Annotated Report
Overview unavailable.
Introductory Front Matter
- Repeated disclaimer stating the document reflects the author’s views, not the DNC’s, and that the DNC cannot independently verify many claims.
- Title page for a work called “Build to Win. Build to Last.”
- A leadership message section is included.
- Table of contents outlining sections on the introduction, executive summary, electoral landscape, campaign review, media, research, organizing, technology, fundraising, spending, conclusion, appendices, notes, and sources.
Disclaimer: This document reflects the views of the author, not the DNC. The DNC was not provided with the underlying sourcing, interviews, or supporting data for many of the assertions contained herein and therefore cannot independently verify the claims presented. **
1 TITLE PAGE BUILD TO WIN. BUILD TO LAST.
Disclaimer: This document reflects the views of the author, not the DNC. The DNC was not provided with the underlying sourcing, interviews, or supporting data for many of the assertions contained herein and therefore cannot independently verify the claims presented. **
2 LEADERSHIP MESSAGE
Disclaimer: This document reflects the views of the author, not the DNC. The DNC was not provided with the underlying sourcing, interviews, or supporting data for many of the assertions contained herein and therefore cannot independently verify the claims presented. **
3 TABLE OF CONTENTS INTRODUCTION EXECUTIVE SUMMARY ELECTORAL LANDSCAPE WHAT HAPPENED (ELECTORAL REVIEW) STATE OF MEDIA & COMMUNICATION STATE OF RESEARCH & STRATEGY STATE OF ORGANIZING & ADVOCACY STATE OF TECHNOLOGY & DATA FUNDRAISING ANALYSIS SPENDING ANALYSIS CONCLUSION APPENDICES NOTES FOR THE READER SOURCES
Disclaimer: This document reflects the views of the author, not the DNC. The DNC was not provided with the underlying sourcing, interviews, or supporting data for many of the assertions contained herein and therefore cannot independently verify the claims presented. **
4 INTRODUCTION
Analyzing the 2024 Electoral Landscape
- Major parties and outside groups invest massive resources to define the terrain for voter choice at every level of the ballot.
- Effective political organizations must study electoral outcomes to identify improvements, operating on the principle that history often rhymes.
- A comprehensive post-election review serves as a blueprint for future campaigns by establishing a series of lessons learned.
- The 2024 election involved billions of dollars in spending and dramatic narrative shifts that require deep analysis beyond just the presidential race.
- A thorough understanding of the 'will of the people' requires examining the success and failure of federal, state, and local candidates nationwide.
- Analysis must distinguish between the 'will of the people' and the systemic structures that either advance or inhibit that will.
Understanding that “little d” democracy is the will of the people and “Big D” Democracy represents the systems and structures in place to advance or inhibit the will of the people, there must also be a review and analysis of the systemic and structural issues.
In every election cycle, the two major parties and hundreds of outside groups invest enormous resources and energy trying to define the terrain for voter choice. What happens at the Presidential level certainly impacts down-ballot contests, yet candidates across the ballot in both parties will still seek to define choices for voters in their specific elections. From those choices, the voters decide which choice is most resonant. One party declares itself the winner, and the other party declares that the fight is far from finished. Effective parties, understanding history rarely repeats itself, it does often rhyme, make it a point to study electoral outcomes after each cycle to identify potential improvements to every aspect of their campaigns. John Adams argued “Liberty cannot be preserved without a general knowledge among the people, who have a right…and a desire to know.” This desire to know, to understand what is going well and needs to be maintained, along with understanding what is not working and needs to evolve, is at the heart of any substantive effort to evaluate the relative impact of strategies and tactics tied to a specific election cycle and specific candidate matchup in order to generate insights about what happened. A thorough review can provide a blueprint for future campaigns, establishing a series of “lessons learned” to drive continuous improvement in future efforts. In this regard, the 2024 election was no different from any other. There were many dramatic moments framing the narrative of the national campaign, thousands of candidates seeking support from voters, and billions of dollars spent across the ballot and throughout the electoral ecosystem to advance particular interests. There are many books already written, and many more to come, presenting analyses of “what happened” for both sides, the efficacy of the strategies advanced, decisions made, and actions taken during the presidential campaign. These analyses, in order to present a thorough picture of the will of the people and the choices they made, must extend beyond the presidential campaign to include those strategies, decisions, and actions taken by other federal, state, and local candidates on ballots nationwide to examine why so many were able to succeed where others came up short. Understanding that “little d” democracy is the will of the people and “Big D” Democracy represents the systems and structures in place to advance or inhibit the will of the people, there must also be a review and analysis of the systemic and structural issues – some going back more
Disclaimer: This document reflects the views of the author, not the DNC. The DNC was not provided with the underlying sourcing, interviews, or supporting data for many of the assertions contained herein and therefore cannot independently verify the claims presented. **
Democratic Party Strategic Reassessment
- The Democratic Party has experienced a decade-long decline in partisan organizing capacity and voter registration advantages.
- A persistent failure to listen to diverse voter groups, particularly in the heartland, has allowed the opposition to gain significant ground.
- The party has drifted from its historical identity as the party of workers and inclusive infrastructure forged in neighborhoods and workplaces.
- This report serves as an after-action analysis of the 2024 cycle to identify gaps in voter participation and contact frequency.
- The analysis follows the money to evaluate spending efficiency and the impact of top vendors on electoral outcomes.
- The ultimate goal is to establish a durable Majority Party Strategy by reclaiming the party's status as the 'party of the people.'
Unfortunate reductions in support and training for our state parties, consequential shifts in voter registration, a loss of partisan organizing capacity, and a persistent inability or unwillingness to listen to all voters has provided the other major party with opportunities for advancement.
5 than a decade – which have impacted electoral outcomes at every level. These issues can inhibit the evolution of Democracy, and limit the reach and success of the Democratic Party. Unfortunate reductions in support and training for our state parties, consequential shifts in voter registration, a loss of partisan organizing capacity, and a persistent inability or unwillingness to listen to all voters has provided the other major party with opportunities for advancement at the expense of Democratic growth, evolution, and ability to find common ground with seemingly disparate groups of voters from coast to coast, and the heartland Democrats tend to ignore. Historically, Democrats have held the advantage in each of these areas. The Democratic Party has always tried to be seen as the party of the people, the party of workers, fair play and civil discourse. The party’s connections with working Americans and their families were forged through decades of organizing and engagement, the development of a vibrant and inclusive party infrastructure, and a relatable agenda which helped us connect in homes, workplaces, and neighborhoods across the country. This report explores with depth and breadth how we lost these relationships by examining both candidate-specific circumstances and the overall trending away from effective and accountable politicking, and seeks to expound upon the combination of strategic, tactical, and organizational improvements Democrats need to form an effective and durable Majority Party Strategy. Why Now? Democracy is a very old institution, and yet what keeps democracy going is the ability of those who seek to lead to look at the data and determine the source of success as well as setbacks. This after-action report specifically aims to identify and elaborate upon the actions the Democratic Party must take after what happened in the 2024 cycle. The report identifies the programs and priorities for consideration and implementation to build our Party to win over the next ten years, and to again become the party of the people well into the future. This report includes a thorough evaluation of voter behavior in the context of the individual-level collection of voter contact data and localized demographic data. The analyses aim to identify gaps in participation, determine the correlation between the frequency and distribution of partisan voter contact, and declare the urgent steps needed to reclaim our strength in engaging voters across the nation. In simple terms, this report follows the money, identifying the top spenders and vendors in both parties, offering insights into where the money went, including who benefited and what issues
Disclaimer: This document reflects the views of the author, not the DNC. The DNC was not provided with the underlying sourcing, interviews, or supporting data for many of the assertions contained herein and therefore cannot independently verify the claims presented. **
Democratic Campaign Infrastructure Analysis
- The report evaluates the composition of campaign spending across various offices and the specific impact of allied independent expenditures.
- It examines the balance between traditional broadcast media and digital investment, emphasizing the need for innovation in storytelling.
- A critical assessment of data and technology infrastructure is provided to ensure security and resiliency for modern political campaigns.
- The methodology combines public data with qualitative insights from over 300 confidential interviews with organizations and individuals.
- The DNC and ASDC conducted a parallel assessment of the health of 57 state and territorial parties through 1,200 additional interviews.
- A formal disclaimer notes that the DNC cannot independently verify the report's claims as the underlying source data was not shared by the author.
“We the People” is not a new idea, but an enduring philosophy meant to include each generation and every available innovation in its design and operation.
6 were prioritized. From there, it presents an exploration of the context and composition of campaign spending for each office, the roles and impact of allied spending, and the volume of independent expenditures in the ecosystem. To examine the reach of the Party, this report evaluates comparative and competitive media spending, the mix of broadcast and digital investment, and the need for greater innovation and experimentation in sharing the Democratic story with more voters and to greater effect and impact. Finally, this report assesses the state of data and technology – with recommendations to ensure the security and resiliency of our critical infrastructure, and opportunities to improve tools and tech to meet the needs of modern, vibrant campaigns. A relevant and modern party must imbue its operations with resilient and robust digital operations to effectively present a unifying declaration to voters - “We the People” is not a new idea, but an enduring philosophy meant to include each generation and every available innovation in its design and operation. Methodology The report analyzes a range of publicly and commercially available data to identify actual investments, actions, and eventual voter behavior. The analysis also includes qualitative data obtained in the form of in-person and virtual interviews with more than 300 organizations and individuals who were promised confidentiality to encourage their participation and candor. Most participants were eager to share their recommendations for how Democrats can improve strategies, decision-making, and infrastructure. In parallel to this report, the DNC and ASDC have conducted more than 1200 interviews to assess the health of our 57 state parties – in every state, district, or territory. While some participants may agree in part and disagree in part with portions of this report, we thank all participants for their candor and contributions, and their enduring commitment to the oldest continuing political party in the United States. No source material or data provided. Unsourced claims cannot be independently verified.
Disclaimer: This document reflects the views of the author, not the DNC. The DNC was not provided with the underlying sourcing, interviews, or supporting data for many of the assertions contained herein and therefore cannot independently verify the claims presented. **
7 EXECUTIVE SUMMARYThis section was not provided by author.
Disclaimer: This document reflects the views of the author, not the DNC. The DNC was not provided with the underlying sourcing, interviews, or supporting data for many of the assertions contained herein and therefore cannot independently verify the claims presented. **
A Ten-Year Strategic Vision
- The Democratic Party must move beyond immediate election cycles to implement a long-term, ten-year strategic plan for infrastructure and partnerships.
- A 'Win Anywhere' strategy is proposed to reconnect with voters in Middle America and the South who feel excluded from the current Democratic vision.
- Economic suffering and poor healthcare access in rural areas have led voters to reject the party because they do not see themselves reflected in its platform.
- The text cites the 1989 chairmanship of Ron Brown as a historical precedent for reclaiming the political center and focusing on 'the races we win.'
- Success requires a shift from 'pie-in-the-sky narratives' toward a practical 'politics of success' that prioritizes the economy and tangible results.
It was Ron Brown who understood every corner of America was hurting and proclaimed his tenure would be less about race and more about 'the races we win.'
8 ELECTORAL LANDSCAPE Ten Years for a Stronger Future While combating an increasingly autocratic and authoritarian government lies at the forefront of the Democratic agenda, our Democratic Party must also develop a plan to carry itself and America beyond 2028. It is essential the Democratic Party develop, organize, and implement a 10-year strategic plan to align the infrastructure, partnerships, and people we need to win. The only way this can be done is if we build to win and build to last. Democrats need a new, forward-thinking electoral strategy focusing on more than who or what is on the ballot, and addressing how Democrats can reconnect with Americans at every level across our country. We must organize everywhere to Win Anywhere. Winning Anywhere means providing for a renewed focus on the voters of Middle America and the South, who have come to believe they are not included in the Democratic vision of a stronger and more dynamic America for everyone. Millions of Americans are suffering from poor access to healthcare, manufacturing and job losses, and a failing infrastructure, yet continue to be persuaded to vote against their best interests because they do not see themselves reflected in the America of the Democratic Party. We can do this, because we’ve done it before. In 1989, after losing three straight presidential campaigns, our party refocused the conversation around policy and purpose to reclaim the vital center of American discourse. Understanding the center is where most people live, then-DNC Chairman Ron Brown led Democrats out of the political wilderness by supporting candidates putting people first, prioritizing the economy, and offering America hope. It was Ron Brown who understood every corner of America was hurting and proclaimed his tenure would be less about race and more about “the races we win.” Ron Brown also challenged the Democratic Party to think and be different. He focused less on pie-in-the-sky narratives and asked the party to “get real about the politics of success[i].” Chairman Brown was relentless in his party-building, and his optimism inspired others to unify and focus on the end goal, winning the White House again in the face of three consecutive defeats leaving many Americans with a distaste for Democrats and politics in general. Brown was idealistic and practical, and he fought for his beliefs while challenging those who argued it could not be done.
Disclaimer: This document reflects the views of the author, not the DNC. The DNC was not provided with the underlying sourcing, interviews, or supporting data for many of the assertions contained herein and therefore cannot independently verify the claims presented. **
Winning Anywhere Strategy
- The Democratic Party aims to replicate the unifying vision of Ron Brown which led to significant victories in the 1990s and paved the way for the Obama presidency.
- A new 'Winning Anywhere' mission focuses on deep collaboration with Labor and progressive partners to reassess messaging and maintain accountability.
- Restoring public trust requires elected officials to deliver on promises decisively to counter voter rage fueled by information silos.
- The party must reform its internal structures and practices to align financial investments with core values for year-round impact.
- Post-election analysis must avoid 'hot takes' and instead focus on the razor-thin margins, such as the few thousand votes that decided House control.
The rage of the voters, stoked daily by information silos, talking heads, and even politicians, has contributed to most Americans having a lack of confidence in both parties.
9 Under this future-focused directive, Democrats were able to win governor’s races in Virginia, mayoral races in New York City, and elect Bill Clinton into the White House in 1992, turning the tide of defeat and ushering in a new era of political achievement. In the ultimate sign of recognition of Ron Brown’s unifying visions, it was President Barack Obama who acknowledged he was president, in part, because of Ron’s vision for the future, “because of the example he set, because of the organization that he brought to the Democratic Party.[ii]” Finding our way back to this level of success will not be easy, and it will not happen overnight. But the reason we will win is twofold. The first is that we do not plan to advance alone. Winning Anywhere is the shared mission and purpose of the DNC and its partners. We will do the hard work to reassess our strategies, our messaging, and our targets, and challenge our partners, including Labor and other progressive organizations, to hold us accountable as we move through the next ten years and beyond. Secondly, once we win, we will ensure our newly elected and re-elected officials move consistently and decisively to instill faith and confidence in the American voting public. The rage of the voters, stoked daily by information silos, talking heads, and even politicians, has contributed to most Americans having a lack of confidence in both parties. Democrats must accept it is more important than to deliver on what they promise and then make sure our constituents are aware we are fighting for the things they care the most about. We have to meet this moment with creativity, purpose, and openness. We must align our values with our investments to maximize the impact of our year-round efforts. We must reform our party’s structure and practices as the means to rebuild and reposition our party to re-earn the trust and confidence of everyday Americans. Assessing the State of the Party There are always hot takes after an election – but hot takes will lead to mistakes if we do not take the time to thoroughly explore what occurred, what worked well, and what should have been done better. We must be careful to draw the right lessons from this experience, and not miss opportunities to identify and build upon some of the positives from the 2024 cycle. Yes, many are deeply angry with the outcome of this most recent national election. They feel cheated, abused, and taken advantage of by a broken system. At the same time, we must acknowledge how close the margins actually were. 7,309 votes across three districts decided control of the US House of Representatives. 327,557 votes across four states decided the US
Disclaimer: This document reflects the views of the author, not the DNC. The DNC was not provided with the underlying sourcing, interviews, or supporting data for many of the assertions contained herein and therefore cannot independently verify the claims presented. **
A Nation Divided
- Recent election cycles from 2016 to 2024 have been decided by razor-thin margins, reflecting a deeply polarized American electorate.
- Democratic leadership often defaults to a denialist mindset, blaming external factors rather than seeking fundamental party accountability.
- Since the 2008 Obama landslide, the Democratic Party has experienced a period of stagnation and retrogression across all levels of government.
- Recent local and state victories in 2025 may provide a false sense of security, masking underlying weaknesses in voter engagement.
- The party failed to capitalize on the 2008 momentum by failing to cement a lasting relationship with working-class Americans.
This kind of thinking – denialist at its core – prevents the Party from seeking real accountability, and from making the changes we need to deliver on our promises to the American people.
10 Senate. And 270,607 votes across four states decided the Presidency – around two-tenths of one percent of all ballots cast for President. The 2020 cycle was also very close – a narrow win for the Presidency, a narrow Democratic majority in the House, and a tie in the Senate based on a runoff in Georgia. The 2016 cycle was also close at the presidential level – with a split between the popular vote and Electoral College (with seven faithless Electors). This demonstrates a basic truth – we have been and remain a nation divided. It is not unique to the 2024 election These hair-splitting margins of defeat may lead some to argue Democrat leadership and candidates may need less changing of their message and approach and more massaging of their ideas for widespread adoption. The arguments have run nonstop since November 2024 – with a better political climate, or advancing slightly different policies, or with a different candidate, victory could have been assured. This kind of thinking – denialist at its core – prevents the Party from seeking real accountability, and from making the changes we need to deliver on our promises to the American people. To grow, we must admit and accept some hard truths about our Party. Since the high point of the 2008 Obama landslide, when he received nearly 10 million more votes than John McCain, the Democratic Party has vacillated between stagnation and retrogression. In doing so, we have lost the confidence we once received from everyday Americans – and election results show it. In the sixteen tumultuous years since that historic election, Democrats have lost ground at every level of government. These losses are the direct result of missed opportunities to invest in our states, counties, and local parties and candidates. This remains true even in the face of the “Blue Wave” in the most recent elections. 2025 gubernatorial and mayoral wins in Virginia, New Jersey, New York City, Detroit, and elsewhere may lead to a false sense of security and a belief the Democratic Party has again found ways to bring the voters back to the booth with their messaging. While these wins are welcome and point to the optimism entrenched in the Majority Party Strategy, a dive into the details shows some of these elections were tighter than Democrats should be comfortable with, and point to room for improvement in future efforts. Numbers appear inaccurate based on public data.
Disclaimer: This document reflects the views of the author, not the DNC. The DNC was not provided with the underlying sourcing, interviews, or supporting data for many of the assertions contained herein and therefore cannot independently verify the claims presented. **
11 2008 – Change We Can Believe In
The 2008 election cycle was the high point for the modern Democratic Party. With a landslide in the Electoral College, a 9.5 million popular vote advantage for President, and wins in the House, Senate, and in the States, Democrats were poised and positioned to lock in those gains for a generation. For the first time since the 1964 election of President Johnson, Democrats gained seats in both chambers while winning the White House. Democrats expanded their House majority to 257 seats, gaining 21 seats, and grew to 60 seats in the Senate, with wins in New Hampshire, Virginia, North Carolina, Minnesota, Colorado, New Mexico, Oregon, and Alaska. In the states, Democrats flipped six legislative chambers, while Republicans flipped four. Democrats retained the governorships in New Hampshire, Delaware, West Virginia, North Carolina, Montana, and Washington, and flipped Missouri. These gains did not last long – as Democrats failed to capitalize on the economic disaster of the Bush presidency by cementing a relationship with working Americans. 2010 – The Rise of the Tea Party

The 2010 Midterm Shellacking
- The 2010 midterm elections resulted in massive Democratic losses across the House, Senate, and state legislatures due to economic stress and the rise of the Tea Party.
- Disinvestment in state Democratic parties during the early Obama years left the party vulnerable to Republican gains during a critical redistricting cycle.
- GOP control of state trifectas led to severe partisan gerrymandering, which effectively removed competitiveness from many electoral districts.
- A lack of Democratic presence in non-competitive regions has allowed Republicans to pass restrictive voting laws and gut essential public services.
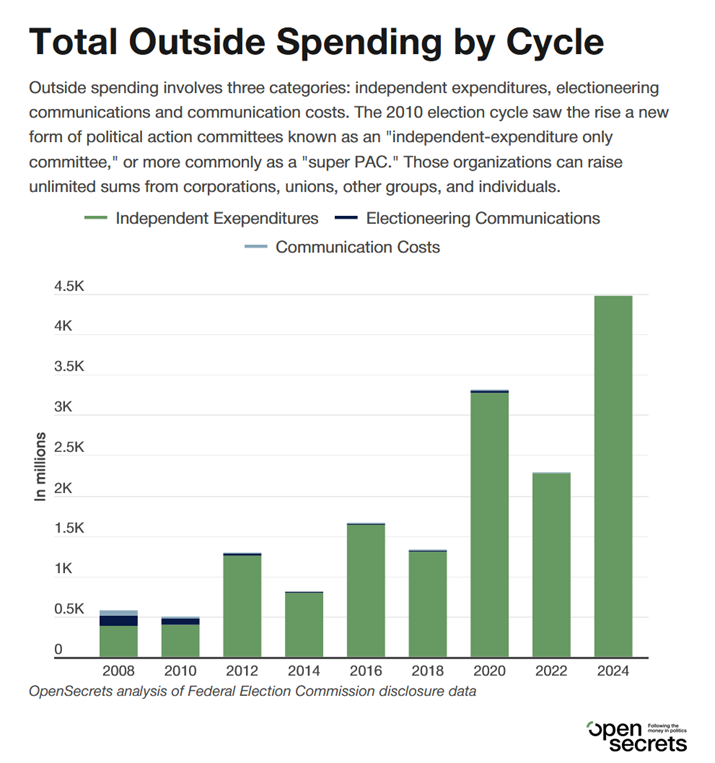
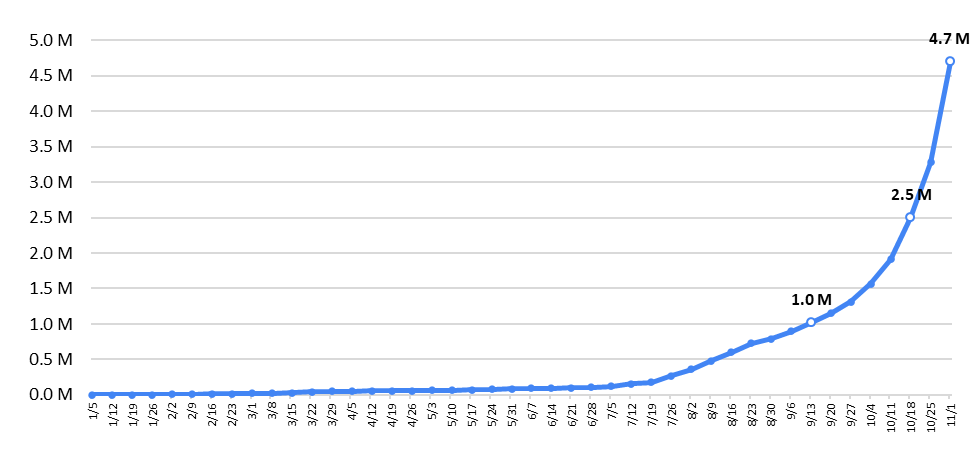
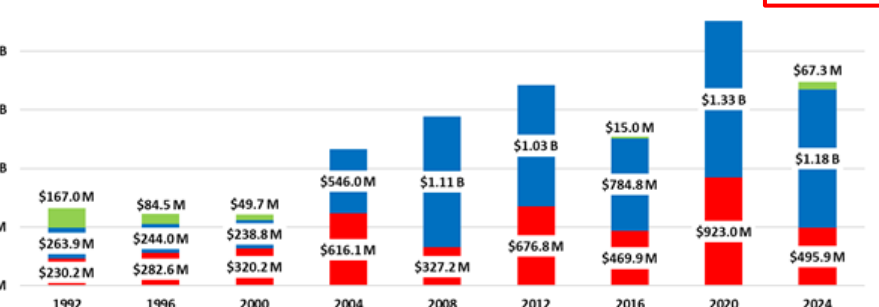
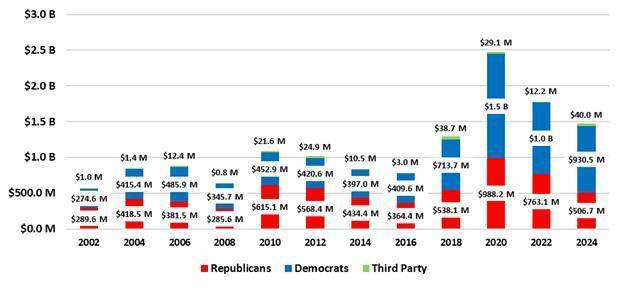
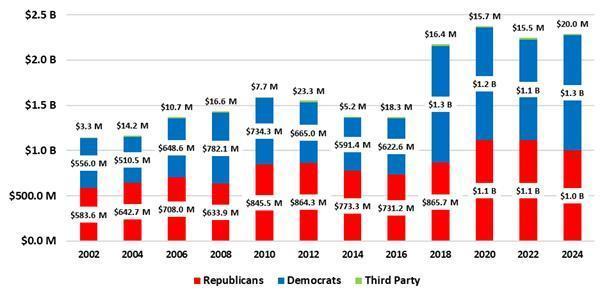
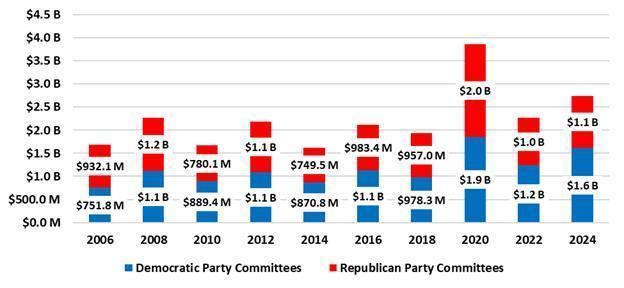
- The 2010 Citizens United era triggered a massive surge in dark money, with outside spending ballooning from $500 million to a projected $4.5 billion by 2024.
- Despite these structural disadvantages and financing shifts, President Obama secured a decisive re-election in 2012 with 332 electoral votes.
Subsequent federal court decisions have enabled and encouraged partisan gerrymandering, stripping even the idea of competitiveness out of the broader electoral and civic ecosystem.
Disclaimer: This document reflects the views of the author, not the DNC. The DNC was not provided with the underlying sourcing, interviews, or supporting data for many of the assertions contained herein and therefore cannot independently verify the claims presented. **
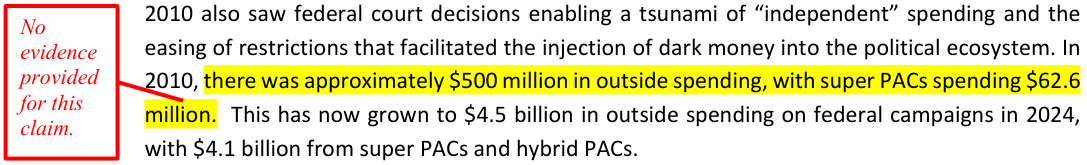
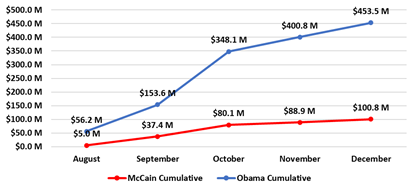
12 The 2010 midterms, converging with lingering economic stresses and resentment towards Wall Street, the rise of the Tea Party, and metastasizing birtherism resulted in sweeping losses for Democrats. The simultaneous disinvestment in state Democratic parties at the start of the Obama presidency contributed to this 2010 mid-term “shellacking.” Democrats lost seven seats in the Senate (including President Obama’s former seat in Illinois), and 63 seats in the House, giving Republicans the majority, six governors, and twenty state legislative chambers. The losses in the states – coinciding with the decennial Census – have had lasting repercussions. With many Republican trifectas in place, Democrats were on the wrong side of severe partisan gerrymandering at the state legislative and federal levels in 2012. Subsequent federal court decisions have enabled and encouraged partisan gerrymandering, stripping even the idea of competitiveness out of the broader electoral and civic ecosystem. Consequently, Democrats have invested less and less in what is now seen as non-competitive terrain, compounding and reinforcing partisan disadvantages in many states and jurisdictions. Worse, Republicans have been relentless at the state policy level, reversing worker protections, enacting restrictions on voting, gutting essential services that Americans have paid for and depend on for their quality of life, and denying pathways of opportunity to and advancement to those most in need. While state legislative Democrats combat these changes when and where they can, in too many states they lack the legislative numbers to stop Republicans. Voters in these states may see Democratic policy as the preferable alternative to Republicans authoritarian advancement, but the inability to offer any substantive effective electoral opposition impacts perspectives and opinions about the party. 2010 also saw federal court decisions enabling a tsunami of “independent” spending and the easing of restrictions that facilitated the injection of dark money into the political ecosystem. In 2010, there was approximately $500 million in outside spending, with super PACs spending $62.6 million. This has now grown to $4.5 billion in outside spending on federal campaigns in 2024, with $4.1 billion from super PACs and hybrid PACs. No evidence provided for this claim.
Disclaimer: This document reflects the views of the author, not the DNC. The DNC was not provided with the underlying sourcing, interviews, or supporting data for many of the assertions contained herein and therefore cannot independently verify the claims presented. **
13 This fundamental shift in campaign financing has profoundly weakened our democracy by reducing election transparency, preventing any sense of accountability, and eroding trust in the political process and the elected officials who uphold it. And yet, Democrats have so far remained competitive, even as we find ourselves seemingly unable to pull ahead. 2012 Re-election President Obama won re-election in 2012, with 332 electoral votes and a nearly five million popular vote advantage. Democrats picked up two seats in the Senate and eight in the House – on the new lines after reapportionment. Democrats also lost the gubernatorial election in North Carolina, but won
Disclaimer: This document reflects the views of the author, not the DNC. The DNC was not provided with the underlying sourcing, interviews, or supporting data for many of the assertions contained herein and therefore cannot independently verify the claims presented. **

Democratic Shifts and Electoral Volatility
- The 2014 midterm 'shellacking' resulted in the largest Republican House majority since 1928 and the loss of nine Democratic Senate seats.
- Internal Republican radicalization led to the defeat of Eric Cantor and the early resignation of Speaker John Boehner, signaling a shift toward Trumpism.
- The 2016 Democratic campaign suffered from state-level disinvestment, a lack of infrastructure, and a late-resolved primary that contributed to the collapse of the 'Blue Wall.'
- A 2018 'resistance' wave allowed Democrats to reclaim the House with a 40-seat gain while protecting incumbents in several Trump-won states.
- The 2020 election saw the highest voter participation in U.S. history, resulting in a Democratic trifecta and the reclamation of the Senate.
Republican primary losses – including House Majority Leader Eric Cantor to a Tea Party challenger – were symptoms of accelerating shifts towards radicalism within the Republican Party.
14 seven legislative chambers - including the first Minnesota trifecta since 1991, while losing six chambers (a net gain of one chamber). 2014 – Shellacking 2.0 The second mid-term “shellacking” of 2014 had the lowest midterm turnout (36.4 percent) since 1942. Democrats lost nine Senate seats to give Republicans control of the chamber, and dropped 13 seats in the House, giving Republicans their largest House majority since 1928. Democrats also lost more ground in the states, losing two more governors, and ten legislative chambers. Of greater consequence is how the 2014 Republican gains featured the election of increasingly radical Republicans – which made normal governance nearly impossible. Republican primary losses – including House Majority Leader Eric Cantor to a Tea Party challenger – were symptoms of accelerating shifts towards radicalism within the Republican Party. The inability of Republicans to manage these forces culminated in the early resignation of Speaker John Boehner in 2014, the elevation of Speaker Paul Ryan, and presaged the escalator ride and subsequent election of Donald Trump. 2016 – Divisions and Distractions With an open seat in the presidential campaign, both parties engaged in deeply polarized contests for their nominations. The Democratic nomination was not fully resolved until the Democratic convention in Philadelphia – 104 days before the November 8th election. After years of disinvestment in state parties, Secretary of State Hillary Rodham Clinton inherited a party in turmoil, an acting national chair, and little effective infrastructure she could rely on both in the states and within the national party. A series of dramatic events, massive election interference, and poor strategy cost Democrats what many assumed to be a history-making Presidency. Despite a popular vote win, the so-called Blue Wall collapsed. Democrats picked up Senate seats in New Hampshire and Illinois, with narrow, painful losses in Missouri, Pennsylvania, and Wisconsin, and gained six seats in Congress. Democrats won the gubernatorial race in North Carolina, but lost in Missouri, Vermont, and New Hampshire, and Republicans netted control of one legislative chamber. John Boehner announced his resignation in fall of 2015, not 2014.
Disclaimer: This document reflects the views of the author, not the DNC. The DNC was not provided with the underlying sourcing, interviews, or supporting data for many of the assertions contained herein and therefore cannot independently verify the claims presented. **
15 2018 – Resistance and Return The post-2016 aftermath was an enormously important time for Democrats. The national party was deeply in debt, and internally divided in the aftermath of the Presidential loss. Thankfully, a surge of resistance (and the utter incompetence of the federal Republican trifecta) gave Democrats the opportunity to regain voter support. A wave of new energy, grassroots fervor, and new candidates came to the fore and Democrats were able to reclaim the House of Representatives with a gain of 40 seats.
No House Democrat was defeated, while 29 Republican incumbents lost. Republicans flipped three open seats while Democrats flipped 14. Democrats were able to win Senate seats in Nevada and Arizona, but lost seats in North Dakota, Missouri, Indiana, and Florida. By protecting Democratic incumbents in Michigan, Montana, Ohio, Pennsylvania, Wisconsin, and West Virginia (all states Trump had won in 2016), Democrats kept the Senate margin close, and were positioned to regain the Senate in 2020. 2020 – A Democratic Trifecta Democrats were able to build on wins from 2018 and leverage anti-incumbent sentiment to win the Presidency and reclaim the Senate. 2020 was the highest turnout election since 1900, and with 158 million votes cast, the highest participation election in US history.
Election Cycles and Political Turmoil
- Joe Biden secured the 2020 presidency with 306 Electoral College votes and a popular vote lead of over 7 million.
- The January 6th insurrection resulted in five deaths and significant legal action, though most convictions were later nullified by presidential pardons in 2025.
- Republicans and legacy media predicted a massive 'red wave' in the 2022 midterms that ultimately failed to materialize.
- Democrats defied historical midterm precedents in 2022 by gaining a Senate seat and maintaining all state legislative chambers.
- Aggressive partisan gerrymandering in states like Florida and Texas allowed Republicans to narrowly reclaim the House of Representatives.
- The 2022 elections saw significant Democratic gains at the state level, including a historic governing trifecta in Michigan.
The ongoing disinformation and denialism orchestrated by Republicans about the events of January 6th is ongoing large-scale gaslighting designed to undermine our entire civic ecosystem.
Disclaimer: This document reflects the views of the author, not the DNC. The DNC was not provided with the underlying sourcing, interviews, or supporting data for many of the assertions contained herein and therefore cannot independently verify the claims presented. **
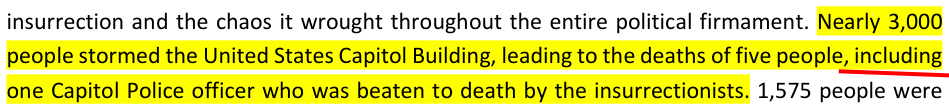
16 Joe Biden won the Electoral College with 306 votes and the popular vote by more than 7 million. Democrats won four seats in the Senate, flipping Colorado, Arizona, and both seats in Georgia, while losing Alabama. This created a tie in the Senate, with Vice President Kamala Harris giving Democrats control. Republicans gained 13 seats in the House, but Democrats retained control with a five-seat advantage. In the states, Republicans flipped the Montana governorship and won both chambers of the New Hampshire legislature. However, no mention of the 2020 election can ignore the abject insanity of the January 6th insurrection and the chaos it wrought throughout the entire political firmament. Nearly 3,000 people stormed the United States Capitol Building, leading to the deaths of five people, including one Capitol Police officer who was beaten to death by the insurrectionists. 1,575 people were charged in connection with the attack, 1,270 were convicted and all but 14 were pardoned immediately when Donald Trump took office on January 20, 2025, avoiding any meaningful accountability for the attack on the Capitol and the Republic. The ongoing disinformation and denialism orchestrated by Republicans about the events of January 6th is ongoing large-scale gaslighting designed to undermine our entire civic ecosystem. 2022 – The Fake Red Wave Despite legacy media handwringing and a barrage of cherry-picked partisan polling from the right, Democrats beat back historical precedent of the party in the White House losing midterm elections. Democrats staved off the purported (and over-reported) red wave. Instead, Democrats gained a seat in the Senate, winning Pennsylvania, with narrow losses in North Carolina and Wisconsin. Republicans were able to net nine seats and take the House due to aggressive partisan gerrymanders in Florida, Georgia, Tennessee, and Texas, and overperformance in California and New York on commission or court-drawn maps. In the states, Democrats flipped the governorships in Arizona, Maryland, and Massachusetts, while losing Nevada. 2022 was also the first midterm since 1934 where the President’s party did not lose a state legislative chamber, as Democrats flipped both chambers in Michigan, the Minnesota Senate, and Pennsylvania House. The legislative lines, drawn in Michigan by an independent commission, gave Democrats their first governing trifecta since 1985. 2024 – The Second Republican Trifecta Claim contradicts public reporting.
Disclaimer: This document reflects the views of the author, not the DNC. The DNC was not provided with the underlying sourcing, interviews, or supporting data for many of the assertions contained herein and therefore cannot independently verify the claims presented. **

Democratic Party Post-Election Analysis
- Republicans secured significant victories across Presidential battlegrounds and flipped key Senate seats in Pennsylvania, Ohio, West Virginia, and Montana.
- Despite losing the national narrative, Democrats saw minor gains in the House and maintained control of several governorships.
- The report identifies a 16-year trend of increasing polarization and cumulative narrow losses that have ceded outsized power to the opposition.
- A disconnect exists between the popularity of Democratic policies, such as Medicaid expansion and wage increases, and the party's electoral performance.
- The author proposes a 10-year strategic plan to address inconsistent messaging and improper planning that have eroded voter trust.
- The DNC issued a disclaimer stating that several claims in this analysis are unsupported by data and contradict public reporting.
The sad truth is Democrats have lost ground at every level from inconsistent messaging and improper planning, even as the policies the Party advances continue to earn voter support at the ballot box.
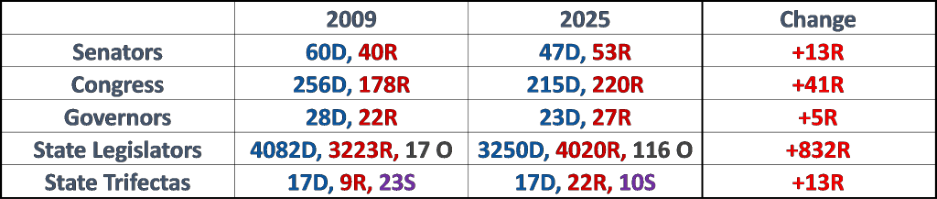
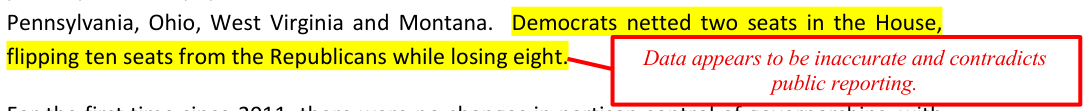
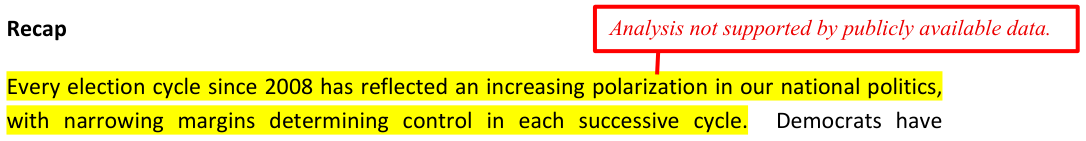
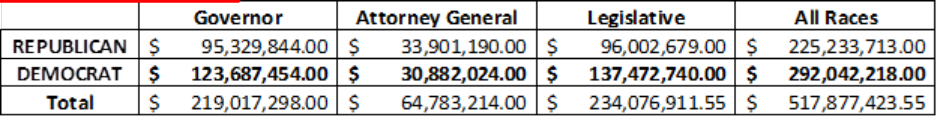
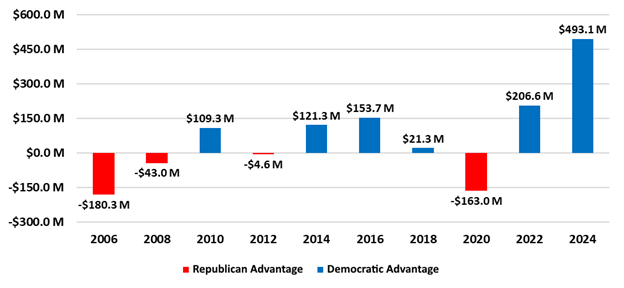
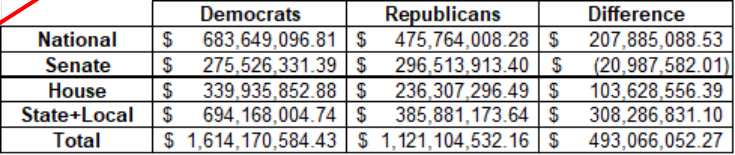
17 Aside from the near sweep across the Presidential battlegrounds and Republicans winning a plurality of the popular vote at the Presidential level, Democrats lost Senate seats in Pennsylvania, Ohio, West Virginia and Montana. Democrats netted two seats in the House, flipping ten seats from the Republicans while losing eight. For the first time since 2011, there were no changes in partisan control of governorships, with Democrats retaining Delaware, North Carolina, and Washington. At the state legislative level, Republicans flipped the Michigan House, and moved the Minnesota House into a tie. Recap Every election cycle since 2008 has reflected an increasing polarization in our national politics, with narrowing margins determining control in each successive cycle. Democrats have experienced substantial and meaningful losses across these 16 years, and need to recommit to effective messages and methods to regain trust and the support of our people.
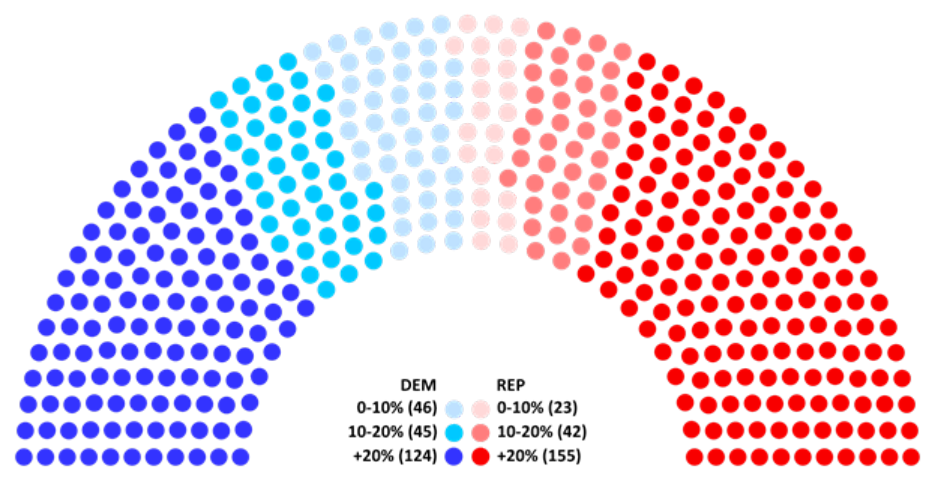
What the chart shows is the impact of successive narrow losses. The cumulative effect of the relatively small losses that Democrats have experienced in each election has led to an outsized amount of power being held by a group thriving on division and disinterest. This trend needs to be reversed. While what was lost in 16 years will not be gained back overnight, this after action and the Chair’s 10-year strategic plan will set the foundation for reinvigorating the Democratic Party, redefining its purpose, and regaining what it has given up over the years due to improper planning and execution. It’s The Future, Stupid The sad truth is Democrats have lost ground at every level from inconsistent messaging and improper planning, even as the policies the Party advances continue to earn voter support at the ballot box. Ballot measures for Medicaid expansion, nonpartisan redistricting, wage increases,
Data appears to be inaccurate and contradicts public reporting. Analysis not supported by publicly available data.
No sourcing provided for several claims in this section.
Disclaimer: This document reflects the views of the author, not the DNC. The DNC was not provided with the underlying sourcing, interviews, or supporting data for many of the assertions contained herein and therefore cannot independently verify the claims presented. **

The Crisis of Democratic Trust
- Voters are supporting progressive policies like family leave and reproductive freedom in red states while simultaneously rejecting Democratic candidates.
- Recent Democratic victories are often the result of 'negative partisanship' against flawed Republican opponents rather than affirmative support for the Democratic platform.
- The 2022 Georgia Senate race serves as a primary example of Republicans leveraging name recognition over candidate qualifications.
- Democrats cannot rely on the continued nomination of weak Republican opponents to secure future electoral victories.
- A looming demographic shift threatens to move up to 12 Congressional seats and Electoral Votes away from traditionally Democratic strongholds.
- The party must develop a long-term strategy to rebuild genuine trust and project leadership to counter misinformation.
Walker’s inability to muster even a shred of credibility precluded him from winning the election in one of the most polarized states in the nation.
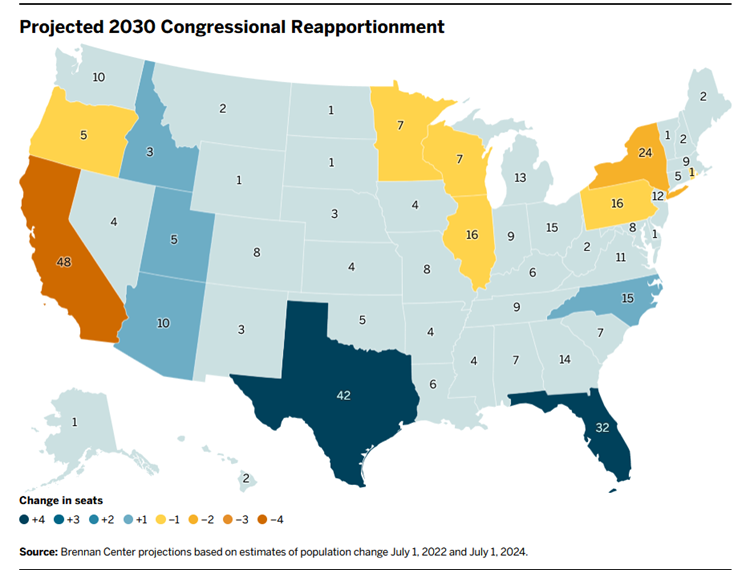
18 family leave, and reproductive freedom have passed in states where Democrats remain locked out of statewide offices. This divergence means the Party and our candidates have lost the confidence and trust of voters. In the face of misinformation and disinformation, our candidates have proven incapable of projecting strength, unity, and leadership, and voters have drifted away. Indeed, many of our critical Democratic wins can be attributed to negative partisanship – where Republicans have nominated deeply flawed candidates, and we have been able to convince some Republicans and most Independents to support Democrats in those contests. Nowhere was this more apparent than in the 2022 Georgia Senate election, where Republicans supported Herschel Walker to take on incumbent Democratic Senator Raphael Warnock. Despite a series of false and unverifiable claims by Walker, as well as the near-complete absence of a comprehensive policy agenda, endorsements by Donald Trump and Mitch McConnell were enough to take the senate race to a runoff when neither candidate was able to claim 50% of the vote in the first round This was a blatant attempt by the Republican power base to take advantage of name recognition and tough economic conditions to push through an unqualified candidate whose job would have been little more than rubber stamping the president’s agenda. Walker’s inability to muster even a shred of credibility precluded him from winning the election in one of the most polarized states in the nation. Democrats cannot count on Republicans continuing to nominate deeply flawed candidates, and certainly need to think through how to nominate strong and ethical leaders. Regaining trust and confidence in the Party – where voters have an affirmative reason to support Democrats – will take a comprehensive strategy and considerable effort over multiple cycles. Democrats need to do it and do it right now, because the future could become even more difficult. Demographic and population projections indicate an accelerating population shift away from traditionally Democratic states. As the Brennan Center has reported, and as seen in the figure below, it is possible for up to 12 Congressional seats (and Electoral Votes) to shift from states like Appears to conflate family and sick leave.
In 2022, Joe Biden was president.
Disclaimer: This document reflects the views of the author, not the DNC. The DNC was not provided with the underlying sourcing, interviews, or supporting data for many of the assertions contained herein and therefore cannot independently verify the claims presented. **
A New Majority Strategy
- Projected 2030 Census reapportionment indicates a significant shift of political power from Democratic strongholds like California and New York to Republican-leaning states like Texas and Florida.
- The author argues that Democrats cannot rely on national tides or historic trends to win, but must instead proactively adapt to changing electoral conditions.
- Reversing losses at the state level is identified as the critical foundation for rebuilding the party's bench and reclaiming national influence.
- The proposed 'Majority Party Strategy' emphasizes organizing everywhere to win anywhere, moving beyond 'tinkering around the margins' to achieve cohesive, large-scale engagement.
- The 2025 elections are framed as a pivotal moment for the party to refresh its leadership and align its vision to reflect the will of the people over the powerful.
With radical midterm redistricting efforts underway, the writing is on the wall, and the call is coming from inside the House.
19 California, New York, and Illinois to Texas, Florida, Utah, and Idaho in the next reapportionment after the 2030 Census1.
2 With radical midterm redistricting efforts underway, the writing is on the wall, and the call is coming from inside the House. We either adapt to the changing conditions of the arena, or history will leave us behind. Hoping for national tides to change or historic trends to shift and help Democrats win is not a strategy. Waiting for a strong national nominee to emerge in 2028 ignores the need to prepare the Party to best support our nominees whenever and wherever they run. The job of the whole part - from leadership and volunteers to elected officials and even former Presidents - is to think bigger and work harder. To recruit, train, listen, organize, and engage at scale. If Democrats keep tinkering around the margins, and expecting better outcomes, it’s a missed opportunity to reclaim the responsibility to offer a better direction for America. It’s imperative 1 Michael Li & Gina Feliz. “How Congressional Maps Could Change in 2030.” Brennan Center for Justice. brennancenter.org/our-work/analysis-opinion/how-congressional-maps-could-change-2030. 2 Michael Li & Gina Feliz. “How Congressional Maps Could Change in 2030.” Brennan Center for Justice. brennancenter.org/our-work/analysis-opinion/how-congressional-maps-could-change-2030.
Disclaimer: This document reflects the views of the author, not the DNC. The DNC was not provided with the underlying sourcing, interviews, or supporting data for many of the assertions contained herein and therefore cannot independently verify the claims presented. **
20 Democrats meet the moment – by identifying and preparing the leaders and organizers who will deliver positive change for America. The losses in the states are the key trend Democrats need to reverse. They are the foundation for moving states back into our column, and the potential bench of candidates for higher office. With the party refreshed and reinvigorated in the aftermath of the 2025 elections, this is the time to Build to Win and Build to Last. Democrats must organize everywhere to win anywhere through Majority Party Strategy focused on everywhere, cohesively, strategically, and decisively. A new Majority Party Strategy is a prerequisite for success in winning back voters, boosting the party, and aligning the vision of everyone involved to ensure the United States reflects the will of the people and not of the powerful. [i] https://www.washingtonpost.com/lifestyle/style/ron-brown-and-michael-a-brown-amid-a-fathers-legacy-a-sons-own-path/2011/03/26/AFD3Fh5B_story.html [ii] https://www.washingtonpost.com/lifestyle/style/ron-brown-and-michael-a-brown-amid-a-fathers-legacy-a-sons-own-path/2011/03/26/AFD3Fh5B_story.html
Disclaimer: This document reflects the views of the author, not the DNC. The DNC was not provided with the underlying sourcing, interviews, or supporting data for many of the assertions contained herein and therefore cannot independently verify the claims presented. **
Electoral Review and Battleground Shifts
- The 2024 election saw the collapse of the 'Blue Wall,' with Pennsylvania, Michigan, and Wisconsin flipping to Donald Trump.
- Donald Trump became the first Republican presidential candidate to win the popular vote since 2004.
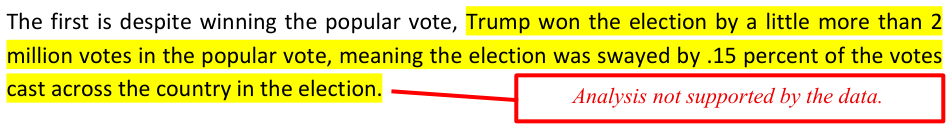
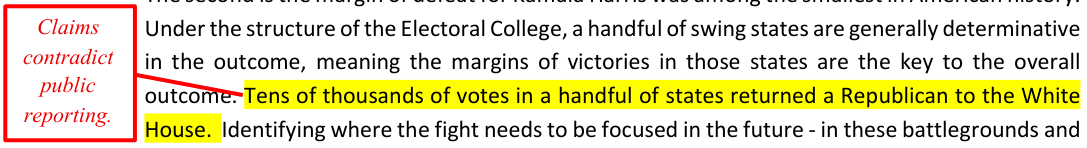
- Despite the electoral shift, the margin of defeat for Kamala Harris was among the smallest in American history.
- The outcome was determined by a fraction of a percentage point, specifically .15 percent of the total votes cast across the country.
- Gubernatorial races showed high levels of incumbency or party retention, with no governor's office changing partisan hands across 11 states.
- The DNC issued a disclaimer stating they cannot independently verify many of the assertions or underlying data provided in this report.
On Election Night, the world watched the Blue Wall crumble to return Donald Trump to the White House.
21 WHAT HAPPENED (ELECTORAL REVIEW) Introduction PENDING National Overview PENDING Battleground State Outcomes On Election Night, the world watched the Blue Wall crumble to return Donald Trump to the White House. States which had consistently and reliably voted for Democratic candidates, including Pennsylvania, Michigan, and Wisconsin, voted for Trump, along with Nevada, Arizona, and Georgia, which had all gone to Biden in the previous election. Every swing state and District Democrats focused on holding onto all swung right, allowing Donald Trump to become the first Republican presidential candidate to win the popular vote since George W. Bush in 2004. Even in the midst of this fundamental shift in the electoral map, there are key takeaways Democrats should consider as they invest in the Majority Party Strategy. The first is despite winning the popular vote, Trump won the election by a little more than 2 million votes in the popular vote, meaning the election was swayed by .15 percent of the votes cast across the country in the election. The second is the margin of defeat for Kamala Harris was among the smallest in American history. Under the structure of the Electoral College, a handful of swing states are generally determinative in the outcome, meaning the margins of victories in those states are the key to the overall outcome. Tens of thousands of votes in a handful of states returned a Republican to the White House. Identifying where the fight needs to be focused in the future - in these battlegrounds and others is a critical early step for the Party. Governors The most positive takeaway for gubernatorial races in 2024 is that no governor’s office changed partisan hands. The office of governor was on the ballot in 11 states: New Hampshire, Vermont, No evidence provided for many claims in this section. This section was not provided by author.
All three of these states voted for Trump in 2016.
Analysis not supported by the data. Claims contradict public reporting.
Appears to be missing Delaware. This section was not provided by author.
Disclaimer: This document reflects the views of the author, not the DNC. The DNC was not provided with the underlying sourcing, interviews, or supporting data for many of the assertions contained herein and therefore cannot independently verify the claims presented. **
Gubernatorial Election Strategies
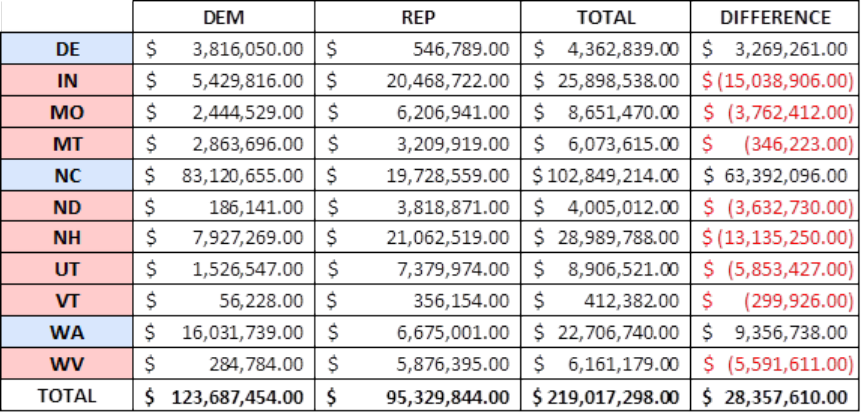
- Republicans dominated the 2024 gubernatorial races, winning eight out of ten contested seats across various states.
- Democrats Josh Stein and Bob Ferguson secured victories in North Carolina and Washington by focusing on kitchen-table issues like housing and the economy.
- The North Carolina race highlighted a concerning trend where an extremist candidate, Mark Robinson, still captured 45% of the vote despite significant scandals.
- The success of Stein and Ferguson suggests that moving away from identity politics toward pragmatic solutions is a winning blueprint for Democrats.
- Robinson's performance demonstrates the power of the conservative media ecosystem to sustain momentum for far-right candidates even without mainstream support.
Robinson’s performance must be a wake-up call to Democrats - even without the support of Trump and major organizations, extreme right-wing candidates can still leverage the conservative media ecosystem to engender support and momentum for their platforms.
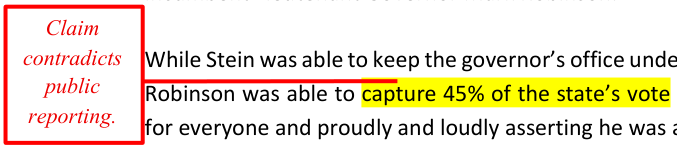
22 West Virginia, Indiana, Missouri, Utah, North Dakota, Montana, Washington, and North Carolina. Republican governors were elected in 8 of those states, while Democrats were able to hang on and win in only two: Washington and North Carolina. The Democratic candidates in both states, Bob Ferguson of Washington and Josh Stein of North Carolina, were each able to win with approximately 55% of the vote. The North Carolina race featured an incumbent Democratic Attorney General Stein running against Republican incumbent Lieutenant Governor Mark Robinson. While Stein was able to keep the governor’s office under Democratic control, it is concerning how Robinson was able to capture 45% of the state’s vote even after his repudiation of equal rights for everyone and proudly and loudly asserting he was a “Black Nazi3.” Robinson’s performance must be a wake-up call to Democrats - even without the support of Trump and major organizations, extreme right-wing candidates can still leverage the conservative media ecosystem to engender support and momentum for their platforms. Stein’s pathway to victory, in contrast, should encourage others to do the same: focus less on abstract issues and identity politics, and connect with voters on the issues they say matter most, including the economy, disaster relief, and addressing housing affordability. The same held true for Bob Ferguson in Washington state. Running on a platform of housing affordability, reducing costs for families throughout the state, and improving public safety allowed him to easily capture the governor’s office. His message resonated with voters concerned about how “Bidenomics” failed to lower the cost of eggs, and how the Trump Administration would gut avenues of education and upward mobility. Stein and Ferguson - notably both then-incumbent attorneys general for their states had a definitive strategy to approach voters. Their wins provide a blueprint for candidates in other states seeking to align themselves with their voters. Their wins prove when Democrats focus on pressing issues for voters, it’s fighting the right fight. And when we fight, we win. 3 “NC gov. Candidate Mark Robinson declared himself ‘Black Nazi’ on porn site: CNN. axios.com/local/raleigh/2024/09/19/mark-robinson-cnn-report-nc-scandal. Correct number is 3, not 2. Appears to be missing Delaware. Claim contradicts public reporting.
Disclaimer: This document reflects the views of the author, not the DNC. The DNC was not provided with the underlying sourcing, interviews, or supporting data for many of the assertions contained herein and therefore cannot independently verify the claims presented. **

North Carolina's Ticket-Splitting Divergence
- Josh Stein significantly outperformed Kamala Harris in North Carolina by winning 51% of male voters, an 11-point lead over Harris's performance with the same demographic.
- Stein's success was rooted in a 'nonpartisan' focus on his record as Attorney General, specifically highlighting his work on fentanyl and consumer protection.
- Approximately 6.8% of North Carolina voters engaged in ticket-splitting, casting ballots for both Donald Trump and Josh Stein, primarily among college-educated suburban women.
- While Mark Robinson's campaign imploded due to toxic rhetoric, Stein's victory was also driven by limiting losses in rural areas where Harris's support cratered.
- The data suggests Stein treated irregular and new voters as persuasion targets rather than just mobilization targets, outperforming Harris by 8 points in that category.
- In contrast to North Carolina, New Hampshire saw the opposite trend where the Democratic gubernatorial candidate ran over 6 points behind Harris.
Voters were willing to split their tickets for governor when faced with unacceptable choices, but voters returned to their partisan corners at the presidential level.
23 NORTH CAROLINA GOVERNOR The Results: ● Stein (D): 54.8% | Robinson (R): 42.7% ● Harris in NC: 47.7% | Trump: 51.1% ● Stein ran 7.8 points ahead of Harris What Happened Mark Robinson’s campaign imploded, running significantly behind Trump statewide. His inflammatory statements about LGBTQ+ individuals, the Holocaust, and slavery made him toxic. Approximately 6.8% of NC voters cast their ballots for Trump-Stein, mostly college-educated suburban women over 45. But Stein didn't just win by default. He addressed the exact problems Harris did not: Men: Won 51% vs. Harris's 40% (+11) Stein's substantially better performance with men suggests his campaign found ways to connect with male voters. His gender gap was notably narrower than Harris's. The national campaign appeared to struggle with male voter engagement; Stein's results suggest a different approach is needed. Rural voters: Stein 38% vs. Harris 29% (+9) Harris essentially cratered in rural North Carolina. The in-state Stein team understood the path to victory lay in limiting margins in rural North Carolina. The seemingly nonpartisan focus on Stein’s record as Attorney General leveraged his record on fentanyl and consumer protection credentials as attorney general. White non-college voters: Stein 50% vs. Harris's 43% (+7) Harris's focus on college-educated suburbs widened the education gap. Stein's better performance with non-college voters suggests more balanced messaging. New voters: Stein 56% vs. Harris's 48% (+8) Stein's success with irregular voters suggests his campaign treated them as persuasion targets, not just mobilization targets. Harris fell below 50% with new voters for the first time in modern Democratic history. The Geographic Formula. Stein succeeded everywhere: ● In urban cores, Stein was +5 vs. Harris (maintained enthusiasm) No evidence provided for many claims in this section. Public reporting and data contradict several claims.
Contradicts claims elsewhere in the report.
Disclaimer: This document reflects the views of the author, not the DNC. The DNC was not provided with the underlying sourcing, interviews, or supporting data for many of the assertions contained herein and therefore cannot independently verify the claims presented. **
24 ● In the suburbs, Stein was +4 (won moderates) ● In rural North Carolina, Stein was +9 (limited losses) Democrats need to hit on all three to win statewide races in North Carolina (and in most states). Harris underperformed in rural areas and struggled in the suburbs. Metro Area Performance. Stein’s best performance relative to Harris was in the major metro areas: ● Raleigh (Wake County): +8 points ● Charlotte (Mecklenburg County): +8 points ● Durham County: +7 points ● Greensboro (Guilford County): +8 points The Robinson Effect. Robinson ran dramatically behind Trump statewide, particularly in college-educated suburbs. In precincts where Robinson performed worse relative to Trump, Stein significantly overperformed Harris. Voters were willing to split their tickets for governor when faced with unacceptable choices, but voters returned to their partisan corners at the presidential level. The Lesson. Robinson imploded, but Stein's results suggest a fundamentally different campaign approach to address the weaknesses the national campaign struggled to fix: stronger performance among male voters, improved competitiveness in rural areas, early messaging, and more balanced coalition-building. NEW HAMPSHIRE GOVERNOR The Results: ● Craig (D): 47.2% | Ayotte (R): 52.8% ● Harris in NH: 52.9% | Trump: 46.4% ● Craig ran 6.4 points behind Harris What Happened. Craig underperformed Harris by 5-7 points across every demographic group. Kelly Ayotte was a strong candidate - as a former Senator with high favorable ratings and a moderate profile. No evidence provided for many claims in this section. Public reporting and data contradict several claims.
Gubernatorial Underperformance and Ticket Splitting
- New Hampshire saw a high ticket-splitting rate with 8.5% of voters supporting both Harris and Republican Kelly Ayotte.
- Democratic candidate Joyce Craig underperformed Harris across all geographic sectors, including urban, suburban, and rural areas.
- The Craig campaign failed to define a clear platform beyond being an alternative to Ayotte and Trump, mirroring national messaging struggles.
- Harris's victory in New Hampshire is characterized more as an anti-Trump sentiment than a proactive endorsement of her candidacy.
- In Washington, Bob Ferguson won the governorship but still ran nearly four points behind the top of the ticket.
- The DNC explicitly disclaims the report's findings, noting a lack of underlying data and contradictions with public reporting.
When you can't define yourself and can't generate enthusiasm, you lose even when your party's presidential candidate wins the state.
Disclaimer: This document reflects the views of the author, not the DNC. The DNC was not provided with the underlying sourcing, interviews, or supporting data for many of the assertions contained herein and therefore cannot independently verify the claims presented. **
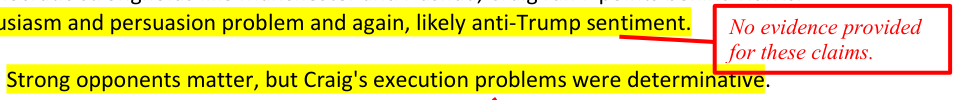
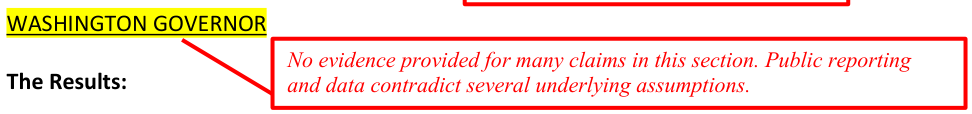
25 About 8.5% of NH voters went Harris-Ayotte (highest ticket-splitting rate of the three top-funded gubernatorial states). These were New Hampshire's traditional moderate Republicans: college-educated, suburban, and older voters who consistently vote. No Geographic Floor. Craig underperformed everywhere: ● In urban areas, Craig was -7 vs. Harris ● In the suburbs, Craig was -6 vs. Harris ● In Rural New Hampshire, Craig was -4 vs. Harris The Definition Problem. The campaign never established what Craig stood for beyond "not Ayotte/Trump." This mirrored the national campaign's struggles with Harris. Both campaigns faced the same challenge: difficulty defining the candidate and opponent, building enthusiasm, or making a compelling case. Harris’ win in NH may be more an anti-Trump than pro-Harris outcome. Craig Underperformed Harris in key areas: ● Portsmouth suburbs (Rockingham County): -8 points ● Manchester/Nashua (Hillsborough County): -7 points ● Concord area (Merrimack County): -7 points Even in Democratic strongholds like Manchester and Nashua, Craig ran 7 points behind Harris. It's an enthusiasm and persuasion problem and again, likely anti-Trump sentiment. The Lesson. Strong opponents matter, but Craig's execution problems were determinative. When you can't define yourself and can't generate enthusiasm, you lose even when your party's presidential candidate wins the state. WASHINGTON GOVERNOR The Results: ● Ferguson (D): 56.3% | Reichert (R): 43.7% ● Harris in WA: 59.5% | Trump: 39.2% ● Ferguson ran 3.7 points behind Harris What Happened. Ferguson won comfortably, but underperformed Harris. Younger, diverse voters voted in the Presidential race but skipped the governor's race. No evidence provided for this claim.
No evidence provided for these claims. No evidence provided for these claims. No evidence provided for many claims in this section. Public reporting and data contradict several underlying assumptions.
Disclaimer: This document reflects the views of the author, not the DNC. The DNC was not provided with the underlying sourcing, interviews, or supporting data for many of the assertions contained herein and therefore cannot independently verify the claims presented. **

Down-Ballot Performance Disparities
- Bob Ferguson underperformed Kamala Harris in urban Democratic strongholds like Seattle and Tacoma by four to five points.
- Ferguson successfully leveraged his attorney general background to outperform Harris in rural areas, limiting losses in conservative districts.
- In North Carolina, Jeff Jackson outperformed Harris by 4.2 points but trailed Josh Stein's gubernatorial performance by 3.4 points.
- The data suggests that lower-profile races in blue states require affirmative candidate cases rather than relying solely on anti-Trump sentiment.
- Voter enthusiasm dropped significantly in environments where Donald Trump was not perceived as being in a competitive race.
- The DNC explicitly disclaimed the findings, noting that public reporting and data often contradict the author's underlying assumptions.
Even in safe blue states, lower-profile races need affirmative cases for candidates, not just opposition to Trump.
26 Ferguson underperformed Harris in Democratic strongholds: ● Seattle (King County): Ferguson -5 vs. Harris ● Tacoma (Pierce County): -4 ● Olympia (Thurston County): -4 ● Everett (Snohomish County): -4 Harris underperformed with voters of color by several points, and new/irregular voters showed the same pattern. One Bright Spot. Ferguson outperformed Harris in rural areas. His attorney general background and public safety credentials likely helped limit losses in conservative areas opposed to the top of the ticket. Ferguson – similar to Josh Steim was able to build credibility on his record and background even as the national campaign struggled to a similar profile around Harris's prosecutor background. The Lesson. Even in safe blue states, lower-profile races need affirmative cases for candidates, not just opposition to Trump. When Trump wasn't in a competitive environment, enthusiasm dropped. ATTORNEY GENERAL NORTH CAROLINA ATTORNEY GENERAL The Results: ● Jackson (D): 51.4% | Bishop (R): 48.6% ● Harris in NC: 47.7% | Trump: 51.1% ● Stein in NC: 54.8% | Robinson: 42.7% ● Jackson ran +4.2 vs. Harris but -3.4 vs. Stein What Happened. Jackson fell between Harris and Stein on virtually every metric. He had real advantages — three terms in Congress, strong digital presence, name recognition, but could not match Stein's success. Jackson Performed Between Harris and Stein. ● Men: Jackson improved significantly over Harris but didn't match Stein ● Rural voters: Better than Harris, not as strong as Stein ● New voters: Outperformed Harris, underperformed Stein ● White non-college voters: Similar pattern No evidence provided for many claims in this section. Public reporting and data contradict several underlying assumptions.
Disclaimer: This document reflects the views of the author, not the DNC. The DNC was not provided with the underlying sourcing, interviews, or supporting data for many of the assertions contained herein and therefore cannot independently verify the claims presented. **
Jackson's Down-Ballot Performance Dynamics
- Jeff Jackson consistently outperformed the presidential ticket but trailed the gubernatorial candidate's exceptional margins.
- Lower visibility and a more conventional Republican opponent limited Jackson's ability to capitalize on ticket-splitting compared to the governor's race.
- Jackson's significant overperformance in urban and suburban metros was bolstered by his established congressional credibility and massive digital following.
- The 'Robinson effect' primarily benefited the top of the state ticket, showing that down-ballot races face unique resource and attention constraints.
- Jackson's success highlights that while strong candidates can outrun the top of the ticket, they still face structural limits in lower-visibility races.
The quality contrast that drove Trump-Stein voters wasn't as stark for AG.
27 Jackson's support across demographics consistently placed him in the middle - better than the struggling presidential campaign, but not matching the exceptional gubernatorial performance. Why Jackson Underperformed Stein Lower race visibility: AG races get less attention than gubernatorial races. Even engaged voters know less about AG candidates. Robinson effect was concentrated: Extraordinary ticket-splitting from Robinson's collapse primarily benefited the governor's race. Lower races didn't benefit as much. Less clear contrast: Dan Bishop was a conventional Republican. The quality contrast that drove Trump-Stein voters wasn't as stark for AG. Resource constraints: Jackson couldn't match Stein's fundraising or media presence. The gubernatorial race dominated coverage. Jackson Overperformed Harris in NC Metros ● Raleigh area: +5 points ● Charlotte area: +4 points ● Durham: +4 points ● Chapel Hill area: +3 points Jackson's overperformance was concentrated in the same urban/suburban areas as Stein's but at lower magnitudes. The Value of Congressional Experience. Despite underperforming Stein, Jackson's 4-point overperformance versus Harris is significant. His three terms in Congress gave him credibility and name recognition generic Democratic candidates wouldn't have. His digital presence - millions of followers across platforms - also helped, particularly with younger voters, where he came close to Stein's performance. The Lesson. Jackson's performance demonstrates both the opportunity and limits of down ballot success in 2024: The opportunity: Even in Attorney General races with lower visibility, strong candidates with established records can outperform the top of the ticket. The limits: Extraordinary circumstances, such as Robinson's collapse, create opportunities for the whole ticket, but campaigns still have to close the deal. While Jackson outspent Bishop, it was No evidence provided for many claims in this section. Methodology appears internally inconsistent.
Disclaimer: This document reflects the views of the author, not the DNC. The DNC was not provided with the underlying sourcing, interviews, or supporting data for many of the assertions contained herein and therefore cannot independently verify the claims presented. **
Down Ballot Performance Gaps
- Josh Stein's gubernatorial success demonstrates that candidate quality and specific opponent weaknesses can overcome national partisan trends.
- A consistent 'Male Voter Problem' plagued the national ticket, with every down-ballot Democrat outperforming Harris among men by 4 to 11 points.
- Stein's ability to recover ground with young men of color suggests that the national campaign's losses in these demographics were not inevitable.
- Education polarization remains most severe among white voters, where Harris's focus on college-educated suburbs created insurmountable math problems.
- The data indicates that Democrats cannot win by losing non-college voters by massive margins when they constitute the majority of the electorate.
- The DNC officially distanced itself from this report, noting that many claims lack supporting data or contradict public reporting.
This is a math problem: Democrats can't lose non-college voters by massive margins and make it up elsewhere when non-college voters are a majority of the electorate.
28 not to the same magnitude as Stein outspending Robinson. Further, Bishop was not Robinson. Jackson benefited from Robinson's implosion but couldn't replicate Stein's success because the intensity of the controversy was focused on the gubernatorial race. The implication: Candidate quality and name recognition matter for all down ballot races, but some dynamics don't transfer uniformly across the ballot. Campaigns need to build their own contrast and definition. KEY DEMOGRAPHIC PATTERNS The Male Voter Problem. Every down ballot Democrat did better among men than Harris: ● Stein: +11 vs. Harris ● Jackson: +6 ● Ferguson: +4 ● Craig: +5 Even Craig, who lost in New Hampshire, still did 5 points better with men. This suggests the national campaign had a specific problem with male voters. Stein outperformed the rest of the candidates because of the specific weaknesses and rejection of Robinson. Young men of color—Harris's steepest losses: Harris saw dramatic drops in support among young Latino men and young Black men compared to Biden's 2020 performance. However, Stein recovered significant ground with both groups, suggesting his campaign found effective ways to reach these voters. Stein's results suggest it's possible to win women AND compete with men with the right approach. Education Polarization. White voters showed substantial education gaps across all races, with college-educated voters supporting Democrats significantly more than non-college voters. But Stein hit 50% with white non-college voters vs. Harris's 43%. This is a math problem: Democrats can't lose non-college voters by massive margins and make it up elsewhere when non-college voters are a majority of the electorate. Harris's focus on college-educated suburbs left gaps at unwinnable levels. Education polarization appeared mostly among White Voters - Black voters show minimal education gaps, Latino voters show moderate gaps, while White voters show the most significant splits. No evidence provided for many claims in this section. Public reporting and data contradict several claims.
Contradicts claims elsewhere in the report.
Disclaimer: This document reflects the views of the author, not the DNC. The DNC was not provided with the underlying sourcing, interviews, or supporting data for many of the assertions contained herein and therefore cannot independently verify the claims presented. **
Irregular Voters and Ticket Splitting
- The Harris campaign struggled with irregular voters, falling below 50% with first-time participants while down-ballot candidates like Josh Stein outperformed her.
- Irregular voters are disproportionately younger, non-college, male, and urban, representing a demographic shift that Democrats failed to capture.
- Ticket-splitting remains a small but decisive factor, with college-educated suburbanites in North Carolina choosing Trump and Stein simultaneously.
- The national campaign incorrectly assumed that persuadable voters would automatically reject Trump and default to the Democratic candidate.
- Josh Stein's success in North Carolina provides a winning formula by maintaining urban enthusiasm, winning swing suburbs, and limiting rural losses.
- The data suggests the election outcome was less about party brand or policy and more about the specific evaluation of Harris as a candidate.
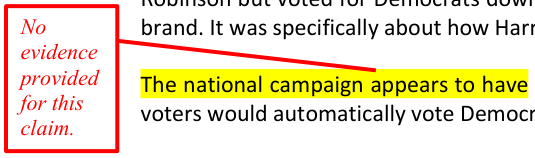
The national campaign appears to have assumed Trump was so unacceptable that persuadable voters would automatically vote Democratic.
29 Irregular Voters: The Biggest Miss New voters (first-time participants in these four election cycles): ● Harris: 48% (first time Dems fell below 50%) ● Stein: 56% (+8) ● Jackson: 53% (+5) ● Ferguson: 57% ● Craig: 50% Irregular voters are disproportionately voters of color, younger, non-college, male, and urban - the voters Democrats need and where the Harris Campaign struggled the most. Josh Stein won them decisively, suggesting his campaign treated them as persuasion targets and engaged them throughout the campaign. It helped to run against a self-described Nazi most voters would never support, but Stein converted where Harris did not. The national campaign appears to have assumed irregular voters would turn out AND vote Democratic at Obama-era rates. Both assumptions proved wrong. Ticket-Splitting. Ticket-splitting rates: ● New Hampshire: 9.7% (mostly Harris-Ayotte) ● North Carolina: 8.5% (mostly Trump-Stein) ● Washington: 4.2% Ticket splitters are overwhelmingly college-educated, suburban, and older voters who vote consistently. They're small (under 10%) but decisive. And they evaluate candidates individually. What This Reveals In North Carolina, engaged educated voters went Trump-Stein—they rejected both Harris and Robinson but voted for Democrats down ballot. The problem wasn't Democratic policy or party brand. It was specifically about how Harris as a candidate The national campaign appears to have assumed Trump was so unacceptable that persuadable voters would automatically vote Democratic. North Carolina's results suggest otherwise. GEOGRAPHIC PATTERNS Urban Cores Contradicts claims elsewhere in the report. No evidence provided for this claim.
No evidence provided for this claim.
Disclaimer: This document reflects the views of the author, not the DNC. The DNC was not provided with the underlying sourcing, interviews, or supporting data for many of the assertions contained herein and therefore cannot independently verify the claims presented. **
30 ● Stein (NC): +5 vs. Harris (maintained enthusiasm) ● Jackson (NC): +2 ● Ferguson (WA): -5 (turnout problem) ● Craig (NH): -7 (enthusiasm collapse) Suburbs (decisive terrain) ● Stein (NC): +4 vs. Harris (won swing voters) ● Jackson (NC): +2 ● Ferguson (WA): -3 ● Craig (NH): -6 (lost moderates badly) Rural (sets the floor) ● Stein (NC): +9 vs. Harris (limited losses) ● Jackson (NC): +5 ● Ferguson (WA): +2 ● Craig (NH): -4 The Formula Winning requires a strong urban performance + competitive suburbs + limited rural losses. Stein achieved all three. Craig failed at all three. Harris lagged in rural areas nationally, which proved to be insurmountable in swing states.
Disclaimer: This document reflects the views of the author, not the DNC. The DNC was not provided with the underlying sourcing, interviews, or supporting data for many of the assertions contained herein and therefore cannot independently verify the claims presented. **
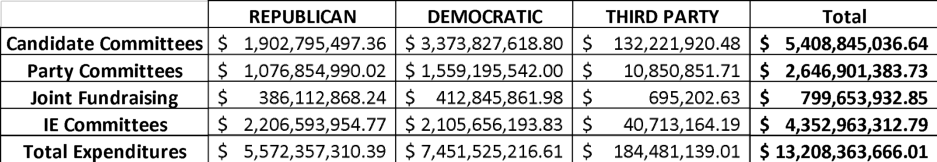
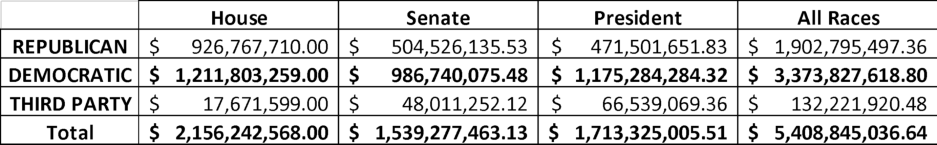
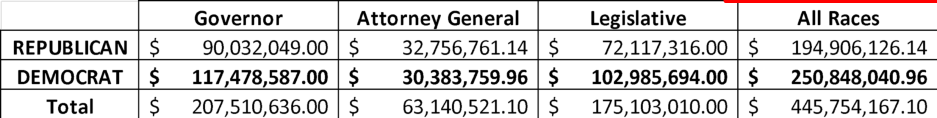
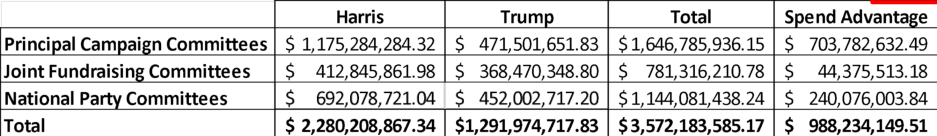
Lessons from State Campaigns
- Josh Stein's success in North Carolina demonstrates that aggressive negative campaigning is effective when the candidate has already established a positive reputation.
- The 11-point gap between Stein and Harris among male voters suggests that the national campaign's focus on women alienated a solvable demographic.
- Stein's performance in rural areas highlights a strategic miscalculation by the Harris campaign, which assumed urban margins could offset massive rural losses.
- A clear professional definition, such as Stein's record as Attorney General, proved more effective than Harris's reactive 'prosecutor vs. felon' framing.
- Harris failed to capture irregular and new voters, winning less than 50% of that group compared to Stein's 56% in the same state.
- The DNC explicitly disclaims the report's findings, noting a lack of underlying data or evidence to verify the author's assertions.
The idea Trump’s negatives were “baked in” is a major failure of analysis and reality - given how his favorability has cratered less than a year into this term.
31 LESSONS FROM THE STATE CAMPAIGNS 1. Going Negative Works (Especially if Voters Know You). Stein spent early to credential himself as a fighter and advocate. When the Robinson story broke, Stein was a known factor and alternative for voters. Pounding the negative on Robinson ensured Stein would never break through. The national campaign did not effectively drive Trump’s negatives, and the White House did not effectively support Vice President Harris over three and half years to improve her standing before the candidate switch. The retrospective job approval for Trump was too high and the campaign and allies failed to remind voters of his incompetence. The idea Trump’s negatives were “baked in” is a major failure of analysis and reality - given how his favorability has cratered less than a year into this term. 2. The Male Voter Problem Was Solvable. Stein won 51% of men while Harris won 40%. That 11-point gap suggests fundamentally different approaches to male voter engagement. The Harris campaign appears to have focused heavily on women. Stein's results show some candidates can appeal strongly to women AND compete effectively with men. 3. Rural Miscalculation. Stein's strong rural performance in NC shows these areas remain competitive with the right candidate and approach. Harris wrote off rural America, assuming urban/suburban margins would compensate. The math doesn't work. You can't lose rural areas by overwhelming margins and make it up elsewhere when rural voters are a significant share of the electorate. If Democrats are to reclaim leadership in the Heartland or the South, candidates must perform well in rural turf. Show up, listen, and then do it again. 4. The Definition Problem. Stein had a clear definition: Attorney General with a strong record. Voters knew what he'd done and what he'd do. Harris struggled with definition beyond "not Trump" and "prosecutor vs. felon." The truncated campaign timeline didn't help, but the campaign did not quickly resolve on how to tag Trump and define Harris. 5. Irregular Voters Weren’t Feeling it. Harris fell below 50% with new voters. Stein won 56%. The Harris campaign’s re-engagement targets appear to have both not shown up and voted more for Trump than expected. No evidence provided for many claims in this section. Data inconsistent with public reporting and contradicts several underlying assumptions.
No evidence provided; contradicts claims elsewhere in report. No evidence provided for these claims.
Disclaimer: This document reflects the views of the author, not the DNC. The DNC was not provided with the underlying sourcing, interviews, or supporting data for many of the assertions contained herein and therefore cannot independently verify the claims presented. **
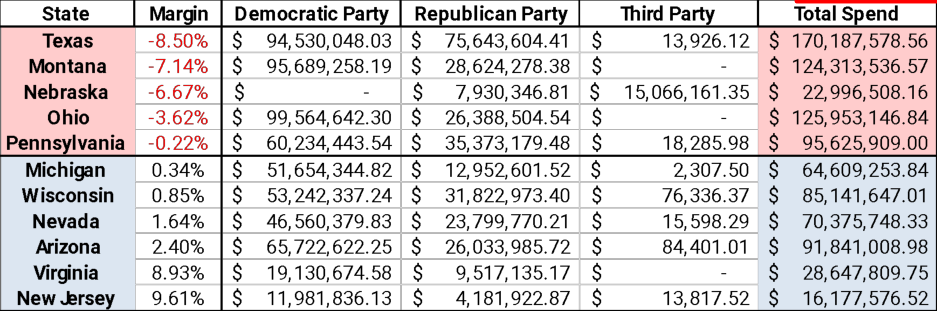
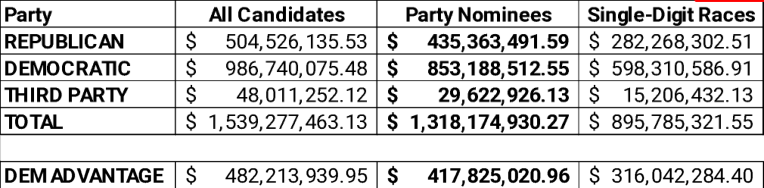
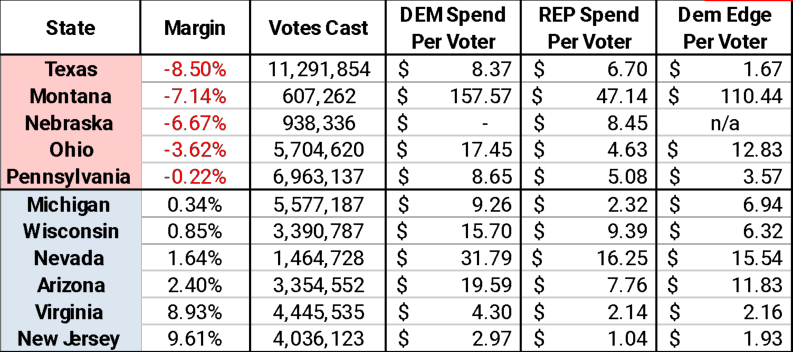
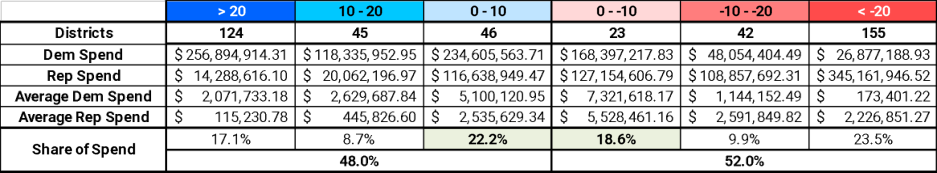
The Limits of Anti-Trumpism
- Massive media spending failed to translate into voter turnout due to a lack of robust on-the-ground organizing.
- The Harris campaign relied too heavily on Trump's unacceptability rather than building an affirmative case for her own candidacy.
- Democrats must engage male voters directly through economic issues rather than assuming identity politics will secure their support.
- A successful geographic formula requires a combination of strong urban turnout, competitive suburbs, and minimizing rural losses.
- The shift of Latino voters toward Republicans suggests that demographic trends are not fixed and depend heavily on candidate execution.
- Year-round engagement and clear policy definitions are more effective at reaching irregular voters than last-minute get-out-the-vote efforts.
The Harris campaign appears to have relied on Trump being unacceptable rather than building an affirmative case for Harris.
32 Massive media investments weren't matched by equally robust organizing. Result: lower turnout and lower support for the top of the ticket. 6. The Enthusiasm Gap Was Predictable. Ferguson's underperformance in Seattle and Craig's collapse in Manchester demonstrate anti-Trump sentiment alone was insufficient to motivate voters. The Harris campaign appears to have relied on Trump being unacceptable rather than building an affirmative case for Harris. Base voters needed reasons to vote FOR Harris as well as against Trump. Without an effective contrast with a difficult (and unaffordable) status quo, the obvious contrast with Trump was not a sufficient motivator, especially since there was not sufficient negative messaging about how horrible Trump was (and still is) for and to most Americans. STRATEGIC IMPLICATIONS For Democrats: Male voters require direct engagement. The gender gap can be narrowed. Deploy male messengers, address economic concerns, and don't assume identity politics will hold male voters of color. The Rural “strategy” is mathematically indefensible. Compete everywhere. Limiting losses matters. Recruit candidates with rural credibility and show up. Anti-Trump sentiment has limits. Build affirmative cases for candidates to drive enthusiasm instead of relying on reductive messaging. Irregular voters are swing voters. They need mobilization AND persuasion. Year-round engagement matters more than October GOTV. Definition is essential. Voters need to know what you'll do and why you're running. Clear accomplishments and concrete plans matter more than vibes. Geographic formula is non-negotiable. Strong urban + competitive suburbs + limited rural losses. You need all three. Demographics aren't destiny. Latino voters shifted Republican nationally but Democratic in NC with the right candidate. Context and execution matter. State parties matter. Built infrastructure wins even when presidential candidates struggle. No evidence provided for these claims.
No evidence provided for many claims in this section. Data inconsistent with public reporting and contradicts several underlying assumptions. No evidence provided for this claim. No evidence provided for these claims.
Disclaimer: This document reflects the views of the author, not the DNC. The DNC was not provided with the underlying sourcing, interviews, or supporting data for many of the assertions contained herein and therefore cannot independently verify the claims presented. **
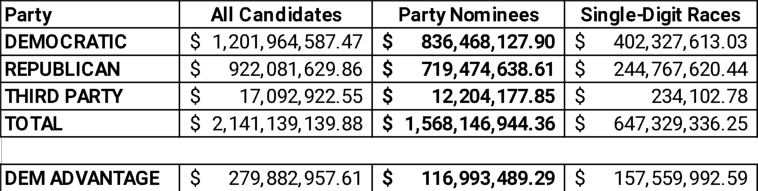
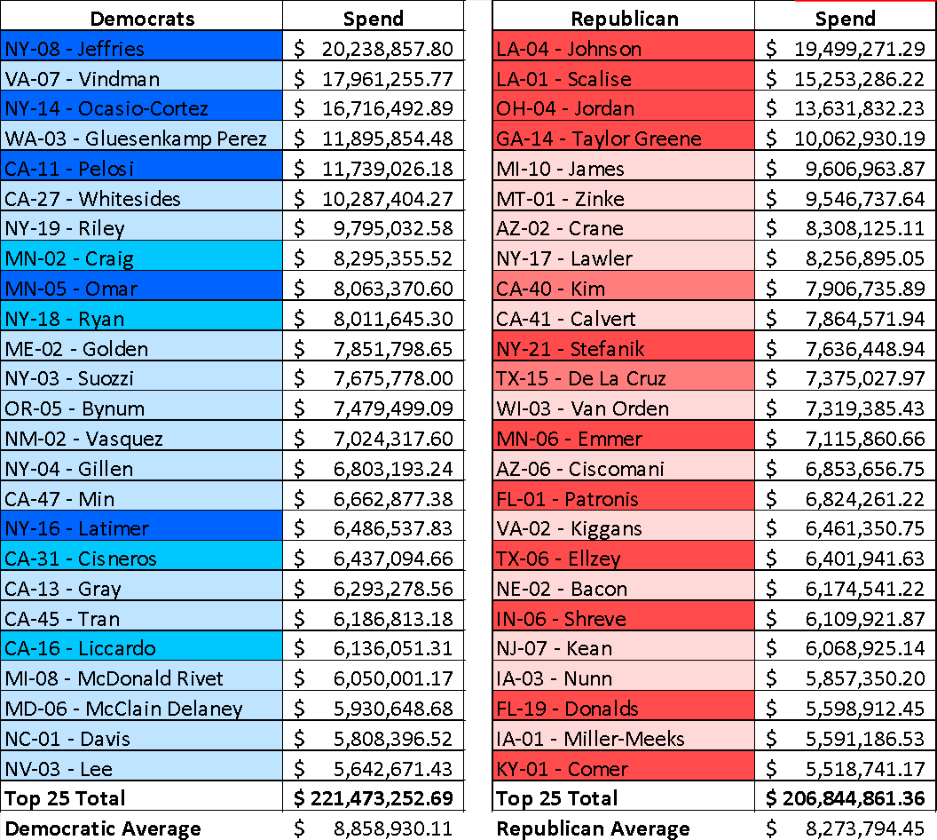
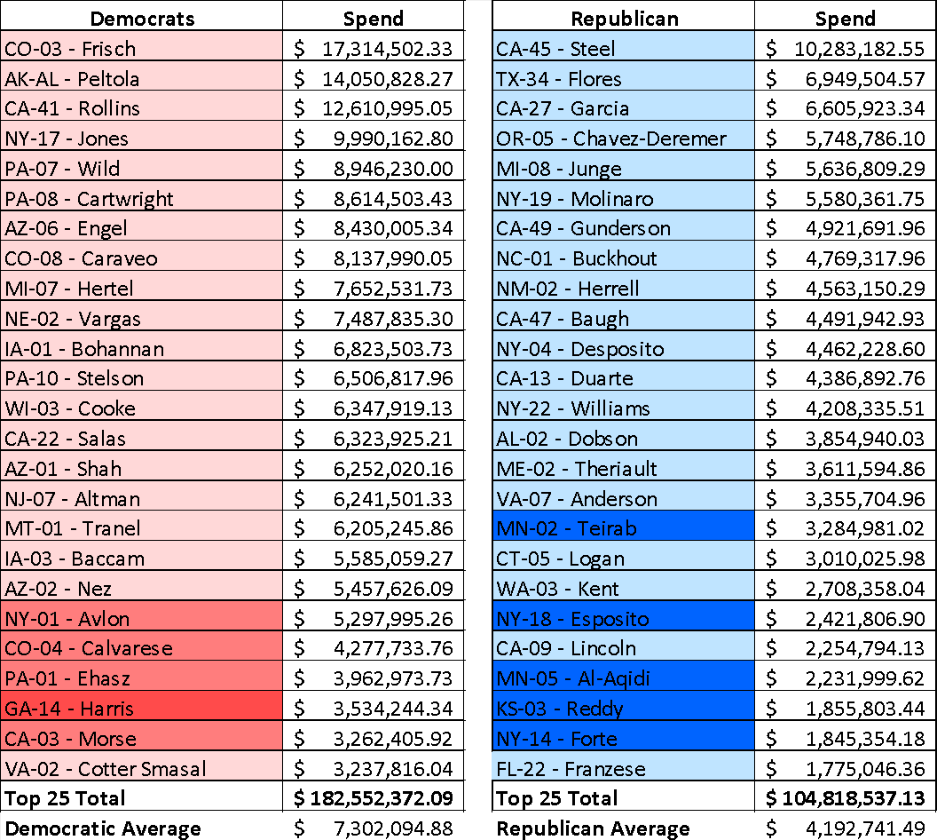
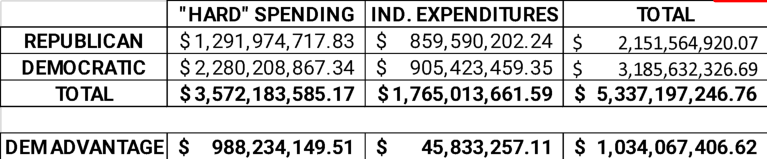
Campaign Strategy and Voter Trends
- Voters demonstrate sophistication through ticket-splitting, with 8-10% of the electorate evaluating candidates individually rather than by party line.
- While demographics like young voters and men trended Republican, Josh Stein's success suggests these losses can be mitigated with the right strategy.
- Early investments in media by the DGA and DAGA allowed candidates to define themselves before their opponents could, providing a significant tactical advantage.
- The late transition to the Harris campaign limited messaging and organizing options, leading to underperformance compared to down-ballot Democrats.
- Candidate quality and execution remain decisive factors, proving that demographics are merely tendencies rather than political destiny.
- Effective campaigning requires introducing a candidate through a strong framework before attempting to define the opponent.
Demographics are tendencies, not destiny, and voter support is impacted - good and bad - through campaign choices.
33 Voters are sophisticated. The 8-10% who split tickets are decisive. They evaluate candidates individually. Same Challenges, Different Responses. Young voters, men, voters of color, and irregular voters all trended Republican compared to 2020. The difference was how campaigns responded. Stein's results suggest effective strategies to mitigate these losses. Harris's campaign appears not to have made similar adjustments. Candidate quality and campaign execution matter enormously, even in nationalized environments. The Bottom Line Elections remain winnable with the right candidates and strategies, even in difficult environments. Demographics are tendencies, not destiny, and voter support is impacted - good and bad - through campaign choices. The North Carolina battleground demonstrates the power of a strong and early investment in supportive media to define the candidates for Governor and Attorney General. Early investments by the DGA and DAGA enabled the candidates to introduce themselves on their terms, and take the high ground when circumstances allowed. The late switch to Harris limited messaging and organizing options and produced predictable results. Down ballot Democrats who took different approaches performed significantly better. Defining the opponent works best if the candidate driving the message has already introduced themselves to voters through an effective framework. Will future campaigns learn from successes like Stein and Jackson, or repeat similar errors? No evidence provided for these claims.
Disclaimer: This document reflects the views of the author, not the DNC. The DNC was not provided with the underlying sourcing, interviews, or supporting data for many of the assertions contained herein and therefore cannot independently verify the claims presented. **
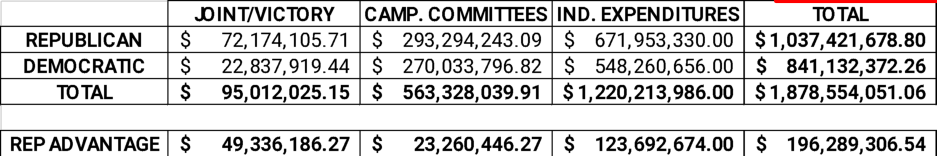
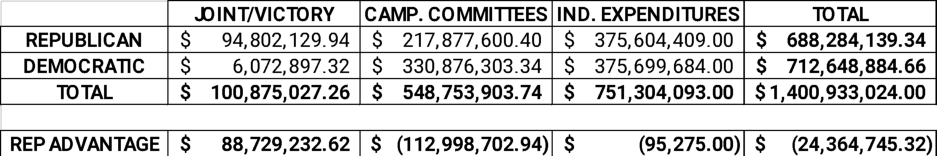
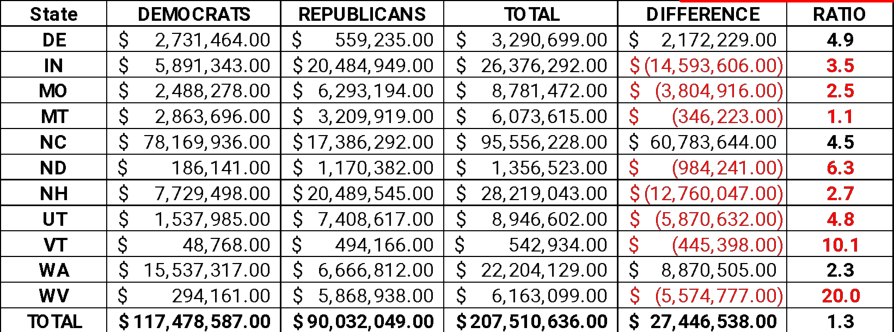
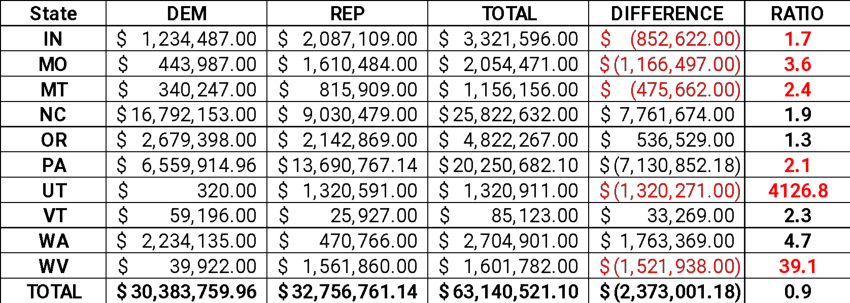
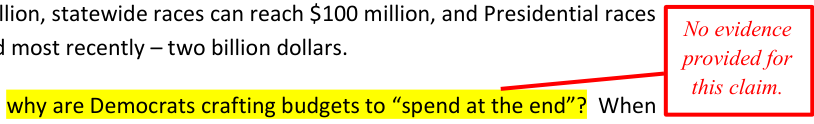
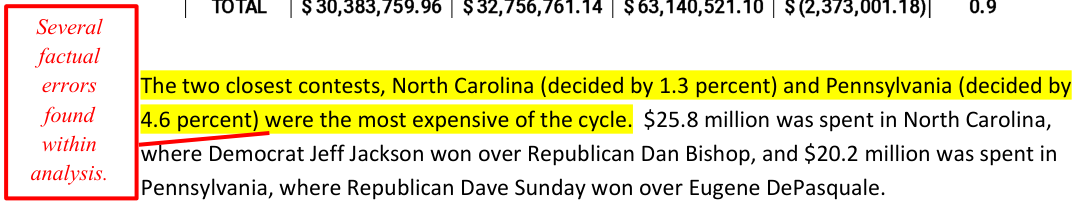
The 2024 Senate Results
- Republicans flipped key seats in Ohio and Montana where Democratic incumbents outperformed Harris but could not overcome significant Trump margins.
- Pennsylvania saw the narrowest Senate race in the country, with David McCormick defeating Bob Casey by a mere 0.2 percentage points.
- Democratic candidates in Michigan, Nevada, and Arizona successfully held their seats by running significantly ahead of the top of the ticket.
- Voter behavior in Nevada showed a unique trend where a portion of Trump supporters chose to skip the Senate race entirely rather than vote for the Republican candidate.
- The results suggest that while personal brands and working-class credentials still matter, they are increasingly vulnerable to the 'gravity' of national partisan trends.
Brown outperformed Harris by 7.6 points and still lost. His decades of fighting for Ohio workers gave him credibility Harris couldn't match, but Brown could not overcome gravity.
34 THE SENATE The 2024 Results: Who Won Where There were 34 Senate races in 2024. In reviewing the results of the six key races, there are several patterns. Here are the specific margins shaped current conditions: Pennsylvania (Trump +2.1%): David McCormick (R) squeaked past Bob Casey (D) by just 0.2 percentage points (48.8% to 48.6%). This was the narrowest Senate race in the country. Casey ran 1.9 points ahead of Harris. Ohio (Trump +11.2%): Bernie Moreno (R) defeated Sherrod Brown (D) by 3.6 points. Brown won 120,000 more votes than Harris in Ohio, while Moreno got 320,000 fewer votes than Trump. Brown outperformed Harris by 7.6 points and still lost. His decades of fighting for Ohio workers gave him credibility Harris couldn't match, but Brown could not overcome gravity. Michigan (Trump +1.4%): Elissa Slotkin (D) beat Mike Rogers (R) by 0.34 percentage point. Rogers got 4% fewer votes than Trump, while Slotkin matched Harris's numbers. Slotkin's strong working-class credentials and presence in manufacturing communities helped her minimize losses in Trump territory. Nevada (Trump +3.1%): Jacky Rosen (D) won by 1.4 points. Sam Brown got nearly 10% fewer votes than Trump. According to the Nevada Appeal's analysis, some Trump voters literally just skipped the Senate race entirely. Rosen's strong organizing operation and deep roots in the Nevada service economy helped her overcome Trump's margin. Arizona (Trump +5.5%): Ruben Gallego (D) won by 2.4 points, running nearly 8 points ahead of Harris. Gallego's working-class background and authentic connections to everyday Arizonans helped him maintain support across diverse communities. Montana (Trump +20.0%): Tim Sheehy (R) defeated Jon Tester (D) by 7.5 points. Tester won 19% more raw votes than Harris but faced an insurmountable Trump tsunami. Tester's deep Montana roots helped him dramatically outperform Harris, but the state's political transformation proved too much to overcome. What the Campaigns Said Personal Brands Still Matter No evidence provided for many claims in this section. Public reporting and data contradict several underlying assumptions. No methodology provided for selection of these states or exclusion of WI.
Disclaimer: This document reflects the views of the author, not the DNC. The DNC was not provided with the underlying sourcing, interviews, or supporting data for many of the assertions contained herein and therefore cannot independently verify the claims presented. **
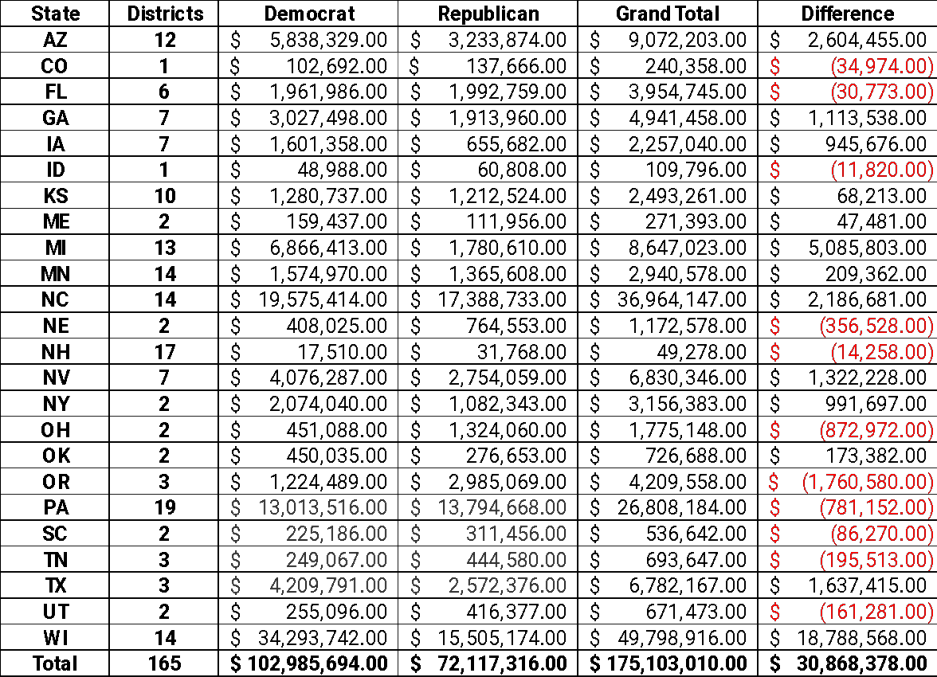
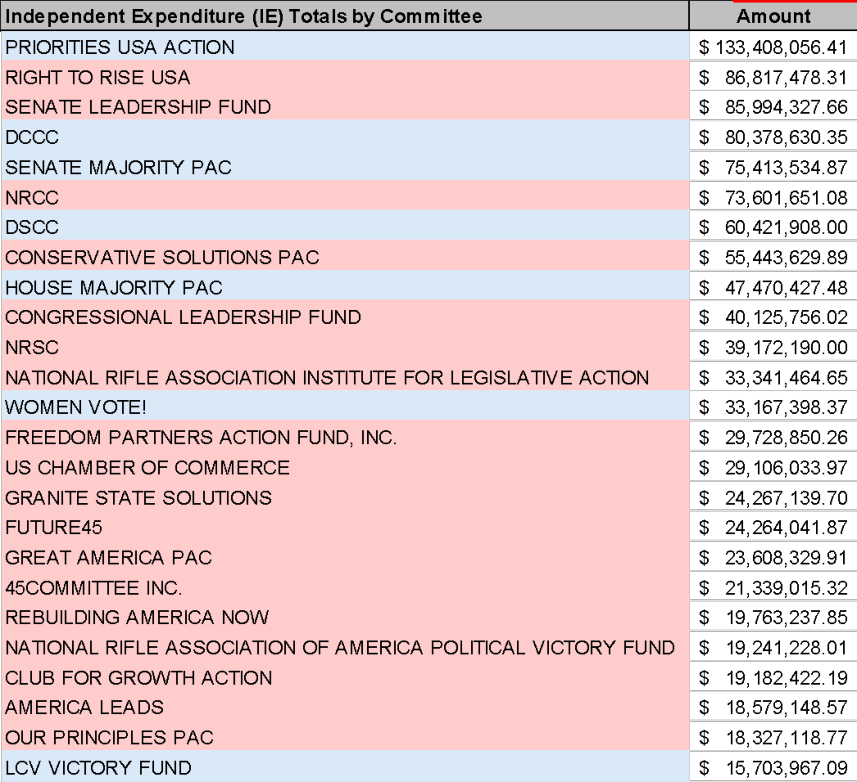
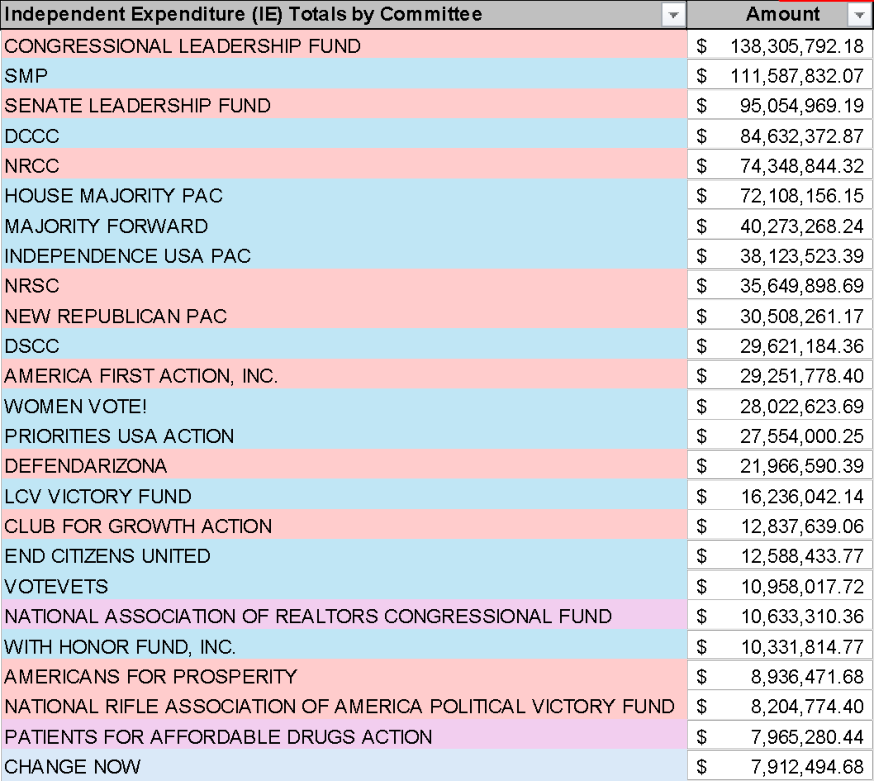
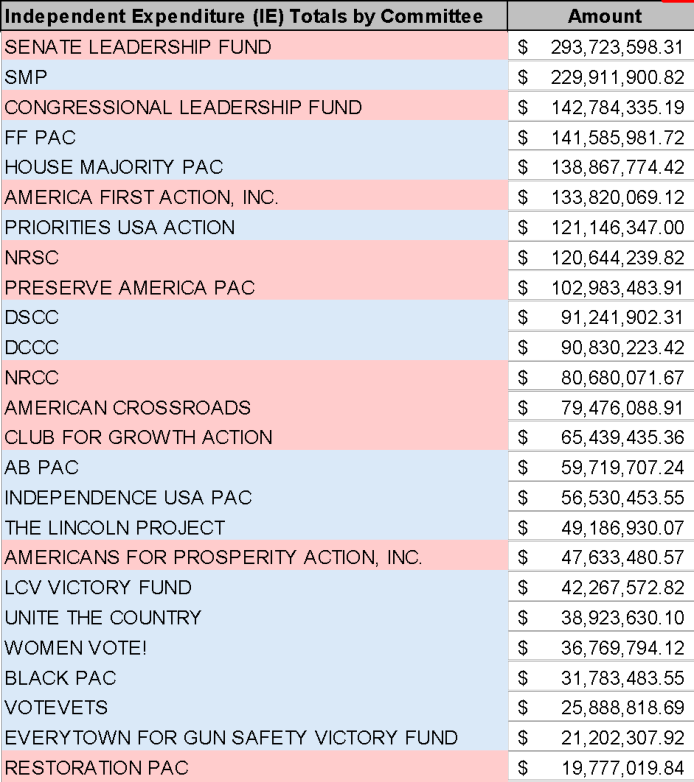
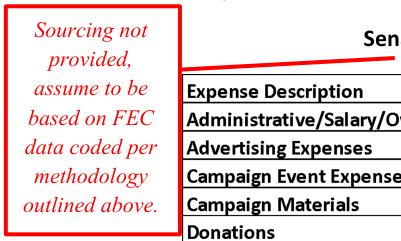
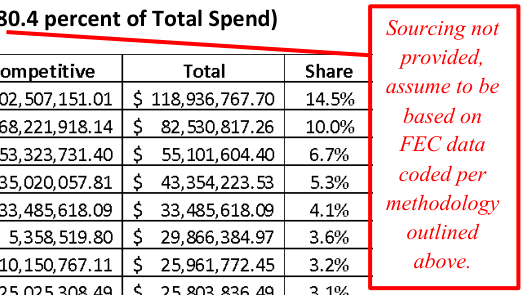
Local Identity and Ground Games
- Sherrod Brown and Jon Tester leveraged decades of personal brand-building to significantly outperform the national Democratic ticket in red states.
- Despite running optimized campaigns and securing local infrastructure wins, both candidates were ultimately overwhelmed by Donald Trump's massive margins.
- Senator Jacky Rosen's success in Nevada is attributed to a year-round organizing model that prioritized authentic local voices over out-of-state canvassers.
- Effective community-based organizing relied on member-to-member outreach, such as hospitality workers discussing kitchen-table issues with their peers.
- Cultural competency and bilingual outreach were essential components in maintaining trust within diverse working-class and Latino neighborhoods.
A hospitality worker talking to another hospitality worker about kitchen-table issues carried more weight than any paid consultant.
35 Sherrod Brown spent decades building a reputation as a working-class fighter who'd look out for Ohio. Jon Tester was the "three-fingered dirt farmer" from Big Sandy. Brown held rallies where he knew people would vote for Trump but might still vote for him. He'd been there for decades building trust and relationships. Tester made an aggressive pitch about the billions in infrastructure money he'd secured for Montana, talking up his work with Trump when it helped the state. Brown got 120,000 more votes than Harris. Tester massively outperformed her. In a "normal" election year, their performance would have been enough to eke out victories. Trump's margins were simply too large. Even a former Ohio Republican Party chair admitted after the election: "I really believe Sherrod Brown ran the best race he could... I don't know he could have won that race in the time that Donald Trump was on the ballot."4 Strong Ground Games Make the Difference The Rosen campaign shared how they built a year-round organizing operation beyond the typical late-cycle push. Rather than relying on paid canvassers from out of state, her campaign developed deep community relationships and deployed authentic local voices. The model worked through several key elements: Year-round presence: Rosen's operation maintained constant engagement with voters. This built trust and familiarity that paid off when it mattered. Community-based organizing: The campaign partnered with established community organizations, particularly in Latino neighborhoods and working-class communities. Member-to-member outreach: Rather than having strangers knock on doors, the campaign deployed people from within communities to talk to their neighbors. A hospitality worker talking to another hospitality worker about kitchen-table issues carried more weight than any paid consultant. Bilingual and culturally competent: With Nevada's diverse population, the campaign conducted outreach in Spanish and integrated cultural understanding into every aspect of organizing. 4 https://www.google.com/url?q=https://signalcleveland.org/why-u-s-sen-sherrod-browns-track-record-with-working-class-voters-wasnt-enough/&sa=D&source=docs&ust=1762851387509158&usg=AOvVaw055teCQogCF_UX1d9QrAit No source material or data provided. Unsourced claims cannot be independently verified.
Disclaimer: This document reflects the views of the author, not the DNC. The DNC was not provided with the underlying sourcing, interviews, or supporting data for many of the assertions contained herein and therefore cannot independently verify the claims presented. **
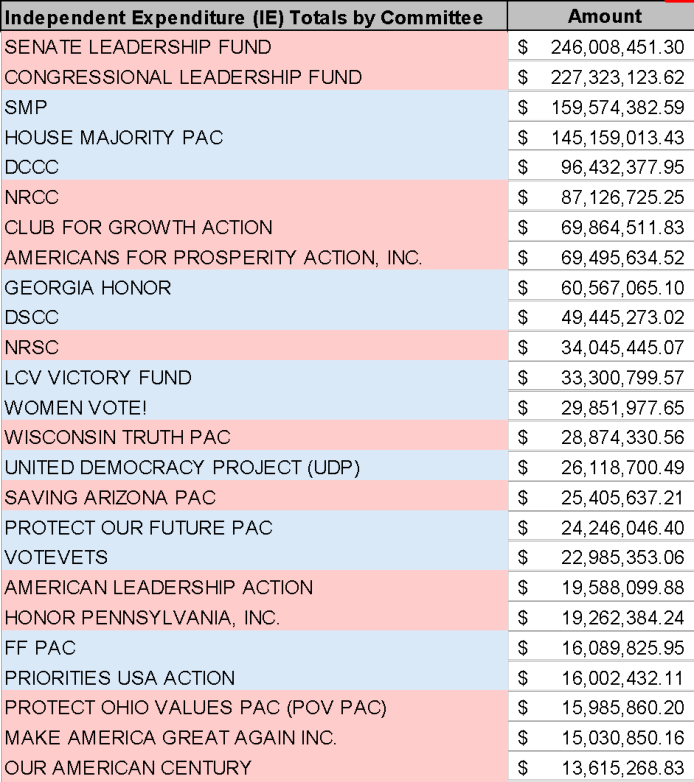
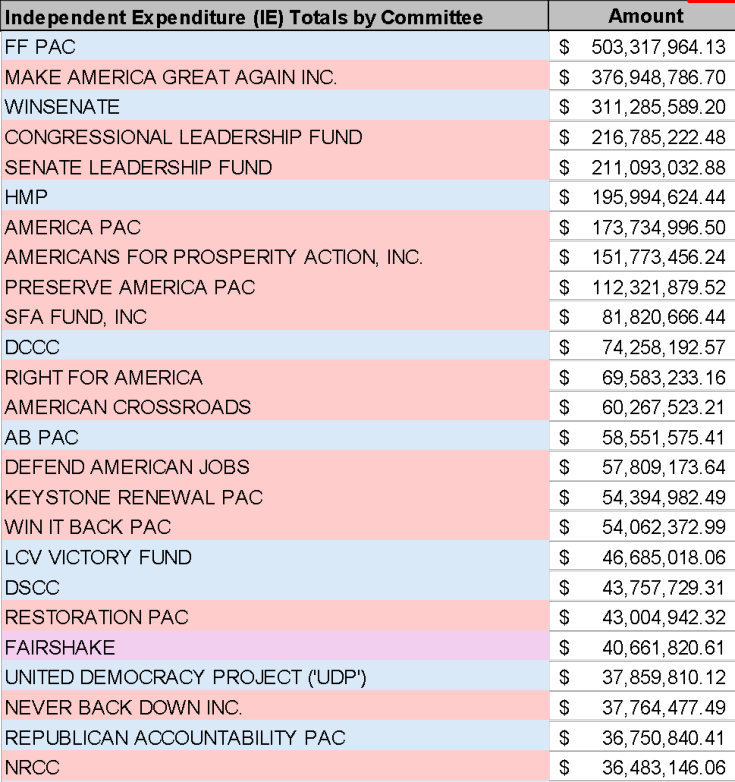
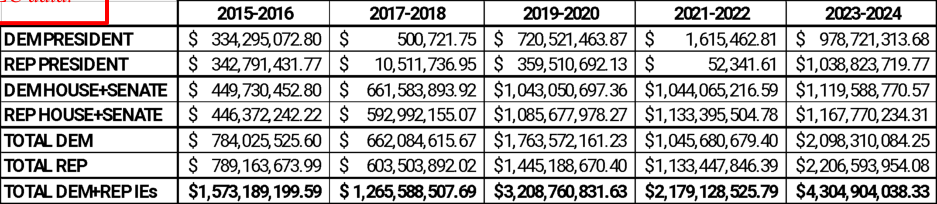
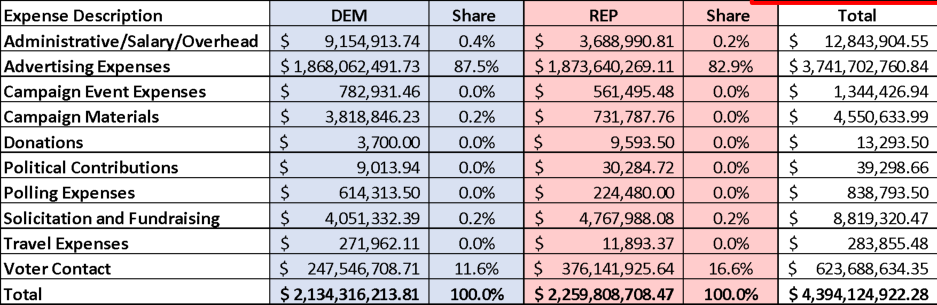
Democratic Organizing Challenges 2024
- Strategic grassroots engagement in Nevada allowed Jacky Rosen to outperform the national ticket by connecting workplace concerns to political choices.
- A widening credibility gap exists between organizational leadership and rank-and-file voters, leading to significant ticket-splitting in states like Pennsylvania.
- Late mobilization and a focus on 'Bidenomics' macro-statistics failed to address the daily micro-economic anxieties of working-class voters.
- Messaging regarding the green energy transition created job-loss anxiety among workers in traditional industries, alienating key constituencies.
- Republicans successfully utilized economic populist messaging to make inroads with working-class men in manufacturing and construction sectors.
- The decline of organizational density in former industrial strongholds like Ohio has severely reduced the Democratic party's long-term organizing capacity.
The 'Bidenomics' framing emphasized macro statistics rather than the micro realities voters experienced daily and specifically tied President Biden - by name - to actual economic anxiety.
36 Specific issue connection: The campaign connected workplace concerns like healthcare costs, scheduling stability, and wage protections directly to political choices. This approach helped Rosen outperform Harris by 4.5 points, proving strategic grassroots engagement can still move votes even in a Trump-heavy environment. Or ads on the Sphere. Where Organizing Efforts Fell Short in 2024 Despite significant resource investments, Democratic organizing faced unprecedented challenges: The Leadership-Voter Gap. Even with strong organizational endorsements, Democratic candidates struggled with rank-and-file voters increasingly willing to split their tickets. In Pennsylvania, voters who supported Democratic priorities on workplace issues still voted for Trump by significant margins. The credibility gap between organizational leadership and everyday voters has widened. Late Engagement. Many organizing efforts didn't begin serious mobilization until Labor Day or later, ceding the summer months to Republican messaging. Resources were concentrated in Presidential swing states, leaving voters in states like Ohio feeling ignored. Messaging Misalignment. National Democratic messaging under the White House’s stewardship, created tensions with key constituencies. Climate change and green energy transition messaging created anxiety among workers in traditional industries worried about job losses. The focus on social issues over economic issues alienated socially conservative voters who prioritized kitchen-table concerns. The "Bidenomics" framing emphasized macro statistics rather than the micro realities voters experienced daily and specifically tied President Biden - by name - to actual economic anxiety. Republican Inroads with Working-Class Voters. Trump's campaign targeted working-class households with economic populist messaging his anti-worker record. Working-class men, particularly in manufacturing and construction, saw Trump as more aligned with their cultural values than Democratic candidates. Organizational Decline in Key States. Shrinking investment in industrial states has reduced Democrats' organizing capacity. Ohio's organizing density dropped significantly as manufacturing declined. Younger members of organized groups show less partisan loyalty than previous generations. The "Losing Better" Strategy No evidence or sourcing provided for many claims in this section.
No evidence provided for many claims in this section. Public reporting and data contradict several claims.
Disclaimer: This document reflects the views of the author, not the DNC. The DNC was not provided with the underlying sourcing, interviews, or supporting data for many of the assertions contained herein and therefore cannot independently verify the claims presented. **
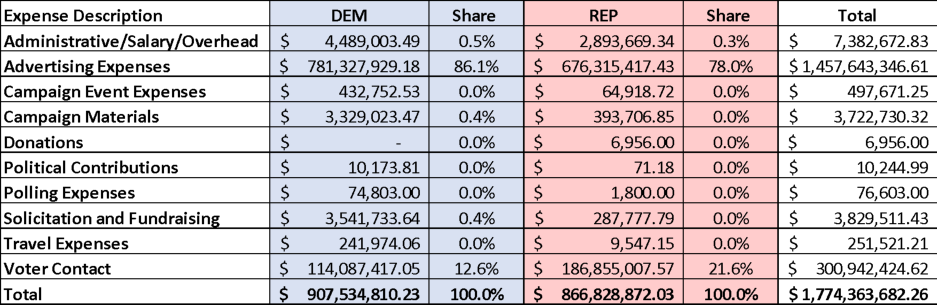
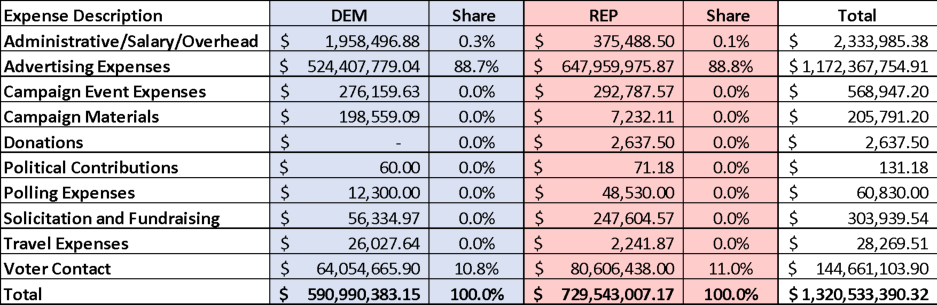
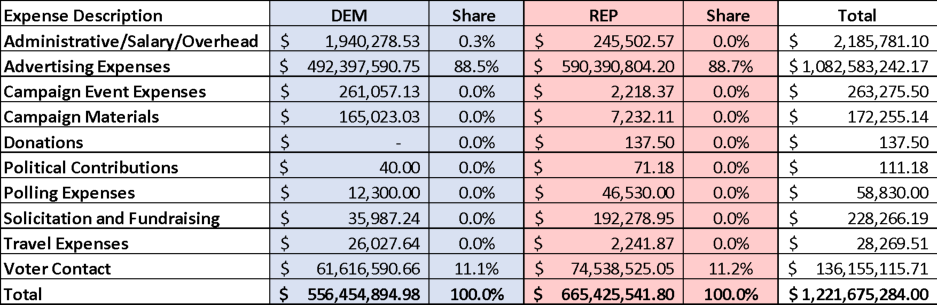
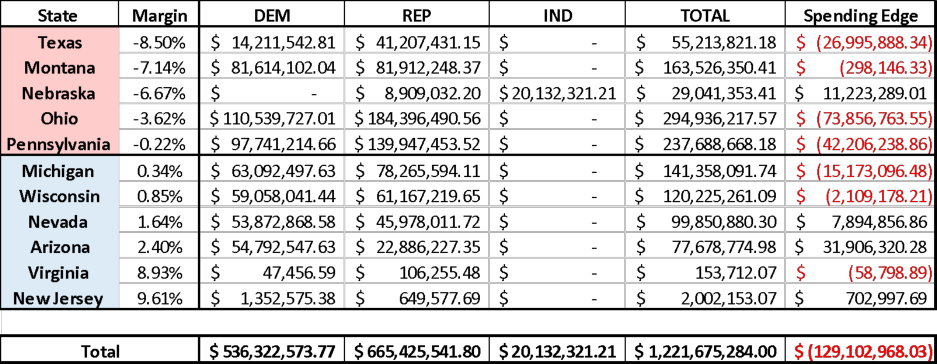
The Strategy of Losing Better
- Elissa Slotkin's Michigan victory relied on 'losing better' by cutting margins in Republican strongholds rather than just focusing on urban centers.
- Successful down-ballot Democrats localized their races to insulate themselves from flawed national party messaging and unpopular leadership.
- Sherrod Brown's performance in Ohio demonstrated that focusing on visceral, state-specific issues like manufacturing can significantly outperform the national ticket.
- The 'Trump but not Moreno' phenomenon revealed that Trump's personal appeal does not automatically transfer to other Republican candidates.
- Data suggests that while Trump's coalition is powerful, it is highly personality-driven and may be difficult for the GOP to replicate in future cycles.
- The presence of Kamala Harris on the ballot likely helped down-ballot Democrats maintain base support compared to a potential Biden candidacy.
Moreno's campaign identified 580,000 'Trump but not Moreno' voters in Ohio.
37 Elissa Slotkin in Michigan had a strategy political operatives call "losing better." Instead of just trying to run up the score in Detroit and Ann Arbor, she focused on cutting her losses in Republican areas. She outperformed Harris in 68 of Michigan's 83 counties. In suburban Oakland County, she won by 12 points while Harris won by 10.5. In GOP-friendly Macomb County, Harris lost by 14 points but Slotkin only lost by 10. Those four points made a difference. Critically, the Slotkin team worked to minimize losses in working-class communities. She emphasized her support for manufacturing jobs and made explicit commitments about protecting the auto industry. While she still lost some working-class voters, she ran significantly better than Harris among the same demographic. Localization Beat Nationalization Rosen's campaign said they won by localizing the race - emphasizing her Nevada roots, her bipartisanship, her work on issues Nevadans cared about. This approach helped insulate her campaign from flawed national messaging. Her strong community organizing infrastructure was essential to this success, providing local credibility that national Democratic campaigns couldn't replicate. In Ohio, Bernie Moreno ran a campaign drenched in Trump. His rallies featured Donald Trump Jr., Lindsey Graham, and constant Trump imagery. Sherrod Brown took the opposite approach. He avoided talking about national Democratic figures and focused relentlessly on Ohio-specific issues, once again, pivoting away from the flawed national messaging. Brown focused on standing up to China, fighting for good jobs, and his history of bipartisanship. His campaign produced ads showing him in manufacturing communities and at community events - specific and visceral reminders of his decades fighting for Ohio. It wasn't enough to win, but he outperformed Harris significantly and probably could have won in a different cycle. The "Trump but not Moreno" Phenomenon. Moreno's campaign identified 580,000 "Trump but not Moreno" voters in Ohio. These were people who either actively preferred Brown or just didn't know enough about Moreno to vote for him. This massive group of voters represents a critical insight: Trump's personal appeal doesn't automatically transfer to down-ballot Republicans. These voters came out specifically for Trump, suggesting Republicans may struggle to recreate his coalition in 2026. Having Kamala Harris on the ballot actually helped down-ballot Democrats maintain part of their base support. Had Biden remained on the ballot, down-ballot Democrats might haven faced even steeper challenges. The Latino Vote Shift No evidence provided for many claims in this section.
Sourcing not provided.
Disclaimer: This document reflects the views of the author, not the DNC. The DNC was not provided with the underlying sourcing, interviews, or supporting data for many of the assertions contained herein and therefore cannot independently verify the claims presented. **
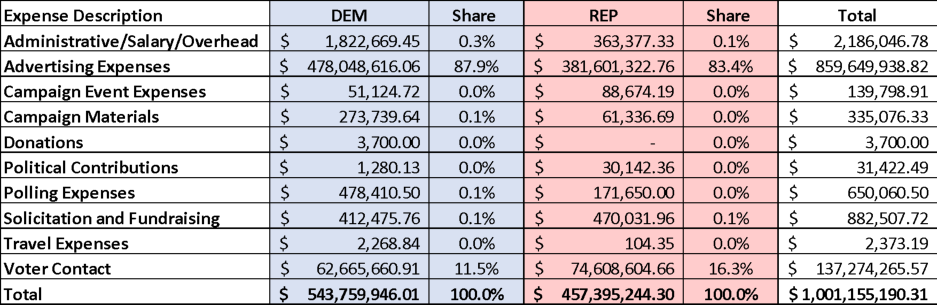
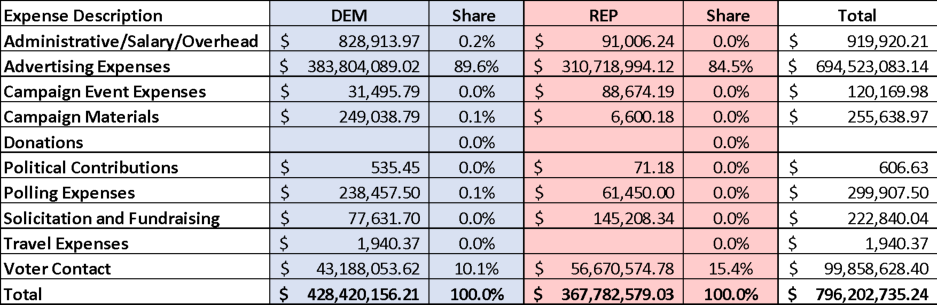
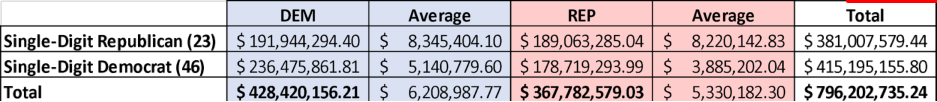
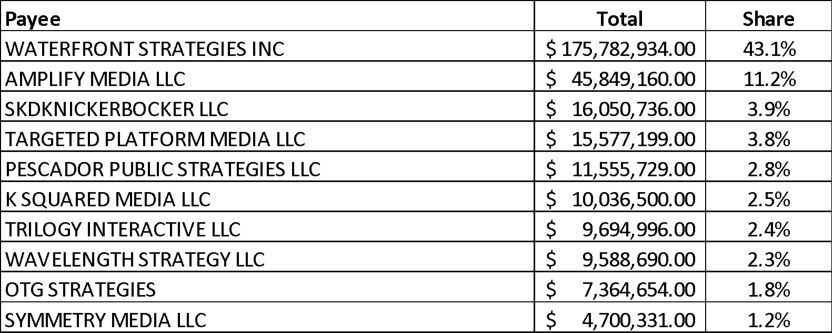
The Latino Voting Shift
- Donald Trump achieved double-digit improvements with Latino voters in 2024, particularly among men in key swing states like Nevada and Arizona.
- Starr County, Texas, which is 97% Hispanic, flipped to the Republican party for the first time since 1892, signaling a historic realignment.
- Successful Democratic candidates like Ruben Gallego outperformed the national ticket by focusing on working-class backgrounds and year-round community presence.
- The report suggests Democrats must move beyond identity politics and late-cycle Spanish ads toward consistent economic messaging and labor partnerships.
- Economic decline in manufacturing hubs has created a political gravity that even established pro-labor Democrats like Sherrod Brown could no longer overcome.
Starr County, which is 97% Hispanic, flipped to Trump - voting Republican for president for the first time since 1892.
38 The 2024 election revealed a seismic shift in Latino voting patterns Democrats cannot ignore. Trump improved his performance with Latino voters by double digits compared to 2020, particularly among Latino men. This shift was most pronounced in: Nevada: Trump won Latino men by 12 points, a complete reversal from 2020. Rosen's strong community organizing and bilingual outreach helped her maintain better Latino support than Harris, but the erosion is undeniable. Arizona: Trump cut Democrats' margin with Latino voters from 24 points in 2020 to 8 points in 2024. Gallego's personal story and consistent presence in Latino communities helped him buck this trend, winning Latinos by approximately 20 points - 12 points better than Harris. Gallego's working-class background, military service, and authentic community connections gave him credibility with Latinos the national campaign could not replicate. Texas: The Rio Grande Valley continued its rightward shift. Starr County, which is 97% Hispanic, flipped to Trump - voting Republican for president for the first time since 1892. Democrats can no longer assume Latino voters, especially younger Latino men, are a reliable part of their base. The party needs a complete rethink of its Latino outreach strategy, moving beyond traditional approaches like Spanish-language ads and late-cycle surrogates. Successful candidates like Gallego and Rosen showed how year-round presence, economic messaging, and addressing cost-of-living concerns resonate more than identity politics. Organizations with significant Latino membership - particularly service sector Labor groups - need to be central partners in this recalibration, as they maintain the year-round infrastructure and community credibility to effectively reach these voters. Working-Class Coalitions Both Jon Tester and Sherrod Brown had a history of strong support from working people. They stayed consistent in their messaging, avoided getting mired in “80-20” issues, and maintained working-class credibility through constant presence at community events and genuine relationships built over decades. Ohio's manufacturing communities voted for Obama in 2008 and 2012, but have been economically hollowed out and decisively shifted to Republicans. Good manufacturing jobs disappearing and being replaced by lower-wage service work has fundamentally altered the political landscape. Brown and Tester could not overcome the gravity of double digit Harris losses. Abortion as a Crosscutting Issue No evidence provided, contradicts public reporting.
Disclaimer: This document reflects the views of the author, not the DNC. The DNC was not provided with the underlying sourcing, interviews, or supporting data for many of the assertions contained herein and therefore cannot independently verify the claims presented. **
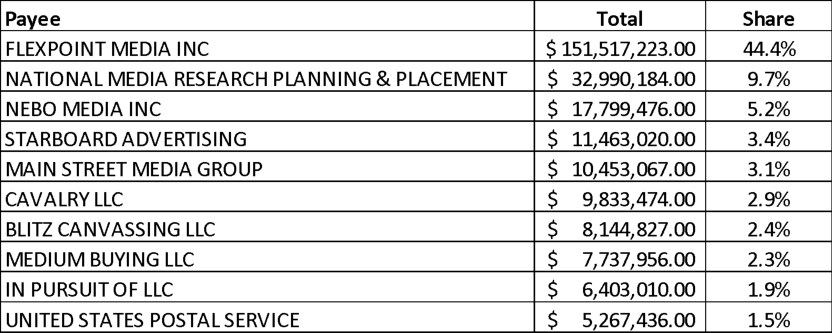
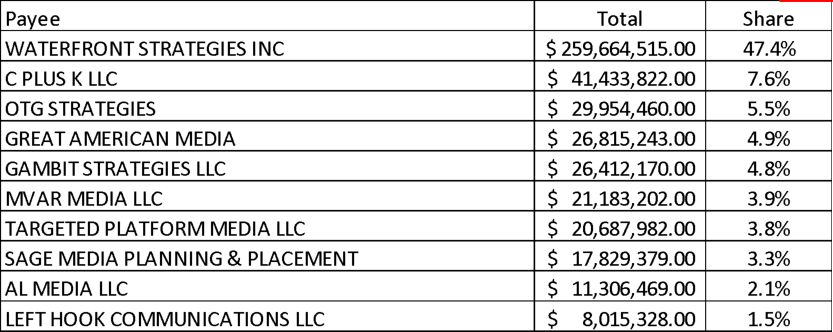
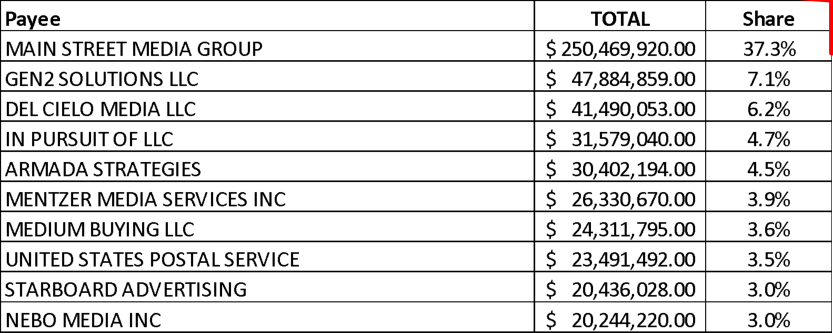
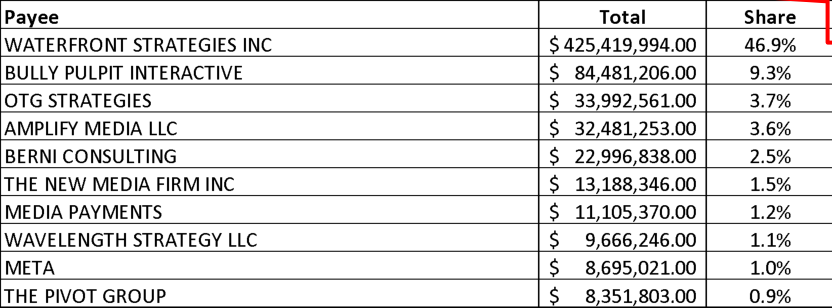
Abortion and Turnout Dynamics
- Democratic candidates Brown and Slotkin utilized multimillion-dollar ad campaigns to weaponize Republican opponents' abortion records.
- The abortion issue successfully attracted suburban women and moderate Republicans who typically vote for GOP candidates down-ballot.
- Historical data from 2018 and 2022 suggests that Donald Trump's absence from the ballot often leads to Republican underperformance.
- Union households maintain higher turnout rates during midterms, potentially granting organized labor decisive influence in 2026.
- The 'Trump effect' primarily benefits the former president himself rather than the broader Republican party infrastructure.
The historical pattern is clear: Trump drives turnout in ways that help him but don't always help other Republicans.
39 Brown hit Moreno hard on abortion in the final weeks, noting how 57% of Ohio voters had just enshrined abortion rights in the state constitution. Slotkin ran a multimillion-dollar ad campaign hammering Rogers on his abortion voting record. This issue allowed Democrats to peel off suburban women and moderate Republicans who might have been open to voting Republican down-ballot. When Trump's Not on the Ballot The historical pattern is clear: Trump drives turnout in ways that help him but don't always help other Republicans. The 2018 and 2022 midterms showed this—Republicans underperformed expectations both times. The question for 2026 is whether Trump in the White House but not on the ballot creates a different dynamic and opportunity for Democrats. Labor implications: Union households historically vote at higher rates in midterms than non-union households, giving organized labor disproportionate influence when overall turnout is lower. If Trump's absence from the ballot depresses Republican turnout (particularly among irregular voters who came out specifically for Trump), unions' superior turnout operation could be decisive in close races. THE HOUSE [PENDING - NEED TO ADJUST FOR A FEW NEW HOUSE LINES] This section was not provided by author.
Disclaimer: This document reflects the views of the author, not the DNC. The DNC was not provided with the underlying sourcing, interviews, or supporting data for many of the assertions contained herein and therefore cannot independently verify the claims presented. **
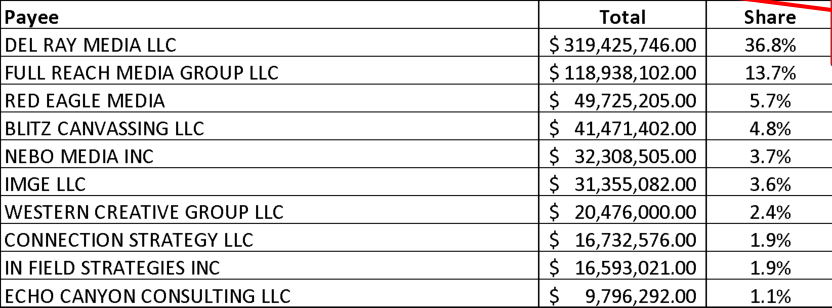
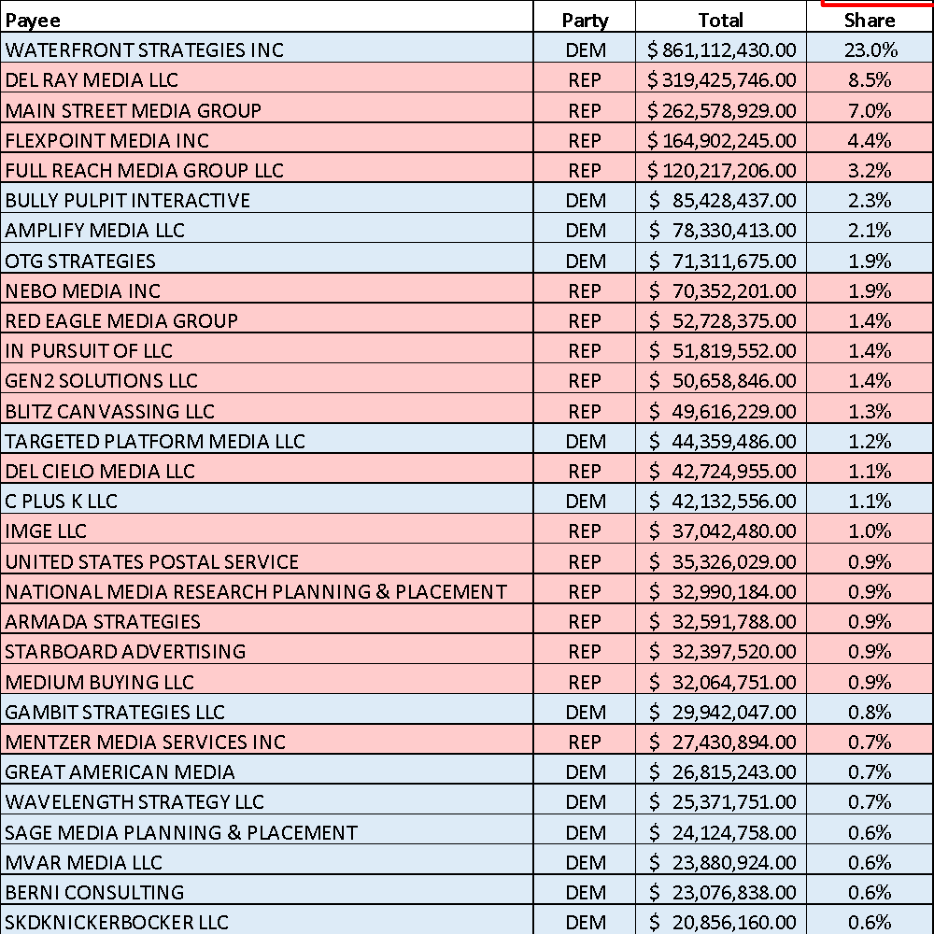
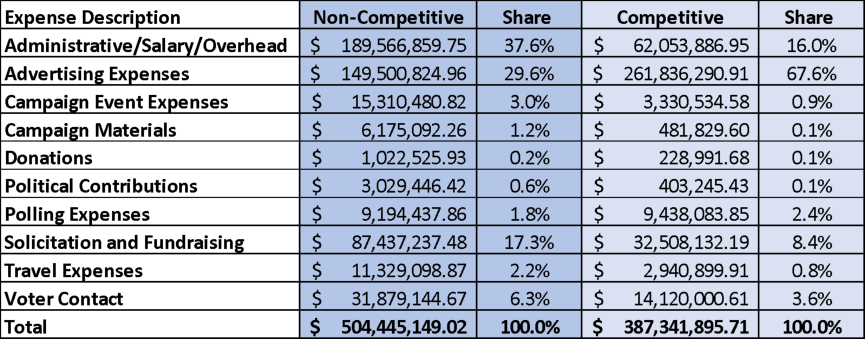
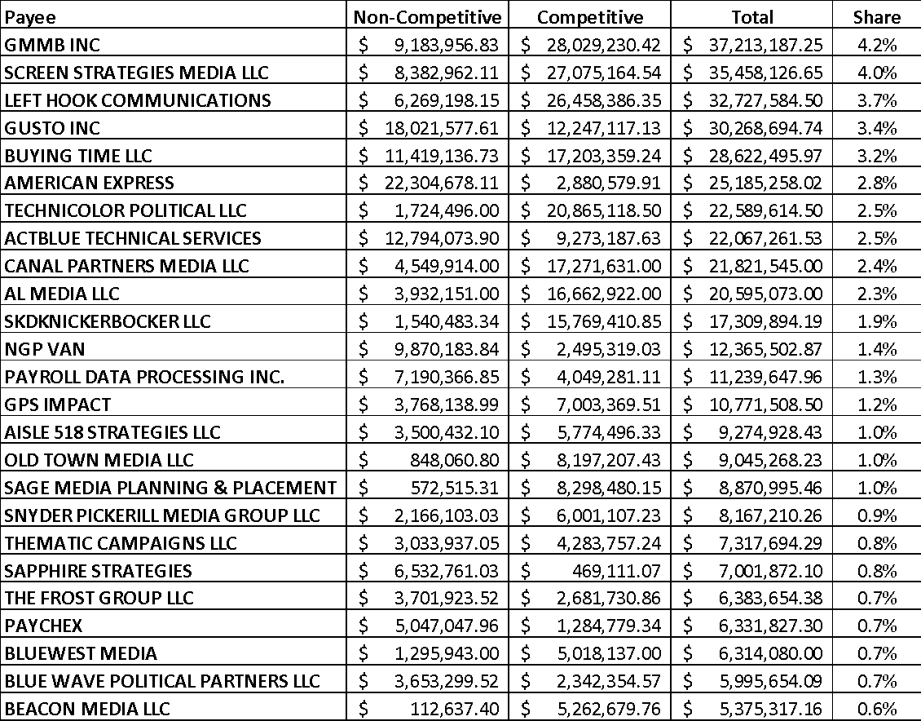
The Democratic Media Deficit
- The current media ecosystem is described as one where Republicans own the infrastructure while Democrats merely rent seasonal access.
- Democratic fundraising efforts effectively transfer billions of dollars from grassroots donors to media oligarchs and right-wing entities.
- Algorithmic platforms prioritize polarization and rage over policy, making it difficult for Democratic messaging to break through.
- Traditional paid media strategies can leverage reach but fail to achieve salience in a modern, shareable media environment.
- The shift from legacy media management to viral engagement has fundamentally changed how down-ballot campaigns gain visibility.
Democrats are essentially raising billions of dollars from retirees, activists, working Americans, and organized labor, and transferring most of it to the pockets of legacy and digital media oligarchs.
40 STATE OF MEDIA & COMMUNICATION In the current media ecosystem, Republicans own and Democrats rent. Democrats pay for seasonal access to the networks, stations, platforms, and newspapers owned by Republicans or right-wing entities, to advertise and communicate with voters. A major share of Democratic fundraising comes from individuals and low-dollar contributions. Within the current approach to paid media, Democrats are essentially raising billions of dollars from retirees, activists, working Americans, and organized labor, and transferring most of it to the pockets of legacy and digital media oligarchs. In a sense, Democrats are funding right-wing media to buy more properties and expand their ability to drive partisan perspectives. With a free and fair press, Democrats have a shot to make their case. When publishers and owners have a partisan point of view, it’s more difficult for Democrats to break through. By design, content platform algorithmic feeds leverage polarization over policy and rage over reason as a means of keeping users online and active in their sites or apps. Given the relevance these platforms have in culture, Democrats cannot abandon all of them, but must still rethink the way time, money, and other resources are allocated to ensure Americans are effectively engaged to win. It’s past time to consider new ways to drive awareness and seek connections with voters at the reach and frequency required to win elections. Rethinking the Media Mix Modern marketing is different. The traditional approach of paying for media to dominate share of voice or attention is far less effective in the context of how information now moves and the ways people consume or seek information and content. Money can leverage reach, but not salience. In an environment designed for shareable media and where algorithmic lift drives traffic and engagement, “virality” can easily surpass the reach and impact of legacy media spending. 20 years ago, a candidate would launch with an op-ed, a press release, or a rally – followed by careful media management, some barnstorming, and a raft of early endorsements and fundraising events. Other than races for President, or when a celebrity or scion sought office, those moments generally stayed in-state, or in-district. Down ballot campaigns struggled to even get mentioned in statewide media, and it was usually only the insider class within those markets, or staff at national campaign committees who paid attention. Sourcing not provided for many claims in this section.
Disclaimer: This document reflects the views of the author, not the DNC. The DNC was not provided with the underlying sourcing, interviews, or supporting data for many of the assertions contained herein and therefore cannot independently verify the claims presented. **
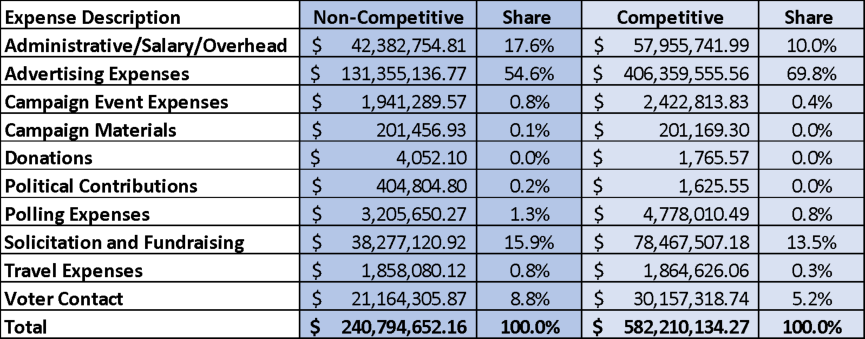
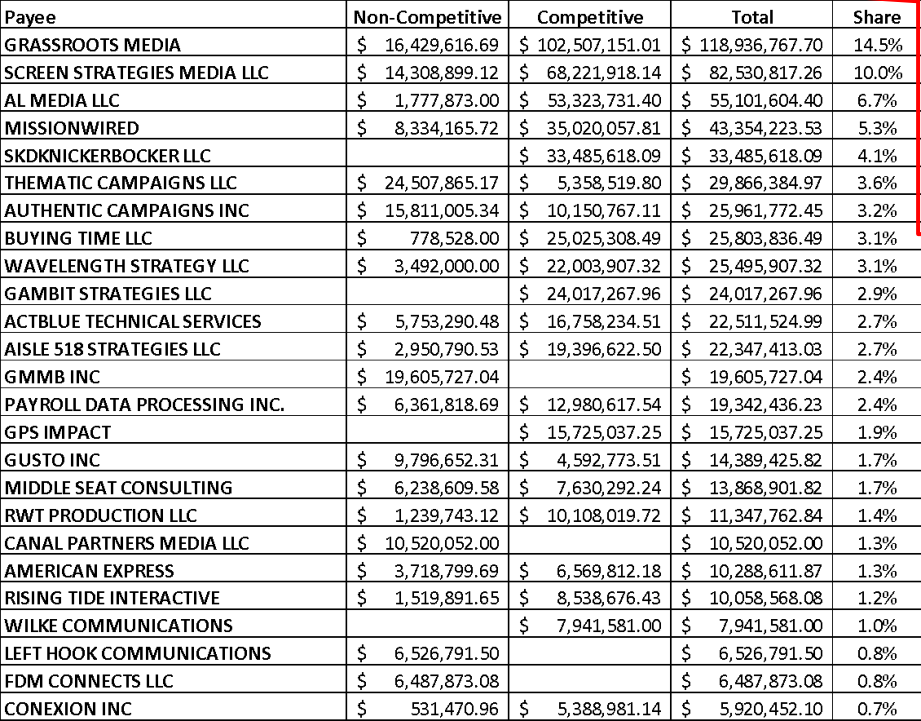
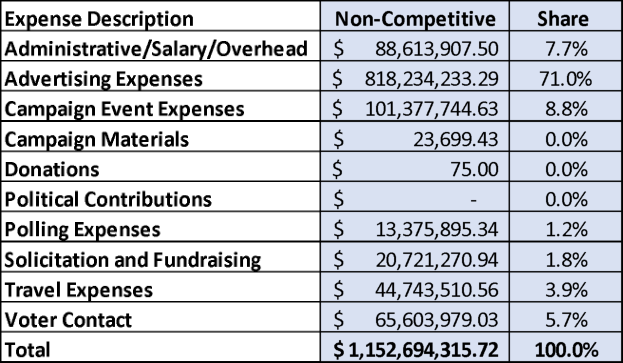
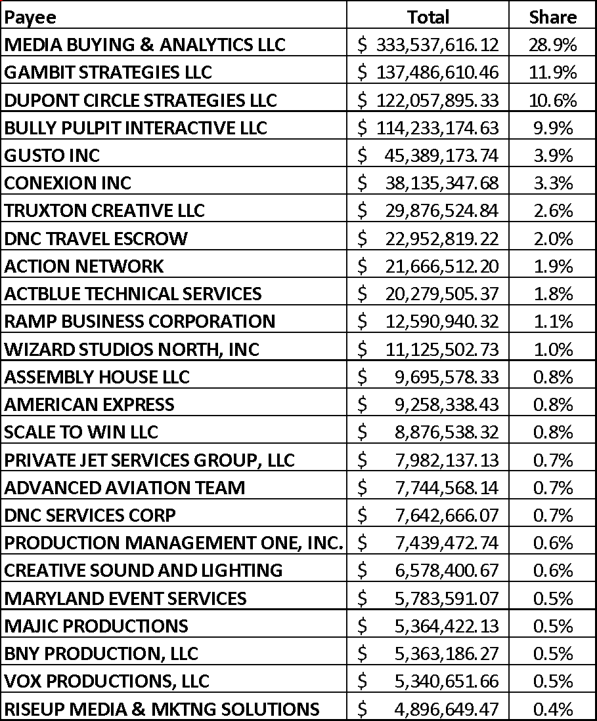
The Digital Campaign Shift
- Modern political campaigns are increasingly launching online to capture national grassroots attention and record-breaking small-dollar donations.
- Despite the rise of digital platforms, both major parties still invest billions in legacy media like broadcast and cable television.
- The 2024 presidential election saw nearly $3 billion in ad spending, with Democrats significantly outspending Republicans in the digital and connected TV space.
- Corporate America has shifted 72% of its advertising budget to digital, yet political campaigns maintain a heavy bias toward traditional broadcast media for persuasion.
- Victory funds are legally restricted to fundraising-focused ads, which explains their exclusive reliance on digital platforms compared to the broader campaign's media mix.
It’s no longer enough for campaigns to push information out – they have to pull people in – and digital and social platforms are tools designed for this engagement.
41 Today, many campaigns launch online, some with announcement videos designed to capture the attention of a national audience of grassroots donors and activists – where small and repeat donations can power campaigns to record fundraising. Yet, even in national campaigns these efforts can be ineffective. For many of the candidates seeking the 2020 nomination, for example, the launch was the best day of their campaign. But the tactic is an indicator of the changing ways information moves, the way opinions about viability are formed, and the way voters are engaged. So why do campaigns – both Democrats and Republicans – still plow billions into legacy media? Is it “because it’s there”? Can Democrats change to engage in the new media ecosystem to win attention to win votes? The fundamentals have changed. It’s no longer enough for campaigns to push information out – they have to pull people in – and digital and social platforms are tools designed for this engagement. In the 2024 Presidential campaign, the media spend totaled $3,187,474,265 by and on behalf of the two major party nominees. In removing the spending by primary candidates and their associated Super PACs, it was $2,986,294,372. The top 50 spenders in the Presidential election combined to spend $2,904,105,253, or 97.2 percent of all ad spending for the general campaign, with $1,338,400,815 coming from the candidates, joint fundraising committees, and national party committees. Trump and affiliated committees spent $435 million, and Harris and affiliated committees spent $903 million. 2024 Presidential Ad Spending and Share by Candidate and Committee5
5 Source – AdImpact 2023-2024 spending reports. The totals for Harris for President and Biden for President are combined, as are the Harris Victory Fund and Biden Victory Fund totals
Disclaimer: This document reflects the views of the author, not the DNC. The DNC was not provided with the underlying sourcing, interviews, or supporting data for many of the assertions contained herein and therefore cannot independently verify the claims presented. **
42 Both campaign committees spent a majority of funds on broadcast and cable, while their victory funds spent exclusively on digital ads. By some estimates, corporate America invests 72% of its ad spend on digital advertising and connected television, and 28% on broadcast and cable television. Commercial marketing follows and seeks to shape the media behaviors of the largest market segments who tend to drive purchasing activity – mostly younger Americans. For campaigns, there continues to be a decided bias in favor of broadcast and cable placement relative to connected television (CTV) and digital platforms. Trump ended up with an overall broadcast share of 56.7 percent, while Harris had an overall broadcast share of 42.0 percent. The supermajority of victory fund ad spending is dedicated to fundraising, so this still means for the purposes of persuasion, both parties are relying on broadcast and cable to carry the majority of their messaging. Including the campaigns, affiliated committees, and independent expenditures, there was more than $1.23 billion spent on broadcast in the Presidential election alone. The spending levels were relatively even on broadcast and cable, but Democrats had significant advantages in connected television and digital spending, and on radio as well. No evidence provided.
Per campaign finance law, victory funds that are joint fundraising committees are only permitted to run advertising with a fundraising component.
Disclaimer: This document reflects the views of the author, not the DNC. The DNC was not provided with the underlying sourcing, interviews, or supporting data for many of the assertions contained herein and therefore cannot independently verify the claims presented. **
43 Combined Presidential Ad Spending by Party and Channel
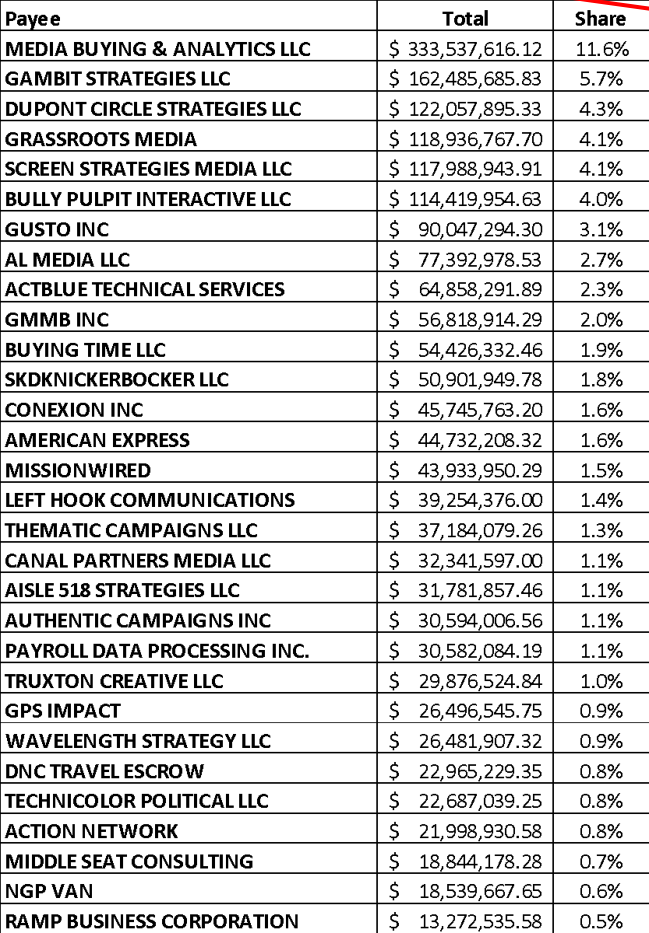
2024 Political Media Spending Analysis
- The Harris campaign achieved a nearly even split between traditional broadcast/cable (48.4%) and digital/CTV (46.5%), while the Trump campaign remained heavily reliant on broadcast at 62.4%.
- In high-stakes Senate races totaling $1.93 billion, Democrats outpaced Republicans in digital and CTV investment by a margin of 7.8 percent.
- House race spending patterns showed the most parity between parties, with both Democrats and Republicans allocating approximately 72% to traditional television and 25% to digital platforms.
- Despite a general spending advantage, the overall media mix for both parties still skews heavily toward traditional broadcast and cable television.
- The report suggests that the current media allocation disadvantages Democrats because their base includes more cord-cutting younger voters who do not engage with traditional TV.
- The DNC issued a disclaimer noting that the underlying sourcing and methodology for these spending assertions could not be independently verified.
While Democrats do spend more on digital than Republicans, the share of spend is still not fully reflective of where the marketplace is.
For the Harris campaign, affiliated committees, and aligned independent expenditures the overall mix of cable and broadcast compared to CTV and digital was nearly even (48.4 percent to 46.5 percent), while for the Trump campaign, affiliated committees and aligned independent expenditures, the spend heavily favored broadcast efforts (62.4 percent) Presidential Media Spend by Category and Party
In Governor’s races, Democrats invested 61.6 percent in broadcast and cable, and 36.6 percent in CTV and digital, compared to Republicans, who invested 64.8 percent in broadcast and cable and 33.6 percent in digital. This covers the elections in Indiana, Missouri, New Hampshire, North Carolina, and Washington, with a combined $287.5 million in media spending.
Methodology unclear for selection of these states for analysis. No sourcing provided. No sourcing provided.
Disclaimer: This document reflects the views of the author, not the DNC. The DNC was not provided with the underlying sourcing, interviews, or supporting data for many of the assertions contained herein and therefore cannot independently verify the claims presented. **
44 Gubernatorial Media Spend by Category and Party
There were similar margins in the top-spending Senate races, where Democrats invested 7.8 percent more of the media and budget into CTV and digital than Republicans. Democrats invested 60.4 percent in broadcast and cable and 36.6 percent in CTV and digital. Republicans invested 66.4 percent in broadcast and cable, and 28.8 percent in CTV and digital. This covers the elections in Arizona, Maryland, Michigan, Missouri, Montana, Nebraska, Nevada, Ohio, and Pennsylvania, with a combined $1.93 billion in media spending. US Senate Media Spend by Category and Party
A review of the top 33 House races – each with a combined $20 million or more in media spending – shows near identical spending between Democrats and Republicans. Democrats
No sourcing provided.
Methodology unclear for selection of these states for analysis or exclusion of WI. No sourcing provided.
Disclaimer: This document reflects the views of the author, not the DNC. The DNC was not provided with the underlying sourcing, interviews, or supporting data for many of the assertions contained herein and therefore cannot independently verify the claims presented. **
45 spent 72.8 percent on broadcast and cable, and 25.5 percent on CTV and digital. Republicans spent 72.5 percent on broadcast and cable, and 25.7 percent on CTV and digital. The combined media spending reached $1.1 billion in these 33 districts. US House Media Spend by Category and Party6
Combining the Presidential, statewide races, and competitive US House districts shows Democrats held a spending advantage across channels, with the exception of satellite TV. 6 The covered House districts are AK-AL, AZ-01, AZ-06, CA-13, CA-22, CA-27, CA-41, CA-45, CA-47, CO-08, IA-01, IA-03, ME-02, MI-07, MI-08, MI-10, NC-01, NE-02, NJ-07, NM-02, NY-04, NY-16, NY-17, NY-19, NY-22, OH-09, OH-13, OR-05, PA-07, PA-08, VA-07, WA-03, and WI-03.
No sourcing provided.
Disclaimer: This document reflects the views of the author, not the DNC. The DNC was not provided with the underlying sourcing, interviews, or supporting data for many of the assertions contained herein and therefore cannot independently verify the claims presented. **
46 2024 Federal and Gubernatorial Ad Spending by Party and Channel
The combined 2024 media mix skews towards broadcast and cable over CTV and digital. Share of Combined Media Spending by Channel
This spending mix disadvantages Democrats, who are more reliant on digital-native and cord-cutting younger Americans who rarely engage with broadcast or cable television. While Democrats do spend more on digital than Republicans, the share of spend is still not fully reflective of where the marketplace is.
No sourcing provided.
No sourcing provided.
Digital Strategy and Voter Erosion
- Democrats spent more on digital and CTV than Republicans but still struggled to reach younger voters effectively.
- Media strategists claimed a lack of digital inventory forced them to pivot back to legacy broadcast and cable television.
- The failure to reach digital natives contributed to significant margin losses in traditionally blue states like New Jersey and Virginia.
- Voter slippage was particularly pronounced among younger Americans and non-White communities compared to 2020 performance.
- The 2025 gubernatorial races in New Jersey and Virginia saw massive combined media spending of $196.3 million as both parties sensed opportunity.
- The author argues that Democrats must rethink their reliance on legacy media to re-engage voters who skipped the 2022 and 2024 cycles.
Investments in legacy media will miss these voters, and the 2024 strategies did not effectively reach them.
Disclaimer: This document reflects the views of the author, not the DNC. The DNC was not provided with the underlying sourcing, interviews, or supporting data for many of the assertions contained herein and therefore cannot independently verify the claims presented. **
47 By party, Democrats spent less on broadcast and more on CTV and digital than Republicans. 2024 Combined Media Spending by Channel and Party So why the disconnect? Why do Democrats not invest more in the places and spaces younger Americans consume information and content? In post-election interviews,some 2024 media strategists indicated they were forced to invest in broadcast because of limited digital inventory. The larger spenders and early movers had saturated the digital market, so the strategists explained they had to move to broadcast and cable as a matter of necessity and market availability. Democrats have to rethink this approach, especially since many of the voters Democrats lost ground with are digital natives and younger Americans who voted in 2020, and did not vote in 2022 and/or 2024. Investments in legacy media will miss these voters, and the 2024 strategies did not effectively reach them. Some Democratic campaigns have taken the hint. In 2024, Democrats lost electoral support at the Presidential level around the country, including in New Jersey and Virginia. Vice President Harris won New Jersey by 5.88 percent, a loss of 10.01 percent from Biden’s 15.89 percent margin in 2024. Vice President Harris won Virginia by 5.78 percent, a loss of 4.33 percent from Biden’s 10.11 percent margin in 2020. Consistent with exit polling from around the country, Democrats lost ground with younger voters in these two states, and also showed slippage with non-White communities where Democrats normally perform well. As a result of the narrow Harris wins, both major parties saw opportunities in New Jersey and Virginia, and prioritized attention and investment. In the 2025 gubernatorial elections, Democrats and Republicans combined to spend $196.3 million in media for the general elections - $111.8 million in New Jersey, and $84.5 million in Virginia.
No source or interview materials were provided to substantiate this claim. No sourcing provided.
Disclaimer: This document reflects the views of the author, not the DNC. The DNC was not provided with the underlying sourcing, interviews, or supporting data for many of the assertions contained herein and therefore cannot independently verify the claims presented. **
2025 Media Spending Strategies
- Democrats significantly outspent Republicans in both the New Jersey and Virginia 2025 elections, totaling over $120 million across both states.
- Campaigns shifted toward more affordable digital channels to navigate the high costs of the New York, Philadelphia, and Washington D.C. media markets.
- Democratic strategists in Virginia prioritized CTV and digital platforms, allocating over 53 percent of their budget to these channels to reach younger voters.
- Republicans maintained a heavier reliance on traditional broadcast and cable television, likely targeting an older demographic.
- The Virginia Democratic campaign sustained spending throughout the entire general election, outperforming Republicans in nearly every channel except satellite.
- The report suggests future Democratic candidates should emulate the Virginia model of investing more in CTV than in broadcast and cable combined.
The investment in connected television – $3.4 million more than broadcast, and more than broadcast and cable combined – is notable and an important example for Democratic incumbents and candidates to use.
48 These races were in three of the most expensive media markets in the United States – New Jersey is split between the New York and Philadelphia markets, and Virginia is covered by Washington, DC in Northern Virginia, and nine other markets, including Norfolk-Portsmouth-Newport News, Richmond-Petersburg, and Roanoke-Lynchburg. By design, the campaigns moved towards more affordable channels to ensure coverage and reach. In both states, the Democrats heavily outspent the Republicans. In New Jersey, Democrats and allied groups spent $67.5 million and Republicans and their allied groups spent $44.3 million. In Virginia, Democrats spent $54.5 million and Republicans spent $30.0 million. 2025 Media Spending by State and Party Democratic campaigns and allied organizations combined to spend 44.0 percent on broadcast and cable, and 53.6 percent on CTV and digital; while the Republicans invested 52.0 percent on broadcast and cable and 45.5 percent on CTV and digital. 2025 Media Spending by Channel and Party Virginia 2025 The Democratic media investments were probably most efficient and effective in Virginia. Virginia does not have candidate contribution limits, which meant strategists knew these races would become very expensive. There was not a Democratic primary for governor, so general election spending began in May, with a combination of CTV and digital in all markets, and broadcast and cable in the Norfolk and Richmond markets. Overall, only 38.5 percent of the Virginia Democratic spend (the campaign/DGA, and allied groups) was invested in broadcast and cable, while Republicans and their allied groups invested 47.9 percent – likely because they were targeting an older demographic more likely to be on those channels.
No sourcing provided.
No sourcing provided.
Disclaimer: This document reflects the views of the author, not the DNC. The DNC was not provided with the underlying sourcing, interviews, or supporting data for many of the assertions contained herein and therefore cannot independently verify the claims presented. **
49 2025 Media Spending by Channel and Party (Virginia) Democrats invested 53.6 percent into CTV and digital, while Republicans invested 45.5 percent. This advantage enabled Democrats to reach younger voters and other targets at greater scale. The Virginia Democratic campaign was able to sustain spending for the entire general election, and racked up significant advantages in placement across every channel other than satellite. 2025 Ad Spending by Party and Channel (Virginia)
The investment in connected television – $3.4 million more than broadcast, and more than broadcast and cable combined – is notable and an important example for Democratic incumbents and candidates to use in asking their campaign teams to consider and potentially emulate. Every campaign is different, and market rates, timing, and inventory drive media placement recommendations, but incumbents and candidates should be wary of media plans where resource allocations may not be connected to the communities and voters needed to win – and
Data does not consistently support this claim. No sourcing provided.
No sourcing provided.
Disclaimer: This document reflects the views of the author, not the DNC. The DNC was not provided with the underlying sourcing, interviews, or supporting data for many of the assertions contained herein and therefore cannot independently verify the claims presented. **
New Jersey 2025 Media Strategy
- The New Jersey gubernatorial race featured a capped candidate spending environment, necessitating heavy outside investment from the DGA.
- Democratic spending reached $39.6 million, significantly outpacing the Republican investment of $23.7 million.
- Democrats prioritized digital and CTV platforms, allocating 49.2 percent of their budget to these channels compared to 43.0 percent for Republicans.
- Early investments by the DGA were instrumental in defining the media landscape and establishing a gross ratings point advantage.
- National presidential campaigns utilize a 'match and mirror' strategy while navigating the pricing disparities between candidate and independent spending.
The national campaigns closely monitor ad spending, seeking to match and mirror their counterparts, and eke out advantages as the campaign progresses.
50 ask their teams to think better. Realigning Democratic spending to meet the market is long overdue, and necessary for a modern and effective campaign. New Jersey 2025 The New Jersey campaign was different – different markets and rates, different demographic needs, and different candidate matchups. There was a vigorous primary in June for the Democratic nomination, and New Jersey also has a tight spending cap for gubernatorial campaigns. Shortly after the Democratic primary, the DGA announced a robust media buy for the fall. This buy eventually grew to $39.6 million, and was a critical investment to complement the capped candidate spend. Republicans also spent heavily, investing $23.7 million. Overall, 48.5 percent of the Democratic spend was invested in broadcast and cable, while Republicans and their allied groups invested 55.7 percent. Democrats invested 49.2 percent in CTV and digital, while Republicans invested 43.0 percent. 2025 Media Spending by Channel and Party (New Jersey) In a capped candidate spending environment, the media spend started later in New Jersey, with both parties starting to spend in late August. Combined Democratic spending exceeded Republican spending across every channel.
No sourcing provided.
Disclaimer: This document reflects the views of the author, not the DNC. The DNC was not provided with the underlying sourcing, interviews, or supporting data for many of the assertions contained herein and therefore cannot independently verify the claims presented. **
51 2025 Ad Spending by Party and Channel (New Jersey)
The early investments by the DGA helped favorably define the contours of the media campaign landscape in both states. Both campaigns were able to build large advantages in gross ratings points and connected television ad impressions. 2025 Media Competitive Metrics by State and Party The variations between the states are a function of the campaign finance realities and the timing of the spending in each state. Within each state, the Democrats developed definitive advantages in dollars and delivery, helping each campaign make the case and contrast needed to win. The Presidential Ad Landscape The national campaigns closely monitor ad spending, seeking to match and mirror their counterparts, and eke out advantages as the campaign progresses. Candidate placements receive preferential pricing and independent spenders have pay more for their placements.
Data does not consistently support these claims. No sourcing provided for many claims in this section. No sourcing provided.
No sourcing provided.
Disclaimer: This document reflects the views of the author, not the DNC. The DNC was not provided with the underlying sourcing, interviews, or supporting data for many of the assertions contained herein and therefore cannot independently verify the claims presented. **
2024 Presidential Ad Spending
- Democrats maintained a significant overall spending advantage of $515.3 million, totaling $1.5 billion compared to the Republicans' $1.02 billion.
- Republicans demonstrated higher geographic focus, allocating 77.6 percent of their total ad budget to battleground states compared to 64 percent for Democrats.
- Outside spending groups played a critical role, with Democratic groups spending $794.9 million and Republican groups spending $614 million.
- Despite being outspent by 24.4 percent in battlegrounds, Republican spending efficiency allowed them to narrow the gap in actual ad delivery and impressions.
- Non-battleground spending was largely driven by digital and national buys, where Democrats outspent Republicans by a margin of $303.8 million to $122 million.
The Democratic presidential campaign invested where it should, but the Republican campaign was more focused and efficient in matching Democratic ad levels.
52 From July 1, 2024 forward, more than $2.55 billion was spent on media – with $1.5 billion spent on behalf of the Democratic nominee, and $1.02 billion on behalf of the Republican nominee – a $515.3 million Democratic spending advantage. Within the battlegrounds, the margins were closer. There was $980.3 million spent on behalf of the Democratic nominee, and $788.2 million spent on behalf of the Republican nominee – a $192.1 million spending advantage. This means 64.0 percent of all Democratic presidential ad spending was in the battlegrounds, while for Republicans it was 77.6 percent. 2024 Presidential Ad Spending by Party and State Competitiveness
This can break out further – into the campaigns (the campaign committee, joint fundraising committees, and national party committees) and outside spenders. The Democratic campaign efforts totaled $735.9 million in ad spending, and the Republicans totaled $401.5 million. Within the battlegrounds it was $418.6 million for the Democrats and $282.2 million for the Republicans – a $136.4 million spending advantage. Among the outside spenders, it was $794.9 million for the Democrats and $614.0 million for the Republicans. In the battlegrounds, Democratic outside groups spent $561.7 million, while Republican outside groups spent $560.1 million, a $55.7 million spending advantage. The Democratic campaign invested 56.9 percent of its ad spending in the battlegrounds, while the outside Democratic groups hit 70.7 percent. The Republican campaign invested 70.3 percent of its ad spending in the battlegrounds, while their outside groups hit 82.4 percent. 2024 Presidential Ad Spend by Spender Type, Party, and State Competitiveness
No sourcing provided.
No sourcing provided.
Disclaimer: This document reflects the views of the author, not the DNC. The DNC was not provided with the underlying sourcing, interviews, or supporting data for many of the assertions contained herein and therefore cannot independently verify the claims presented. **
53 The comparatively efficient Republican battleground spending helped them narrow the gap in actual ad delivery. Despite being outspent by 50.7 percent overall, and by 24.4 percent in the battlegrounds, Republicans were able to narrow the gap in gross rating points and connected television ad impressions. 2024 Presidential – Gross Rating Points and Connected TV Impressions by Party and State Competitiveness
Democratic outside spenders were able to overcome what was actually a net advantage for the Trump campaign in Gross Rating Points, and added a net billion CTV impressions to the overall margin. 2024 Presidential – GRPs and CTV Impressions by Spender Type, Party, and State Competitiveness
The largest drivers of non-battlegrounds spending are digital buys and national buys which are not allocated to a single state. Democrats spent $303.8 million, and Republicans $122.0 million on these types of investments. The Democratic presidential campaign invested where it should, but the Republican campaign was more focused and efficient in matching Democratic ad levels. Ad strategies will continue to
No sourcing provided.
No sourcing provided.
Disclaimer: This document reflects the views of the author, not the DNC. The DNC was not provided with the underlying sourcing, interviews, or supporting data for many of the assertions contained herein and therefore cannot independently verify the claims presented. **
The Always-On Strategy
- Democratic campaigns often suffer from a 'seasonal' spending model that goes dark between election cycles, ceding the narrative to opponents.
- Right-wing organizations maintain an 'always on' presence, consistently framing partisan information flows long before Democrats begin their outreach.
- Waiting until the final months of a campaign to engage voters is increasingly ineffective in an era dominated by misinformation and disinformation.
- The 'messaging vacuum' created by Democratic absence allows Republicans and foreign actors to define and brand the party on their own terms.
- Early investments in North Carolina by the DGA and DAGA serve as successful counter-examples of defining candidates before the opposition can.
- Future strategies must align ad placements with modern media consumption behaviors and ensure coordination with outside entities to maximize impact.
In an age of misinformation and disinformation, the answer to the question of “when is the right time to engage actual and potential voters” must always be “now.”
54 evolve by the time a future Democratic nominee needs to set a strategy, which will be guided by the exigencies and insights of the time, so there is not a definitive prescription for the future. A future nominee will need to ensure their campaign’s ad placements are connected to the media consumption behaviors of the voters needed to win, and to the degree permissible, effectively and efficiently aligned with the decisions of outside entities to maximize the ability to present and make the case for the candidate and the ticket. In the meantime, the DNC and partner committees will continue to research and support ad strategies connected to how the voters Democrats need seek information, receive information, and make voting decisions. “Always Late” versus “Always On” Since 2018, the progressive organization Tech for Campaigns has conducted an annual review of digital spending within each two-year election cycle. In their report on the 2024 cycle, they highlight the way right-wing organizations are “always on,” and by comparison, how Democrats and progressive organizations use a seasonal and late messaging approach. Democrats and partner organizations make massive investments in media towards the end of an election cycle and then go dark – while right-wing organizations have as a more consistent spend. By the time Democratic candidates show up, often in the last few months of a campaign, it can be too late to persuade voters when the other side has been framing and shaping partisan information flow for months, if not longer. Those who argue voters only tune in towards the end of a campaign are wrong. In an age of misinformation and disinformation, the answer to the question of “when is the right time to engage actual and potential voters” must always be “now.” When Democrats “go dark” between cycles, it is ceding too much ground and share of voice – making it easier for Republicans and foreign actors to fill the messaging vacuum, push false narratives, and to define and brand Democrats on their terms. Some Democratic organizations get it. In 2024, the DGA and DAGA each invested in early media in North Carolina. The DGA supported $18.4 million in supportive advertising from May through August of 2024 focused on Josh Stein’s record as Attorney General – clearing the backlog of thousands of untested rape kits to help close decades old cases, and his crackdown on fentanyl in the state. DAGA spent $4.5 million to define Republican Dan Bishop’s positions No additional sourcing or evidence provided for many claims in this section. Public reporting contradicts several underlying assumptions.
Disclaimer: This document reflects the views of the author, not the DNC. The DNC was not provided with the underlying sourcing, interviews, or supporting data for many of the assertions contained herein and therefore cannot independently verify the claims presented. **
The Always On Strategy
- Early and consistent investment in political messaging provides clarity for voters and allows candidates to focus on affirmative platforms.
- Seasonal funding cycles and legal restrictions on non-party organizations often dilute the effectiveness of Democratic outreach.
- State parties require permanent infrastructure to raise the electoral floor, especially in historically non-viable districts.
- The 2024 defeat of Sherrod Brown in Ohio serves as a case study for how national party drag can overcome even strong individual incumbents.
- A proposed permanent campaign model includes dedicated communications, research, and training through the DNC and state parties.
In a world (or state) where significant investment flows more frequently than once every six years, is Sherrod Brown still a Senator?
55 on abortion and his close alignment with the deeply polarizing Republican gubernatorial nominee who wanted to permanently ban all abortions and jail doctors. By investing early and late, these efforts provided clarity for voters and enabled the campaigns to make their own plans and advance their own affirmative messages. Democrats bear a responsibility to step up and advance stories and positions through a more longitudinal approach; and with partners, become more consistent content providers. There are many organizations working to shape policy; and even more organizations dedicated to creating and delivering content and promoting candidates and choices. These organizations need resources to stay “on,” but many receive “seasonal” investment. Many also face funding restrictions in what they can say, and cannot associate themselves with the word “Democrat,” which can lessen the effectiveness of their investments. Democrats can use the word Democrat. Party committees and candidates also need investment to stay “on,” especially in states and districts where Democrats have not been seen as viable and therefore have not been supported by the Party, organizations, or donors – in some instances for decades. Consider Ohio, where Sherrod Brown was the only Democrat able to win a statewide election from 2012 through 2024 by winning re-election to the US Senate in 2018. There were many good Democrats who ran for statewide office each cycle, but each started from scratch – having to raise money, manage their resources, and spending on message delivery at the end. Candidates should spend to win with the resources they have on the calendar they have, but a supported state party can raise the floor for the whole ticket through an “always on” approach. The Ohio Democratic Party made this case for years and did better than many of their counterparts in other states in terms of raising money and organizing. However, eventually the drag of the national party and campaign became too much for even Sherrod Brown to overcome. In a world (or state) where significant investment flows more frequently than once every six years, is Sherrod Brown still a Senator? Could Democrats have won one of the narrowly decided contests in 2018 if the party had received strategic support from 2012 through 2018? The permanent campaign Chair Martin has proposed includes dedicated communications infrastructure. Working through the DNC, ASDC, and state parties, in coordination with party committees, candidates, and partners, these investments will provide the research, training, and resources needed to drive our message and support our candidates across the ticket.
Disclaimer: This document reflects the views of the author, not the DNC. The DNC was not provided with the underlying sourcing, interviews, or supporting data for many of the assertions contained herein and therefore cannot independently verify the claims presented. **
Strategic Funding and Messaging
- Democratic funders must demand accountability for past failures and prioritize filling organizational gaps in non-competitive regions.
- The 'always on' strategy of the right necessitates a consistent, year-round messaging infrastructure rather than late-cycle spending.
- Successful early investments in 2025 state elections serve as proof points for the necessity of defining the narrative well before 2026.
- Democrats must innovate within the attention ecosystem to match the scale of a national party and counter foreign-backed disinformation.
- With over $8 billion raised in 2024, the issue is not a lack of resources but the strategic timing and placement of those funds.
The right is “always on,” if Democrats do not match this strategy, it will be too late to make the case, much less close the deal.
56 As funders evaluate where to invest, they should question whether recent approaches have worked. The places and spaces where Democrats lost ground are known. Moving forward, is there accountability for what did or did not work? Are new organizations needed to fill gaps? How can parties be resourced and supported to help reclaim the voters Democrats need to win now and in the future? Will resources move earlier to support a more consistent and responsive messaging infrastructure? Democrats raised and spent more than $8 billion in federal elections alone in 2024. The resources are there, so it’s time for Democratic decisionmakers – incumbents, candidates, party leaders, and donors – to direct and invest more resources to ongoing messaging, especially in the places outside the competitive landscape. The right is “always on,” if Democrats do not match this strategy, it will be too late to make the case, much less close the deal. Democrats need to ideate and innovate across the ever-changing attention ecosystem, throw a lot of things at the wall, find what works best, and share best practices until it works at the scale of a national party. In 2025, the DGA, DAGA, and DLCC again proved the benefits of early investments in New Jersey, Virginia, and Pennsylvania. The DGA supported and financed early investment in media placement in New Jersey and Virginia, providing an effective contrast for voters, and clarity for campaign planners. DAGA directly invested in media placement immediately after the New Jersey primary to support the nominee. The DLCC provided early investments to the House Caucus in Virginia, and coordinated support for the judicial retention elections in Pennsylvania, enabling Governor Shapiro to close the deal as the election drew closer. A broad coalition supported California’s Prop 50. These are proof points for the path Democrats need for 2026 – waiting for the end of the cycle is too great a risk. Republicans can read polls, too. They can see the world turning against them and will adjust by spending billions. Democrats should have confidence in the proven ability to raise funds, and should invest earlier in defining the election for voters in favorable terms. The campaign has already started. Countering Misinformation and Disinformation American elections are now influenced by more than American interests. There is an obvious and conscious effort by foreign and domestic actors to shape electoral choices through misinformation and disinformation directed at American voters.
Disclaimer: This document reflects the views of the author, not the DNC. The DNC was not provided with the underlying sourcing, interviews, or supporting data for many of the assertions contained herein and therefore cannot independently verify the claims presented. **
Combating Global Political Misinformation
- Foreign actors, particularly from Russia and Eastern Europe, manage a significant portion of extremist social media accounts to influence American elections.
- Traditional fact-checking is often counterproductive because it can inadvertently amplify the original smear or fail against voters motivated by tribalism.
- Effective opposition to disinformation requires addressing the underlying motivations of voters, such as the desire to signal political identity or generate chaos.
- Right-wing interests utilize a long-term strategy of amplifying polarizing figures within the Democratic Party to 'other' and alienate the entire platform.
- Democratic organizations must prioritize rapid response operations and affirmative messaging to protect candidates from being painted as out of touch.
Fact-checking will not stop the spread of misinformation if the need to signal one’s politics, derogate the opposition, or generate chaos is a more powerful motivator than truth.
57 This is not limited to the United States, as voters around the globe have been subjected to a barrage of extremist misinformation in recent elections. Recent news coverage about changes to the platform formerly known as Twitter has exposed how nearly half of right-wing, pro-MAGA accounts were actually create and are managed in Russia, Eastern Europe, and other non-American locations. Throughout American history, extreme views have temporarily bubbled up to shape public discourse, but normalcy eventually returned as more reasonable voices reasserted reason as a source of truth. Misinformation and disinformation are effective when there is a lack of trust or confidence in leaders and platforms, leaving voters susceptible to whatever they see or hear. There are many organizations dedicated to correcting the record and supporting an affirmative argument for Democrats. In recent years, it’s become apparent how fact-checking can be perceived as counterproductive by bringing more attention to the underlying smear. Countering false information comes down to both making an affirmative case, and pushing back on the motivations behind the smears, rather than responding to the lack of substantive truth. Research has shown “Fact-checking will not stop the spread of misinformation if the need to signal one’s politics, derogate the opposition, or generate chaos is a more powerful motivator than truth.”7 Democrats will continue to explore this combination, by bringing focus to a consistent and long-term affirmative agenda and finding ways to address and align with voter motivations. The attacks on Democrats, including the elevation of incumbents and candidates within the Democratic Party whose politics or positions are used to paint candidates running in competitive states and districts as out of touch will not stop. Those Democrats must continue to make their case, define their opponents, and have effective rapid response operations in place to protect the party and the candidates. The DNC and other committees have developed staff and operations to manage rapid response efforts, usually through earned media efforts and coordinated messaging. These tactics will remain in place, and need more support. The organizations doing this work over the past several cycles have been subject to legal attack by the right, and by partisan investigations. Their work is essential to the broader ecosystem, and needs to be protected and continued. 7 Why Americans Crave Fake News, Aaron Tiedman, New America (2023). https://www.newamerica.org/political-reform/reports/why-americans-crave-fake-news/the-problem-of-misinformation-in-a-democracy/ No evidence provided; contradicts public reporting.
Disclaimer: This document reflects the views of the author, not the DNC. The DNC was not provided with the underlying sourcing, interviews, or supporting data for many of the assertions contained herein and therefore cannot independently verify the claims presented. **
58 All is fair in love, war, and politics, and yes, Democrats have made investments in Republican primaries – seeking to shape general election matchups. The difference is right-wing interests take a longer-term approach and amplify polarizing messaging and candidates within the Democratic family with the intention of “othering” all Democrats. Without aggressive pushback and tactics, it works. No evidence or sourcing provided for this claim.
Disclaimer: This document reflects the views of the author, not the DNC. The DNC was not provided with the underlying sourcing, interviews, or supporting data for many of the assertions contained herein and therefore cannot independently verify the claims presented. **
The Platform Specificity Mandate
- Modern media campaigns must recognize that every device and platform offers a unique user experience that requires tailored content.
- Democratic consultants are criticized for 'shoehorning' traditional 30-second TV spots into digital spaces rather than creating native content.
- Overproduced video content can create a sense of dissonance for voters when it appears on platforms where they expect authenticity.
- To remain relevant, candidates must commit to experimentation and inhabit the specific digital spaces where voters live and scroll.
- Reaching digital-native voters requires a shift from a one-size-fits-all broadcast mentality to a platform-first strategy.
Understanding the way in which an overproduced video creates dissonance with a voter based on where they are experiencing it in their media journey is an important step.
59 All Screens Are Not the Same Effective modern media campaigns start with understanding each platform where an ad is placed is different, and so is every device. A phone is different than a tablet or a computer, which is different from a television. A social media or digital platform is different than a connected TV experience, print outlet, radio, or a television station or network. A common critique surfaced during interviews is how Democratic media consultants seem to craft content for traditional media and then try to shoehorn the content into digital spaces. They cut a 30 second TV spot, and try to use it on digital platforms, or fashion cutdowns to 15 seconds, 12 seconds or 6 seconds to fit the ad specs of different platforms. Critics – most of them digital practitioners – see this approach as uninspiring and lacking imagination. While this critique paints Democratic media strategists with a broad brush, innovation is a choice. Understanding how different channels, different tools, and different platforms work is crucial to reaching the generations of digital-native voters who will decide elections. For Democrats to make the case for which party has these voters’ best interests at heart, they first have to be able to reach the voters – in both delivery, and channel fit. Understanding the way in which an overproduced video creates dissonance with a voter based on where they are experiencing it in their media journey is an important step for Democratic candidates and incumbents who wish to remain relevant. It is difficult to be always “on,” and to tailor media to audience and platforms, but it is required in this modern media environment. Democrats need to be everywhere to win anywhere - across platforms, channels, and media formats. There must be a commitment and openness to experimentation about where people are living, scrolling, reacting, and amplifying content, and then to effectively inhabit those spaces. The smartphone has set the stage for social media and digital platforms to take on lives of their owns, attracting viewers and voters who are in each space looking for different and unique experiences. Each of these platforms, and many others, have different types of audiences seeking different experiences, and serve content to people who are either political or non-political. It’s up to Democrats to engage them wherever they are – now and in the future. User behavior is not tied to partisan choices – interests change with the moment, and usage of a platform No source material or data provided. Unsourced claims cannot be independently verified.
Disclaimer: This document reflects the views of the author, not the DNC. The DNC was not provided with the underlying sourcing, interviews, or supporting data for many of the assertions contained herein and therefore cannot independently verify the claims presented. **
Strategic Messaging and Voter Engagement
- Democrats must develop better tools to map voter habits and prioritize active listening to build genuine support.
- The DNC is collaborating with tech leaders to modernize voter engagement and identify effective technical resources.
- A strategic shift toward aggressive negative messaging is necessary to frame the choice for voters effectively.
- The text argues that Democrats often rely on reason while the electorate is increasingly driven by rage.
- The failure to disqualify Donald Trump in the public eye is attributed to an insufficiently aggressive prosecution of his record.
- Despite low favorability ratings and primary struggles, Trump remained a threat because the opposition's messaging lacked a 'brutal' edge.
Democrats operate in an ecosystem defined by reason even in cycles when the electorate is defined by rage.
60 changes on how people feel they fit. Audiences change their minds and habits all the time, and will flow to anything with a positive value proposition or user experience. Democrats need better tools to identify and map potential voters against their preferred platforms and their media consumption habits – and then LISTEN. Only then can Democrats inhabit the habits of voters in effective ways to build support. The Democratic National Committee has convened leaders from the technology and data sectors to understand the combination of technical and human resources needed to identify the most effective forms of voter listening and engagement. This work will help Democratic incumbents and candidates better connect with voters, and run more responsive campaigns. Negative Messaging Voting is a choice. And negative messaging needs to be a part of the story as choices are framed for voters. At times, it seems Democrats are trying to win arguments while Republicans are focused on winning elections. Democrats operate in an ecosystem defined by reason even in cycles when the electorate is defined by rage. This highlights a fundamental and necessary truth – a brutal and efficiently delivered message will frame the choice for voters and help actually win the election. When voters are not enraptured by the policy agendas advanced by candidates, the campaign’s motivations and intentions are irrelevant. Democrats need to meet the voters where they are, and make an aggressive, contrarian case against their opponents. The retrospective evaluation of Donald Trump's presidency was too positive. Given the ability of right-wing entities to slash and smear the Vice President, it was essential to prosecute a more effective case as to why Trump should have been disqualified from ever again taking office. The grounds were there, but the messaging did not make the case. In April 4, 2025, Trump’s favorability was well underwater among respected public polls. His net favorability was in the net-negative double digits. Trump had been consistently attacked by Republican candidates during the nominating process, and struggled to break 50 percent in Iowa and New Hampshire. He secured the nomination, but was not well positioned for November. No sourcing or evidence provided for many claims in this section.
Disclaimer: This document reflects the views of the author, not the DNC. The DNC was not provided with the underlying sourcing, interviews, or supporting data for many of the assertions contained herein and therefore cannot independently verify the claims presented. **
The Failure of Negative Advertising
- Donald Trump's favorability improved significantly leading up to the 2024 election despite his felony convictions in New York.
- Democratic leadership opted against large-scale negative advertising, assuming Trump's flaws were already 'baked in' to public perception.
- The strategy prioritized introducing a new nominee over attacking Trump, leaving millions of first-time voters without a framed alternative.
- First-time voters broke heavily for Trump, suggesting a failure by Democrats to remind the electorate of his previous administration's failures.
- Post-election data shows Trump's favorability has returned to double-digit negatives as voters experience renewed chaos and economic uncertainty.
- The author argues that 'voter remorse' in 2025 is a direct result of the Democrats' lack of negative firepower during the campaign.
Buyers (voters) would not have “remorse” if Democrats had effectively made the case.
61 In May of 2024, he was convicted in New York on 34 felony counts for making fraudulent and false statements to hide payments to Stormy Daniels at the close of the 2016 presidential campaign. Yes, as the election drew near, his favorability improved, with net approvals in the net-negative single digits. Select National Public Polling – Net Change in Trump Favorability There were similar shifts in the campaign’s internal polling. There was a decision in the 2024 Democratic leadership not to engage in negative advertising at the scale required. The supporters of this approach argued Donald Trump’s negatives were known, obvious, and baked in, so it would not be a particularly effective approach to engage in negative messaging when the main priority was to introduce a relatively unknown nominee after the unprecedented candidate switch. There are two primary observations to make here. The first is that there were millions of people voting for the first time in the 2024 election. These new voters, as indicated by exit data and other research, broke heavily for Trump. Was this because he met them where they were and reached out to them in effective ways? Or did Democrats fail to see these voters and thus fail to offer them a properly framed alternative? Or, was it because Democrats never helped these voters remember and reflect on Trump’s failures as president? The second observation is how Trump’s favorability returned to net-double-digit negatives in 2025, and has stayed there – as voters have yet again experienced the expected chaos, lawlessness, and economic uncertainty of a corrupt and incompetent administration. Buyers (voters) would not have “remorse” if Democrats had effectively made the case. The Trump campaign and supportive Super PACs went full throttle against Vice President Harris, but there was not sufficient or similar negative firepower directed at Trump by Democrats.
No sourcing or evidence provided. No sourcing or evidence provided.
No sourcing provided.
No sourcing provided for these claims.
Disclaimer: This document reflects the views of the author, not the DNC. The DNC was not provided with the underlying sourcing, interviews, or supporting data for many of the assertions contained herein and therefore cannot independently verify the claims presented. **
The Economic Messaging Failure
- The Democratic Super PAC Future Forward prioritized economic messaging over character-based attacks on Donald Trump.
- National exit polling revealed a devastating loss for Harris among voters who prioritized the economy, trailing by a 63-point margin.
- Harris failed to capture the middle-income bracket, losing voters earning between $30,000 and $100,000 by six points.
- The campaign suffered from a strategic misalignment where the Super PAC failed to 'go low' or frame Trump negatively as per traditional political roles.
- Future presidential campaigns require better ecosystem alignment to ensure that messaging strategies across various entities do not conflict.
The national exit polling indicates Harris lost the 32 percent of voters who identified the economy as their most important issue by 18 to 81, a negative 63 percent margin.
62 The Super PAC designated to supporting the Democratic presidential campaign had a different point of view and pursued a different strategy – based on economic messaging. In their post-election interviews with the party, Future Forward's principals were refreshingly transparent and forthcoming, and their argument about making the economy case holds salience, as it was a top issue for voters and drove voter choice. The problem is Harris lost the economic argument. The national exit polling indicates Harris lost the 32 percent of voters who identified the economy as their most important issue by 18 to 81, a negative 63 percent margin; and lost voters earning between $30,000 and $100,000 (48 percent of the electorate) 46-52 a negative six-point margin. 2024 National Exit Poll
This does not mean the ads did not work, or the strategy was wrong. The economy was bad, but voters wanted change, and did not see the Democrats as being enough. In this context, the inability to properly frame Trump to be as terrible as he has quickly proven to be was a massive missed opportunity given what was a necessity for the campaign. If the Super PACs are not going to go negative, the campaign must, which is in part what happened. But it also goes against what has been somewhat of an established practice. Traditionally, where the campaign goes high, the Super PACs and the party committees go low. There has been much ink spilled about the dynamic between the campaign and Future Forward. Notwithstanding these differences, future presidential campaigns need entities across the ecosystem to be aligned. While they cannot legally coordinate, there needs to be a more
No source material or data provided. Unsourced claims cannot be independently verified.
Disclaimer: This document reflects the views of the author, not the DNC. The DNC was not provided with the underlying sourcing, interviews, or supporting data for many of the assertions contained herein and therefore cannot independently verify the claims presented. **
Strategic Alignment and Voter Engagement
- Presidential campaigns must establish clear 'lanes' and maintain strategic dominance over Super PACs to ensure a coherent message.
- The campaign's direct access to the candidate and ground-level voter data makes it better equipped than external entities to drive strategy.
- Divergent messaging between a campaign and its Super PAC leads to duplicative efforts and voter confusion.
- The borderless nature of modern media requires Democrats to adapt to how algorithms and digital sharing influence content visibility.
- The party needs to shift from 'pushing' information at voters to 'pulling' them into active community participation.
- Donors and leadership should refuse to support Super PACs that are not strictly aligned with the nominee's strategic needs.
Democrats need to move on from messaging strategies consisting of pushing information and content out, rather than pulling people in.
63 effective understanding about the role of Super PACs in presidential elections. There must be clarity between the Super PAC and the campaign about the lanes they will occupy. Campaign staff could see what the Super PAC was doing (or not) in terms of their ad placements, and made adjustments. The strategy should ideally be driven by and the signals sent by the presidential campaign. The campaign can access the candidate, and can drive outcomes and responses faster than external entities. The campaign also has more insight from voters on the ground and field level than the Super PACs do. Super PACs can spend resources to monitor voter feedback and voter sentiment in close to real time as well. But when they are divergent on how to message, it means that there actually isn't a combined and coherent strategy. Efforts are duplicative at best, and confusing at worst. Moving forward, Democrats need future presidential nominees to seriously consider their decisions about whether or not to have a Super PAC, and if so, whether the designated Super PAC is aligned with their strategic needs. Anything else simply cannot exist within the ecosystem, and donors and leadership should not accept it. Pulling People In In the context of the 21st century, media is now borderless. There was a time when an ad placed in a given market would stay within that market. Now, the way content is shared and the way algorithms can be manipulated means some voters can see something instantly, no matter where they are, while others may never see the content at all. It is important for Democrats to acknowledge this moment an opportunity – to rethink and reformulate the way the party engages voters of all ages, backgrounds, and interests. The party must learn and align to how voters consume and receive information, what moves the needle, and what will keep them engaged and participating in subsequent elections. Democrats need to move on from messaging strategies consisting of pushing information and content out, rather than pulling people in. A call to action focused on unity and empowering leaders to help and lead every level of politics. Pulling people in is one of the hardest things to do in elections, especially in a modern information and cultural ecosystem where a lot of people are content to sit on their couch and be on the phone, as opposed to being out in their communities and engaging and learning about what's going on in the world around them. No source material or data provided. Unsourced claims cannot be independently verified.
Disclaimer: This document reflects the views of the author, not the DNC. The DNC was not provided with the underlying sourcing, interviews, or supporting data for many of the assertions contained herein and therefore cannot independently verify the claims presented. **
The Art of Democratic Engagement
- Democrats must move beyond data-driven metrics to understand the emotional and cultural 'why' behind voter behavior.
- Effective organizing requires re-engaging in local and digital spaces where the party has been absent for too long.
- The party needs to prioritize listening to activists and allies to incorporate their needs into broader political strategies.
- Relying solely on pollsters and tech stacks creates a reductive view of the electorate that limits coalition building.
- Success depends on a three-step marketing funnel: winning voter attention first, support second, and the actual vote third.
The hard part is starting, the harder part is keeping it going, but the easiest part is having the humility to listen and learn.
64 That is not a criticism of the American people, but an observation about what has changed in the culture. Democrats need to think about what it even means to pull people into a party, what does the process look like, and how best can it be achieved. Because once Democrats get someone to show up and buy in, they might actually come back. They may not come back forever, but if they come back one more time, Democrats can shift the entire dialogue. It can then be about coming back with their friends and coworkers and loved ones. Democrats can prove again to Americans there are people who think like them, with similar passions and priorities and politics. Showing and proving there is a party full of people like them will convince them to pull more people in and join the work to reclaim our country. The truth is there are many communities throughout our country where Democrats have not been present for far too long. There are countless groups dedicated to a range of local, national, and global interests and causes. People access them through their phones, their chats, and their messaging apps. Unfortunately, Democrats are not even close to being in those conversations. It’s time to re-engage – in-person and online. This is organizing, yes – but an essential component of Democratic messaging. It will take a nation to get America back, and without vision and purpose, who will come? The opportunity before Democrats is to think through how people and voters can be identified and invited into the party. And as Democrats bring people in, are they listening to what people are saying and what they want? How are conversations and insights being shared? Is there an approach to sharing these insights with incumbents and candidates so they understand where communities are? The hard part is starting, the harder part is keeping it going, but the easiest part is having the humility to listen and learn, and to then incorporate what activists and allies say and want and need, and pulling them into the work Democrats have to do. In the absence of effective engagement, everything becomes reductive to the tech stack and the dashboard – Democrats are limited to the questions the pollsters ask, and the inputs from those questions inform the decisions made about content, tactics, and strategies. The broader the net, the broader the coalition, the stronger the Democratic Party will be. Because none of us is as smart as all of us.
Disclaimer: This document reflects the views of the author, not the DNC. The DNC was not provided with the underlying sourcing, interviews, or supporting data for many of the assertions contained herein and therefore cannot independently verify the claims presented. **
65 The truth is, right now, for all of the technology, and all of the data, Democrats may be able to tell what people think, but cannot answer why a voter feels a certain way about a candidate, or what voters bring to the table, or how voters make decisions. These are the things necessary in a modern marketing ecosystem for Democrats to be able to first win voter attention, their support second, and their action – voting – third. Pulling people in – through messaging, then organizing, is the path for Democratic candidates to able to win anywhere.
Disclaimer: This document reflects the views of the author, not the DNC. The DNC was not provided with the underlying sourcing, interviews, or supporting data for many of the assertions contained herein and therefore cannot independently verify the claims presented. **
The Evolution of Campaign Research
- Research must drive campaign design by determining messaging, delivery methods, and target audiences.
- Traditional phone banking has become ineffective due to caller ID and collapsing response rates.
- Market research faces significant response bias as participants are often atypical of the general electorate.
- Reaching younger and non-White voters is increasingly difficult due to mobile plan structures and frequent relocation.
- Pending changes to the digital and texting landscape will necessitate further innovation to maintain representative samples.
- Campaigns must evaluate if newer research methodologies are superior or merely complementary to traditional tools.
The challenge in reaching younger voters is further complicated by how many young Americans are still part of family plans, so their phone number may actually be associated with a parent or another relative.
66 STATE OF RESEARCH & STRATEGY Research should drive design. It should tell us what to say, how to say it, and who to say it to. Research approaches constantly change. In 2008, the Obama campaign applied innovative approaches to generate responses at scale - every day. Throughout the general election, the campaign could constantly model and revise how they would engage voters through effective messaging and effective organizing. Seventeen years ago, it was possible to generate sufficient sample on a daily basis through phone banking – this is no longer the case. With technology like caller ID now ubiquitous and a range of experiential factors over the years, many Americans no longer answer their phone to people they do not know and response rates have collapsed. Some of the people who do participate in market research are incentivized, or are – in general – atypical from the electorate. Skilled and experienced researchers bring their art to the table by knowing how to find the proper balance within the data they collect to reflect a representative voting population. Response bias remains a challenge. Younger Americans and non-White communities have long been underrepresented in research approaches and technology has not exactly made it easier to engage. The challenge in reaching younger voters is further complicated by how many young Americans are still part of family plans, so their phone number may actually be associated with a parent or another relative. Younger Americans are also more likely to change their phone number and younger Americans are far more likely to move than older Americans – where their addresses change, but their voter registration may not be updated. Campaigns and their research teams constantly evaluate whether they are reaching the right people in the right places with the right questions to develop the right messages. Are elements of participation bias in our research ecosystem getting worse as it becomes more difficult to reach and engage voters? Perhaps. Are pending changes to the texting landscape going to force more innovation by researchers to achieve representative samples? Certainly. Democratic candidates and incumbents therefore need to consider how we use market research to drive decision making, how to ensure research remains an effective tool, and whether newer research approaches are “better” or an effective complement to existing approaches. A note on data quality No additional sourcing or evidence provided for many claims in this section.
Disclaimer: This document reflects the views of the author, not the DNC. The DNC was not provided with the underlying sourcing, interviews, or supporting data for many of the assertions contained herein and therefore cannot independently verify the claims presented. **
The Limits of Voter Data
- Democratic strategy relies on demographic assumptions that are often undermined by incorrect or outdated voter list data.
- Maintaining accurate voter files is a significant financial burden, as refreshing phone numbers and addresses is a constant and expensive process.
- While data models are statistically accurate in the aggregate, they often misclassify individual voters based on race, gender, or age.
- A tension exists within the party between those who view analytics as absolute truth and those who prioritize anecdotal observation.
- Models act as lagging indicators because they are built on past behaviors rather than real-time shifts in voter sentiment.
- The author calls for a party-wide conversation on improving source data quality despite the high costs involved.
Analytics is truth, anecdote is flawed. Others argue sometimes we have to believe our eyes, no matter what the math says.
67 Democrats have long believed certain voting cohorts are far more supportive than others, and in general, voter outcomes have validated this. However, if the demographic data within voter lists are not correct, then the underlying assumption about an individual voter's propensity to behave a certain way is also incorrect. There are many examples over time about how voter data on both the hard side and the soft side misclassify voters based on gender or race. Further, some states do not report age in their voter rosters, and when age is modeled it is not always perfect. Voter files require constant refreshing of phone number data and address data for voters, which drives cost because it is very expensive to constantly and consistently update voter files with fresh phone numbers. The data modelers will say, while the data in most voter files is not deterministic at the individual level, in the aggregate, their models are correct. This is true. And yet it should not prevent Democrats from having the hard conversations about improving data quality, simply because it may seem cost prohibitive. Democrats, as a family, need to have a conversation to resolve how to improve our source data to drive improved decision-making. Once the data is improved, what are we using it for? How are we making decisions? What analytical inputs and frameworks are being applied to identify support or vote propensity and other factors connected to voter choice and voter behavior. Balancing Tactics and Approaches If voter demographic data is generally correct with an acceptable level of fuzziness, it doesn't mean the tools and outputs from the data are fundamentally flawed. It means there should always be some level of hedge associated with what is learned from the data. There are those within the party who drive decisions through the available science and tools we’ve developed. Analytics is truth, anecdote is flawed. Others argue sometimes we have to believe our eyes, no matter what the math says. In general, more information is a good thing – and decision makers can and should base their decisions upon it. But models are generally lagging indicators of voter choice. They are developed on a foundation of proven and actual past behavior, measured and updated against current responses.
Disclaimer: This document reflects the views of the author, not the DNC. The DNC was not provided with the underlying sourcing, interviews, or supporting data for many of the assertions contained herein and therefore cannot independently verify the claims presented. **
Modernizing Democratic Campaign Analytics
- The Democratic Party has utilized data analytics since the 1990s, but the 2016 election highlighted the dangers of over-reliance on these tools without cultural context.
- Declining response rates and the difficulty of reaching specific demographics have fundamentally challenged the accuracy of traditional polling methods.
- Surveys are limited by their design, as they can only provide answers to the specific questions asked, often missing organic cultural shifts.
- A more effective research model combines qualitative social listening with quantitative polling to identify and measure emerging voter trends.
- The Democratic National Committee aims to lead a transition toward a more comprehensive information ecosystem to guide candidate messaging and resource allocation.
There are many who argue polling is just fine in terms of what it is - measuring opinion and direction among who it is able to engage, yet surveys can miss things bubbling in culture because surveys can only give you the answers to the questions that you ask.
68 But without sufficient or fully representative responses, how do we make sure we are seeing what we need to see? Either in real time, or in enough time to make adjustments to reconnect or recapture with the voters we need to win. These debates have been raging for decades, and it's time for Democrats to convene and figure out how we need to move forward. Analytics within the Democratic Party goes back to the 1990s. Experiments with clustering, voter profiles, and market segmentation have long been tools used by the national party in presidential and national coordinated campaigns. As technology improved and it became easier to collect, analyze, and parse large-scale data sets, analytics became a ubiquitous tool for the design and implementation of national campaigns. The 2016 Presidential campaign proved an analytics-dependent campaign can miss important context. In the aftermath of the loss, there was a lot of discussion about “fixing polling” or finding tools to parallel Cambridge Analytica. There are many who argue polling is just fine in terms of what it is - measuring opinion and direction among who it is able to engage, yet surveys can miss things bubbling in culture because surveys can only give you the answers to the questions that you ask. Most pollsters concur shrinking response rates and the inability to reach certain voters has changed their profession – and many excellent researchers have worked to resolve these issues. Qualitative and social listening can indicate where voters are, and polling can measure the frequency and distribution of potential new information and trends, assuming it is quickly fielded, analyzed, and tested for the purposes of interventions or changes. The ability to drive listening through technology-based solutions can be a value add, with the understanding human intervention and inquiry are still needed to understand where the public is and how and why they may be moving. Democratic candidates and incumbents need to understand the ins and outs of the research business, because it drives so much of the decision-making within a campaign. Everything about what a candidate says to how your resources are allocated, and how the campaign tries to reach your voters with your message. The Democratic National Committee will be leading conversations around the information ecosystem, and the research approaches we need to take. And we will be seeking to educate our
Disclaimer: This document reflects the views of the author, not the DNC. The DNC was not provided with the underlying sourcing, interviews, or supporting data for many of the assertions contained herein and therefore cannot independently verify the claims presented. **
2024 Campaign Analytics Strategy
- The 2024 campaign utilized a research paradigm centered on active listening and large-scale panels to inform Democratic candidate strategy.
- Analytics teams transitioned from the DNC to the campaign in early 2023 to support fundraising, digital ads, and state operations.
- Resource allocation was driven by data modeling to determine the specific number of voters required to reach 270 electoral votes.
- The campaign identified 're-engagement targets' among younger and minority voters who supported previous Democratic tickets but lacked consistent turnout.
- Strategy focused on 'traditional swing voters' in the suburbs and a small segment of 'peel-away Trump voters' alienated by chaos or abortion issues.
- A disclaimer notes that the DNC has not independently verified the sourcing or data behind these strategic assertions.
The third and smallest target group was “peel-away Trump voters,” who had perhaps voted for Trump in 2016 or 2020, but may have been with Democrats on abortion or who were alienated with the chaos and corruption of the Trump era.
69 candidates and incumbents about what works, and the ways in which we need to engage voters, through a new research paradigm centered on listening to get the best outputs for Democratic candidates. The 2024 National Campaign The initial research structure of the Presidential campaign started on the analytics side, with departmental leaders starting on the DNC payroll as consultants in the late spring of 2023, and rolling over to the campaign shortly thereafter. The analytics team created a series of products for different campaign departments and leadership needs. They supported grassroots fundraising and compliance, digital advertising, and state operations. They deployed large-scale panels for ongoing active listening, and could periodically explore reactions to ideas or breaking questions. They also managed the ad testing for the campaign, generating reports and audience lists for the campaign paid media team and campaign leadership; and evaluations of campaign program effort and effectiveness. Their work guided resource allocation for the campaign – how many voters were needed to win in a given state, and how many voters in a given set of states would lead to 270 electoral votes. From the outset, the campaign set three targeting priorities. There were “re-engagement targets” – voters who had supported Obama or Biden, but were infrequent voters who needed persuasion to vote and to vote for Biden and then Harris – mostly younger voters or voters of color. There were “traditional swing voters,” these are voters who have largely moved towards Democrats in the Trump era, mostly college educated suburban voters who were not field targets, but were tracked for support. The third and smallest target group was “peel-away Trump voters,” who had perhaps voted for Trump in 2016 or 2020, but may have been with Democrats on abortion or who were alienated with the chaos and corruption of the Trump era. Trump’s favorability was tracking ahead of 2016 and 2020, especially in the Sun Belt, so they campaign felt they needed to take a run at these voters to drive his numbers down. No source material or data provided. Unsourced claims cannot be independently verified.
Claims are contradicted elsewhere in report.
Disclaimer: This document reflects the views of the author, not the DNC. The DNC was not provided with the underlying sourcing, interviews, or supporting data for many of the assertions contained herein and therefore cannot independently verify the claims presented. **
Campaign Analytics and Polling Friction
- The analytics team observed a stagnant race with little movement in voter support despite ongoing campaign efforts.
- A specialized polling team felt marginalized and underutilized, often seeing campaign advertisements only after they aired publicly.
- Campaign leadership adopted a minimalist research strategy, planning only three polling waves for the entire general election.
- Media team members reportedly dismissed polling data as non-essential for high-level strategic decision-making.
- The June 2024 debate performance triggered internal discussions about a potential candidate switch to the Vice President.
- Post-debate analytics showed no positive movement toward the campaign, confirming a failure to reach target audiences.
The pollsters described their work as underutilized during their initial engagement... they did not see ads until after they were airing, in some instances reading about the ads in the media.
70 The analytics team reported there was little movement throughout the campaign – and the state teams struggled to meet contact and support goals. The analytics showed the race was characterized by stability – it remained tightly competitive throughout the general election. The “message polling” team was not fully onboarded until December of 2023. Comprised of three experienced polling firms and an expert qualitative firm, the pollsters described their work as underutilized during their initial engagement. They performed their work, and delivered their findings to campaign leadership, but there was limited feedback or discussion on their work product. Before the candidate switch, the pollsters never reviewed ad copy or content – and commented how they did not see ads until after they were airing, in some instances reading about the ads in the media. They also reported they had little insight into the data provided to leadership from the analytics team. As the June 2024 debate neared, there were discussions about polling around the debate and after the convention. The polling team was informed the plan was for them to poll three times during the general election, and the post-convention polling would count as one of those three polling waves. They attributed this minimalist approach to research to members of the media team not believing polling data was essential to decision making. The debate obviously changed many things. The dial-testing during the debate demonstrated the weakness of the President’s performance, and a post-debate survey was scrapped. The analytics team measured voter reaction, and reported seeing little change. The fundamental need to earn votes from the target audiences remained, and there was no positive movement towards the campaign. Post-debate, and about a week before the candidate switch, there were internal discussions about how to prepare a campaign for the Vice President. In 2020, when Kamala Harris was selected by President Biden to serve as the running mate, many voters were excited and curious. No source material or data provided. Unsourced claims cannot be independently verified. No sourcing provided for this claim.. No source material or data provided. Unsourced claims cannot be independently verified.
Disclaimer: This document reflects the views of the author, not the DNC. The DNC was not provided with the underlying sourcing, interviews, or supporting data for many of the assertions contained herein and therefore cannot independently verify the claims presented. **
Strategic Neglect of the Vice President
- The White House allowed the 'border czar' label to persist without correction, damaging the Vice President's public image.
- Extensive polling was conducted to optimize Dr. Jill Biden's role, yet no similar research was performed for Vice President Harris.
- The administration failed to identify effective messaging, issues, or target audiences to leverage the Vice President's potential to support the President's agenda.
- Upon becoming the nominee, the campaign lacked foundational self-research on Harris, forcing a frantic scramble to reconstruct her record and vision.
- The author argues that failing to prepare or utilize Harris earlier was a 'significant failure of imagination' that could have bolstered the administration's standing.
- The DNC issued a disclaimer noting that many of these assertions lack underlying sourcing or independent verification.
The idea that a prepared and supported Vice President could not have helped the President in the preceding three and a half years is a significant failure of imagination.
71 Democrats won the election and President Biden assigned the Vice President a brief including immigration, which was poorly framed by Republicans as the “border czar.” It was not the official title, but it was the one that the media propagated and the White House failed to contradict or correct. Prior to the midterm election, the White House directed the DNC to conduct polling to identify how Dr. Biden could support her husband as president. The research explored the settings, the issues, and the messages needed to create an effective framework. No similar research was conducted to support the Vice President - to identify the issues she should talk about, the ways in which she should talk about them, the audiences with which she could perhaps resonate and support the President's agenda. There was also no independent research of the Cabinet. The White House's approach towards elevating the Vice President with a controversial issue brief without leveraging research into understanding how taxpayers and voters would react to the messengers of the Democratic administration was a massive missed opportunity. As a result, at the moment of the candidate switch the polling team discovered there was no self-research on the Vice President to guide the development of the research instruments. An incumbent Vice President. With no research to share once she became the nominee. The White House did not position or prepare the Vice President. Had the White House explored and evaluated ways to leverage Kamala Harris earlier in the administration, perhaps it would have improved the President’s standing, and it certainly could have helped prepare her to lead the ticket. Any fair critic of the Vice President has to acknowledge the strength and ability she demonstrated as the nominee. The idea that a prepared and supported Vice President could not have helped the President in the preceding three and a half years is a significant failure of imagination. Once the candidate switch was announced, the polling team quickly scrambled to get into the field with three studies – one on the Vice President’s biography and record, one on her vision and plan, and another on attacks and responses. Members of the Vice President’s team were tapped to reconstruct and update their own self-research from 2019, but even they were unclear if the research made it to the polling team. Claim contradicts public reporting.
No evidence provided; contradicts claims elsewhere in report.
Disclaimer: This document reflects the views of the author, not the DNC. The DNC was not provided with the underlying sourcing, interviews, or supporting data for many of the assertions contained herein and therefore cannot independently verify the claims presented. **
Polling Strategy and Stagnation
- Campaign pollsters increased data collection frequency following the candidate switch to Harris, yet results remained largely stagnant within the margin of error.
- A temporary polling bump occurred after the September 2024 debate but quickly receded to previous levels for the remainder of the election.
- Research indicated a desperate need for the Vice President to distance herself from the status quo to satisfy voter desire for change.
- Campaign leadership reportedly resisted pollsters' advice to create 'measured breaks' from the current administration's policies.
- Pollsters identified Republican attack ads regarding transgender issues as highly effective, noting the campaign felt 'boxed' by the candidate's own recorded statements.
- Attempts at policy differentiation, such as a single speech on immigration, were criticized by internal experts as being too late and poorly amplified.
They all recognized the attack as very effective, and felt the campaign was boxed – the ad was a video of her saying what she said, and it was framed as an attack on her economic priorities.
72 The resulting research was rolled together into a report shared with campaign leadership. It guided ongoing conversations with campaign leaders, but the pollsters never provided a briefing to the ticket. After the candidate switch, the post-convention research plan was revisited and the planned polling cadence increased. The pollsters attributed this to an addition to the campaign leadership team and a new desire for more data awareness to guide decisions. The pollsters had assigned states, and fielded surveys in roughly two-week intervals for the balance of the general election. Throughout the general election, similar to what was shared by the analytics team, the polling data never really moved or expanded beyond the margin of error. There was a brief increase after the September, 2024 debate, but it receded and then remained stable for the duration of the general election. Polling Reactions The pollsters concurred on three key findings. First, they felt it was important for the Vice President to find separation from the status quo. They recognized voters were looking for change, and felt it was necessary to find ways to demonstrate how a Harris-Walz administration would be more effective in addressing American needs. The pollsters acknowledged the loyalty demonstrated by the Vice President but also suggested it was contrary to strong signals in their data about how even measured breaks would help position the Vice President to win. They expressed their positions to campaign leadership, but there was little movement. One cited an attempted differentiation on immigration – with a single speech delivered on a Friday afternoon with little amplification as an example of too little, too late. Second, the pollsters were involved in discussions around the Trump attack ads – in particular the attack ad focused on the Vice President’s prior statements on transgendered Americans. They all recognized the attack as very effective, and felt the campaign was boxed – the ad was a video of her saying what she said, and it was framed as an attack on her economic priorities. No source material or data provided. Unsourced claims cannot be independently verified.
No source material or data provided. Unsourced claims cannot be independently verified.
Claim contradicts public reporting.
Disclaimer: This document reflects the views of the author, not the DNC. The DNC was not provided with the underlying sourcing, interviews, or supporting data for many of the assertions contained herein and therefore cannot independently verify the claims presented. **
Strategic Failures and Shifting Margins
- The campaign struggled with an inability to lower Donald Trump's favorability or his high retrospective job approval ratings.
- Democrats lacked a consistent, defined theory for attacking Trump or maneuvering toward his disqualification compared to the Republican framework.
- A lack of polling in non-battleground states like New Hampshire led to a failure to recognize shrinking margins in traditionally safe Democratic territory.
- The campaign's rigid focus on the path to 270 electoral votes prevented them from addressing emergent risks in states like New Mexico and Minnesota.
- Post-2024 investments in New Jersey and Virginia suggest that the party must prioritize year-round organizing to reclaim ground lost during the presidential cycle.
The Republicans had a defined framework for attacking the Vice President, but the Democrats did not have a defined or consistent theory for attacking Trump or how to maneuver to disqualification.
73 If the Vice President would not change her position – and she did not – then there was nothing which would have worked as a response. The pollsters generally concurred with the opinions shared by campaign leadership - given the stakes and timing, the focus needed to be on attacking Trump. Third, the inability to impact Trump’s favorability was a major failure of the campaign. His retrospective job approval was too high. The Republicans had a defined framework for attacking the Vice President, but the Democrats did not have a defined or consistent theory for attacking Trump or how to maneuver to disqualification. Widening the Aperture National campaigns also need to think about how they are faring in the ecosystem outside their battlegrounds. While most campaign resources should focus on battleground states, there should also be periodic inquiry into other states to measure potential opportunities or emergent risks. This did not occur in 2024. In the fall of 2024, the campaign approached the New Hampshire gubernatorial campaign and the Democratic Governor Association for an update because the campaign had not polled there since June. Vice President Harris did win New Hampshire by 2.78 percent. The pollsters were aware of shrinking margins in other states based on their awareness and analysis of public data – in the aftermath of the debate, there was serious concern about New Hampshire, New Mexico, and Minnesota – all of which ended up being decided by single digits. This is not to say the campaign should have invested in states where we lost ground, but still won. From a campaign perspective, their job is to get to 270 electoral votes, and spending on states not initially in the battleground array would have been a distraction or a diversion of resources. But now these states seem more competitive for Democrats. This played out in New Jersey and Virginia in 2025. The 2024 Presidential campaign won New Jersey by 5.88 percent and Virginia by 5.75 percent, leading some to argue Republicans had a chance to buck historic trends and win the statewide elections. Democrats therefore invested heavily in the 2025 states, securing double digit wins in the gubernatorial contests, and reclaiming ground lost in 2024. This goes to the role of the party relative to the role of candidates. The party's job is to lay a foundation for candidates to win. This means the year-round organizing, the training, the capacity development within a state, the recruiting of candidates, the supporting of candidates No evidence provided for this claim.
Disclaimer: This document reflects the views of the author, not the DNC. The DNC was not provided with the underlying sourcing, interviews, or supporting data for many of the assertions contained herein and therefore cannot independently verify the claims presented. **
Combating Partisan Polling Disinformation
- Democratic organizations must pool resources through coordinated campaigns to maximize financial impact and build long-term infrastructure.
- Partisan 'red wave' polls are identified as intentional disinformation efforts designed to distort media narratives and polling averages.
- Sophisticated polling tactics include showing early Democratic leads to manufacture a false sense of Republican 'momentum' later in the cycle.
- Democratic campaigns are urged to educate the press and voters to contextualize and dismiss data from non-reputable sources.
- A conflict exists between fundraising teams who use dire polling for urgency and communications teams trying to debunk misinformation.
- Candidates must establish strict guardrails to prevent their own campaigns from proactively spreading demobilizing disinformation.
These efforts are disingenuous and relatively sophisticated; some start by showing Democrats with an early lead so later polls then show Republican 'momentum.'
74 in ways that help them out-punch their opposition and get themselves in a position to seek upsets and eventually turn voters to their cause. It’s the DNC's job. It's the job of the state parties and the county and local committees. Our candidates and the campaign committees must keep their focus on winning their specific election – ideally in ways they can support the party's work. By participating in coordinated campaigns, their dollars go further because they are pooled with other candidates – which both builds for the present cycle and lays the foundation for future work connected to year-round organizing. Partisan “Polls” In the run up to the 2022 election, a wave of partisan red wave “polls” flooded the media ecosystem and rocketed across social media. These “polls” resurfaced in 2024 and in 2025, presenting data inconsistent with reputable nonpartisan public polling, and internal Democratic data. To the extent voters look to polling for information, these partisan efforts are an intentional disinformation effort targeted at Democrats, and less rigorous aggregators will include these polls in their polling averages. Democrats must align on how to respond to these attempts and media manipulation and voter disinformation – and in the interim, can respond in two ways. First, every Democratic incumbent and candidate campaign must push back on partisan efforts to distort competitiveness and mislead voters. These efforts are disingenuous and relatively sophisticated. Some start by showing Democrats with an early lead so later polls then show Republican “momentum.” Others drop in a flurry nearer to the close of a campaign to shape polling averages and saturate media churn. By educating voters and the fair press about these efforts, Democrats can limit their coverage and enable the public to contextualize the “data.” Second, Democratic fundraisers love to use competitiveness as a method for creating urgency and energy for fundraising. When it’s legitimate, they should. When these disinformation tactics are in play, Democrats should avoid amplifying them at all costs. It is difficult for campaign comms teams to push back on “polls” the fundraising shop is promoting. By their nature, these “polls” are intended to demobilize Democrats and deaden the focus our campaigns are trying to bring to the choices being presented to the electorate. Candidates and incumbents need to set guardrails and guidelines for their campaigns to limit the proactive spread of these and other sources of disinformation.
Disclaimer: This document reflects the views of the author, not the DNC. The DNC was not provided with the underlying sourcing, interviews, or supporting data for many of the assertions contained herein and therefore cannot independently verify the claims presented. **
75 ConclusionThis section was not provided by the author.
Disclaimer: This document reflects the views of the author, not the DNC. The DNC was not provided with the underlying sourcing, interviews, or supporting data for many of the assertions contained herein and therefore cannot independently verify the claims presented. **
Reforming Democratic Organizing Models
- Democratic candidates and incumbents are calling for a more effective, year-round organizing model to replace the current seasonal approach.
- A long-standing debate persists over whether organizing should be led by official party structures or outside progressive organizations.
- Recent shifts in legal parameters regarding coordination with outside entities necessitate a reassessment of how campaigns engage with voters.
- The current 'offshoring' of organizing to independent actors prevents campaigns from fulfilling the core function of building direct, two-way relationships with voters.
- Internal resistance from media consultants and party traditionalists remains a significant barrier to shifting funding toward labor-intensive organizing efforts.
- While independent efforts likely saved key margins in recent elections, the lack of centralized coordination creates strategic vulnerabilities.
The media consultants may not like it, and organizing is one of the hardest things to do in politics, so there will be many within the party who will seek to preserve the current division of labor.
76 STATE OF ORGANIZING & ADVOCACY Democratic candidates and incumbents must demand a more effective organizing model for the Democratic Party. There are many ongoing philosophical and practical conversations within the party and broader ecosystem about the best ways to engage Americans. There's been debate within progressive and Democratic circles for a long time about, first, who should lead organizing – the hard side or outside organizations (both), where should it live (everywhere), and how it should happen (all the time). It's time for a serious conversation about roles and lanes and what the future can be, especially given how campaigns and parties can, apparently, now coordinate with outside entities who engage in these types of activities. Democrats need to adjust to these shifting legal parameters and a loosening of constraints to reassess the essential roles everyone can play to cultivate effective engagement and two-way conversations with voters across the nation. Democrats have proven the ability to raise sufficient funding to effectively fund quality organizing within the Democratic ecosystem. The media consultants may not like it, and organizing is one of the hardest things to do in politics, so there will be many within the party who will seek to preserve the current division of labor. The existing understanding works – to a point. There is no doubt the Presidential election margins would have been much worse without independent efforts to organize in the battleground states. The split ticket results in the Senate, House, and nonfederal campaigns were not solely the result of divergent messaging strategies, there were also separate investments in direct voter contact. Democrats would have lost many more elections across the ballot without state tables and national partners directly engaging within communities on behalf of those candidates. Given preferential media rates, and given the ways in which money can move through the ecosystem, this division of labor has made sense. However, this approach to offshoring organizing leaves Democratic committees and campaigns relying on independent or soft-side actors to meet what should be a core function for Democratic campaigns, which is to pull people in and not simply push information out. No evidence or sourcing provided for many claims in this section.
No evidence or sourcing providing for this claim.
Disclaimer: This document reflects the views of the author, not the DNC. The DNC was not provided with the underlying sourcing, interviews, or supporting data for many of the assertions contained herein and therefore cannot independently verify the claims presented. **
Reimagining Democratic Party Organizing
- The 2024 cycle suffered from misaligned independent approaches and delayed program implementation, threatening future Democratic leadership.
- While candidates focus on immediate wins, the Party must balance current battlegrounds with long-term investments in neglected jurisdictions.
- Democrats risk losing voters even in battleground states if they fail to rebuild 'organizing muscle' through consistent, year-round engagement.
- State parties should serve as the primary vehicles for coordinated campaigns, as individual campaigns often lack the scale to fund effective organizing.
- Effective organizing requires prioritizing direct, face-to-face voter contact over outdated methods like mass phone banking or excessive texting.
- The Party possesses the necessary revenue to fund these efforts, provided leadership commits to a structural shift in strategy.
Democrats will not grow in the places they do not sow, and even in current battleground states and districts, Democrats may fail to rebuild a real relationship with voters if candidates and incumbents do not push their campaigns and parties to regain and reclaim organizing muscle.
77 There were also unique challenges in the 2024 cycle – including misaligned independent approaches – which led to delayed implementation of programs across the ecosystem. A status quo approach may lead Democrats to the same place – locked out of power and incapable of offering leadership to the American people. This also connects to the strategic intention of organizing investments. Many of the leading spenders across the ecosystem are focused on winning the elections right before them. This is the right approach for candidates, but not the Party. It’s the Party’s job is to think through how to right-size and resource levels of effort in critical, targeted terrain necessary to win now, and it’s also the Party’s job to grow the map through strategies and programs focused on changing future conditions in states and jurisdictions not currently on the map. States or jurisdictions outside of the so-called battlegrounds have not received meaningful partisan or nonpartisan organizing investments for years, if not decades. Democrats will not grow in the places they do not sow, and even in current battleground states and districts, Democrats may fail to rebuild a real relationship with voters if candidates and incumbents do not push their campaigns and parties to regain and reclaim organizing muscle. Quality organizing is hard. At the significant scale of a statewide race, it's incredibly difficult for campaigns to effectively fund and organize from within the campaign. It's why state parties can and should be the vehicle to convene modern and effective coordinated campaigns to drive this activity at the required scale to support the entire ticket. Democrats have proven the ability to raise the revenues required to properly fund quality organizing within the hard-side ecosystem – so long as leaders are willing to make the decision to do so. It’s time to rethink the roles, responsibilities, and lanes to design, develop, and deliver a more effective approach to leadership and engagement. What is Organizing, Anyway? As Speaker Tip O'Neill shared decades ago, “people like to be asked.” Organizing, at its core, is the process of developing the ability to reach as many people as possible to earn as many voters as possible through direct voter contact. The key to all of it is the ask. It isn't putting money into paid phones for the sake of being able to reach more voters when no one answers their phone anymore. It isn't texting at the expense of a face-to-face conversation.
Disclaimer: This document reflects the views of the author, not the DNC. The DNC was not provided with the underlying sourcing, interviews, or supporting data for many of the assertions contained herein and therefore cannot independently verify the claims presented. **
The Power of Personal Organizing
- Current Democratic strategies prioritize fiscal efficiency and incremental vote costs over genuine voter belief and engagement.
- Data-driven metrics often overlook the fundamental effectiveness of face-to-face contact in increasing voter turnout.
- Personal interaction humanizes politics, signaling the importance of participation through a volunteer's dedicated time.
- High-quality organizing relies on trained volunteers who can articulate a candidate's values as neighbors rather than strangers.
- Historical Democratic success was built on year-round coordination with labor, environmental, and faith-based community organizations.
- The shift toward reaching voters only in specific geographies during election cycles has weakened the party's deep-level engagement.
Face-to-face interaction makes politics come to life and helps voters to establish a personal connection with the electoral process.
78 Now, there are data showing response rates on doors are low, and it's less effective, or less efficient in terms of the allocation of a single dollar. These are the incorrect metrics for understanding how many people actually believe what Democrats are saying. Democrats will know they are winning in tough contests if voters are not engaged where they live their lives. The current analytics approach partially considers efficiency through a fiscal evaluation - how far can a campaign stretch a campaign dollar? Can leaders calculate the cost of an incremental vote? How many decimal points are needed to measure campaign effect? Data matters – a lot – but the efficiency approach ignores some pure fundamentals. As laid out by Donald P. Green and Alan S. Gerber in their classic study Get Out the Vote, “there no longer is any doubt that face-to-face contact with voters raises turnout,” both for the targeted voter and others within their household. “Face-to-face interaction makes politics come to life and helps voters to establish a personal connection with the electoral process. The canvasser’s willingness to devote time and energy signals the importance of participation in the electoral process. Many nonvoters need just a nudge to motivate them to vote. A personal invitation sometimes makes all the difference.”8 The power in quality organizing flows from a highly trained volunteer who believes in their candidate, and is therefore capable of expressing what the candidates' positions are, what their values are, and who they are as both potential leaders and as neighbors or colleagues or friends of the person who's having the conversation. This deep level of engagement is something the Democrats used to do at the scale of our politics. It is what catapulted Democrats to the White House and Governor’s Mansion, and the Senate, House, and offices across the ballot in states. Organizing wasn't done simply by Democratic campaigns showing up once every 2 years, 4 years, for the last 1-2 months of a cycle. It was done in close coordination with allies in the environmental space, with organized Labor, with pro-choice organizations. With local community organizations. With faith organizations. Democrats now have a politics and an organizing philosophy driven, in part by what is the most efficient way to reach voters only in the geographies needed to win. 8 Green, Donald P. and Gerber, Alan S., “Get Out the Vote – How to Increase Voter Turnout,” Fifth Edition, 2024 No data provided for this claim.
No sourcing provided for this claim.
Disclaimer: This document reflects the views of the author, not the DNC. The DNC was not provided with the underlying sourcing, interviews, or supporting data for many of the assertions contained herein and therefore cannot independently verify the claims presented. **
Campaign Resource Allocation Dilemma
- Modern Democratic campaigns have transitioned from a mindset of scarcity to raising billions of dollars, yet spending habits remain rooted in old models.
- A significant imbalance exists between media spending, which exceeded $1 billion, and field organizing, which received only about $150 million.
- The current strategy relies on late-cycle voter contact, asking for support for candidates with whom voters have no personal connection or prior engagement.
- The author argues that campaigns should utilize their massive resources to fund year-round organizing, voter registration, and professional development.
- There is a critical need for candidates and incumbents to maintain a constant presence in communities rather than appearing only during election cycles.
- The text concludes with a disclaimer that the DNC cannot verify the specific financial claims or data points provided by the author.
With comparatively low spending, the campaign ended up running the same playbook of showing up at the end of a cycle and asking people to support a candidate they had never met, will never meet, and in some cases had never heard of.
79 There used to be big debates and big fights within campaigns about how to allocate resources for media, for organizing, for all forms of voter contact, for the use of the candidate's time, for fundraising, for developing surrogates, for research and strategy development. In healthy campaigns, the answer to all those questions should be “yes,” because healthy campaigns should have the resources to do everything. Democrats have a proven ability to raise funds. The presidential campaign raised in excess of $2 billion through the Democratic National Committee, their Joint Fundraising Committees, and the Principal Campaign Committee. The House, Senate, and nonfederal campaigns raised billions more. With the explosion of campaign money, will Democrats continue to operate through old ways of thinking, driven mostly by strategies of scarcity, of limited resources? When Democrats operated under spending cap, there were tight budgets, where 20-30% of a program budget would be allocated to organizing, and 60-70% to media and mass communications. In the 2024 context, this would mean somewhere around S300 million being put into organizing. In speaking with campaign leadership, they estimated around $150 million was invested in voter contact through the coordinated campaign structures, which is simply too small a piece of the pie in a context where Democrats need greater levels of engagement. By comparison, the national campaign invested $1.04 billion in media expenditures through the DNC, campaign, and joint fundraising committees from 2023-2024. With comparatively low spending, the campaign ended up running the same playbook of showing up at the end of a cycle and asking people to support a candidate they had never met, will never meet, and in some cases had never heard of. Now it’s fair to question whether a national campaign could effectively spend $300 million on organizing – the answer should be again be “yes.” Grow capacity across the party, move money and program to more states and districts, register more voters, support more recruiting, training, and professional development for volunteers, staff, activists, surrogates, party leaders, and candidates. Leverage the funds (and time) to build to win. Due to these ongoing shortfalls, the pressing challenge is to get back into communities and presence candidates and incumbents to show the American people not only are Democrats on No sourcing provided for this claim. No source material or data provided. Unsourced claims cannot be independently verified.
Disclaimer: This document reflects the views of the author, not the DNC. The DNC was not provided with the underlying sourcing, interviews, or supporting data for many of the assertions contained herein and therefore cannot independently verify the claims presented. **
The Power of Two-Way Organizing
- Democrats must shift from one-way media messaging to direct, face-to-face organizing that invites voters to be part of a movement.
- Effective organizing requires two-way engagement to gather human intelligence and adjust strategies based on real-time voter feedback.
- The party lacks a shared taxonomy for defining 'quality' organizing and traditional field tactics like canvassing and voter education.
- Current Democratic strategy relies on 'dropping in' seasonal talent rather than empowering local community members to organize year-round.
- Republican-aligned groups like Turning Point USA maintain an 'always on' presence that Democrats must match to build long-term power.
It’s time to again ask voters for their help, for their opinions, and to offer them the ability to be a part of something bigger than a single election.
80 their side, Democrats are actually delivering for them. This is what many 2025 candidates did – proving it is both possible and necessary. Face-to-face organizing is why movement politics can be so powerful – leading through vision, and by pulling people in, rather than solely pushing information out. Instead, for too long Democrats have tried to negotiate with voters through the media without any meaningful level of direct interaction. It’s time to again ask voters for their help, for their opinions, and to offer them the ability to be a part of something bigger than a single election. People are ready, it’s up to Democratic leaders to meet them where they are. Doing this requires two-way engagement – one-way communications can deliver the message, but two-way engagement can demonstrate if its working, help drive decisions, and provide insights to make adjustments. Organizing and organizers are the key to this approach – the human capital and human intelligence to leverage modern tools and approaches to put people and their concerns first. How will Democrats define “quality” organizing? What is being measured, and what is being learned to adjust thinking and design across cycles to build to win and build to last. What does an organizer do? Is there even a shared taxonomy for organizing – for what “field” means, and within field, what do canvassing, or phone banking, or any of the traditional and emerging tactics look like? How do things like visibility, voter registration, voter education and other factors come into play? The party has to decide whether it will continue to rely on the tactic of dropping people into states as opposed to hiring locally. It’s easier (cheaper for some) to develop and “deploy” seasonal talent even if it puts Democrats in a situation where cycle after cycle, campaigns and parties have to find new people to go work the same turf, instead of teaching people within the community and funding and empowering them to organize their neighbors year-round. The Republicans do this differently. Turning Point USA is not a seasonal, churn and burn ecosystem. They run program around the calendar, and across the nation. The Koch-funded entities and other organizations started more than a decade ago, and remain in communities. These efforts are targeted to specific elements of the electorate, and generally remain “always on.” Democrats and allies must consider how to match and exceed these investments. No sourcing provided for this claim.
Disclaimer: This document reflects the views of the author, not the DNC. The DNC was not provided with the underlying sourcing, interviews, or supporting data for many of the assertions contained herein and therefore cannot independently verify the claims presented. **
Modernizing Democratic Organizing Strategy
- Republicans have successfully closed the ground-game gap by studying and emulating previous Democratic and Obama-era campaign innovations.
- Paid voter contact remains a vital supplement to organic organizing, particularly when deployed early to build long-term community relationships.
- A DNC internal review identified significant leadership and skill gaps that require standardized training and development for future cycles.
- Successful organizing outcomes are directly tied to positive workplace cultures, early investment, and the use of functional relational tools.
- The 2024 strategy focuses on building national coordinated teams and selecting unified relational data infrastructure by the second quarter of 2023.
The irony is many of these efforts were emulating what Democrats used to do.
81 The irony is many of these efforts were emulating what Democrats used to do. The Republicans studied and learned from their losses in 1998 and the 2000 outcome to launch their “72-hour program.” They were intrigued by the effort and outputs of America Coming Together in 2004. They were blown away by the innovation of the 2008 Obama campaign. They observed, and then planned, and then organized a ground game to counter what had been Democratic and Labor advantages. Paid Programming There are critics of paid programming and they miss the point. Yes, paid programming should be used as a supplement, not the foundation for direct voter contact. Quality canvassing or paid phones in turf - especially in hard-to-reach communities – will still have impact, especially if it is early enough in the calendar to engage and cultivate relationships and potentially build even more capacity for direct voter contact later in the calendar. Some donor advisors question the returns on paid voter contact – paid canvassing, phone banking, and texting – and have argued for limiting future investment in these tactics. Rather than debate those things through the lens of a controlled test, or the efficiency paradigm of an incremental vote, Democrats need to shift to a voter centered analysis. Quality programs work. If outside entities face challenges in funding, this previous cycle should demonstrate how limited or delayed resources impacted program quality, timing, and outcomes. Learning from the Work In the aftermath of the 2022 midterm election, key staff at the DNC conducted a review of organizing efforts in the cycle. They explored a range of inputs from organizers and volunteers as well as leadership within the organizing ecosystem to understand the impacts of midterm programming, and to identify opportunities for improvement. The report delivered seven findings and made five programmatic recommendations. DNC 2022 Volunteer & Voter Contact Program Analysis (2023) No sourcing provided for this claim. No source material or data provided. Unsourced claims cannot be independently verified.
Disclaimer: This document reflects the views of the author, not the DNC. The DNC was not provided with the underlying sourcing, interviews, or supporting data for many of the assertions contained herein and therefore cannot independently verify the claims presented. **
82 The takeaways included a need for training and development based on significant programmatic and leadership skill gaps; a strong recommendation for how Organizers can best use their time, how programs with early investment had higher outputs and growth over the cycle, the need to upgrade the tools required for relational organizing, how supporting volunteer leadership and in-person work improved outcomes, and how hiring and scaling was accelerated in positive working cultures. These insights cannot be taken for granted even if they may be obvious to some. Organizers need to trust and be valued by their own organization. Workflows accelerate and quality improves when everyone in the ecosystem knows their role and is supported. Tools have to work and support the work. Training and retraining optimizes quality and outcomes. Based on these takeaways, the DNC staff made five recommendations for actions in 2023 to prepare for the 2024 national election, with potential start dates, including: Q1 2023 - Build a national coordinated and organizing team to support early innovative program, leadership development, management training, and core skills training with the initial state staff and volunteer base. Q2 2023 - Choose a relational tool to build national and in-state relational program and data infrastructure, recruit volunteers, and escalate relational volunteer leaders.
Democratic Organizing and Funding Delays
- The report highlights a failure to implement 2023 recommendations for hiring senior and mid-level organizing staff on the proposed timeline.
- A lack of volunteer and activist interest in the campaign reportedly hampered early hiring and decision-making efforts.
- Democratic staffing for the 2024 cycle was significantly delayed, with some final state hires occurring only weeks before the election.
- The document contrasts the Republican 'always on' investment strategy with the Democratic 'always late' spending pattern.
- Late fundraising and restricted money flows forced organizations to scramble for engagement at the very end of the campaign cycle.
- The DNC explicitly disclaims the report's assertions, noting a lack of underlying sourcing, interviews, or verifiable data for the claims.
The 2024 cycle shows the inefficiencies of the current ecosystem and contrasts with how Republicans raise and invest across the calendar while Democrats spend at the end (“always on” versus “always late”).
Disclaimer: This document reflects the views of the author, not the DNC. The DNC was not provided with the underlying sourcing, interviews, or supporting data for many of the assertions contained herein and therefore cannot independently verify the claims presented. **
83 Q3 2023 - Hire CCDs, data directors, and organizing directors to customize relational and distributed programs to state and coalition needs. Q3 2023 - Hire lean, highly skilled organizing staff, and launch in-person Leadership Summits to integrate volunteers in Democratic county parties and clubs into state and national programs. Q4 2023 - Launch “Campaign Schools” across the country to start building cohorts for entry-level and mid-level roles. Each of these recommendations were designed to increase capacity and net more votes for 2024. The authors have argued they felt the recommendations were even more important given the relatively poor standing of President Biden, so it would require more time on task to generate capacity. Unfortunately, none of these recommendations were implemented on the proposed timeline, if at all. The authors of the report acknowledged how hiring and decision-making for organizing was impacted by the reality there was little volunteer or activist interest in the campaign. Hiring the senior staff in states began in the Spring of 2024, and lasted through August 2024. The final state staffing hires were made in October, only weeks prior to the election. Many of these findings and recommendations in the 2022 report hold true, and mirror what has been shared by allied organizations in their assessments of 2024 – the need for comprehensive assessments of training and professional development, the need to hire and retain entry and mid-level staff earlier in the cycle, and more experimentation and learning around relational organizing. The Democratic National Committee will convene urgent and actionable conversations with stakeholders in the organizing ecosystem to understand how reset around roles, lanes, and resources to maximize outputs and reclaim our primacy in organizing. No evidence or sourcing provided for this claim. / No evidence provided; contradicts public reporting and data. No sourcing or evidence provided for this claim.
Disclaimer: This document reflects the views of the author, not the DNC. The DNC was not provided with the underlying sourcing, interviews, or supporting data for many of the assertions contained herein and therefore cannot independently verify the claims presented. **
84 2024 Program Feedback The 2024 cycle shows the inefficiencies of the current ecosystem and contrasts with how Republicans raise and invest across the calendar while Democrats spend at the end (“always on” versus “always late”). In interviews with leaders across the ecosystem, there were consistent observations about the limitations placed on their programming based on how money moved (mostly late), and the types of money raised (restricted, etc.). Delayed fundraising delayed decision making, and left organizations across the ecosystem scrambling to engage at the close of the campaign. Democratic coordinated campaigns achieved significant volume of activity in 2024. The post-election assessment conducted shortly after the election demonstrates the ability to engage is there. The data also showed engagement needs to start far earlier in the cycle. Democratic Voter Engagement Attempts by Week (2024)
No sourcing or evidence provided for many claims in this section. No source material or data provided. Unsourced claims cannot be independently verified.
No evidence provided for this claim. Sourcing not provided.
Disclaimer: This document reflects the views of the author, not the DNC. The DNC was not provided with the underlying sourcing, interviews, or supporting data for many of the assertions contained herein and therefore cannot independently verify the claims presented. **
Funding Delays and Tactical Hurdles
- A massive surge in Democratic activity at the end of 2024 proved technical capacity but highlighted a failure in early-cycle engagement.
- Legal restrictions and a lack of specific 'flavors' of funding prevented allied organizations from starting voter persuasion until October.
- Labor-funded entities were more effective but still suffered from funding delays that hindered staff hiring and program scaling.
- The 'early money is like yeast' philosophy must be applied beyond candidates to the broader organizing and messaging ecosystem.
- Traditional voter contact methods like phone calls are facing cratering response rates and significant demographic response bias.
- Over-saturation of fundraising texts has created a suboptimal experience for voters, potentially damaging grassroots engagement.
Democrats have long known early money is like yeast – it helps the dough rise.
85 The chart above demonstrates the overwhelming surge of activity at the end of the 2024 cycle. This proves Democrats have the technical capacity and the tools to attempt to reach voters, and should serve as the foundation for understanding how to implement effort across the calendar moving forward. There were similar patterns of effort on the independent side. Because Democrats and allied organizations actually follow the law, even well-funded groups had to stay within their primary purpose, and lacked early resources to engage in voter persuasion. As a consequence, several key leaders in the voter engagement ecosystem said they could not engage in persuasion until the first week of October – after some states had started voting. The organizations were ready, and had the people, but did not have the right “flavor” of funding to engage as they intended. The entities funded by organized Labor fared better and ran very effective programs, but even these organizations could have used more funding. Historically, these organizations leverage contributions from other funders into their programs. In interviews, these groups shared how the delays in funding by other entities or donor tables prevented them from hiring staff in states as early as they would have preferred, delayed program ramps, and ultimately limited their ability to persuade early enough to shift to get out the vote efforts. Democrats have long known early money is like yeast – it helps the dough rise. This lesson has certainly been used by candidates to win nominations and general elections, but it needs to apply to organizing and messaging efforts across the ecosystem. With adequate and early funding, state parties and state tables, national committees and national organizations can better design and deliver the organizing capacities needed to win. Decision-makers need time. Time to evaluate program inputs, to make adjustments to scripts and content. To leverage candidate and surrogate time into engaging with the right voters in the right places. A Tactical Assessment From a tactical perspective, there was a lot of discussion about diminishing contact rates. Response rates on phones have cratered for voter research and direct voter contact. There are also anecdotal critiques about response bias among the voters who do answer their phones - who tend to be older and homeowners rather than younger and renters. Texting is a way to rapidly reach voters at enormous scale. One problem identified in interviews is how Democrats and organizations bombard voters and grassroots donors, with nonstop fundraising solicitations. By curating a suboptimal experience for the people being No evidence provided for many claims in this section.
Disclaimer: This document reflects the views of the author, not the DNC. The DNC was not provided with the underlying sourcing, interviews, or supporting data for many of the assertions contained herein and therefore cannot independently verify the claims presented. **
The Crisis of Voter Contact
- Over-reliance on bulk texting has led to voter frustration and a perception that the Democratic party primarily uses digital tools for fundraising rather than genuine engagement.
- Campaign strategists view texting as an effective tool for event logistics and fundraising but largely dismiss its utility for persuasion or deep organizing.
- Door-to-door canvassing has suffered a 'learning loss' due to the 2020 pandemic, which disrupted the development of new organizing talent and reduced overall program capacity.
- Despite declining response rates, door-to-door interaction remains significantly more effective than phone banking, yet it has not returned to its pre-pandemic share of the tactical mix.
- The 2024 cycle saw over 370 million contact attempts, but the dominance of low-response tactics like phones and texting raises questions about the efficiency of the current strategy.
What can and should be a two-way conversation becomes one-way delivery and a “STOP” message.
86 texted, it should surprise no one when many voters say “all the Democrats ever do is ask for money.” People constantly text with their family, friends, and colleagues. People will engage with people they know, but will ignore and be frustrated by stranger, or bulk texting. What can and should be a two-way conversation becomes one-way delivery and a “STOP” message. Strategists within the presidential campaign indicated they did not see texting as a form of organizing or an effective tool for persuasion. They did see its value in fundraising, in organizing for events, and driving event attendance. Prospectively, assuming these potentially effective actions are synced to organizing, texting retains a measure of value, but with emerging technical restrictions on texting, it will pale by comparison to more proven tactics as a way of persuasion or driving turnout among voters. Practitioners are also seeing a reduction in response rates in door-to-door canvassing, and attribute it in part to the learning loss from the limited organizing during the 2020 pandemic cycle. This forced many 2018 activists out of a normal, second organizing ecosystem, and prevented new talent from emerging in the organizing ecosystem. They believe these gaps in the organizing ecosystem limited the quality and capacity of 2024 canvass programming. Practitioners agree this can be countered through a commitment to training to help the ecosystem reclaim a greater measure of responsiveness in door-to-door canvassing and position Democrats to effectively engage communities. Even though response rates on doors have dropped, they are still significantly higher than those on phones. And while phones are less expensive, and therefore potentially more cost-efficient, Democrats can reach more people in communities directly and indirectly by leaving literature, by finding supporters and offering them lawn signs and other opportunities to display support. How Tech is Impacting Organizing The composition of Democratic organizing tactics has changed. While phone banking has long been the principal channel of engagement, door-to-door canvassing had generally comprised 20 to 25 percent of all voter contact attempts each cycle. The volume and share of door-to-door contact attempts cratered during the 2020 pandemic cycle, and it has not yet recovered to its pre-pandemic share. There is still a meaningful volume No source material or data provided. Unsourced claims cannot be independently verified.
No sourcing provided for many claims in this section.
Disclaimer: This document reflects the views of the author, not the DNC. The DNC was not provided with the underlying sourcing, interviews, or supporting data for many of the assertions contained herein and therefore cannot independently verify the claims presented. **
87 of door-to-door canvassing, but when low-response tactics like phones and texting dominate the share of attempts, Democrats should evaluate whether this is an effective tactical mix. Share of Voter Contact Attempts by Tactic (2024)
2024 Program Outputs In 2024, Democrats made a total of 370.7 million voter contact attempts, generating a total of 11.7 million contacts from 7,968,547 voters. Of these voters, 6,602,150 eventually voted, for an 82.9 percent turnout rate. 309.8 million of these attempts occurred within the battlegrounds,9 generating a total of 9.1 million contacts with 6.97 million voters. 9 Here, battlegrounds refer to the states of Arizona, Nevada, Georgia, North Carolina, Pennsylvania, Michigan, and Wisconsin, and the Maine-02 and Nebraska-02 Congressional Districts.
Sourcing not provided.
Disclaimer: This document reflects the views of the author, not the DNC. The DNC was not provided with the underlying sourcing, interviews, or supporting data for many of the assertions contained herein and therefore cannot independently verify the claims presented. **
88 2024 Coordinated Program Recap10
Battleground Voter Contact Efficiency
- Democrats identified support from 21.4 percent of the 32.5 million voters in battleground jurisdictions.
- Voters identified by the party showed a high engagement level with an average turnout rate of 72.2 percent.
- While door-to-door canvassing made up only 8.6 percent of contact attempts, it accounted for a massive 50 percent of all successful voter IDs.
- Phone calls and text messages dominated the volume of attempts at over 91 percent combined, but yielded significantly lower contact rates.
- The campaign relied heavily on low-contact digital tactics toward the end of the cycle due to time constraints, despite their inefficiency compared to physical outreach.
- The DNC issued a disclaimer stating they could not independently verify the underlying data or sourcing for these specific voter contact claims.
Despite constituting only 8.6 percent of contact attempts, door-to-door canvassing represented 50.0 percent of voter IDs.
32.5 million Americans voted in these battleground jurisdictions. By engaging 6.97 million people, this means Democrats contacted and identified support (ID’d) from 21.4 percent of the battleground electorate. Turnout among the voters ID’d by the party averaged 72.2 percent. Voter contact rates varied across tactics and states. The contact rate on doors was 17.1 percent across the battlegrounds, the phone contact rate was 2.2 percent, and the text contact rate was 0.8 percent. A text contact is not the delivery of the text message; it is when an outgoing text message generates a trackable and responsive reply (an indication of how the voter intends to vote). 2024 Voter Contact Rates by Tactic and State
10 ID Rate divides the Total People ID’d by the Vote Total – with the quotient being the percent of all voters who were ID’d by the Democratic Party. The Turnout of ID’d voters divides the count of ID’d People Who Voted by the Total People ID’d to generate a turnout percentage.
Sourcing not provided. Table appears to contain inaccuracies.
Inconsistent with data in chart.
Sourcing not provided.
Disclaimer: This document reflects the views of the author, not the DNC. The DNC was not provided with the underlying sourcing, interviews, or supporting data for many of the assertions contained herein and therefore cannot independently verify the claims presented. **
89 In most of the battleground turf, phone calls represented a majority of contact attempts, followed by text messages. Across the battlegrounds, 53.0 percent of voter contact attempts were made by phone, 38.4 percent by text message, and 8.6 percent by door-to-door canvassing. Share of Voter Contact Attempts by Tactic and State
The differing tactics applied in a given state connects to the variable nature of the demographic and geographic realities of each state and market. Some communities and cohorts are more walkable; some are easier to reach by phone. Overall, the battleground program heavily relied on tactics with low-contact rates to generate ID volume – the only option with limited time at the end of the campaign. Despite constituting only 8.6 percent of contact attempts, door-to-door canvassing represented 50.0 percent of voter IDs. Phone IDs represented 39.6 percent of voter IDs, and text messaging represented 10.4 percent of voter IDs.
Sourcing not provided.
Disclaimer: This document reflects the views of the author, not the DNC. The DNC was not provided with the underlying sourcing, interviews, or supporting data for many of the assertions contained herein and therefore cannot independently verify the claims presented. **
90 Share of Voter IDs by Tactic and State
The Challenges of Ground Operations
- Staffing shortages and onboarding delays significantly hindered the early implementation of state-level campaign programming.
- Door-to-door canvassing requires a long lead time for recruitment and training, making it less flexible than digital or phone outreach.
- Data shows that 72 percent of voter IDs were collected in the final month, often after voting had already commenced in battleground states.
- Late-cycle engagement risks alienating voters who perceive the party as only showing up when they need a vote.
- The author argues for a shift toward neighbor-to-neighbor organizing to move beyond a tool-defined ecosystem to a voter-centered one.
- Starting field operations earlier allows for geographic reach and the ability to make data-driven course corrections before the final stretch.
If Democrats instead continue to rely on ineffective tactics instead of thinking through ways to effectively organize communities so neighbors are talking to neighbors it is acquiescing to an ecosystem defined by its tools, as opposed to designing an effective ecosystem centered on voters.
These data reflect a significant volume of activity, but there were still program challenges. Leadership of the states program within the campaign indicated their programming was limited by staffing gaps. Throughout the spring, they found it difficult to find people willing to work on the campaign, and were not always able to hire staff on the planned schedule. They also reported challenges with onboarding – a process which got much smoother by the end of the campaign was at times a source of tension between the campaign and the party committees. As a consequence, staffing took months longer than expected to reach its full complement, and the delays impacted programming. While phones and texting can be quickly deployed, reaching people door-to-door requires time to build. Organizers and canvassers need to be recruited, onboarded, and trained, and it takes weeks to develop an effective rhythm in the many tasks associated with an effective canvassing operation. This impacted the ramp of door-to-door programs. The battlegrounds combined to generate 4.7 million contacts on the doors. There were one million IDs shortly after Labor Day, it took a little more than a month to cross two million, with a rapid accelleration at the end. The ramp is solid, yet 72 percent of the IDs were collected during last month of the campaign, when in most battlegrounds, voting had already begun.
No source material or data provided. Unsourced claims cannot be independently verified. Sourcing not provided.
Disclaimer: This document reflects the views of the author, not the DNC. The DNC was not provided with the underlying sourcing, interviews, or supporting data for many of the assertions contained herein and therefore cannot independently verify the claims presented. **
91 Battleground Door Contacts by Week (Cumulative)
There are some who argue direct voter contact should take place later in the cycle, when it has more of a chance to “stick.” This may be true for some campaigns, but for voters, this becomes yet another example of a national campaign and party showing up in the last month of an election and asking voters for their support. It was not late in every state. A few states banked IDs earlier in the cycle, providing the ability to adapt program and re-ID those voters over the course of the campaign. Share of IDs Over Time by State Data and science show face-to-face engagement works. Democrats therefore need greater effort in door-to-door canvassing and other forms of face-to-face engagement to earn support and tun out voters. If Democrats instead continue to rely on ineffective tactics instead of thinking through ways to effectively organize communities so neighbors are talking to neighbors it is acquiescing to an ecosystem defined by its tools, as opposed to designing an effective ecosystem centered on voters. This requires starting earlier and a dose of imagination. Starting earlier will provide more effective geographic reach and volume of engagement where voter feedback can provide insight for adjustments or course corrections.
Sourcing not provided.
Sourcing not provided.
Disclaimer: This document reflects the views of the author, not the DNC. The DNC was not provided with the underlying sourcing, interviews, or supporting data for many of the assertions contained herein and therefore cannot independently verify the claims presented. **
Building Early Campaign Infrastructure
- Direct engagement requires early investment in state-level teams to build high-performance cultures before the general election.
- Contested primaries often delay general election readiness due to the need for internal party healing and organizational transitions.
- The 2016 election serves as a warning, where a late nomination left the candidate with insufficient infrastructure just 104 days before the vote.
- The DNC aims to modernize coordinated campaigns so state parties can identify key voters regardless of when a nominee is finalized.
- Strategic staffing and sequence planning allow a nominee to layer onto an existing structure rather than building from scratch.
- The party faces a persistent failure in training and retaining human capital, which must be addressed to sustain long-term success.
This is exactly what occurred in 2016, when Secretary Clinton cinched the nomination in Philadelphia 104 days before the election and then discovered there was little infrastructure in place to help her win.
92 Committing to direct, person-to-person engagement also requires investing in people. State teams need time to build a high-performance culture capable of delivering with energy and urgency in the moments voters are making decisions. Backloading this work leaves little flexibility for Democrats to make the case, much less close the deal. Not every state or district can necessarily start early. Some states have primaries later in the calendar, complicating efforts to build out capacity for the entire ticket. Even after primaries, there are some instances where relationships need to be healed, and it is difficult to flip the switch from the primary to the general election. This played out in 2025. In Virginia, the gubernatorial nominee was uncontested, and was able to take control of the coordinated campaign after the filing deadline. In New Jersey, there was a contested (and heated primary) which required several weeks of careful politicking to bring the team together. The DGA and DNC provided critical leadership, technical support, and financing during the general elections, and while the Virginia coordinated program started earlier, by Election Day, both coordinated campaigns were firing on all cylinders. Democrats will have a rigorous, efficient, and fair nominating process for 2028, but it is entirely possible there it will be a protracted contest – perhaps finally resolving in a July convention. If this is the case, Democrats may have a nominee who needs to bring the party together, a staff and team exhausted by the process, and urgency in standing up a national campaign. This is exactly what occurred in 2016, when Secretary Clinton cinched the nomination in Philadelphia 104 days before the election and then discovered there was little infrastructure in place to help her win. This DNC will prepare for all eventualities, and this is why the Chair has called for a modernized coordinated campaign, where state parties can organize and convene partners to identify the right voters in the right places to win. Thinking ahead, planning ahead, and staffing in the right sequence will help prepare the party to support the nominee, and allow the nominee to layer an existing structure instead of having to hire from scratch. If the party reaches consensus on a nominee sooner in the calendar, all the better. Democrats will be prepared for any scenario. A National Commitment to Training To better plan and organize for the future, Democrats must overcome a persistent failure to effectively train, retain, and sustain human capital within the party. There are many people Timeline inaccurate; claims contradicted in public reporting.
Disclaimer: This document reflects the views of the author, not the DNC. The DNC was not provided with the underlying sourcing, interviews, or supporting data for many of the assertions contained herein and therefore cannot independently verify the claims presented. **
Revitalizing Democratic Organizing Infrastructure
- The 2020 pandemic caused significant 'learning loss' in political organizing due to the lack of in-person engagement and mentorship.
- Democratic leadership is proposing a National Training Institute to standardize professional development and career paths for political staff.
- Donors and strategists are urged to prioritize long-term investment in a skilled workforce rather than short-term cycle spending.
- Voter registration remains the foundational prerequisite for political power and determines the legitimacy of governance.
- The history of the American franchise is marked by a tension between constitutional expansion and violent suppression.
- The document emphasizes that 'people power' is the critical requirement for the strategy of organizing everywhere to win anywhere.
The expansion of access was not easy – and those who favored oppression and suppression resorted to violence, terror, and murder to prevent individuals and groups from being able to vote.
93 who love this country and want to make elections and politics a career, yet struggle to find opportunities where they can earn a consistent living, or receive sufficient professional development or advancement opportunities to make it worth their while. There's no denying the impact of COVID-19 on the 2020 cycle. Democrats engaged in very little in-person organizing, and it’s had a significant impact on the organizing ecosystem in terms of learning loss and a missed opportunity to engage entry-level staff and cultivate them for subsequent cycles. The Democratic Party and the broader family need a reset. The DNC is leading through the creation of a National Training Institute, the establishment of boot camps and training modules to drive engagement in communities across the country. The DNC will convene, and organize the organizers of training across the ecosystem to reach consensus on what effective modules should look like, who are the people who will be trained, and what needs to be designed and developed to support accountability measures and identify any gaps. Funders who want and expect quality need to invest in the people who will deliver the work. The strategists and donor advisors guiding program investments over the next two years should ensure there is a skilled and reskilled workforce ready to lead. If an operating premise is Democrats need to organize Everywhere to win Anywhere, people power is a critical prerequisite. Voter Registration Voter registration is a foundational element of organizing and administering elections. Voter registration affects who gets to vote, how candidates are chosen, and who ultimately governs. The constitutional approach to voter registration has evolved over time, with access to the franchise expanding over the centuries and decades. Constitutional amendments, court decisions, and legislation have expanded the franchise to women, non-White Americans, and younger voters. The expansion of access was not easy – and those who favored oppression and suppression resorted to violence, terror, and murder to prevent individuals and groups from being able to vote. No evidence or data provided for many claims in this section.
Disclaimer: This document reflects the views of the author, not the DNC. The DNC was not provided with the underlying sourcing, interviews, or supporting data for many of the assertions contained herein and therefore cannot independently verify the claims presented. **
Voter Suppression and Shifting Demographics
- The text argues that voting access is a hard-won right currently under threat from systematic suppression efforts and partisan rigging.
- Democrats view voting as the foundational freedom, while Republicans are characterized as feeling threatened by increased voter participation.
- Data shows a significant decline in Democratic enrollment share since 2008, particularly in Southern states like Kentucky and West Virginia.
- A generational shift is occurring where younger voters are increasingly registering as unaffiliated or independent compared to older, more partisan cohorts.
- The author contends that Democrats must prioritize universal registration and education to counter barriers and maintain electoral competitiveness.
The MAGA-organized insurrection on January 6, 2021 was only the first act.
94 Through the diligence and courage of patriots, abolitionists, progressives, clergy, organized Labor, and the blood and sacrifice of too many martyrs to the cause, access to voting is something many Americans now take for granted. Yet the entire nation now faces mounting efforts to purge voter rolls and suppress participation. Improving access to registration and to casting a ballot have long been priorities for Democrats. Democrats believe voting and freedom are directly linked to each other, and any restriction on voting is by design the first step in limiting other freedoms enjoyed by all Americans. The reverse is also true. Republicans feel threatened when voting increases, which is why they opposed the passage of the John Lewis Voting Rights Act, why radical federal courts are overturning voting protections, and why Republican state legislatures and governors passed significant restrictions on voter participation in the aftermath of the Trump defeat in 2020. The MAGA-organized insurrection on January 6, 2021 was only the first act. Voter suppression, the partisan rigging of congressional lines, and the unconstitutional deployment of military forces on American soil are unprecedented but intentional steps to trample American freedoms. If Democrats want to ensure elections exist – and then remain free and fair – Democrats need to make sure everyone can be registered to vote, can participate in the elections they want to, and then can vote for candidates of their choosing. This is important in states with partisan voter registration or nonpartisan voter registration alike. While evidence of suppression can be easier to see in states with partisan registration, Republicans are enacting and enforcing barriers across the nation. Democrats must respond. Historically, Democrats have benefitted from nonpartisan voter registration efforts. Democrats have long earned votes from younger Americans, women, and non-White voters. As more of these voters aged into the electorate, having entities support registration and provide voter education helped protect or expand partisan margins. At the time of Barack Obama’s election, there were seven jurisdictions with majority Democratic enrollment. In 2024, there were two: Maryland, and the District of Columbia. Democratic Enrollment Share (2008-2014)11 11 Official State Sources – Secretaries of State or other designated custodians of voter records. Data pulled in July, 2025.
Disclaimer: This document reflects the views of the author, not the DNC. The DNC was not provided with the underlying sourcing, interviews, or supporting data for many of the assertions contained herein and therefore cannot independently verify the claims presented. **
95 The greatest shifts were in three southern states: Kentucky, West Virginia, and Louisiana; where Kentucky went from 57.2 percent Democratic in 2008 to 43.5 percent in 2024, West Virginia went from 56.5 percent to 31.1 percent, and Louisiana went from 52.9 percent to 38.4 percent. These states had traditionally been Democratic, and while some people switched their registration, the magnitude of the shift may be attributed to older legacy Democratic voters transitioning, and their younger “replacements” registering as Republicans, in third parties, or as unaffiliated voters. This pattern of lower partisanship among younger cohorts is a common feature of American politics, persisting over time, and across parties. In every region of the nation, a plurality of younger voters register as unaffiliated or independent, and become more partisan as they age. The charts below are select states with partisan registration, parsed by region, party, and age. In each instance, the youngest voters are the least partisan. The Democratic and Republican shares each of age cohort increase over time, with the most partisanship among seniors. Regional Enrollment Shares by Party and Age (2025)
Sourcing not provided for the following charts.
The Voter Registration Mandate
- The author argues against the belief that Democrats should abandon voter registration due to shrinking margins among young and non-White voters.
- The 'Rising American Electorate' is projected to eventually become the dominant electorate, making long-term registration efforts a strategic necessity.
- A lack of funding and prioritization from national campaigns has hindered the effectiveness of voter registration organizations in recent cycles.
- Republicans have made registration a priority, and the author insists Democrats must adopt an 'always on' approach to remain competitive.
- Historical successes in Nevada, Georgia, and Arizona are cited as proof that multi-year investments in registration can flip key states.
Failing to plan is planning to fail.
Disclaimer: This document reflects the views of the author, not the DNC. The DNC was not provided with the underlying sourcing, interviews, or supporting data for many of the assertions contained herein and therefore cannot independently verify the claims presented. **
96 There are some advisors and commentators who believe Democrats can no longer count on the so-called Rising American Electorate of young and non-White voters to lift Democrats to victory. They therefore argue against voter registration because they feel it could actually bring more non-Democrats into the franchise. Please reconsider. First, the Rising American Electorate will one day be The Electorate. Failing to plan is planning to fail. Second, while there were definitive shortfalls among most of these cohorts in support for the national campaign, the 2025 elections showed how quickly voters will change their support based on information and experience. The gains and improvements in support by Democrats across the nation in 2025 special and general elections are a positive sign – working to cement and expand those gains is the work Democratic candidates and incumbents must demand their campaigns and party committees lead. There are also critics of the organizations leading voter registration who point to the shrinking partisan margins and states as proof the organizations have not me the moment. Interviews with these organizations surfaced how voter registration efforts were not identified as a priority by the national campaign, so they found it difficult to raise funds to effectively field their programs and generate new registrations. Registration is a priority for Republicans, and it must again be so for Democrats. The Democratic Party, through the DNC, Association of State Democratic Committee, and the State Parties will work to register voters on the hard side.
No source material or data provided. Unsourced claims cannot be independently verified.
No source material or data provided. Unsourced claims cannot be independently verified. No source material or data provided. Unsourced claims cannot be independently verified.
Disclaimer: This document reflects the views of the author, not the DNC. The DNC was not provided with the underlying sourcing, interviews, or supporting data for many of the assertions contained herein and therefore cannot independently verify the claims presented. **
97 Every state party has been participating in organizational reviews with the DNC and ASDC, and will identify voter registration goals as part of their strategic planning processes. Voter registration will be an essential goal for every coordinated campaign, and an early and ongoing measurement of progress and growth. The broader ecosystem needs an “always on” approach to voter registration. Nevada first flipped after years of investment in registration. Georgia and Arizona flipped because of years of organizing and registration by funded in-state groups and the party. There are proven best practices and proven organizations ready to the do the work – they need the resources to get started.
Disclaimer: This document reflects the views of the author, not the DNC. The DNC was not provided with the underlying sourcing, interviews, or supporting data for many of the assertions contained herein and therefore cannot independently verify the claims presented. **
Modernizing Democratic Political Technology
- Technology serves as a critical building block for dictating terms of engagement in a real-time, always-on media environment.
- The party must navigate a fractured ecosystem of streaming, mobile, and social media to counter sophisticated conservative messaging.
- Traditional analog methods like phone calls are no longer sufficient for the micro-level analysis required for adaptive modern campaigns.
- Democrats face the challenge of centering the human element in politics while leveraging cutting-edge technological infrastructure.
- The 2012 Obama/Biden campaign set a high-water mark for data analytics that the party must now evolve beyond to remain competitive.
- Technological advancement is framed as a necessary defense against rising authoritarian politics and right-wing extremism.
In these digital times, however, analog methods fail to provide the micro-level analysis necessary to shape adaptive campaigns capable of winning anywhere.
98 STATE OF TECHNOLOGY & DATA Technology by itself is not enough to win elections, but in this always-on, real-time environment it can be a critical building block to dictate the terms of engagement and drive the relationships needed to make or break critical messaging campaigns. Having the proper political technology in place will allow the party to break through the noise and counter messages from an increasingly sophisticated conservative media ecosystem focused on sowing discord and apathy among priority voters, increasing its relational presence and taking the DNC to new heights for the next ten years and beyond. Political decision-makers have to contend with a vast, fractured media ecosystem made up of streaming content, mobile devices, an ever-increasing number of social media applications and networking spaces, and find ways to center the human element in politics while leveraging the power of a cutting-edge technological infrastructure. It is no secret technology changes faster than politics, and Democrats must keep up. In the past, there were only a few communication channels open to campaigns, and voters were easy to target. Voters picked up the phones when you called them, and it was easy to determine what they were thinking, what they wanted to see from their elected officials, and how likely they were to vote. In these digital times, however, analog methods fail to provide the micro-level analysis necessary to shape adaptive campaigns capable of winning anywhere. Focusing on the digital and technological infrastructure needed to support the hard work done by the boots on the ground, and understanding where improvements need to be made to remain competitive for 2026 and beyond is essential. Democrats must simultaneously work to shore up our own capacity and counter rising authoritarian politics and right-wing extremism. This section assesses the evolution of the technological capabilities and structures of the Democratic Party, identifies where innovation is needed, and lays out a path for how the party must again advance to meet the challenges inherent in targeting and engaging a shifting electorate constantly influenced and informed in a rapidly changing information environment. 2012 Election Cycle The 2012 Democratic National Committee and the Obama/Biden campaign were celebrated for their sophisticated use of technology and data analytics, particularly when compared to what the RNC was able to do for Mitt Romney and Paul Ryan. It was during the 2012 election cycle that No sourcing provided for many claims in this section.
Disclaimer: This document reflects the views of the author, not the DNC. The DNC was not provided with the underlying sourcing, interviews, or supporting data for many of the assertions contained herein and therefore cannot independently verify the claims presented. **
The Rise of Vertica
- The DNC implemented Vertica to centralize 180 million voter files with donor and volunteer data into a single high-performance repository.
- Advanced algorithms allowed the Obama/Biden campaign to 'micro-listen' to voters and test message effectiveness across narrow demographic groups.
- Data-driven scoring models directed volunteers to specific doors with tailored scripts to maximize the probability of persuasion.
- The system created a feedback loop where every interaction refined the models to better identify and target potential Democratic voters.
- While the DNC modernized, the Republican data infrastructure remained fragmented and prone to catastrophic failure during critical election windows.
- Despite its initial success as a 'quantum leap' in microtargeting, the long-term sustainability of the Vertica-based system was later called into question.
With these new capabilities, the Obama/Biden campaign was able to “micro-listen” to what voters were saying/doing, and test the effectiveness of messages aimed at narrow demographic groups.
99 the DNC first acquired a license for Vertica, a high-performance analytics software that enabled the party to centralize its volunteer and donor data, but also to access and analyze a 180-million-person voter file. A state-of-the-art system at the time, Vertica served as the party’s central data repository, the digital warehouse containing every state’s voter file, every commercially available voter data point, and internally, the results of every door visited by canvassers on and every phone call made by volunteers. This data was combined with information generated from social media, campaign interactions, and online user activity to reveal voter tendencies in a way never before envisioned. With these new capabilities, the Obama/Biden campaign was able to “micro-listen” to what voters were saying/doing, and test the effectiveness of messages aimed at narrow demographic groups. Algorithms integrated into Vertica could look for patterns embedded in the data and develop scores to place voters into particular groups to identify how much attention needed to be paid to them and which channels of communication were mostly likely to make significant inroads. The effects of these microtargeting models was most evident in the way it directed volunteers to target particular voters over the phone or at their doors, and provided guidance on which script was likely to maximize the impact of the message. The results of voter interaction helped refine those models, increasingly identifying the next likely voter who could be persuaded to vote and vote Blue. In contrast, Republican data repositories were so slow that they could not respond to changing news cycles, and were so fragmented and antiquated they could not handle the traffic from its own volunteers, crashing so completely on Election Day staffers thought they had been the victim of a cyberattack. Before Vertica, the DNC had no central repository of data, and lagged when it came to identifying the chorus of voters and the song they sang in any election cycle. Knowledge about voters was stored separately from data about campaign interactions, because those databases were developed by different teams who had little interest in making their systems compatible. Vertica represented a quantum leap forward in terms of targeted outreach and advertising on a granular level. While it convinced some in the party they had their system of the future, it was not a success built to last. No sourcing or evidence provided for this claim; contradicts public reporting. Sourcing not provided. No evidence provided for this claim; contradicts public reporting.
Disclaimer: This document reflects the views of the author, not the DNC. The DNC was not provided with the underlying sourcing, interviews, or supporting data for many of the assertions contained herein and therefore cannot independently verify the claims presented. **
The Cost of Digital Stagnation
- Following the 2012 election, Republicans successfully reverse-engineered the Obama campaign's digital strategies to modernize their own infrastructure.
- Democrats failed to institutionalize their 2012 technological advantage, leading to decaying data assets and an outdated system by 2016.
- The Vertica data system became a liability, suffering from frequent crashes and an inability to handle the scale of modern campaign analytics.
- Technological failures prevented the Clinton campaign from identifying critical shifts in voting patterns among key demographic groups in blue regions.
- The lack of continuous investment in data infrastructure resulted in what Hillary Clinton described as mediocre or nonexistent data during her run.
Interviews with various campaign staffers detailed how the system was known for crashing upwards of 16 hours at a time.
100 While Democrats were content enjoying the 2012 victory and celebrating what got them there, Republicans went back to the drawing board to learn from their losses. Instead of trying to revolutionize their own system, Republican analysts looked at where the Obama campaign spent its attention and resources, and worked to reverse-engineer the reasoning behind those decisions. Eventually, they were able to surpass Democratic efforts and reinvented the process by which Republicans approached digital media, to great effect for future campaigns. 2016 and 2020 In the wake of the unprecedented and largely unforeseen forces leading Trump’s election in 2016, the party had to reckon with the roles played by decaying data assets and an increasingly outdated technological infrastructure in its failure to elect Hillary Clinton. Despite the significant, forward-thinking investments made to advance data-driven campaigning for the 2012 election, an unfortunate decision to rest on the laurels of success instead of institutionalizing their advantage led to significant under-investments in upgrading and maintaining the system. This decision compounded the inability of Democrats nationwide to identify the specific micro-groups of likely and potential voters who could be persuaded to vote for Democrats across the ticket. Vertica played a central role in the strategic decisions made in the 2012 election, but an inability to commit to continuous improvement validated the old adage about technological progression: if you are not on the train, you will be left at the station. Reflecting on the 2016 campaign, Hillary Clinton believed the system she inherited campaign produced “mediocre to poor, nonexistent, wrong” data.[i] In 2016, Vertica was already too old and too strained to handle the amount of data it held and the analyses it was being used to conduct. Interviews with various campaign staffers detailed how the system was known for crashing upwards of 16 hours at a time[ii].” Vertica, the centerpiece of DNC data analysis, was an archaic tool being used beyond its designed capabilities. It was not a system built to last indefinitely or designed to be used by the number of individuals and entities who were accessing it. Party leaders and state-level decision makers were therefore not tuned into changes in voting patterns by age, gender, race, and state. Shifts in reliably blue regions were undetectable until it No sourcing provided for this claim.
No sourcing provided for this claim.
Disclaimer: This document reflects the views of the author, not the DNC. The DNC was not provided with the underlying sourcing, interviews, or supporting data for many of the assertions contained herein and therefore cannot independently verify the claims presented. **
Rebuilding the Democratic Data Machine
- The 2016 failure was attributed to an unwieldy data system that missed micro-dissents in key Blue Wall states.
- The DNC transitioned from the outdated Vertica system to Google’s BigQuery to handle petabyte-scale analysis.
- New infrastructure allowed for legal data sharing between the party and affiliates, mirroring a successful Republican model.
- The Bloomberg-backed firm Hawkfish was established to counter GOP digital advantages and test strategies in local races.
- Technological shifts were credited with narrow Democratic victories in traditionally Republican strongholds like Kentucky.
- The document serves as an internal critique, noting that the DNC could not independently verify all claims made by the author.
It was essential to catch up to the times and ensure Democrats were on the train and not left at the station once again.
101 was too late, leading to under-investment in areas needing financial and operative injections to maintain the Blue Wall. The abandonment of a microtargeting and micro-listening approach left wide swaths of potential voters under-motivated to vote for Democrats, and in many cases, to vote at all. Some observers consider this a significant reason why Clinton did not spend meaningful time engaging voters in Pennsylvania, Michigan, Wisconsin, and other historically Democratic states because the shifts were invisible in a system too bulky and unwieldy to hear micro-dissents and objections. In the aftermath of 2016, the DNC recognized Vertica’s limitations. It was essential to catch up to the times and ensure Democrats were on the train and not left at the station once again. This time, the Warehouse was scaled up to ensure the people who needed access to voting data could get it when they needed it, and simple queries would not crash the system for hours at a time. Thus began the construction of a new Data Warehouse backed by Google’s BigQuery, a tool capable of petabyte-scale analysis that could unlock insights previously unreachable with existing tools and hardware. Using BigQuery was another massive leap forward. It allowed for the party and its affiliated groups to share data without running afoul of campaign finance laws, based on the advanced Republican model many believe provided Donald Trump with an advantage in the 2016 election by providing data beyond what the RNC could reasonably capture on its own. Redeveloping such a system had been previously impossible for Democrats relying on the outdated Vertica system, despite Democrats being the originators of the approach. 2020 Innovation As part of the 2019 nominating process, the Bloomberg campaign helped found Hawkfish in early 2019 in order to combat the digital advances made by Republicans and the MAGA strategists in charge of President Trump’s campaign. Ostensibly founded to provide a technological edge to his own presidential campaign, Hawkfish also began working on races in Virginia and Kentucky, where Democrats picked up down ballot wins. In November 2019, Andy Beshear narrowly defeated Republican Matt Brevin to take control of Kentucky, a state where Trump’s 2016 margin of victory was just under 30 percentage points. One key to this victory was leveraging technology No sourcing or evidence provided for this claim.
Source not provided. Per public reporting, the firm was founded by Bloomberg prior to his campaign's launch.
Disclaimer: This document reflects the views of the author, not the DNC. The DNC was not provided with the underlying sourcing, interviews, or supporting data for many of the assertions contained herein and therefore cannot independently verify the claims presented. **
Data-Driven Political Innovation
- Michael Bloomberg founded Hawkfish to bridge the digital content and analytics gap between the Democratic party and the GOP.
- The success of modern campaigns relies on mastering the digital medium to target micro-communities with energized content.
- Hawkfish serves as a cautionary tale where innovation is often discarded if it does not produce immediate electoral victories.
- The GOP's 2024 success is attributed to leveraging data-driven strategies and social media amplification more effectively than their rivals.
- The DNC developed a best-in-class data warehouse named Phoenix to modernize technological toolkits for Democratic campaigns.
- The text highlights a growing tension where political decision-making is now inseparable from deep data analysis.
Hawkfish is a cautionary tale about innovation. Win and you’re in, lose and you’re out.
102 to determine what was most important to Kentucky voters, and showing them how Beshear’s platform most aligned with their needs and interests. Hawkfish was initially founded to be a premier digital agency and technology services provider, specializing in “digital ad services, including content creation, ad placement, and analytics” for Democratic contenders in various races12. Bloomberg founded the company after realizing how President Trump and the GOP were better at creating content and using it as calls to action than any entity in the Democratic ecosystem. What Bloomberg knew, and what the party needs to accept, is that the only way to position the party for future wins is to master the digital medium, targeting the right groups and sharing the kind of compelling content to keep them awake, energized and excited about the future. Now Bloomberg was unsuccessful in winning the nomination, and while Hawkfish continued to work in the 2020 cycle, it was officially shut down in Spring 2021. Hawkfish is a cautionary tale about innovation. Win and you’re in, lose and you’re out. And sometimes the ideas persist, sometimes innovation leaves, and other times there is no growth. More than ever, decision-making in politics is guided by data. The ability to identify and engage with micro-communities of voters, deriving insights about their preferences and priorities, is a key to modern campaigns. Data and politics are increasingly intertwined and inseparable from one another. Today’s political campaigns and voter mobilization efforts are essentially data-driven efforts. Voters, candidates and elected officials rely on data analysis to shape their communities on the local, regional and national level. The GOP’s victory in 2024 largely came down to its ability to learn more from President Obama’s victory than Democrats did. The GOP’s campaign was powered by data, amplified by social media, and enabled by ardent supporters at every level. 2024 Election Despite the end result in 2024, the technological shift could be seen. Thanks to the donors who provided the seed money for system modernization and capital improvements, the DNC began to work with flexible and powerful technological toolkits. As a result of this latest investment, campaigns had access to a best-in-class data warehouse, codenamed Phoenix, powered by 12https://www.cnbc.com/2019/12/23/mike-bloomberg-campaign-uses-tech-firm-he-founded-earlier-this-year.html No sourcing or evidence provided for this claim.
No evidence provided; contradicts claims elsewhere in report. Material in this section repurposed from previously published material from the DNC Tech department. Analysis not supported by source material.
Disclaimer: This document reflects the views of the author, not the DNC. The DNC was not provided with the underlying sourcing, interviews, or supporting data for many of the assertions contained herein and therefore cannot independently verify the claims presented. **
Modernizing Democratic Data Infrastructure
- The DNC overhauled its voter file processing to handle over 900 distinct updates, ensuring a precise view of the national electorate.
- A proprietary matching algorithm tracked 50 million records of voters moving between states, preserving historical data on demographics and support.
- New absentee and early vote (AV/EV) tools processed 10,000 data files in 2024, doubling the volume from 2020 to power ballot chase programs.
- Strategic investments in cell phone data tools expanded the DNC's targeting reach from 30% to 86% of all registered voters.
- The 'Phoenix' infrastructure allowed the Harris campaign to focus on high-level strategy rather than technical data management.
- Total voter contact attempts across the 2024 cycle reached nearly one billion individual data points, shifting from digital outreach to door-to-door canvassing.
It also includes a multi-million dollar investment in cell phone tools that took the DNC from being able to target 30% of registered voters to 86% by the end of the 2024 election cycle.
103 robust data about the American electorate and state-of-the-art tooling to turn that data into actionable insights. Up through the 2024 election cycle, the specific work included: ● Modernizing our voter file processing infrastructure, which enabled the processing of more than 900 distinct voter file updates collected in partnership with state parties to ensure we have the clearest view of who is eligible to vote in every state; ● Doubling down on our investment in a unique internal algorithm for matching registration records as voters move between and within states, identifying more than 50 million records from moved or re-registered voters, allowing us to carry historical demographic, vote history, and support data with voters over time; ● Building custom tooling for ingesting absentee and early vote (AV/EV) data, giving campaigns a daily-updating view of every voter with a ballot in hand, successfully returned, or rejected around the country – powering critical ballot chase and cure programs in the final stretch. In 2024, the DNC AV/EV tool processed more than 10,000 data files – more than double our processing volume from 2020; ● Augmenting our understanding of voters with a powerful set of models leveraging decades of accumulated data to help campaigns understand who is likely to support their candidates, turn out to vote or to volunteer, be motivated about specific issues, and more; ● Strengthening our collaboration with the Democratic Data Exchange (DDx), which in the 2024 cycle provided hundreds of millions of data points to hard-side campaigns on the activities of outside groups, improving the targeting and efficiency of our programs up and down the ballot; ● Providing IWillVote.com as a premier resource for voter education information, including where and how to vote in every state. In addition to providing this information to millions of voters who visited IWillVote.com in the final weeks of the election, we launched a historic partnership program – “Powered by I Will Vote” – which facilitated the display of the I Will Vote data directly on partner websites and tools, and; ● Ensuring campaigns had the data they needed to reach voters where they were. This includes a revamped process for mapping addresses that led to the addition of six million new addresses to our file, and providing a 10% increase in Tribal canvassable voters and an 11% increase in rural canvassable voters. It also includes a multi-million dollar investment in cell phone tools that took the DNC from being able to target 30% of registered voters to 86% by the end of the 2024 election cycle.
Disclaimer: This document reflects the views of the author, not the DNC. The DNC was not provided with the underlying sourcing, interviews, or supporting data for many of the assertions contained herein and therefore cannot independently verify the claims presented. **
104 As a result of these investments, the Biden, and then Harris, campaigns were able to operate entirely on top of a DNC-built data infrastructure. This didn’t replace critical functions of the campaign – far from it, it enabled the campaign to spend less time thinking about infrastructure and more time thinking about central strategic questions around resource allocation, targeting, and how to efficiently reach and engage with voters. Contact Attempts An analysis of contact attempts through the 2024 election cycle shows how necessary the upgrade to Phoenix was in advancing the mission, vision, and values of the Democratic Party. In terms of overall contact attempts, there were just under one billion individual data points to track, beginning with a high volume of text and phone calls, which were eventually overtaken by a shift to door-to-door canvassing.
(Chart from DDx 2024 After-Action Report, and includes both soft and hard side contact attempts.)
The Phoenix Data Infrastructure
- The Phoenix system processed nearly 1 billion outreach attempts, resulting in 53 million successful contacts during the 2024 cycle.
- Data infrastructure allowed for state-by-state analysis to determine which contact methods were most effective in shifting voter behavior.
- Sophisticated behavioral models were developed using the data, though the insights often arrived too late to alter the 2024 election outcome.
- The platform supported down-ballot successes and narrow Senate victories despite a global climate of anti-incumbent sentiment.
- Thousands of analysts and engineers across hundreds of committees utilized the centralized data to drive strategic decision-making.
By looking at the mix of types of attempts made versus polling data and the eventual outcomes in voting patterns in that state, analysts were able to develop increasingly sophisticated models of voter behavior, though much of this information arrived too late to change the 2024 outcome.
Disclaimer: This document reflects the views of the author, not the DNC. The DNC was not provided with the underlying sourcing, interviews, or supporting data for many of the assertions contained herein and therefore cannot independently verify the claims presented. **
105 These nearly 1 billion text, phone, walk, mail, and relational attempts resulted in almost 53 million successful contacts across the entire progressive ecosystem during the 2024 General Election Cycle, making the Phoenix system a vital component of the electoral analysis that shaped daily and weekly strategic decisions. The infrastructure in use at the time also allowed for an analysis of what was most effective from state-to-state, as seen below. By looking at the mix of types of attempts made versus polling data and the eventual outcomes in voting patterns in that state, analysts were able to develop increasingly sophisticated models of voter behavior, though much of this information arrived too late to change the 2024 outcome.
(Table from DDx 2024 After-Action Report, and includes both soft and hard side contact attempts.) This same infrastructure was also available to every state party in the country, to Senate campaigns that pulled out narrow victories, and to campaigns up and down the ballot that leveraged data to run winning programs in the face of significant domestic and global anti-incumbent headwinds. Phoenix has now been directly used by thousands of campaign analysts, data scientists, and engineers representing hundreds of campaigns and committees. The data generated and maintained in our infrastructure was simultaneously available to every
Disclaimer: This document reflects the views of the author, not the DNC. The DNC was not provided with the underlying sourcing, interviews, or supporting data for many of the assertions contained herein and therefore cannot independently verify the claims presented. **
Data Insights and Cyber Defense
- The Phoenix data warehouse revealed that while text messaging had the highest volume of attempts, door-to-door canvassing remained the most effective method for voter contact.
- Technical data suggests that future elections will be decided on 'American welcome mats,' indicating that physical outreach offers the highest return on investment for donors.
- Despite massive online reach, the Democratic party struggled to connect with young voters and key demographics within their primary social ecosystems.
- The centralized nature of Phoenix makes it a high-value target for state-sponsored hackers, necessitating advanced cybersecurity measures to prevent a repeat of 2016.
- During the 2024 election week, the DNC successfully repelled over 6.1 billion malicious cyber requests, a massive spike compared to previous months.
The technical data supports the theory that future election cycles may just well be decided on American welcome mats, suggesting that continued use of donor dollars in this direction generates the highest return on investment.
106 Democratic campaign staffer and volunteer around the country who knocked on doors or made phone calls around the country this cycle – with the results of their outreach coming back into Phoenix for the benefit of future campaigns. What Phoenix allowed analysts to understand is that while the mode of raw attempts was text messaging, with almost 420 million texts sent, the mode of successful contacts with voters was door-to-door canvassing, with just under 24 million total conversations had on doorsteps nationwide. The technical data supports the theory that future election cycles may just well be decided on American welcome mats, suggesting that continued use of donor dollars in this direction generates the highest return on investment. This will continue being the case with demographics that failed to be reached in the last election. It has been pointed out by many that if the election were decided by voters under 30, that Kamala Harris would be President. Yet despite reaching voters online at a scale never before seen, the party still missed opportunities to connect with young voters and voters in key demographics because we failed to meet these voters in the ecosystems where they spend the majority of their time and where narratives are built. Election Integrity Any assessment of the state of technology in the Democratic party would be incomplete without an acknowledgement that comprehensive data warehouses like Phoenix represent an irresistible target for hackers and other bad actors seeking to undermine the integrity of the modern political process. The mere existence of the kind of data collected and analyzed by the party requires sophisticated protective efforts to rebuff the kinds of cyber attacks experienced by the party in 2015 and 2016, when various groups of Russian-sponsored computer hackers and intelligence agencies infiltrated the DNC computer network to aid in Donald Trump’s ascent to the presidency. In the lead-up to the 2024 campaign cycle, a persistent concern was that more Russian operatives or nation-state actors would again attempt a cyberattack on Democratic resources. These concerns were warranted as data reveals that there were widespread cyberattacks in 2024. However, because of a commitment to deploying robust and advanced protection tools to safeguard the data, the DNC and its vendors repelled over 6.1 billion malicious requests between October 31st and November 6th, more than double the volume seen during the entire months of September and October. 2025 and Beyond No evidence or sourcing provided for this claim.
Disclaimer: This document reflects the views of the author, not the DNC. The DNC was not provided with the underlying sourcing, interviews, or supporting data for many of the assertions contained herein and therefore cannot independently verify the claims presented. **
The Fragility of Political Infrastructure
- The 2024 election cycle demonstrated that optimized tech infrastructure can successfully drive voter mobilization and persuasive messaging.
- A near-collapse of the NGP VAN database in 2024 threatened to revert modern campaigning to 1970s-era pen and paper methods.
- DNC engineers and donors were forced to implement an emergency workaround to prevent the loss of critical voter data and models.
- The crisis exposed the risks of overreliance on a single CRM system for the entire Democratic and progressive ecosystem.
- The DNC has issued a Request For Proposal to develop next-generation tools that prioritize user experience for ground-level organizers.
- Future political success depends on building a technological foundation that is flexible, adaptable, and capable of handling massive data loads.
If VAN had collapsed, the entire get-out-the-vote operation might have transitioned to one familiar with strategists in the 1970s and 80s, with canvassers working with pen and paper instead of smartphones and tablets.
107 Overall, what 2024 showed us is that our tech infrastructure finally began to work as it was intended. Campaigns were able to optimize their persuasive messaging and increase their voter mobilization efforts. Even more recently, Democratic wins in governor and mayoral races nationwide showed that when innovation is paired with investment and consistency, success is possible. Candidates were able to craft and deliver persuasive messaging, injecting them directly into the ecosystems where these voters spend the majority of their time and are open to being persuaded and engaged. Yet, there is still work to be done. In March 2025, the New York Times reported on problems with NGP VAN, the database that most Democratic and progressive campaigns and organizations have relied on for years. Problems with the database were so severe during the 2024 election cycle that leaders in the party staged an “extraordinary intervention[iii]” to keep the system, and the election, up and running. In early 2024, NGP VAN warned Democratic groups that it could not continue to successfully handle the petabytes of data that were routinely being downloaded to and uploaded from its servers. If VAN had collapsed, the entire get-out-the-vote operation might have transitioned to one familiar with strategists in the 1970s and 80s, with canvassers working with pen and paper instead of smartphones and tablets, effectively unable to determine which doors would yield the highest likelihood of a successful conversion. Thankfully, DNC engineers, with the assistance of devoted donors, were able to fund and operate an emergency workaround that maintained the accessibility of critical data and models. Top Democrats made addressing this issue a priority and agreed that this could not continue to be an item of discussion every four years. This is why Ken’s vision for the future includes one where cutting-edge technological tools lie at the very foundation of the modern political process, especially technology that “centers the user experience of organizers and volunteers,” who work at the ground floors of the campaigns and need to have up-to-date date on trends and changes in order to run flexible and adaptable campaigns capable of delivering on the promises set by the future faces and leaders of the party. The reliability issues with NGP VAN raised concerns about an overreliance on a single CRM, and sparked an exploration of an alternative that could refine the party’s relational messaging and strategy while handling the increased technological demands of the tens of millions of data points contained within it. This past spring, the DNC issued a Request For Proposal focused on identifying “the tools and technologies that will power the next generation of organizing at the DNC and at every level of the ballot around the country.” In a world where online and offline information continues to No sourcing provided for these claims. Sourcing for quote not provided.
Disclaimer: This document reflects the views of the author, not the DNC. The DNC was not provided with the underlying sourcing, interviews, or supporting data for many of the assertions contained herein and therefore cannot independently verify the claims presented. **
Modernizing Democratic Campaign Infrastructure
- The DNC must integrate influencer engagement, relational organizing, and digital media into a single, cohesive executive strategy.
- Data sharing standards must be nationalized to prevent local campaign data from becoming stagnant between election cycles.
- Technology should prioritize authentic person-to-person communication and resonant messaging over technical novelty.
- The party must institutionalize technological advantages by constantly re-evaluating vendor relationships and system redundancies.
- Infrastructure requires continuous investment to prevent 'technological marvels' from becoming obsolete within a single four-year cycle.
If we have learned anything from the past few election cycles, it is that today’s technological marvel can become tomorrow’s antique faster than we can bat an eye.
108 merge into a third, interconnected space, voting tools and technologies must be able to develop a cohesive strategy that unites influencer engagement, relational organizing, and digital media as equal parts of an executive strategy that reflects Ken’s commitment to Organize Early, Organize Always, and Organize Everywhere. As we work to build campaigns that honor our founding principles while branching out into new, uncertain realities, the DNC is committed to ensuring the tools leveraged and deployed in the future drive authentic, impactful voter engagement, while allowing teams to generate lessons learned from processes focused on continuous improvement. The vendors that the DNC partners with must not only understand this mission, but become equal partners in it, helping to organize winning strategies and campaigns not just for 2028, but for election cycles to come. Rather than each community-, city-, and state-level effort generating data that sits around gathering dust between elections, it is essential to develop and deploy strong national standards around data sharing and reporting while preserving the flexibility that allows for adjustments based on local issues and trends. In this manner, technology and the data that it generates should focus on more relational organizing, more efficient person-to-person communication, and more resonant messages over technology for technology’s sake. It is essential that the DNC takes the lead in reducing duplicative efforts and stretched resources, and leverage technology in a way that models what cooperation can look like between and among groups with the same goals of a prosperous future that represents everyone’s interests and not just that of a few billionaires and their friends. In order to do that, the technological infrastructure of the party must ensure that we are prepared to win elections now and for years to come, including the integration of redundancies and protections that ensure that the data is secure and accessible, and that its integrity can never be questioned. If we have learned anything from the past few election cycles, it is that today’s technological marvel can become tomorrow’s antique faster than we can bat an eye. The breakthrough tools that powered “Yes We Can” in 2012 proved that they could not keep up just four years later. Ensuring that our advantages are institutionalized in our perspective and approach requires evaluating every relationship with every vendor to determine if they can continue to meet the moment, or whether it is time to find new partners as committed to the fight as everyone in the party itself. Infrastructure can’t be built once and then set aside – it requires continued, ongoing investment to keep up with both technological advances and the innovations of campaign programs that are
Disclaimer: This document reflects the views of the author, not the DNC. The DNC was not provided with the underlying sourcing, interviews, or supporting data for many of the assertions contained herein and therefore cannot independently verify the claims presented. **
Modernizing Political Technology Infrastructure
- The Democratic Party must ensure its technological tools facilitate voter engagement rather than imposing limitations on strategic growth.
- The failure of initiatives like Hawkfish highlights the inconsistent adoption and leveraging of political technology within the party.
- Late-cycle funding for technology prevents proper user training and discourages effective platform utilization when it is needed most.
- A 'ground up' approach is required, involving early investment and consistent training to replace fractured and contradictory efforts.
- The DNC Tech team emphasizes a commitment to providing best-in-class infrastructure for candidates at every level of the ballot.
- Innovation should be evaluated independently of immediate electoral results to ensure long-term structural improvements.
Not only is the money necessary for technology investment often allocated at late points in the political cycle, but campaigns frequently default to what they know best over what will work best.
109 built on top of it. And especially as we ask critical questions as a party about how we are engaging with voters, we should ensure our tools are helping to move us forward rather than limiting where we’re able to go. Additionally, innovations should be considered separated from end results. What has been made obvious through the demise of Hawkfish and other technological advances within the party is that while the role of technology in politics and political campaigns continues to expand at an exponential rate, the adoption and leveraging of political technology remains inconsistent at best. Not only is the money necessary for technology investment often allocated at late points in the political cycle, but campaigns frequently default to what they know best over what will work best. Allocating money for technology adoption late in the political cycle means that users of the platforms and the infrastructure are trained on it late in the cycles, discouraging their effective use and potential contributions to campaigns in need. Beginning with the end in mind means planning from the ground up, allocating money for technological investments early, consistently training members on their use, and ensuring that its use represents a cohesive strategic execution over fractured, duplicative, and frankly contradictory efforts. We bear a critical responsibility to ensure our candidates – for the presidency and all candidates up and down the ballot – continue to have access to best in class infrastructure. And as the DNC Tech team, we’re committed to staying in the fight. [i] Inside the Democrats’ plan to fix their crumbling data operation. Wired. https://www.wired.com/story/democrats-fix-crumbling-data-operation/. [ii] Inside the Democrats’ plan to fix their crumbling data operation. Wired. https://www.wired.com/story/democrats-fix-crumbling-data-operation/. [iii] NYT. Inside the Democratic Disaster that Didn’t Happen in November. https://www.nytimes.com/2025/03/01/us/politics/democrats-voter-data.html?searchResultPosition=1 No sourcing or evidence provided for this claim.
Disclaimer: This document reflects the views of the author, not the DNC. The DNC was not provided with the underlying sourcing, interviews, or supporting data for many of the assertions contained herein and therefore cannot independently verify the claims presented. **
The Evolution of Campaign Fundraising
- American democracy allows campaigns to win on ideas and organizing even when significantly outspent by opponents.
- Early fundraising provides a critical advantage for hiring staff, producing media, and building campaign infrastructure.
- Historically, Republicans held a fundraising advantage as the party of corporations and elites throughout the late 20th century.
- Democrats previously relied on lean operations and partnerships with Labor to overcome financial disadvantages.
- The financial landscape shifted in the 2000s, leading to a 2024 cycle where Democrats significantly outspent Republicans across all levels.
- The document notes a lack of specific sourcing or evidence for several claims regarding 2024 fundraising totals.
Money, along with big ideas, sweat, shoe leather, and elbow grease, combine into energetic campaigns to persuade and turn out the voters needed to win.
110 Campaign Fundraising One of the many great things about our American democracy (if we can keep it) is how in free and fair elections, a campaign can win on ideas and smart organizing, even if they are outspent by multiples of millions of dollars. The ability to raise money – especially early money – does provide an enormous advantage. Candidates are able to hire staff, invest in organizing, print or produce collateral, pay for media, and build to win. Money, along with big ideas, sweat, shoe leather, and elbow grease, combine into energetic campaigns to persuade and turn out the voters needed to win. Throughout the 1980s, 1990s, and early 2000s, Democrats faced significant spending disadvantages. As the party of corporations and elites, Republicans consistently outraised and outspent Democrats at every level of federal and nonfederal campaigns. Democrats were still able to win by running lean and effective campaigns and by working in close partnership with Labor and other allies in service to working people and a better America. This financial landscape changed in the 2000s for reasons discussed later, and Democrats now have a fundraising edge. By the 2024 cycle, Democrats significantly outraised and outspent Republicans in the race for President, in Senate and House elections, and in nonfederal elections. Federal Candidate Fundraising, 2024[1] Non-Federal Candidate Fundraising, 2024[2]
No sourcing or evidence provided for many claims in this section.
No evidence provided for these claims.
Sourcing not provided, but assume data is from the FEC. Sourcing not provided, but assume data is from the FEC.
Disclaimer: This document reflects the views of the author, not the DNC. The DNC was not provided with the underlying sourcing, interviews, or supporting data for many of the assertions contained herein and therefore cannot independently verify the claims presented. **
Fundraising Advantages and Self-Funders
- Democrats have established a significant fundraising advantage over Republicans across nearly every political level in the 2024 cycle.
- Despite financial superiority, Democrats underperformed in critical elections, suggesting that raising money is not an end unto itself.
- The party must revisit its fundraising principles and tactics to understand why more money did not translate into better electoral outcomes.
- Self-financing candidates, while wealthy and powerful, frequently fail because they are perceived as trying to buy public office.
- Historical data from the 1980s to the present shows a pattern of self-funders spending tens of millions of dollars only to lose statewide and national races.
- The document's claims regarding fundraising and candidate performance are noted as unverified by the DNC due to a lack of underlying sourcing.
Democrats can and should take lessons from 2024 – when we had much more money than Republicans and still underperformed in critical elections – to revisit the principles, tactics, and outcomes of our fundraising.
111 Of course, not every dollar raised is spent in cycle, and some spending can be from funds raised or rolled over prior to the two-year cycle. Fundraising totals are dependent on a combination of the electoral calendar, primary and general election competitiveness, and whether there are incumbents, challengers, or open seats for given contests. For 2024, the summary tables above demonstrate how far Democrats have come in cultivating a significant fundraising advantage at nearly every level of politics. However, raising more campaign money than Republicans cannot be an end unto itself. Democrats can and should take lessons from 2024 – when we had much more money than Republicans and still underperformed in critical elections – to revisit the principles, tactics, and outcomes of our fundraising. A Note on Self-Funders The wealthy and powerful have always sought to control our country, generally through proxies, but occasionally seek office themselves. And when they run, they usually self-finance their campaigns. Self-financing candidates are often unsuccessful, frequently facing attacks for trying to “buy” public office. The 1980s and 1990s featured the rise of self-financed campaigns, with candidates like John Anderson, Ross Perot, Steve Forbes, and Michael Huffington spending tens of millions of dollars on losing campaigns for statewide and national office. The flood of personal spending increased after 2000, with John Corzine spending $60 million to win the New Jersey U.S. Senate race, Michael Bloomberg spending more than $68 million to win his first mayoral election in New York City, and candidates like Tom Golisano (NY), Doug Forrester (NJ), Meg Whitman (CA), Linda McMahon (CT), and Bob Hugin (NJ) each spending tens of millions of dollars to lose statewide races. In 2008, Mitt Romney poured nearly $45 million of personal funds into his losing primary against John McCain. In 2014, Bruce Rauner spent heavily to win the Illinois governor’s race, and spent heavily again to lose in 2018 when he was dramatically outspent by the also self-financing current Governor J.B. Pritzker. No sourcing or data provided for many claims in this section. No evidence provided; contradicts claims elsewhere in report.
Disclaimer: This document reflects the views of the author, not the DNC. The DNC was not provided with the underlying sourcing, interviews, or supporting data for many of the assertions contained herein and therefore cannot independently verify the claims presented. **
The Limits of Campaign Finance
- Michael Bloomberg and Tom Steyer spent over $1.4 billion in the 2020 Democratic primary but yielded almost no delegate success.
- Effective campaigns require a synergy of funding, a resonant message, and a robust ground organization rather than just capital.
- The Federal Election Campaign Act of 1971 and post-Nixon reforms established the FEC and a public financing system to restore public trust.
- Major party candidates have largely abandoned the public financing system because they can raise significantly more money independently.
- Opting into public funds requires candidates to adhere to strict spending limits and rigorous disclosure requirements that many now find too restrictive.
- Despite historical attempts at regulation, campaign money acts like water, constantly finding new ways to seep into the political system.
As a general matter, campaign money is like water - it seeks its own level, probing for cracks and seeping into the body politic.
112 In 2019 into early 2020, Michael Bloomberg and Tom Steyer combined to spend more than $1.4 billion in seeking the Democratic nomination for President. In fact, Bloomberg’s $1.07 billion spend exceeded the rest of the combined Democratic field seeking the nomination. Bloomberg and Steyer combined to win a single delegate. While some self-funders can win, money only goes so far. Winning a nomination and general election requires a mix of funding, a message rooted in experience and relevant to the moment, and an organization geared to identifying and turning out supporters. Regardless, the investments made by self-funders throughout recent history now pale in comparison to the amounts of money flowing into elections. Presidential Campaign Fundraising As a general matter, campaign money is like water - it seeks its own level, probing for cracks and seeping into the body politic. From our Founding, special interests have sought influence, and as early as 1907, President Theodore Roosevelt advocated the establishment of public financing for Presidential campaigns. In 1971, Congress passed the Federal Election Campaign Act (FECA). Additional post-Nixon reforms enacted in 1974 were designed to restore confidence in American politics, and led to the creation of the Federal Elections Commission in 1975. First implemented in the 1976 Presidential campaign, public financing for Presidential primaries and the general election remains in place in the law, but these practices have been effectively abandoned by major party candidates as they can now raise more funds outside the public financing system. To receive public funds, candidates need to “opt in” to the system. Opting in triggers more advanced disclosure requirements for fundraising, and tighter accounting, allocation, and disclosure rules for campaign spending. Candidates must hit fundraising thresholds to qualify for matching funds for the nominating contests, and the timing of receipts, expenditures, and federal fund transfers were once a tightly monitored and strategic process for candidates. The nominees for any party receiving 25 percent of the popular vote in the previous Presidential general election are eligible to receive a grant for the subsequent general election. In exchange for accepting the general election grant, the nominee must agree to limit spending Appears to be a conflation of contests won and delegates awarded.
No evidence provided for many claims in this section.
Disclaimer: This document reflects the views of the author, not the DNC. The DNC was not provided with the underlying sourcing, interviews, or supporting data for many of the assertions contained herein and therefore cannot independently verify the claims presented. **
The Collapse of Public Financing
- The federal public financing system was designed to level the presidential playing field through grants and spending caps.
- George W. Bush's 2000 campaign began the shift away from the system by 'busting the cap' during the primary season.
- Barack Obama became the first major party nominee to opt out of the general election grant in 2008, gaining a four-to-one spending advantage.
- The 2012 cycle marked the first time both major party candidates fully abandoned public funding for the general election.
- Since the system's collapse, presidential campaign spending has exploded, exceeding $2 billion in the 2020 cycle.
- Modern Democratic nominees, with one exception, have consistently raised over $1 billion for their principal campaign committees.
McCain was actually forced to borrow $17 million in August and September 2008 to float his campaign until the federal funding transfer was made.
113 to the amount of the grant and may not accept private contributions for the general election campaign. From 1976 until 2004, major party nominees opted to receive funding from the FEC for the general election, and were also eligible to participate in a matching funds program for the primaries and caucuses, subject to the aforementioned spending caps and tight regulation. This had the effect of leveling the playing field for each party’s nomination, and because the major party candidates received the identical amount of public funds for the general election, the candidates would have to carefully manage resources – forcing campaigns to limit their direct spending between the last nominating contest and their party convention when they would officially become the nominee and receive their general election grant. The general election grant is $20 million plus the difference in the price index. In 2024, the grant was set at $123.5 million. Campaigns now routinely outspend this number in the general election – sometimes in a week! The unintended consequence of reform was to push more candidates out of the public finance system, leading to massive increases in campaign fundraising and expenditures. The abandonment of the public financing system began in the 2000 cycle. Democrats Al Gore and Bill Bradley stayed in the matching fund system for the nominating process, and Gore accepted the grant for the general election; while then-Texas Governor George W. Bush “busted the cap” on the Republican side for the nomination, but accepted the FEC grant for the general election. By staying out of the matching fund system, Bush enjoyed a significant advantage over the Republican field during the nominating process. Learning from this, and realizing an incumbent Bush would have an even greater spending advantage if he stayed outside the public finance system for his reelection campaign, most 2004 Democratic presidential candidates opted out of the matching fund program for the nomination process, but both major party candidates remained in the public system for the 2004 general election. In 2008, candidates from both major parties opted out of the matching fund program for the primaries, and Barack Obama became the first major party candidate to opt out of the public financing system for the general election. President Obama therefore spent more than $435 million in the general election, while Senator McCain spent a little more than $100 million. This
Disclaimer: This document reflects the views of the author, not the DNC. The DNC was not provided with the underlying sourcing, interviews, or supporting data for many of the assertions contained herein and therefore cannot independently verify the claims presented. **
114 means President Obama enjoyed a more than four to one overall spending advantage over John McCain, who stayed within the public financing system he championed. 2008 Presidential General Election Spending (Cumulative)[3]
McCain was actually forced to borrow $17 million in August and September 2008 to float his campaign until the federal funding transfer was made. This cash flow advantage and spending disparity helped fuel Obama’s electoral landslide victory. 2012 was the first Presidential election where both major party candidates opted out the public finance system for the general election, resulting in combined presidential campaign spending exceeding one billion dollars when adjusted for inflation. This has persisted in every cycle since 2012, with combined spending exceeding $2 billion in 2020. Further, when adjusted for inflation, every Democratic nominee after 2004 other than Secretary Hillary Clinton in 2016 has exceeded $1 billion in fundraising into their principal campaign committees – leading to significant and meaningful resource advantages for their campaigns.
Inconsistencies found between chart and cited FEC data.
The Billion-Dollar Campaign Ecosystem
- Political campaigns have evolved from a cottage industry into a double-digit billion-dollar ecosystem characterized by weak regulation.
- Aggregate Senate fundraising has more than doubled since 2016, jumping from an average of $829.3 million to $1.76 billion per cycle.
- Democratic Senate candidates have consistently outraised their Republican counterparts in every election cycle since 2014.
- The 2018 midterm 'resistance' against the Trump administration served as a primary catalyst for the explosion in Democratic fundraising totals.
- Despite a massive $370 million average fundraising advantage over the last three cycles, Democrats faced significant losses in the 2024 Senate map.
- Total political spending is significantly higher than candidate totals suggest, as non-campaign entities like PACs added over $1 billion in 2024.
Collectively, campaigns are now more than a cottage industry, they are a double-digit billion-dollar ecosystem with weak regulation and where sharper practices can make a significant difference in driving winning outcomes.
Disclaimer: This document reflects the views of the author, not the DNC. The DNC was not provided with the underlying sourcing, interviews, or supporting data for many of the assertions contained herein and therefore cannot independently verify the claims presented. **
115 Inflation-Adjusted Presidential Campaign Fundraising (1992-2024)[4]
It is important to note these data are for the Presidential campaigns alone. The data does not include party or joint fundraising committee receipts or spending, or receipts to independent expenditure committees. These non-campaign committee entities combined for more than $1 billion in additional receipts (and consequent expenditures) in the 2024 cycle. The recent increases in total candidate fundraising for President have been matched by similar growth in fundraising in the Senate and House and in statewide and legislative campaigns. Collectively, campaigns are now more than a cottage industry, they are a double-digit billion-dollar ecosystem with weak regulation and where sharper practices can make a significant difference in driving winning outcomes. Senate Campaign Fundraising From 2018 forward, Senate candidates have aggregated at least $1.3 billion each two-year cycle. After averaging $829.3 million from 2002 through 2016, aggregate fundraising has more than doubled to an inflation-adjusted average of $1.76 billion from 2018 through 2024.
FEC data cited, but inconsistencies found with that data and approach to analysis.
Disclaimer: This document reflects the views of the author, not the DNC. The DNC was not provided with the underlying sourcing, interviews, or supporting data for many of the assertions contained herein and therefore cannot independently verify the claims presented. **
116 Senate Candidate Fundraising by Cycle – 2002-2024 (Inflation Adjusted)
As overall Senate fundraising has increased – Democrats have surpassed Republicans. In 2014, Republican Senate candidates outraised Democrats, but Democratic Senate candidates have outraised Republicans in every subsequent cycle. Senate Candidate Fundraising by Party and Cycle – 2002-2024 (Inflation Adjusted)
Sourcing not provided, assume to be FEC data.
Sourcing not provided, assume to be FEC data.
Disclaimer: This document reflects the views of the author, not the DNC. The DNC was not provided with the underlying sourcing, interviews, or supporting data for many of the assertions contained herein and therefore cannot independently verify the claims presented. **
117 Senate fundraising exploded in the 2018 cycle, driven by Democrats. Again, aggregate fundraising totals within a Senate cycle are connected to the map – which seats are up in a given election year – but the growth in 2018 was also connected to the midterm resistance in reaction to the Trump election and mismanaged administration. Republican aggregate fundraising grew by 47.7 percent from 2016 to 2018 to an inflation adjusted $538.1 million, while Democratic aggregate fundraising grew by 74.3 percent, to an inflation adjusted $713.7 million. In 2020, Democrats surpassed $1.46 billion in total Senate fundraising, $1.0 billion in 2022, and $930.5 million in 2024; while Republicans raised $988.2 million in 2020, $763 million in 2022, and $538.7 million in 2024. As important as the growth is, the disparity in fundraising between the two parties is now enormous, and Democrats have averaged a $370 million dollar fundraising advantage over the past three election cycles (a full six-year Senate term). These advantages helped Senate Democrats forge a tie in the Senate until a series of losses in the tougher 2024 map. Senate Fundraising Advantages – 2002-2024 (Inflation Adjusted)
There were 34 Senate races on the 2024 ballot, with varying patterns of fundraising based on the nature of the contest – open seats versus re-elects, etc.
Sourcing not provided, assume to be calculation from previous charts. Mathematical errors present.
2024 Senate Fundraising Dynamics
- The 2024 Senate elections showed a heavy concentration of capital, with 68.2 percent of all funds flowing into the 11 most competitive races.
- Democratic candidates successfully outraised their Republican counterparts in 13 out of 14 highlighted contests.
- Spending in open safe seats occasionally exceeded general election spending due to intense primary competition.
- The 'raise per voter' metric is introduced as a more nuanced way to measure campaign intensity across states with varying populations.
- Data inconsistencies exist within the report regarding the total number of competitive races cited versus those analyzed in charts.
Two thirds of the funds were raised into the one-third of competitive seats.
Disclaimer: This document reflects the views of the author, not the DNC. The DNC was not provided with the underlying sourcing, interviews, or supporting data for many of the assertions contained herein and therefore cannot independently verify the claims presented. **
118 Eleven seats were decided by single digits (6 Democrats and 5 Republicans), 13 decided by 10 to 20 percent (9 Democrats, 1 Independent, and 3 Republicans), and 10 seats were decided by more than 20 percent (2 Democrats, 1 Independent, and 9 Republicans). 28 Democrats and 38 Republicans were not in cycle in 2024. US Senate Election Outcomes (2024)[5]
Competitiveness drives fundraising, and in some instances, open safe seats saw significant primary spending which exceeded spending the general election. When controlling only for the nominees in general elections, as expected, spending volume was higher in the more competitive contests. Fundraising for the 11 Senate contests decided by single digits totaled $882,600,904.42, or 68.2 percent of all funds raised for all 34 Senate races. Two thirds of the funds were raised into the one-third of competitive seats.
Data inconsistencies with graphic below. Sourcing not provided.
Disclaimer: This document reflects the views of the author, not the DNC. The DNC was not provided with the underlying sourcing, interviews, or supporting data for many of the assertions contained herein and therefore cannot independently verify the claims presented. **
119 Senate Candidate Fundraising - 2024 (Single-Digit Contests)
Democrats outraised Republicans in 13 of the 14 contests. The one exception is Nebraska, where Democrats did not field a candidate, and the independent candidate outraised their Republican counterpart. Comparing fundraising totals may not paint an accurate picture of a given election’s competitiveness. Each state is different – with different populations, geographic and economic profiles, and campaign landscapes. There are also impacts on how candidates raise money based on their status as incumbents or challengers. This next table shows the comparative “raise per voter” – the total amount of money raised for each competitive Senate race compared to the actual number of votes cast in each state. Total Senate Raise Per Voter - 2024[6]
Sourcing not provided, but assume data is from the FEC and Secretaries of State.
Unclear which 14 races are being referred to. Chart above and analysis only mention 11 races.
Sourcing not provided, assume to be FEC data.
Disclaimer: This document reflects the views of the author, not the DNC. The DNC was not provided with the underlying sourcing, interviews, or supporting data for many of the assertions contained herein and therefore cannot independently verify the claims presented. **
Congressional Fundraising and Battleground Spending
- There is no discernible pattern between total spending and specific vote outcomes, despite massive financial outlays in battleground states.
- Fundraising for U.S. House candidates has more than doubled since 2016 when adjusted for inflation, exceeding $2.2 billion per cycle.
- Democrats currently hold an aggregate fundraising advantage in the House, with their general election nominees averaging higher totals than their Republican counterparts.
- Financial resources are heavily concentrated in competitive areas, with 37.6 percent of all House funds raised within the 69 districts decided by single digits.
- The Montana Senate race serves as a primary example of extreme spending, where Jon Tester outspent his opponent three to one and significantly outperformed the top of the ticket.
- Candidate fundraising is only one part of the financial ecosystem, which includes coordinated expenditures and independent efforts averaging over $100 million per battleground state.
As a general matter, there is no discernible pattern to the spend associated with a given vote total or outcome.
120 As a general matter, there is no discernible pattern to the spend associated with a given vote total or outcome. The Montana spend is significant, but was necessary. Jon Tester spent the most per voter, outspent Tim Sheehy by more than three to one, and outperformed the top of the ticket by more than any other battleground Senate race. It bears repeating – candidate fundraising is only one measure of financial support. The Senate campaign committees, coordinated expenditures, independent expenditure efforts, and state parties all add to the fundraising mix for both major parties – taking the combined spending in the battlegrounds to an average of more than $100 million per state. House Campaign Fundraising Similar to the Senate, fundraising for US House candidates has more than doubled when adjusted for inflation since 2016 - exceeding $2.2 billion in every election since 2018. House Candidate Fundraising by Cycle – 2002-2024 (Inflation Adjusted)
The House landscape is far more complex than the Senate, where every seat is up every two years. There are therefore many more House candidates – 1,869 FEC filers for the House in 2023-2024 in comparison to 265 filers for the US Senate - and Democrats now have the advantage in aggregate fundraising.
Raise and spend appear to be used interchangeably in this section.
Sourcing not provided, assume to be FEC data.
Disclaimer: This document reflects the views of the author, not the DNC. The DNC was not provided with the underlying sourcing, interviews, or supporting data for many of the assertions contained herein and therefore cannot independently verify the claims presented. **
121 House Candidate Fundraising by Party and Cycle – 2002-2024 (Inflation Adjusted)
Most House candidates raise less than Senate candidates – but their aggregate dollars exceed Senate fundraising. A significant portion of House funds are raised and spent during primary elections, and as with the Senate, a significant percentage of House fundraising is concentrated in battleground districts. This assessment starts with measuring the electoral competitiveness of the 2024 elections. There are a few ways to consider House outcomes – the seats decided by single digits in 2024 (46 Dem, 23 Rep), seats decided by 10 to 20 percent (45 Dem, 42 Rep, and 279 seats decided by more than 20 percent (124 Dem, 155 Rep).
Sourcing not provided, assume to be FEC data.
Disclaimer: This document reflects the views of the author, not the DNC. The DNC was not provided with the underlying sourcing, interviews, or supporting data for many of the assertions contained herein and therefore cannot independently verify the claims presented. **
122 US House 2024 Election Outcomes[7]
Focusing solely on nominee campaigns (excluding unsuccessful primary campaigns or retiring members) shows Democrats retained a financial advantage, especially in battleground districts. Overall, general election Democrats averaged $4,322,692.33 raised, while general election Republicans averaged $3,683,447.76 raised. As the table above demonstrates, 37.6 percent of all funds raised were within the 69 districts decided by single digits – with those 69 districts comprising 15.9 percent of all House seats. Democrats raised 43.7 percent of all of their funds, while Republicans raised 30.6 percent off all funds in the 68 districts decided by single digits.
Sourcing not provided.
Sourcing not provided, assume analysis is based on data provided above.
Disclaimer: This document reflects the views of the author, not the DNC. The DNC was not provided with the underlying sourcing, interviews, or supporting data for many of the assertions contained herein and therefore cannot independently verify the claims presented. **
House Fundraising Disparities
- Democratic House candidates maintained a significant fundraising lead over Republicans, with top winners averaging nearly $1 million more than their GOP counterparts.
- Party leadership continues to drive the highest totals, with Hakeem Jeffries and Mike Johnson each raising approximately $20 million or more.
- Unsuccessful Democratic challengers significantly outpaced unsuccessful Republicans in fundraising, averaging over $7.3 million compared to the GOP's $4.2 million.
- The data suggests that Democratic losses in competitive districts were not due to a lack of funding, as they targeted 20 of 23 single-digit Republican-held seats.
- Federal party committee fundraising has shifted from a stable $1.7-$2.2 billion range to an 'exploded' level of growth starting in the 2020 cycle.
- The RNC set a record in 2020 with over $890 million in receipts, largely fueled by massive transfers from joint fundraising committees.
Democrats did not lose because of a lack of funding – though more would have certainly helped.
123 House Top Raisers The top 25 winning raisers in each party are a collection of leadership and battleground Members. Top 25 Raisers by Party (2023-24) – Successful Candidates
Democrats averaged nearly $1 million more than the top 25 Republicans, with Democrats averaging $9,914,825.97, and Republicans averaging $8,956,196.21. The two leaders led their respective caucuses in fundraising, with Hakeem Jeffries at $22,977,197.34 and Mike Johnson at $19,867,069.39.
Sourcing not provided, assume to be FEC data.
Disclaimer: This document reflects the views of the author, not the DNC. The DNC was not provided with the underlying sourcing, interviews, or supporting data for many of the assertions contained herein and therefore cannot independently verify the claims presented. **
124 Democrats also had an advantage among the candidates who were unsuccessful. The table below shows the top 25 fundraising Democratic and Republican incumbents and challengers who came up short, with the colors reflecting the margin of the contest in favor of the current incumbent. Note how 20 of the 23 single digit Republican-held seats are on the Democratic list. Democrats did not lose because of a lack of funding – though more would have certainly helped. This is actually a good sign – competitive Democrats proved to be effective fundraisers. Top 25 Raisers by Party (2023-24) – Unsuccessful Candidates
Sourcing not provided, assume to be FEC data.
Disclaimer: This document reflects the views of the author, not the DNC. The DNC was not provided with the underlying sourcing, interviews, or supporting data for many of the assertions contained herein and therefore cannot independently verify the claims presented. **
125 For the Democrats, Adam Frisch raised $17.2 million to finish 4.98 percent behind Republican Jeff Hurd, while Republican Incumbent Michelle Steel spent $10.7 million to finish .21 percent behind Democrat Derek Tran. Unsuccessful Democrats outspent unsuccessful Republicans by $3.0 million, averaging $7,318,222.46 raised compared to $4,292,561.73 for Republicans. Federal Party Committees Federal Party Committees include the national party committees, Senate and House campaign committees, state party federal state party accounts and local party federal accounts.[8] While contributions to candidates and national party committees are indexed to inflation, individual contributions to state party committees have been capped at $10,000 per year since BCRA became effective in 2003. Aggregate federal party committee fundraising is generally higher in Presidential years and lower in midterms – and had been relatively stable – averaging an inflation adjusted $1.7 billion in each midterm from 2006 through 2018, and an inflation adjusted 2.2 billion in the 2008, 2012, and 2016 Presidential cycles. Party committee fundraising exploded in 2020, driven by the $890,538,963 record receipts by the RNC – with a massive portion from joint fundraising committee transfers into the RNC. Federal Party Committee Fundraising by Cycle – 2006-2024 (Inflation Adjusted)
Raise and spend appear to be used interchangeably in this section.
Sourcing and methodology not provided, assume to be FEC data.
Disclaimer: This document reflects the views of the author, not the DNC. The DNC was not provided with the underlying sourcing, interviews, or supporting data for many of the assertions contained herein and therefore cannot independently verify the claims presented. **
Democratic Fundraising and Transfer Dynamics
- The 2024 election cycle saw record-breaking party committee fundraising, reaching a combined total of $2.7 billion.
- Democrats maintained a significant financial lead, out-raising Republicans by nearly half a billion dollars in the 2024 cycle.
- National and state party committees utilize unlimited fund transfers to coordinate spending and optimize resources across different campaign levels.
- State committees leverage nonprofit mail permits to provide House and Senate candidates with significantly lower postage rates for direct mail.
- A substantial portion of total receipts—$446 million—is held in restricted accounts dedicated to conventions, legal proceedings, and headquarters buildings.
- While Democrats led in national and state-level fundraising, Republicans maintained a fundraising advantage specifically at the Senate committee level.
Senate and House candidates can take advantage of this lower rate by transferring funds to their state party to cover the production and postage for direct mail, and save themselves money in the process.
126 The 2022 midterm election generated a combined $2.3 billion in party committee fundraising - a meaningful bump from 2018. By 2024, the combined party committee fundraising reached $2.7 billion. Other than 2020, Democrats have led in aggregate fundraising in every cycle since 2012, when Democrats trailed Republicans by $4.6 million for the cycle. Party Committee Fundraising by Party and Cycle – 2006-2024 (Inflation Adjusted)
In 2024, the Democratic advantage was nearly half a billion dollars.
Sourcing not provided, assume to be FEC data.
Disclaimer: This document reflects the views of the author, not the DNC. The DNC was not provided with the underlying sourcing, interviews, or supporting data for many of the assertions contained herein and therefore cannot independently verify the claims presented. **
127 Fundraising Advantages – 2006-2024 (Inflation Adjusted)
The 2024 cycle featured several advantages for Democrats. Democrats led in fundraising at the national committee, House committee, and state and local party committee levels, while trailing at the Senate committee level. Party Committee Receipts Comparison (2023-2024) The significant receipts reported by the national party committees and state and local party committees requires context. National and state party committees can transfer unlimited amounts of money to and from each other, and national party committees can also transfer unlimited amounts to their Senate and Congressional campaign committees. The ability to transfer funds is particularly important for joint fundraising committees, where funds can be raised in a coordinated fashion with Presidential candidates, the national party committee, and among state parties. Subject to careful documentation and compliance
Sourcing not provided, assume to be FEC data.
Chart appears to contain mathematical errors; sourcing not provided.
Disclaimer: This document reflects the views of the author, not the DNC. The DNC was not provided with the underlying sourcing, interviews, or supporting data for many of the assertions contained herein and therefore cannot independently verify the claims presented. **
128 regulations, these funds can then be transferred among the committees to make certain types of expenditures. State Committees can also receive unlimited transfers from federal candidates. One of the most common examples is for direct mail. Most state committees have a nonprofit mail permit which allows them to send mail at a much lower postage rate. Senate and House candidates can take advantage of this lower rate by transferring funds to their state party to cover the production and postage for direct mail, and save themselves money in the process. In looking solely at transfers, the DNC and Democratic state and local parties received much more in transfers than the RNC and Republican state and local parties, while Republicans transferred more at the Senate and House levels. Transfers to Party Committees (2023-2024) Transfers are still money however, and the more important evaluation is whether the transfers stay within the committee and how they are invested in infrastructure or election activity. Restricted Account Receipts Within the totals for the national party committees are accounts to support the presidential nominating conventions. National party committees, along with the Senate and House committees can also have accounts for recounts or other legal proceedings, and headquarters buildings. These are sometimes referred to as restricted funds, because they can only be spent for their intended purpose. Restricted contributions totaled $446 million across the six party committees for the 2024 cycle, and are included within the overall $2.7 billion in party committee receipts listed above.
Sourcing not provided, assume to be FEC data.
Joint Fundraising Committee Dynamics
- Joint Fundraising Committees (JFCs) allow candidates to pool contributions and accept large single checks based on aggregate limits.
- Democrats have established a strategic fundraising advantage over Republicans within this complex, regulated ecosystem.
- The 2023-2024 cycle saw 1,298 registered JFCs generating a massive total of $3.49 billion in receipts.
- A supermajority of JFC funds benefited presidential candidates, with Kamala Harris outraising Donald Trump in this category.
- While Republicans had more individual JFCs (715) than Democrats (556), the total revenue favored the Democratic side.
- The data suggests significant candidate leverage, as individuals can participate in multiple committees to maximize capacity.
Overall, party committee fundraising is a complex, tightly regulated ecosystem.
Disclaimer: This document reflects the views of the author, not the DNC. The DNC was not provided with the underlying sourcing, interviews, or supporting data for many of the assertions contained herein and therefore cannot independently verify the claims presented. **
129 Contributions to Accounts of National Party Committees (2023-2024)
Overall, party committee fundraising is a complex, tightly regulated ecosystem. As with candidate fundraising, Democrats have cultivated an advantage relative to Republicans. Joint Fundraising Committee Receipts Joint Fundraising Committees (JFC or JFCs) enable candidates to pool contributions based on the aggregate contribution limits for each candidate, PAC, or party committee participating in the joint committee. A donor could write a single check covering the combined “max” for the participating committees, as long as they have not separately contributed to any of the participating committees during the covered election cycle. Candidates in both parties use Joint Fundraising Committees to raise funds and manage fundraising expenses. There are no limits to how much money can be transferred from a joint committee into a participating committee – so long as the accounting shows there were not separate contributions subject to limit made to the receiving committee. For the 2023-2024 cycle, there were 1,298 registered joint fundraising committees, 715 benefiting Republican candidates, 556 befitting Democrats, 26 benefitting third party candidates, and one as PAC contributing to candidates of both major parties, but reporting no revenue. JFCs totaled $3.49 billion in receipts in the two-year cycle.
Sourcing not provided, assume to be FEC data. Chart appears to contain mathematical errors.
Disclaimer: This document reflects the views of the author, not the DNC. The DNC was not provided with the underlying sourcing, interviews, or supporting data for many of the assertions contained herein and therefore cannot independently verify the claims presented. **
130 Joint Fundraising Committees – Count and Total Receipts by Party (2023-2024) Candidates can participate in more than one joint fundraising committee, and several candidates took advantage of this to leverage significant fundraising capacity. A supermajority of funds raised through JFCs benefited Presidential candidates. Kamala Harris raised $1.37 billion in two joint fundraising committees, the Harris Victory Fund and the Harris Action Fund. Donald Trump raised $1.09 billion into three committees – the Trump National Committee JFC, the Trump 47 Committee, and the Trump Save America JFC. Robert Kennedy raised $6.1 million into the Kennedy Victory Fund for his withdrawn independent bid. Presidential JFC Receipts (2023-2024)
There were also joint fundraising committees for Nikki Haley, Ron Desantis, Tim Scott and Asa Huctinson during the Republican nomination process.
Sourcing not provided, assume to be FEC data.
Sourcing not provided, assume to be FEC data. Standard for including JFCs unclear; not all JFCs included for either nominee.
Disclaimer: This document reflects the views of the author, not the DNC. The DNC was not provided with the underlying sourcing, interviews, or supporting data for many of the assertions contained herein and therefore cannot independently verify the claims presented. **
Joint Fundraising Committee Evolution
- Republicans significantly outpaced Democrats in non-Presidential joint fundraising committee (JFC) receipts, totaling $677.8 million compared to $300.2 million.
- The 2014 McCutcheon v. FEC ruling removed aggregate contribution limits, allowing wealthy donors to inject millions into the federal political ecosystem.
- Republicans pioneered a strategy of using JFC funds for 'fundraising ads' that functioned as campaign persuasion tools, bypassing traditional spending constraints.
- The FEC deadlocked 3-3 on a request for clarity regarding JFC advertising limits, effectively allowing parties to continue these practices without regulation.
- JFCs are increasingly retaining funds to engage in direct advocacy and secure the 'lowest unit charge' for broadcast media usually reserved for candidates.
- Accounting for JFC transfers is complex, as gross receipt reporting can lead to double-counting or inflated campaign finance statistics.
The ads were nearly identical to the standard campaign ads, but would briefly mention or make a fundraising request in a caption included in the ad.
131 Among the non-Presidential joint fundraising committees, Republicans dominated, raising $677.8 million in comparison to $300.2 million for Democrats. Non-Presidential JFC Receipts (2023-2024) The Republican fundraising advantage is notable, because it centers on a strategy to raise money from large contributors and to exploit loopholes to spend funds through a joint fundraising committee on advertisements in support of the participating candidates. The 2014 holding in McCutcheon v. FEC struck down the aggregate limit on contributions an individual could make across all federal candidates and party committees – at the time, $123,200. This opened the floodgates, where wealthier Americans can now plow millions into the federal ecosystem each cycle. Historically, joint fundraising committees were used to raise funds and then transfer permissible amounts into campaign committees. The excess funds were generally used to subsidize the costs of fundraising – enabling candidates to “net” more direct contributions and turn those transfers into permissible candidate activity. This meant most of the funds raised into a joint fundraising committee were distributed out to the participating committees. Republicans started pushing the envelope in 2024. They began using JFC funds to run “fundraising ads” which were more persuasion than fundraising. The ads were nearly identical to the standard campaign ads, but would briefly mention or make a fundraising request in a caption included in the ad. The Trump campaign went further – using JFC funds to organize rallies and held “donor” events – photo lines or roundtables – to rationalize the spending. Democrats sought clarity from the FEC, requesting an opinion on the limits of JFC advertising, but the commission deadlocked 3-3, so no formal opinion was issued and the parties moved forward without constraints.
Sourcing not provided, assume to be FEC data.
Disclaimer: This document reflects the views of the author, not the DNC. The DNC was not provided with the underlying sourcing, interviews, or supporting data for many of the assertions contained herein and therefore cannot independently verify the claims presented. **
132 This context explains why some JFCs are retaining more money rather than transferring it to the candidates or committees – they are now able to engage in campaign activity, yet at a “discount” to the candidate. Rather than focus on transferring eligible funds to participating committees, they can directly advertise, and drive greater levels of placement at the lowest unit charge candidates receive from broadcast media. This phenomenon will be covered more in the spending section of this report. It's also important to understand how transfers from JFCs to participating committees are considered receipts for the receiving committee. For example, the Presidential joint fundraising committees transferred out money to their principal campaign committees, the national parties, and to state parties. The cash retained was spent on fundraising and advocacy. Presidential JFC Receipts, Transfers Out, and Cash Retained (2023-2024)
The receiving committees reported the transfers as receipts, and when thinking about combined fundraising statistics, they should be counted once – at the final receiving end. Nikki Haley was criticized for reporting the gross receipts of her principal campaign and joint fundraising committees as a combined total during her campaign for President. Deducting the transfers will paint a more accurate picture of actual receipts to the campaign.
Sourcing not provided, assume to be FEC data.
Disclaimer: This document reflects the views of the author, not the DNC. The DNC was not provided with the underlying sourcing, interviews, or supporting data for many of the assertions contained herein and therefore cannot independently verify the claims presented. **
Joint Fundraising and Independent Expenditures
- Republican non-Presidential joint fundraising committees (JFCs) retained a significantly higher percentage of receipts (35.5%) compared to Democrats (17.4%) to exploit FEC inaction.
- Over $1.1 billion was retained by JFCs across both parties, serving as a massive additive funding source beyond standard campaign and party committee limits.
- Independent expenditure (IE) committees raised a total of $5.5 billion, with Democratic-aligned groups leading at $3.14 billion versus $2.28 billion for Republicans.
- IE committees often utilize 'dark money' entities to mask the original identity of contributors before transferring funds into the reporting committees.
- Strategic IE spending includes 'hybrid' tactics, such as running counterproductive content to mislead voters or influencing the opposing party's primary elections.
- The analysis identifies 803 non-party IE organizations, with a vast majority (575) primarily supporting Democratic candidates during the 2023-2024 cycle.
The Republican non-Presidential JFCs had a more intentional strategy to push the envelope on spending regulations, and were positioned to leverage the deadlock and inaction of the FEC into more direct spending on behalf of their candidates.
133 In the non-Presidential joint fundraising committees, there is a different pattern. The JFCs for Democrats transferred $247.9 million of total receipts to participating committees and retained $52.3 million - or 17.4 percent. The JFCs for Republicans transferred $437.1 million to participating committees and retained $240.708 million – or 35.5 percent. The Republican non-Presidential JFCs had a more intentional strategy to push the envelope on spending regulations, and were positioned to leverage the deadlock and inaction of the FEC into more direct spending on behalf of their candidates. Non-Presidential JFC Receipts, Transfers Out, and Cash Retained (2023-2024) Between the Presidential and non-Presidential joint fundraising Committees, $1,138,100,092.86 was retained – and can be considered additive to campaign committee and party committee fundraising. Moving forward, Democratic incumbents, candidates, and strategists need to consider how best to leverage JFC receipts into effective action. Independent Expenditures Independent expenditures are made by a range of organizations, including party committees. Since party committees have been covered above, the receipts to those organizations are excluded from this analysis. Many independent expenditure committees invest in multiple campaigns or for particular offices. There are IEs specific to President, the Senate, the House, as well as IEs which make expenditures for all three committees, or a mixture of two – Senate/President, House/President, and Senate/House. Es make expenditures to support or oppose a candidate, and most are exclusive to a single party. An IE will sometimes appear to support a candidate from the other party – for example
Sourcing not provided, assume to be FEC data.
Disclaimer: This document reflects the views of the author, not the DNC. The DNC was not provided with the underlying sourcing, interviews, or supporting data for many of the assertions contained herein and therefore cannot independently verify the claims presented. **
134 to attempt to influence the opposing party’s primary. Some IE committees make expenditures to “support” a candidate by running counterproductive content in an effort to mislead voters. This analysis aligns committees with their stated intent, and interprets the “hybrid” spenders based on their core allegiance or stated intention, and assigns partisanship based on those insights. 803 non-party committee organizations made independent expenditures in 2024. 575 primarily supported Democrats, 249 supported Republicans, and six supported third party candidates. Independent Expenditure Committees by Party and Recipient Type (2023-2024)
All IEs report revenues and disbursements. Most IEs mask contributors by raising funds into dark money entities, and then transfer the money into the IE committee. Many IEs also receive transfers from affiliated committees and other sources. These transfers in – from party committees, candidate committees, other IEs, and other affiliated committees – are excluded from this analysis to prevent double counting them as revenue. After transfers in, independent expenditure committees reported a total of $5.5 billion in receipts. Democratic-aligned IEs raised $3.14 billion, Republican-aligned IEs raised $2.28 billion, and IE’s supporting third and other party candidates raised $76.0 million.
Sourcing not provided, assume to be FEC data.
Disclaimer: This document reflects the views of the author, not the DNC. The DNC was not provided with the underlying sourcing, interviews, or supporting data for many of the assertions contained herein and therefore cannot independently verify the claims presented. **
135 Independent Expenditure Committee Receipts by Party and Recipient Type (2023-2024)
Federal and Gubernatorial Fundraising Trends
- Total federal receipts for the 2023-2024 cycle reached nearly $14.9 billion across all parties and committees.
- Democrats maintained a significant financial lead at the federal level, raising $8.6 billion compared to the Republicans' $6.1 billion.
- The scale of Democratic fundraising is so vast that the physical bills would theoretically circle the earth more than 33 times.
- In 2024 gubernatorial races, Republicans outraised Democrats in eight out of eleven contests, though Democrats led in aggregate funding.
- Fundraising proved a decisive factor in gubernatorial outcomes, as the leading spender won in every single one of the eleven contests.
- State-level fundraising remains highly variable due to diverse regulations regarding contribution limits, matching funds, and disclosure rules.
In each contest, the leading spender won.
This receipts for IEs far surpass the reported independent expenditures by these committees, as they also have operating expenses, and as with all committees, not every dollar raised is spent in cycle. Total Federal Receipts Combined receipts in the federal ecosystem reached nearly $14.9 billion. Combined Federal Receipts (2023-2024) Democratic candidates, parties, and committees raised nearly $8.6 billion or 57.8 percent of all funds raised, Republicans raised nearly $6.1 billion or 40.8 percent, and third parties raised $213.4 million or 1.4 percent of all funds raised. If Democrats took every dollar raised in the two-year cycle and laid them end to end, it would circle the earth more than 33 times. Non-Federal Receipts Democrats also hold advantages in nonfederal fundraising. In the aggregate, Democratic candidates generally outraise Republicans in battleground races.
Sourcing not provided, assume to be FEC data. data.
No evidence provided for many claims in this section. Sourcing not provided, assume to be FEC data.
Disclaimer: This document reflects the views of the author, not the DNC. The DNC was not provided with the underlying sourcing, interviews, or supporting data for many of the assertions contained herein and therefore cannot independently verify the claims presented. **
136 Each state has their own fundraising rules. Many, but not all states have contribution limits. Some have matching funds or spending caps. Some states have strict disclosure rules, others take a more unregulated approach. Gubernatorial Receipts There were 11 gubernatorial elections in 2024. Republicans outraised Democrats in eight of the elections, and Democrats outraised Republicans in three. In each contest, the leading spender won. $219 million was raised by the major party candidates in the 11 elections. Gubernatorial Campaign Receipts (2024)
Many of the gubernatorial elections held in Presidential years are noncompetitive, and with most falling outside the Presidential battlegrounds, receive little investment from the opposing party in an acknowledgment of the difficulty in overcoming the gravity of the two national tickets. Two elections in Presidential battlegrounds bucked this trend, with the election of Democrat Josh Stein in North Carolina, and Republican Kelly Ayotte in New Hampshire. In North Carolina, Stein outraised Republican Mark Robinson by more than four-to-one. In New Hampshire, Ayotte outraised Democrat Joyce Craig by more nearly three-to-one. Aggregate gubernatorial fundraising favored Democrats by $28.3 million due to Stein’s record fundraising in North Carolina.
Sourcing not provided, assume from state-level databases.
Disclaimer: This document reflects the views of the author, not the DNC. The DNC was not provided with the underlying sourcing, interviews, or supporting data for many of the assertions contained herein and therefore cannot independently verify the claims presented. **
2024 Down-Ballot Campaign Finance
- Republicans outraised Democrats in six of the ten attorney general contests, with the top fundraiser winning every race.
- The North Carolina and Pennsylvania attorney general races were the most expensive, totaling over $47 million combined.
- The Democratic Legislative Campaign Committee (DLCC) utilized 'Spotlight Races' to target battlegrounds and long-term power-building seats.
- Democrats led in aggregate funding in 15 of the 24 states analyzed for state legislative districts.
- Fundraising dominance was more consistent in attorney general races than at the legislative level, where leading funders do not always win.
- The data is subject to a disclaimer noting that the DNC cannot independently verify the underlying sourcing or factual accuracy of the claims.
Jackson outraised Bishop nearly two-to-one, and Sunday outraised DePasquale by more than two-to one.
137 Attorney General Receipts There were ten elections for attorney general. Eight aligned with gubernatorial campaigns (IN, MO, MT, NC, UT, VT, WA and WV, while two were standalone (OR and PA). Republicans outraised Democrats in six of the ten contests, and as with the gubernatorial campaigns, the larger raiser won in each contest. $64.8 million was raised across the ten elections. Attorney General Campaign Receipts (2024)
The two closest contests, North Carolina (decided by 1.3 percent) and Pennsylvania (decided by 4.6 percent) were the most expensive of the cycle. $26.3 million was spent in North Carolina, where Democrat Jeff Jackson won over Republican Dan Bishop, and 20.8 million was spent in Pennsylvania, where Republican Dave Sunday won over Eugene DePasquale. Jackson outraised Bishop nearly two-to-one, and Sunday outraised DePasquale by more than two-to one. Aggregate attorney general receipts favored Republicans by $3.0 million, as five of the remaining three seats were Republican-held and noncompetitive. State Legislative Districts The Democratic Legislative Campaign Committee (DLCC) supports the election of state legislators and other offices to ensure Democratic representation in chambers across the country. They designate priority elections as Spotlight Races. In 2024, the DLCC designated races in at least 24 states. Some of these races are Battlegrounds - essential to protecting or flipping control of a legislative chamber, others are races for Power
Sourcing not provided, assume from state-level databases.
Several factual errors found within analysis.
Disclaimer: This document reflects the views of the author, not the DNC. The DNC was not provided with the underlying sourcing, interviews, or supporting data for many of the assertions contained herein and therefore cannot independently verify the claims presented. **
138 Building – where majorities may not be in immediate play, but the contests are designed to get closer and position Democrats to flip a chamber in future cycles or to protect a Democratic gubernatorial veto. Watch List contests are where Democrats are focused on keeping a majority. A review of the campaign finance records in 24 states identified fundraising totals in 165 contests. Democrats led in aggregate funding in 15 of the 24 states, and in 115 of the 165 contests.
State contribution limits and reporting requirements vary, and not every leading funder wins at the legislative level.
No sourcing or evidence provided for this claim.
Disclaimer: This document reflects the views of the author, not the DNC. The DNC was not provided with the underlying sourcing, interviews, or supporting data for many of the assertions contained herein and therefore cannot independently verify the claims presented. **
The Democratic Funding Paradox
- Democratic campaigns are transitioning from a historical mindset of financial scarcity to an era of unprecedented fundraising abundance.
- The volume of state legislative receipts can now exceed gubernatorial races, offering a strategic opportunity to reshape the political landscape.
- Despite record-breaking budgets, campaigns continue to follow outdated 'spend at the end' models rather than investing early in communities.
- A significant portion of grassroots funding is being funneled into media platforms owned by oligarchs rather than building permanent infrastructure.
- The party faces a strategic disadvantage by 'renting' engagement systems while Republicans focus on ownership and long-term efficiency.
We take their hard-earned cash, yet are spending enormous funds on legacy and social media platforms owned by oligarchs.
139 For all nonfederal races the national campaign committees, state party committees, and state legislative caucus accounts generate revenue they invest in races or in coordinated campaigns, and there are many allied organizations seeking to power build in the states. Given the volume of state legislative races, the combined legislative receipts can exceed gubernatorial or other constitutional officer receipts. Finding more efficiency through effective coordinated campaigns and state tables can expand the map and enable nonfederal campaigns and committees win more races and reshape the state political landscape. Why Does Money Matter? Most Democratic voters, activists, and donors are unaware of the massive amounts of money Democratic candidates and incumbents can access to run campaigns. Even many Democratic incumbents and candidates are not fully aware of the ways campaign fundraising has exploded within the political ecosystem – and are therefore not fully appreciating the opportunities they have to demand more innovation from their strategists and consultants to rethink strategies and systems. For a long time, Democrats have planned campaign budgets and programs through scarcity. There was the belief there would be limited funds, so campaigns would have to carefully marshal resources across the calendar to ensure payrolls could be met, media buys could be placed, and organizing could be supported. Campaigns can now meet their fundraising needs. Contested Congressional races are now routinely exceeding $10 million, statewide races can reach $100 million, and Presidential races easily exceed a billion – and most recently – two billion dollars. With all of these resources, why are Democrats crafting budgets to “spend at the end”? When will Democratic incumbents and challengers demanding their campaigns invest in the communities and people they seek to represent and serve – and invest earlier in the campaign cycle, and between elections? For now, Democrats remain a people-powered party. A supermajority of our campaign funding comes from our grassroots activists. We take their hard-earned cash, yet are spending enormous funds on legacy and social media platforms owned by oligarchs. We are essentially cementing inefficiencies in our ability to engage voters by continuing to rely on systems we “rent” and Republicans “own.” No evidence provided for this claim.
Disclaimer: This document reflects the views of the author, not the DNC. The DNC was not provided with the underlying sourcing, interviews, or supporting data for many of the assertions contained herein and therefore cannot independently verify the claims presented. **
Modernizing Democratic Campaign Strategy
- The author argues that Democrats possess sufficient financial resources but must abandon outdated practices to ensure long-term political success.
- Fundraising data highlights the massive scale of the 2024 cycle, including combined Biden-Harris totals and significant Senate expenditures.
- The analysis incorporates diverse data points, including third-party fundraising trends from Ross Perot to Robert Kennedy Jr.
- Independent Senators King and Sanders are categorized with Democrats due to their caucus affiliation, despite their independent status.
- The text emphasizes the need for a 'Build to Win and Build to Last' philosophy to replace stale institutional habits.
- Data verification remains a point of contention, as the DNC has not independently verified the author's underlying sourcing or assertions.
Democrats must break with stale and counterproductive practices to Build to Win and Build to Last.
140 We have enough money to think and act differently. Democrats must break with stale and counterproductive practices to Build to Win and Build to Last. [1] These are candidate totals only – and exclude party and joint fundraising committees. Presidential fundraising reflects the two-year fundraising by Donald J. Trump for the nominating process and general election, and excludes the fundraising by other Republican candidates who sought the nomination. The Biden-Harris and Harris-Walz fundraising are combined, with the committee’s name changing after the candidate switch. Senate fundraising reflects two-year totals for the 34 seats in-cycle for 2024. [2] Non-federal candidate fundraising reflects the totals for all gubernatorial and attorney general elections held in 2024. The Legislative totals reflect the aggregate fundraising in DLCC 2024 spotlight contests. [3] Source: FEC Bulk Data – Operating Expenses (2007-2008). [4] Third Party Fundraising reflects Ross Perot in 1992 and 1996, Ralph Nader in 2000, Jill Stein in 2016, and Robert Kennedy in 2024. Source: FEC Presidential Fundraising Summaries (multiple). [5] Two Senate incumbents were elected as Independents and conference with Democrats – Senator King from Maine won by 17.42 percent, and Senator Sanders from Vermont won by 31.08 percent. Their results are shaded purple in the graphic, and are included in the Democratic totals in the chart legend. [6] Vote Margins and Totals are sourced from official state election returns. Campaign fundraising totals are from the FEC Financial Summary for 2023 and 2024 Senate Campaigns Through December 31, 2024. [7] In uncontested House races, the Presidential margin correlating with the partisanship of the elected Member was used to define their margin of victory. [8] The party committee analysis is limited to the activities for the two major parties. The DNC and RNC, the DCCC and NRCC, the DSCC and NRSC and Democratic and Republican state and local committees.
Disclaimer: This document reflects the views of the author, not the DNC. The DNC was not provided with the underlying sourcing, interviews, or supporting data for many of the assertions contained herein and therefore cannot independently verify the claims presented. **
Campaign Spending Dynamics
- Campaign spending plans are highly flexible and reflect a candidate's specific values, strategy, and the unique realities of the political climate.
- Fundraising methods, such as focusing on small-dollar donors versus major contributors, directly dictate the subsequent spending strategy.
- Strategists analyze opponents' FEC filings to decode their internal strategies and adjust their own campaign tactics accordingly.
- Federal spending is divided into 'hard side' (candidate/party committees) and 'soft side' (independent expenditures), each with different operational focuses.
- The 2024 federal election cycle saw a combined expenditure exceeding $13.2 billion, with Democrats outspending Republicans by nearly $2 billion.
- Independent expenditure organizations typically maintain leaner staff structures to maximize the percentage of funds directed toward direct programming and advertising.
In competitive races, campaign strategists will pore over the campaign finance filings of their opponents, seeking to discern the strategies of the opposing campaigns, and will consider adjustments based on what they see.
141 SPENDING ANALYSIS Campaign Spending There is no set formula for how campaigns should spend money. Campaign spending plans should be flexible in meeting campaign needs and the realities of the moment – and they reflect the campaign’s values and strategy. Campaign success is the result of many factors, including the strengths of the opponent, the office being sought, the economic or national climate, the composition of the electorate, the partisanship of the state, district, or jurisdiction, and how much money is available. Campaigns differ in how they raise money, which then impacts the spending strategy. Some choose to focus on low dollar fundraising; others focus on major donors; and most try to leverage both into robust fundraising. Some candidates position around whether to accept contributions from donors with certain backgrounds; seeking favor from interest groups or to shape a public narrative around being a “clean-money candidate.” In some non-federal elections, there are choices about opting into or out of public financing systems. In the federal campaign ecosystem, any expenditure supporting or opposing a candidate must be reported and disclosed to the FEC. In competitive races, campaign strategists will pore over the campaign finance filings of their opponents, seeking to discern the strategies of the opposing campaigns, and will consider adjustments based on what they see. In federal campaigns, spending falls into two major categories. The first is called “hard side” spending – the investments by candidates, committees, and party committees. These expenses require rigorous disclosure, and are focused on express advocacy, organizing, infrastructure, administration, staffing, and fundraising. For what's called the soft side, independent expenditures expenses typically include fundraising, advocacy through advertising, and organizing. These organizations tend to have leaner staff counts, and focus on putting most of their investments into program. These two “sides” combined to spend more than $13.2 billion on campaigns in the 2024 federal election cycle. Democrats had nearly $7.5 billion dollars spent by or for their campaigns, while Republicans had nearly $5.6 billion dollars spent by or for their campaigns. This does not account for billions more spent through PACs, Separate Segregated Funds, or non-connected committees. Sourcing not provided for most claims in this section, assume to be FEC data.
Disclaimer: This document reflects the views of the author, not the DNC. The DNC was not provided with the underlying sourcing, interviews, or supporting data for many of the assertions contained herein and therefore cannot independently verify the claims presented. **
Federal Campaign Spending Dynamics
- Democratic candidates maintained a significant spending lead over Republicans in federal races, totaling nearly $3.8 billion compared to $1.9 billion.
- The 2024 presidential campaigns reached a combined spending total of $3.57 billion, with Harris outspending Trump by nearly $1 billion.
- Candidate spending is considered the most effective form of expenditure because it is closest to the electoral strategy and benefits from preferential media rates.
- A complex ecosystem of party committees and PACs often surpasses direct candidate spending to shape the broader voter landscape.
- Campaigns utilize strategic transfers to state and national committees to leverage lower postal rates and maximize the utility of every dollar spent.
- Democratic spending advantages extended to non-federal races, particularly in gubernatorial and state legislative contests in North Carolina.
In federal campaigns, spending by other entities – party committees, PACs, and independent expenditures – surpass candidate spending – creating a vast ecosystem of billions of dollars spent to shape the landscape and define voter choice.
142 Total Federal Campaign Spending (2023-2024) Candidate Spending In practice, the “best” spending is candidate spending. It is closest to the person the people are being asked to support, and in principle, closest to the electoral strategy. At the candidate level, Democrats led in spending for President, for Senate and House elections, and in non-federal campaigns. $5.4 billion was spent directly by campaigns, with nearly $3.8 billion spent by Democratic federal candidates, and $1.9 billion spent by Republicans. Federal Candidate Expenditures, 2023-2024 In non-federal campaigns Democrats led Republicans in spending on gubernatorial elections by more than $27 million, trailed in Attorneys General races by nearly $2.4 million, and led in targeted state legislative races by more than $30 million. Non-Federal Candidate Expenditures, 2023-2024 The overall advantages in non-federal spending are based on strong Democratic campaigns for Governor and Attorney General in North Carolina. DGA, DAGA, the DLCC, and state legislative caucuses spent tens of millions more dollars to support their candidates’ success.
Sourcing not provided, assume to be FEC data.
Sourcing not provided, assume to be FEC data.
Sourcing not provided, assume to be from state-level databases.
Disclaimer: This document reflects the views of the author, not the DNC. The DNC was not provided with the underlying sourcing, interviews, or supporting data for many of the assertions contained herein and therefore cannot independently verify the claims presented. **
143 In federal campaigns, spending by other entities – party committees, PACs, and independent expenditures – surpass candidate spending – creating a vast ecosystem of billions of dollars spent to shape the landscape and define voter choice. Presidential Campaign Spending Evaluating presidential campaign spending requires understanding how money moves into and through Presidential campaigns. For national campaigns, massive amounts of money are moved through transfers into and out of campaigns, and once those transfers “stop moving” they are spent on planned activities. Historically, candidate committees have invested in media spending because candidates receive a preferential rate for media placement. The national and state party committees typically have nonprofit postal accounts which allow them to send direct mail at a much lower postal rate so they usually send mail on behalf of the ticket. There are also benefits to centering organizing in state parties as an efficient approach to creating and earning voters and votes for the whole ticket, and to leverage nuances in campaign finance law to maximize the “utility” of a given campaign dollar. It is therefore normal and expected to see Presidential and other candidates to spend a significant portion of funds on media – to both raise money and to spread the campaign message – and for there to be large transfers to state parties or the national committees to fund permissible activity at the most efficient cost. For the purposes of this analysis, in 2024, the Presidential “campaigns” consist of the principal campaign committees, designated joint fundraising committees, and the national party committees. The Harris and Trump campaigns – including the primary elections – reached $3.57 billion in combined spending. Harris spent $2.28 billion, and Trump spent $1.29 billion. Harris had an overall $988.2 million “hard” spending advantage. Combined Presidential Election Spending by Candidate and Committee Type
Sourcing not provided, assume to be FEC data.
Disclaimer: This document reflects the views of the author, not the DNC. The DNC was not provided with the underlying sourcing, interviews, or supporting data for many of the assertions contained herein and therefore cannot independently verify the claims presented. **
2024 Senate Campaign Spending
- Total spending for the 2024 Senate general election candidates reached $1.31 billion, with Democrats outspending Republicans by nearly two-to-one.
- A supermajority of campaign funds, totaling $895.7 million, was concentrated in just 11 states where contests were decided by single digits.
- Democrats outspent Republicans in every race except Nebraska, where an Independent candidate outspent the Republican incumbent.
- High spending volume did not guarantee victory, as the most expensive Democratic campaigns were largely unsuccessful in their respective races.
- The impact of campaign dollars varied wildly by market, with spending per voter ranging from $1.67 in Texas to over $110 in Montana.
The $18.8 million Allred spending advantage over Cruz measured against the 11.29 million votes cast in the state works out to a $1.67 per voter spending advantage for Allred – the lowest for any single-digit Senate election.
144 Senate Spending Senate candidate spending is more straightforward. While the Senate Republican and Democratic Party committees (NSRC and DSCC) spend on behalf of candidates and the races in cycle, they are dividing investments across multiple candidates. Across the 89 general election candidates in the 34 Senate elections held in 2024, spending reached $1.31 billion, with $853.1 million spent by Democrats, $435.3 million spent by Republicans, and $29.6 million spent on behalf of third party candidates (two incumbent independent candidates – Angus King in Maine, and Bernie Sanders in Vermont, as well as Dan Osborn in Nebraska). There was an additional $221.1 million spent by primary candidates or candidates who withdrew during the cycle. 2023-2024 Senate Spending by Party and Candidate Status The elections decided by single digits accounted for a supermajority of campaign spending - $895.7 million spent by campaigns in 11 states. Senate Candidate Spending - 2024 (Single-Digit Contests)
Sourcing not provided, assume to be FEC data.
Sourcing not provided, assume to be FEC data and state Secretaries of State election results.
Disclaimer: This document reflects the views of the author, not the DNC. The DNC was not provided with the underlying sourcing, interviews, or supporting data for many of the assertions contained herein and therefore cannot independently verify the claims presented. **
145 Democrats outspent Republicans in every contest apart from Nebraska where there was no Democratic nominee in the regular election – and where the Independent, (Dan Osborn) outspent Republican incumbent Deb Fischer. In isolation, spending volume did not correlate to winning. The highest-spending Democratic campaigns were mostly unsuccessful, but it doesn’t mean those investments were a mistake – because it takes massive spending to make difficult partisan terrain competitive. Dollars also spend differently in each market or state, so a $95.6 million Democratic spend in Montana spends “further” than a $94.5 million spend in Texas, or a $99.5 million spend in Ohio. In Texas, the $94.5 million spend by Colin Allred was offset by the smaller, but still large $75.6 million spend by Ted Cruz. The $18.8 million Allred spending advantage over Cruz measured against the 11.29 million votes cast in the state works out to a $1.67 per voter spending advantage for Allred – the lowest for any single-digit Senate election. By comparison, the $67.0 million spending advantage for Jon Tester over Tim Sheehy works out to $110.44 per voter spending advantage. Senate Candidate Spend per Voter by Party and State
Of course, candidate committee spending is only part of the story. There was additional joint fundraising committee spending, and both coordinated and independent expenditures which drove spending even higher in most Senate contests – addressed later in this section. US House Spending There were 1,851 filers with the Federal Elections Commission for the US House in 2024,
Sourcing not provided, assume to be FEC data and state Secretaries of State election results.
Claim contradicts public data.
Disclaimer: This document reflects the views of the author, not the DNC. The DNC was not provided with the underlying sourcing, interviews, or supporting data for many of the assertions contained herein and therefore cannot independently verify the claims presented. **
House Campaign Spending Disparities
- Total House candidate spending for the 2023-2024 cycle exceeded $2.1 billion, with Democrats maintaining a $279.8 million spending advantage over Republicans.
- Strategic 'over-investment' occurred in battleground districts, where 15.9 percent of House seats accounted for nearly a third of all candidate spending.
- In the 69 districts decided by single digits, Democrats outspent Republicans by $157.5 million, focusing heavily on Republican-held seats.
- Democratic leadership and battleground winners averaged $8.8 million in spending, slightly outpacing their Republican counterparts' $8.2 million average.
- Unsuccessful Democratic candidates significantly outspent unsuccessful Republicans, averaging $7.3 million compared to $4.2 million for the GOP.
- The data highlights a concentrated financial effort by Democrats to flip Republican-held single-digit districts, though results varied.
The 69 districts (15.9 percent of the 435 house districts) accounted for 31.4 percent of all House candidate spending for the cycle.
146 including retiring incumbents, and candidates who reported no revenue or expenses. There were also candidates who were on the ballot but did not file with the FEC, either because they never reached a reporting threshold, or otherwise decided not to file their candidacy. These 1,851 filers spent a combined $2,141,139,139.88 - $1,201,964,587.47 spent by Democrats, $922,081,629.86 spent by Republicans, and $17,092,922.55 spent by third party candidates, a $279.8 million spending advantage for Democrats. 2023-2024 House Spending by Party and Candidate Status Among the 808 filers who made it to the general election (Party Nominees), a total of $1.56 billion was spent, with $836.4 million spent by Democrats, $719.4 million spent by Republicans, and $12.2 million spent by third party candidates – a $116.9 million advantage for Democrats. Among the 69 districts decided by single digits, 647.3 million was spent, with 402.3 million spent by Democrats, 244.7 million spent by Republicans, and 234,102 spent by third party candidates – for a $157.5 million advantage for Democrats. The 69 districts (15.9 percent of the 435 house districts) accounted for 31.4 percent of all House candidate spending for the cycle. It was strategic decision made by both parties to “over-invest” in these battleground districts. Note the higher average spend by both parties in the 23 Republican-held single districts – where the majority was decided. House Candidate Campaign Spending by District Margins House Top Raisers
Sourcing not provided, assume to be FEC data.
Sourcing not provided, assume analysis is based on data provided above.
Disclaimer: This document reflects the views of the author, not the DNC. The DNC was not provided with the underlying sourcing, interviews, or supporting data for many of the assertions contained herein and therefore cannot independently verify the claims presented. **
147 The top 25 spenders among winning candidates in each party are a collection of leadership and battleground Members. Typically, leadership will raise funds to support other candidates, and battleground Members will be among the top spenders. Top 25 Spenders by Party (2023-24) – Successful Candidates
The top 25 spenders for Democrats averaged an $8.8 million spend, while the top 25 spenders among Republicans averaged an $8.2 million spend.
Sourcing not provided, assume to be FEC data.
Disclaimer: This document reflects the views of the author, not the DNC. The DNC was not provided with the underlying sourcing, interviews, or supporting data for many of the assertions contained herein and therefore cannot independently verify the claims presented. **
148 Democrats also had an advantage among the candidates who were unsuccessful. The table below shows the top 25 spending Democratic and Republican incumbents and challengers who came up short, with the colors reflecting the margin of the contest in favor of the current incumbent. Note how 20 of the 23 single digit Republican-held seats are on the Democratic list.
Unsuccessful Democrats outspent unsuccessful Republicans by $77.7 million, an average of $3.1 million, with Democrats averaging $7.3 in spending compared to nearly $4.2 million for Republicans.
Disclaimer: This document reflects the views of the author, not the DNC. The DNC was not provided with the underlying sourcing, interviews, or supporting data for many of the assertions contained herein and therefore cannot independently verify the claims presented. **
Non-Candidate Campaign Spending Dynamics
- Candidate committee spending represents only a portion of the total financial resources deployed in modern presidential elections.
- The FEC mandates disclosure from various entities, including joint fundraising committees, party committees, and independent expenditure groups.
- Incumbent presidents typically integrate their campaigns with national party committees to streamline fundraising and resource allocation.
- Joint fundraising committees allow for the transfer of unlimited funds for permissible activities between candidates and party organizations.
- In the 2024 cycle, the combined spending for Harris reached $2.28 billion compared to $1.29 billion for Trump before accounting for independent expenditures.
- When including independent expenditures, the total disclosed spending gap between the Democratic and Republican efforts expanded to over $1 billion.
Republican independent expenditures spent $859.5 million on behalf of Republicans or against the Democrats, and Democratic independent expenditures spent $905.4 million on behalf of the Democrat or against the opposition.
149 Non-Candidate Spending Candidate committee spending is only part of the puzzle – an important and perhaps decisive part – but still only a portion of what is spent on behalf of candidates. The FEC requires the disclosure of spending information from any entity spending on behalf of a candidate – either for the candidate or against their opponent(s). Depending on the type of entity, the spending is disclosed in periodic reports and aggregated by the FEC. Separate from the direct candidate spending, joint fundraising committees, party committees, and independent expenditures all add to the spending mix. Presidential Non-Candidate Spending For Democrats, an incumbent President exerts control over the DNC, and even before Joe Biden announced his candidacy for re-election, the integration of his campaign with the DNC was expected and immediate. As part of this integration, two joint fundraising committees were set up, and used to help raise money and support the overall campaign. Joint fundraising committees enable candidates to raise and spend money in collaboration with party committees, and a party committee can support the transfer of unlimited funds for permissible activities. As indicated above, the combined candidate committee, joint fundraising committees, and national party committee spending totaled $2.28 billion for Harris and $1.29 billion for Trump. When adding independent expenditures, the gap expands. Combined “Hard” and “Soft” 2024 Presidential Expenditures Republican independent expenditures spent $859.5 million on behalf of Republicans or against the Democrats, and Democratic independent expenditures spent $905.4 million on behalf of the Democrat or against the opposition – a net $45.8 million advantage for Democratic spending, taking the overall margin for disclosed presidential spending to $1.03 billion.
Sourcing not provided, assume to be FEC data.
Disclaimer: This document reflects the views of the author, not the DNC. The DNC was not provided with the underlying sourcing, interviews, or supporting data for many of the assertions contained herein and therefore cannot independently verify the claims presented. **
Senate and House Spending Analysis
- Senate non-candidate spending reached a massive $1.87 billion, bringing the total cost for all Senate races to over $3.4 billion.
- Republicans maintained a significant financial advantage in Senate joint fundraising and independent expenditures, totaling over $123 million in the latter category.
- The average cost per Senate campaign reached an unprecedented $100.5 million when accounting for all committee and candidate spending.
- In the House, Republicans dominated joint fundraising expenditures with $94.8 million compared to only $6.02 million for Democrats.
- Democratic House efforts were bolstered by the DCCC, which outspent its Republican counterpart by $112.9 million to maintain competitiveness.
- Independent expenditures in House races resulted in a virtual tie, with less than $100,000 separating the total spending for both parties.
The Republican advantages in non-candidate committee and independent expenditures narrowed the margin in Democratic and Republican spending to a $285.9 million Democratic advantage, and kept Republicans competitive as the campaigns came to a close.
150 Senate Non-Candidate Spending The Senate landscape is a bit more complicated. First, Senate candidates will have joint fundraising committees make both transfers to the participating candidate committees and make direct expenditures to raise money and communicate with voters. Excluding the transfers to the participating candidate committees, the joint fundraising committees spent $95.0 million on direct expenditures. Republicans spent $72.1 million, while Democrats spent $22.8 million, a $49.3 million Republican advantage. The Senate national campaign committees also invest in campaigns – through planning, infrastructure development, coordinated and independent expenditures, and transfers to state parties. When excluding refunded contributions, the remaining committee spending reached $563.3.0 million, with $293.2 million spent by the NRSC, and $270.0 million by the DSCC – a $23.6 million Republican advantage. Reported Senate independent expenditures reached $1.22 billion, with $671.9 million spent for Republicans and $548.2 million spent on behalf of support Democrats – a $123.6 million Republican advantage. Non-Candidate Committee Senate Spending Across these categories, spending topped $1.87 billion, which when coupled with the $1.53 billion in Senate candidate spending brings total spending for the Senate to $3,417,831,514.19, or an average of $100.5 million per campaign. The Republican advantages in non-candidate committee and independent expenditures narrowed the margin in Democratic and Republican spending to a $285.9 million Democratic advantage, and kept Republicans competitive as the campaigns came to a close. House Non-Candidate Spending In the House, joint fundraising committee spending reached $100.8 million after transfers to participating committees, with Republicans dominating spending with $94.8 million on behalf of their candidates and $6.02 million on behalf of Democrats. Democrats offset this with strong
Sourcing not provided, assume to be FEC data.
Disclaimer: This document reflects the views of the author, not the DNC. The DNC was not provided with the underlying sourcing, interviews, or supporting data for many of the assertions contained herein and therefore cannot independently verify the claims presented. **
151 spending by the DCCC of $300.8 million in comparison to $217.8 million by the NRCC, a $112.9 million advantage for Democrats on a total national campaign committee spend of $548,7 million. The two parties virtually tied with independent expenditures - $375.6 million spent on behalf of Republicans and nearly $375.7 million spent on behalf of Democrats – a $95,275 advantage with House independent expenditure spending reaching $751.3 million. Non-Candidate Committee House Spending
Sourcing not provided, assume to be FEC data.
Disclaimer: This document reflects the views of the author, not the DNC. The DNC was not provided with the underlying sourcing, interviews, or supporting data for many of the assertions contained herein and therefore cannot independently verify the claims presented. **
2024 Non-Federal Campaign Spending
- Democratic candidates generally maintained an aggregate fundraising advantage in non-federal battleground and non-battleground races.
- In 2024 gubernatorial elections, the candidate who spent the most money won in every single one of the eleven contests.
- A massive $78.1 million spend by Josh Stein in North Carolina accounted for the majority of the total Democratic gubernatorial spending advantage.
- Republicans held a slight spending edge in Attorney General races, winning all six contests where they outspent their Democratic opponents.
- State legislative data shows Democrats led in aggregate spending in 13 out of 24 analyzed states and in the majority of spotlighted contests.
- The data highlights the impact of massive individual contributions, such as a $10 million in-kind expenditure that swung the Pennsylvania Attorney General race.
In each contest, the leading spender won.
152 Non-Federal Spending Democrats also hold advantages in nonfederal spending. In the aggregate, Democratic candidates generally outraise Republicans in battleground races, with significant imbalances in non-battleground contests. Each state has their own fundraising and spending disclosure rules. Many, but not all states have contribution limits. Some have matching funds or spending caps which impact spending strategies. Gubernatorial Spending There were 11 gubernatorial elections in 2024. Republicans outspent Democrats in eight of the elections, and Democrats outspent Republicans in three. In each contest, the leading spender won. $207.5 million was raised by the major party candidates in the 11 elections, with Democrats spending $117.4 million, and Republicans spending 90.0 million – a Democratic advantage of $27.4 million. Gubernatorial Campaign Spending (2024)
The Democratic advantage in aggregate spending is the direct result of the record spending by Governor Josh Stein in North Carolina – whose $78.1 million is in shouting distance of the entire Republican field of $90.0 million. Democrats will not always have the advantage of a 4.5:1 spending advantage, but depending on the terrain, in some states, it is what it takes to win. In New Hampshire, now-Governor Kelly Ayotte outspent Democrat Joyce Craig by 2.7 to 1. While New Hampshire voters have historically tended to split their ballots, and did so in 2024 by rejecting Donald Trump while voting for Ayotte, New Hampshire will remain a gubernatorial battleground.
Sourcing not provided, assume to be from state-level databases.
Disclaimer: This document reflects the views of the author, not the DNC. The DNC was not provided with the underlying sourcing, interviews, or supporting data for many of the assertions contained herein and therefore cannot independently verify the claims presented. **
153 Governor Bob Ferguson also outspent Republican Dave Reichert by 2.3 to 1 in Washington. Ferguson proved to be a strong fundraiser, following the successful model of a State Attorney General moving up as a gubernatorial candidate. Attorney General Spending There were ten elections for attorney general, and Republicans outspent Democrats in six of the ten contests, and won all of the races where they outspent Democrats. Candidate spending totaled $63.1 million across the ten elections, with Democrats raising $30.3 million, and Republicans raising $32.7 million – a $2.3 million Republican advantage. Attorney General Campaign Spending (2024)
The two closest contests, North Carolina (decided by 1.3 percent) and Pennsylvania (decided by 4.6 percent) were the most expensive of the cycle. $25.8 million was spent in North Carolina, where Democrat Jeff Jackson won over Republican Dan Bishop, and $20.2 million was spent in Pennsylvania, where Republican Dave Sunday won over Eugene DePasquale. Jackson outraised Bishop nearly two-to-one, and Sunday outraised DePasquale by more than two-to one. DePasquale actually outraised Sunday in contributions, but Sunday was aided by a massive $10.0 million in-kind expenditure from a conservative donor which enabled Sunday to outspend DePasquale. State Legislative Spending The Democratic Legislative Campaign Committee (DLCC) Spotlight Races also generated significant spending. A review of the campaign finance records in 24 states identified spending totals in 165 contests. Democrats led in aggregate spending in 13 of the 24 states, and in 112 of the 165 contests.
Sourcing not provided, assume to be from state-level databases.
Several factual errors found within analysis.
Disclaimer: This document reflects the views of the author, not the DNC. The DNC was not provided with the underlying sourcing, interviews, or supporting data for many of the assertions contained herein and therefore cannot independently verify the claims presented. **
154 DLCC Spotlight Race Candidate Spending by State and Party (2024)
State Legislative Spending Strategy
- Democratic legislative candidates outspent Republicans by over $30 million across 165 key non-federal races.
- The total investment in these races reached $175.1 million, highlighting the massive scale of state-level political financing.
- State legislative spending can often surpass that of gubernatorial races due to the high volume of individual contests.
- National committees and allied organizations invest hundreds of millions annually to build power through coordinated state campaigns.
- Winning state-level seats is framed as a critical component for long-term redistricting battles and national party strategy.
Given the volume of state legislative races, the combined legislative candidate spending sometimes exceed gubernatorial or other constitutional officer spending.
These 165 candidates spent $175.1 million, with Democratic legislative candidates spending a combined $102.9 million, and Republicans spending a combined $72.1 million, for a Democratic advantage of $30.8 million. For each of these non-federal races, there are national campaign committees, state-level legislative caucus committees, and state party committees who invest in races or in coordinated campaigns, and there are hundreds of millions of dollars invested every cycle by many allied organizations seeking to power build in the states. Given the volume of state legislative races, the combined legislative candidate spending sometimes exceed gubernatorial or other constitutional officer spending. Finding more efficiency through effective coordinated campaigns and state tables will help Democrats expand the map. As Democrats plan and map future redistricting and state policy fights,
Sourcing not provided.
Disclaimer: This document reflects the views of the author, not the DNC. The DNC was not provided with the underlying sourcing, interviews, or supporting data for many of the assertions contained herein and therefore cannot independently verify the claims presented. **
155 winning these non-federal campaigns is essential to reshape the state political landscape and build a national majority party strategy.
Disclaimer: This document reflects the views of the author, not the DNC. The DNC was not provided with the underlying sourcing, interviews, or supporting data for many of the assertions contained herein and therefore cannot independently verify the claims presented. **
The Rise of Outside Spending
- Wealthy interests have historically sought ways to bypass campaign finance constraints established by the Federal Election Campaign Act.
- Federal court decisions have frequently undermined congressional efforts to maintain clean campaign finance and fair election standards.
- The Bipartisan Campaign Reform Act of 2002 attempted to close loopholes by eliminating nonfederal funds and limiting the influence of large contributors.
- Section 527 organizations emerged as a primary vehicle for unlimited spending because they were not subject to the same disclosure and contribution limits as traditional PACs.
- Both political parties utilized 527 organizations to run aggressive 'issue campaigns' that often functioned as thinly veiled attacks on opposing candidates.
Campaign finance lawyers took notice, and advised so long as 527 organizations did not coordinate with parties or candidates, they could raise and spend unlimited amounts of money.
156 Understanding Outside Spending Well before FECA was even enacted, or the first officers of the FEC took their oaths, some wealthy individuals and powerful interests worked to find ways around the constraints on campaign finance. While reformers have made continuous efforts to amend and revise FECA – either to close loopholes or strengthen enforcement – there have been simultaneous efforts to overturn Congressional intent through federal court decisions which have undermined the context and concept of clean campaign finance and fair elections. As the federal courts loosened campaign finance regulations, Congress eventually passed the Bipartisan Campaign Reform Act of 2002 (BCRA) or McCain-Feingold. BCRA included significant and substantial changes to campaign finance, such as eliminating the raising or spending of nonfederal campaign funds, adjusting campaign contribution limits, and limiting the roles of federal candidates and officeholders in nonfederal campaign activity. The goal was to provide clarity and transparency to the public – by limiting the influence of large contributors, and forcing federal party and campaign committees to operate with fewer resources. While well-intentioned, there were immediate reactions to these changes in federal law. 527 organizations (named as such due to how they were organized under the Internal Revenue Code) had existed since the 1970s as a tax designation for candidate committees, PACs, and party committees. While FECA imposed contribution limits and spending restrictions and mandated disclosure for campaign and political committees, Section 527 of the IRS did not. Campaign finance lawyers took notice, and advised so long as 527 organizations did not coordinate with parties or candidates, they could raise and spend unlimited amounts of money. In the 2000 cycle, there were significant investments in 527 organization “issue campaigns.” In one instance, the cynically named Republicans for Clean Air spent millions on ads praising George W. Bush’s environmental “record” while attacking Senator John McCain during the nominating process. Democrats also experimented with 527 issue advocacy, with investments in Joint Victory 2000, the Media Fund, the League of Conservation Voters, Sierra Club, EMILY’s List, and trial lawyer groups all making and placing issue ads throughout the general election. No evidence provided for many claims in this section.
Disclaimer: This document reflects the views of the author, not the DNC. The DNC was not provided with the underlying sourcing, interviews, or supporting data for many of the assertions contained herein and therefore cannot independently verify the claims presented. **
The Evolution of 527 Groups
- The Bipartisan Campaign Reform Act (BCRA) banned soft money contributions to political parties, inadvertently driving donors toward 527 organizations.
- Democratic strategists pioneered large-scale external expenditures in 2004 through groups like America Coming Together and The Media Fund.
- These independent organizations successfully coordinated with each other to manage both media blitzes and ground-level voter mobilization.
- Republicans countered with their own 527s, including the controversial Swift Boat Veterans for Truth, which utilized aggressive attack ads.
- The FEC eventually fined many of these groups for illegal coordination and exceeding contribution limits, leading most to disband before 2008.
- The 2004 cycle served as a proof-of-concept for the massive, unregulated outside spending that would eventually dominate modern American elections.
In all, IRS filings indicated an estimated $100 million was spent by 527 groups in the 2020 cycle, a figure which now seems quaint.
157 In all, IRS filings indicated an estimated $100 million was spent by 527 groups in the 2020 cycle, a figure which now seems quaint, and in response, Congress required 527s to file disclosure reports, but allowed the organizations to continue to accept unlimited contributions. So, when BCRA passed and banned so-called soft money contributions to political parties, there was already a tested vehicle ready to receive large contributions. Previously, national and state parties could leverage non-federal contributions into permissible activity. With the ban on soft money, there was now tens of millions of dollars in available financing, and strategists in both parties saw the potential for large-scale paid media campaigns and voter engagement efforts. Notably, in 2003, in anticipation of the 2004 Presidential election, key Democratic strategists advocated investment and founded or expanded what were to become the first large scale external expenditures – America Coming Together, America Votes, and The Media Fund. Separately, some major donors and grassroots donors formed MoveOn Voter Fund (a separate organization from MoveOn.org, which started in 1998). While independent of the campaigns, the 527 organizations could coordinate with each other. The Media Fund became the lead advertising arm of a broader 527 network, working in tandem with America Coming Together (ACT), which focused on field organizing and voter mobilization. Both organizations were founded before there was a Democratic nominee, and played no favorites in the Democratic nominating process. ACT was on the ground in many states before John Kerry had secured the nomination, and The Media Fund and MoveOn filled the airwaves in the spring as the Bush campaign started to advertise after the Democratic nomination was secured. These 527 organizations combined to spend more than $100 million in targeted states. In response, Republicans created the Progress for America Voter Fund and the Swift Boat Veterans for Truth – the infamous smear committee. These organizations ran a combination of attack and supportive ads. In reaction to these expenditures, there were complaints filed by both parties with the FEC. The FEC concluded most of the 527 expenditures were impermissible engagement in federal campaign activity, and many were issued what were significant fines back then for violating contribution limits, improperly seeking to influence the election, and potential coordination. Most of the 2004 527 organizations disbanded before the 2008 cycle, but their creation, activity, and impact were an early example of the massive spending still to come. The Rise in “Outside” Entities Year appears to be incorrect.
Disclaimer: This document reflects the views of the author, not the DNC. The DNC was not provided with the underlying sourcing, interviews, or supporting data for many of the assertions contained herein and therefore cannot independently verify the claims presented. **
Evolution of Modern Campaign Finance
- Following the 2004 loss, Democratic donors established the Democracy Alliance to build a long-term progressive infrastructure of think tanks and media.
- The 2008 Obama campaign uniquely discouraged outside spending, relying instead on massive direct fundraising and grassroots energy to defeat John McCain.
- The 2010 Citizens United and SpeechNow.org court rulings fundamentally deregulated campaign finance by allowing unlimited independent expenditures.
- Republicans immediately leveraged new legal frameworks through groups like American Crossroads to retake the House of Representatives in 2010.
- By the 2012 cycle, both parties fully embraced the Super PAC model, with hundreds of millions of dollars flowing through candidate-specific outside groups.
The 2010 Citizens United and SpeechNow.org cases enabled corporations, unions, and groups of individuals to make unlimited contributions to groups making independent expenditures.
158 Democrats were deeply frustrated with the 2004 campaign loss. Democrats were not outspent, but were under-organized on the hard side and were unable to counter Republican messaging and platform advantages – which may sound familiar 20 years later. In response, major donors and organizations outside the party sought new forms of organization and investment to better engage voters to counter conservative advantages. The Democracy Alliance, labor unions, and other donor collaboratives sought to develop and support a network of think tanks, media outlets, and activist groups to provide a progressive counterweight to decades of conservative investment. Over time, these efforts have matured – even if some organizations and donor collaboratives have disbanded or experienced changes in leadership or composition. There have been near endless debates about whether to focus on current elections or think more broadly about developing capacity for the long term. During the 2008 cycle, the Obama campaign loudly and consistently discouraged outside spending – a strategy given the nominee’s preferences and perhaps due to his matchup against a campaign finance reformer in John McCain. With the ability to significantly outspend Senator McCain head-to-head on the hard side, and the massive energy fueling the Obama campaign it was an easier call, but not without risk. Some organizations continued to spend to provide a backstop to any potential reversals – but the Obama landslide was a welcome relief. Federal court decisions between the 2008 and 2012 cycles radically changed campaign finance. The 2010 Citizens United and SpeechNow.org cases enabled corporations, unions, and groups of individuals to make unlimited contributions to groups making independent expenditures. This led to the near-immediate creation of American Crossroads and Crossroads GPS (its 501(c)(4) parallel group) which spent more than $70 million in support of Republicans and helped them retake the House of Representatives. The entire political ecosystem took notice of these 2010 actions. In 2011, Priorities USA Action was created to support President Obama’s re-election and Democrats created House Majority PAC and Senate Majority PAC to support their incumbents and candidates. On the Republican side, many of the potential challengers to President Obama had their own Super PACs – with organizations supporting Mitt Romney, Newt Gingrich, and Rick Santorum combining to raise and spend nearly $200 million in the primary and general elections. American Crossroads remained active in the 2012 cycle, and existing organizations, including several long-financed by the Koch network expanded their roles to take advantage of the new
Disclaimer: This document reflects the views of the author, not the DNC. The DNC was not provided with the underlying sourcing, interviews, or supporting data for many of the assertions contained herein and therefore cannot independently verify the claims presented. **
The Rise of Super PACs
- The 2012 election cycle marked the first significant use of Super PACs by both parties, with over $600 million spent on federal elections.
- Republican-aligned Super PACs, catalyzed by the Koch brothers and Freedom Partners, initially outspent Democratic counterparts by a nearly 2:1 margin.
- By the 2016 cycle, Super PAC spending reached a massive $1.57 billion, with nearly every Republican presidential candidate supported by a dedicated fund.
- The 2016 election losses left the DNC in debt and created a vacuum that sparked a surge of new 'resistance' organizations focused on organizing and storytelling.
- In 2018, independent expenditures totaled $1.26 billion, with Democratic-aligned groups narrowly outspending Republicans to help reclaim seats.
In this vacuum, a surge of resistance energy led to the formation of many new organizations across the partisan and progressive ecosystem – dedicated to issues, story-telling, organizing, training, candidate recruitment, and candidate fundraising.
159 ability to spend. The Kochs catalyzed Americans for Prosperity and created Freedom Partners to pool contributions for independent expenditures. The 2012 cycle was the first to feature Super PACs on both sides of the aisle, with more than $600 million spent influencing federal elections. By 2014, the lanes were clear – the Freedom Partners Action Fund, American Crossroads, Senate Conservatives Fund, and Club for Growth Action were driving spending on House and Senate races for Republicans, and House Majority PAC and Senate Majority PAC for the Democrats. Priorities USA Action remained active in the cycle, but positioned itself more to prepare for the 2016 presidential cycle. There were several other Super PACs on the right and left, but Republican-aligned Super PACs outspent Democratic-aligned Super PACS by nearly 2:1. In 2015 and 2016, nearly every Republican presidential candidate had a Super PAC supporting their campaigns, with more than $150 million spent in support of Jeb Bush, Ted Cruz, Marco Rubio, and Donald Trump during the nominating process. Americans for Prosperity and Freedom Partners spent more than $200 million in the cycle, and Crossroads, while active, receded in influence as others began to spend more. Priorities USA Action became the main Super PAC for the 2016 Democratic Presidential cycle, with House Majority PAC and Senate Majority PAC becoming institutionalized as the main Super PACs for the Democratic House and Senate; as spending reached a combined $1.57 billion.
Disclaimer: This document reflects the views of the author, not the DNC. The DNC was not provided with the underlying sourcing, interviews, or supporting data for many of the assertions contained herein and therefore cannot independently verify the claims presented. **
160 Top 25 Independent Expenditure Committees (2015-2016)
The losses in the 2016 cycle were a shock to Democrats. The DNC was deeply in debt, and many existing institutions struggled to explain the research and program failures which allowed Trump to win. In this vacuum, a surge of resistance energy led to the formation of many new organizations across the partisan and progressive ecosystem – dedicated to issues, story-telling, organizing, training, candidate recruitment, and candidate fundraising. The combined efforts of existing and new organizations helped elect new Democrats across the country in 2018, including several who won in Democratic primaries.
Sourcing not provided, assume to be FEC data.
Disclaimer: This document reflects the views of the author, not the DNC. The DNC was not provided with the underlying sourcing, interviews, or supporting data for many of the assertions contained herein and therefore cannot independently verify the claims presented. **
161 There was $1.26 billion in independent expenditures in 2018, with $662.0 million spent on behalf of Democrats and $603.5 million spent on behalf of Republicans. The leading spenders on the Democratic side were SMP, Majority Forward and the DSCC for the Senate, the DCCC and House Majority PAC to support House Democrats, and groups like Independence USA, Women Vote!, Priorities USA Action, the LCV Victory Fund, End Citizen’s United, VoteVets, and the With Honor Fund provided additional investment on behalf of federal Democrats. Top 25 Independent Expenditure Committees (2017-2018)
The Republican side was led by the Congressional Leadership fund and the NRCC for the House, the Senate Leadership Fund and NRSC for the Senate, and groups like New Republican PAC,
Sourcing not provided, assume to be FEC data.
Disclaimer: This document reflects the views of the author, not the DNC. The DNC was not provided with the underlying sourcing, interviews, or supporting data for many of the assertions contained herein and therefore cannot independently verify the claims presented. **
Independent Expenditure Trends 2020-2024
- Total independent expenditures saw a massive surge from $3.14 billion in 2020 to $4.42 billion in the 2024 cycle.
- Democrats held a significant spending advantage of over $318 million in 2020, but Republicans gained the upper hand in both 2022 and 2024.
- Super PACs played a critical role in the 2020 Democratic primary, with groups like Unite the Country and Persist PAC spending millions to bolster specific candidates.
- The 2024 cycle featured massive individual contributions from high-profile vehicles like Elon Musk's America PAC and the Koch-funded Americans for Prosperity Action.
- Future Forward emerged as the dominant spending force in 2024, directing over $500 million toward the Biden and Harris campaigns.
America PAC – the Elon Musk vehicle – spent $173.7 million, and Americans for Prosperity Action – the Koch fueled entity – spent $151.7 million.
162 America First Action, DefendArizona, Club for Growth Action, Americans for Prosperity, and the NRA. There was $3.14 billion in independent expenditures in 2020, with $1.76 billion spent on behalf of Democrats and $1.44 billion spent on behalf of Republicans, a $318.3 million advantage for Democrats. Top 25 Independent Expenditure Committees (2019-2020)
SMP and the DSCC, and HMP and the DCCC again played major roles in driving Democratic independent spending for the Senate and House. Future Forward, Priorities USA, American Bridge, Independence USA and The Lincoln Project were all major spenders in the race for
Sourcing not provided, assume to be FEC data.
Disclaimer: This document reflects the views of the author, not the DNC. The DNC was not provided with the underlying sourcing, interviews, or supporting data for many of the assertions contained herein and therefore cannot independently verify the claims presented. **
163 President, along with the LCV Victory Fund, Unite the Country, Women Vote!, Black PAC, VoteVets, and Everytown for Gun Safety. For the Republicans, Senate Leadership Fund and the Congressional Leadership Fund again led Republican spending. America First Action and Preserve America PAC led spending for Republicans in the race for President. During the 2020 Democratic nominating process, Super PACs were created to support some of the primary candidates. Unite the Country spent approximately $20 million in the early states to support President Biden. Persist PAC spent $14.7 million to support Elizabeth Warren in the Super Tuesday contests. VoteVets spent approximately $8.0 million on ads in Iowa and New Hampshire supporting Pete Buttigieg, and Kitchen Table Conversations spent $2.7 million on behalf of Amy Klobuchar. There was $2.25 billion in independent expenditures in 2022, with $1.04 billion spent on behalf of Democrats and $1.13 billion spent on behalf of Republicans, a Republican advantage of $87.7 million.
Disclaimer: This document reflects the views of the author, not the DNC. The DNC was not provided with the underlying sourcing, interviews, or supporting data for many of the assertions contained herein and therefore cannot independently verify the claims presented. **
164 Top 25 Independent Expenditure Committees (2021-2022)
The Senate Leadership Fund and the NRSC combined to lead spending in the Senate for the Republicans, and Congressional Leadership Fund and the NRCC combined to lead Republican spending in the House. SMP, Georgia Honor, and the DSCC combined to lead spending for Senate Democrats and House Majority PAC and the DCCC led spending for House Democrats. In 2024, independent expenditures reached $4.42 billion, with $2.09 billion spent on behalf of Democrats, and $2.20 billion spent on behalf of Republicans, a $108.2 million Republican advantage.
Sourcing not provided, assume to be FEC data.
Disclaimer: This document reflects the views of the author, not the DNC. The DNC was not provided with the underlying sourcing, interviews, or supporting data for many of the assertions contained herein and therefore cannot independently verify the claims presented. **
165 Top 25 Independent Expenditure Committees (2023-2024)
As the primary super PACs for the presidential candidates, Future Forward led all independent expenditures spending with $503.3 million on behalf of Biden and then Harris, and Make America Great Again Inc with $376.9 million on behalf of Trump. WINSENATE inherited the SMP role as the lead spender for Senate Democrats, and HMP remained the leading spender for House Democrats. Congressional Leadership Fund led in House spending for Republicans and Senate Leadership Fund for Senate Republicans. America PAC – the Elon Musk vehicle – spent $173.7 million, and Americans for Prosperity Action – the Koch fueled entity – spent $151.7 million.
Sourcing not provided, assume to be FEC data.
Republican Independent Expenditure Surge
- Republican independent expenditures in the presidential race nearly tripled between 2020 and 2024, rising from $359.5 million to over $1 billion.
- Democratic spending in the same category grew by a more modest 35.8 percent, reaching $978.7 million in 2024.
- The GOP utilized high-net-worth individuals and 'oligarchs' like Elon Musk to compensate for a lack of grassroots fundraising from everyday Americans.
- Independent expenditures are used for diverse campaign needs including media, organizing, and polling, though full financial transparency is often obscured by fund transfers between vehicles.
- The surge in outside spending provided Republicans with a $108.2 million advantage that helped offset their deficits in direct candidate fundraising.
The Republicans were able to activate their oligarchs, and leverage multiple independent expenditures from Musk and others to make up for their lack of fundraising support from everyday Americans.
Disclaimer: This document reflects the views of the author, not the DNC. The DNC was not provided with the underlying sourcing, interviews, or supporting data for many of the assertions contained herein and therefore cannot independently verify the claims presented. **
166 The largest difference between 2020 and 2024 is the near-tripling of Republican independent expenditures in the presidential election. The spending at the Congressional (House and Senate) levels were essentially the same from 2020 to 2024, but presidential independent expenditures for Democrats grew from $720.5 million in 2020 to $978.7 million in 2024 (an increase of 35.8 percent), while Republican spending grew from $359.5 million in 2020 to $1.02 billion in 2024 (an increase of 188.9 percent). Independent Expenditure Totals by Party and Office (2016-2024) The combined $108.2 independent expenditure advantage for Republicans in 2024 helped partially offset their hard-side fundraising and spending deficits. The Republicans were able to activate their oligarchs, and leverage multiple independent expenditures from Musk and others to make up for their lack of fundraising support from everyday Americans. How Independent Expenditures Spend in Campaigns Independent expenditures are made by committees, candidates and individuals in support or opposition to a candidate. Some organizations have much larger budgets and operations, and then transfer funds to another vehicle through which they make independent expenditures, so there is not a full picture of the resources being brought to bear. Only the actual investments in support or opposition are disclosed – in organizing, media, and other expenses in direct support of the effort. The FEC has categorical descriptions for expenses, including Administrative/Salary/Overhead, Advertising, Campaign Events, Campaign Materials (buttons, bumper stickers, brochures and other collaterals), Donations (to organizations and groups), Political Contributions (to candidates and committees), Polling, Solicitation and Fundraising Expenses, and Travel. In addition, costs specific to Voter Contact can be coded to identify organizing investments. This analysis requires a caveat – expenses may not have been properly coded or described by the compliance teams for the various entities making the independent expenditures, and there
Sourcing not provided, assume to be FEC data. Data appears inconsistent with table below.
Disclaimer: This document reflects the views of the author, not the DNC. The DNC was not provided with the underlying sourcing, interviews, or supporting data for many of the assertions contained herein and therefore cannot independently verify the claims presented. **
2024 Independent Expenditure Analysis
- Independent expenditures in 2024 were almost entirely dedicated to program costs like media and voter contact, accounting for over 99 percent of disclosed spending.
- The data reveals a strategic divide where Democratic groups held a $105 million advantage in advertising, while Republican groups led voter contact spending by $72.7 million.
- Independent expenditure committees appear more efficient than traditional campaigns because their parent organizations often absorb overhead and staffing costs.
- Democratic voter contact efforts suffered from late-cycle fundraising, which delayed hiring and limited the scale of their ground game compared to previous cycles.
- Reported figures may undercount the total progressive investment because nonpartisan organizing efforts are not reflected in independent expenditure disclosures.
- The scale of independent expenditures varies wildly, with 840 organizations reporting spending between one dollar and over half a billion dollars.
This is one of the key ways independent expenditures differ from campaigns and parties – with an overwhelming set of investments going to “program” rather than to overhead.
167 are definitional questions about what constitutes a specific category of expense. For example, is a text message an advertisement or voter contact? Is a mailer intended to persuade an ad or voter contact? For the purposes of this analysis – the more traditional definition of an ad – in print, television, radio, or digital – and all of the attendant production, placement and delivery costs are considered an advertising expense. Canvassing, phone banking, direct mail, and yard signs are considered voter contact. Each expense was reviewed and coded to these categories. The spending numbers also slightly differ from the aggregate totals reported above – due to the way some expenses are estimated and later reconciled during the campaign season. In 2024, massive investments in media and voter contact dominated the share of independent expenditure spend – accounting for more than 99 percent of disclosed independent expenditures on behalf of both parties. 2024 Independent Expenditures by Category and Party
This is one of the key ways independent expenditures differ from campaigns and parties – with an overwhelming set of investments going to “program” rather than to overhead. Again – many independent expenditures are made by committees with large staffs and much larger budgets, but most of those costs are borne by the organization, which makes the independent expenditures look more efficient when viewed solely through the lens of the reported expenditures. Independent expenditures vary in size and scope – with 840 organizations reporting expenditures ranging from as low as one dollar to more than half a billion dollars. Breaking these down by the office sought and party provides a more informed insights into how decision makers sought to influence campaign outcomes.
Sourcing not provided, assume to be based on FEC data coded per methodology outlined above.
Disclaimer: This document reflects the views of the author, not the DNC. The DNC was not provided with the underlying sourcing, interviews, or supporting data for many of the assertions contained herein and therefore cannot independently verify the claims presented. **
168 Presidential IE Spending Filtering the expenses made on behalf of the two major party nominees reflects a Democratic spending advantage on media and a Republican spending advantage on voter contact. 2024 Presidential Independent Expenditures by Category and Party
Democratic IEs spent $781.3 million on Advertising either supporting Biden/Harris or opposing Trump, while Republican IEs spent $676.3 million either supporting Trump or opposing Biden/Harris – a Democratic advantage of $105.0 million. In Voter Contact – Republican IEs spent $186.8 million in support of Trump or in opposition to his opponents, while Democratic IEs spent $114.0 million in support of Biden/Harris or in opposition to Trump – a Republican advantage of $72.7 million. The relatively low Democratic voter contact spend is not necessarily intentional. There are many who critique the relatively late arrival of funds in the 2024 cycle, and organizations generally agreed they needed more funds and sooner to make up for what Republicans were investing in the ground game. The broader progressive ecosystem does invest heavily in nonpartisan organizing well before the election draws near, and those investments are not reflected in independent expenditure reporting. Yet, to a one, these organizations agreed fundraising was a challenge in 2024, with less money than 2018 or 2020, and later in the cycle. The late fundraising delayed hiring and
No source material or data provided. Unsourced claims cannot be independently verified. Sourcing not provided, assume to be based on FEC data coded per methodology outlined above.
Strategic Reform and Spending Gaps
- The author argues that Democratic organizing programs often suffer from late deployment and a lack of long-term local capacity compared to Republican cultural engagement.
- Future success requires a shift from temporary 'vended' efforts that spin up each fall to directed investments in building permanent local infrastructure.
- There is an urgent need for the Democratic ecosystem to reform research, messaging, and accountability to counter massive right-wing investments projected for 2026-2028.
- Financial data from 2024 Senate races reveals a significant Republican advantage in independent expenditures, totaling over $123 million more in advertising.
- In critical single-digit Senate contests, Republican independent expenditures outpaced Democratic spending in seven out of eleven races.
- The text emphasizes that leaders must diversify investments across multiple agile organizations to meet evolving electoral needs and real-time messaging shifts.
It’s a lot easier for Republicans to close the deal when they have been engaging voters through culture around the calendar and Democrats show up at the end of each cycle, seeking to inform and persuade at the last moment.
Disclaimer: This document reflects the views of the author, not the DNC. The DNC was not provided with the underlying sourcing, interviews, or supporting data for many of the assertions contained herein and therefore cannot independently verify the claims presented. **
169 deployment, limited scope of the overall program, and shortened the windows for voter persuasion – in some instances after voting was underway in some states. Funders and their advisors need to consider how to assess and define organizing and voter contact in 2026 and beyond. Quality programs work, and need investment. Tools and tactics evolve with the times, so what do independent organizing programs look like – is it vended effort which spins up and down each fall? Or is directed investments in local capacity to build to win and build to last? There also needs to be consideration of approaches to research, advertising, messaging, and branding. It’s a lot easier for Republicans to close the deal when they have been engaging voters through culture around the calendar and Democrats show up at the end of each cycle, seeking to inform and persuade at the last moment. Stakeholders need to recognize how messaging and advertising are evolving in real time. Research needs to be scrutinized for effectiveness and innovation. Delivery needs evaluation, as does messenger. Leaders need to think through how to diversify investments across multiple organizations to ensure there are agile investments to meet the electoral needs of the moment. Despite the 2024 electoral outcomes, there are also many positive lessons from 2024 (and 2025). How those insights are shared, and how they are absorbed will be an important test for leaders and stakeholders. What does reform, growth, and optimization look like? How can lanes and responsibilities be defined – and how will organizations then be held accountable for actions and outcomes? The ecosystem needs to have these conversations – and quickly – to overcome what will likely be massive right-wing investments in 2026, 2027, and 2028. Senate IE Spending Senate independent expenditures show a similar focus on Advertising and Voter Contact. When evaluating independent expenditures made on behalf of the 89 campaigns across the 34 Senate campaigns on the ballot in 2024, Democratic IEs spent $524.7 million on Advertising to support Democrats (or Independents) against Republicans, while Republican IEs spent $647.9 million to support Republicans or oppose Democrats – a Republican advantage of $123.5 million.
Disclaimer: This document reflects the views of the author, not the DNC. The DNC was not provided with the underlying sourcing, interviews, or supporting data for many of the assertions contained herein and therefore cannot independently verify the claims presented. **
170 2024 Senate Independent Expenditures by Category and Party
In Voter Contact – Republican IEs spent $80.6 million in support of Republicans or in opposition to Democrats/Independents, while Democratic IEs spent $64.0 million in support of Democrats or Independents or in opposition to Republicans - a Republican advantage of $16.5 million. In narrowing the focus to the eleven Senate races decided by single digits, Republican independent expenditures exceeded Democrats and Independents in seven of the eleven contests. Senate Independent Expenditures by Category and Party (Single-Digit Contests)
Democrats and Independents combined for $556.4 million in independent expenditures, while Republicans totaled $665.4 million – a $108.9 million Republican advantage.
Sourcing not provided, assume to be based on FEC data coded per methodology outlined above.
Sourcing not provided, assume to be based on FEC data coded per methodology outlined above. Table appears to contain mathematical errors.
Independent Expenditure Spending Analysis
- Republicans held a significant $97.9 million advantage in Senate advertising expenditures and a $12.9 million lead in voter contact.
- Democratic Senate independent expenditures were more highly concentrated in the most competitive 'single digit' contests compared to Republican spending.
- House Democrats reversed the Senate trend, maintaining an $86.3 million advantage in total independent expenditures over their Republican counterparts.
- In House races, Democrats outspent Republicans on advertising by $96.4 million, while Republicans maintained a lead in voter contact spending.
- The vast majority of financial resources in both chambers were funneled into districts and states decided by single-digit margins.
- The DNC issued a formal disclaimer noting that the data provided lacks underlying sourcing and contains potential mathematical errors.
House Democrats were on the positive side of the ledger for independent expenditures.
Disclaimer: This document reflects the views of the author, not the DNC. The DNC was not provided with the underlying sourcing, interviews, or supporting data for many of the assertions contained herein and therefore cannot independently verify the claims presented. **
171 Independent expenditures invested $590.3 million in Advertising on behalf of Republicans, and $492.3 million on behalf of Democrats – a $97.9 million Republican advantage; and $74.5 million in Voter Contact on behalf of Republicans compared to $61.6 million for Democrats, a $12.9 million Republican advantage. 2024 Senate Independent Expenditures by Category and Party (Single Digit Contests)
The independent expenditures for Democrats were more concentrated in these tighter contests – 94.1 percent of total Senate Democratic IEs were in these 11 states, compared to 91.1 percent for the Republican IEs. The highest aggregate spending was in the most competitive contests – is it should have been. House IE Spending Unlike the Senate, House Democrats were on the positive side of the ledger for independent expenditures. $543.7 million was spent on behalf of House Democrats, and $457.3 million was spent on behalf of House Republicans, an $86.3 million Democratic advantage.
Sourcing not provided. Table also does not align with title and appears to contain mathematical errors.
Disclaimer: This document reflects the views of the author, not the DNC. The DNC was not provided with the underlying sourcing, interviews, or supporting data for many of the assertions contained herein and therefore cannot independently verify the claims presented. **
172 House Independent Expenditures by Category and Party
House independent expenditures show a similar focus in spending on Advertising and Voter Contact. Democratic IEs spent $478.0 million on Advertising to support Democrats or oppose Republicans, while Republican IEs spent $381.6 million to support Republicans or oppose Democrats – a Democratic margin of $96.4 million. Republican IEs outspent Democratic IEs in Voter Contact - $74.6 million to $62.5 million, an $11.9 million Republican advantage. As with the Senate, the contests decided by single digits attracted most of the independent spending. In the 69 districts decided by single districts (46 Democratic and 23 Republican), spending reached $796.2 million, with $428.4 spent on behalf of Democrats, and $367.7 million spent on behalf of Republicans. House Independent Expenditures by Category and Party (Single-Digit Contests)
Sourcing not provided, assume to be based on FEC data coded per methodology outlined above. Sourcing not provided, assume to be based on FEC data coded per methodology outlined above.
Disclaimer: This document reflects the views of the author, not the DNC. The DNC was not provided with the underlying sourcing, interviews, or supporting data for many of the assertions contained herein and therefore cannot independently verify the claims presented. **
Independent Expenditures and Redistricting
- Nearly 80 percent of independent spending for both parties was concentrated in highly competitive single-digit contests.
- Democrats maintained a significant $73 million advantage in advertising expenditures, while Republicans led in voter contact spending.
- The author argues that Democratic investments successfully defended a large field despite top-of-the-ticket headwinds.
- Republicans are accused of aggressively redrawing congressional maps to counter unfavorable demographic and mathematical trends.
- Strategic recommendations include defining clear 'lanes' for negative messaging to protect candidate reputations.
- Future success depends on investing in partisan voter registration and organizing ahead of the 2030 Census redistricting.
They see the math and maps, and since they cannot change the math of the existing lines, they are trying to change the maps.
173 78.7 percent of the total independent spend on behalf of Democrats was invested in these single-digit contests, and 80.4 percent of the total spend for Republicans. There is a growing trend of independent expenditures made in primaries – either within the party, or across party lines to shape ballot choice for general elections. Within the 69 districts, independent expenditures on Advertising reached $383.3 million on behalf of Democrats and $310.7 million, on behalf of Republicans – a $73.0 million advantage for Democrats. Independent expenditures on Voter Contact reached $56.6 million for Republican and $43.1 million for Democrats, a $13.4 million advantage for Republicans. While the parties spent more on “defense” than “offense,” the allocations make sense. Independent expenditures averaged $11.5 million per district, with the average IE on behalf of Democrats reaching $6.2 million, and the average on behalf of Republicans reaching $5.3 million. House Average Independent Expenditures by Party (Single-Digit Contests) Democrats invested more on defense than Republicans, and Democrats have a larger field to defend, so the takeaway should be these investments worked as intended. Had the headwinds at the top of the ticket been less, House Democrats are likely in the majority. This is why Republicans are rigging congressional lines across the country. They see the math and maps, and since they cannot change the math of the existing lines, they are trying to change the maps. As leaders and stakeholders consider next steps, and as court cases and advisory opinions reshape the way money moves across the electoral ecosystem, there are a few key recommendations. ● Define lanes for communications ecosystem. Who will carry contrast and negative messaging so candidates go high as other entities go low. This was a major failing in 2024, and it cannot be repeated. Set the lanes and hold organizations accountable. ● Define what effective organizing will be in 2026 and 2027 as a prelude to 2028 and the 2030 Census and the next round of redistricting. The waves of right-wing spending are coming – and organizing will make the difference. ● Invest in partisan voter registration – where permissible and possible.
Sourcing not provided, appears calculation is based on tables above.
Disclaimer: This document reflects the views of the author, not the DNC. The DNC was not provided with the underlying sourcing, interviews, or supporting data for many of the assertions contained herein and therefore cannot independently verify the claims presented. **
The Political Spending Ecosystem
- Billions of dollars in independent expenditures are controlled by a very narrow cohort of political professionals.
- A small group of 'blessed' organizations, such as the Senate Leadership Fund and House Majority PAC, dominate spending across multiple cycles.
- Presidential Super PACs like Future Forward and Priorities USA shift roles based on the specific nominee and leadership approval.
- The current system relies heavily on legacy tactics and established relationships rather than proven innovation.
- There is an urgent need to upskill organizing staff and invest earlier to identify and turn out supporters effectively.
- Stakeholders must question if massive resources are being properly invested as voter behavior and marketing technology evolve.
The organizations making independent expenditures are known to few, but those few matter.
174 ● Upskill organizing staff to meet the moment. Support testing and innovation of tools and tactics through the combination of old and new. ● Invest earlier to scale earlier to identify and turn out supporters earlier. Where Did the Money Go? Billions of dollars in independent expenditures. Billions more on the hard side to shape electoral choice. A relatively narrow cohort of professionals making decisions impacting the planet. The organizations making independent expenditures are known to few, but those few matter. The people running the organizations leading the charge for the Senate and House are known to stakeholders and are “blessed” by Leadership to manage majority-making or majority-preserving strategies. These people are deeply experienced – having worked at the campaign committees and in states, with multiple winning elections on their baseball cards. This is why the same eight organizations – Senate Leadership Fund, Congressional Leadership Fund, NSRC and NRCC for the Republicans, and Senate Majority PAC (SMP), House Majority PAC (HMP) and the DSCC and DCCC for Democrats – have driven the majority of spending on behalf of their candidates for multiple cycles. For presidential IEs, the process is subject to the nominee. Priorities USA was created for the Obama re-elect in 2012, and became the “blessed” Super PAC for Hillary Clinton in 2016. Priorities pivoted to support the Senate in 2018, and was the second-largest spender in 2020 after Future Forward, and ahead of American Bridge and Unite the Country as shown above. Had another candidate emerged, there might have been different choices made, or there might have been no designated Super PAC, similar to 2008. Regardless, Future Forward took the lead for 2020 and 2024, even as many other organizations continued to invest in the Biden and Harris campaigns. There is also more money than ever pouring into the ecosystem. Leaders and stakeholders need to inquire whether these resources are being properly invested as marketing and voters change. Loyalty is not necessarily the question – but is the ecosystem moving more money into tested vehicles or legacy tactics? Is there sufficient innovation and accountability to ensure the 2026 cycle is successful and a building block for an effective majority party strategy? No sourcing provided; analysis appears to be based on public FEC data.
Disclaimer: This document reflects the views of the author, not the DNC. The DNC was not provided with the underlying sourcing, interviews, or supporting data for many of the assertions contained herein and therefore cannot independently verify the claims presented. **
Political Vendor Ecosystem Analysis
- Independent expenditures in House and Senate races are dominated by a small group of elite media and voter contact firms.
- A single firm, Waterfront Strategies, manages nearly half of all Democratic independent expenditures across both chambers.
- Republican spending shows a heavy reliance on direct mail services and firms like Blitz Canvassing and the Koch-owned In Pursuit Of LLC.
- The top ten vendors for each party control a supermajority of the total spend, reaching as high as 84.5 percent in Democratic Senate races.
- Analyzing these established patterns is essential for stakeholders to design more effective voter communication strategies for 2026 and 2028.
The largest on the Democratic side, Waterfront Strategies, accounted for 43 percent of all House Democratic independent expenditures, while the largest on the Republican side, Flexpoint Media LLC accounted for 44.4 percent.
175 For 2026, 2028 and beyond, there may or not be change – but part of the assessment is understanding the patterns and practices of the existing ecosystem to discern whether improvements can be made. To this end, a quick recap of the movers and shakers within the vendor ecosystem can shed some light for leadership, stakeholders, and activists to prime the conversation for how both the independent side and hard side can rethink investment in our current context, and design new forms of voter communication and engagement to meet the needs of today and the future. House IE Vendors In the House, the top ten vendors on each side of the partisan divide accounted for a supermajority of independent expenditures. The largest on the Democratic side, Waterfront Strategies, accounted for 43 percent of all House Democratic independent expenditures, while the largest on the Republican side, Flexpoint Media LLC accounted for 44.4 percent of all House Republican independent expenditures. Most of the top ten spenders are media firms, and these payments likely represent the gross media expenditures these firms made on behalf of clients. Top Ten House Democratic IE Payees (75.0 Percent of Total IE Spend)
OTG Strategies is a paid voter contact firm, which organizes voter engagement. Top Ten House Republican IE Payees (76.6 percent of Total IE Spend)
Sourcing not provided, assume to be FEC data. Sourcing not provided, assume to be FEC data.
Disclaimer: This document reflects the views of the author, not the DNC. The DNC was not provided with the underlying sourcing, interviews, or supporting data for many of the assertions contained herein and therefore cannot independently verify the claims presented. **
176 On the Republican side, Blitz Canvassing was the main voter contact spender. The payments to the US Postal Service are postage for direct mail – more voter contact.
Disclaimer: This document reflects the views of the author, not the DNC. The DNC was not provided with the underlying sourcing, interviews, or supporting data for many of the assertions contained herein and therefore cannot independently verify the claims presented. **
177 Senate IE Payees In the Senate, there are a few repeat vendors in both parties, and spending was even more concentrated on the Democratic side. Waterfront Strategies is again the top payee for Democrats at $259.6 million, 47.4 percent of all Democratic independent expenditures. OTG Strategies and Targeted Platform Media also make repeat appearances for Democrats. The top ten vendors accounted for 84.5 percent of Senate Democratic independent expenditures. Top Ten Senate Democratic IE Payees (84.5 Percent of Total IE Spend)
On the Republican side, Main Street Media Group is the top payee, at $250.4 million and 37.3 percent of the overall Republican independent expenditures. Repeat payees are In Pursuit Of LLC, the Koch-owned firm, Medium Buying LLC, Nebo Media Inc, and the US Postal Service, again highlighting the Republican usage of direct mail.
Sourcing not provided, assume to be FEC data.
Disclaimer: This document reflects the views of the author, not the DNC. The DNC was not provided with the underlying sourcing, interviews, or supporting data for many of the assertions contained herein and therefore cannot independently verify the claims presented. **
Concentrated Political Spending Trends
- A small group of elite vendors dominates the independent expenditure (IE) market, with the top 30 payees capturing 74 percent of the total $3.74 billion spend.
- Waterfront Strategies emerged as the leading Democratic payee, securing $425.4 million or nearly half of all Democratic Presidential IE funds.
- Republican spending patterns show a significant investment in direct voter contact through firms like Blitz Canvassing and In Field Strategies.
- Del Rey Media led the Republican side with $319.4 million in expenditures, representing over a third of their total presidential IE spend.
- The data reveals a high rate of repeat business for specific media and strategy firms across Presidential, Senate, and House races.
The top 30 payees from both parties account for 74.0 percent of the total IE spend – or $2.77 billion of the overall $3.74 billion IE spend.
178 Top Ten Senate Republican IE Payees (76.9 Percent of Total IE Spend)
These top ten vendors accounted for 76.9 percent of Senate Republican independent expenditures. Presidential IE Payees Presidential elections draw the most independent spenders and a much larger pool of money. There were again some repeat vendors for both parties. Waterfront Strategies again led all payees, with $425.4 million, or 46.9 percent of all Democratic Presidential independent expenditures. OTG strategies appeared for the third time, with Amplify Media and Wavelength Strategy making second appearances. The top ten payees accounted for 71.7 percent of Democratic Presidential independent expenditures. Top Ten Presidential Democratic IE Payees (71.7 percent of IE Spend)
Sourcing not provided, assume to be FEC data.
Sourcing not provided, assume to be FEC data.
Disclaimer: This document reflects the views of the author, not the DNC. The DNC was not provided with the underlying sourcing, interviews, or supporting data for many of the assertions contained herein and therefore cannot independently verify the claims presented. **
179 On the Republican side, Del Rey Media was the top payee at $319.4 million, or 36.8 percent of the overall Republican independent expenditures. Nebo Media makes its third appearance, and Blitz Canvassing makes a second appearance, with In Field Strategies also listed – indicating the comparatively large investments in direct voter contact by Republicans. Top Ten Presidential Republican Payees (75.8 Percent of Total IE Spend)
Sourcing not provided, assume to be FEC data.
Disclaimer: This document reflects the views of the author, not the DNC. The DNC was not provided with the underlying sourcing, interviews, or supporting data for many of the assertions contained herein and therefore cannot independently verify the claims presented. **
180 Combined IE Spending Combining the spending from the Presidential, Senate, and House independent expenditures highlights the concentration of spending among a relatively small group of vendors and organizations. The top 30 payees from both parties account for 74.0 percent of the total IE spend – or $2.77 billion of the overall $3.74 billion IE spend Top 30 Payees by Party – 74.0 Percent of Total IE Spend
Sourcing not provided, assume to be FEC data.
Disclaimer: This document reflects the views of the author, not the DNC. The DNC was not provided with the underlying sourcing, interviews, or supporting data for many of the assertions contained herein and therefore cannot independently verify the claims presented. **
Democratic Congressional Spending Patterns
- House Democratic candidate committees outspent their Republican counterparts in 2024, totaling $891.7 million across 1,114 active committees.
- Spending for House Democrats was heavily concentrated in competitive districts, where nominees averaged $5.69 million per contest.
- Strategic shifts in competitive races saw candidates prioritize high-cost advertising over administrative overhead and direct voter contact.
- The 'zombie committees' of former officials remain active, contributing to the total number of committees even when candidates are not on the ballot.
- Senate Democratic spending reached nearly $1 billion, with 69.8 percent of funds in competitive states allocated specifically to advertising.
- A small group of elite media and fundraising firms dominate the financial landscape, with the top 25 Senate payees receiving over 80 percent of all spending.
This includes so-called zombie committees of former elected officials, who continue to spend money through their campaign accounts even if they have no immediate intention to run again for office.
181 How the candidate committees spend money is the next question – with approaches based on strategic needs specific to each candidate matchup. House Democratic Spending All federal candidate committees are required to disclose spending, even if candidates are not on the ballot. This includes so-called zombie committees of former elected officials, who continue to spend money through their campaign accounts even if they have no immediate intention to run again for office. In the House, there were 1,114 active Democratic candidate committees in 2024, even though there were far fewer active campaigns. All active committees combined to spend $891.7 million. For House Republicans, 1,307 candidate committees combined to spend $809.4 million. Among the Democrats, effort and spending was concentrated in the most competitive seats. Democrats were on the ballot in 68 of the 69 seats (Washington has an open primary system, and the top two finishers in WA-04 were Republican). The 68 nominees spent a combined $387.3 million, an average of $5.69 million per contest. House Candidate Spending by Competitive Status
What is important is how the competitive Democrats spent less on Administrative Overhead and more on Advertising. There is less spent on Voter Contact, which can be borne by an
No sourcing provided for many claims in this section.
Sourcing not provided, assume to be based on FEC data coded per methodology outlined above.
Disclaimer: This document reflects the views of the author, not the DNC. The DNC was not provided with the underlying sourcing, interviews, or supporting data for many of the assertions contained herein and therefore cannot independently verify the claims presented. **
182 effective coordinated campaign in service to the whole ticket, and those expenditures are usually made with the state party. There were more than 25,000 payees across the House Democratic candidate committees. GMMB – a leading media and placement firm was the top payee at 37.2 million, or 4.2 percent of the total House Democratic spend. The top 25 payees combined to spend $408.3 million, or 45.8 percent of the total spend. As expected, a majority of the top payees are media production or placement firms. Top 25 House Candidate Committee Payees (45.8 percent of Total Spend)
Senate Democratic Spending There were 185 active Democratic Senate candidate committees in 2024, which combined to spend $999.4 million. For Senate Republicans there were 241 committees which combined to spend 754.6 million.
Sourcing not provided, assume to be based on FEC data coded per methodology outlined above.
Disclaimer: This document reflects the views of the author, not the DNC. The DNC was not provided with the underlying sourcing, interviews, or supporting data for many of the assertions contained herein and therefore cannot independently verify the claims presented. **
183 The 31 Democratic nominees in the cycle (excluding the third-party candidates Angus King, Bernie Sanders, and Dan Osborn) combined to spend $823.0 million. $240.7 million was spent on the Non-Competitive campaigns, and $582.2 million was spent in the ten states (excluding Nebraska, decided by single digits. In the competitive states, $406.3 million, or 69.8 percent of the spend was allocated to Advertising, and $30.1 million, or 5.2 percent of the spend was allocated to Voter Contact. In most of these competitive races, the coordinated campaigns could carry the bulk of organizing and keep those costs off-budget for the Senate campaigns. Senate Candidate Spending by Competitive Status
The top 25 Senate payees were a mix of traditional media, digital media, and fundraising firms, and combined to spend $661.4 million, or 80.4 percent of all Democratic Senate spending.
Sourcing not provided, assume to be based on FEC data coded per methodology outlined above.
Democratic Federal Campaign Spending
- The Democratic Senate ecosystem utilized over 3,600 payees, yet a narrow cohort of firms managed the vast majority of institutional spending.
- The Biden-Harris presidential campaign committee spent over $1.15 billion, with 71 percent of that total dedicated specifically to advertising.
- Presidential campaigns often offload staffing and fundraising costs to the DNC and state parties to keep the main committee's overhead low.
- A unique $100 million investment in event production companies distinguished this presidential campaign's spending from previous cycles.
- Across all federal candidate spending, over $2.86 billion was distributed among 29,000 payees, showing a massive scale of financial activity.
- Despite the high number of vendors, there remains a significant concentration of capital within a small number of elite media and consulting firms.
It’s a lot of people and a lot of money.
Disclaimer: This document reflects the views of the author, not the DNC. The DNC was not provided with the underlying sourcing, interviews, or supporting data for many of the assertions contained herein and therefore cannot independently verify the claims presented. **
184 Top 25 Senate Candidate Committee Payees (80.4 percent of Total Spend)
There were more than 3,600 payees in the Democratic Senate ecosystem. The top payee for Senate Democrats was Grassroots Media at $118.9 million, or 14.5 percent of the total Senate spend. 23 of the top 25 Senate payees also worked for House candidates, and 14 of the top 25 are in common with the House top 25. Again, a relatively narrow cohort of firms managing most of the Democratic institutional spend. Presidential Democratic Spending The Biden-Harris/Harris-Walz campaign committee (the same entity renamed as part of the candidate switch to preserve the ability to spend the existing cash) spent more than $1.15 billion.
Sourcing not provided, assume to be based on FEC data coded per methodology outlined above.
Disclaimer: This document reflects the views of the author, not the DNC. The DNC was not provided with the underlying sourcing, interviews, or supporting data for many of the assertions contained herein and therefore cannot independently verify the claims presented. **
185 Presidential Campaign Spending by Category
$818.2 million, or 71.0 percent was spent on Advertising, followed by $101.3 million on campaign events, $88.6 million on Administration, Salary, and Overhead, and $65.6 million on voter contact. Presidential campaigns (especially when there is an incumbent) can rely on the DNC, state parties, and coordinated campaigns to place staff and to offload the associated costs from the main campaign committee. The fundraising costs are also low because most fundraising expenses were managed through the Joint Fundraising Committees instead of the campaign. The top 25 payees were a mix of media companies, event production companies, payroll, and travel support entities. These 25 payees and combined to spend $1.00 billion, or 86.9 percent of the total campaign committee spend.
Sourcing not provided, assume to be based on FEC data coded per methodology outlined above.
Disclaimer: This document reflects the views of the author, not the DNC. The DNC was not provided with the underlying sourcing, interviews, or supporting data for many of the assertions contained herein and therefore cannot independently verify the claims presented. **
186 Top 25 Presidential Campaign Payees (86.9 percent of Total Spend)
Overall, there were more than 2,000 payees for the campaign committee. Media Buying Analytics LLC – a dba for Canal Partners Media LLC – was the largest payee, at $333.5 million. The investment in production companies to support more than $100 million in spending on campaign events is unique to this presidential campaign. Their presence in the top 25 has pushed a few firms down who also worked on House and Senate campaigns. Combined Federal Candidate Spending Overall, there were more than 29,000 payees who received more than $2.86 billion. It’s a lot of people and a lot of money. However, there is still a significant reliance on paid media in campaigns, and a concentration of those investments in a relatively small number of firms.
Sourcing not provided, assume to be FEC data.
Disclaimer: This document reflects the views of the author, not the DNC. The DNC was not provided with the underlying sourcing, interviews, or supporting data for many of the assertions contained herein and therefore cannot independently verify the claims presented. **
Democratic Spending and Sustainability
- The top 30 Democratic payees received $1.90 billion, accounting for over 66 percent of all federal campaign expenses.
- The vast majority of this spending is directed toward media, digital fundraising firms, and contribution processing.
- Heavy investment in paid media and voter contact through phones or texting leaves little infrastructure behind for future campaigns.
- The author argues that current spending habits prioritize immediate election cycles over long-term party building.
- The report suggests that the 2024 cycle proved there is sufficient funding to invest in both winning and lasting party infrastructure.
- The DNC explicitly distances itself from the report's findings, noting that underlying data and sourcing were not provided for verification.
When an ecosystem invests so heavily in paid media, in fundraising, and events; or in paid voter “contact” through phones and texting, what gets left behind for the next campaign other than lists to rent or sell?
187 The top 30 Democratic payees across the federal candidate ecosystem received more than $1.90 billion, or 66.3 percent of all Democratic campaign expenses. $1.56 billion goes to media and most of the rest to digital/fundraising firms, or contribution processing. Top 30 Democratic Federal Candidate Committee Payees (66.3 percent of Total Spend)
Campaigns have to make choices with the time, options, and resources they have; so these may have been the proper decision in the moment, but are they best decisions for building a party?
Sourcing not provided, assume to be FEC data.
Disclaimer: This document reflects the views of the author, not the DNC. The DNC was not provided with the underlying sourcing, interviews, or supporting data for many of the assertions contained herein and therefore cannot independently verify the claims presented. **
188 When an ecosystem invests so heavily in paid media, in fundraising, and events; or in paid voter “contact” through phones and texting, what gets left behind for the next campaign other than lists to rent or sell? Building to win requires new thinking, and building to last requires thinking about more than the next election. It requires finding the best way to connect with the right voters in the right places, and if 2024 has proven anything, there is enough money to do it all the right way.
Disclaimer: This document reflects the views of the author, not the DNC. The DNC was not provided with the underlying sourcing, interviews, or supporting data for many of the assertions contained herein and therefore cannot independently verify the claims presented. **
189 CONCLUSION This section was not provided by the author.
Disclaimer: This document reflects the views of the author, not the DNC. The DNC was not provided with the underlying sourcing, interviews, or supporting data for many of the assertions contained herein and therefore cannot independently verify the claims presented. **
190 APPENDICES This section was not provided by the author.
Disclaimer: This document reflects the views of the author, not the DNC. The DNC was not provided with the underlying sourcing, interviews, or supporting data for many of the assertions contained herein and therefore cannot independently verify the claims presented. **
191 NOTES FOR THE READER While we extensively fact-check DNC After Action Report in order to ensure accuracy, it is always possible that mistakes remain. We encourage any readers who notice factual errors to reach out to use at XXXX@dnc.org. Mistakes will be corrected as quickly as possible, and any changes will be noted in the text. All numbers and figures are accurate as of xx/xx/2025. This section was not completed.
Disclaimer: This document reflects the views of the author, not the DNC. The DNC was not provided with the underlying sourcing, interviews, or supporting data for many of the assertions contained herein and therefore cannot independently verify the claims presented. **
192 SOURCES Empirical claims in the DNC After Action Report are based on publicly available evidence and are accompanied by a hyperlink to evidence supporting the claim. In addition, a traditional bibliography can be found here, and more data is provided in the Appendix below. We supplemented the publicly available data by interviewing more than 12,000 Democrats across all 57 state parties and territories. We conducted surveys with over 5,000 DNC members, voters, and supporters. We conducted these surveys and interviews from May 2025 - October 2025. All surveys and interviews and surveys were conducted by the DNC Office of Strategy and Innovation. Sources, interview materials, and other evidence not provided.