Generative illustration for Chapter 11: Weather and Climate Extreme Events in a Changing Climate

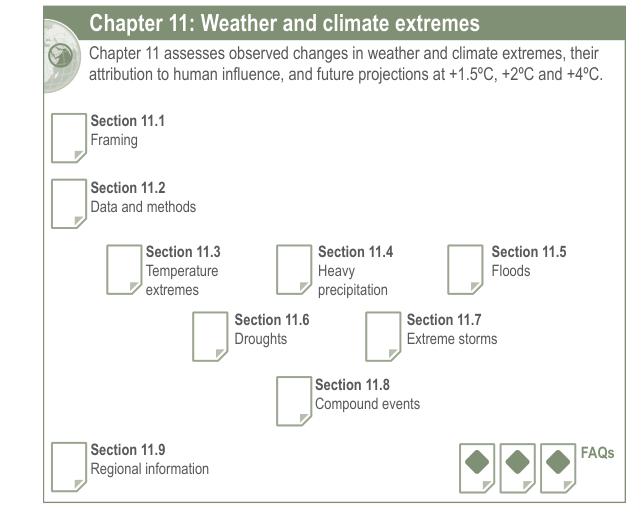




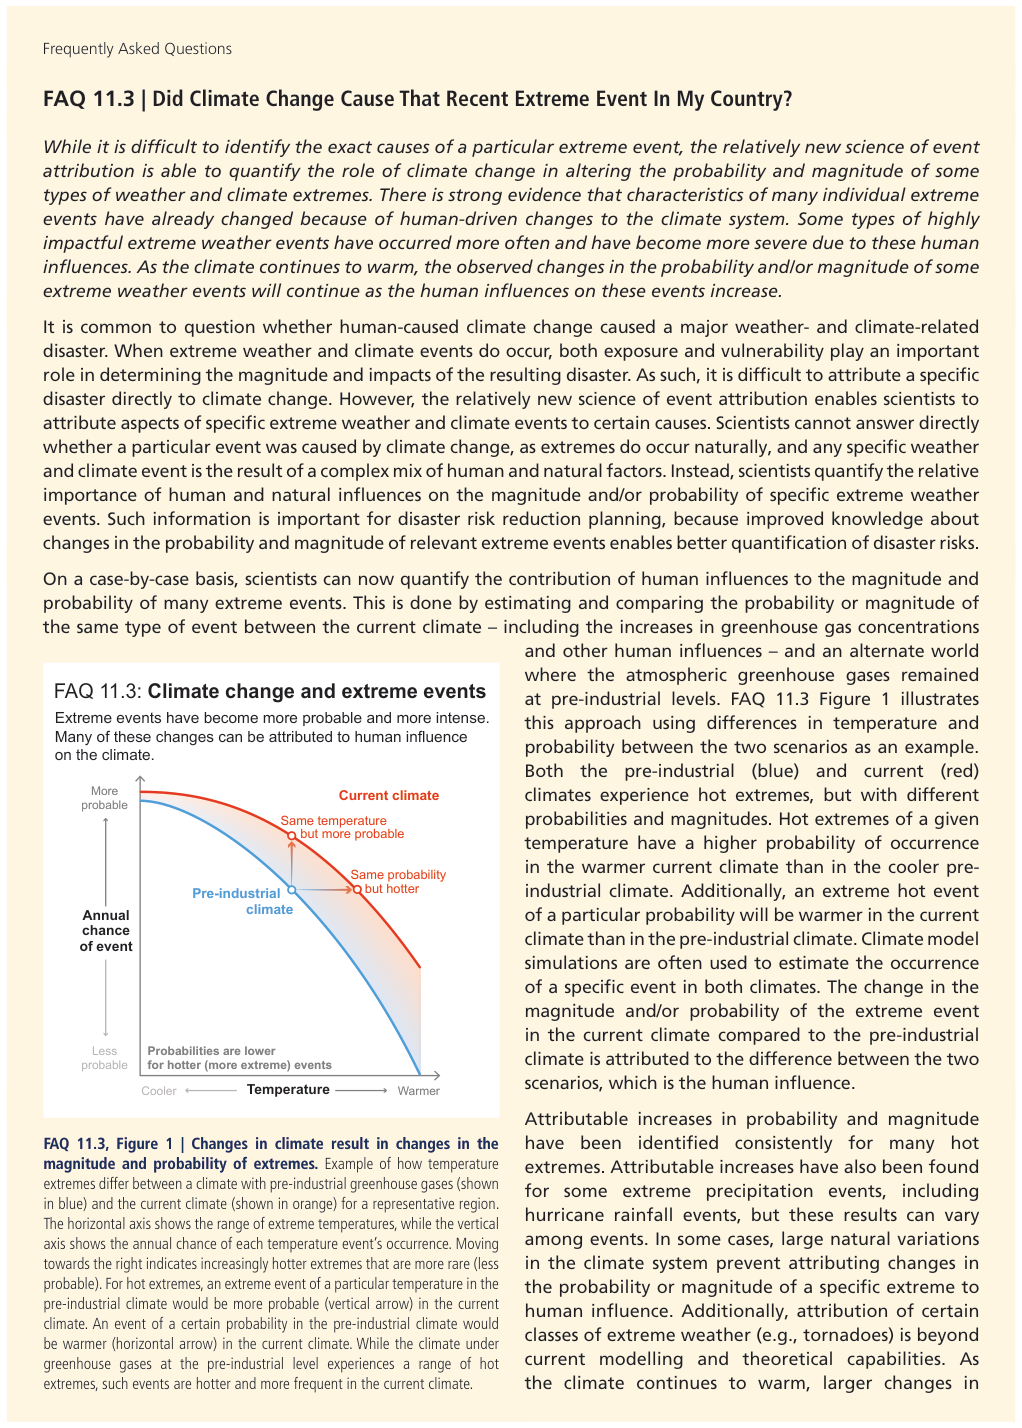
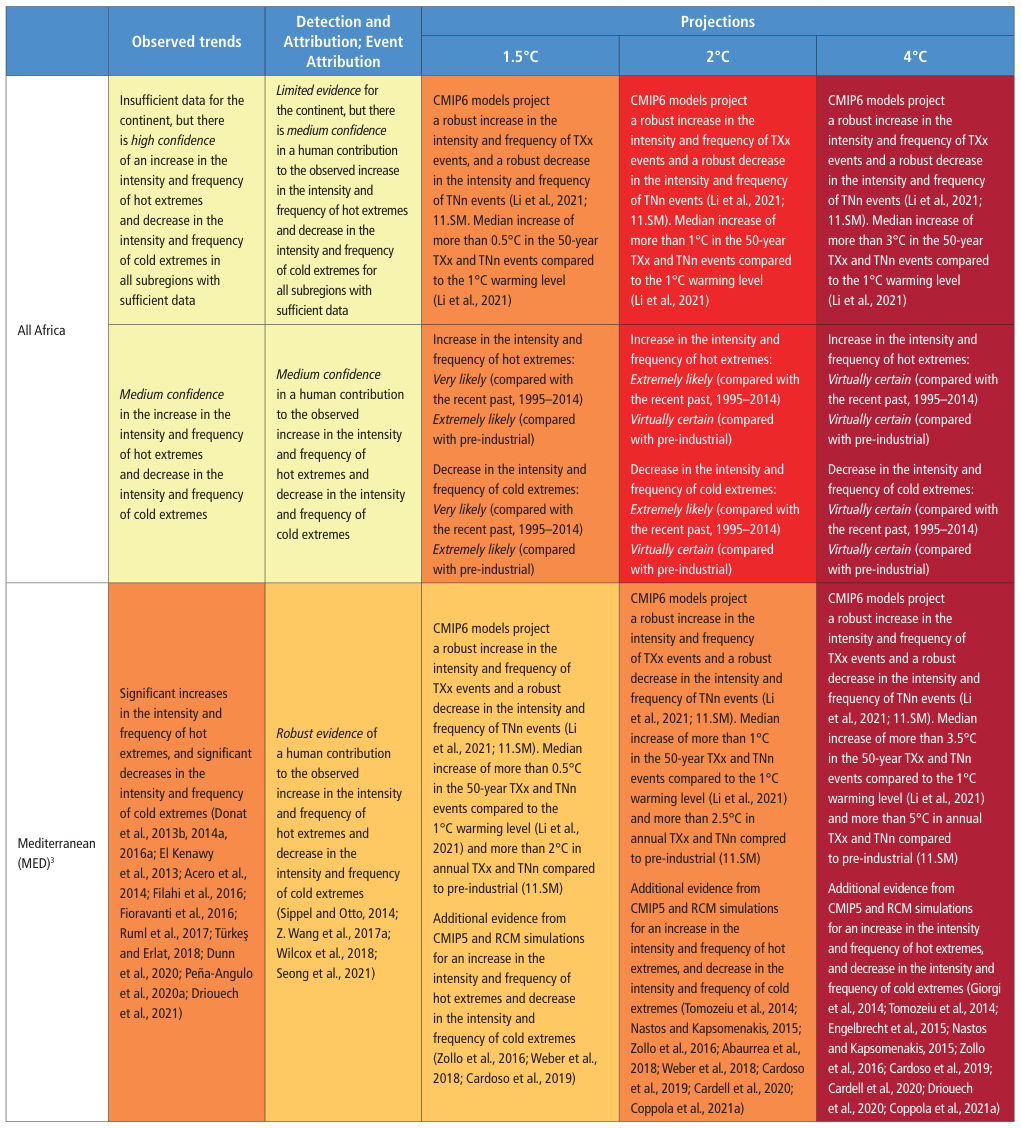
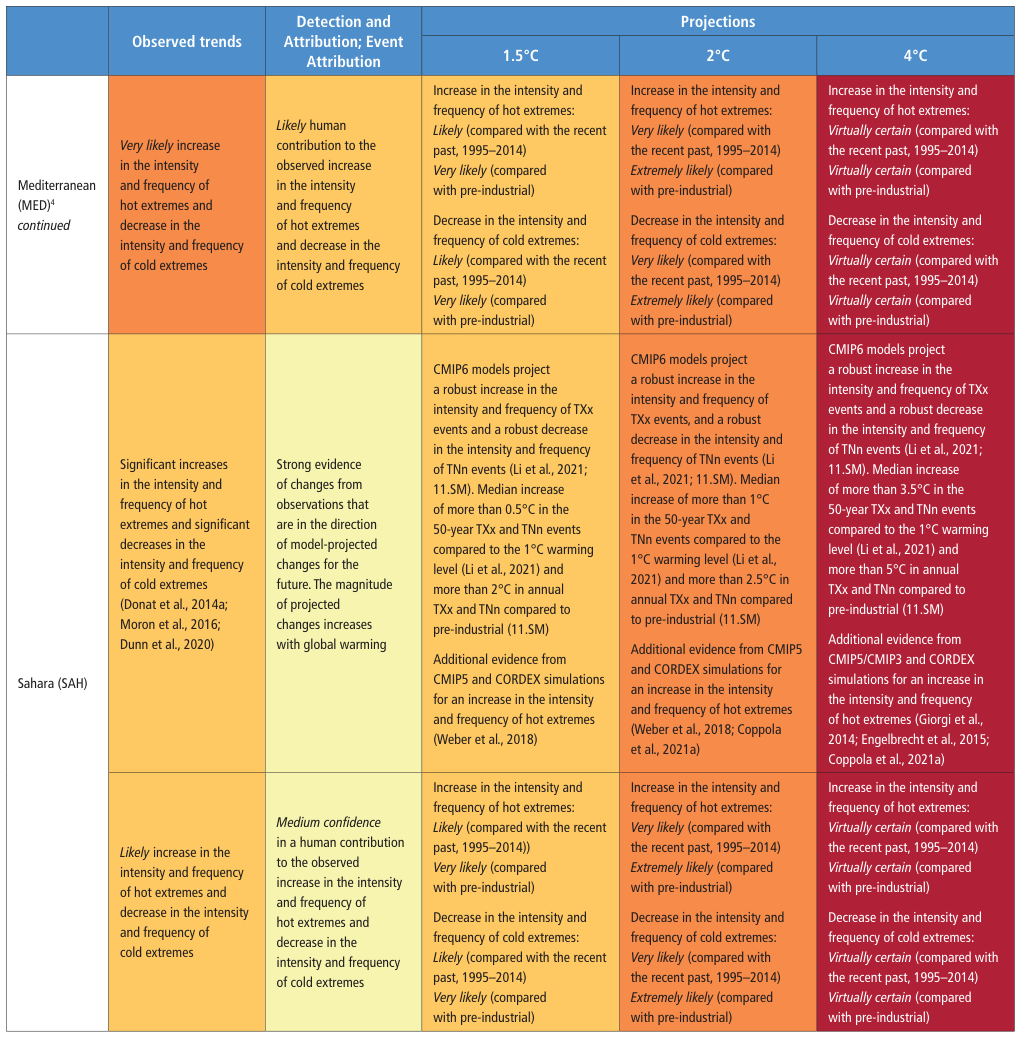
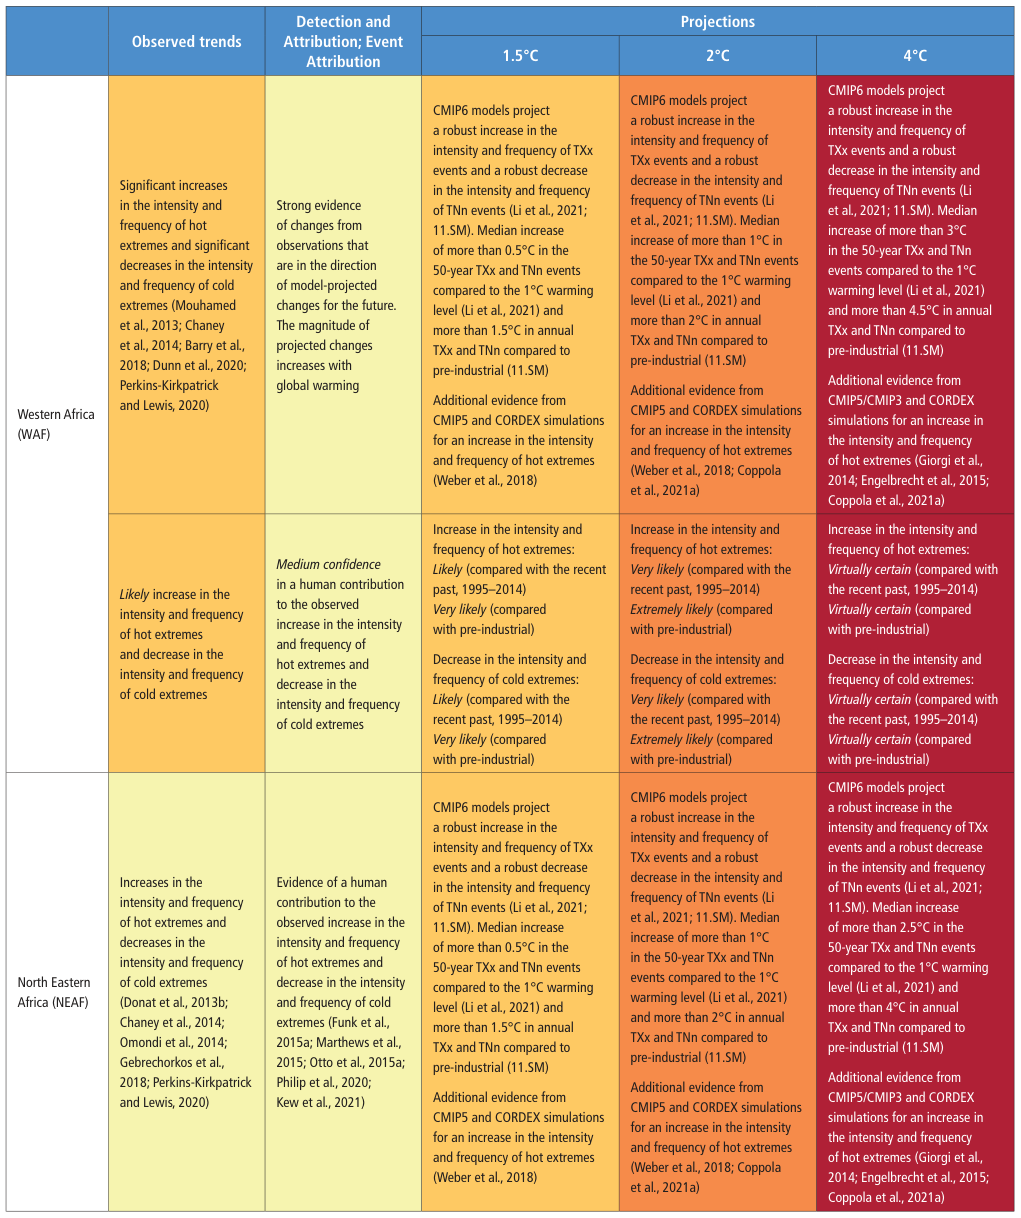
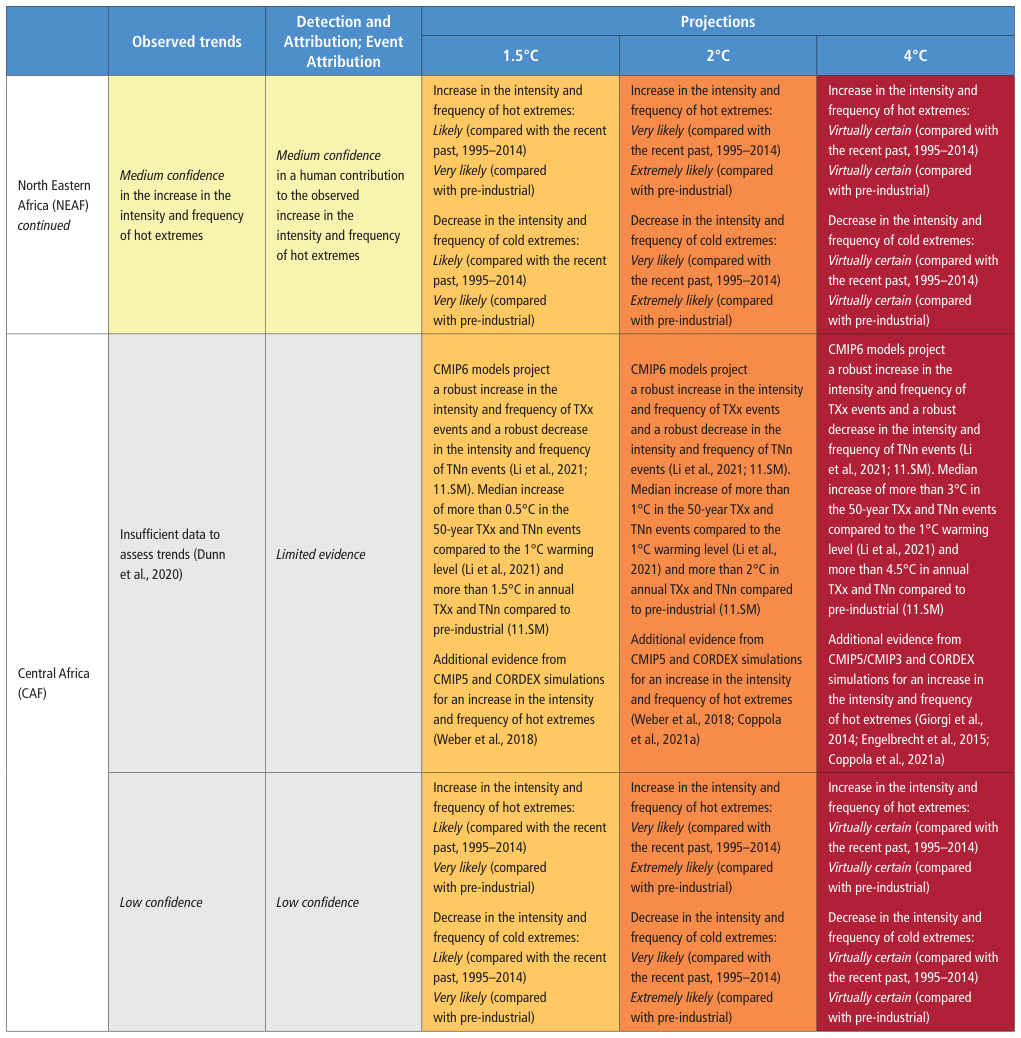
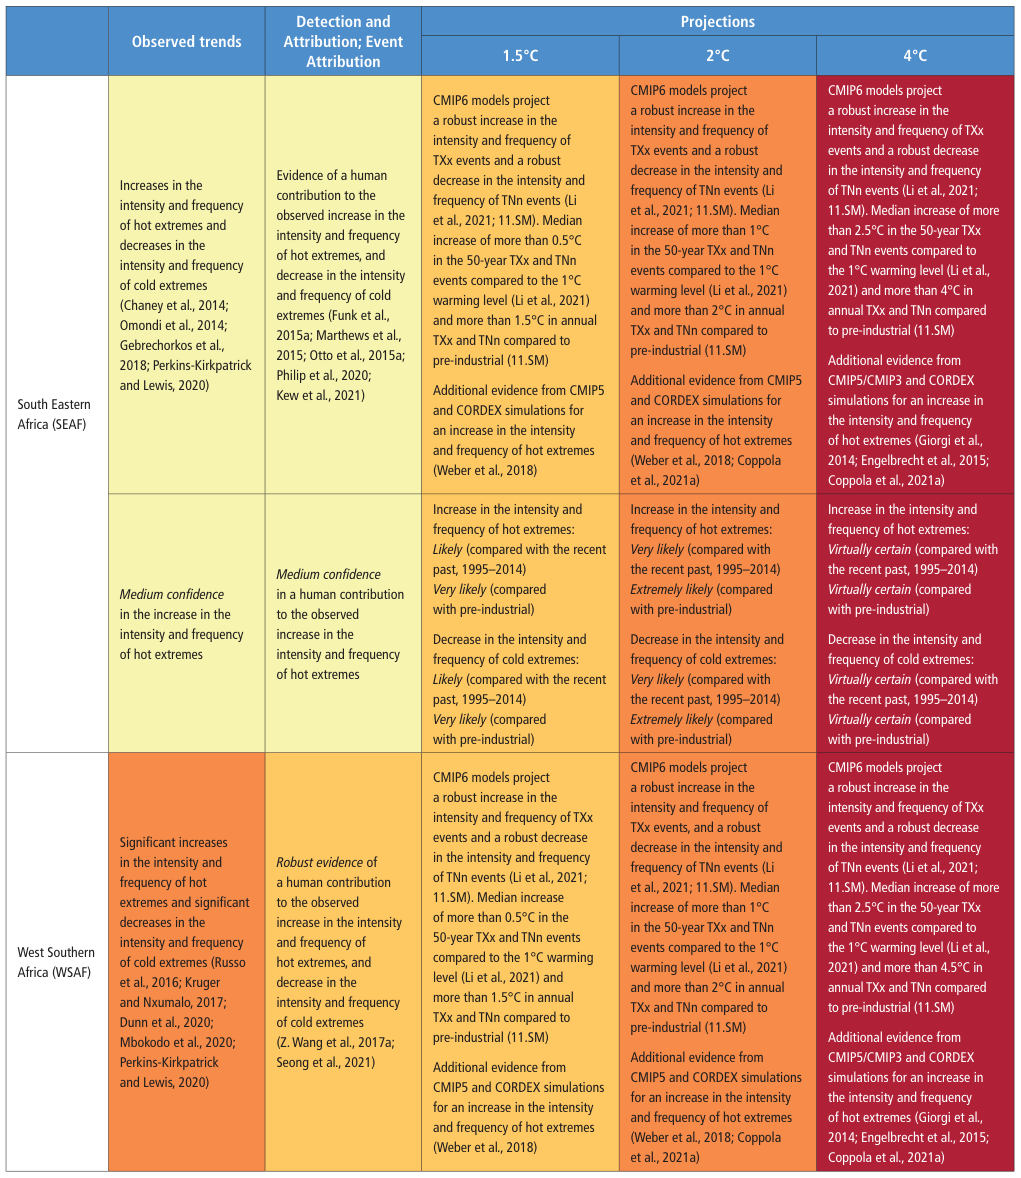
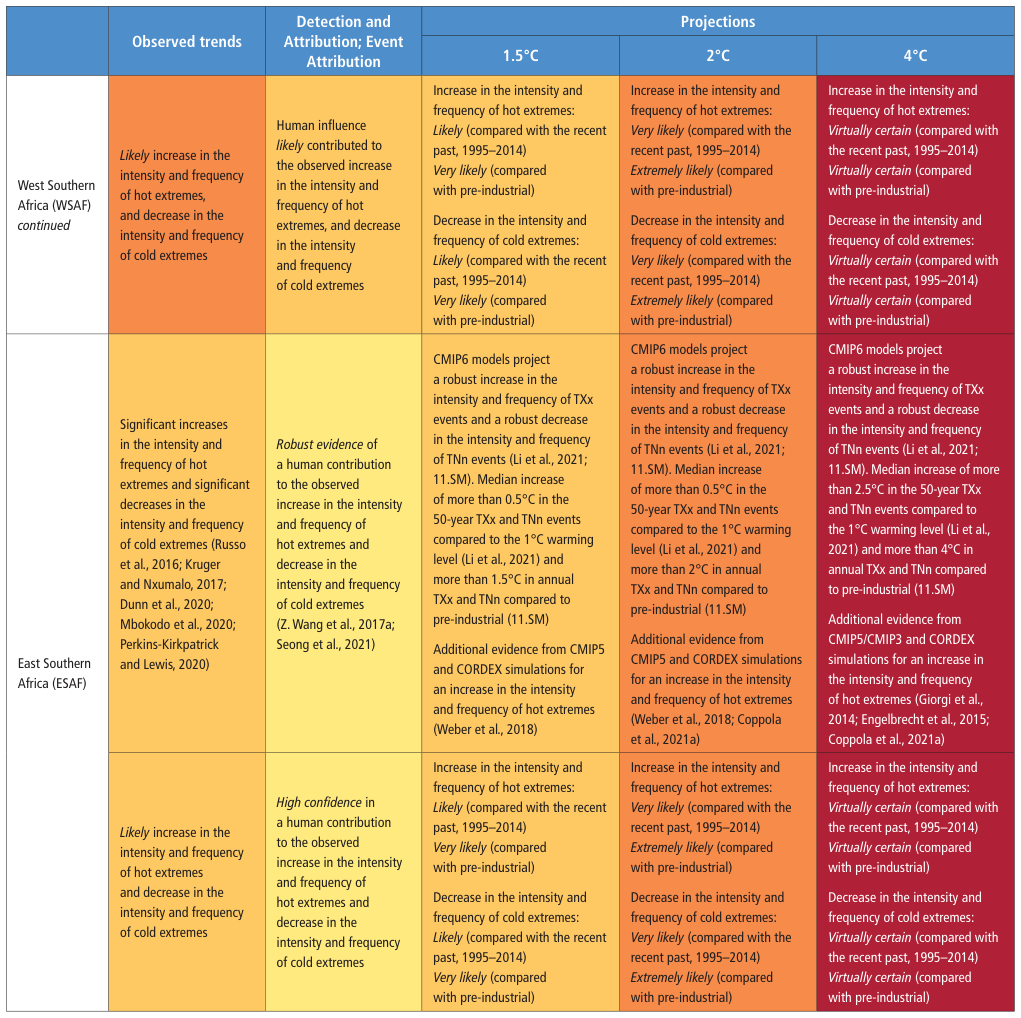
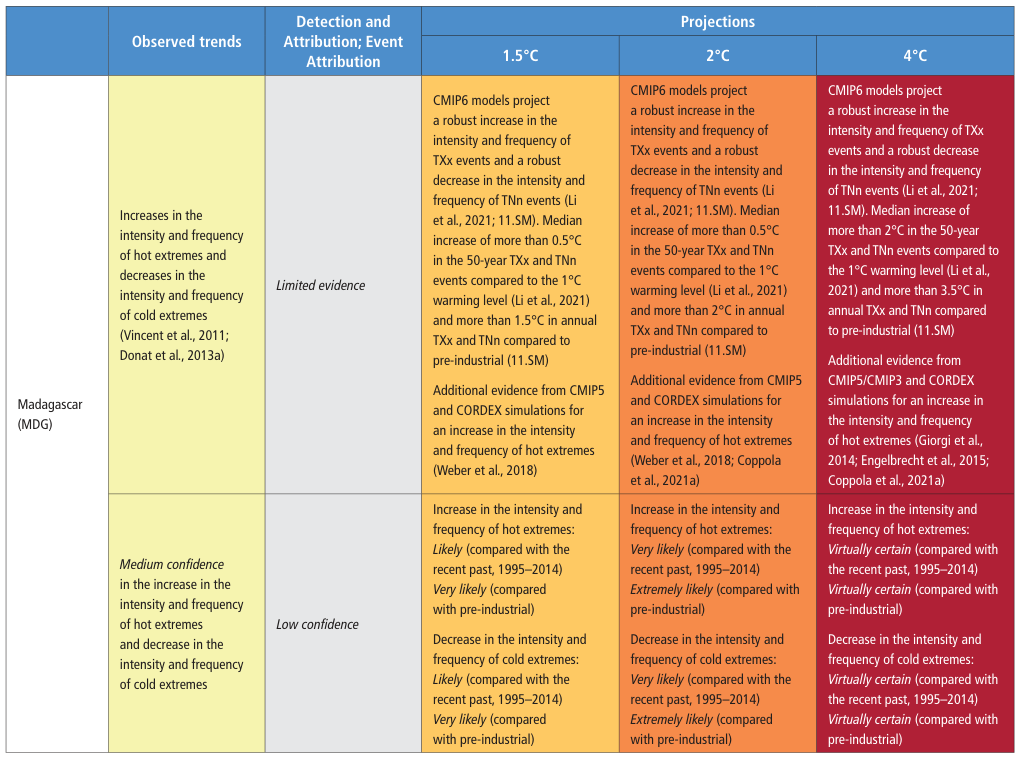
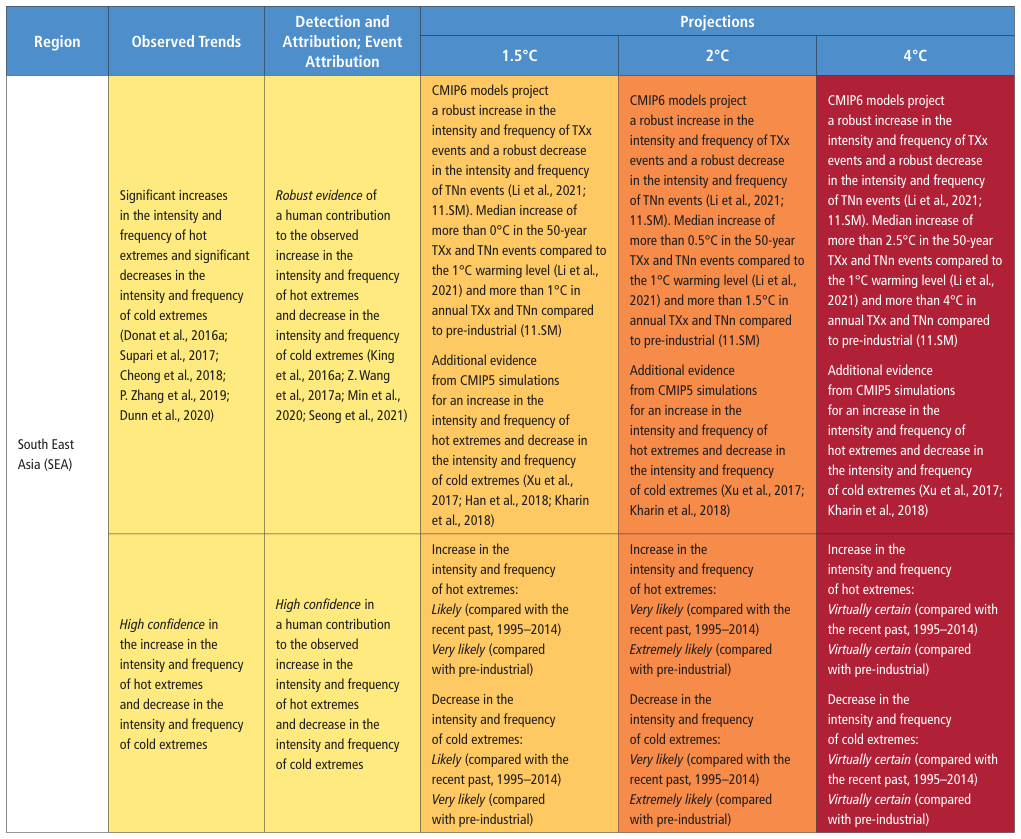
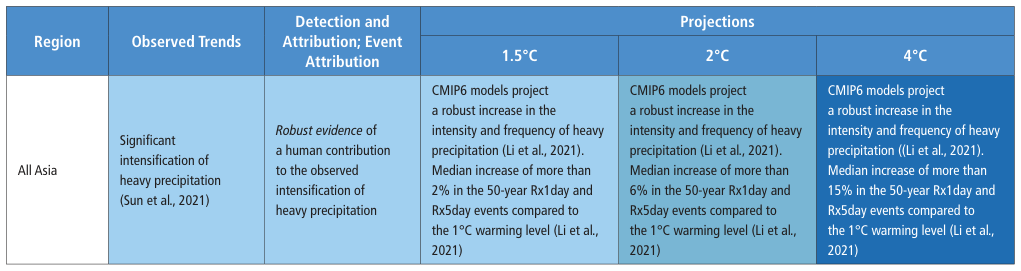
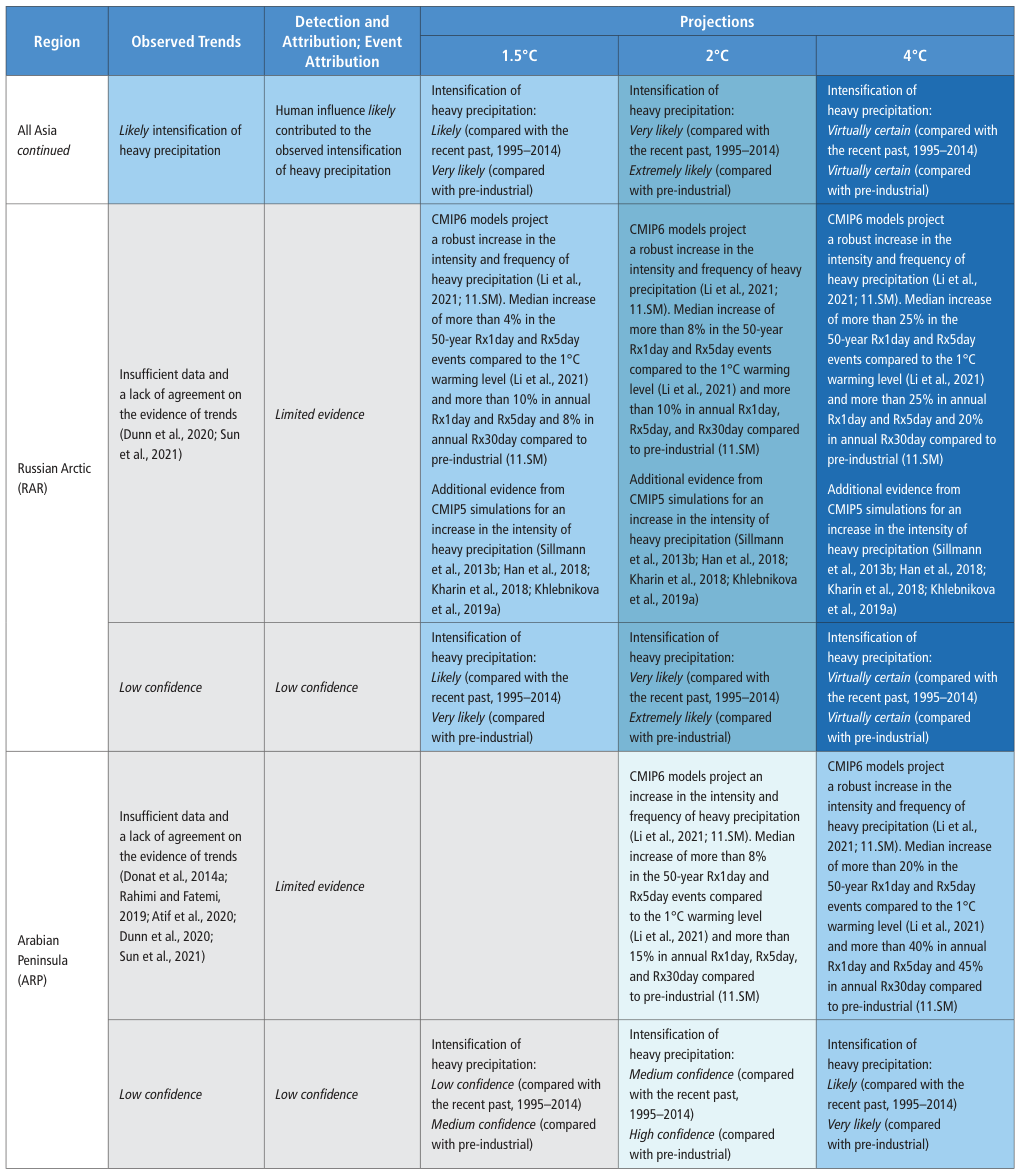
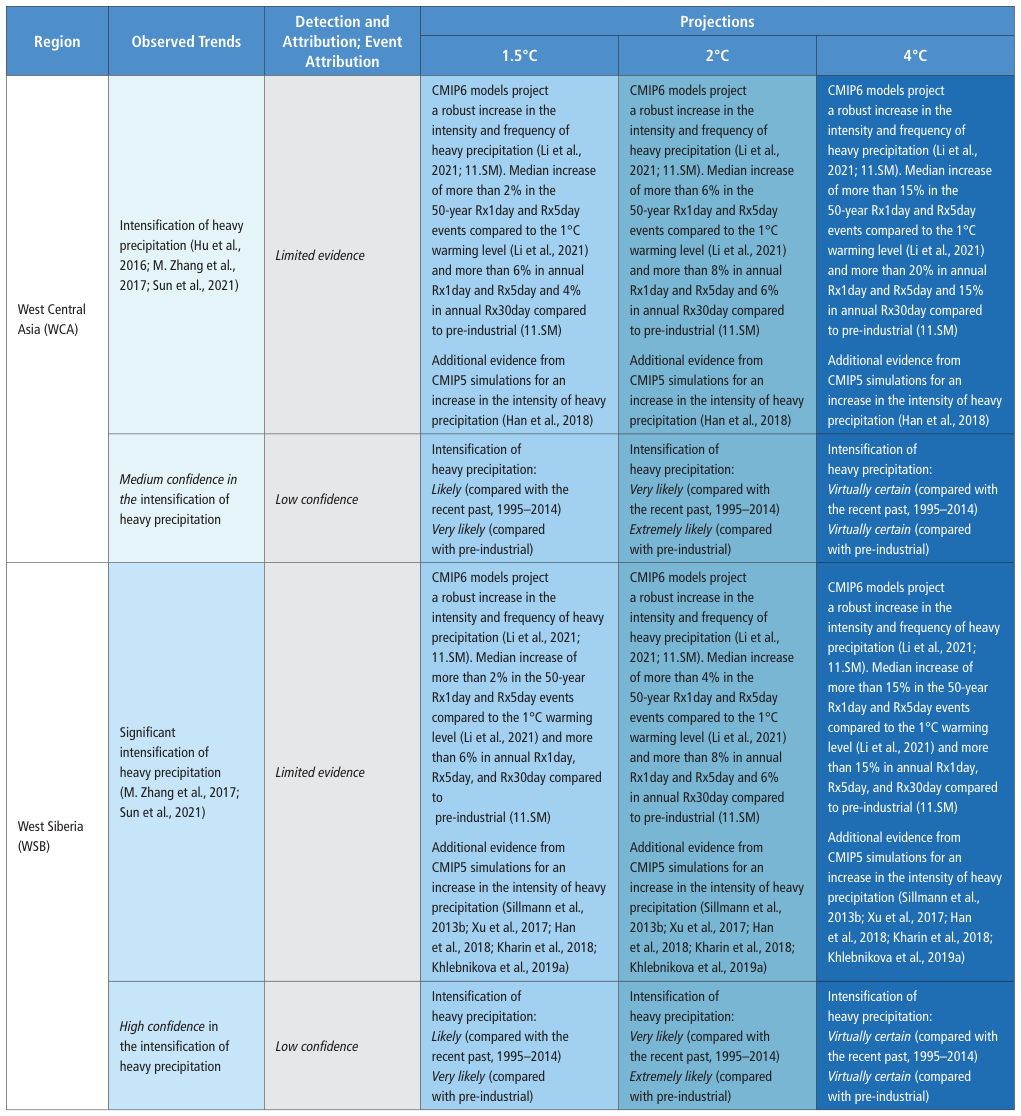
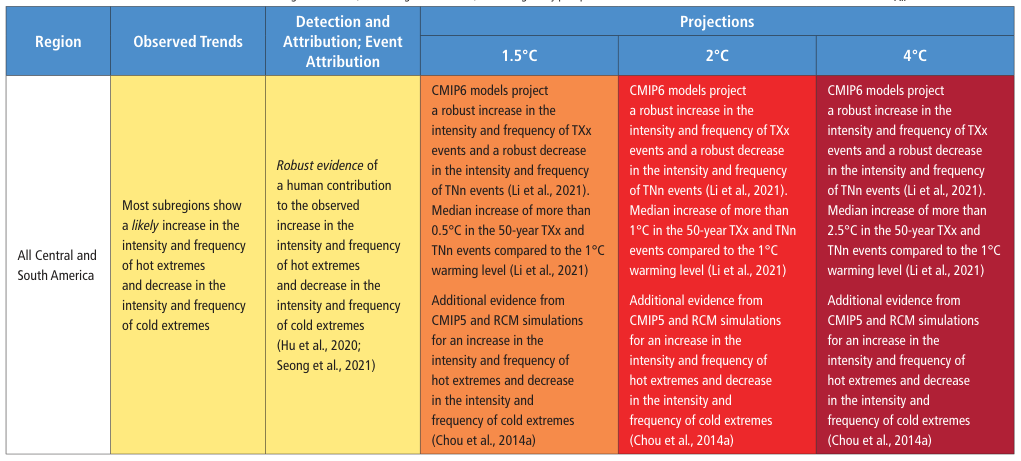
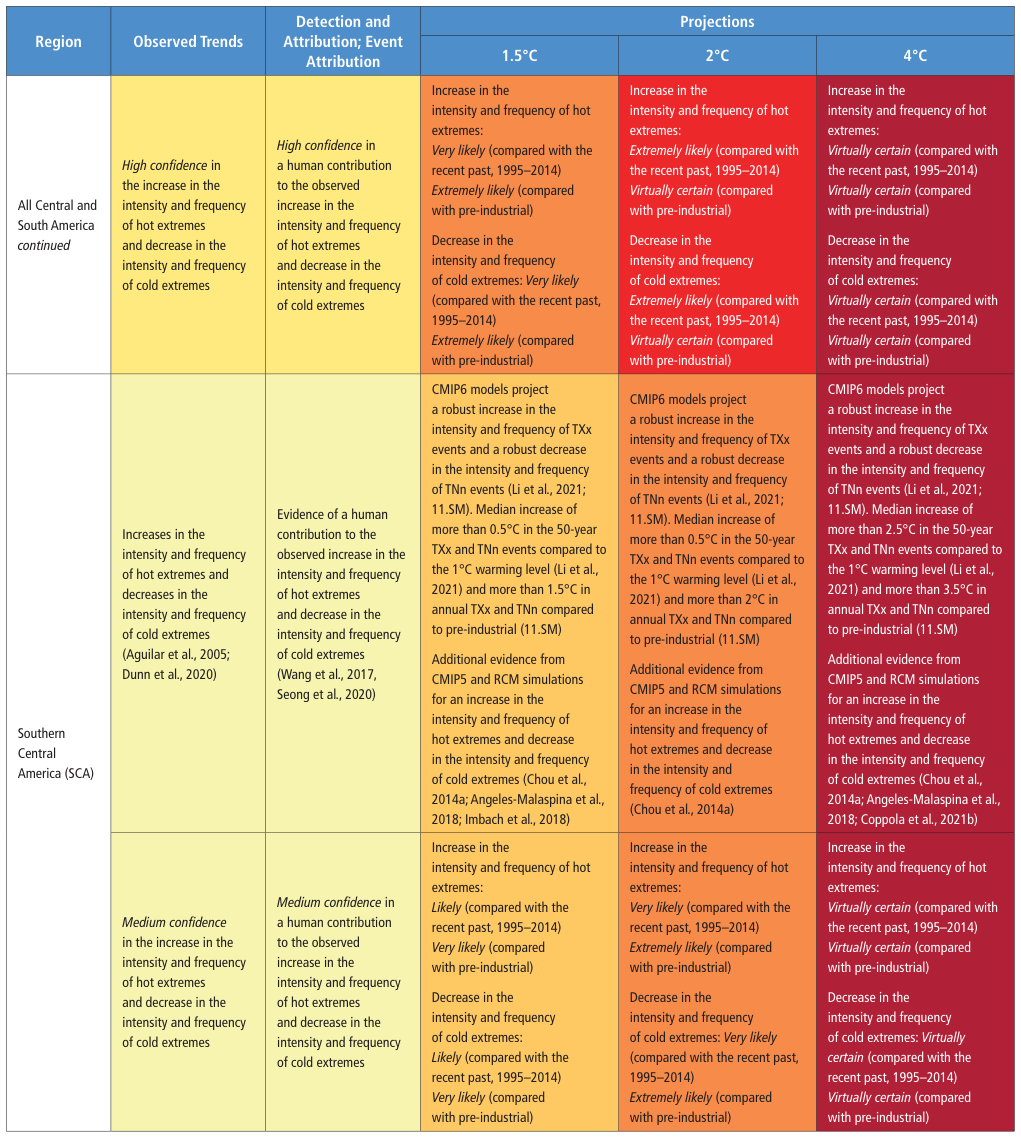
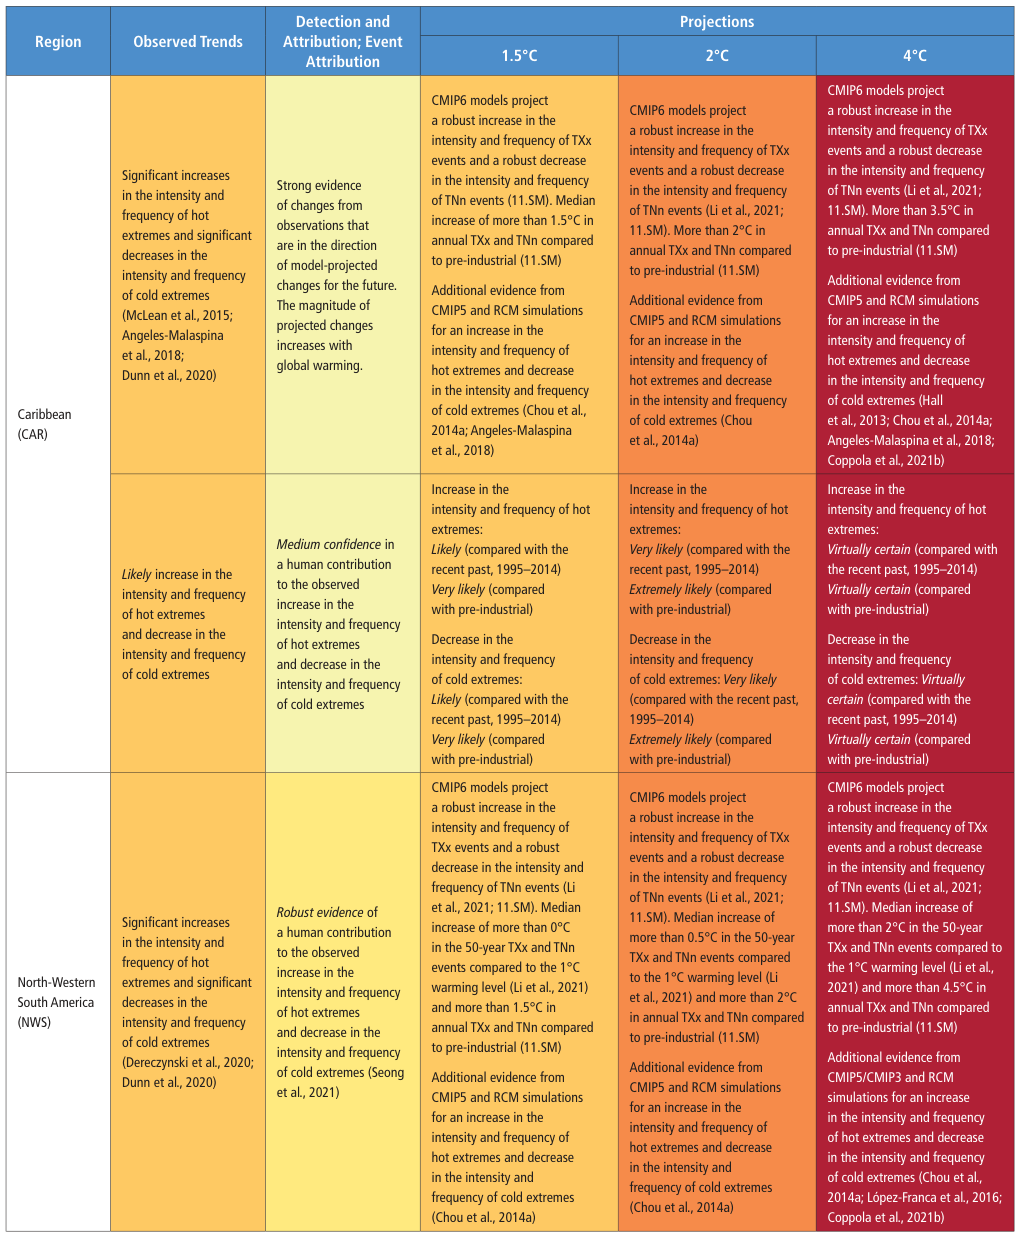
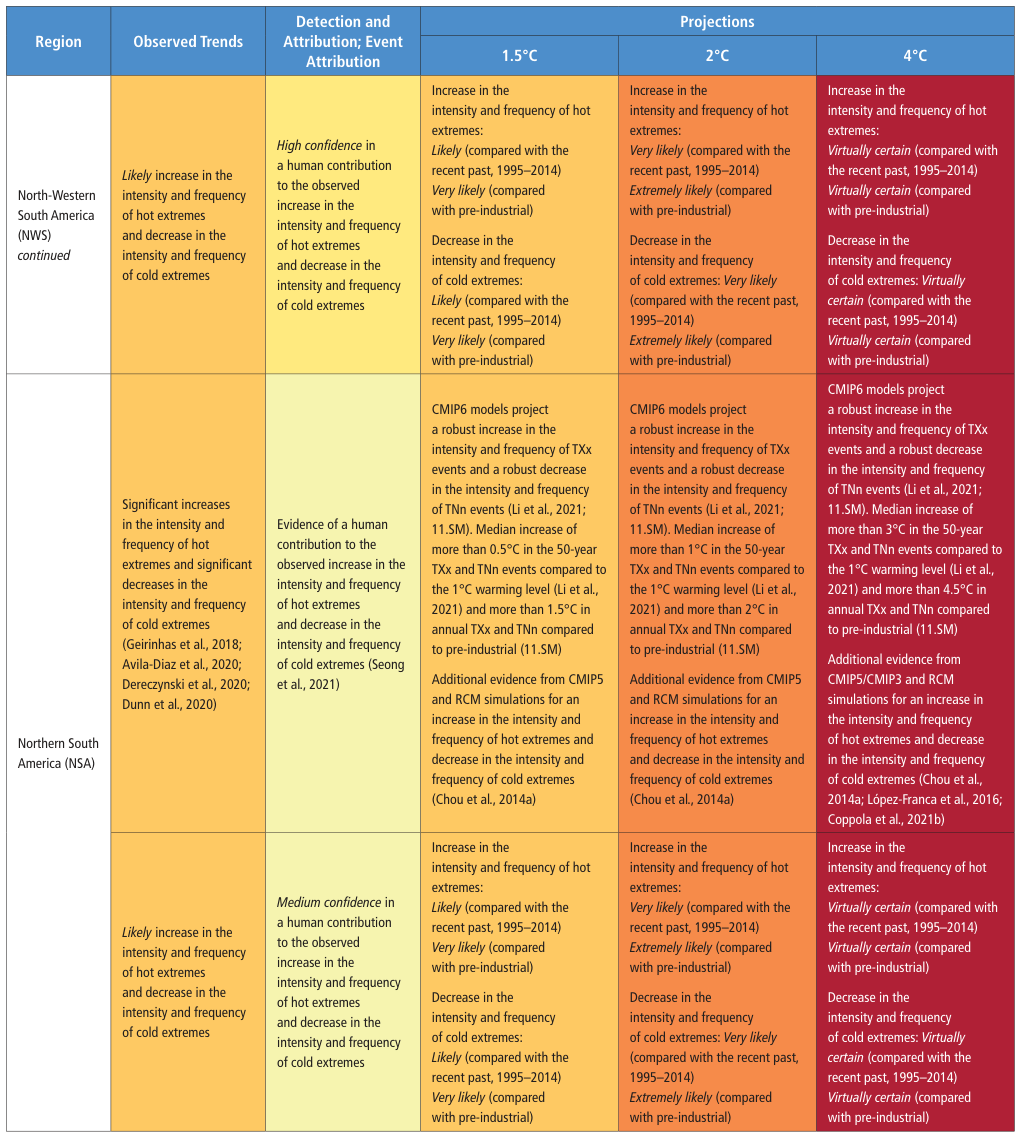
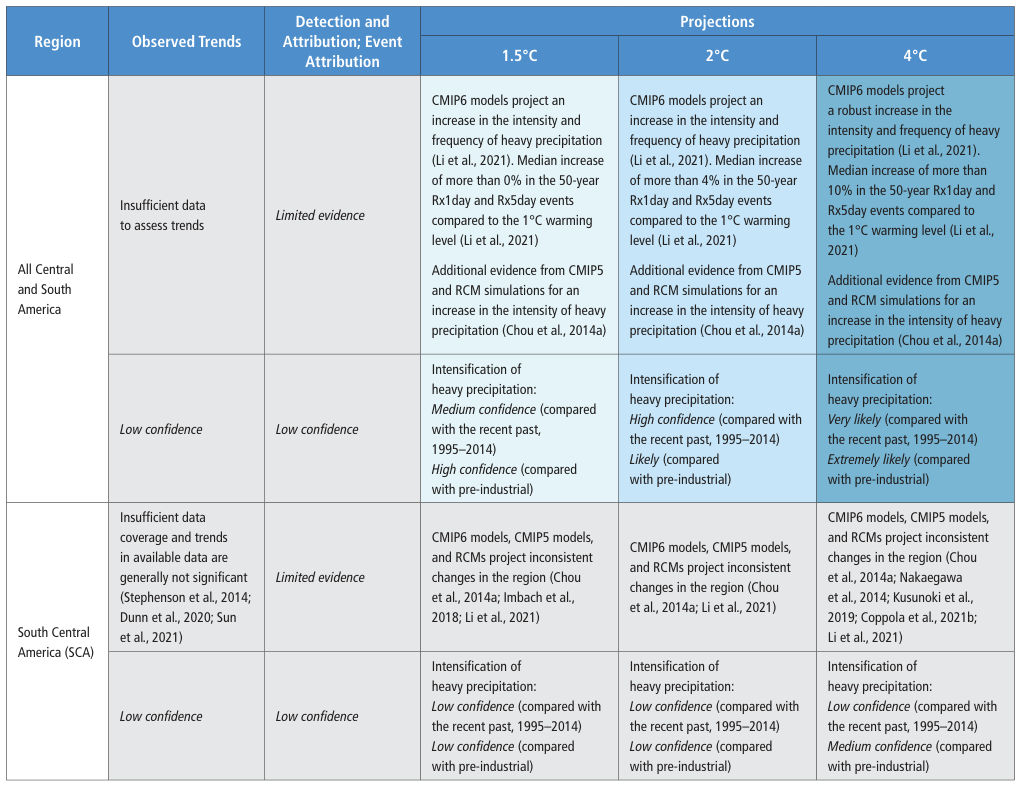
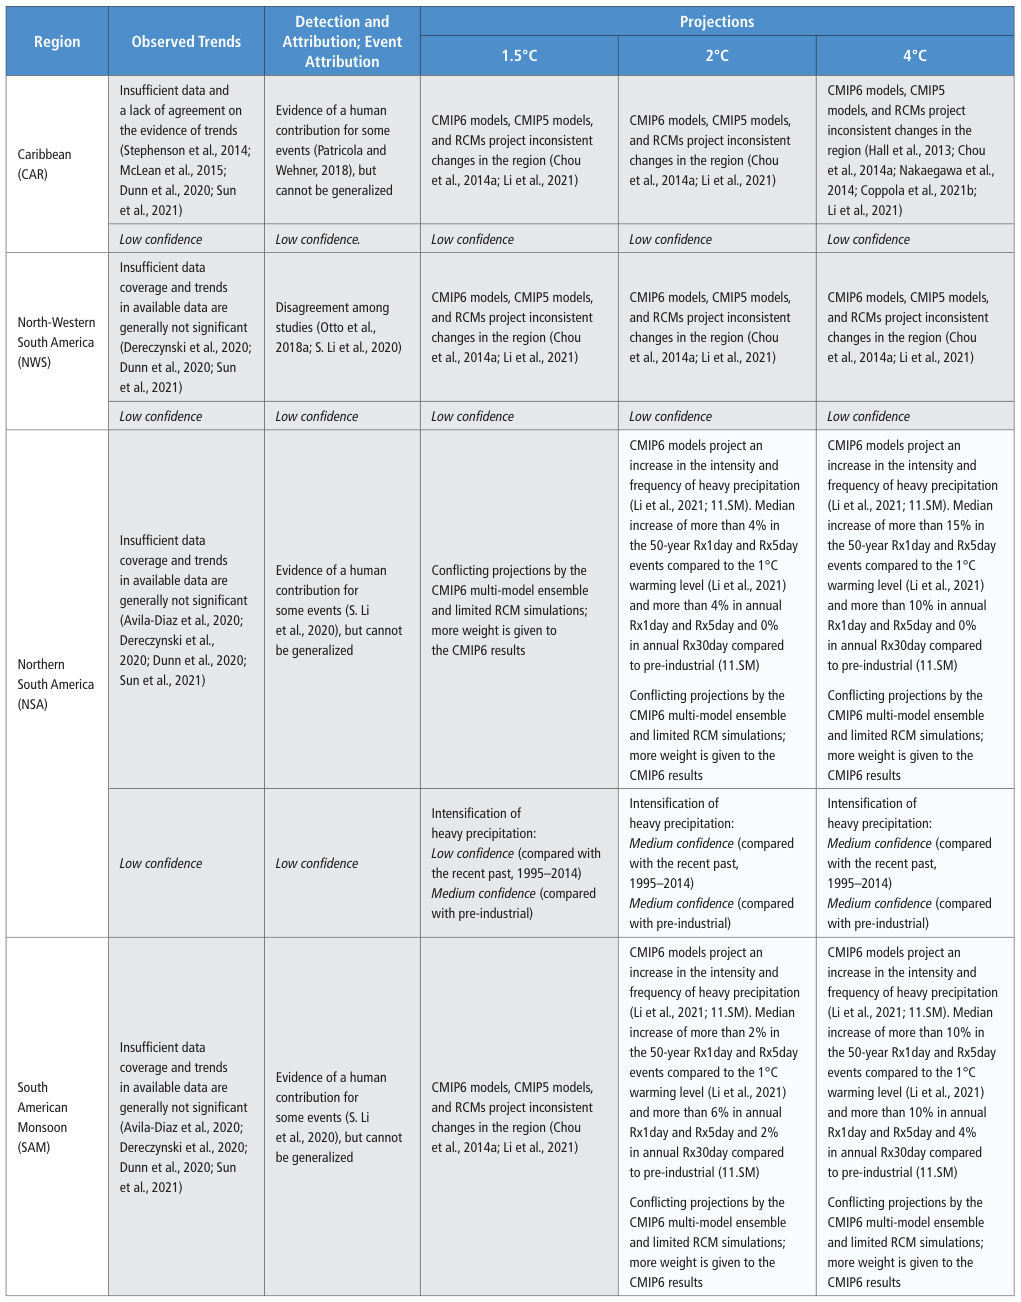
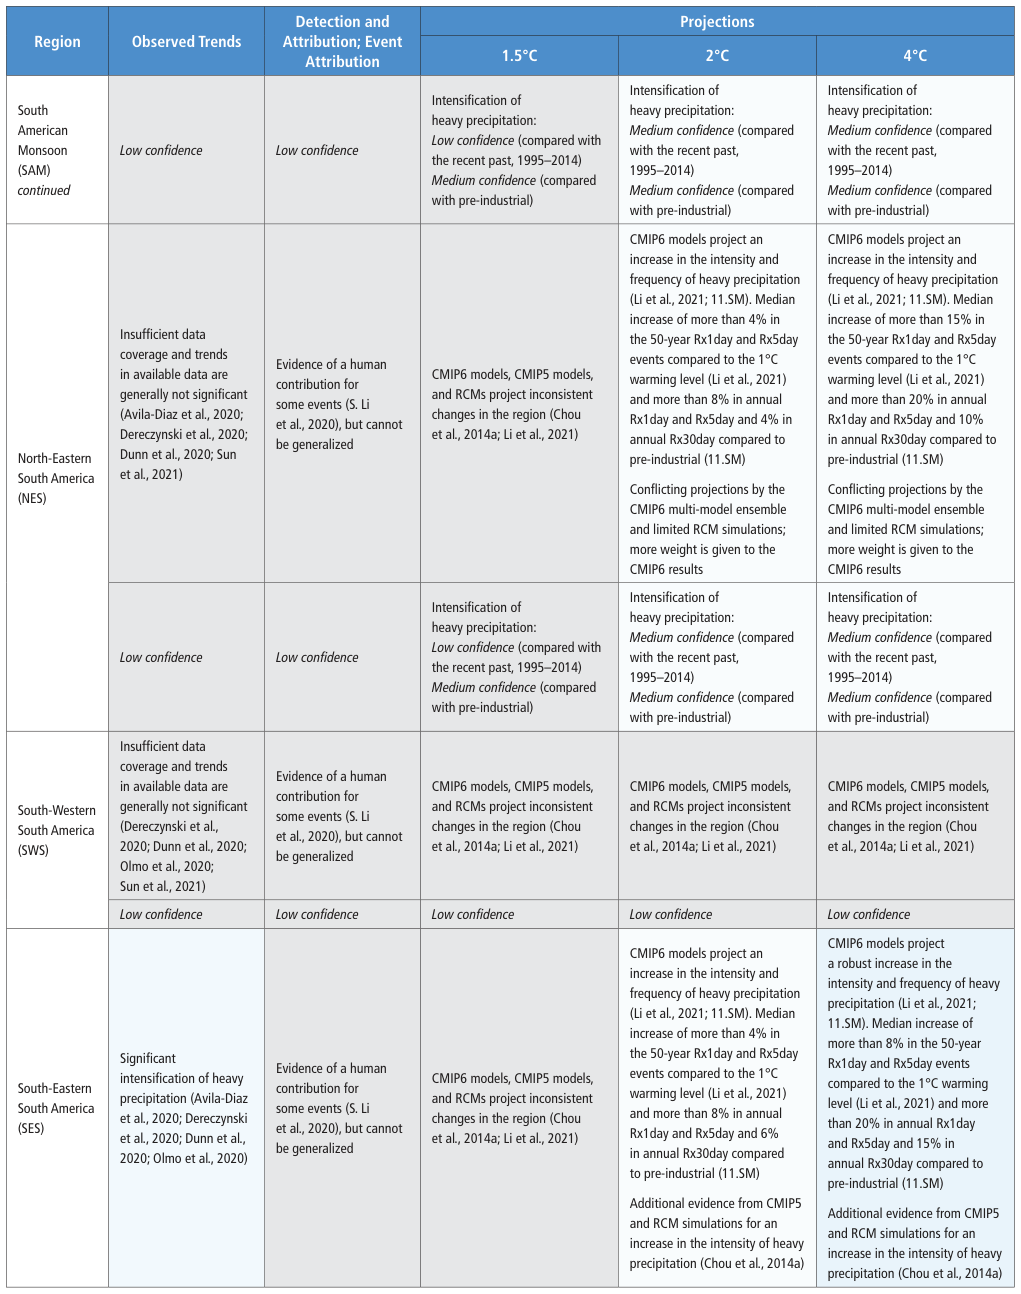
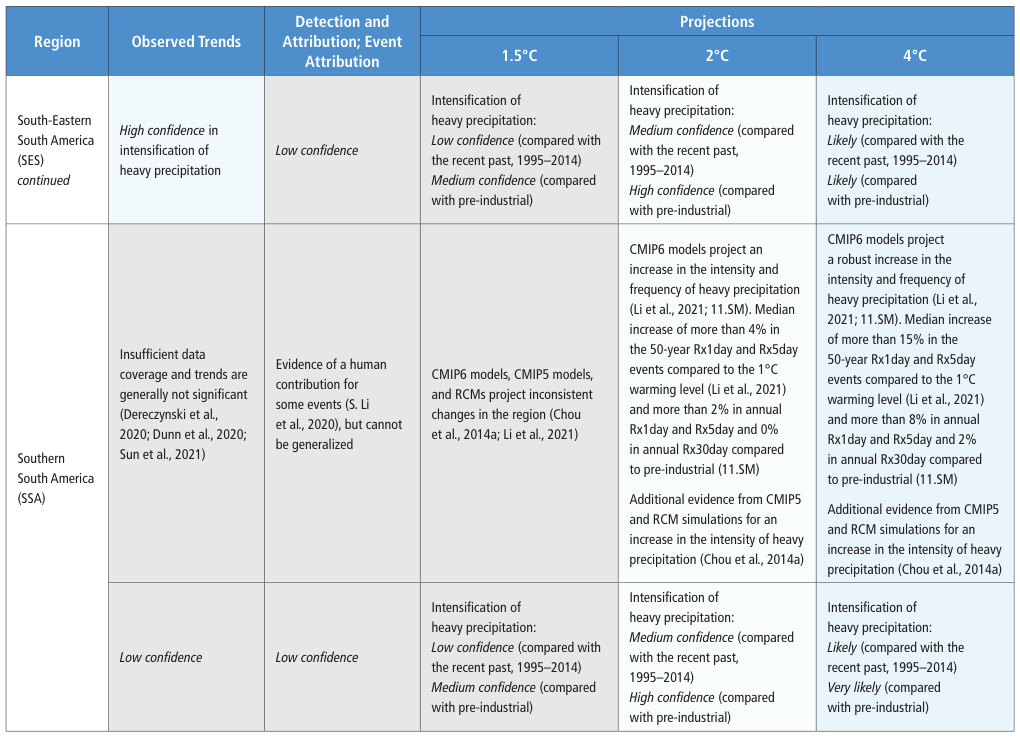
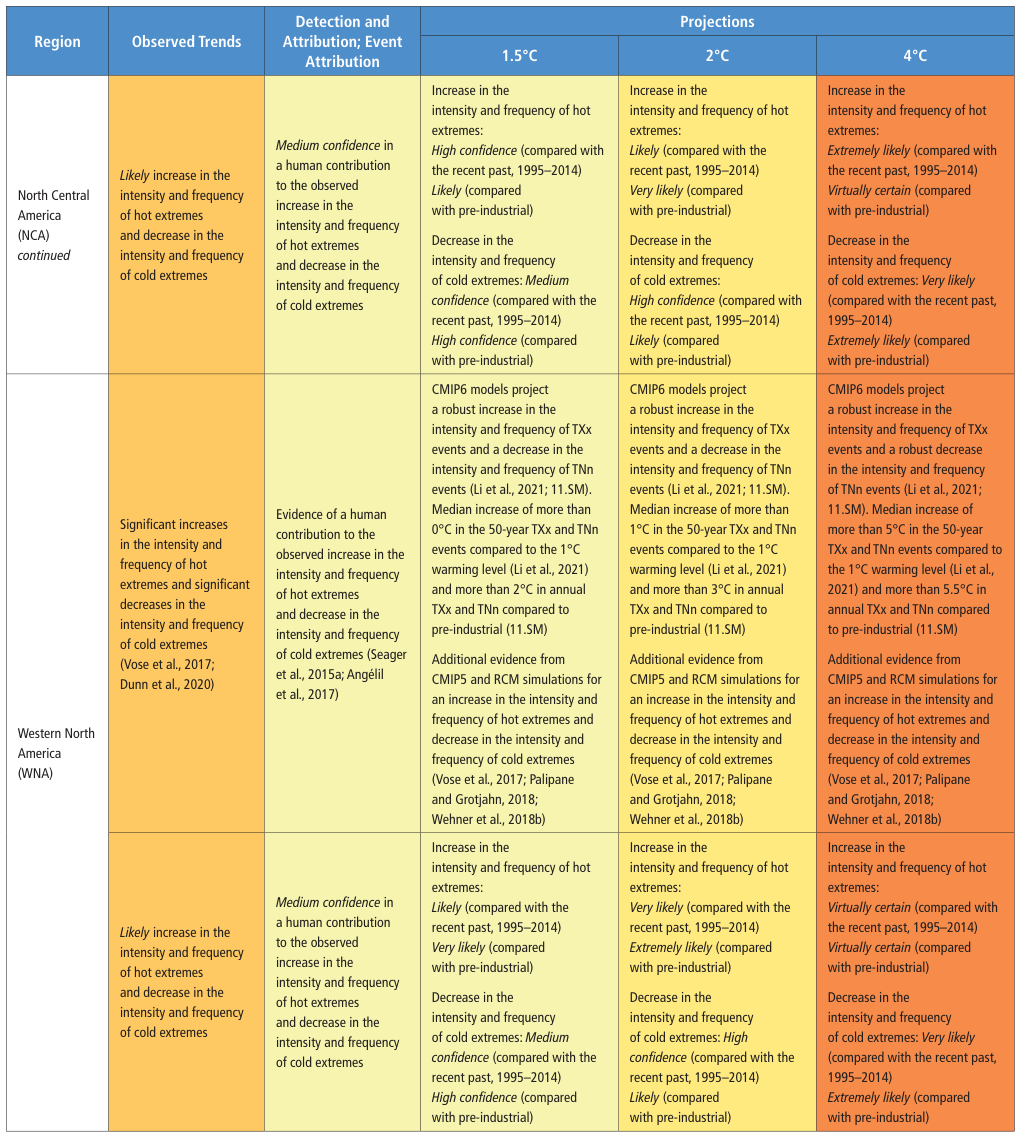
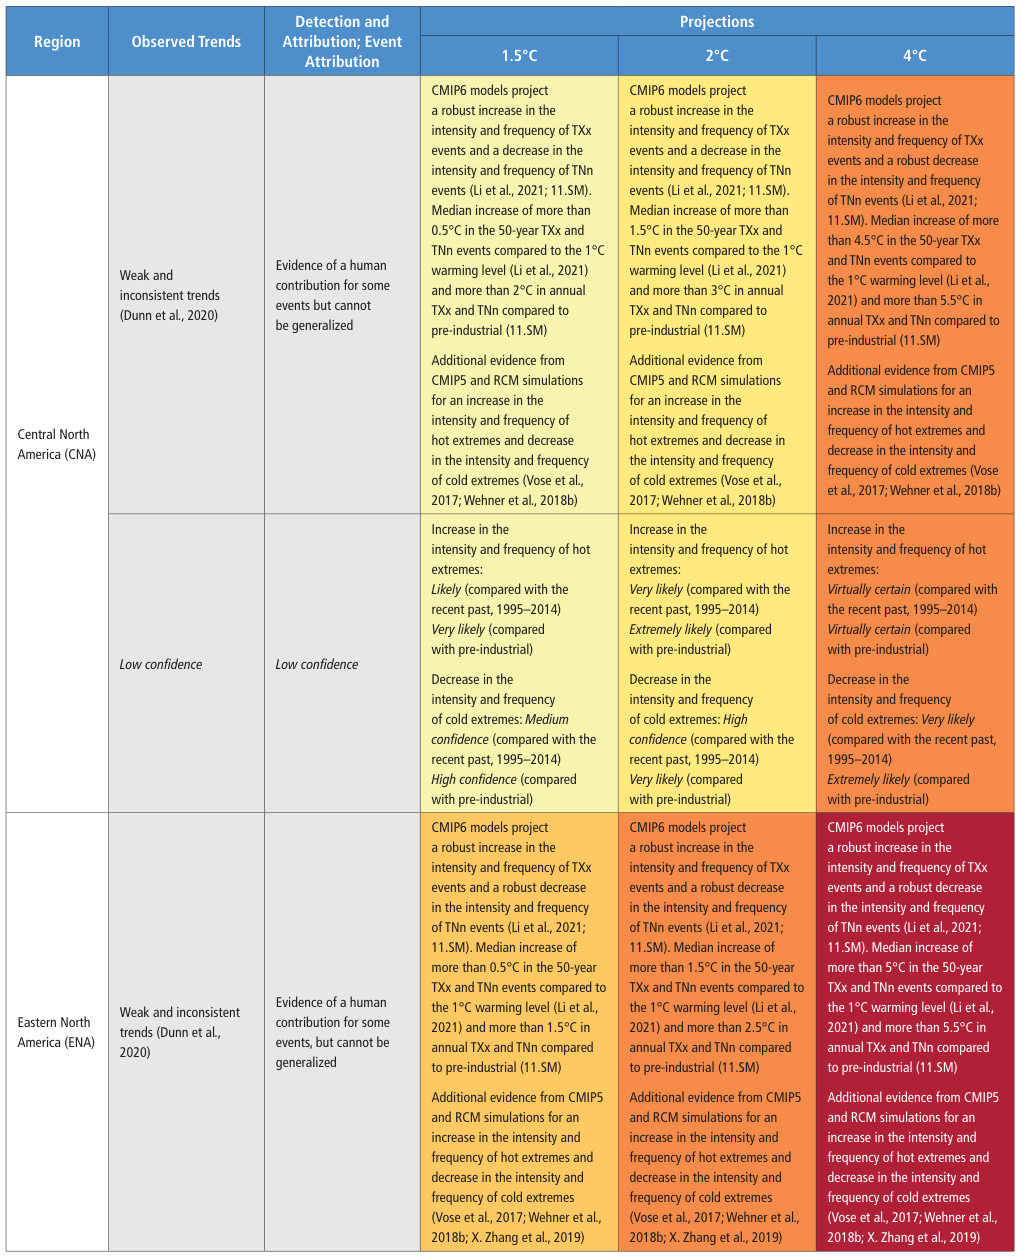
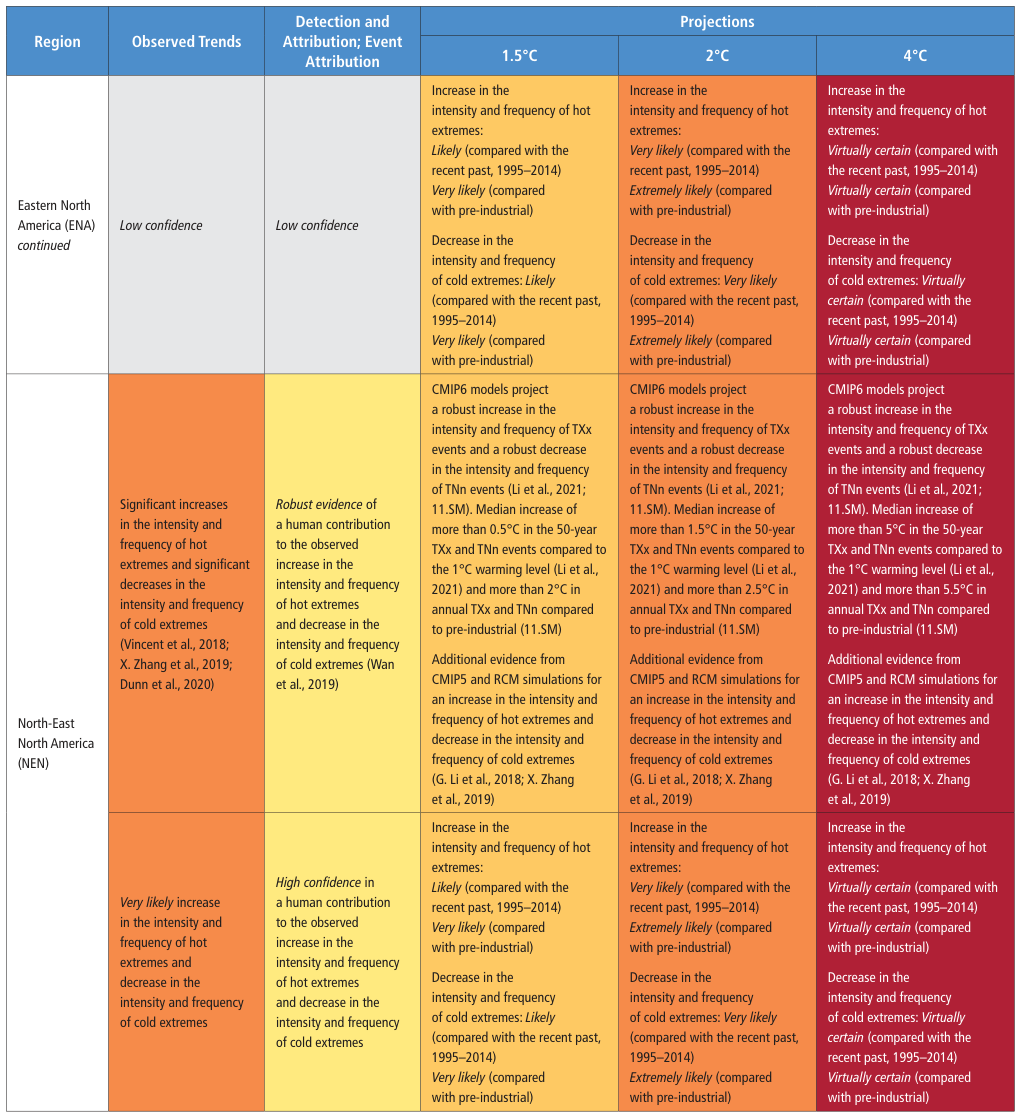
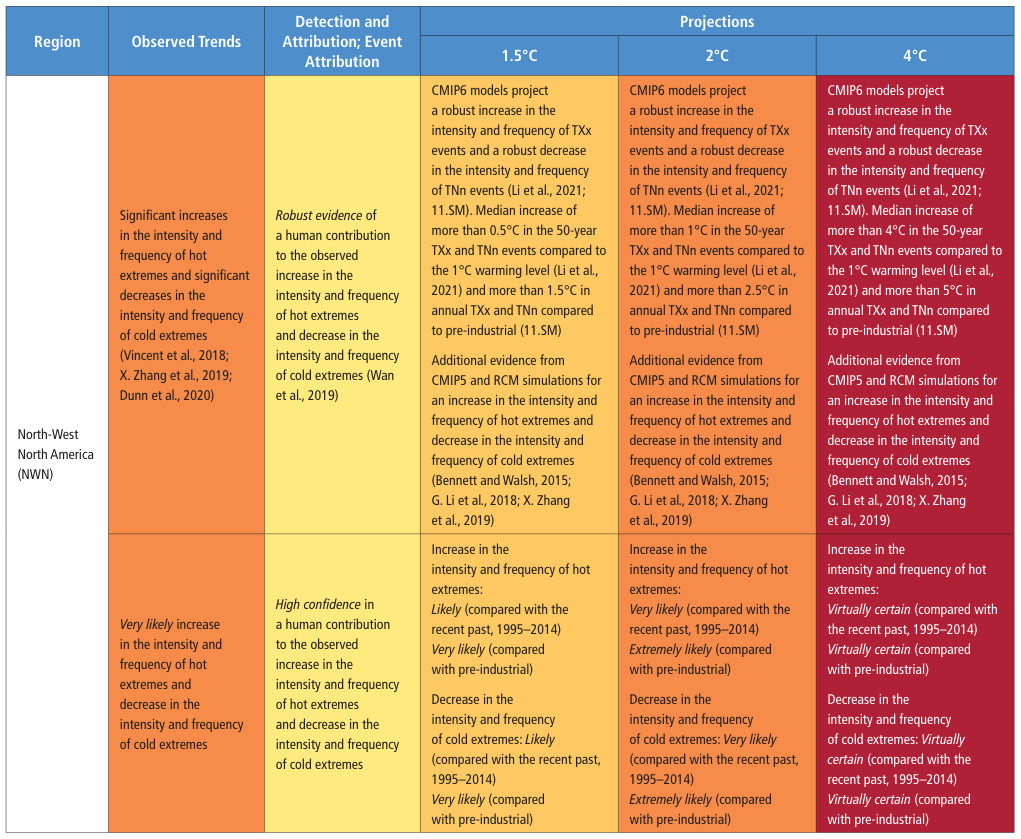
Chapter 11: Weather and Climate Extreme Events in a Changing Climate
Overview unavailable.
Climate Extremes Assessment
- This chapter provides a comprehensive scientific assessment of weather and climate extreme events within the context of a changing global climate.
- The report is a collaborative effort involving a diverse group of coordinating lead authors and lead authors from over a dozen countries.
- It forms a critical part of the Intergovernmental Panel on Climate Change (IPCC) Sixth Assessment Report on the physical science basis of climate change.
- The extensive list of contributing authors and review editors highlights the global scale and rigorous peer-review process of the findings.
- The document serves as a formal record for policymakers, detailing the specific contributors and institutional affiliations behind the climate data.
Weather and Climate Extreme Events in a Changing Climate.
Climate Extremes Assessment Framework
- The chapter establishes a comprehensive framework for defining and studying extreme weather events in the context of global climate change.
- It distinguishes between thermodynamic and dynamic drivers of extremes, examining how large-scale circulation and regional feedbacks influence event intensity.
- A significant focus is placed on the attribution of specific extreme events to human-induced greenhouse gas emissions and other external forcings.
- The text outlines a methodology for projecting future extremes based on specific global warming levels rather than just temporal scenarios.
- Specific categories of climate phenomena are analyzed individually, including temperature extremes, heavy precipitation, floods, and droughts.
- The inclusion of 'low-likelihood, high-impact' events highlights the scientific concern regarding rare but potentially catastrophic climate outcomes.
Box 11.2 | Changes in Low-likelihood, High-impact Extremes
Climate Extremes Assessment Framework
- The chapter provides a comprehensive assessment of weather and climate extremes across regional and global scales, focusing primarily on land regions.
- Key phenomena analyzed include temperature extremes, heavy precipitation, various types of flooding, droughts, and tropical cyclones.
- The assessment tracks observed changes and human attribution from 1950 to the present, while projecting future risks at warming levels ranging from 1.5°C to 4°C.
- Significant scientific advances since the AR5 report allow for better understanding of human influence on individual extreme events and compound disasters.
- The scope includes 'compound events,' which are multivariate or concurrent extremes such as simultaneous droughts and heatwaves.
- The text highlights a shift toward event attribution, answering whether human-induced climate change contributed to specific recent weather disasters.
Since the IPCC Fifth Assessment Report (AR5), there have been important new developments and knowledge advances on changes in weather and climate extremes, in particular regarding human influence on individual extreme events.
Human Influence on Climate Extremes
- Human-induced greenhouse gas emissions are now an established cause of increased frequency and intensity in weather and climate extremes.
- Evidence for the attribution of extreme precipitation, droughts, and tropical cyclones to human influence has strengthened significantly since the AR5 report.
- Certain recent extreme heat events are considered extremely unlikely to have occurred without human interference in the climate system.
- Even small incremental increases in global warming, such as 0.5°C, lead to statistically significant changes in extremes at both global and regional scales.
- The frequency of rare extreme events is projected to increase at a higher percentage rate than more common events as global warming continues.
- Improved physical understanding and climate modeling have increased scientific confidence in the detection and projection of these extreme events.
Some recent hot extreme events would have been extremely unlikely to occur without human influence on the climate system.
Escalating Global Temperature Extremes
- Global hot extremes have increased in frequency and intensity since 1950, while cold extremes have decreased, a trend driven primarily by human-induced greenhouse gas forcing.
- Regional factors such as soil moisture, snow-ice albedo feedbacks, and land-use changes can moderate or amplify these temperature shifts.
- Urbanization and aerosol concentrations have specifically influenced regional trends, with cities experiencing exacerbated nighttime heat extremes.
- Future warming scenarios predict that temperature extreme intensity will increase proportionally to global warming levels, potentially doubling or quadrupling as warming moves from 1.5°C to 3°C.
- The Arctic is projected to see the highest increase in the temperature of coldest days, warming at roughly three times the rate of global averages.
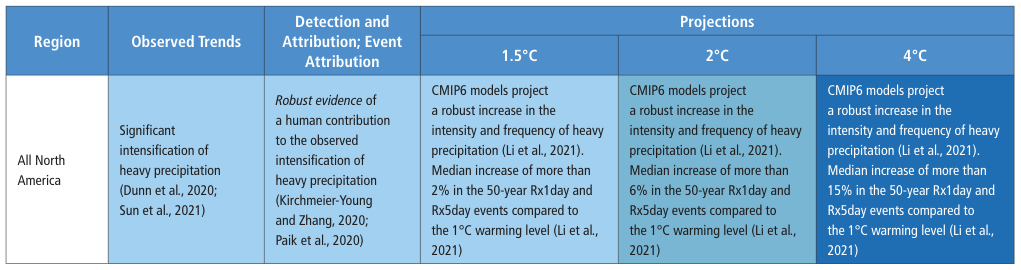
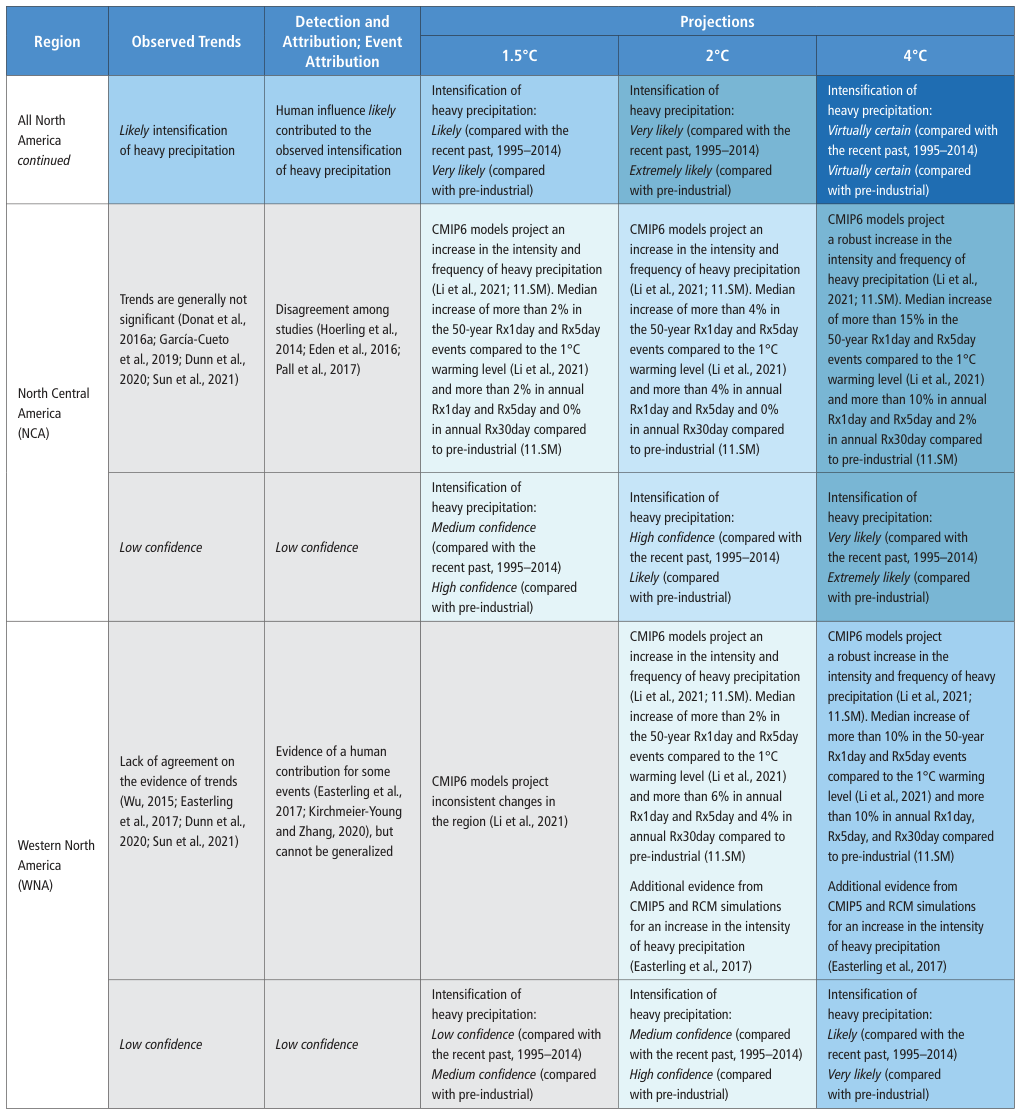
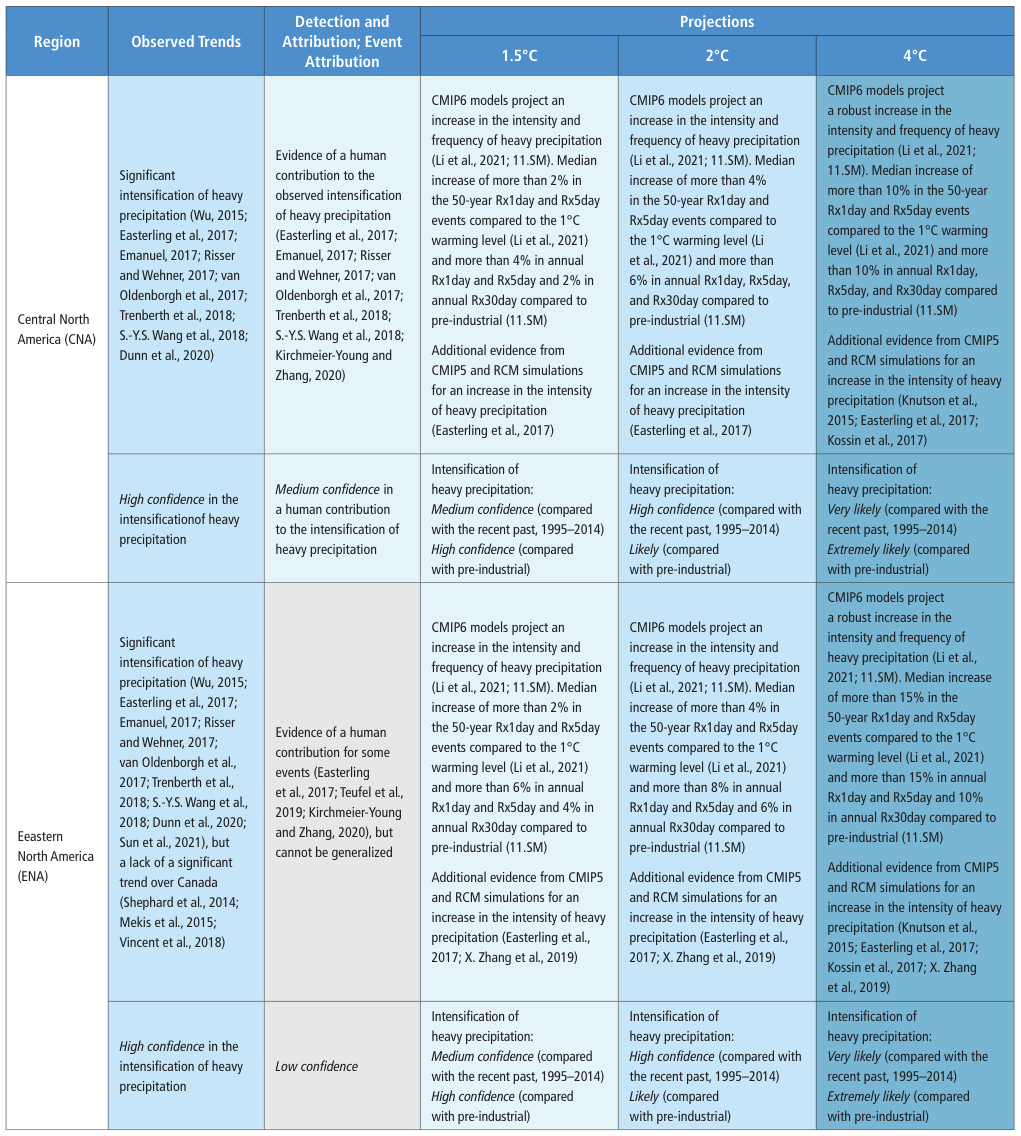
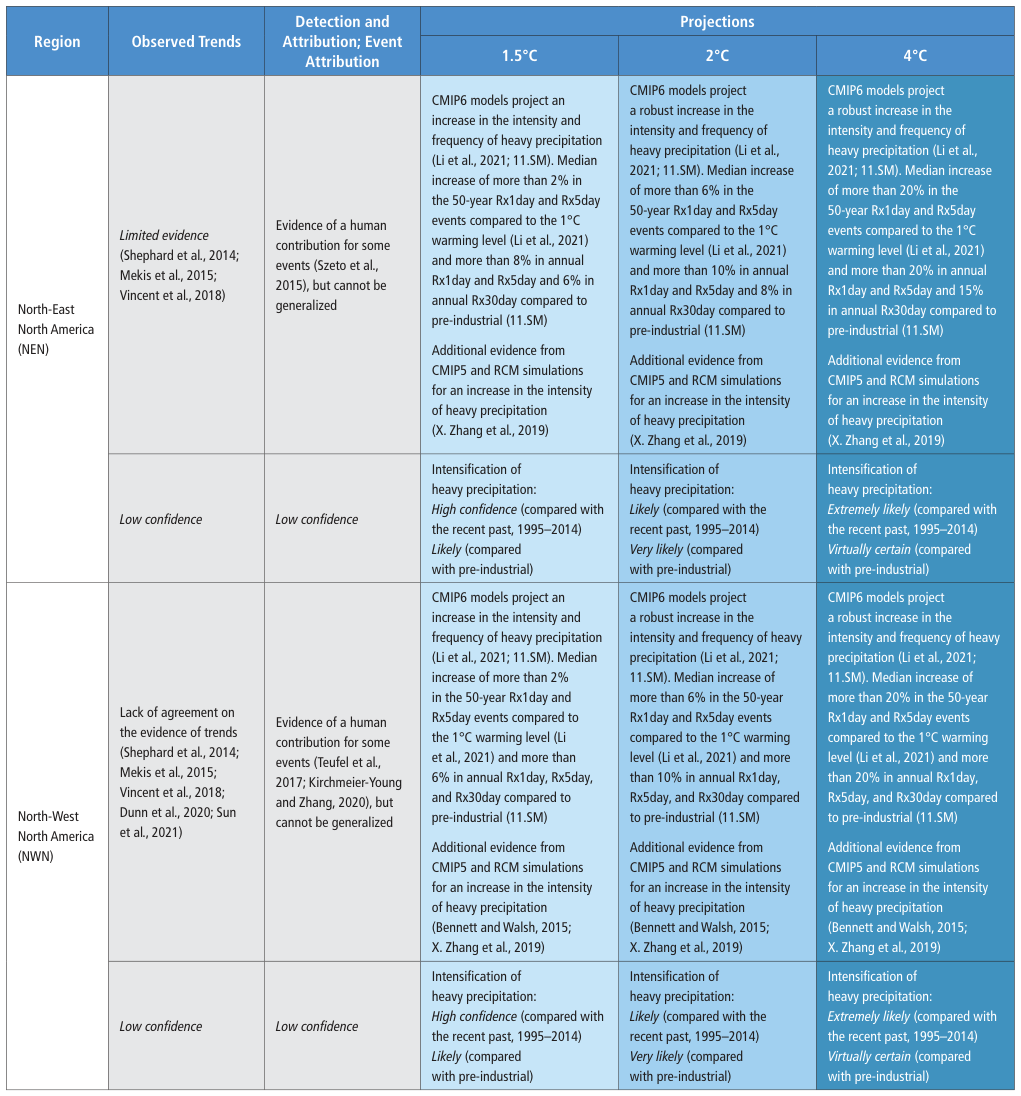
- Heavy precipitation events are increasing in frequency and intensity across most land regions with sufficient data, particularly in North America, Europe, and Asia.
Relative to present-day conditions, changes in the intensity of extremes would be at least double at 2°C, and quadruple at 3°C of global warming, compared to changes at 1.5°C of global warming.
Intensifying Precipitation and Drought Trends
- Human-induced climate change is driving an intensification of heavy precipitation across North America, Europe, and Asia.
- Atmospheric moisture capacity increases by approximately 7% for every 1°C of warming, leading to more frequent and intense extreme weather events.
- Projected 4°C warming could triple the frequency of rare 50-year precipitation events, significantly increasing the risk of flash and surface water flooding.
- River flood patterns are shifting, with snow-melt regions experiencing earlier peak streamflow due to rising temperatures.
- Agricultural and ecological droughts are increasing globally, primarily driven by higher evapotranspiration and atmospheric demand rather than just precipitation deficits.
- Regional flood and drought projections remain complex due to the influence of land management, atmospheric circulation, and local hydrological processes.
At the global scale, the intensification of heavy precipitation will follow the rate of increase in the maximum amount of moisture that the atmosphere can hold as it warms (high confidence), of about 7% per 1°C of global warming.
Drought Trends and Extreme Storms
- Agricultural and ecological droughts are increasing across most continents, with human-induced climate change identified as a contributing factor in several regions.
- Future projections indicate that even at 1.5°C to 2°C of warming, multiple regions will face more severe droughts driven by enhanced atmospheric evaporative demand.
- At 4°C of global warming, approximately 50% of all inhabited regions are expected to experience significant increases in agricultural and ecological droughts.
- The land carbon sink is expected to become less efficient under high-emission scenarios due to soil moisture limitations and severe drought conditions.
- Global warming is increasing the average and maximum rain rates for tropical cyclones, extratropical cyclones, and atmospheric rivers.
- The proportion of intense Category 3–5 tropical cyclones has likely increased over the last forty years, alongside a poleward migration of peak intensity in the North Pacific.
There is high confidence that the land carbon sink will become less efficient due to soil moisture limitations and associated drought conditions in some regions in higher-emissions scenarios.
Escalating Climate Extremes and Surprises
- Human-induced climate change is driving an increase in the proportion of intense tropical cyclones and peak wind speeds globally.
- Compound events, such as concurrent heatwaves and droughts, have become more frequent and are projected to intensify with further warming.
- Fire weather conditions and compound flooding are increasingly probable due to the synergy of rising sea levels and extreme precipitation.
- Global food security is at risk as concurrent extremes are projected to affect multiple critical crop-producing regions simultaneously, especially above 2°C of warming.
- The rapid pace of global warming means that even events with moderate probability may be perceived as unprecedented 'surprises.'
- Low-likelihood, high-impact events cannot be ruled out, particularly if global warming levels exceed 4°C.
With increasing global warming, some compound events with low likelihood in past and current climates will become more frequent, and there is a higher chance of occurrence of historically unprecedented events and surprises.
Weather and Climate Extremes
- The chapter assesses observed and projected changes in climate extremes at global warming levels of 1.5°C, 2°C, and 4°C.
- It serves as a regional chapter, bridging the gap between large-scale global context and specific regional impacts across continents.
- Extremes are defined as climatic impact-drivers where risk is modulated by human exposure, vulnerability, and adaptation efforts.
- The assessment builds upon a foundation of previous IPCC reports, including the SREX report and the Fifth Assessment Report (AR5).
- The scope includes diverse phenomena such as temperature extremes, heavy precipitation, floods, droughts, and extreme storms.
- A specific focus is placed on compound events and low-likelihood, high-impact extremes that pose significant risks.
The IPCC risk framework articulates clearly that the exposure and vulnerability to climatic impact-drivers, such as extremes, modulate the risk of adverse impacts of these drivers.
Defining and Assessing Climate Extremes
- Chapter 11 evaluates weather and climate extremes, focusing on human attribution and future projections at specific warming levels.
- Extreme events are defined by their rarity at a specific place and time, though definitions of 'rare' vary from unprecedented events to those occurring several times a year.
- Human-induced climate change is shifting the rarity of events, making previously unprecedented occurrences more probable and resulting in 'surprises' in the observational record.
- The assessment covers diverse phenomena including temperature extremes, various types of droughts (meteorological, agricultural, and hydrological), and multiple storm categories.
- A new focus is placed on compound events—multivariate or concurrent extremes—which were not assessed in depth in previous IPCC reports.
- The ability to detect and project changes is influenced by the varying spatial and temporal scales of events, ranging from localized tornadoes to multi-year regional droughts.
Rarity of an event with a fixed magnitude also changes under human-induced climate change, making events that are unprecedented so far rather probable under present conditions, but unique in the observational record – and thus often considered as ‘surprises’.
Assessing Climate Extremes and Forcing
- The assessment expands beyond extreme events to include droughts and tropical cyclones in general due to their significant impact relevance.
- A new focus is placed on 'compound events,' where multiple extremes occur concurrently or in succession, leading to amplified impacts.
- Future projections are categorized by global warming levels (1.5°C, 2°C, and 4°C) to provide actionable data for mitigation and adaptation policy.
- Observed changes in extremes since the mid-20th century are increasingly attributed to anthropogenic influences and enhanced radiative forcing.
- Temperature extremes on land are projected to increase at a higher rate than the global mean temperature due to land-sea warming contrasts.
Multiple concomitant extremes can lead to stronger impacts than those resulting from the same extremes had they happened in isolation.
Scaling Climate Extremes
- Temperature extremes and heatwave frequency scale linearly or nonlinearly with global warming across different geographical regions.
- Annual maximum one-day precipitation increases by approximately 7% per 1°C of warming, following the Clausius–Clapeyron relation.
- High confidence exists for extremes driven by global thermodynamic processes, while confidence remains lower for those influenced by regional dynamic processes.
- Attribution studies provide evidence that greenhouse gases have influenced the frequency and magnitude of individual extreme weather events.
- Event attribution research is geographically uneven, with a significant lack of data and studies concerning the developing world.
The frequency of hot temperature extremes, the number of heatwave days and the length of heatwave seasons in various regions also scale well, but nonlinearly, with global mean temperatures.
Mapping Global Climate Extremes
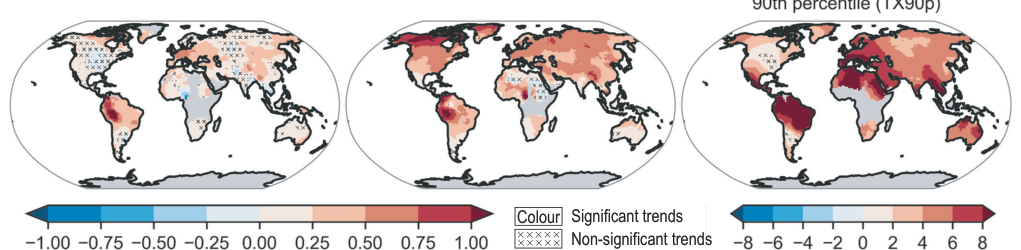
- Observed temperature anomalies show a consistent upward trend in global annual means, with land-based hottest daily maximums (TXx) rising significantly.
- Climate models across various Shared Socio-economic Pathway (SSP) scenarios demonstrate a linear scaling between regional extreme heat and global surface air temperature increases.
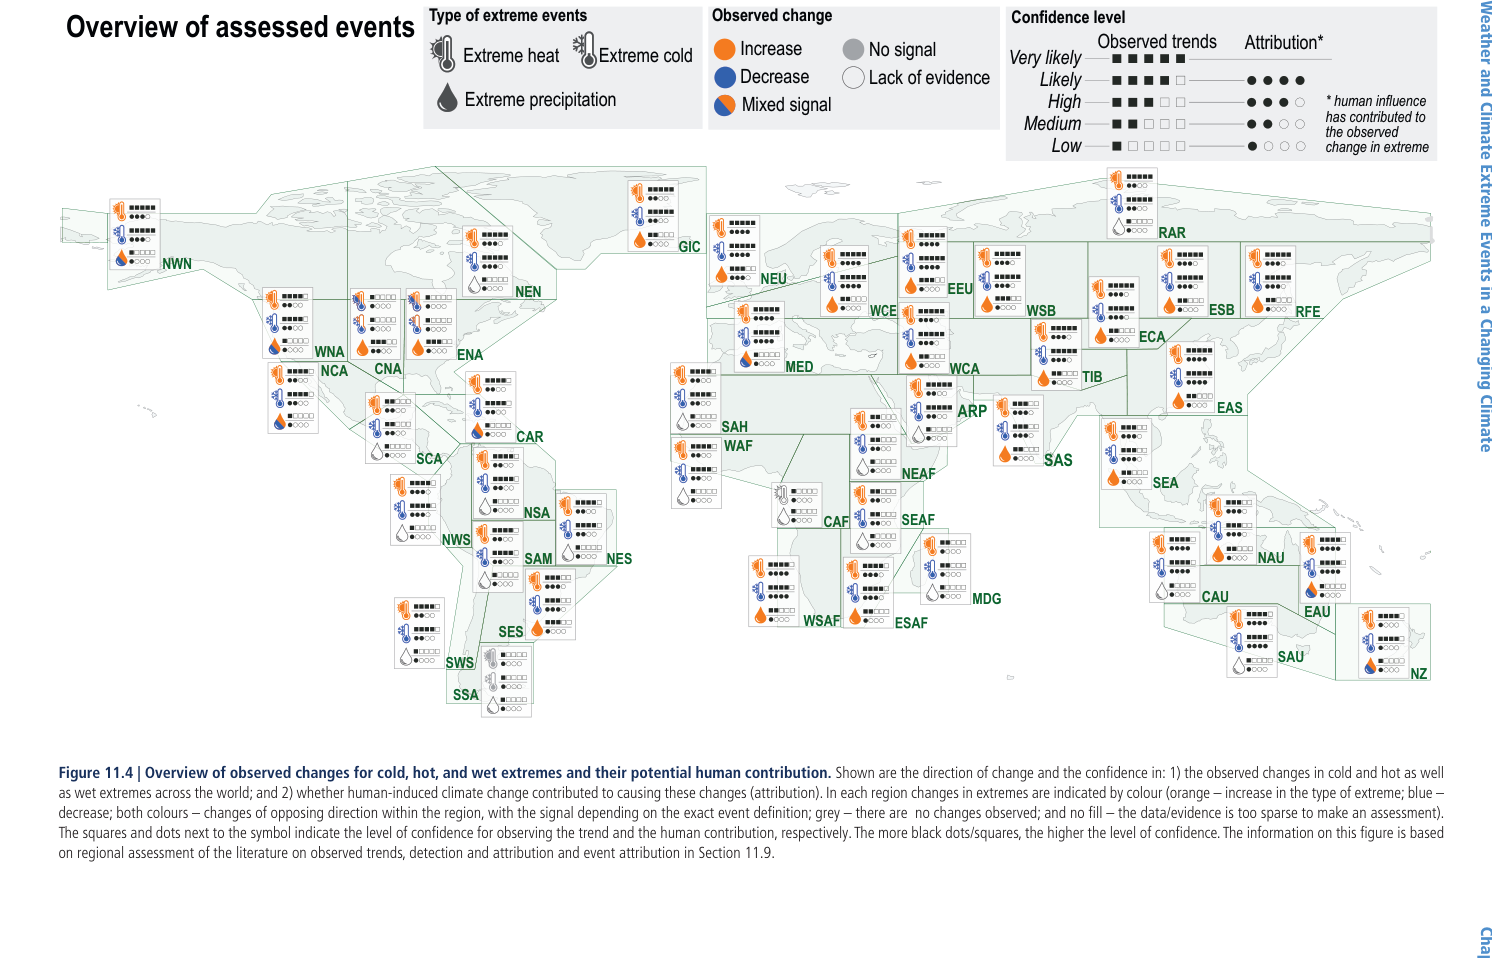
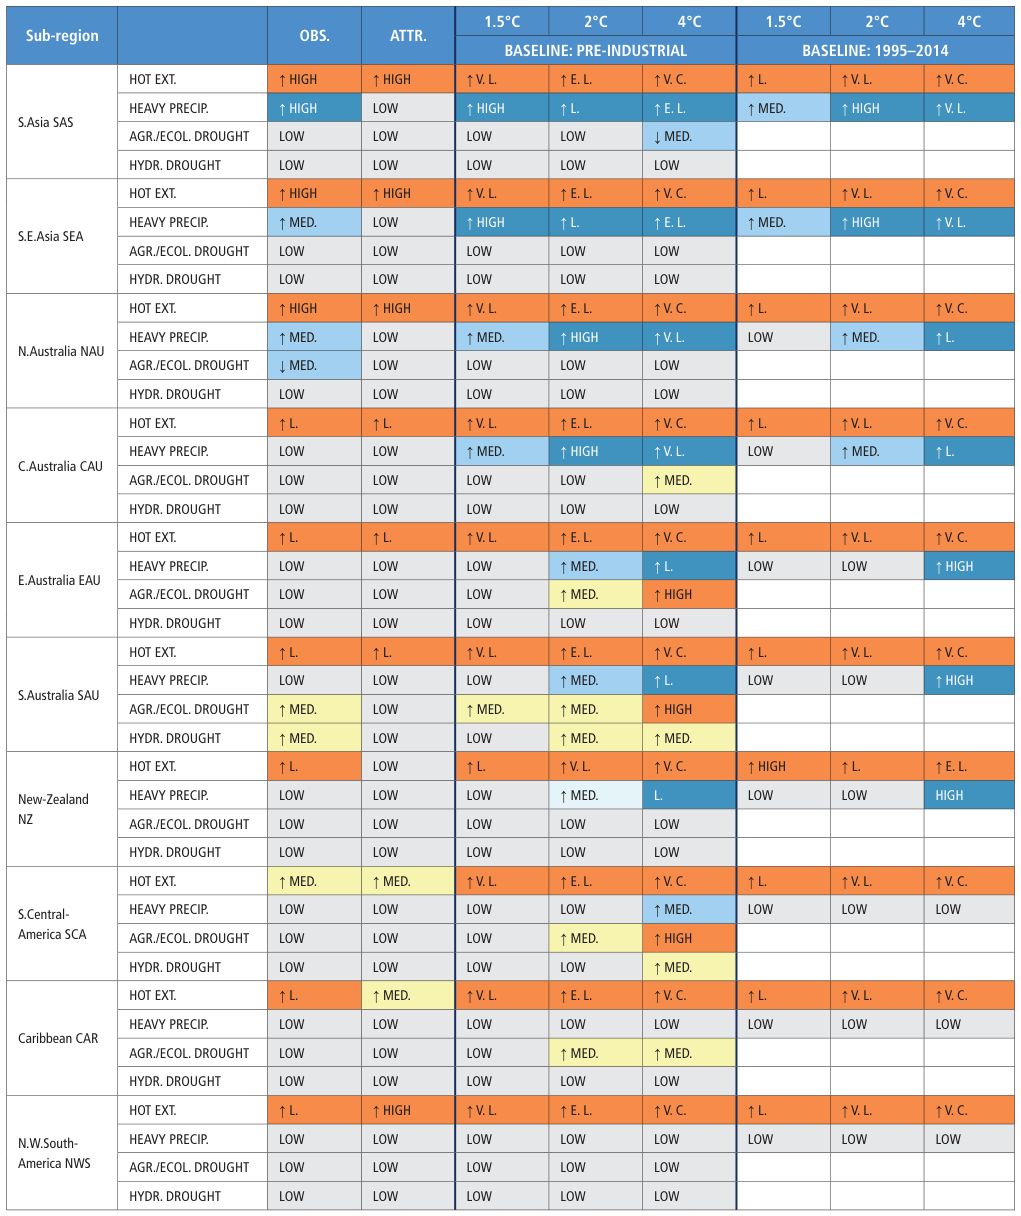
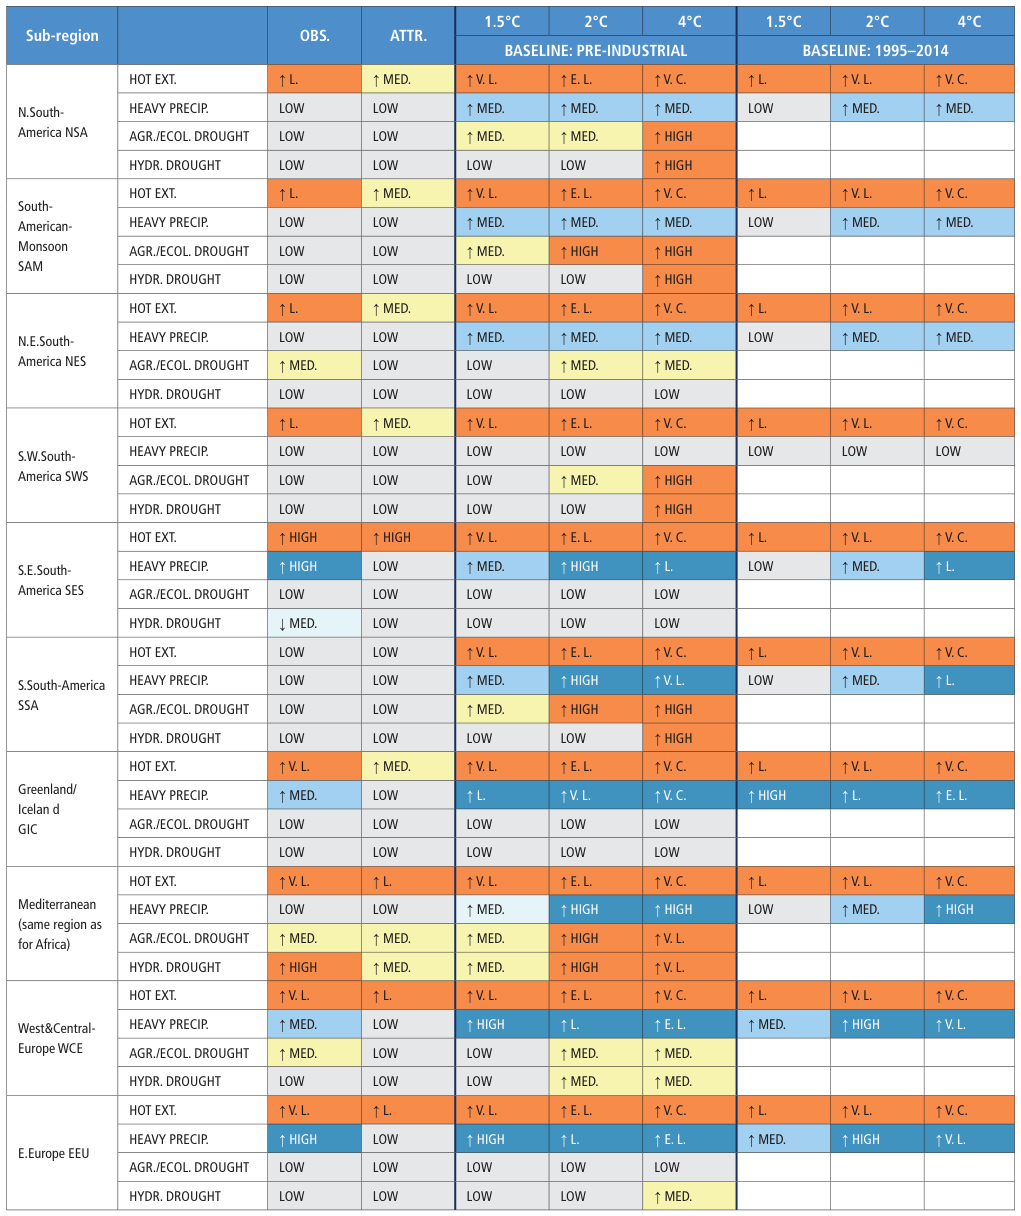
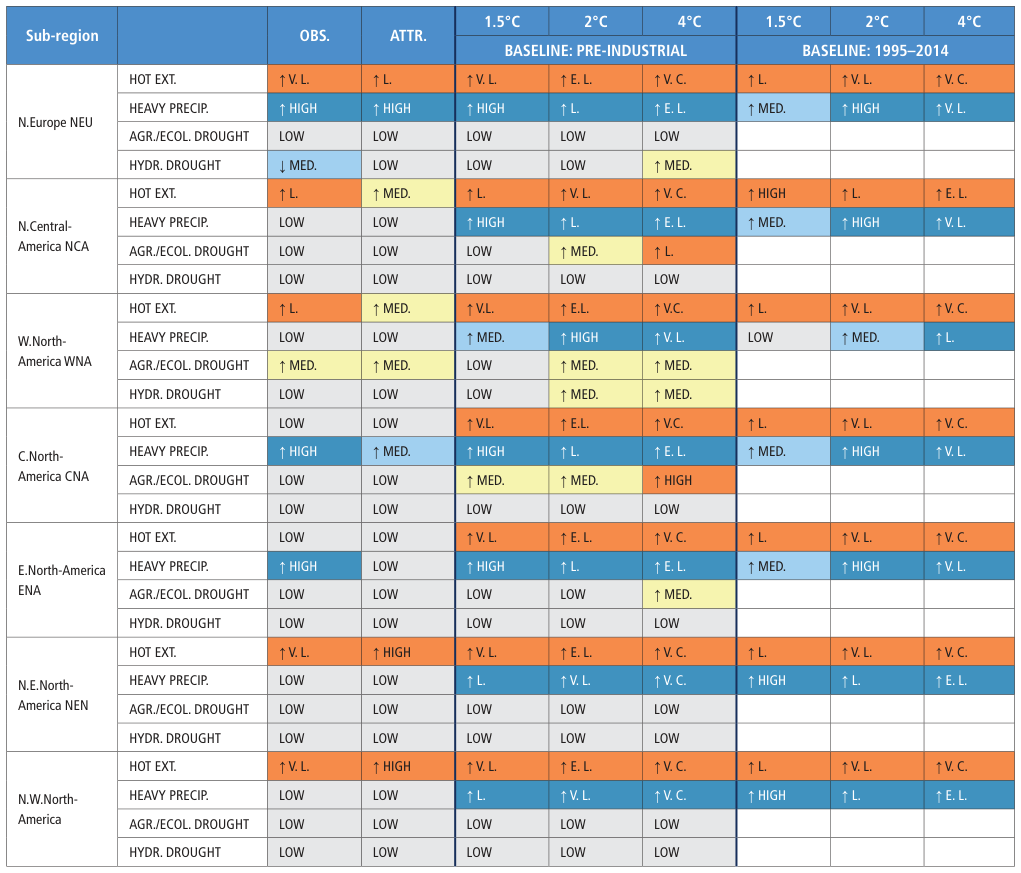
- A comprehensive regional assessment reveals that extreme heat increases are nearly universal across all inhabited land regions, with high confidence in human attribution.
- Observed changes in extreme precipitation and cold events show more regional variability than heat, though many areas still exhibit a clear human-induced signal.
- The data highlights a critical lack of evidence or sparse data for certain extreme event types in specific regions, particularly in parts of Africa and South America.
In each region changes in extremes are indicated by colour (orange – increase in the type of extreme; blue – decrease; both colours – changes of opposing direction within the region).
Mechanisms of Climate Extremes
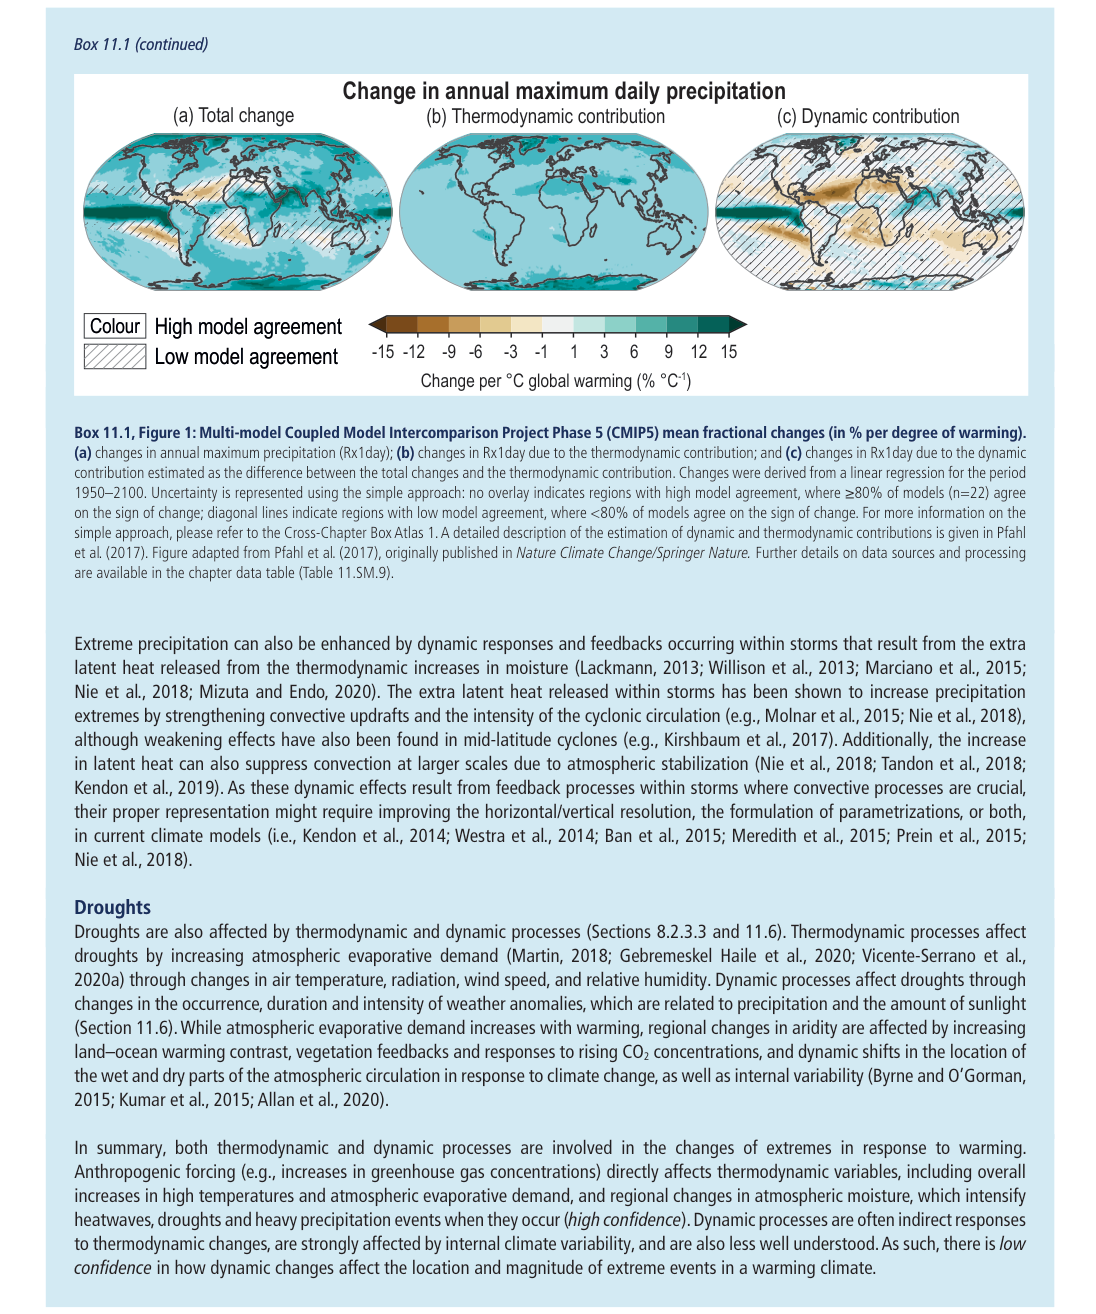
- Climate extremes are driven by the interplay between thermodynamic changes in heat and moisture and dynamic changes in atmospheric and oceanic motions.
- Increased greenhouse gases create a direct thermodynamic effect that increases the frequency and intensity of warm extremes while decreasing cold extremes.
- Feedback loops such as water vapor and lapse rate changes amplify surface warming, though the lapse rate effect varies between tropical and high-latitude regions.
- Surface processes, including reduced snow cover and soil drying, create positive feedback loops that further intensify extreme heat through albedo and sensible heat flux changes.
- Biological factors, such as altered plant transpiration under high CO2 levels, can contribute to higher projected temperatures.
- Polar amplification weakens north-south temperature gradients, reducing cold air advection and potentially increasing the persistence of weather patterns like heatwaves.
While the water vapour feedback always amplifies the initial temperature increases (positive feedback), the lapse rate feedback amplifies near-surface temperature increases (positive feedback) in mid- and high latitudes but reduces temperature increases (negative feedback) in tropical regions.
Thermodynamics and Precipitation Extremes
- Global water vapor content increases by approximately 7% for every 1°C of warming, following the Clausius–Clapeyron relation.
- While global precipitation extremes align with thermodynamic expectations, regional variations occur due to moisture transport limits and land-ocean warming differentials.
- Dynamic contributions to precipitation, such as changes in storm tracks and weather regimes, introduce significant uncertainty in regional climate projections.
- Increased latent heat release from higher moisture levels can intensify storms by strengthening convective updrafts and cyclonic circulation.
- The complexity of storm-level feedbacks means that current climate models may require higher resolution to accurately predict localized extreme events.
The extra latent heat released within storms has been shown to increase precipitation extremes by strengthening convective updrafts and the intensity of the cyclonic circulation.
Thermodynamic and Dynamic Climate Drivers
- Droughts are driven by thermodynamic processes that increase atmospheric evaporative demand through changes in temperature, radiation, and humidity.
- Dynamic processes influence the frequency and intensity of weather anomalies, affecting precipitation patterns and sunlight exposure.
- Anthropogenic forcing directly impacts thermodynamic variables with high confidence, leading to intensified heatwaves and heavy precipitation.
- Dynamic responses to warming are less understood and heavily influenced by internal climate variability, resulting in low confidence regarding their impact on extreme event locations.
- Regional aridity is further complicated by vegetation feedbacks, CO2 concentrations, and the warming contrast between land and ocean.
- Multi-model projections show high agreement on thermodynamic contributions to precipitation changes but significant uncertainty in dynamic shifts.
Dynamic processes are often indirect responses to thermodynamic changes, are strongly affected by internal climate variability, and are also less well understood.
Circulation Patterns and Climate Extremes
- Large-scale atmospheric circulation patterns like ENSO and the Hadley circulation are primary drivers of regional weather extremes, including droughts and heavy precipitation.
- Global warming is causing a poleward shift of extratropical jets and storm tracks, alongside a widening of the Hadley circulation since the 1980s.
- While the overall amplitude of ENSO variability may remain stable, the frequency of extreme ENSO-related precipitation events is projected to increase.
- Aerosol forcing and land-ocean heat contrasts further complicate circulation patterns, affecting monsoon intensity and tropical cyclone activity.
- There remains low confidence in the specific future magnitude and spatial distribution of circulation changes, leading to uncertainty in near-term extreme weather projections.
- Local and regional feedbacks, such as land-use changes and aerosol concentrations, significantly modulate how large-scale climate shifts manifest as local extremes.
Changes in weather systems come with changes in the frequency and intensity of extreme winds, extreme temperatures, and extreme precipitation, on the backdrop of thermodynamic responses of extremes to warming.
Regional Forcing and Climate Extremes
- Land use and management, including irrigation and deforestation, significantly influence regional hot extremes but are often poorly represented in climate models.
- Low-emissions scenarios involving large-scale land modifications for biofuels and carbon capture may introduce unintended regional climate impacts.
- Aerosol concentrations created a 'global dimming' effect that historically masked heat extremes, but recent 'brightening' has accelerated regional warming.
- Decreases in European aerosol concentrations since the 1990s have contributed to extreme heat as far away as north-east Asia through atmospheric feedbacks.
- Soil moisture feedbacks in mid-latitude regions cause hot extremes to warm substantially faster than the global mean temperature.
- Regional feedback mechanisms contribute to a higher degree of uncertainty and spread in climate model projections compared to global warming averages.
King et al. (2016b) show that aerosol-induced cooling delayed the timing of a significant human contribution to record-breaking heat extremes in some regions.
Regional Feedbacks and Climate Extremes
- Soil moisture and precipitation exhibit complex feedback loops, with negative spatial and positive local effects that influence heavy rainfall projections.
- Current climate models struggle to accurately capture the sign and spatial distribution of soil moisture-precipitation feedbacks in several regions.
- Snow-albedo feedbacks are projected to significantly amplify warming in high latitudes, though their specific impact on temperature and precipitation extremes remains uncertain.
- Heatwaves and droughts can mutually amplify through a cycle of increased evapotranspiration, soil drying, and heightened sensible heat flux.
- Regional forcings and feedbacks can cause extreme temperatures to warm at a higher rate than mean temperatures with high confidence.
- There is only medium confidence in how well state-of-the-art Earth System Models (ESMs) represent these critical regional feedback processes.
Finally, extreme events may also regionally amplify one another.
Projected Extreme Temperature Frequencies
- The data tracks projected changes in extreme temperature events across global land areas and specific AR6 regions.
- Extreme events are categorized as 10-year and 50-year occurrences based on an 1850–1900 pre-industrial baseline.
- Projections are modeled across five global warming levels ranging from 1°C to 4°C.
- The frequency of these events increases significantly as global warming levels rise, with 50-year events showing more dramatic relative increases than 10-year events.
- Results utilize the CMIP6 multi-model ensemble to provide median estimates and uncertainty ranges for regional climate shifts.
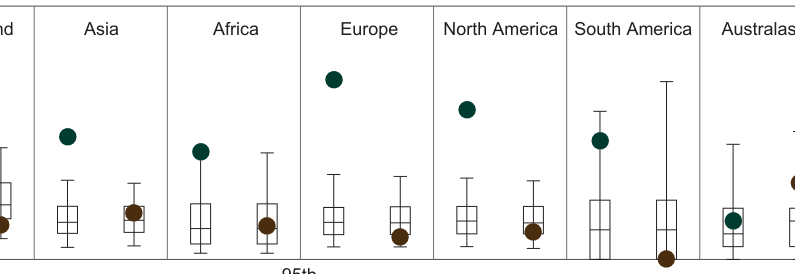
Extreme temperatures are defined as the maximum daily temperatures that were exceeded on average once during a 10-year period (10-year event, blue) and once during a 50-year period (50-year event, orange) during the 1850–1900 base period.
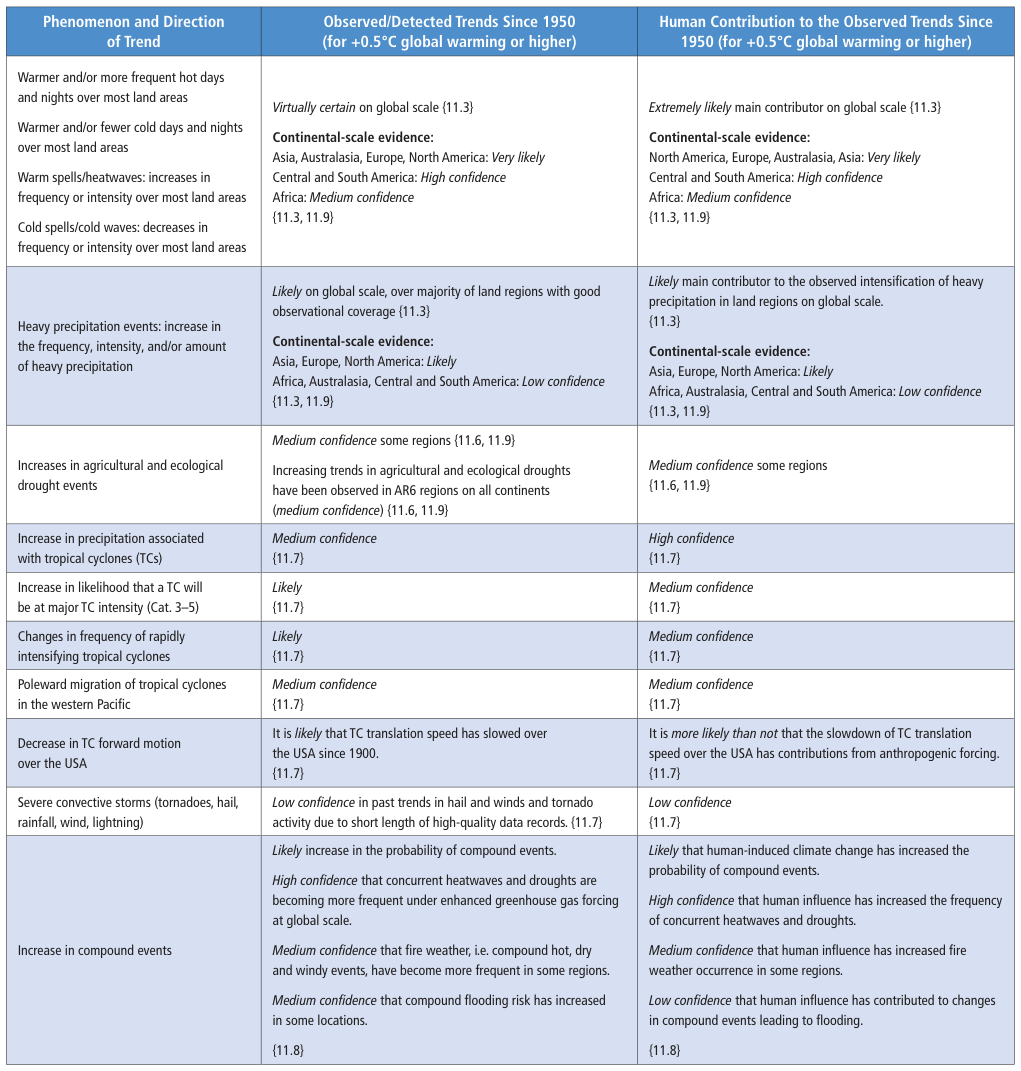
Climate Extremes and Human Influence
- Global warming levels between 1°C and 4°C are projected to significantly increase the frequency of 10-year and 50-year extreme precipitation events.
- Human influence is considered the 'extremely likely' main contributor to the global increase in frequency and intensity of hot days and nights since 1950.
- While heat extremes are virtually certain on a global scale, confidence in regional trends varies, with higher confidence in Asia and Europe compared to Africa.
- Heavy precipitation events have likely increased globally, with human activity identified as a likely driver for intensification in well-monitored land regions.
- Confidence in future projections can exceed confidence in past attribution when physical processes are well-understood despite currently weak observational signals.
In the case where the signal in the observations is still relatively weak but the physical processes underlying the changes in extremes in response to human forcing are well understood, confidence in the projections would be higher than in the attribution.
Climate Extremes and Anthropogenic Forcing
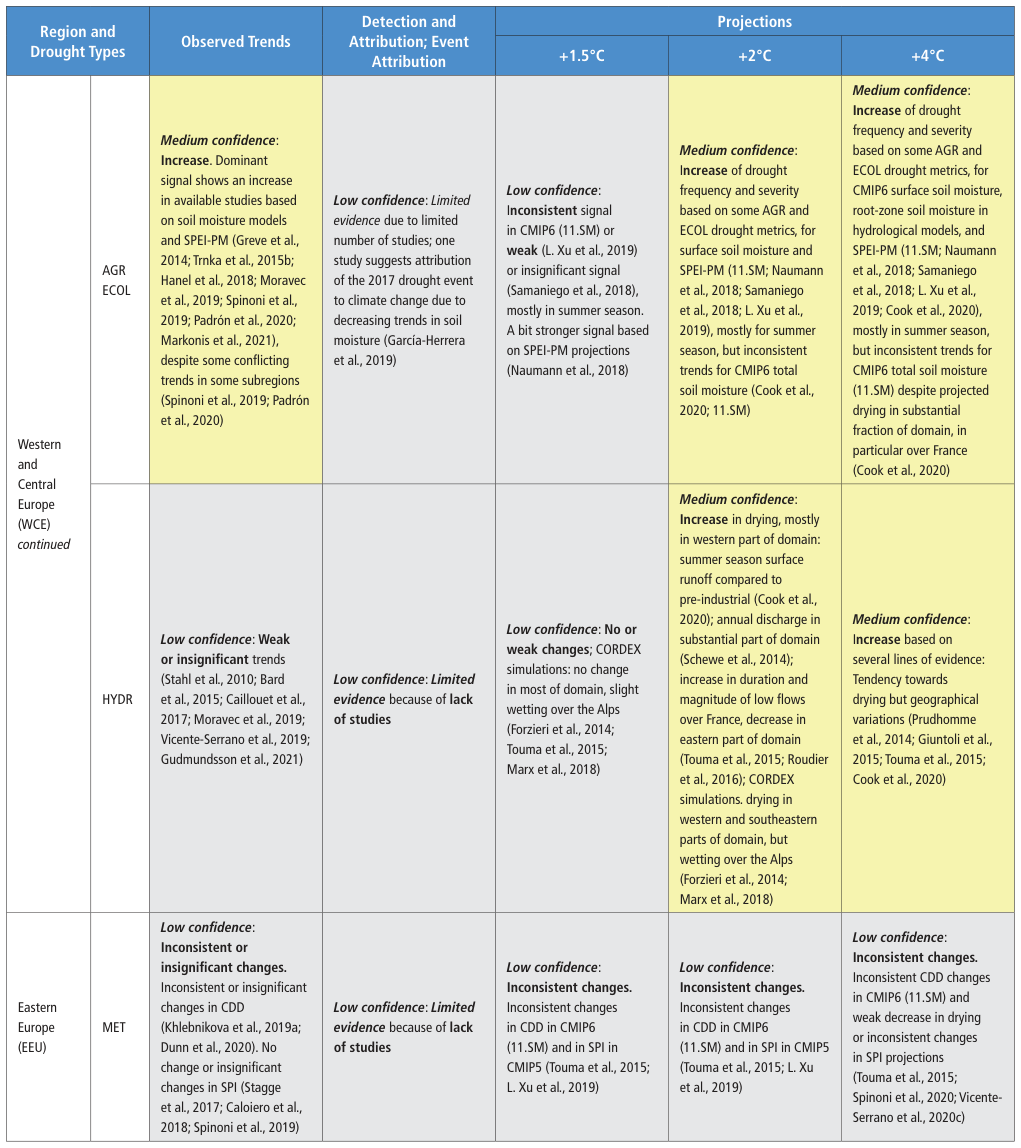
- Agricultural and ecological droughts are increasing across all continents with medium confidence.
- Tropical cyclones are exhibiting higher intensities (Category 3–5), increased precipitation, and slower translation speeds over the USA.
- Compound events, such as concurrent heatwaves and droughts, are becoming more frequent due to human-induced greenhouse gas forcing.
- Global warming disproportionately affects specific regions, with the hottest days in mid-latitude and semi-arid areas warming at twice the global rate.
- The Arctic is projected to experience the most extreme temperature shifts, with the coldest days warming at triple the rate of global warming.
- Confidence in future projections may be lower than attribution if physical processes in a much warmer world are poorly understood.
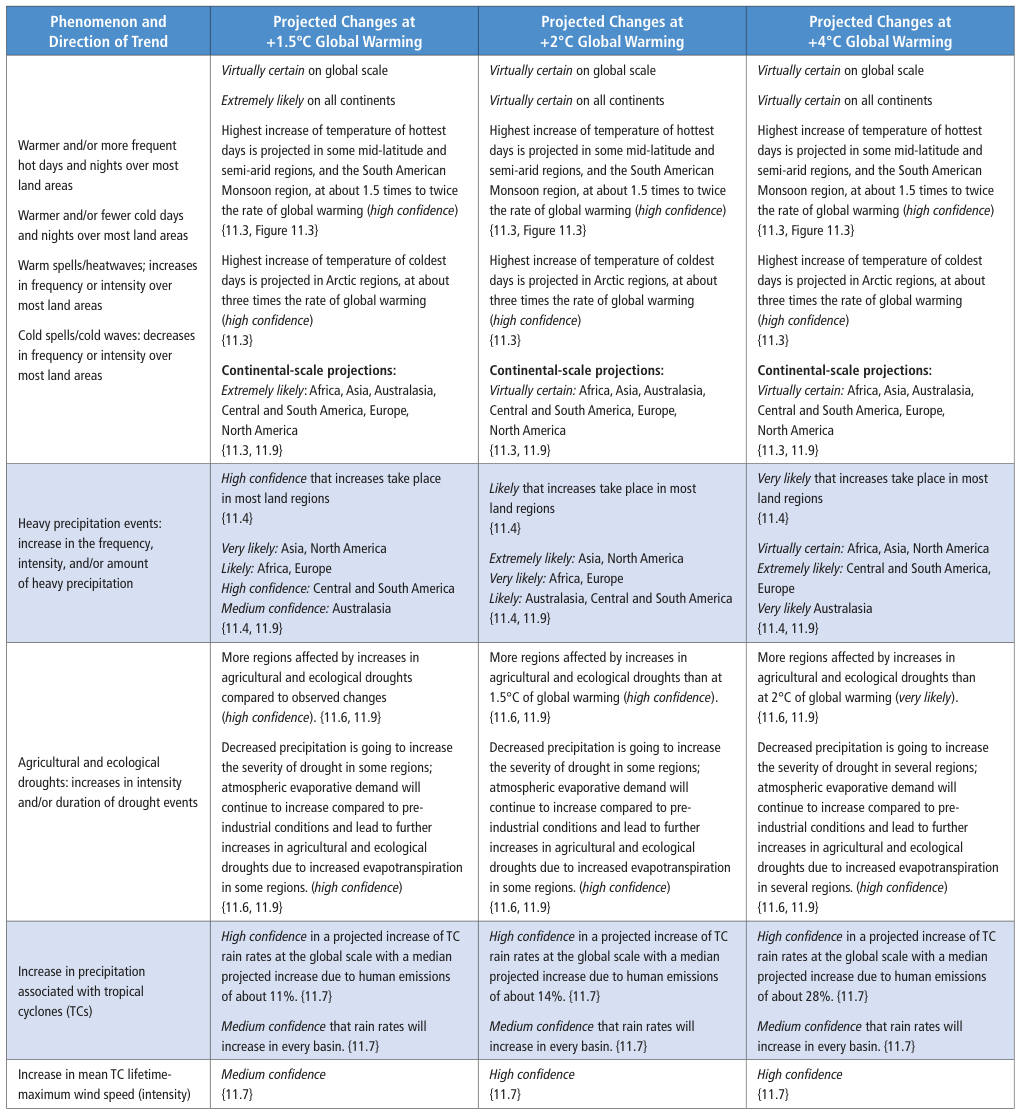
Highest increase of temperature of coldest days is projected in Arctic regions, at about three times the rate of global warming.
Global Climate Change Projections
- Global temperature increases are virtually certain across all continents, with mid-latitude and semi-arid regions warming at up to twice the global rate.
- The Arctic is projected to experience the most extreme warming of cold days, occurring at approximately three times the rate of global warming.
- Heavy precipitation events are expected to increase in frequency and intensity across most land regions, particularly in Asia and North America.
- Agricultural and ecological droughts will intensify and expand to more regions due to increased atmospheric evaporative demand and decreased precipitation.
- Tropical cyclones are projected to see an 11% median increase in rain rates globally due to human-induced emissions.
- Confidence levels for these extreme weather shifts generally increase as global warming thresholds rise from 1.5°C to higher levels.
Highest increase of temperature of coldest days is projected in Arctic regions, at about three times the rate of global warming (high confidence).
Projected Climate Extreme Trends
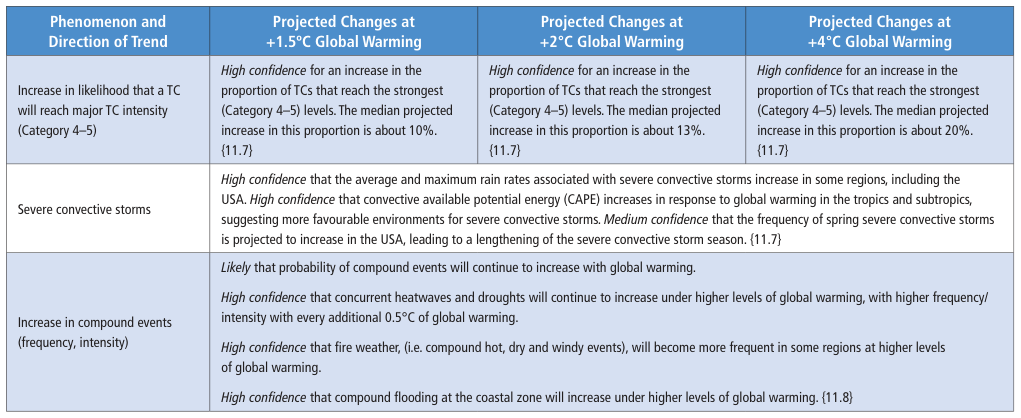
- Tropical cyclone rain rates are projected to increase by approximately 14% at 1.5°C warming and 28% at 4°C warming.
- There is high confidence that the proportion of tropical cyclones reaching Category 4–5 intensity will increase as the planet warms.
- Severe convective storms are expected to have higher rain rates and longer seasons in regions like the USA due to increased convective available potential energy.
- Compound events, such as concurrent heatwaves and droughts, will increase in frequency and intensity with every additional 0.5°C of warming.
- Fire weather conditions—characterized by hot, dry, and windy events—are projected to become more frequent in several regions.
High confidence that concurrent heatwaves and droughts will continue to increase under higher levels of global warming, with higher frequency/ intensity with every additional 0.5°C of global warming.
Climate Surprises and High-Impact Risks
- Low-likelihood, high-impact (LLHI) events are often categorized as 'surprises' because they are rarely anticipated and poorly understood.
- These events can stem from climate tipping points, such as the collapse of the Atlantic circulation or the drying of the Amazon rainforest.
- Compound events, where multiple extremes occur simultaneously or in quick succession, represent another pathway to catastrophic impacts.
- Scientific 'low confidence' in these scenarios reflects a lack of data and knowledge rather than the impossibility of the events occurring.
- Modern researchers are using physical climate models to create 'storylines' of plausible extremes to better prepare for events that have no historical precedent.
- The brevity of meteorological records—often only 50 to 60 years—makes it statistically difficult to predict events that occur on centennial scales.
The low confidence does not by itself exclude the possibility of such events occuring, rather it indicates a poor state of knowledge.
Extremes in a Non-Stationary Climate
- Regional assessments of rare events help quantify risks that are locally unprecedented but share similar climatic drivers.
- The concept of a 'non-stationary climate' means the historical framework for adaptation is constantly shifting and becoming less reliable.
- Events previously considered extreme, such as the 2018 Northern Hemisphere heatwaves, are becoming statistically common even at 1°C of warming.
- High impacts can result from relatively moderate extremes when combined with high levels of societal vulnerability and exposure.
- Future warming scenarios, particularly above 4°C, significantly increase the probability of 'extreme extremes' and simultaneous global disasters.
- Concurrent events across different locations, driven by anomalous circulation or natural variability, pose a major threat to global stability.
As warming continues, the climate moves further away from its historical state we are familiar with, resulting in an increased likelihood of unprecedented events and surprises.
Escalating Risks of Compound Extremes
- Global warming is significantly increasing the probability of compound events, such as the simultaneous occurrence of extreme heat and drought.
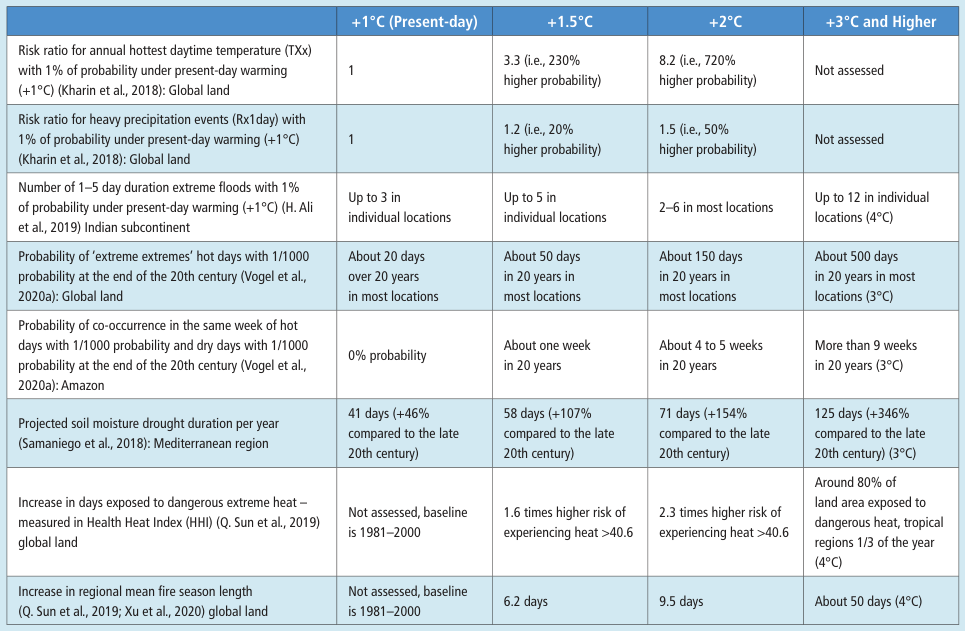
- In the Mediterranean, soil moisture drought duration is projected to increase by up to 346% if global temperatures rise by 3°C.
- Tropical regions face a future where dangerous heat levels could persist for one-third of the entire year at higher warming levels.
- Events that were once considered extremely unlikely without human influence are becoming commonplace as the climate warms.
- The rapid pace of global warming creates a high confidence that societies will face historically unprecedented events and climate surprises.
- Compound events, including concurrent extremes at single locations, are identified as a primary factor increasing the risk of high-impact disasters.
With increasing global warming, some compound events with low likelihood in past and current climate will become more frequent, and there is a higher chance of historically unprecedented events and surprises.
Defining and Measuring Climate Extremes
- Climate extremes are defined by variables exceeding or falling below specific thresholds, which can be relative (percentiles) or absolute (fixed values).
- Relative thresholds allow for extreme events to be identified in any season, whereas absolute thresholds are often linked to specific health or ecosystem impacts.
- Changes in extremes are analyzed through two lenses: the frequency of a specific magnitude or the magnitude of a specific return period.
- The sensitivity of an extreme event to global warming depends on its definition; for instance, temperature magnitude changes often scale linearly, while frequency changes can be exponential.
- As global warming progresses, fixed thresholds may become the 'new normal,' potentially leading to a saturation in the change of probability for those specific events.
- Adaptation strategies may shift what constitutes a 'threshold' over time, though this factor is currently under-integrated in climate projections.
In the case of temperature extremes, changes in magnitude have been shown to often depend linearly on global surface temperature, while changes in frequency tend to be nonlinear and can, for example, be exponential for increasing global warming levels.
Observing and Gridding Climate Extremes
- Climate extremes vary across temporal scales ranging from hourly convective storms to multi-year megadroughts, each requiring specific data sampling strategies.
- Long-term assessment of rare events like megadroughts is particularly challenging due to the limited sample size available in historical observational records.
- Station-based indices for temperature and precipitation are often interpolated onto regular grids to facilitate regional analysis and climate model comparisons.
- Two distinct methodologies exist for gridding: computing indices at the station level before gridding, or gridding daily values first and then computing indices.
- The density of weather stations significantly impacts whether gridded data represents a point estimate or an areal mean, which can lead to biases when comparing observations to model outputs.
- Reanalysis data products provide an alternative source for extreme statistics, though they require rigorous validation against direct observations to ensure accuracy.
In regions with very limited station density (e.g., Africa), the gridded values are closer to point estimates of extremes.
Reanalysis and Satellite Data Limitations
- Temperature extreme data in reanalyses align best with observations after 1980, following the start of the satellite era.
- Extreme precipitation data shows lower agreement across different reanalysis products compared to temperature data.
- Regions with sparse ground observations, such as Africa and South America, suffer from a lack of observational constraints in climate models.
- Modern reanalysis products like ERA5 show improved accuracy over older versions in specific geographic regions.
- Satellite data provides high-resolution sub-daily precipitation info but is limited by indirect measurement and orbital gaps.
- Studies show a significant disconnect between satellite-derived and station-based timing for extreme precipitation events.
Caution is needed when reanalysis data products are used to provide additional information about past changes in these extremes in regions where observations are generally lacking.
Contextualizing Extremes via Paleoclimate Records
- Pre-instrumental data from the Common Era (the last 2000 years) provides a long-term context for modern extreme weather events.
- Historical evidence suggests that droughts of greater magnitude and duration than those in the instrumental record occurred during the preceding millennium.
- Floods in Europe, the Mediterranean, and East Asia over the last five centuries have likely exceeded the magnitude of modern observed floods.
- Confidence in pre-instrumental data is limited by non-uniform geographical coverage, with sparser networks in regions like Australia compared to Europe or North America.
- Natural archives often lack the temporal resolution to capture short-duration events like tropical storms, which may last only days or hours.
- Interpreting sedimentary and botanical records requires complex understanding of natural processes to distinguish between specific environmental disturbances.
Natural archives may be sensitive only to intense environmental disturbances, and so only sporadically record short-duration or small spatial-scale extremes.
Paleoclimate Evidence of Extremes
- Sedimentary archives often provide incomplete or sporadic preservation histories of past climate disturbances.
- Pre-instrumental evidence is most reliable for long-duration and large-scale events like multi-year droughts.
- Multiproxy synthesis products, such as drought atlases, offer more precise insights than single-site studies.
- Recent droughts in California and the Levant appear unprecedented in severity and duration compared to the last several centuries.
- In contrast, some regions like the Great Plains and China may have experienced more severe droughts earlier in the Common Era.
- Conflicting evidence remains regarding the relative severity of historical versus modern extremes in several global locations.
Recent observed drought extremes in some regions – such as the eastern Mediterranean Levant, California in the USA, and in the Andes – do not have precedents within the multi-century periods reconstructed in these studies, in terms of duration and/or severity.
Historical Climate Extremes Comparison
- Reconstructions of pre-instrumental droughts often show conflicting results regarding severity depending on the seasonal perspective and evidence used.
- Modern European summer temperatures, specifically the 2003 and 2010 events, are likely the warmest in at least 500 years, though the year 1540 remains a significant historical outlier.
- Historical flood magnitudes in regions like Central Europe and East Asia have frequently exceeded those found in modern instrumental records.
- Paleoflood data reveals significant centennial-scale variability, though modern land use and infrastructure changes make direct comparisons to historical floods difficult.
- Tropical cyclone activity has fluctuated significantly over the Common Era, with some periods showing higher frequency or intensity than observed in the modern era.
- Paleotempestology is currently limited by its coastal focus, making it difficult to extrapolate localized storm data to entire oceanic basins.
In regions, such as Europe and China, that have rich historical flood documents, there is strong evidence of high-magnitude flood events over pre-instrumental periods.
Paleoclimate Records and Attribution Science
- Paleoreconstruction reveals that rare, high-magnitude flood and drought events occurred frequently over the last 2000 years, often exceeding instrumental records.
- The presence of extreme events in the distant past does not inherently prove or disprove modern shifts in climate trends due to the statistical nature of long-term record keeping.
- Evidence suggests human activities began influencing global drought patterns as early as the start of the 20th century.
- Attribution science has evolved to identify specific external drivers behind individual extreme weather events rather than just long-term trends.
- Technical challenges in attribution, such as the non-Gaussian distribution of extreme data, are being addressed through spatial averaging and non-stationary value distributions.
- Since the AR5 report, the field has shifted from isolated case studies to a robust body of literature quantifying the human fingerprint on specific high-impact events.
The probability of finding an unprecedented extreme event increases with a longer length of past record-keeping, in the absence of longer-term trends.
Attributing Extreme Weather Events
- The probability-based approach quantifies how anthropogenic climate change alters the likelihood or intensity of specific extreme events.
- Researchers compare the current climate against a counterfactual world without human influence to determine if an event was, for example, twice as likely to occur.
- Methodologies vary based on the level of 'conditioning,' ranging from broad warming trends to specific atmospheric circulation patterns.
- The 'storyline' approach uses highly conditional models to simulate rare events or those where specific atmospheric dynamics were the primary drivers.
- A significant limitation of conditional approaches is that the fixed variables, such as sea surface temperatures, may themselves be influenced by climate change.
- The final outcome of any attribution study is heavily dependent on how the event is defined, the framing of the research, and uncertainties in observational data.
These highly conditional approaches have also been called ‘storylines’ and can be useful when applied to extreme events that are too rare to otherwise analyse.
Methodologies in Climate Event Attribution
- Attribution statements are highly sensitive to the spatial and temporal definitions of climate events, with larger-scale averages typically yielding higher confidence.
- The reliability of climate models is a critical factor, as events driven by complex atmospheric dynamics can stretch the capabilities of current-generation simulations.
- The 'storyline approach' offers an alternative for attribution that does not rely on a model's ability to perfectly represent atmospheric circulation.
- Robustness in attribution is increasingly achieved through multi-model and multi-approach methods that combine observational data with experimental models.
- Regional climate extremes are found to scale quasi-linearly with global warming levels, regardless of the specific underlying emission scenarios.
- Using global warming levels (GWLs) as a metric helps separate the uncertainty of the warming response from the specific impacts on climate extremes.
Extreme events characterized by atmospheric dynamics that stretch the capabilities of current-generation models limit the applicability of the probability-based approach of event attribution.
Global Warming Level Projections
- Assessments are shifting toward Global Warming Levels (GWLs) rather than time-based scenarios to reduce uncertainty from varying model responses.
- The report focuses on three primary benchmarks: +1.5°C (Paris Agreement limit), +2°C (slight overshoot), and +4°C (worst-case scenario).
- While many climate extremes scale robustly with global temperature, local factors like aerosol forcing and land-use changes can distort these relationships.
- Discrepancies in temperature models often stem from missing variables such as crop intensification and irrigation practices.
- The timing of when a GWL is reached is critical for long-term variables with high inertia, such as sea level rise, but less so for near-term extremes.
- Researchers are working to identify the specific warming levels at which changes in climate extremes emerge from natural 'climate noise'.
Since these local forcings are not represented, and their future changes are difficult to project, these can be important caveats when using GWL scaling to project future changes for these regions.
Emergence of Climate Extremes
- Signals for temperature extremes (TXx) emerge very early, appearing below 0.2°C of global warming in many regions.
- A difference of only 0.5°C in global warming, such as the gap between 1.5°C and 2°C, results in detectable differences in temperature extremes across most regions.
- The emergence of heavy precipitation extremes (Rx1day) is generally consistent with previous findings for less-extreme precipitation events.
- Analyses are increasingly shifting from a time-based axis to a global surface temperature axis to measure the impact of warming levels.
- Data from CMIP5 and CMIP6 ensembles confirm that regional climate signals often become significant well before reaching major global warming thresholds.
Overall, signals for extremes emerge very early for TXx, already below 0.2°C in many regions (Figure 11.8a,b), and at around 0.5°C in most regions.
Global Warming Levels Framework
- Climate projections are increasingly communicated through Global Warming Levels (GWLs) rather than just time-based emission scenarios.
- The shift toward GWLs is largely motivated by the specific temperature goals established in the Paris Agreement.
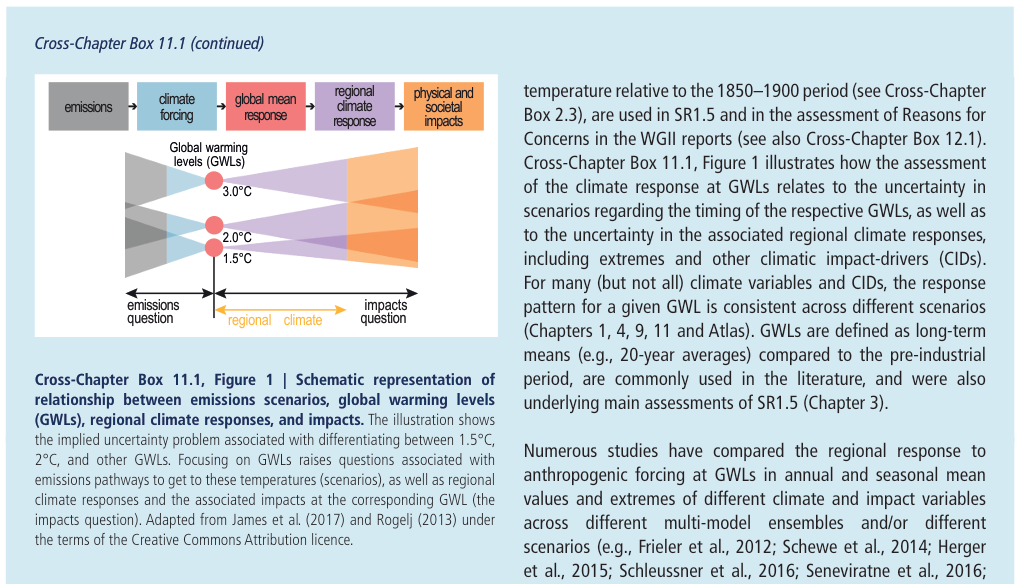
- GWLs are calculated as 20-year averages of global surface temperature changes relative to the 1850–1900 pre-industrial period.
- For many climate variables, the regional response patterns remain consistent for a specific GWL regardless of which emission scenario is used to reach it.
- This framework allows researchers to assess uncertainties in the timing of warming alongside the resulting regional impacts and extreme weather events.
For many (but not all) climate variables and CIDs, the response pattern for a given GWL is consistent across different scenarios.
Global Warming Levels and Regional Response
- Regional climate response patterns are largely consistent across different emission scenarios when measured against specific Global Warming Levels (GWLs).
- Temperature-related variables show higher consistency across scenarios than hydrological or atmospheric dynamics variables.
- The GWL approach is superior to linear pattern scaling because it can accommodate non-linear climate responses, such as the frequency of heat extremes.
- Regional climate sensitivity can be effectively decoupled from the global warming uncertainty caused by specific emission pathways or internal variability.
- Discrepancies in GWL-based responses may still occur in regions with significant aerosol changes or for complex indices like warm-spell duration.
- This decoupling allows for the development of regionally resolved emulators that use global surface temperature as a primary input for climate modeling.
Thus, the GWL approach isolates the uncertainty in the regional climate response from the global warming uncertainty induced by scenario, global mean model response and internal variability.
Mapping Global Warming Levels
- Global Warming Levels (GWLs) are used to differentiate climate impacts at specific thresholds like 1.5°C and 2°C regardless of the emission scenario.
- The 'GWL-sampling' approach, also known as epoch analysis, identifies and averages Earth system model simulations that reach specific temperature targets.
- Research indicates that the mean temperature response at a specific GWL is largely insensitive to the rate of warming or the specific pathway taken to get there.
- Uncertainty in these models is visualized through an 'advanced approach' that distinguishes between robust signals, conflicting signals, and areas with no significant change.
- Mapping these levels involves reconciling CMIP6 ensemble data with assessed ranges of projected global surface temperatures from other lines of evidence.
The close agreement of (g) and (h) demonstrates that the mean temperature response at 2°C is not sensitive to the rate of warming.
Mapping Global Warming Levels
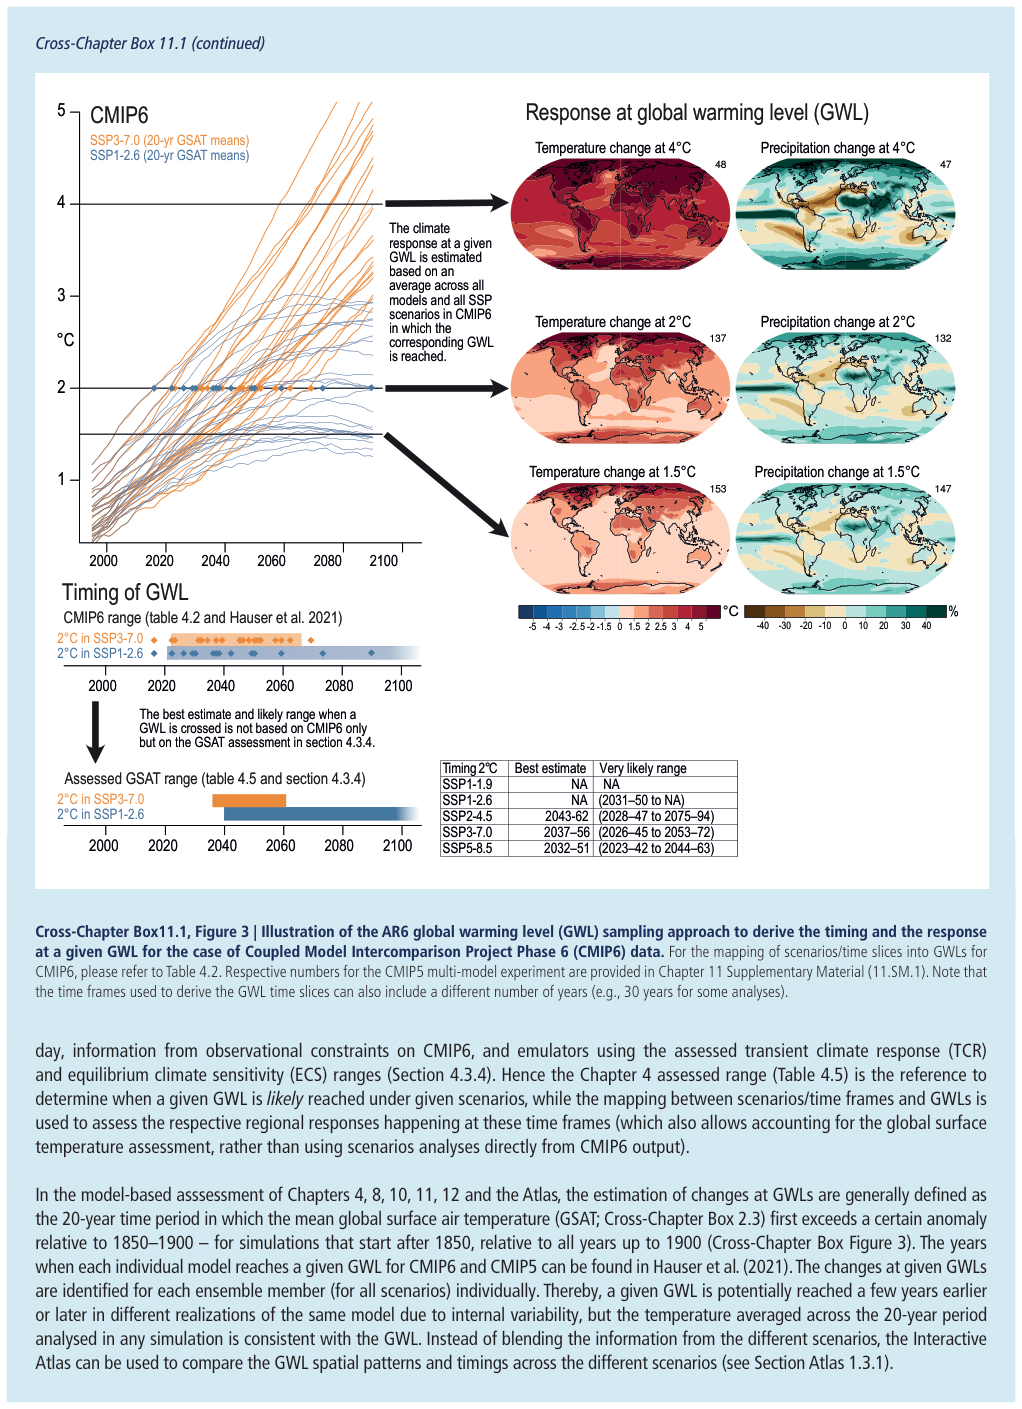
- The assessment uses Global Warming Levels (GWLs) as a reference to determine when specific temperature thresholds are reached under various emission scenarios.
- GWLs are defined as the 20-year period where the mean global surface air temperature first exceeds a specific anomaly relative to the 1850–1900 baseline.
- The methodology incorporates observational constraints and emulators rather than relying solely on raw CMIP6 model output to ensure more accurate timing estimates.
- Individual model realizations may reach a GWL at different times due to internal climate variability, but the 20-year average remains consistent with the target level.
- High-emission scenarios like SSP5-8.5 are projected to reach the 2°C threshold as early as the 2032–2051 window, while low-emission scenarios may never reach it.
- This sampling approach allows researchers to compare spatial patterns of climate change across different scenarios at the same level of global warming.
Thereby, a given GWL is potentially reached a few years earlier or later in different realizations of the same model due to internal variability.
Global Warming Levels vs Scenarios
- Climate projections can be mapped from time-based scenarios to specific Global Warming Levels (GWLs) to standardize assessments across different models.
- Scenarios remain essential for evaluating mitigation pathways, emission-driven uncertainties, and variables influenced by specific radiative forcings like aerosols.
- Fast-responding climate elements such as sea ice and snow cover show minimal dependence on the specific scenario used to reach a warming level.
- Slow-responding variables like ice sheet volume and sea level rise are highly dependent on the timing and pathway taken to reach a GWL.
- The climate response at a specific GWL can vary significantly depending on whether the state is transient, in equilibrium, or following a temperature overshoot.
Slow-responding variables such as ice volumes of glaciers and ice sheets respond with a substantial delay and, due to their inertia, the response depends on when a certain GWL is reached.
Global Warming and Temperature Extremes
- Global Warming Level (GWL) projections help policymakers understand the drastic differences between stabilizing at 1.5°C versus reaching 3°C or 4°C.
- The AR6 assessment emphasizes that every 0.5°C of warming causes statistically significant increases in the frequency and intensity of climate extremes.
- Greenhouse gas forcing is identified as the primary driver behind the global increase in warm extremes and the decrease in cold extremes.
- Regional temperature extremes often exceed global average warming due to land-sea temperature contrasts and local feedback loops like soil moisture and snow-albedo effects.
- Large-scale atmospheric circulation patterns, such as atmospheric blocking and planetary wave modulations, are critical mechanisms that trigger heatwaves and cold snaps.
- Natural modes of variability like the North Atlantic Oscillation (NAO) influence the persistence of extreme events, though their future response to warming remains a complex area of study.
The AR6 assessment shows that every bit of global warming matters and that changes in global warming of 0.5°C lead to statistically significant changes in mean climate and climate extremes.
Drivers of Regional Temperature Extremes
- Global warming is the dominant driver of regional temperature extremes, and human influence remains the primary cause even after accounting for natural variability.
- Land-atmosphere feedbacks, particularly soil moisture drying, significantly amplify high temperatures in mid-latitude regions through increased sensible heat flux.
- Direct CO2 forcing affects land temperatures by reducing plant transpiration and evaporative cooling, leading to higher land warming.
- Snow and ice-albedo feedbacks are critical contributors to the rapid warming of cold extremes in high-latitude regions.
- Regional human activities like deforestation can increase hot extremes, while irrigation and specific agricultural practices may provide localized cooling effects.
- Discrepancies between climate models and observations often stem from the complex representation of land-atmosphere feedbacks and irrigation processes.
Irrigation has been shown to be responsible for a cooling of hot temperature extremes of up to 1°C–2°C in many mid-latitude regions in the present climate, a process not represented in most of state-of-the-art ESMs.
Drivers of Temperature Extremes
- Greenhouse gas forcing is identified as the primary driver behind the global warming of temperature extremes.
- Regional temperature variations are significantly influenced by aerosol reductions, land-use changes, and soil-moisture feedbacks.
- The urban heat island effect and rapid urbanization have specifically exacerbated nighttime temperature extremes in cities.
- Agricultural practices like irrigation and crop expansion have locally attenuated summer heat in regions like the Midwestern USA.
- Updated observational data provides overwhelming evidence of increased frequency and intensity of hot extremes alongside decreasing cold extremes.
- Current climate models (CMIP5 and CMIP6) often struggle to accurately represent local forcings, leading to regional simulation uncertainties.
While the magnitude of the observed trends in temperature-related extremes varies depending on the region, spatial and temporal scales, and metric assessed, evidence of a warming effect is overwhelming, robust, and consistent.
Global Trends in Temperature Extremes
- Global data shows a robust increase in the frequency and intensity of hot extremes alongside a significant decrease in cold extremes.
- Land-based warming for the hottest daily maximums (TXx) is approximately 45% higher than the global average warming rate.
- Daily minimum temperature extremes (TNn) are warming faster than daily maximums, with the Arctic seeing particularly high increases in night-time temperatures.
- Nearly all land regions globally have experienced a statistically significant decrease in the frequency of cold nights and cold spell days since the 1950s.
- Despite data gaps in parts of Africa, available evidence confirms a clear increase in heatwaves and a reduction in cold events across the continent.
- Warming trends in temperature extremes persisted even during the period of slower global surface warming observed from the late 1990s to early 2010s.
Warming of land mean TNn is even higher, with about 3°C of warming since 1960.
Global Shifts in Temperature Extremes
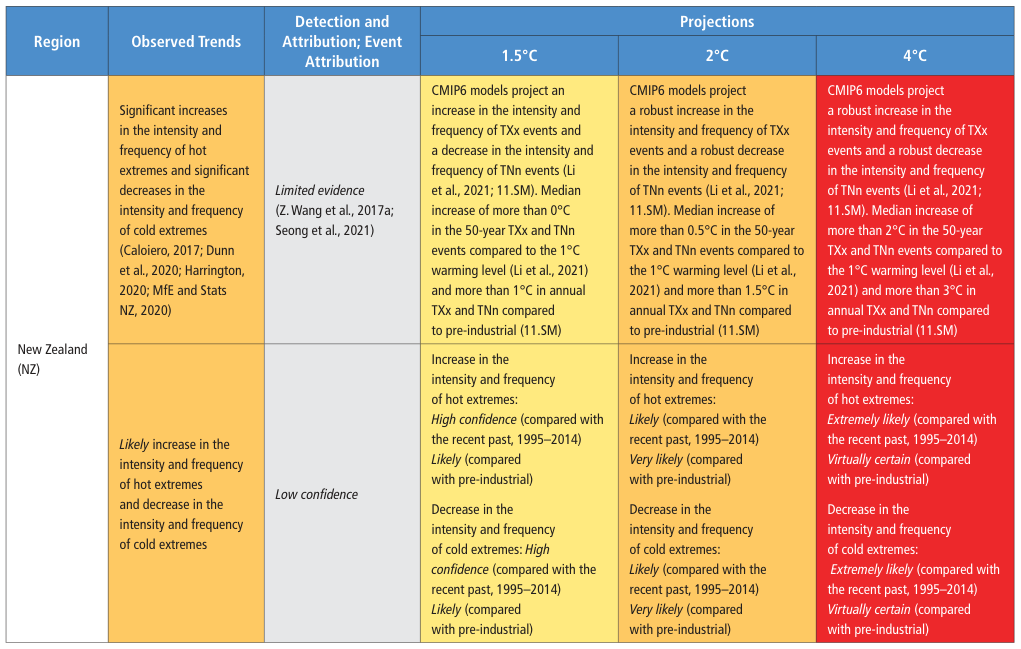
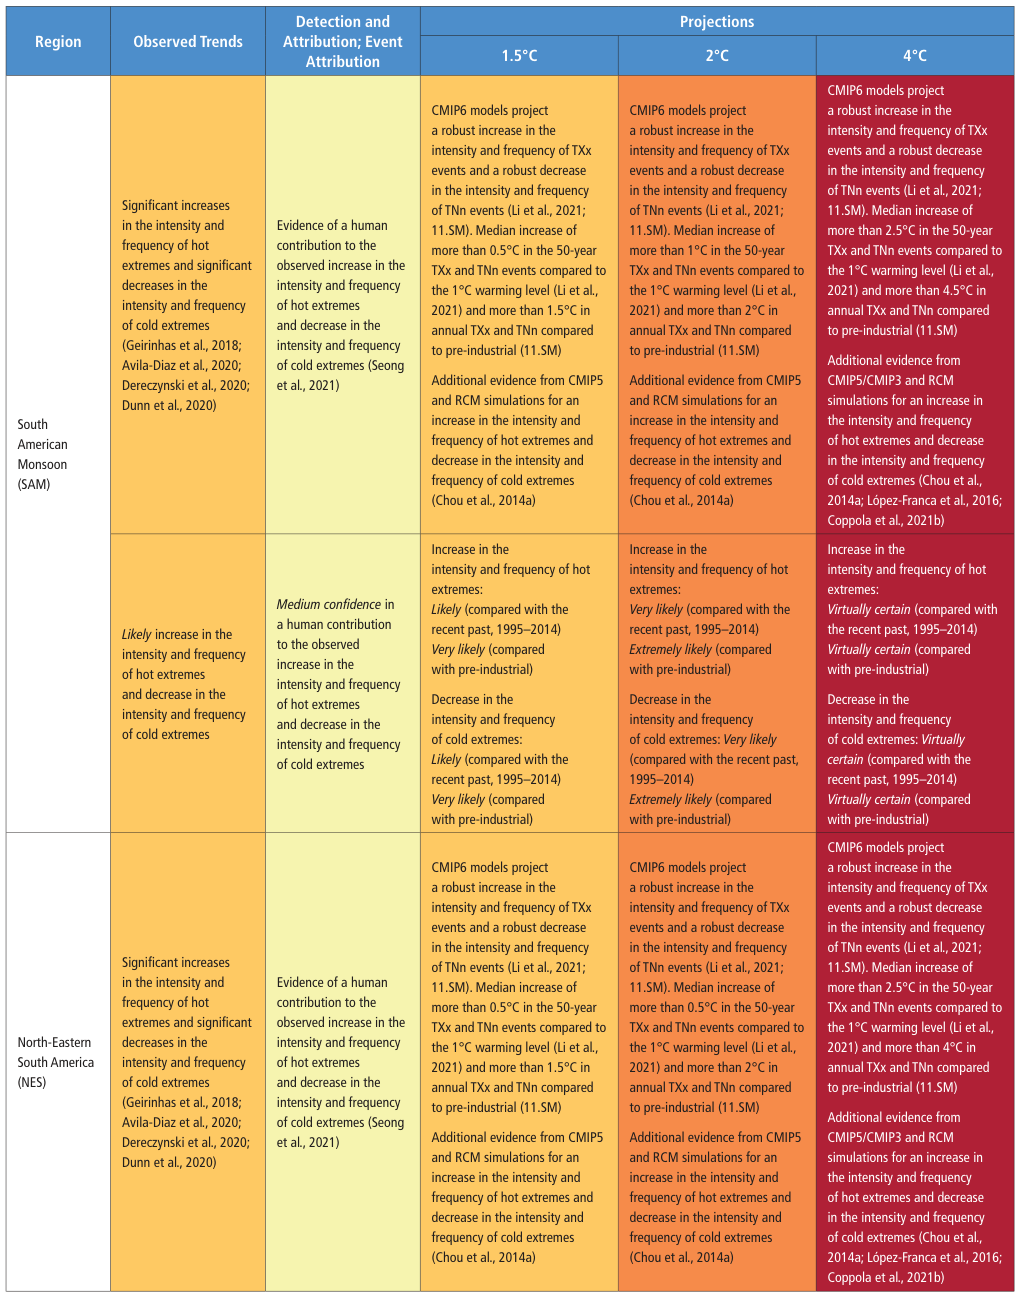
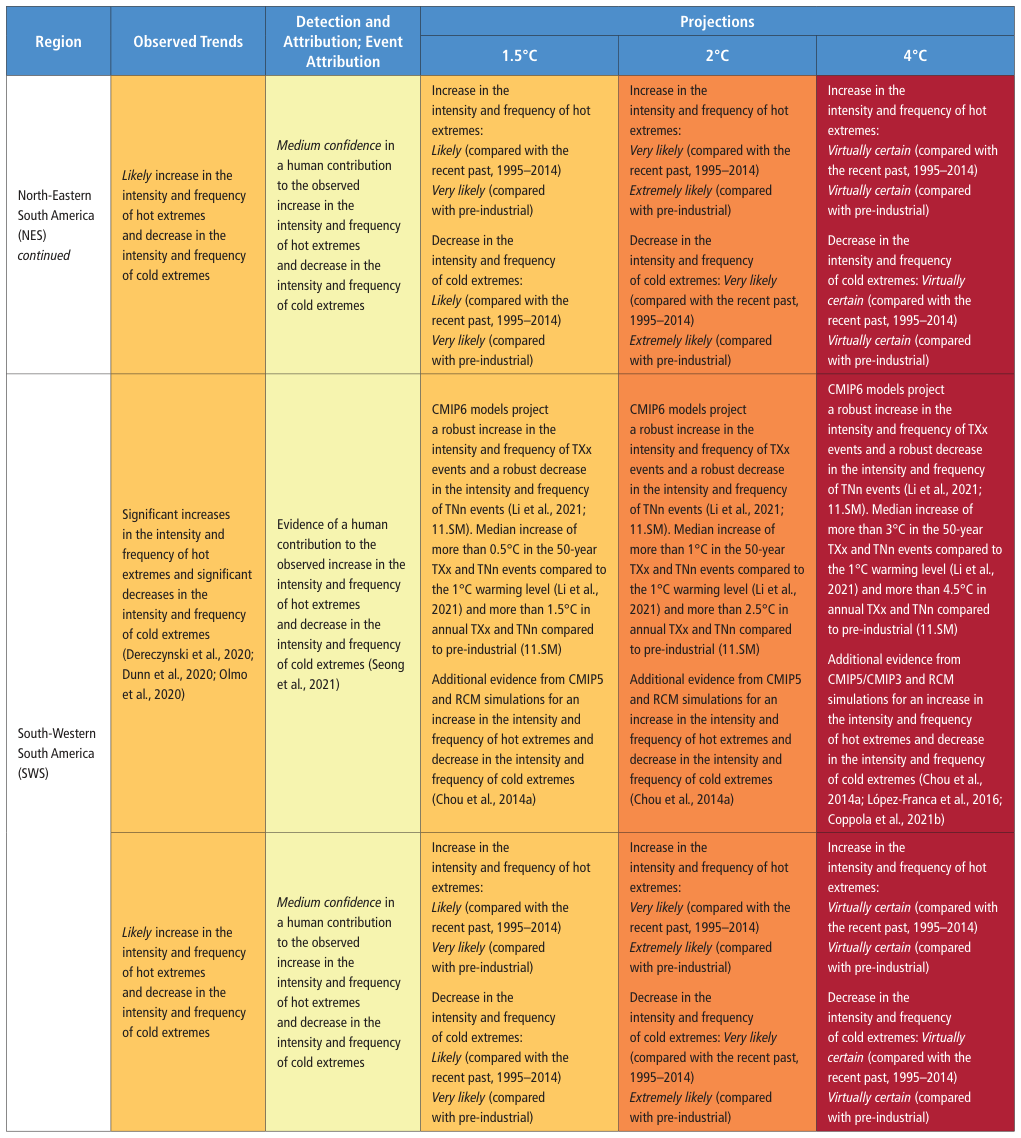
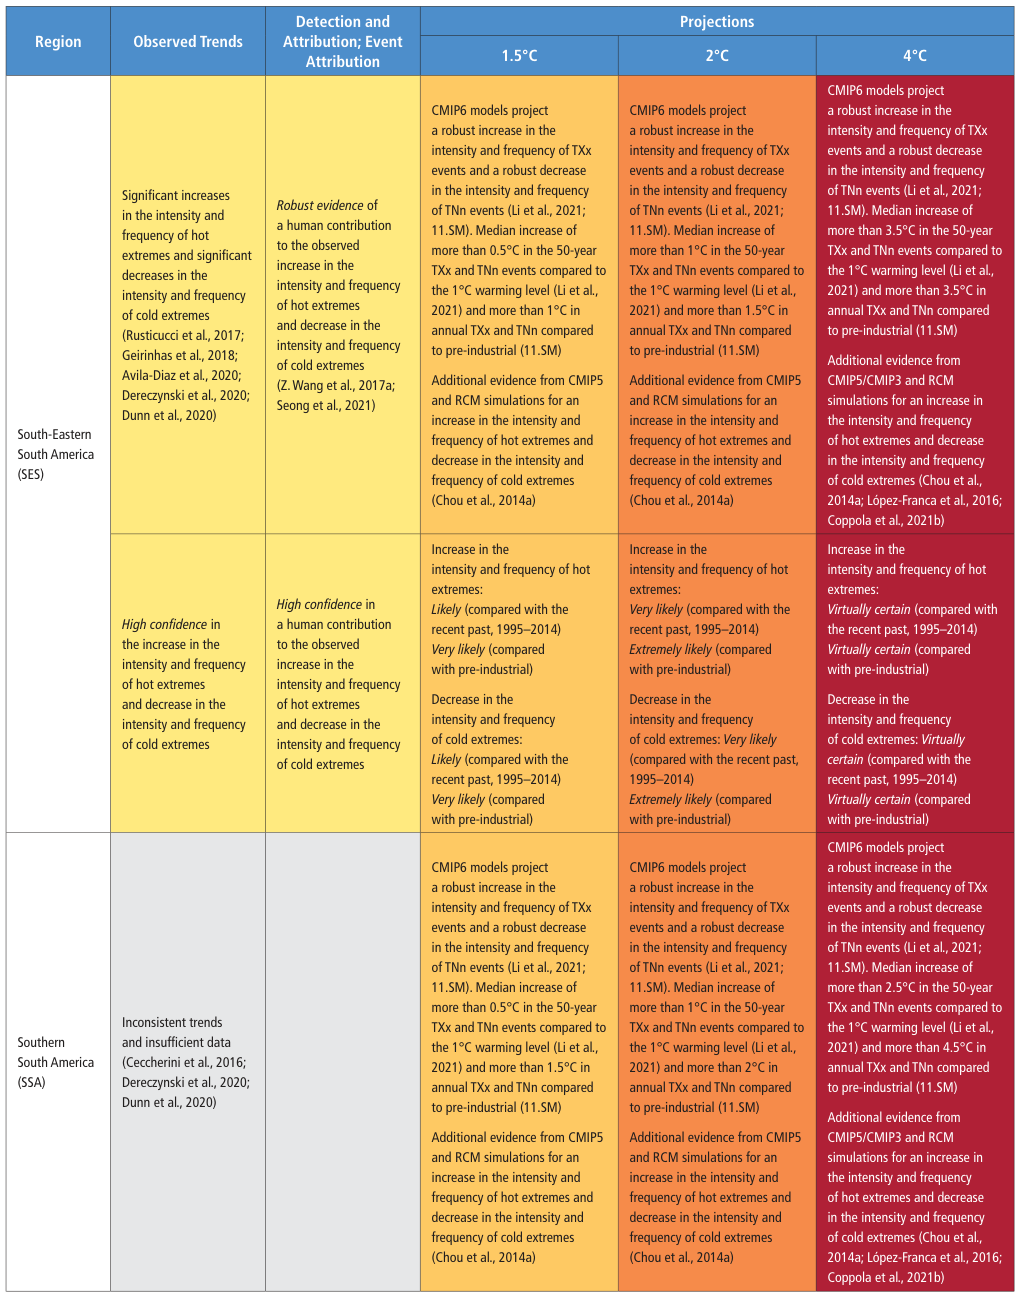
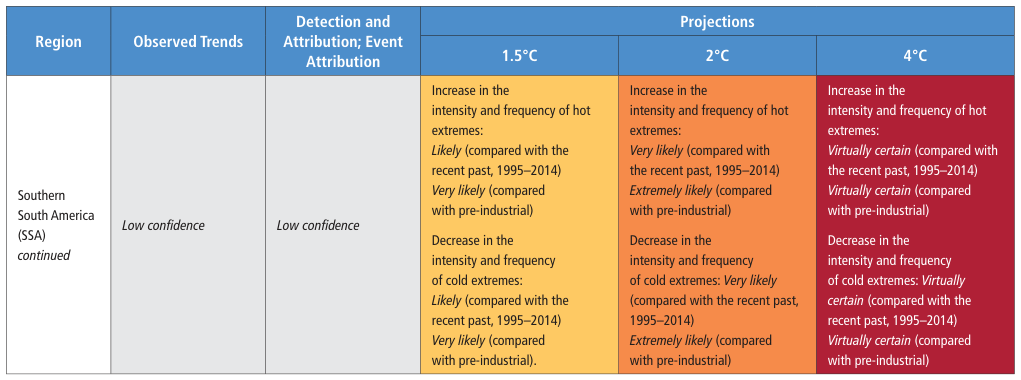
- Widespread warming has led to a very likely increase in the intensity and frequency of hot extremes across Asia, Australasia, and South America.
- Cold extremes, including cold spells and cold nights, have significantly decreased in frequency and intensity since the mid-20th century.
- In Australasia, the increase in extreme minimum temperatures has generally exceeded the increase in extreme maximum temperatures.
- Regional variations exist, such as stable frost day counts in parts of Southern Australia and localized decreases in warm extremes in South-Eastern South America during summer.
- The duration of heat extremes is lengthening in specific areas, such as southern China, contributing to a larger area fraction of extreme warmth across the continent.
- Data coverage gaps are mitigated by the high confidence in widespread warming trends and projected future changes that align across all regions.
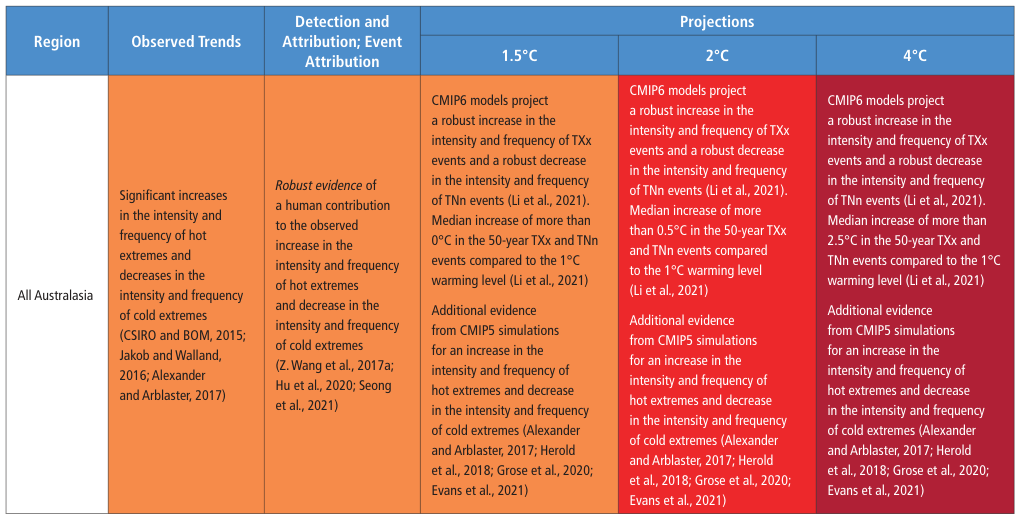
The increase in extreme minimum temperatures occurs in all seasons over most of Australia and typically exceeds the increase in extreme maximum temperatures.
Global Trends in Temperature Extremes
- Cold night temperatures (TNn) are warming faster than hot day extremes (TXx) in several regions, particularly in North-East Brazil and Northern South America.
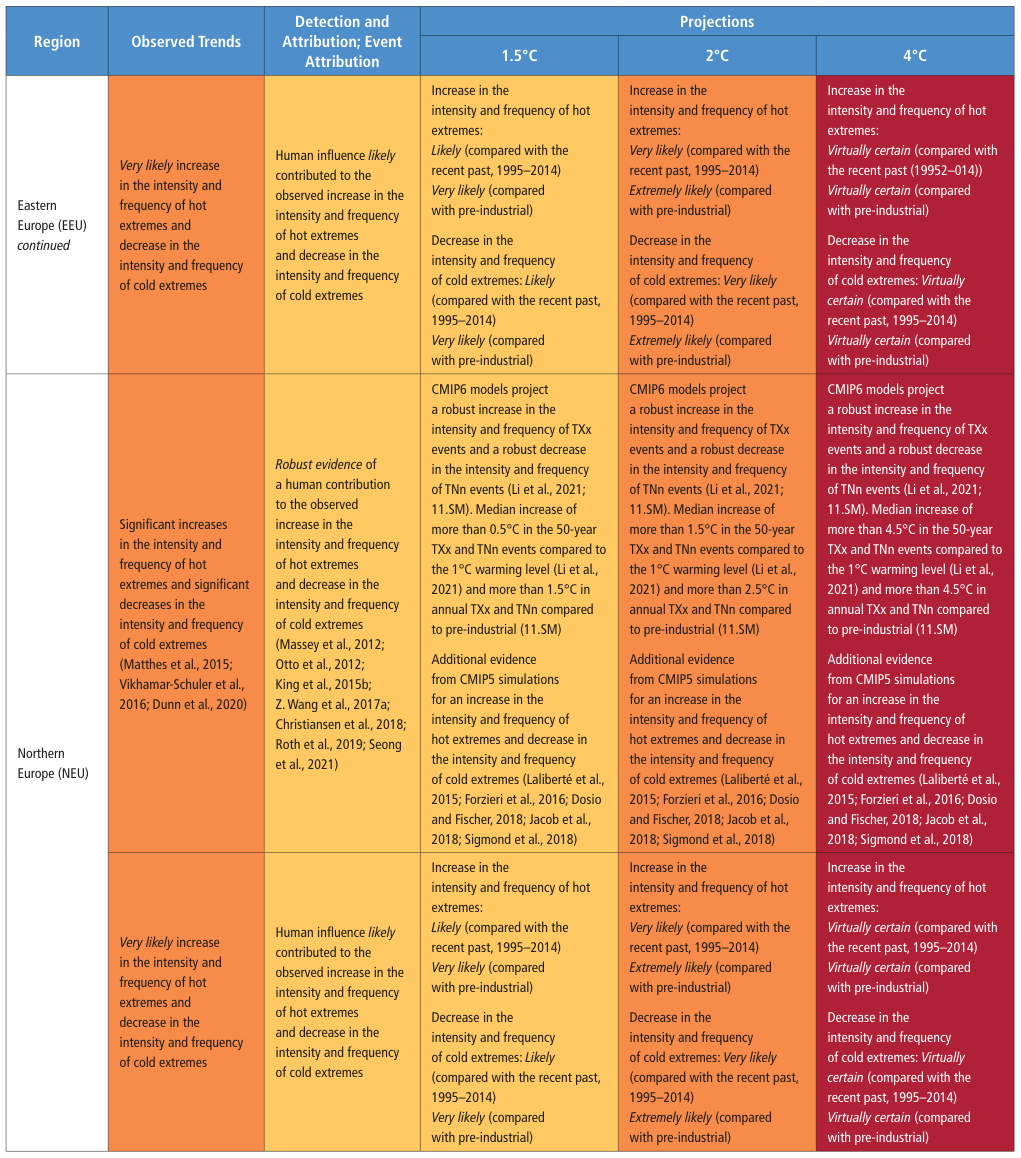
- Europe shows a very robust increase in the frequency and magnitude of heatwaves, alongside a significant decline in the frequency of winter cold spells.
- North America exhibits a consistent increase in hot extremes and a decrease in cold extremes, though spatial variations exist in the United States.
- The probability of typical European cold spells has halved compared to a hypothetical world without human-induced climate change.
- The Arctic and Greenland have experienced a marked increase in extreme heat events since 1979, aligning with observed summer ice melt.
- Long-term data from 1960–2018 confirms significant warming trends in annual maximum temperatures and the frequency of days exceeding the 90th percentile.
Typical cold spells, such as that observed during the 2009–2010 winter, had an occurrence probability two times smaller currently than if climate change had not occurred.
Global Trends in Temperature Extremes
- Arctic annual minimum temperatures have risen at three times the rate of global surface temperatures since the 1960s, with mid-winter warming being particularly intense.
- Global heatwave metrics, including intensity, duration, and frequency, have significantly increased between 1950 and 2011.
- Regional data from Europe, Australia, Africa, and Asia show consistent increases in heatwave days and duration, though some local variations exist.
- It is virtually certain that warm days and nights have increased globally while cold days and nights have decreased since 1950.
- Climate models generally capture the spatial distribution of temperature extremes but tend to overestimate hot extreme trends and underestimate cold extreme trends.
- Confidence levels for temperature trends in Africa and South America are lower than other regions due to limited data availability and fewer localized studies.
Arctic annual minimum temperatures have increased at about three times the rate of global surface temperature since the 1960s.
Evaluating Climate Model Performance
- CMIP6 models show similar performance to CMIP5 in simulating temperature extremes, maintaining a general warm bias for hot extremes and a cold bias for cold extremes.
- Regional performance varies, with models underestimating warming in Western and Central Africa while performing well in East Asia and Australia.
- Multi-model ensembles consistently outperform individual models by reducing systematic biases across various temperature indices.
- CMIP6 models demonstrate improved representation of underlying processes like seasonal, diurnal, and synoptic-scale variability compared to their predecessors.
- Systematic biases persist in specific geographies, such as hot extremes being too cool in mountainous regions and too warm in the eastern USA.
- Atmospheric Model Intercomparison Project (AMIP) simulations effectively capture global trends but tend to produce overly persistent heatwave events.
The relative error estimates in the simulation of various indices of temperature extremes in the available CMIP6 models show that no single model performs the best on all indices, and the multi-model ensemble seems to outperform any individual model due to its reduction in systematic bias.
Regional Climate Model Performance
- Regional Climate Models (RCMs) generally provide added value over Global Climate Models (GCMs) in simulating temperature extremes, particularly in topographically complex areas.
- Extensive evaluations across East Asia, Europe, and Africa demonstrate that RCM performance is highly dependent on resolution and specific parameterizations.
- Significant biases remain in European and North American models, often manifesting as cold biases in areas with complex terrain or due to missing physiological CO2 effects.
- The exclusion of land surface processes, such as enhanced water-use efficiency and evapotranspiration changes, can lead to inaccuracies in temperature projections.
- Land-use changes like temperate deforestation are identified as critical factors that influence summer warming and winter cooling trends in climate simulations.
The land surface models used in the RCMs do not account for physiological CO2 effects on photosynthesis leading to enhanced water-use efficiency and decreased evapotranspiration.
Attributing Temperature Extremes
- Earth System Models (ESMs) successfully reproduce global mean states and warming trends but struggle to capture specific land-surface effects like deforestation and irrigation.
- Observations show that forest cover typically provides a cooling effect during the day, yet some climate models incorrectly simulate daytime warming in these regions.
- There is high confidence that human influence, primarily greenhouse gas emissions, is the dominant driver of the increased frequency and intensity of hot extremes globally.
- Anthropogenic warming is estimated to be responsible for approximately 75% of moderate daily hot extremes occurring over land.
- The cooling effect of aerosols has partially offset greenhouse gas warming, with detectable impacts specifically noted over Europe and Asia.
- Recent studies have improved the signal-to-noise ratio, allowing for the detection of human-induced climate signals even at country and sub-country scales.
As much as 75% of the moderate daily hot extremes (above 99.9th percentile) over land are due to anthropogenic warming.
Anthropogenic Signals in Temperature Extremes
- Global studies across North America, Asia, Australia, and Europe show a clear anthropogenic signal in extreme temperature trends.
- Human influence has significantly increased the frequency of record-breaking heat while decreasing record-breaking cold events.
- Anthropogenic warming has increased the severity and probability of the hottest months across 80% of the globe's observed area.
- Specific regional impacts include a 60-fold increase in the probability of extreme summer heat in eastern China since the 1950s.
- In Southern Australia, unique local factors like decreased cloud cover have led to more frost days despite an overall rise in mean temperatures.
- Advances in attribution methods now allow scientists to distinguish human-caused climate signals from natural forcing with high confidence.
Sun et al. (2014) found that human influence has caused a more than 60-fold increase in the probability of the extreme warm 2013 summer in eastern China since the 1950s.
Attributing Extreme Temperature Events
- Recent studies identify an 'infinite risk ratio' for certain extreme events, meaning they are virtually impossible without human-induced climate change.
- Anthropogenic influence has consistently reduced the probability of extreme cold events in Europe, the USA, and China, with rare exceptions due to circulation changes.
- The scale and duration of an event significantly impact attribution results, with larger and longer events showing higher risk ratios as natural variability decreases.
- Regional variations in extreme temperatures are influenced by local factors like land-surface feedbacks, aerosols, and irrigation which can mask or enhance greenhouse gas effects.
- Human activities such as deforestation and crop intensification play measurable roles in regional temperature extremes, sometimes contributing up to a third of observed warming.
Several studies of recent events from 2016 onwards have determined an infinite risk ratio (a fraction of attributable risk, or FAR, of 1), indicating that the occurrence probability for such events is close to zero in model simulations without anthropogenic influences.
Human Influence on Temperature Extremes
- Human influence is the primary driver behind the global increase in hot extremes and the decrease in cold extremes.
- Recent extreme heat events are considered extremely unlikely to have occurred without human-induced climate change.
- Regional factors like aerosol concentrations and agricultural practices have temporarily attenuated warming in specific areas.
- Future projections indicate that heatwaves will become more frequent, intense, and longer-lasting as global temperatures rise.
- Even a 0.5°C increase in global warming significantly shifts the frequency and intensity of the rarest temperature events.
- Temperature extremes over land are projected to warm at a faster rate than the global mean temperature.
Some specific recent hot extreme events would have been extremely unlikely to occur without human influence on the climate system.
Scaling of Temperature Extremes
- Temperature extremes generally scale linearly with global warming levels, but regional rates can significantly exceed the global average.
- In the mid-latitudes, hot extremes can warm at twice the rate of global warming due to soil moisture and evapotranspiration feedbacks.
- The Arctic experiences the most dramatic shifts, with the coldest nights warming at approximately three times the rate of global mean temperature increases.
- The probability of extreme events increases nonlinearly, meaning rare events like 100-year heatwaves become disproportionately more frequent as warming progresses.
- Under high-emission scenarios, nearly 92% of land area could experience what is currently a 20-year heat extreme every other year by the end of the century.
In the Arctic winter, the rate of warming of the temperature of the coldest nights is about three times the rate of global warming.
Global Projections of Temperature Extremes
- Global warming is driving a nonlinear increase in fixed-threshold heat indices across all continental regions.
- Future heatwaves are projected to increase significantly in area, duration, and magnitude, primarily due to rising mean seasonal temperatures.
- Regional Climate Models (RCMs) provide high-resolution data showing robust increases in temperature extremes across Africa, Asia, and Australia.
- It is very likely that hot extremes will increase and cold extremes will decrease even at a modest 1.5°C global warming threshold.
- Under a 4°C warming scenario, these shifts in temperature extremes are considered virtually certain to occur on a global scale.
Compared to the historical climate, warming will result in strong increases in heatwave area, duration and magnitude.
Global Shifts in Temperature Extremes
- Climate models across CMIP5, CMIP6, and CORDEX consistently project a rise in the intensity and frequency of hot extremes globally.
- Africa is expected to see a significant increase in heatwaves and warm nights while cold spells and frost days diminish even at low warming levels.
- In Asia, temperature extremes in north-west regions could increase by as much as 8.4°C under high-emission scenarios.
- The Middle East and North Africa (MENA) regions face extreme temperature increases of nearly 7°C by the end of the century.
- Australasia and South America show similar trends where the loss of cold extremes and frost days is driven primarily by rising mean temperatures.
Future mid-latitude warm extremes, similar to those experienced during the 2010 event, are projected to become more extreme, with temperature extremes increasing potentially by 8.4°C (RCP8.5) over north-west Asia.
Global Projections of Temperature Extremes
- Climate models across CMIP5, CMIP6, and CORDEX simulations consistently project a global increase in the frequency and intensity of hot extremes and a decrease in cold extremes.
- In Europe, the most significant increases in heatwave duration are expected in southern cities, while Central European cities may experience the highest maximum heatwave temperatures.
- North American projections indicate that winter minimum temperatures are rising faster than mean temperatures, with extreme cold spells potentially warming by over 10°C.
- The frequency of warm nights is projected to increase more rapidly than warm days in certain regions, continuing a trend observed in historical data.
- It is virtually certain that heatwave length and intensity will increase over most land areas compared to the 1995–2014 baseline.
- Temperature extremes in mid-latitude and semi-arid regions are expected to rise at 1.5 to 2 times the rate of overall global warming.
CMIP5 models do not project current 1-in-20-year annual minimum temperature extremes to recur over much of the continent.
Climate Extremes and Precipitation Mechanisms
- Arctic regions are projected to warm at approximately three times the global rate, with temperature extremes increasing nonlinearly as global warming levels rise.
- The magnitude of temperature extremes on land is expected to increase more significantly than the global mean temperature.
- Heavy precipitation increases globally due to the thermodynamic effect of warming, which expands the atmosphere's water-holding capacity according to the Clausius–Clapeyron relation.
- Regional precipitation extremes are further influenced by dynamic changes and large-scale climate modes like ENSO and the North Atlantic Oscillation.
- Future projections of extreme precipitation remain uncertain due to the difficulty of separating global warming effects from internal climate variability and cloud microphysical adjustments.
- Changes in sea surface temperatures and aerosol levels are identified as critical drivers that can amplify monsoonal rainfall and coastal storm intensity.
The probability of temperature extremes generally increases nonlinearly with increasing global warming levels (high confidence).
Urbanization and Heavy Precipitation Trends
- Urbanization intensifies extreme precipitation through mechanisms like the urban heat island effect, aerosol emissions, and physical structures that impede atmospheric motion.
- Global extreme precipitation increases are primarily driven by thermodynamic changes that follow the Clausius-Clapeyron relationship as the atmosphere warms.
- Dynamic drivers of precipitation, such as changes in atmospheric circulation, remain a complex and uncertain aspect of future climate projections.
- Recent observational data confirms a robust global increase in the annual maximum daily precipitation (Rx1day) since the mid-20th century.
- Significant increases in heavy rainfall have been recorded across North America, Europe, and Asia, surpassing what would be expected by chance.
- Human-induced factors beyond greenhouse gases, including irrigation and land-use changes, significantly influence local precipitation extremes.
Urbanization intensifies extreme precipitation, especially in the afternoon and early evening, over the urban area and its downwind region.
Trends in Extreme Precipitation
- Global data from 1961–2018 shows a significant increase in the frequency of days where precipitation exceeds 50 mm.
- The magnitude of maximum daily precipitation (Rx1day) is increasing at a rate consistent with Clausius-Clapeyron scaling relative to global temperature rise.
- While regional studies in Africa, Australia, and Asia indicate an intensification of sub-daily extreme rainfall, global confidence remains low due to sporadic data coverage.
- Increases in sub-daily heavy precipitation are directly linked to a higher frequency of pluvial floods in smaller watersheds.
- The use of 'apparent scaling' to predict future climate responses is limited because it conflates thermodynamic factors with unrelated synoptic weather states.
Often, sub-daily precipitation data have only sporadic spatial coverage and are of limited length.
Extreme Precipitation in Africa and Asia
- Africa shows a higher percentage of stations with significant increases in extreme daily precipitation compared to those showing decreases.
- Data limitations in Africa result in low confidence for continent-wide trends, as well-gauged areas cover only 15% of sub-Saharan Africa.
- Asia exhibits robust evidence of increased extreme precipitation since the 1950s, though these trends are marked by high spatial variability.
- In South East Asia, many regions report a paradoxical trend of increased rainfall intensity occurring alongside a reduced number of total wet days.
- Regional variations are significant, with increases noted in central and South Asia while some areas like the eastern Himalayas show decreases.
- Discrepancies in trends often arise from the use of different datasets, including gauge-based, remotely sensed, and reanalysis data.
With few exceptions, most South East Asian countries have experienced an increase in rainfall intensity, but with a reduced number of wet days.
Global Extreme Precipitation Trends
- Central India has experienced a significant decrease in moderate rainfall during the South Asian monsoon season.
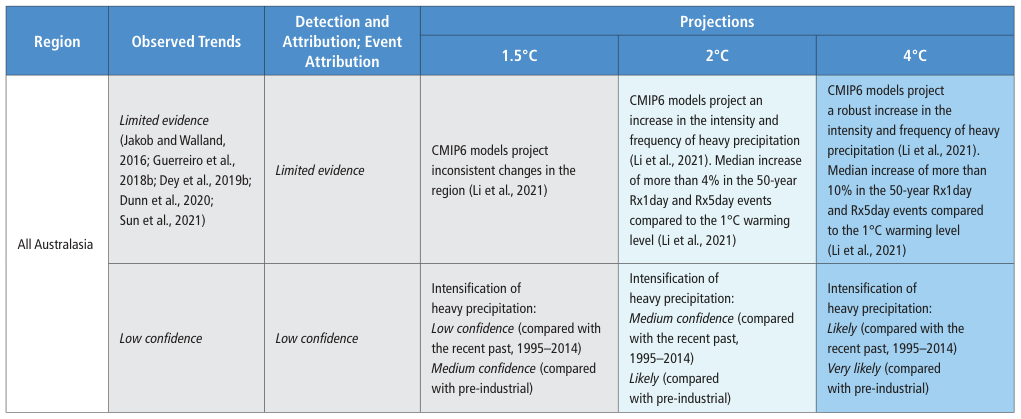
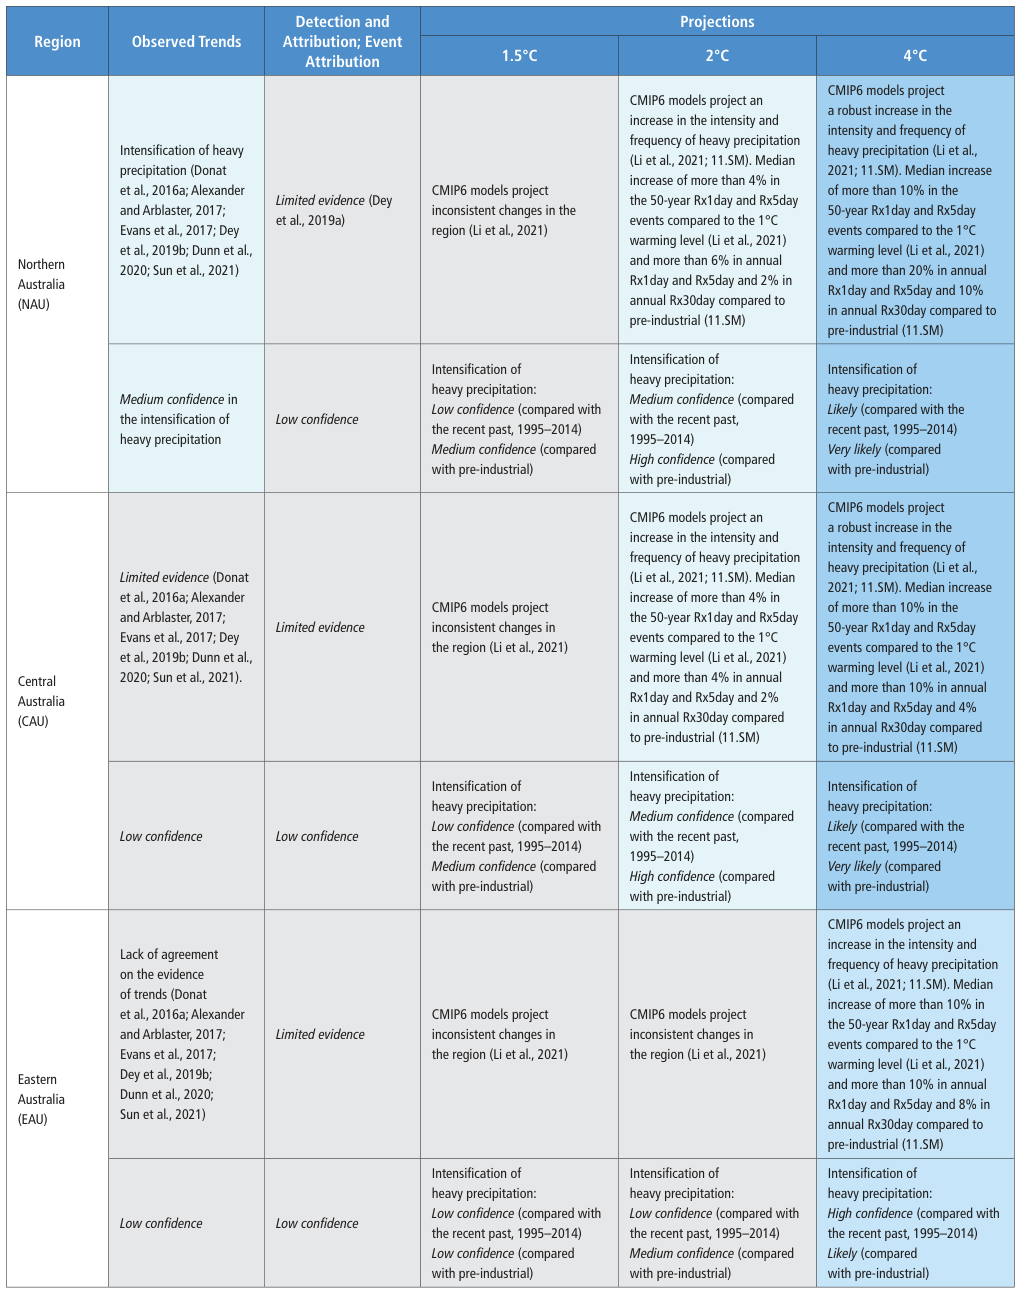
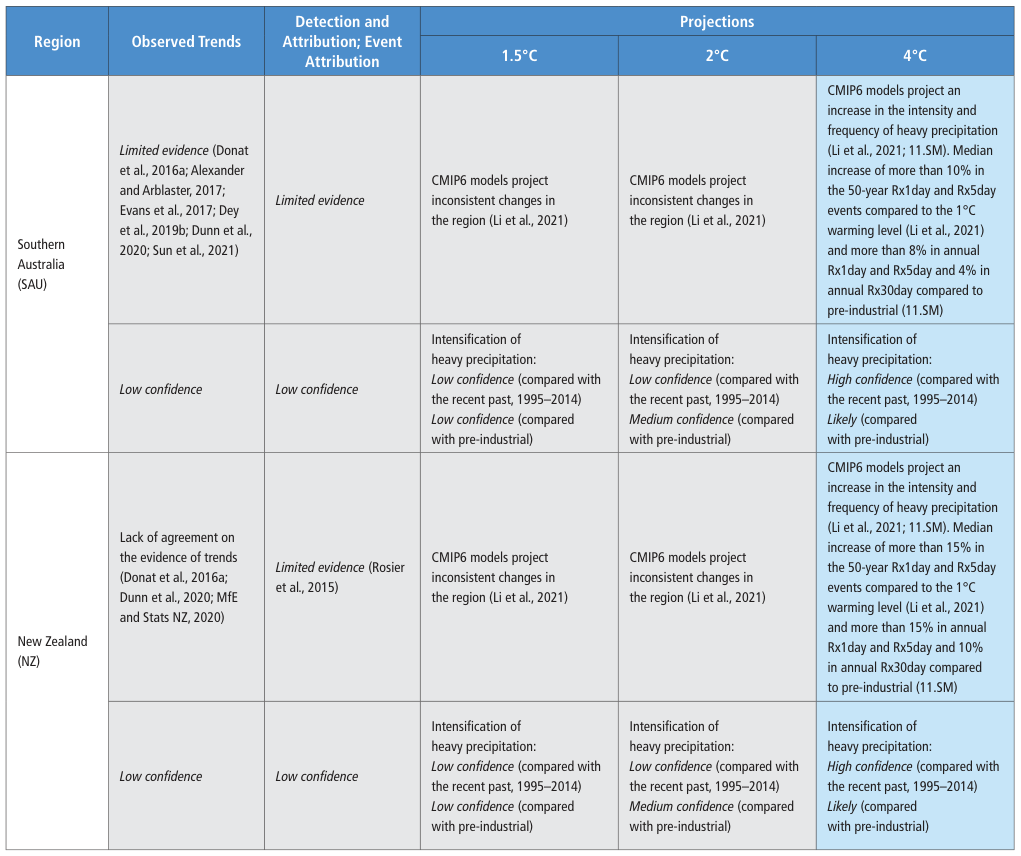
- Australasia shows a regional divide, with heavy precipitation increasing in the north-west but decreasing in eastern and southern regions.
- New Zealand exhibits low confidence in heavy rain trends, with a general decrease in moderate-heavy events but no significant change in very heavy events.
- South America shows high confidence in increasing extreme rainfall in the South-Eastern region and the Amazon, despite decreases in north-eastern Brazil.
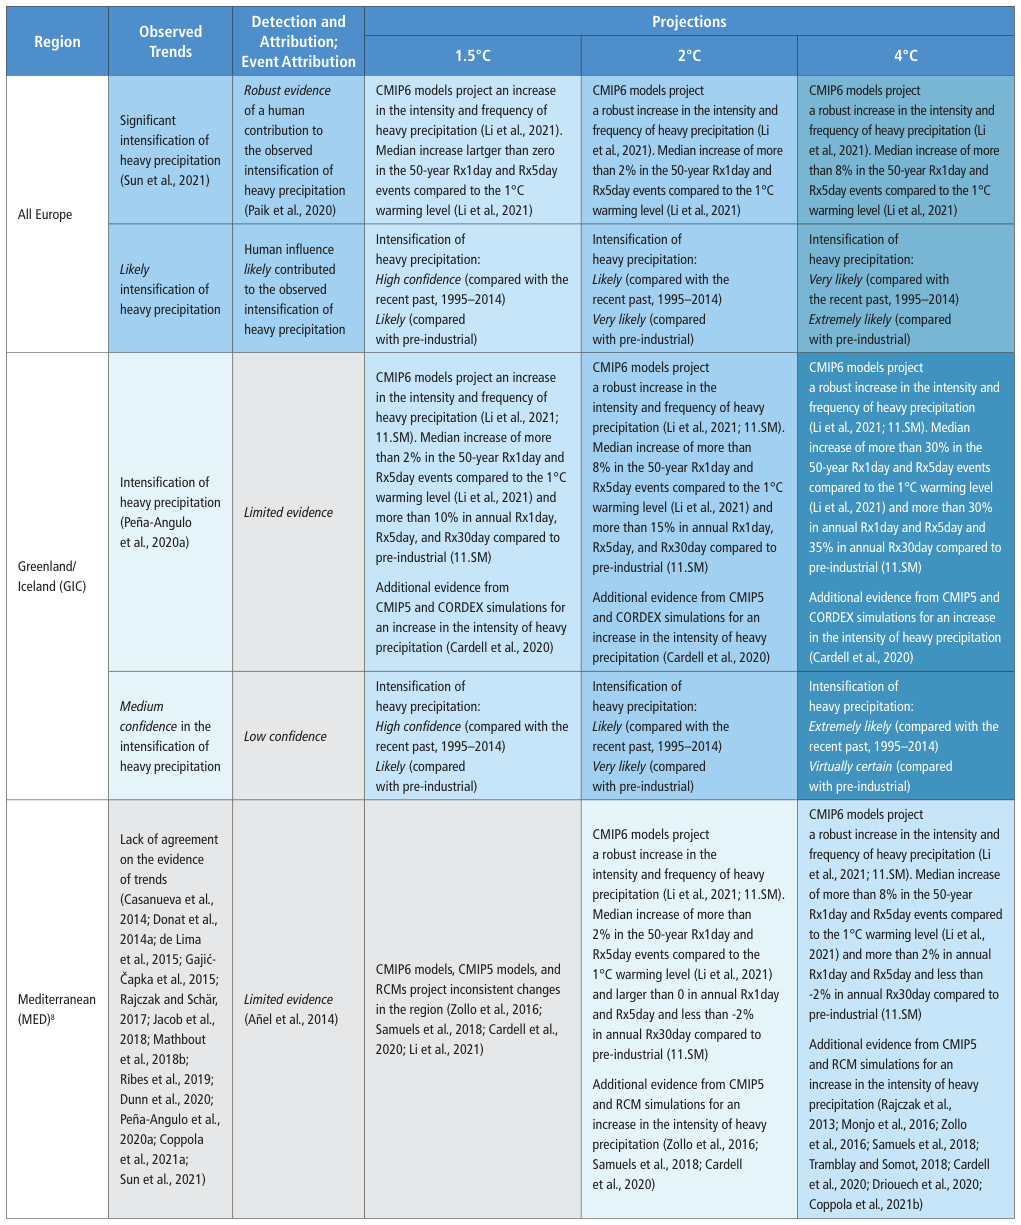
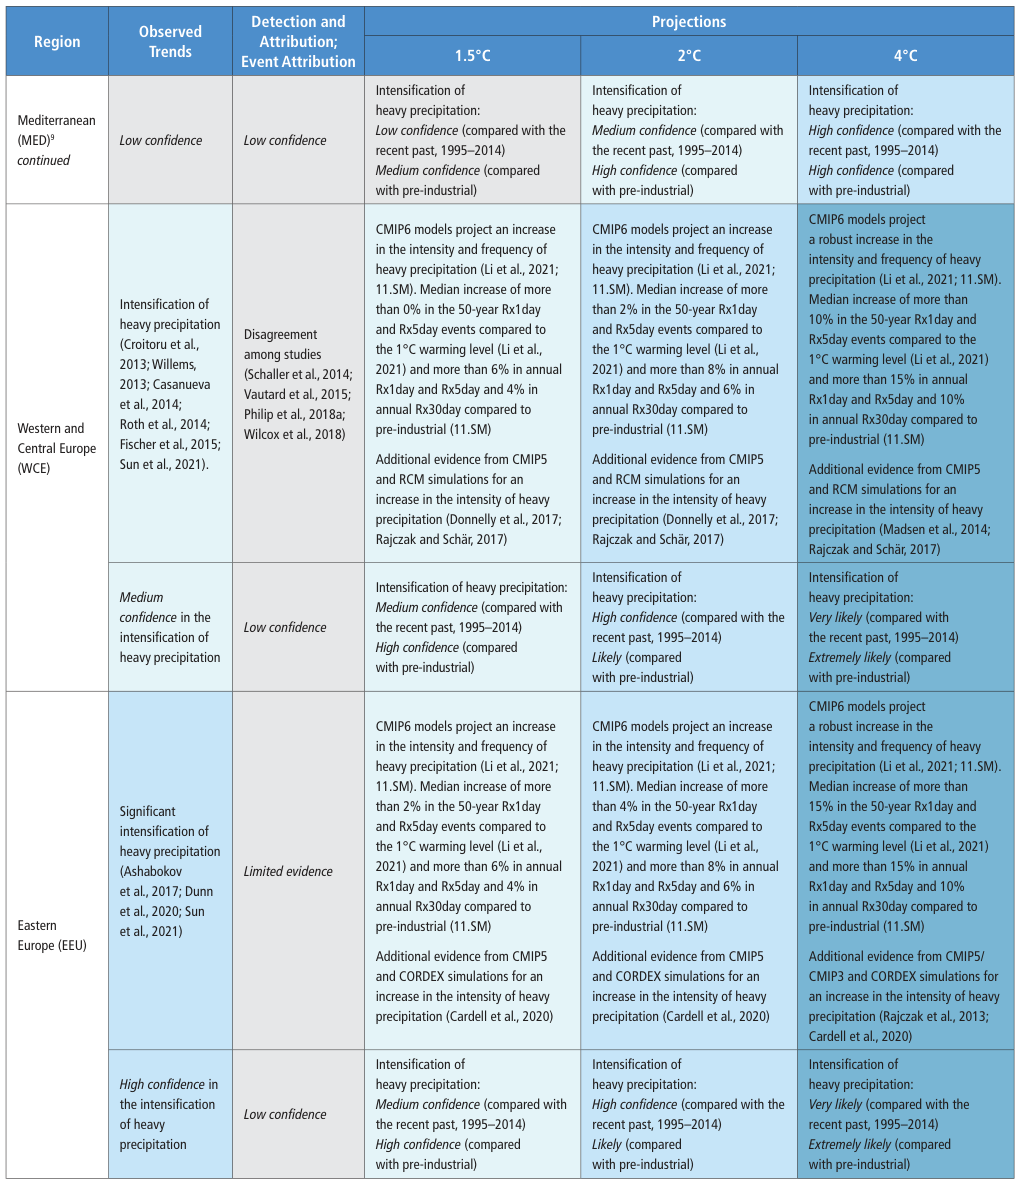
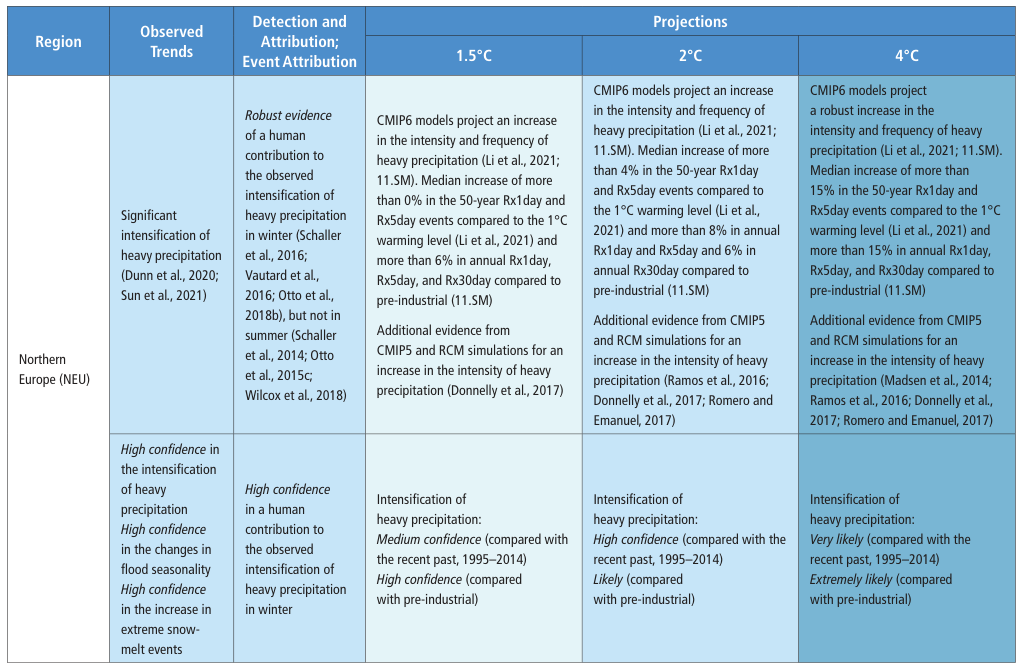
- Europe demonstrates robust evidence of a very likely increase in the magnitude and intensity of extreme precipitation since the 1950s.
- Global data reveals a complex mosaic of precipitation changes where regional variations often outweigh continent-wide trends.
Among all sub-regions, South-Eastern South America shows the highest rate of increase for rainfall extremes, followed by the Amazon.
Global Trends in Extreme Precipitation
- Extreme precipitation events have likely increased in frequency and intensity across most land regions with sufficient data coverage since 1950.
- In Europe, increases are most prominent in summer and winter, with the Netherlands seeing extreme rainfall double for every 1°C of warming.
- North America shows robust evidence of increased precipitation intensity, though regional variations exist, such as a lack of detectable trends in Canada.
- The Mediterranean region exhibits inconsistent spatial trends, with decreases in the west and increases in the east.
- Small Islands lack a cohesive global trend, with localized changes often influenced by tropical cyclones and ENSO cycles.
- Continental-scale increases are most clearly documented in North America, Europe, and Asia due to higher densities of observational data.
In the Netherlands, the total precipitation contributed from extremes higher than the 99th percentile doubles per 1°C increase in warming.
Evaluating Extreme Precipitation Models
- Analysis of 8,345 stations from 1950–2018 shows a higher percentage of significant positive trends in annual maximum daily precipitation than would be expected by chance.
- Evaluating climate models for heavy precipitation is difficult due to the spatial scale mismatch between point-based station observations and grid-based simulated areal means.
- The 'areal-reduction factor' can cause discrepancies as large as 130% when comparing station estimates to CMIP6 model resolutions.
- While reanalysis products offer spatial completeness for model comparison, they rely on similar parametrizations as the models, potentially biasing results.
- CMIP model generations show modest improvements in simulating extreme rainfall, largely attributed to increased horizontal resolution and better storm representation.
- Higher resolution alone is often insufficient for accuracy, as model parametrization remains a critical factor in simulating extreme events.
The areal-reduction factor, the ratio between pointwise station estimates of extreme precipitation and extremes of the areal mean, can be as large as 130% at CMIP6 resolutions.
Evaluating CMIP6 Precipitation Extremes
- CMIP6 models generally capture large-scale precipitation features but retain persistent biases, such as the double-ITCZ over the Pacific.
- Models successfully reproduce the observed trade-off where increases in extreme precipitation occur alongside decreases in non-extreme precipitation.
- CMIP6 models show a slight improvement over CMIP5, producing larger and more accurate extreme precipitation values due to higher spatial resolutions.
- Regional performance varies significantly, with models struggling to replicate specific patterns in areas like the north-east USA while performing better in summer months.
- Model biases are often consistent across different observational datasets, though simulated magnitudes are closer to areal-mean values than point estimates.
Additionally, CMIP5 models reproduced the relation between changes in extreme and non-extreme precipitation: an increase in extreme precipitation is at the cost of a decrease in non-extreme precipitation.
Modeling and Attributing Extreme Precipitation
- CMIP5 and CMIP6 models show high confidence and interchangeable performance in simulating large-scale spatial distributions of extreme precipitation.
- Regional Climate Models (RCMs) generally outperform Global Climate Models (GCMs) by better accounting for local topography and coastlines, though results vary by region.
- Convection-permitting models significantly improve the accuracy of daily and sub-daily precipitation distributions compared to standard parameterization methods.
- There is now robust evidence that human-induced greenhouse gas and aerosol forcing have contributed to the intensification of heavy precipitation at global and continental scales.
- Observed increases in extreme precipitation over the Northern Hemisphere land area are consistent with the Clausius-Clapeyron scaling relationship to warming.
Simulated extreme precipitation in the tropics also appears to be too large, indicating possible deficiencies in the parametrization of cumulus convection at this resolution.
Human Influence on Extreme Precipitation
- Anthropogenic forcing, primarily greenhouse gas emissions, is identified as the dominant driver of intensified global daily precipitation extremes.
- Climate models successfully replicate observed increases in heavy precipitation under human-induced forcing but fail to do so under natural forcing alone.
- Large-scale volcanic eruptions provide a rare example of natural forcing that temporarily reduces extreme precipitation through surface cooling and monsoon weakening.
- Human influence is now detectable at continental scales across North America, Eurasia, and mid-latitude regions, affecting both frequency and intensity.
- Regional attribution remains challenging and less robust due to a weak signal-to-noise ratio, though detection is expected to improve within two decades.
- Specific regional shifts, such as those in India and Australia, involve complex interactions between aerosols, land-use changes, and warming ocean temperatures.
A still weak signal-to-noise ratio seems to be the main cause for the lack of robustness, as detection would become robust 20 years in the future.
Anthropogenic Drivers of Extreme Precipitation
- Human-induced greenhouse gas emissions are the primary driver behind the intensification of heavy precipitation events globally.
- Extreme precipitation increases are often linked to both rising saturation vapor pressure and changes in large-scale atmospheric circulation.
- Some extreme rainfall events are increasing at rates exceeding the Clausius-Clapeyron rate of 7% per degree of warming.
- Attribution of human influence is most detectable in large-scale events, while smaller-scale events often lack a clear signal-to-noise ratio.
- Evidence of anthropogenic influence is strongest in North America, Europe, and Asia, where observational data is most abundant.
There are multiple cases indicating that very extreme precipitation may increase at a rate more than the C-C rate (7% per 1°C of warming).
Extreme Precipitation and Global Warming
- Recent climate models provide robust evidence that extreme precipitation increases proportionally with global mean temperature rise.
- The rate of increase for rare precipitation events is independent of the specific forcing agent, whether it be CO2, methane, or solar forcing.
- A small increment of 0.5°C in global warming is projected to cause a statistically significant increase in the intensity of extreme rainfall.
- The median scaling for 50-year extreme precipitation events over land is approximately 7% per 1°C of warming.
- While extreme precipitation increases across most land areas, decreases are primarily confined to subtropical ocean regions due to shifting storm tracks.
- Rare, long-period extreme events show larger relative increases in intensity compared to more frequent or moderate precipitation events.
A small increment such as 0.5°C in global warming can result in a significant increase in extreme precipitation.
Escalating Extreme Precipitation Projections
- Climate models project that the frequency of rare precipitation events increases nonlinearly with global warming, showing larger jumps for more extreme events.
- A 2.0°C warming level is projected to more than double the frequency of 100-year extreme precipitation events compared to a 1.5°C scenario.
- At a high warming level of 4°C, the frequency of 10-year and 50-year precipitation events is expected to approximately double and triple, respectively.
- While global climate models have limited ability to simulate hourly extremes, convection-permitting models consistently project increases in sub-daily precipitation intensity.
- Evidence suggests that extreme sub-daily precipitation will increase even in regions where some models previously projected a decrease in overall rainfall.
The CMIP5 model simulations show that the frequency for present-day climate 20-year extreme precipitation is projected to increase by 10% at the 1.5°C global warming level, and by 22% at the 2.0°C global warming level.
Global Warming and Precipitation Extremes
- Extreme precipitation is projected to increase across approximately 80% of Japanese stations under a 4°C warming scenario.
- In Africa, heavy rainfall is very likely to increase at higher warming levels, affecting the majority of land regions across the continent.
- Western South Africa is a notable exception where heavy rainfall is expected to decrease due to a reduction in westerly winds and cold fronts.
- Asia is projected to see increases in 10-year and 50-year extreme precipitation return values over 95% of its regions at 2°C warming.
- A mere half-degree difference between 1.5°C and 2.0°C warming levels results in a detectable and significant increase in extreme precipitation events.
- While most sub-regions show an upward trend in intensity, Northern Africa remains an area of low confidence due to conflicting model data.
A half-degree difference in warming between the 1.5°C and 2.0°C warming levels can result in a detectable increase in extreme precipitation over the region.
Projected Precipitation Extremes Globally
- Extreme daily precipitation is projected to intensify across South, Central, and Northern Asia, including a general wetting of the Tibetan Plateau and Himalayas.
- High-latitude regions such as Siberia and the Russian Far East show high confidence in projected increases of heavy precipitation across multiple climate models.
- In Australasia, extreme rainfall is expected to increase by 5% to 6% per degree of global warming, though dynamic atmospheric processes may offset these gains in some areas.
- Confidence in precipitation increases for Australasia remains low at 1.5°C of warming but becomes likely at 3°C or higher.
- Central and South America are expected to see extreme precipitation increases that scale with global surface temperature, regardless of the specific emission scenario.
- Regional variations remain significant, with some areas like the Pacific coasts of El Salvador and Guatemala potentially seeing decreases in extreme rainfall.
Yet, there is large uncertainty in the increase because projected changes in dynamic processes lead to a decrease in Rx1day that can offset the thermodynamic increase over a large portion of the region.
Global Extreme Precipitation Projections
- Extreme precipitation is projected to increase across South-Eastern South America and the La Plata basin, though CMIP6 models show mixed results for other sub-regions.
- In Europe, the frequency of the most intense precipitation events is projected to nearly double for every 1°C of additional global warming.
- Regional disparities in Europe suggest strong increases in the north and the Alps, while the southern Mediterranean may see decreases or no change.
- North America is very likely to experience increased intensity and frequency of extreme rainfall at higher warming levels, though projections for Mexico remain uncertain.
- At a 4°C global warming level, it is virtually certain that rare heavy precipitation events will become more frequent and intense on a global scale.
- The intensification of heavy precipitation globally is expected to scale with the increase in maximum atmospheric moisture content.
The most intense precipitation events observed today in Europe are projected to almost double in occurrence for each 1°C of further global warming.
Extreme Precipitation and Flood Dynamics
- Atmospheric moisture capacity increases by approximately 7% for every 1°C of global warming, driving more intense precipitation.
- The frequency of rare heavy precipitation events grows non-linearly, with 50-year events expected to triple at 4°C of warming.
- Regional variations in extreme precipitation are influenced by local warming rates, atmospheric circulation, and storm dynamics.
- Floods are categorized into multiple types, including pluvial, flash, and river floods, each driven by distinct physical processes.
- River flood risk is a complex interplay of precipitation intensity, antecedent soil moisture, and snowmelt in colder regions.
- Pluvial and urban floods are directly linked to extreme precipitation exceeding the capacity of natural and artificial drainage systems.
The increase in the frequency of heavy precipitation events will be non-linear with more warming and will be higher for rarer events (high confidence), with 10- and 50-year events to be approximately double and triple, respectively, at the 4°C warming level.
Drivers of River and Flash Flooding
- River flooding is influenced by a complex interplay of stream morphology, land use, and feedbacks between climate, soil, and vegetation.
- Water management and engineering have increased flood resilience in some regions, often masking the impact of increased extreme precipitation.
- In snow-covered regions, the response of floods to warming is uncertain due to the competing effects of increased precipitation and reduced snow accumulation time.
- Rising atmospheric CO2 levels may increase flood magnitude by improving plant water-use efficiency and maintaining higher soil moisture levels.
- Flash floods, particularly in urban areas, are driven by intense rainfall and impervious surfaces, making extreme precipitation a primary proxy for flood risk.
- The direct connection between extreme precipitation and urban flooding is mediated by the design and capacity of drainage systems.
Water regulation and management have, in general, increased resilience to flooding, masking effects of an increase in extreme precipitation on flood probability in some regions.
Global Flood Trends and Variability
- Extreme precipitation does not always result in a flood event because flooding is influenced by multiple complex environmental factors beyond rainfall alone.
- Global assessments show low confidence in uniform trends for flood magnitude or frequency, with significant regional heterogeneity across different continents.
- There is a notable contrast between the global intensification of short-duration extreme precipitation and the lack of a consistent global increase in peak river flows.
- Data collection is hampered by uneven spatial coverage of streamflow gauges, particularly in Africa, South America, and parts of Asia, making global synthesis difficult.
- In cold regions where snowmelt dominates, warming temperatures have significantly altered the seasonality of peak flows and flood timing.
- Regional trends vary sharply, with observed increases in north-western Europe and the Amazon, while decreases dominate in Africa, Australia, and southern Europe.
This is in direct contrast to the global and continental scale intensification of short-duration extreme precipitation.
Uncertainties in Flood Modeling
- Global peak flow trends show significant regional variation, with increases in the Amazon and Northeast USA but decreases in Australia and the Mediterranean.
- Hydrological models face structural diversity and require extensive calibration of sub-grid processes, leading to inherent reliability issues.
- Regional models generally simulate moderate flows well but exhibit large biases when attempting to predict the most extreme flood events.
- Global-scale models struggle significantly with reproducing the actual magnitude of flood hazards compared to regional counterparts.
- Future flood projections are complicated by cascading uncertainties from emission scenarios, climate model inputs, and downscaling techniques.
- Attribution of long-term flood changes remains difficult, with most current research focusing on specific flash flood or urban flood events.
Regional models reproduce moderate and high flows reasonably well, but there are large biases for the most extreme flows, independent of the climatic and physiographic characteristics of the basins.
Attributing Floods to Human Influence
- Anthropogenic influence on flood intensity varies significantly by region, with some areas seeing increases and others decreases.
- Attributing flood events to climate change is complex because precipitation is only one of many drivers, alongside land-cover change and river management.
- While specific events like UK winter flooding have been linked to human activity with high confidence, global trends remain difficult to verify.
- Global hydrological models only reproduce observed spatial patterns of river flow when anthropogenic climate change is included in the simulations.
- There is currently low confidence in general statements regarding human influence on global flood changes due to limited studies and modeling uncertainties.
- Future projections suggest flood hazards will increase across roughly half the globe, particularly in tropical Africa and parts of Asia and South America.
Attributing changes in heavy precipitation to anthropogenic activities cannot be readily translated to attributing changes in floods to human activities, because precipitation is only one of the multiple factors, albeit an important one, that affect floods.
Global Flood Risk Projections
- Global warming levels of 1.5°C and above are projected to increase the fraction of land area affected by flood hazards due to heavier precipitation.
- Current hydrological models often fail to account for critical human factors such as flood prevention measures, control policies, and land cover changes.
- Projections indicate a significant increase in flood frequency across all continents except Europe as global temperatures rise.
- Regional flood trends vary significantly, with high confidence in increases for Southeast Asia and India, but decreases for the Mediterranean and Central Europe.
- There is medium confidence in global flood trends but low confidence in specific regional projections due to the complexity of hydrological processes.
- River flood projections are generally more uncertain than pluvial flood projections because they involve complex human water management and land use variables.
These results suggest medium confidence in flood trends at the global scale, but low confidence in projected regional changes.
Classifying and Driving Drought Types
- Drought is categorized into four main types—meteorological, agricultural, ecological, and hydrological—based on the specific system impacted.
- The phenomenon lacks a single universal definition because it can propagate across different Earth sub-domains either simultaneously or asynchronously.
- Drought timescales vary drastically, ranging from rapid-onset 'flash droughts' lasting weeks to decadal 'megadroughts.'
- Drought assessment relies on various indices that measure anomalies in variables like precipitation, soil moisture, and atmospheric evaporative demand.
- Thermodynamic processes, such as heat and moisture exchanges, are the primary drivers of drought changes in a warming climate with high confidence.
- While atmospheric dynamics dominate precipitation deficits, there is low confidence in how greenhouse gas forcing affects these dynamic processes.
The distinction of drought types is not absolute, as drought can affect different sub-domains of the Earth system concomitantly, but sometimes also asynchronously, including propagation from one drought type to another.
Mechanisms of Precipitation and Evaporation
- Precipitation deficits are driven by a complex interplay of synoptic processes, large-scale circulation patterns, and global ocean-atmosphere oscillations like ENSO and IPO.
- Land-atmosphere feedbacks are confirmed to play a dominant role in regional precipitation deficits, though the sign and locality of these feedbacks vary.
- Earth system models (ESMs) currently struggle with substantial uncertainties and variations in representing soil-moisture–precipitation feedbacks.
- Atmospheric evaporative demand (AED) represents the maximum potential evapotranspiration from a surface, distinct from actual evapotranspiration which is limited by water availability.
- AED is influenced by a combination of solar radiation, wind speed, and vapor pressure deficit, making temperature-only estimation methods unreliable.
- In arid regions, AED and actual evapotranspiration are often decoupled, with AED being highest where actual moisture loss is lowest due to soil limitations.
In general, AED is highest in regions where ET is lowest (e.g., desert areas), further illustrating the decoupling between the two variables under limited soil moisture.
Atmospheric Demand and Drought Feedbacks
- Increased atmospheric evaporative demand (AED) exacerbates plant stress and drought severity by impacting leaf physiology and xylem safety margins.
- Prolonged high vapor pressure deficit (VPD) can lead to plant mortality through carbon starvation and decreased hydraulic conductance.
- Thermodynamic processes under climate change dominate AED increases, as land warms faster than oceans, preventing moisture levels from keeping pace with saturation pressure.
- Soil moisture deficits create self-intensifying feedback loops where reduced evapotranspiration leads to further atmospheric dryness and potential flash droughts.
- Vegetation plays a complex role in modulating these processes by accessing deep water stores and altering surface albedo.
- AED directly impacts hydrological drought by increasing evaporation from surface waters and raising water consumption in irrigated lands.
In addition, soil moisture plays a role in drought self-intensification under dry conditions in which ET is decreased and leads to higher AED, an effect that can also contribute to triggering flash droughts.
Soil Moisture and Hydrological Deficits
- Soil moisture is the primary regulator of plant water uptake and xylem hydraulic conductance, making it a critical factor in ecosystem health.
- Deficits in soil moisture are the leading cause of xylem embolism and carbon starvation, which are the primary drivers of plant mortality.
- In sub-humid and semi-arid regions, soil moisture levels are more significant than atmospheric evaporative demand in determining vegetation stress.
- Earth System Models (ESMs) distinguish between surface and total column soil moisture, though surface projections may overestimate the drying impact on deep-rooted vegetation.
- The propagation of meteorological droughts into streamflow and groundwater is influenced by complex physiographic characteristics and human activities like damming.
- Climate warming alters snowpack levels and melt timing, which shifts the seasonality and magnitude of low-flow events in many hydrological systems.
For this reason, soil moisture deficits are the main driver of xylem embolism, the primary cause of plant mortality.
Drought Indices and Climate Drivers
- Atmospheric-based indices like PDSI and SPEI rely on precipitation and atmospheric evaporative demand (AED) rather than direct soil moisture measurements.
- In humid regions, these indices reflect the actual water balance, whereas in dry regions they represent an upper bound for water-balance deficits.
- The assessment prioritizes Penman-Monteith-based calculations (SPEI-PM and PDSI-PM) to ensure more accurate temperature-based evaporative estimates.
- Drought is categorized into three distinct types: meteorological (precipitation-based), agricultural/ecological (soil moisture-based), and hydrological (streamflow-based).
- Thermodynamic processes are identified with high confidence as the primary driver of drought changes under human-induced climate change.
- Historical evidence of drought trends remains regionally variable, with some areas like southern Europe seeing intensification while others show decreases.
Drought events are the result of dynamic and/or thermodynamic processes, with thermodynamic processes being the main driver of drought changes under human-induced climate change (high confidence).
Global Drought and Evaporation Trends
- Recent decades have seen severe precipitation deficits across diverse global regions, including the Amazon, southwestern China, and the Great Horn of Africa.
- While global studies show no uniform trend in precipitation-based drought frequency, specific regions in Africa and South America exhibit significant long-term drying.
- Some areas, such as Northern Australia and Northern Europe, have actually experienced a decrease in meteorological drought frequency.
- Atmospheric Evaporative Demand (AED) is intensifying drought events by increasing vegetation stress and depleting soil moisture.
- Global temperature increases and declining relative humidity have led to a worldwide rise in Vapor Pressure Deficit (VPD).
- Pan evaporation trends vary significantly by region, increasing in East Asia and Europe while decreasing in parts of North America and the Tibetan Plateau.
In several regions, AED increases have intensified recent drought events, enhanced vegetation stress, or contributed to the depletion of soil moisture or runoff through enhanced ET.
Global Trends in Soil Moisture
- Atmospheric Evaporative Demand (AED) shows significant regional diversity, increasing in the Mediterranean and New Zealand while decreasing in South Asia.
- Vapor Pressure Deficit (VPD) is the dominant driver of AED trends, often outweighing the compensatory effects of reduced wind speeds or solar dimming.
- Long-term ground observations of soil moisture are scarce, forcing researchers to rely on microwave-based satellite data and hydrological models.
- Satellite data provides only medium confidence for trend analysis due to data inhomogeneities and the fact that sensors only measure surface rather than root-zone moisture.
- Global evidence indicates that soil moisture drying is occurring across both arid and humid regions, with notable increases in East Asia and Europe.
- Despite global drying trends, some regions like Eastern and Central North America show no significant long-term trends in soil moisture deficits.
Drying has not only occurred in dry regions but also in humid regions.
Global Hydrological Drought Trends
- Drought trends are increasingly driven by higher evapotranspiration (ET) and atmospheric evaporative demand (AED) rather than just precipitation deficits.
- Hydrological drought intensification is observed with high confidence in the Mediterranean, East Asia, and southern Africa.
- Northern and Central Europe show no significant evidence of increased hydrological drought severity since 1950 based on streamflow records.
- North American data remains inconsistent, with studies showing both increases and decreases in drought frequency depending on the methodology used.
- Groundwater droughts are showing increased frequency and severity linked to global warming and enhanced evapotranspiration.
- Atmospheric-based indices like SPEI-PM indicate more severe drying trends than precipitation-only indices in Africa and East Asia.
In the Mediterranean region, there is high confidence in hydrological drought intensification.
Global Trends in Drought Severity
- Drought severity is increasingly driven by atmospheric evaporative demand (AED) rather than just precipitation deficits.
- Agricultural and ecological droughts are showing stronger increasing trends across all continents compared to meteorological droughts.
- Increased evapotranspiration is exacerbating soil moisture loss, plant water stress, and the frequency of severe forest fires.
- Regional data indicates high confidence in increased water stress during dry seasons due to rising global temperatures.
- While some regions show decreasing drought trends, the majority of observed changes point toward more frequent and intense drying episodes.
- Hydrological drought trends remain more difficult to assess at a regional scale due to limited historical datasets.
There are stronger signals indicating observed increases in agricultural and ecological drought, which highlights the role of increased ET, driven by increased AED, for these trends.
Climate Model Evaluation Challenges
- Earth System Models (ESMs) exhibit limited performance and significant variability in identifying precipitation deficits and long-term drought trends.
- While CMIP6 models show improved performance in specific regions like East Asia and Southern South America, evidence remains insufficient to fully distinguish them from CMIP5.
- Models frequently underestimate the severity of precipitation deficits and the frequency of dry days, likely due to errors in simulating persistent weather patterns.
- Atmospheric Evaporative Demand (AED) simulations capture seasonal cycles but diverge significantly in magnitude and often underestimate atmospheric drying trends.
- Soil moisture deficit modeling is particularly uncertain due to complex hydrological processes and a critical lack of global observational data.
- Model spread and uncertainty are notably higher in regions where enhanced drought conditions are projected under high-emissions scenarios.
ESMs are generally found to underestimate the severity of precipitation deficits and the dry day frequencies in comparison to observations.
Modeling Soil Moisture Dynamics
- Climate and hydrological models require high resolution to accurately capture land-atmosphere feedbacks and topographic effects.
- There is significant disagreement between models regarding interannual soil moisture variability and seasonal skill across different regions.
- Regional climate models in Europe often exhibit excessive early summer drying, leading to overestimated drought severity.
- CMIP5 models frequently overestimate annual evapotranspiration while underestimating it during boreal summers, indicating a bias in soil-moisture-temperature coupling.
- Model spread is the primary source of uncertainty in future soil moisture projections, outweighing internal variability and scenario differences.
- While CMIP6 shows some improvements in modeling long-term trends, substantial biases in land carbon uptake sensitivity to soil moisture persist.
These models display overly strong drying in early summer, resulting in an excessive decrease of latent heat fluxes, with potential implications for more severe droughts in dry environments.
Modeling Hydrological and Atmospheric Droughts
- Earth System Models (ESMs) struggle to simulate streamflow and groundwater directly, often relying on stand-alone hydrological models that are overly responsive to climate forcing.
- Hydrological models frequently fail to capture low flows accurately, leading to an overestimation of drought frequency and an underestimation of drought duration.
- Atmospheric-based drought indices derived from ESMs suffer from biases in precipitation and atmospheric evaporative demand, resulting in low spatial agreement with observed trends.
- Model uncertainty at the catchment scale is often higher than the uncertainty introduced by Global Climate Models or downscaling techniques.
- Despite significant inter-model spread and regional biases, there is medium confidence in using multi-model ensembles to assess future drought projections.
- The lack of observational data for soil moisture and streamflow in many regions complicates the evaluation and validation of drought simulation models.
Simulations of hydrological drought metrics show uncertainties related to the contribution of both GCMs and hydrological models, but hydrological models forced by the same climate input data also show a large spread.
Attributing Global Precipitation Deficits
- Only two global regions show medium confidence in human-induced climate change affecting meteorological droughts: South-Western South America (increase) and Northern Europe (decrease).
- In the Mediterranean, conflicting studies and high internal variability lead to low confidence in attributing long-term precipitation trends to human influence.
- North America and Africa generally show low confidence in the attribution of long-term meteorological drought trends, despite complex regional signals.
- While long-term trends are difficult to attribute, human influence has been identified in specific sub-regional events, such as the 2015–2017 drought in Cape Town.
- Attribution studies for single events often yield mixed results depending on the models and methods used, as seen in the 2015 Central European drought analysis.
There is evidence of substantial internal variability in long-term precipitation trends in the region, which limits the attribution of human influence on variability and trends of meteorological droughts from observational records.
Attribution of Global Drought Events
- Scientific studies show mixed results when attributing specific meteorological droughts to human-induced climate change across different continents.
- While some events like the 2011 East African rain failure are linked to anthropogenic warming, others in California and South America are primarily driven by natural variability.
- The 2015 El Niño and rising sea surface temperatures remain dominant factors in many recent African and Asian drought cycles.
- Methodological inconsistencies between different climate models and data sources create significant uncertainty in drought attribution results.
- Long-term soil moisture deficits in the Northern Hemisphere since 1951 are increasingly attributed to anthropogenic forcing rather than natural cycles.
- Global-scale drying tendencies in the land surface are only reproducible in models that include human-induced climate influences.
Their results showed a disagreement in the original anthropogenic attribution in a number of precipitation deficit events, which increased uncertainty in the attribution of meteorological droughts events.
Anthropogenic Drivers of Global Drought
- Human-induced climate change is a primary driver of soil moisture deficits, largely through increased evapotranspiration and vapor pressure deficits.
- Global hydrological models indicate that anthropogenic radiative forcing plays a more dominant role in river flow trends than land use or water management.
- Regional studies in North America, China, and Ethiopia confirm that climate trends outweigh human water management in explaining hydrological droughts.
- In specific regions like the Mediterranean and central USA, human water consumption may intensify drought magnitude by as much as 20–40%.
- Atmospheric-based drought indices show an attributable anthropogenic signal linked to the increased frequency and severity of extreme drought events.
- Anthropogenic influence on soil moisture was a critical factor in the propagation of widespread megafires in Australia during 2019.
A global study with a single hydrological model estimated that human water consumption has intensified the magnitude of hydrological droughts by 20–40% over the last 50 years.
Human Influence on Global Drought
- Anthropogenic greenhouse gas forcing has been identified as a significant contributor to global aridification trends since the early 20th century.
- Increased atmospheric evaporative demand (AED), driven by rising temperatures and decreased humidity, is the primary mechanism for human-induced drought intensification.
- While regional trends in meteorological droughts often show low confidence for human attribution, specific extreme events in California, Europe, and Asia have been directly linked to human forcing.
- There is medium confidence that human-induced climate change has expanded the total land area affected by agricultural and ecological droughts during dry seasons.
- In regions like the Mediterranean, hydrological droughts are influenced by a complex mix of climate change, water management, and land-use practices.
Several meteorological and agricultural and ecological drought events have been attributed to human-induced climate change, even in regions where no long-term changes are detected.
Global Drought Projections
- Future drought severity is projected to increase in regions including southern Europe, Central America, and southern Africa, though inter-model spread remains a factor.
- Uncertainties in drought modeling are influenced by plant physiological responses to rising CO2 and soil-moisture–atmosphere feedbacks.
- There is high confidence that drought frequency and intensity will increase as a direct function of global warming levels, specifically at 1.5°C, 2°C, and 4°C increments.
- CMIP6 projections generally indicate a stronger increase in the probability of precipitation deficits compared to earlier CMIP5 models.
- While mean precipitation patterns align with projected drought duration, they do not consistently correlate with changes in drought intensity.
- A significant increase in the length of dry spells is projected for most of the African continent under a 4°C global warming scenario.
There are also substantial increases in drought hazard probability from 1.5°C to 2°C global warming and for further additional increments of global warming (high confidence).
Global Meteorological Drought Projections
- West and Southern Africa are projected to face significant precipitation reductions and increased consecutive dry days (CDD) as global warming reaches 4°C.
- The Mediterranean region is expected to experience substantial increases in meteorological drought intensity and duration even at a 1.5°C warming threshold.
- South East Asia faces a unique risk of increased precipitation deficits driven by a higher frequency of extreme El Niño events.
- The Amazon exhibits a geographic divide in climate trends, with projected increases in dryness in the east contrasting with opposite trends in the west.
- North America, particularly California and the southern regions, is projected to see increased precipitation variability and more frequent consecutive drought periods.
- While Europe shows a consistent drying trend in the south, Western and Central European projections vary between extreme drying and negligible trends.
In California, more precipitation variability is projected, characterized by increased frequency of consecutive drought and humid periods.
Global Warming and Drought Expansion
- Meteorological droughts are projected to increase in frequency and severity across multiple global regions as warming reaches 1.5°C, 2°C, and 4°C.
- Atmospheric Evaporative Demand (AED) is expected to rise globally, primarily driven by increases in Vapor Pressure Deficit (VPD).
- The role of CO2 in mitigating drought is debated, as higher concentrations may improve plant water-use efficiency but cannot fully offset warming-induced demand.
- Plant physiological benefits from CO2 are likely minimal during actual dry periods because stomata close in response to limited soil moisture.
- Soil moisture deficits and direct evaporation from water bodies remain critical factors that CO2-induced plant resistance cannot mitigate.
- There is low confidence regarding whether CO2-induced vegetation changes will significantly reduce the severity of future soil moisture and streamflow deficits.
The benefits of the atmospheric CO2 for plant stress and agricultural and ecological droughts would be minimal precisely during dry periods given stomatal closure in response to limited soil moisture.
Soil Moisture and Atmospheric Demand
- Increased atmospheric evaporative demand (AED) is driven by both global warming and CO2 physiological effects on plant stomata.
- Soil moisture deficits are projected to be more widespread than precipitation deficits due to enhanced evaporation and transpiration.
- Surface soil moisture is expected to decrease more significantly than total soil moisture or precipitation at all warming levels.
- Major regions facing severe soil moisture deficits include the Mediterranean, southern Africa, and the south-western USA.
- Significant increases in drought intensity are detectable in specific regions even with a global warming increase as small as 0.5°C.
Increased AED is thus both a driver and a feedback with respect to changes in ET, complicating the interpretation of its role on drought changes.
Global Warming and Drought Projections
- Climate models project significant increases in both the intensity and frequency of agricultural and ecological droughts as global warming levels rise from 1.5°C to 4°C.
- Drought frequency is expected to increase worldwide during the boreal summer, driven largely by increased evapotranspiration and atmospheric evaporative demand.
- Increased soil moisture limitation is projected to cause higher vegetation stress, which may reduce the efficiency of the global land carbon sink.
- While some global averages suggest wetting tendencies in runoff, regional projections indicate a sharp increase in hydrological droughts during low-runoff periods.
- There is high confidence that higher-emission scenarios (above 4°C) will severely impair the land's ability to absorb carbon due to drought conditions.
This stresses the dominant influence of ET (as a result of increased AED) in intensifying agricultural and ecological droughts in the warm season in many locations, including mid- to high latitudes.
Global Hydrological Drought Projections
- Hydrological deficits are projected to increase across most continents, with medium confidence in specific regions including the Mediterranean, Western North America, and Southern Africa.
- Human activities such as water demand and land cover changes may account for over 50% of projected hydrological drought changes in certain areas.
- Mountainous regions face severe risks as warming reduces snowpack reservoirs, with projected snow water equivalent losses reaching 70% at 4°C of global warming.
- Atmospheric-based drought indices often predict more intense drying than Earth System Models, partly due to complex physiological CO2 effects on plants.
- Discrepancies between drought metrics arise because atmospheric indices reflect potential vegetation stress rather than direct soil moisture or runoff levels.
In western USA, a 22% reduction in winter snow water equivalent is projected at around 2°C of global warming, with a further decrease of a 70% reduction at 4°C global warming.
Escalating Global Drought Risks
- Human-forced atmospheric evaporative demand is significantly increasing plant water stress, leading to widespread forest dieback and higher risks of megafires.
- Atmospheric-based drought indices like PDSI-PM and SPEI-PM project more severe agricultural and ecological droughts across North America, Europe, Africa, and Australia.
- Even if global warming is stabilized at 2°C, high-confidence projections indicate severe drought impacts for regions including the Mediterranean and Southern Africa.
- At a 4°C warming threshold, the spatial extent of drought expands drastically, affecting nearly every major continental region with increased intensity and frequency.
- While agricultural and ecological droughts show the most widespread increases, meteorological and hydrological droughts are also projected to intensify in specific vulnerable zones.
The enhanced AED associated with human forcing would increase plant water stress, with effects on widespread forest dieback and mortality, and stronger risk of megafires.
Global Warming and Drought Projections
- Incremental increases in global warming as small as 0.5°C are projected to cause measurable worsening of droughts in specific regions.
- Agricultural and ecological droughts will expand significantly at 2°C and 4°C warming levels, affecting nearly every major land region.
- While elevated CO2 can improve plant water-use efficiency, it is unlikely to offset the severe impacts of increased atmospheric evaporative demand.
- The global land carbon sink is expected to become less efficient as soil moisture limitations and vegetation stress increase under high-emission scenarios.
- Meteorological and hydrological droughts are also projected to intensify, though their patterns differ from agricultural drought trends.
- Quantifying climate change impacts on extreme storms remains difficult due to high stochastic variability and modeling constraints for small-scale processes.
There is high confidence that the global land carbon sink will become less efficient due to soil moisture limitations and associated drought conditions.
Projected Trends in Extreme Storms
- Global warming is expected to increase the intensity and heavy rainfall associated with tropical cyclones (TCs) in both hemispheres.
- While the overall frequency of tropical cyclones may decrease or stay the same, the frequency of the most intense storms is likely to increase in specific ocean basins.
- Mid-latitude cyclones are projected to shift poleward with a reduced frequency due to anthropogenic climate change.
- Confidence remains low regarding long-term trends and future projections for small-scale weather phenomena like tornadoes and hail storms.
- Recent assessments indicate a 'virtually certain' increase in North Atlantic tropical cyclone activity since the 1970s, partly attributed to aerosol forcing.
- Soil moisture projections suggest that conditions once considered 1-in-6-year droughts could become the norm as global temperatures rise.
A projected reduction in mean soil moisture by one standard deviation corresponds to soil moisture conditions typical of about 1-in-6-year droughts during 1850–1900 becoming the norm in the future.
Climate Change and Tropical Cyclones
- Anthropogenic forcing has likely contributed to detectable shifts in tropical cyclone migration patterns in the western North Pacific.
- Higher global warming levels, specifically 2°C versus 1.5°C, are projected to result in significantly heavier precipitation associated with tropical cyclones.
- The detection of human-induced effects on cyclones is complicated by a wide range of natural variability, including the El Niño–Southern Oscillation and the widening of the Hadley cell.
- Aerosol forcing and sea surface temperature patterns are identified as key drivers that influence cyclone activity and cloud microphysics.
- Historical 'best-track' data for cyclones suffer from technological inconsistencies, leading to low confidence in long-term frequency and intensity trends.
- Recent satellite-era data from the past 40 years show positive trends in cyclone intensity, even when data is homogenized to account for historical biases.
This broad range of natural variability makes detection of anthropogenic effects difficult, and uncertainties in the projected changes of these modes of variability increase uncertainty in the projected changes in TC activity.
Global Tropical Cyclone Trends
- Homogenized data from 1979–2017 indicates a significant global increase in the probability of major tropical cyclones by approximately 6% per decade.
- There is evidence that intensification rates and the frequency of rapid intensification events have increased during the satellite era.
- While USA landfall frequency shows no long-term trend since 1900, there is a noted decrease in storm translation speeds and an increase in normalized damage.
- Regional variations are prominent, with decreasing landfall trends in Australia and a north-westward shift in western North Pacific storm tracks.
- The North and South Indian Oceans show a consistent increase in the occurrence of the most intense cyclones despite an overall decrease in total frequency.
- A global poleward migration of the latitude where cyclones reach peak intensity has been identified, potentially linked to the expansion of the tropics.
The first metric – the mean latitude where TCs reach their peak intensity – exhibits a global and regional poleward migration during the satellite period.
Shifting Tropical Cyclone Dynamics
- Tropical cyclones are exhibiting a documented poleward migration, particularly in the western North Pacific basin.
- The locations where cyclones reach peak intensity and develop eyes are shifting away from the equator.
- Global data indicates a slowdown in cyclone translation speed, which increases the duration of local hazards.
- Slower-moving storms are directly linked to higher local rainfall amounts and increased structural wind damage.
- Scientific debate continues regarding whether these trends are driven by climate change or data heterogeneity in historical records.
- Projections suggest an increase in the proportion of intense storms and higher precipitation rates despite stable or decreasing total frequency.
TC translation speed is a measure of the speed at which TCs move across the Earth’s surface, and is very closely related to local rainfall amounts (i.e., a slower translation speed causes greater local rainfall).
Slowing Cyclones and Model Accuracy
- Evidence suggests tropical cyclone (TC) translation speeds have decreased by 17% over the contiguous USA between 1900 and 2017.
- Slower storm movement and increased 'stalls' or 'meanders' are linked to higher local rainfall and increased flooding risks.
- Global data indicates a likely increase in the proportion of Category 3–5 cyclones and the frequency of rapid intensification events over the last 40 years.
- Accurate future projections require models to correctly simulate both environmental factors like sea surface temperatures and actual TC behavior.
- Standard CMIP5/6 climate models with 100–200 km grid spacing are unable to simulate the most intense Category 4–5 storms.
- Confidence in projecting intense cyclones generally improves as model resolution increases toward the 10–60 km range.
In combination with slowing translation speed, abrupt TC track direction changes – that can be associated with track ‘meanders’ or ‘stalls’ – have become increasingly common.
Modeling Tropical Cyclone Dynamics
- High-resolution models with 1–10 km grid spacing are increasingly capable of capturing realistic tropical cyclone (TC) structures like eye-walls.
- While higher resolution generally improves intensity simulations, model physics and convective parameterization remain critical factors in accuracy.
- Convection-permitting models and variable resolution global models offer alternatives to traditional regional models by reducing boundary condition errors.
- Atmosphere-ocean coupled models provide more realistic simulations of TC evolution compared to atmosphere-only models.
- Large ensemble simulations are essential for reliable statistical detection of TC changes that single experiments might miss.
- Despite technological advances, higher horizontal resolution does not automatically guarantee an improved TC climatology.
However, higher horizontal resolution does not necessarily lead to an improved TC climatology.
Modeling Tropical Cyclone Projections
- Coupled climate models often struggle to simulate sea surface temperatures accurately due to unrealistic hurricane frequency and intensity representations.
- Computational constraints limit the ensemble sizes of high-resolution models, leading to uncertainties in future sea surface temperature patterns and aerosol forcing.
- Regional climate models and downscaling approaches provide localized insights but rely on specific boundary conditions and seeding assumptions.
- Higher-resolution models (1–60 km) are essential for capturing intense Category 4–5 storms and realistic eyewall structures.
- There is growing evidence that anthropogenic greenhouse gases and aerosols have measurably influenced atmospheric variability in hurricane-prone regions.
- While human influence on Atlantic hurricane activity is increasingly recognized, distinguishing the exact magnitude of human versus natural variability remains a challenge.
Models with horizontal resolutions of 10–60 km are capable of reproducing strong TCs with Category 4–5 and those of 1–10 km are capable of the eye wall structure of TCs.
Tropical Cyclone Trends and Warming
- Simulations indicate that global warming increases the mean intensity and the proportion of very intense tropical cyclones (TCs).
- Natural variability alone cannot explain the significant increase in TC intensification rates observed in the Atlantic basin since the 1980s.
- A robust slowdown in TC translation speed has been observed, potentially linked to anthropogenic forcing and latitudinal track shifts.
- The poleward migration of TCs in the western North Pacific is statistically significant and aligns with long-term climate projections.
- Recent extreme TC seasons, such as the 2015 activity near Hawaii, are attributed to a combination of El Niño and human-induced sea surface temperature changes.
The cause of the observed slowdown in TC translation speed is not yet clear.
Anthropogenic Forcing and Tropical Cyclones
- Anthropogenic forcing has increased the probability of late-season severe tropical storms in regions like the Arabian Sea and the Atlantic.
- Changes in aerosol emissions, specifically sulphate, have been linked to shifts in tropical cyclone genesis frequency in the western North Pacific.
- Event attribution studies for major storms like Hurricane Sandy and Typhoon Haiyan show mixed results regarding human influence on storm intensity.
- High-resolution modeling (5 km or less) is often necessary to accurately simulate rapid intensification and robustly attribute changes to warming.
- While slow translation speed was the primary cause of Hurricane Harvey's flooding, climate change significantly increased the associated rain rates.
- Ocean heat content and sea surface temperatures are identified as critical drivers for the intensification of recent extreme seasonal hurricane events.
These results imply that higher resolution, such as in a convective permitting 5 km or less mesh model, is required to obtain a robust anthropogenic intensification of a strong TC.
Anthropogenic Influence on Tropical Cyclones
- Recent active tropical cyclone seasons in the North Atlantic and Pacific basins are very likely influenced by human-induced climate change and aerosol forcing.
- Urbanization significantly amplifies flood risks, with models suggesting it increased the risk of Hurricane Harvey's flooding by a factor of 21.
- There is high confidence that anthropogenic climate change has contributed to increased heavy precipitation during intense tropical cyclones.
- Global climate models generally project a decrease in the total frequency of tropical cyclones, particularly weaker ones, as the planet warms.
- Scientific uncertainty remains regarding future cyclone frequency due to conflicting results between high-resolution simulations and empirical genesis indices.
A best estimate from a regional climate and flood model is that urbanization increased the risk of the Harvey flooding by a factor of 21.
Uncertainty in Tropical Cyclogenesis Projections
- Climate models show significant disparity in predicting the future frequency of tropical cyclones (TCs), often disagreeing on whether numbers will increase or decrease.
- Increased atmospheric stability and mid-tropospheric saturation deficits are theorized to reduce overall TC frequency by suppressing vertical convective mass flux.
- While total storm counts may decline, high-resolution models consistently project an increase in the proportion of intense Category 4 and 5 hurricanes.
- A 2°C global warming scenario suggests a 13% increase in the proportion of major storms, even as the total global frequency of all TCs may drop by 14%.
- The lack of process understanding regarding 'seeds' and humidity variables remains a primary barrier to high-confidence regional TC projections.
This disparity in the sign of the projected change in global TC frequency, and the difficulty in explaining the mechanisms behind the different signed responses, further emphasize the lack of process understanding of future changes in tropical cyclogenesis.
Tropical Cyclone Projections Under Warming
- Global tropical cyclone (TC) maximum surface wind speeds are projected to increase by approximately 5% for every 2°C of global warming.
- While individual storm intensity is expected to rise, the total global frequency of tropical cyclones is projected to decrease, leading to little change or even a reduction in accumulated cyclone energy (ACE).
- Average TC rain rates are projected to increase by about 12% per 2°C of warming, consistent with the Clausius–Clapeyron scaling of atmospheric moisture.
- Regional variations are significant; for instance, the eastern USA may see a decrease in annual TC-related precipitation due to fewer landfalling storms despite higher rain rates per storm.
- There is evidence of a projected poleward or eastward expansion of TC occurrence, particularly in the western and central North Pacific regions.
- Extreme precipitation events, such as the 10-year return value of one-day maximum rainfall, are expected to increase significantly in areas spanning from Hawaii to south of Japan.
The strongest TC in the western North Pacific can be as strong as 857 hPa in minimum surface pressure with a wind speed of 88 m s–1 under warming conditions in 2074–2087.
Tropical Cyclone Migration and Size
- Climate models consistently project a poleward migration of the latitude where tropical cyclones reach their maximum intensity, particularly in the western North Pacific.
- While observational data for the North Atlantic is less clear, projections suggest a future poleward shift in storm tracks for that region as well.
- There is no scientific consensus on changes to storm translation speeds, though some evidence suggests a slowdown outside of the tropics.
- High-resolution models indicate a potential broadening of tropical cyclone wind fields, possibly due to a rising tropopause causing eyewalls to incline further outward.
- Future coastal flood hazards are expected to increase primarily due to rising sea levels, even when changes in storm intensity and tracks are factored in.
- Projected changes in storm surge severity vary by region, with East Asia showing a likely increase in severity due to future tropical cyclone behavior.
A plausible mechanism is that, as the tropopause height becomes higher with global warming, the eye wall areas become wider because the eye walls are inclined outward with height to the tropopause.
Tropical and Extratropical Storm Trends
- Sea level rise is the primary driver of increased storm surge risk in regions like Fiji, outweighing changes in tropical cyclone (TC) intensity.
- A natural 'protective barrier' of wind shear along the US East Coast is projected to erode by the mid-21st century due to greenhouse gas forcing.
- Global warming is very likely to increase average peak TC wind speeds and the proportion of intense Category 4–5 storms.
- Tropical cyclone rain rates are expected to increase at a rate exceeding the standard 7% per degree of warming due to moisture convergence.
- While the frequency of the strongest storms may rise in specific regions, the total global frequency of all tropical cyclones is expected to decrease or remain stable.
- There is currently low confidence in long-term trends regarding the number and intensity of extratropical cyclones due to high natural variability.
Greenhouse gas forcing in CMIP5 and the Community Earth System Model Large Ensemble simulations, however, erodes the pattern and degrades the natural shear barrier along the USA coast.
Extratropical Cyclone Trends and Modeling
- Reanalyses show high confidence that the number of strong extratropical cyclones (ETCs) increased in the Southern Hemisphere between 1979 and 2009.
- In the Northern Hemisphere, the frequency of deep low-pressure cyclones has generally decreased since 1979, though trends are non-monotonic and show significant decadal variability.
- Using absolute central pressure to measure storm intensity is considered problematic because it is influenced by fluctuating background mean sea level pressure.
- Standard climate models (CMIP5 and CMIP6) consistently underestimate the dynamical intensity and frequency of explosive cyclogenesis events.
- Model performance improves with higher horizontal resolution, as coarse models struggle to resolve diabatic processes like latent heat release and cloud formation.
There is also high confidence that most current climate models underestimate the number of explosive systems over both hemispheres.
Extratropical Cyclone Trends and Projections
- Significant observational uncertainty remains regarding precipitation associated with extratropical cyclones (ETCs), particularly concerning low rainfall intensity over mid-latitude oceans.
- There is high confidence that human-induced emissions of ozone-depleting substances have caused a poleward shift in Southern Hemisphere storm tracks.
- Attributing specific extreme ETC events to human influence remains difficult, with current research providing only low confidence in such links.
- Projections suggest a general decrease in the frequency of strong ETCs in the Northern Hemisphere, including an estimated 17% reduction in extreme wind speed events.
- In contrast to the Northern Hemisphere, the Southern Hemisphere is projected to see a robust increase in extreme cyclones of 20% to 50% depending on the metric used.
- While dynamical intensity changes may be small, shifts in storm track locations are expected to cause substantial local variations in extreme wind speeds.
They found that the number of extreme cyclones is projected to increase by at least 20% and as much as 50%, depending on the specific metric used to define extreme ETCs.
Extratropical and Convective Storm Trends
- While the dynamical intensity of extratropical cyclones (ETCs) shows little change, there is high confidence that associated precipitation will increase due to higher atmospheric water vapor.
- Future precipitation increases are expected to follow a rate of approximately 7% per 1°C of surface warming, though regional variations like Mediterranean decreases may occur.
- Winter ETCs are expected to produce less total snowfall as rising temperatures shift precipitation to rain, yet extreme snowfall events may persist in specific cold regions.
- Historical data for severe convective storms, including tornadoes and hail, remains limited by monitoring inadequacies, leading to low confidence in observed global trends.
- Climate models project an increase in the frequency and intensity of severe thunderstorms, but specific details regarding these increases remain uncertain.
- The representation of storm intensity in climate models is highly sensitive to the resolution and formulation of convective processes.
There is high confidence that snowfall associated with winter ETCs will decrease in the future, because increases in tropospheric temperatures lead to a lower proportion of precipitation falling as snow.
Mechanisms of Severe Convective Storms
- Severe convective storms can manifest as individual mesoscale convective systems (MCSs) or be embedded within larger synoptic-scale systems like tropical cyclones.
- Recent research utilizes 'convective aggregation' and high-resolution modeling to understand how stationary, back-building convection leads to extreme rainfall events.
- Regional variations in storm modes exist, such as the band-shaped precipitation systems common in East Asia versus the rotating or linear modes identified in the USA.
- The occurrence of severe storms depends on specific environmental metrics including atmospheric stability, moisture content, and vertical wind shear.
- There is high confidence that convective available potential energy (CAPE) increases with global warming, particularly in the tropics and subtropics.
- Scientific uncertainty remains regarding how the balance of warming factors, such as rising freezing levels versus stronger updrafts, will ultimately affect hail size and storm frequency.
MCSs sometimes take a linear shape and stay almost stationary with successive production of cumulonimbus on the upstream side (back-building type convection), and cause heavy rainfall.
Dynamics of Severe Convective Storms
- Severe convective storms are influenced by environmental factors like Convective Available Potential Energy (CAPE) and vertical wind shear, which dictate hailstone size and storm intensity.
- Storm systems are often embedded within larger synoptic-scale patterns, including tropical cyclones, extratropical cyclones, and atmospheric rivers.
- Topographic effects and enhanced water vapor flux can significantly increase the duration and intensity of precipitation associated with these systems.
- Global trends in severe convective storms remain difficult to synthesize due to varying regional definitions and limited long-term documentation.
- Satellite observations from TRMM and GPM missions are providing a more comprehensive global view of Mesoscale Convective Systems (MCSs).
- While extreme precipitation events show an upward trend in the USA, the overall frequency of severe thunderstorms and hail lacks a significant global increase.
The uncertainty, however, arises from the balance between these environmental factors affecting severe storm occurrence.
Global Trends in Convective Storms
- While the annual number of US tornadoes remains stable, their variability has increased, resulting in fewer tornado days but more tornadoes per event.
- A geographical shift in US tornado activity is evident, with increases in the mid-south and decreases over the High Plains.
- Mesoscale Convective Systems (MCSs) are increasing in frequency, duration, and precipitation intensity, particularly in the central USA and the Sahel.
- Global trends for hail and lightning remain uncertain due to inconsistent records and insufficient long-term observational coverage.
- Regional variations are significant, with thunderstorm frequency increasing in parts of Europe while decreasing by nearly 50% in China since 1961.
- The lack of a standardized definition for severe convective storms complicates the synthesis of global observational data.
The mean annual number of tornadoes has remained relatively constant, but their variability of occurrence has increased since the 1970s, particularly over the 2000s, with a decrease in the number of days per year, but an increase in the number of tornadoes on these days.
Modeling Severe Convective Storms
- Convection-permitting models with grid spacings finer than 4 km are necessary to explicitly represent severe convective storms.
- High-resolution simulations are computationally expensive, leading researchers to use dynamical downscaling or time-sliced methods.
- While these models improve the representation of precipitation rates and diurnal cycles, they still struggle to directly simulate specific phenomena like tornadoes and hail.
- An alternative approach involves analyzing environmental conditions, such as CAPE and vertical wind shear, using coarser-resolution global climate models.
- Detecting long-term trends in severe convective storms remains extremely difficult due to inconsistent observational data and conflicting environmental factors.
- Event attribution studies are beginning to emerge, such as those using storyline approaches to analyze specific heavy rainfall events in Japan.
Even in finer-resolution convection-permitting models, it is difficult to directly simulate tornadoes, hail storms, and lightning, so modelling studies of these changes are limited.
Severe Convective Storm Projections
- Attributing specific severe convective storms to climate change remains difficult due to the limitations of coarse-resolution global climate models.
- Recent extreme rainfall events in Japan and India have been linked to both rapid regional warming and natural cycles like El Niño.
- Convection-permitting models suggest that while weak-to-moderate convection may decrease, the frequency and intensity of strong convection will likely increase.
- Global warming is expected to increase Convective Available Potential Energy (CAPE) due to higher low-level humidity, particularly in the tropics.
- Increased convective inhibition over land areas, caused by reduced relative humidity, may create more resistance to storm initiation despite higher energy levels.
- There is currently low confidence in general global projections because the relationship between simulated environments and actual storm occurrence is insufficiently validated.
Convective inhibition becomes stronger over most land areas under global warming, resulting mainly from reduced low-level relative humidity over land.
Future Severe Convective Storms
- Global warming is expected to increase Convective Available Potential Energy (CAPE), creating more favorable environments for severe convective storms.
- In the United States, the severe storm season is projected to begin earlier in the year and exhibit greater interannual variability.
- While in-cloud hail generation may increase, some simulations suggest surface hail could be nearly eliminated in specific regions like Colorado due to melting.
- There is high confidence that average and maximum rain rates from severe storms will increase in a warming world.
- Significant uncertainty remains regarding future changes in tornadoes and lightning due to the complex interplay between instability and vertical wind shear.
- Historical data on extreme surface winds shows a potential decline in northern mid-latitudes, though confidence in these trends remains low due to measurement uncertainties.
hail is almost eliminated at the surface in the future in most of the simulations, despite more intense future storms and significantly larger amounts of hail generated in-cloud.
Global Trends in Wind Speeds
- Observational data reveals a 'stilling' effect in the tropics and mid-latitudes, where surface wind speeds have decreased by approximately 0.014 m/s per year.
- The decline in land-based wind speeds is attributed to shifts in atmospheric circulation and increased surface roughness from expanded vegetation cover.
- In contrast to land trends, satellite and ship-based data indicate positive trends in mean and extreme wind speeds over global oceans and the Arctic.
- Future projections suggest that while the global frequency of tropical cyclones may decrease, their average peak wind speeds are expected to increase with warming.
- Extratropical cyclones associated with extreme winds are projected to decrease in the Northern Hemisphere but increase in the Southern Hemisphere regardless of season.
An earlier study attributed the stilling to both changes in atmospheric circulation and an increase in surface roughness due to an overall increase in vegetation cover.
Extreme Winds and Compound Events
- Extreme surface wind speeds are projected to decrease in most tropical areas of the Southern Hemisphere due to a reduction in tropical cyclone frequency and intensity.
- Mediterranean 'medicanes' are expected to decrease in overall frequency under warming scenarios, though the strongest instances are likely to become more intense.
- Observed extreme wind intensity is generally weakening in low to mid-latitudes while becoming more severe in high latitudes poleward of 60 degrees.
- Compound events are defined as combinations of multiple drivers or hazards that amplify societal or environmental risks beyond the sum of their individual parts.
- Compound events are categorized into four types: preconditioned, multivariate, temporally compounding, and spatially compounding events.
- The impact of concurrent or successive weather events often exceeds a system's coping capacity more quickly than isolated extreme events.
This is because multiple stressors can exceed the coping capacity of a system more quickly.
The Nature of Compound Events
- Compound events involve the combination of multiple weather or climate drivers that may not be extreme individually but cause catastrophe when occurring together.
- Common examples include the co-occurrence of heat and drought leading to tree mortality, or storm surges combined with heavy precipitation causing coastal floods.
- Spatially concurrent extremes are increasingly threatening global food security by affecting multiple breadbasket regions simultaneously.
- The land area affected by these concurrent extremes has increased, with high confidence that frequency will rise further as global warming exceeds 2°C.
- Ecosystems adapted to historical climate variability are particularly vulnerable to multivariate anomalies that deviate from local temperature and precipitation norms.
- While most multi-hazard dependencies increase risk, negative correlations between hazards can occasionally decrease overall system vulnerability.
Many major weather- and climate-related catastrophes are inherently of a compound nature.
Rising Risks of Compound Flooding
- The probability of co-occurring storm surges and heavy precipitation is significantly higher on the USA Atlantic and Gulf coasts compared to the Pacific coast.
- Historical data from the last century shows an increasing dependence between heavy precipitation and storm surges, leading to more frequent compound events today.
- Significant correlations between high sea levels and river discharge are observed globally, particularly in North America, Europe, Australia, and Japan.
- Traditional flood assessments often underestimate risk by analyzing drivers like tides or rainfall in isolation rather than as correlated compound events.
- Under high-emission scenarios, the global probability of meteorological conditions driving compound flooding is projected to increase by more than 25% by 2100.
- Hotspots for compound flooding have been identified in regions with limited observational data, such as Madagascar, Vietnam, and Northern Morocco.
Such single driver analyses might underestimate flood probabilities if multiple correlated drivers contribute to flood occurrence.
Rising Compound Climate Extremes
- Coastal flooding is becoming more frequent and intense due to the complex interaction between rising sea levels, storm surges, and fluvial flooding.
- There is high confidence that the magnitude of compound coastal flooding will increase globally as a result of both sea level rise and heavier precipitation.
- Concurrent droughts and heatwaves are strongly linked because weather systems that produce extreme heat typically suppress rainfall while land-atmosphere feedbacks further amplify drying.
- The probability of co-occurring meteorological droughts and heatwaves has already increased in many regions and is projected to continue rising under unabated warming.
- Anthropogenic forcing is a primary driver of increased heatwave frequency, which ensures that compound hot and dry events will occur more often even if drought frequency remains stable.
- Concurrent hot and dry conditions significantly amplify fire weather, with human-induced climate change linked to increased burnt areas through higher vapour pressure deficits.
This means that, even if drought occurrence is unaffected, compound hot and dry events will be more frequent.
Global Trends in Fire Weather
- The relationship between climate and wildfire is nonstationary and varies significantly across different vegetation types and ecosystems.
- While global fire weather seasons lengthened by 19% between 1979 and 2013, total burned area actually decreased due to human land-use changes.
- Anthropogenic climate change is a documented driver of increasingly dangerous bushfire conditions in regions like Australia and the Mediterranean.
- Future projections indicate with high confidence that compound hot and dry conditions will become more frequent as global temperatures rise.
- Concurrent extremes in different parts of the world, driven by atmospheric teleconnections, pose a significant challenge to global risk management capacity.
Between 1979 and 2013, the global burnable area affected by long fire weather seasons doubled, and the mean length of the fire weather season increased by 19%.
Global Concurrent Climate Extremes
- The text examines periods where multiple extreme weather events occurred simultaneously across different global regions.
- A primary driver identified is the variability in tropical Pacific sea surface temperatures.
- The 2015–2016 extreme El Niño is highlighted as a major catalyst for these concurrent events.
- Research also addresses the synergy between long-term global warming and specific atmospheric circulation patterns.
- The 2018 boreal spring and summer serve as a case study for combined anthropogenic and atmospheric impacts.
The first focuses on concurrent extremes driven by variability in tropical Pacific sea surface temperatures (SSTs) associated with the 2015–2016 extreme El Niño.
Extreme El Niño and Warming
- The 2015–2016 El Niño was one of the strongest in 145 years, characterized by unprecedented warmth in the central equatorial Pacific.
- Anthropogenic greenhouse gas forcing is significantly exacerbating the intensity and frequency of climate extremes during El Niño events.
- The 2015–2016 event triggered severe global droughts, particularly in Indonesia, Ethiopia, and the Amazon, leading to record-low land water anomalies.
- In the Amazon, the drought increased forest fire incidence by 36% and crippled river transportation for essential goods like food and medicine.
- Evidence suggests that both the amplitude and frequency of high-magnitude ENSO events have increased since 1950 compared to the pre-industrial period.
- Global mean surface temperatures reached record highs in 2016, driven by the synergy between the extreme El Niño and long-term warming trends.
It also left rivers with very low water levels and large sandbanks, preventing ship transportation of food, medicines, and fuels.
Impacts of the 2015-2016 El Niño
- The 2015-2016 extreme El Niño event significantly altered global weather patterns, contributing to severe droughts in Ethiopia, southern Africa, Indonesia, and the Amazon.
- Anthropogenic warming exacerbated these events by increasing sea surface and local air temperatures, intensifying the impact of the natural El Niño cycle.
- Widespread droughts caused tropical forests to shift from carbon sinks to carbon sources, releasing an estimated 2.3 PgC into the atmosphere.
- The period saw record-breaking tropical cyclone activity in the North Pacific, with Category 4 and 5 storms occurring at more than twice the typical annual rate.
- While some regions faced extreme rainfall and flooding, such as Chennai and the Yangtze River region, others like Australia experienced their least active cyclone season on record.
- The high atmospheric CO2 growth rate in 2015 is directly linked to reduced vegetation uptake and increased forest fires during these climate extremes.
Overall, tropical forests were a carbon source to the atmosphere during the 2015–2016 El Niño-related drought, with some estimates suggesting that up to 2.3 PgC were released.
Extreme Weather Events 2015-2016
- Extreme rainfall events in China during the summer of 2016 were linked to changing climate patterns.
- The Western North Pacific experienced an unusually high frequency of intense Category 4 and 5 tropical cyclones in 2015.
- The Eastern North Pacific saw a record-breaking total number of tropical cyclones during the same boreal summer.
- The 2015–2016 El Niño event triggered significant CO2 releases into the atmosphere due to widespread droughts and fires.
- Scientific attribution studies connect these specific regional anomalies to broader global climate shifts.
High CO2 release to the atmosphere associated with droughts and fires in several affected regions
2018 Northern Hemisphere Extremes
- The 2018 boreal spring and summer saw unprecedented concurrent heatwaves and droughts across mid-latitude regions of the Northern Hemisphere.
- Severe impacts included thousands of heat-related deaths in Japan and Canada, massive crop failures in Europe, and infrastructure damage such as melting roads.
- Japan experienced a dual catastrophe where a record-breaking heavy rain event, causing over 230 deaths, was immediately followed by a lethal heatwave.
- The extreme weather was driven by atmospheric anomalies, including meandering jet streams, atmospheric rivers, and the North Pacific Subtropical High.
- Research indicates the total area affected by these hot extremes—roughly 22% of populated Northern Hemisphere land—was unprecedented but consistent with a +1°C warming scenario.
The reported impacts included: 90 deaths from heat strokes in Quebec; 1469 deaths from heat strokes in Japan; and melting of roads in the Netherlands and the UK.
Human Influence on Concurrent Extremes
- Recent concurrent extreme events, such as the 2018 heatwaves and heavy rainfall in Japan, are virtually certain to have been impossible without human-induced global warming.
- Under a +2°C warming scenario, extreme temperature events that occurred in 2018 are projected to happen every single year.
- The 2015–2016 El Niño event demonstrated how high-magnitude ENSO cycles lead to simultaneous global droughts, heavy precipitation, and intense tropical cyclones.
- Anthropogenic warming has significantly increased the probability of specific disasters, such as the 7% increase in rainfall intensity during Japan's 2018 heavy rain event.
- There is a growing concern regarding the risk of concurrent extremes hitting the world's breadbaskets, which could threaten global food security.
- While the frequency of these events is increasing, there remains low confidence in projecting specific changes to the atmospheric circulation patterns that cause them.
Hence, it is virtually certain that these 2018 concurrent events would not have occurred without human-induced global warming.
Regional Climate Extreme Assessments
- The text outlines a comprehensive framework for assessing climate extremes across six major global regions, categorized by temperature, precipitation, and drought.
- Assessments integrate global datasets for cross-regional consistency with specific regional studies to provide localized calibration.
- Confidence levels are strictly defined, where 'low confidence' is assigned to regions with limited data, conflicting evidence, or high natural variability.
- Projections are evaluated at three specific Global Warming Levels (GWLs): 1.5°C, 2°C, and 4°C above pre-industrial levels.
- Drought assessments primarily use a pre-industrial baseline (1850–1900) because their long timescales make it difficult to distinguish changes against the recent past.
In cases when the evidence is strongly contradictory, for example, with substantial regional changes of opposite sign, ‘mixed signal’ is indicated.
Methodology for Regional Climate Assessments
- The assessment utilizes consistent global analyses and multi-model ensembles like CMIP6 to evaluate observed and projected changes in temperature and precipitation.
- Human contribution to regional temperature extremes is assessed with medium confidence even in data-sparse regions if observations align with warming-driven model projections.
- Heavy precipitation assessments rely on one-day or five-day metrics, incorporating both global datasets and regional CORDEX simulations.
- Drought analysis is categorized into meteorological, agricultural/ecological, and hydrological types using specific indices like the Standardized Precipitation Index (SPI).
- Attribution of climate events to human influence is constrained by data availability, often requiring a synthesis of global studies and localized event attribution analyses.
This assessment is further supported by an understanding of how temperature extremes change with the mean temperature and overwhelming evidence of a human contribution to the observed larger-scale changes.
Assessing Global Drought Trends
- Agricultural and ecological droughts are evaluated using total column soil moisture and water-balance metrics like precipitation minus evapotranspiration.
- The assessment prioritizes drought indices based on the Penman–Monteith equation to avoid biases inherent in temperature-only modeling approaches.
- High confidence in drying trends for arid regions requires consistent signals across both surface soil moisture and atmospheric evaporative demand.
- Projections for global warming levels of 1.5°C, 2°C, and 4°C utilize data from CMIP5 and CMIP6 model intercomparisons.
- Hydrological drought assessments focus on changes in low flows and mean runoff rather than soil moisture alone.
- Attribution of agricultural and ecological droughts currently relies on regional studies due to a lack of global-scale attribution data.
Medium to high confidence in drying was assigned in the assessment for arid regions if a signal was also identifiable in total soil moisture in addition to surface soil moisture.
Climate Modeling and Drought Analysis
- The text catalogs various scientific studies utilizing CMIP5 and CMIP6 models to project drought conditions under different global warming levels.
- Multiple drought indicators are analyzed, including soil moisture, runoff, low-flow days, and the Standardized Precipitation Index (SPI).
- Projections are categorized by warming thresholds ranging from 1.5°C to 4.5°C above pre-industrial levels (1850–1900).
- The research distinguishes between different types of drought, specifically meteorological (MET), agricultural/ecological (AGR/ECOL), and hydrological (HYDR).
- Regional-scale attribution of hydrological droughts remains limited to a few specific AR6 regions, requiring supplemental evidence from event attribution studies.
One global-scale study with regional-scale information is available for the attribution of hydrological droughts (Gudmundsson et al., 2021), but only in a few AR6 regions.
Climate Extremes vs. Averages
- Changes in local surface temperature extremes generally mirror the shifts seen in local average temperatures, with both moving toward warmer values.
- Precipitation extremes behave differently than average precipitation, often increasing even in regions where the total average rainfall is decreasing.
- Regional warming rates vary significantly by season, with the Arctic warming three to four times faster in winter than in summer.
- The intensification of extreme precipitation is primarily driven by a 7% increase in atmospheric water vapor for every 1°C of surface warming.
- Global average precipitation increases at a much slower rate of 2–3% per 1°C due to physical constraints that do not apply to short-term extreme events.
- Specific regions like southern Europe and the Amazon may experience extreme heat intensification that exceeds the local average warming rate.
On the contrary, changes in precipitation extremes (heavy precipitation) generally do not follow those in average precipitation, and can even move in the opposite direction.
Climate Extremes vs Averages
- The relationship between average and extreme climate changes depends heavily on the specific variable being measured.
- Surface temperature changes show a strong correlation between average increases and extreme peaks at the local scale.
- Precipitation changes exhibit a much weaker relationship, where average rainfall and extreme events can diverge significantly.
- Local and regional processes cause substantial geographic variation in how these climate variables manifest.
- Climate models like CMIP6 predict that under a 4°C warming scenario, temperature extremes will mirror average warming trends globally.
- Extreme precipitation events, such as the largest daily rainfall of the year, do not necessarily follow the same patterns as seasonal averages.
At the local scale, average and extreme surface temperature changes are strongly related, while average and extreme precipitation changes are often weakly related.
Unprecedented Climate Extremes
- Human-induced climate change is already increasing the frequency and magnitude of hot extremes while decreasing cold extremes.
- Future extreme events will be unprecedented in five ways: magnitude, frequency, location, timing, and compound occurrence.
- New regions, such as parts of the Arctic, are experiencing events like wildfires that were previously highly improbable.
- Compound events, where multiple extremes like drought and heat occur simultaneously, create more severe impacts than isolated events.
- The probability of unprecedented extremes rises significantly with every degree of global warming, such as from 2°C to 3°C.
- Some recent extreme heat events would have had almost no chance of occurring without human influence on the climate system.
As the climate moves away from its past and current states, we will experience extreme events that are unprecedented, either in magnitude, frequency, timing or location.
Attributing Extremes to Climate Change
- Climate change is driving unprecedented extremes through larger magnitudes, increased frequencies, and new locations.
- The science of event attribution quantifies how human-driven climate change alters the probability and magnitude of specific weather events.
- Attributing a disaster directly to climate change is complex because exposure and vulnerability also determine the final impact.
- Scientists compare current climate data against a hypothetical pre-industrial world to isolate human influence on weather patterns.
- Strong evidence already exists for human-caused increases in the severity of hot extremes and certain precipitation events.
Scientists cannot answer directly whether a particular event was caused by climate change, as extremes do occur naturally, and any specific weather and climate event is the result of a complex mix of human and natural factors.
Attributing Extremes to Human Influence
- Human-caused global warming has significantly increased the probability and magnitude of heatwaves and hot extremes globally.
- Natural climate variations can sometimes mask the ability to attribute specific extreme events to human influence.
- Certain complex weather phenomena, such as tornadoes, currently remain beyond the reach of modeling and theoretical attribution capabilities.
- As global temperatures continue to rise, the signal of human influence is expected to emerge more clearly across various types of extreme weather.
- In Africa, there is high confidence that hot extremes have increased in frequency and intensity, while cold extremes have decreased.
- Climate models project a robust future increase in the intensity of the hottest daily maximum temperatures as warming reaches higher thresholds.
Additionally, attribution of certain classes of extreme weather (e.g., tornadoes) is beyond current modelling and theoretical capabilities.
Projected Extremes in Temperature
- CMIP6 models project a robust increase in the intensity and frequency of maximum temperature (TXx) events.
- There is a corresponding robust decrease in the intensity and frequency of minimum temperature (TNn) events.
- Human contribution to the observed increase in hot extremes and decrease in cold extremes is supported by medium to robust evidence.
- Projections indicate that 50-year temperature extremes could increase by more than 3°C relative to the 1°C warming level in certain scenarios.
- In the Mediterranean region, it is virtually certain that hot extremes will increase and cold extremes will decrease compared to pre-industrial levels.
- Regional climate models and CMIP5 simulations provide additional evidence for these significant shifts in temperature extremes.
Median increase of more than 3°C in the 50-year TXx and TNn events compared to the 1°C warming level.
Mediterranean and Saharan Climate Extremes
- CMIP6 models project a robust increase in the intensity and frequency of hot extremes (TXx) and a decrease in cold extremes (TNn) across the Mediterranean and Sahara.
- In the Mediterranean, median increases in 50-year extreme temperature events are projected to exceed 3.5°C compared to the 1°C warming level.
- Human contribution is cited as a likely factor in the observed increase of hot extremes and the corresponding decrease of cold extremes in these regions.
- Future projections indicate that at a 4°C global warming level, the increase in hot extremes becomes virtually certain compared to both the recent past and pre-industrial levels.
- The Sahara region shows strong observational evidence of changes aligning with model projections, with the magnitude of these changes scaling directly with global warming levels.
The magnitude of projected changes increases with global warming.
Escalating Climate Extremes
- CMIP6 climate models project a robust increase in the intensity and frequency of hot extremes (TXx) alongside a decrease in cold extremes (TNn).
- Median projections suggest that 50-year extreme heat events could increase by more than 3.5°C compared to current warming levels.
- There is medium confidence that human activity is a contributing factor to the observed increase in hot extremes and the decline in cold extremes.
- The likelihood of extreme heat events becomes 'virtually certain' at higher global warming thresholds, such as 4°C.
- Regional data for Western Africa and Southern Europe shows significant observed trends that align with future model projections.
- The magnitude of projected climatic changes scales directly with the level of global warming, with 4°C scenarios showing the most drastic shifts.
The magnitude of projected changes increases with global warming.
Escalating Temperature Extremes in Africa
- Climate models project a robust increase in the intensity and frequency of hot extremes (TXx events) across North Eastern Africa.
- There is a corresponding robust decrease in the intensity and frequency of cold extremes (TNn events) as global temperatures rise.
- Human contribution to these observed temperature shifts is noted with medium confidence across multiple scientific studies.
- Projections indicate that 50-year extreme heat events could increase by more than 3°C compared to current warming levels in certain scenarios.
- The likelihood of these extreme temperature shifts is categorized as 'virtually certain' when compared to pre-industrial baselines in high-warming projections.
- Data from CMIP6, CMIP5, and CORDEX simulations consistently support the trend of intensifying heat and diminishing cold.
Median increase of more than 3°C in the 50-year TXx and TNn events compared to the 1°C warming level.
African Climate Extreme Projections
- North Eastern Africa shows medium confidence in human-attributed increases in the intensity and frequency of hot extremes.
- Projections for 4°C global warming indicate that increases in hot extremes and decreases in cold extremes are virtually certain for North Eastern Africa.
- Central Africa currently lacks sufficient historical data to assess observed trends, resulting in low confidence for event attribution.
- CMIP6 models project a robust increase in the intensity of 50-year extreme heat events across Central Africa as global temperatures rise.
- At a 4°C warming level, annual extreme temperature events in Central Africa are projected to increase by more than 4.5°C compared to pre-industrial levels.
Median increase of more than 4.5°C in annual TXx and TNn compared to pre-industrial.
Climate Extremes in SE Africa
- South Eastern Africa is experiencing a documented increase in the intensity and frequency of hot extremes alongside a decrease in cold extremes.
- Scientific evidence indicates a human contribution to these observed shifts in temperature patterns.
- Climate models project a robust and continuous increase in the intensity of heat events as global warming levels rise from 1.5°C to 4°C.
- At a 4°C warming level, annual hot extremes are projected to increase by more than 4°C compared to pre-industrial levels.
- The certainty of these temperature shifts increases from 'likely' to 'virtually certain' as the projected global warming threshold rises.
Evidence of a human contribution to the observed increase in the intensity and frequency of hot extremes, and decrease in the intensity and frequency of cold extremes
Climate Extremes in Southern Africa
- West Southern Africa is experiencing significant increases in the intensity and frequency of hot extremes alongside a decrease in cold extremes.
- There is robust evidence and high confidence that human influence has contributed to these observed shifts in temperature extremes.
- Climate models (CMIP6) project that at a 4°C warming level, annual hot extremes could increase by more than 4.5°C compared to pre-industrial levels.
- The frequency and intensity of 50-year extreme heat events are projected to rise significantly even at lower warming thresholds like 1.5°C and 2°C.
- Projections for the region indicate that the shift toward more frequent hot extremes is 'virtually certain' when compared to both the recent past and pre-industrial eras.
Median increase of more than 2.5°C in the 50-year TXx and TNn events compared to the 1°C warming level and more than 4.5°C in annual TXx and TNn compared to pre-industrial.
Escalating Global Temperature Extremes
- Scientific data confirms a significant global increase in the frequency and intensity of hot extremes alongside a decrease in cold extremes.
- There is high confidence and robust evidence that human activity is a primary contributor to these observed temperature shifts.
- Climate models (CMIP6) project that 50-year extreme heat events will increase in intensity by over 2.5°C if global warming reaches the 4°C threshold.
- At a 4°C warming level, annual hot and cold extremes are projected to shift by more than 4°C compared to pre-industrial levels.
- The likelihood of increasing heat extremes is classified as 'virtually certain' when comparing future projections to both the recent past and pre-industrial eras.
Median increase of more than 2.5°C in the 50-year TXx and TNn events compared to the 1°C warming level (Li et al., 2021) and more than 4°C in annual TXx and TNn compared to pre-industrial.
Projected Climate Extremes in Africa
- Climate models project a robust increase in the intensity and frequency of hot extremes (TXx) across Africa as global temperatures rise.
- There is a corresponding robust decrease in the intensity and frequency of cold extremes (TNn) compared to pre-industrial levels.
- At a 4°C warming level, the intensity of 50-year extreme heat events is projected to increase by more than 3.5°C compared to pre-industrial times.
- Heavy precipitation events (Rx1day and Rx5day) are expected to intensify, with a projected 20% increase in intensity at 4°C of global warming.
- Confidence levels for these projections increase with higher warming scenarios, reaching 'virtually certain' for heat extremes at the 4°C threshold.
- Despite clear projections, there is currently insufficient observational data to assess historical trends for heavy precipitation across the African continent.
Median increase of more than 3.5°C in annual TXx and TNn compared to pre-industrial.
Climate Extremes and Regional Projections
- Global climate trends show a virtual certainty of increasing hot extremes and decreasing cold extremes compared to pre-industrial levels.
- The Mediterranean region currently shows a lack of agreement on observed heavy precipitation trends due to conflicting evidence and limited data.
- Climate models project a robust increase in the intensity and frequency of heavy precipitation in the Mediterranean as global temperatures rise by 2°C and 4°C.
- The Sahara region lacks sufficient historical data to assess past trends, but models project significant increases in heavy precipitation intensity.
- Confidence levels for the intensification of heavy precipitation generally increase as the projected global warming threshold moves from 1.5°C to 4°C.
- At a 4°C warming level, the intensification of heavy precipitation in the Mediterranean and Sahara is projected with high confidence.
CMIP6 models project a robust increase in the intensity and frequency of heavy precipitation (Li et al., 2021; 11.SM).
Projected Heavy Precipitation Intensification
- Climate models indicate a robust increase in the intensity and frequency of heavy precipitation events across Western and North Eastern Africa as global temperatures rise.
- At a 4°C warming level, median increases in 50-year extreme precipitation events are projected to exceed 25% to 30% compared to the 1°C warming level.
- There is currently low confidence in observed historical trends for these regions due to insufficient data and a lack of agreement among existing evidence.
- Confidence in the intensification of heavy precipitation increases significantly with higher warming scenarios, moving from 'Likely' to 'Virtually certain' compared to pre-industrial levels.
- The projections are supported by multiple modeling frameworks, including CMIP6, CMIP5, and CORDEX simulations.
Intensification of heavy precipitation: Extremely likely (compared with the recent past, 1995–2014) Virtually certain (compared with pre-industrial)
Projected Precipitation Extremes in Africa
- Climate models project a robust increase in both the intensity and frequency of heavy precipitation events across Central and South Eastern Africa.
- At a 4°C warming level, the intensity of 50-year extreme precipitation events is projected to increase by more than 20% to 25% compared to 1°C warming.
- While historical data for these regions remains insufficient to assess past trends, future projections show high confidence in the intensification of rainfall.
- The likelihood of extreme precipitation increases significantly with each degree of global warming, moving from 'likely' at 1.5°C to 'virtually certain' at 4°C.
- Annual maximum 1-day and 5-day precipitation amounts are expected to rise by over 30% in some regions compared to pre-industrial levels under high-warming scenarios.
CMIP6 models project a robust increase in the intensity and frequency of heavy precipitation.
Southern Africa Precipitation Projections
- CMIP6 climate models project a robust increase in the intensity and frequency of heavy precipitation across Southern Africa as global temperatures rise.
- At a 4°C warming level, median increases in 50-year extreme precipitation events are projected to exceed 15% compared to 1°C warming levels.
- Confidence levels for precipitation intensification increase significantly with higher warming scenarios, moving from 'low' at 1.5°C to 'virtually certain' at 4°C for some metrics.
- West Southern Africa shows inconsistent model projections at lower warming levels (1.5°C and 2°C) but reaches high confidence for intensification at 4°C.
- Annual heavy precipitation events (Rx1day and Rx5day) are expected to increase by more than 25% in certain regions compared to pre-industrial levels under extreme warming.
CMIP6 models project a robust increase in the intensity and frequency of heavy precipitation.
Projected Precipitation and Drought Trends
- Climate models indicate a robust increase in the intensity and frequency of heavy precipitation events as global temperatures rise.
- At a 4°C warming level, Madagascar is projected to see a median increase of more than 15% in 50-year extreme precipitation events.
- Confidence levels for the intensification of heavy precipitation increase significantly when comparing future scenarios to pre-industrial levels rather than the recent past.
- While some regions lack sufficient historical data to assess past trends, CMIP6 models provide high confidence for future intensification of extremes.
- The data distinguishes between different types of droughts, including meteorological, agricultural, and hydrological, across various African sub-regions.
Median increase of more than 15% in the 50-year Rx1day and Rx5day events compared to the 1°C warming level.
African Climate Extreme Projections
- The Sahara region shows low confidence in drought trends due to limited evidence and inconsistent signals across various climate models.
- Meteorological projections for the Sahara suggest a slight reduction in drying based on consecutive dry days at higher warming levels.
- Western Africa exhibits medium confidence in observed drying trends, specifically when measured by the Standardized Precipitation Index.
- Human contribution to drought in Western Africa remains uncertain, with a noted trend reversal occurring between 1981 and 2010.
- Projections for Western Africa at 4°C warming indicate a medium confidence increase in seasonal meteorological droughts.
- Data consistency remains a challenge, as CMIP6 global climate models often show conflicting results for precipitation and drought frequency in these regions.
No evidence that late onset of 2015 wet season in Nigeria was due to human contribution.
Drought Projections in North Eastern Africa
- Observational data for North Eastern Africa shows mixed signals, with some areas experiencing increased drought while others, like the Horn of Africa, show wetting trends.
- There is low confidence in attributing recent meteorological drought events in the region to anthropogenic climate change, with studies suggesting natural variability played a larger role.
- Projections for 1.5°C and 2°C global warming levels generally indicate non-significant changes in the frequency and intensity of meteorological droughts.
- At higher warming levels (4°C), there is medium confidence in a decrease in meteorological drought frequency, supported by multiple climate models.
- Agricultural and ecological drought signals remain inconsistent across the region due to geographical variations and differences in model indices.
- Hydrological drought data is limited, though some studies suggest a potential decrease in streamflow under specific warming scenarios.
Robust evidence that recent meteorological drought events (in 2016 and 2017) are not attributable to anthropogenic climate change.
Central African Drought Projections
- Scientific assessments for Central Africa show medium confidence in observed decreases of soil moisture-based and hydrological droughts compared to pre-industrial conditions.
- There is low confidence in attributing long-term drought trends to human influence due to limited evidence and inconsistent signals between different climate models.
- Projections for meteorological drought are highly uncertain, with CORDEX simulations suggesting a drying tendency while CMIP6 models often show a tendency toward wetting.
- Agricultural and ecological drought data indicate a slight tendency toward soil moisture wetting in future warming scenarios, though results vary by the specific index used.
- The region is characterized by significant data gaps, with many assessments marked as 'low confidence' due to a lack of studies or conflicting results between observations and models.
Inconsistent signal in observations vs models for 1951–2010 trends; no signal in single-model based study.
African Drought Trends and Projections
- Scientific assessments of drought trends in Western and South Eastern Africa show a high degree of uncertainty, frequently resulting in 'low confidence' ratings.
- While long-term trends are inconsistent, specific recent extreme events in Southern Africa have been successfully attributed to anthropogenic climate change.
- Projections for South Eastern Africa remain non-robust, with different climate models showing conflicting signals for meteorological and hydrological drought.
- In West Southern Africa, there is medium confidence that dryness will increase as global warming reaches higher thresholds compared to pre-industrial levels.
- The data highlights a significant gap between the clear occurrence of recent severe droughts and the difficulty of establishing long-term statistical trends.
Robust evidence that recent drought events are not attributable to anthropogenic climate change.
Southern Africa Drought Projections
- Climate models show high confidence in the increase of dryness indicators like Consecutive Dry Days (CDD) and drought frequency across Southern Africa.
- While precipitation shifts remain weak at lower warming levels, higher global warming thresholds (up to 4°C) correlate with robust increases in drought severity.
- Agricultural and ecological drought risks are projected to rise, evidenced by decreasing soil moisture and water-balance estimates.
- Hydrological drought projections remain at low confidence due to limited evidence and non-significant signals in runoff and streamflow studies.
- There is a notable discrepancy between different drought indices, with Standardized Precipitation Index (SPI) often showing weaker signals than other metrics.
High confidence: Increases in dryness (CDD, DF, NDD); slight but weaker increase in SPI.
Drought Trends in Southern Africa
- There is medium confidence that human influence has contributed to the recent increase in meteorological drought in the East Southern Africa (ESAF) region.
- Multiple climate models and indices, including Consecutive Dry Days (CDD) and Standardized Precipitation Index (SPI), show a dominant increase in drought frequency and intensity.
- Projections for the mid-to-late 21st century under high-emission scenarios (RCP8.5) indicate a high confidence in increased drought frequency and a higher number of dry days.
- Agricultural and ecological drought assessments show medium to high confidence in future soil moisture decreases and water-balance deficits.
- Hydrological drought evidence remains limited, with low confidence in long-term runoff trends despite some observed drying tendencies.
- Comparisons against pre-industrial baselines consistently suggest that global warming of even 0.5°C to 2°C significantly shifts drought patterns in the region.
Medium confidence that human influence has contributed to stronger recent meteorological drought.
Madagascar Drought Projections
- Current observed trends in Madagascar's meteorological and agricultural droughts show low confidence due to inconsistent data and limited evidence.
- Projections for meteorological drought frequency and intensity increase to medium confidence at 1.5°C of global warming.
- At 2°C of warming, there is high confidence in the increase of meteorological drought based on metrics like dry day counts and the Standardized Precipitation Index.
- Agricultural and ecological drought projections reach high confidence only at the 4°C warming threshold, indicating a robust decrease in soil moisture.
- Hydrological drought projections remain the most uncertain, only reaching medium confidence for increased drying at the 4°C warming level.
- The data highlights a clear correlation between rising global temperatures and the escalating severity of drought events across various metrics.
Robust increase of drought frequency and severity (SPI-12).
Escalating Arctic Temperature Extremes
- Climate models show a very likely increase in the intensity and frequency of hot extremes alongside a decrease in cold extremes.
- There is robust evidence that human contribution is a primary driver of these observed shifts in temperature patterns.
- CMIP6 models project that 50-year extreme heat events could increase by more than 4.5°C compared to baseline warming levels.
- The Russian Arctic specifically shows significant increases in hot extremes and decreases in cold extremes according to multiple regional studies.
- Future projections indicate that increases in hot extremes are 'virtually certain' when compared to pre-industrial levels.
- The intensity of annual maximum temperatures (TXx) and minimum temperatures (TNn) is expected to rise robustly across all warming scenarios.
Human influence very likely contributed to the observed increase in the intensity and frequency of hot extremes, and decrease in the intensity and frequency of cold extremes.
Arabian Peninsula Climate Extremes
- The Arabian Peninsula is experiencing significant increases in the intensity and frequency of hot extremes alongside a decrease in cold extremes.
- CMIP6 climate models project a robust and continued increase in maximum temperature (TXx) events as global warming levels rise.
- At a 4°C warming level, the region is projected to see a median increase of more than 5.5°C in annual hot extremes compared to pre-industrial levels.
- There is medium confidence that human activity has contributed to the observed shift toward more frequent and intense heat events.
- Projections for the future indicate that the magnitude of these temperature changes increases proportionally with the degree of global warming.
- The likelihood of increased hot extremes is categorized as 'virtually certain' when comparing future 4°C scenarios to the pre-industrial era.
Median increase of more than 5.5°C in annual TXx and TNn compared to pre-industrial.
Escalating Temperature Extremes in Asia
- Climate models show a robust increase in the intensity and frequency of hot extremes (TXx) across West Central Asia.
- There is a corresponding significant decrease in the intensity and frequency of cold extremes (TNn) compared to pre-industrial levels.
- Human contribution to these observed temperature shifts is supported by robust evidence and medium to high confidence levels.
- Future projections suggest a median increase of over 5.5°C in annual extreme temperatures compared to pre-industrial benchmarks in certain scenarios.
- The likelihood of increased hot extremes is categorized as 'virtually certain' when comparing future projections to the recent past and pre-industrial eras.
Median increase of more than 5.5°C in annual TXx and TNn compared to pre-industrial.
Regional Climate Extreme Projections
- West Central Asia and West Siberia are experiencing a significant increase in the intensity and frequency of hot extremes alongside a decrease in cold extremes.
- There is high confidence and robust evidence that human activity has contributed to these observed shifts in temperature extremes.
- Climate models project that at a 4°C warming level, increases in hot extremes and decreases in cold extremes become virtually certain compared to pre-industrial levels.
- In West Siberia, CMIP6 models indicate a robust increase in the intensity of maximum temperature events (TXx) and a decrease in minimum temperature events (TNn).
- Projections for West Central Asia show that as global warming levels rise from 1.5°C to 4°C, the likelihood of extreme heat events escalates from 'likely' to 'virtually certain'.
High confidence in a human contribution to the observed increase in the intensity and frequency of hot extremes and decrease in the intensity and frequency of cold extremes.
Shifting Temperature Extremes in Siberia
- CMIP6 climate models project a robust increase in the intensity and frequency of hot extremes (TXx) alongside a decrease in cold extremes (TNn).
- In East Siberia, there is high confidence and robust evidence that human activity has contributed to these observed temperature shifts.
- Projections indicate that at a 4°C global warming level, median increases in extreme temperature events could exceed 5°C compared to pre-industrial levels.
- The likelihood of increased hot extremes is classified as 'virtually certain' when comparing future 4°C scenarios to both the recent past and pre-industrial eras.
- Multiple modeling generations, including CMIP5, CMIP6, and regional simulations, provide consistent evidence for these intensifying climate trends.
High confidence in a human contribution to the observed increase in the intensity and frequency of hot extremes and decrease in the intensity and frequency of cold extremes
Projected Trends in Temperature Extremes
- CMIP6 climate models project a robust increase in the intensity and frequency of maximum temperature (TXx) events.
- There is a corresponding robust decrease in the intensity and frequency of minimum temperature (TNn) events across studied regions.
- Human contribution to these observed changes in hot and cold extremes is noted with high confidence and robust evidence.
- Projections indicate that 50-year extreme events could see median temperature increases of more than 4.5°C compared to current warming levels.
- The likelihood of increased hot extremes is categorized as 'virtually certain' when compared to pre-industrial levels in long-term projections.
- Regional data from the Russian Far East confirms significant local shifts in extreme temperature patterns consistent with global trends.
High confidence in a human contribution to the observed increase in the intensity and frequency of hot extremes and decrease in the intensity and frequency of cold extremes.
Regional Climate Extreme Projections
- The Russian Far East and East Asia are experiencing significant increases in the frequency and intensity of hot extremes alongside decreases in cold extremes.
- There is high confidence and robust evidence that human activity has contributed to these observed shifts in temperature extremes.
- Climate models project that at a 4°C warming level, increases in hot extremes and decreases in cold extremes become virtually certain for the Russian Far East.
- In East Asia, CMIP6 models project a median increase of more than 2°C in annual temperature extremes compared to pre-industrial levels at a 2°C global warming threshold.
- Projections indicate that even at lower warming levels like 1.5°C, the intensification of heat events is already considered likely or very likely across these regions.
High confidence in a human contribution to the observed increase in the intensity and frequency of hot extremes and decrease in the intensity and frequency of cold extremes.
Shifting Temperature Extremes in Asia
- Scientific data confirms significant increases in the intensity and frequency of hot extremes across East Central Asia.
- Conversely, there is a robust observed decrease in the frequency and intensity of cold extremes in the region.
- Attribution studies provide strong evidence that human influence has contributed to these observed temperature shifts.
- Climate models project that a 4°C warming scenario would lead to a median increase of over 4.5°C in annual temperature extremes compared to pre-industrial levels.
- The likelihood of increased hot extremes and decreased cold extremes is categorized as 'virtually certain' under higher warming projections.
Human influence likely contributed to the observed increase in the intensity and frequency of hot extremes and decrease in the intensity and frequency of cold extremes.
Escalating Temperature Extremes
- Climate models show a robust increase in the intensity and frequency of hot extremes (TXx) alongside a significant decrease in cold extremes (TNn).
- There is high confidence and robust evidence that human activity is a primary contributor to these observed shifts in temperature patterns.
- Projections for the Tibetan Plateau indicate significant warming, with median increases in annual temperature extremes exceeding 1.5°C compared to pre-industrial levels.
- The likelihood of more intense heat events is categorized as 'virtually certain' when compared to both the recent past and pre-industrial eras.
- CMIP6 simulations project that 50-year extreme heat events could increase by more than 3.5°C relative to a 1°C global warming baseline in certain regions.
High confidence in a human contribution to the observed increase in the intensity and frequency of hot extremes and decrease in the intensity and frequency of cold extremes
Regional Climate Extremes Projections
- CMIP6 models project a robust increase in the intensity and frequency of hot extremes (TXx) alongside a robust decrease in cold extremes (TNn).
- On the Tibetan Plateau, there is high confidence that human activity has contributed to the observed increase in hot extremes and decrease in cold extremes.
- Projections for the Tibetan Plateau indicate that at a 4°C warming level, increases in hot extremes and decreases in cold extremes are virtually certain.
- South Asia shows significant observed increases in heat intensity and frequency, with robust evidence linking these trends to human influence.
- For the Tibetan Plateau, median increases in 50-year extreme events are projected to exceed 4°C compared to the 1°C warming level baseline.
High confidence in a human contribution to the observed increase in the intensity and frequency of hot extremes and decrease in the intensity and frequency of cold extremes.
Climate Extremes in Southeast Asia
- Southeast Asia is experiencing significant increases in the intensity and frequency of hot extremes alongside a decrease in cold extremes.
- There is high confidence and robust evidence that human activity has contributed to these observed shifts in temperature extremes.
- Climate models (CMIP6) project that 50-year extreme heat events will increase in intensity by more than 3.5°C under a 4°C global warming scenario.
- The likelihood of increasing hot extremes is categorized as 'virtually certain' when comparing future projections to pre-industrial levels.
- Regional simulations consistently show a robust decrease in the intensity and frequency of annual cold extremes (TNn events).
High confidence in a human contribution to the observed increase in the intensity and frequency of hot extremes and decrease in the intensity and frequency of cold extremes.
Projected Climate Extremes in Asia
- CMIP6 models project a robust increase in the intensity and frequency of hot extremes (TXx) alongside a robust decrease in cold extremes (TNn).
- At a 4°C warming level, annual hot and cold extremes are projected to increase by more than 4°C compared to pre-industrial levels.
- There is high confidence in a human contribution to the observed increase in hot extremes and the decrease in cold extremes across Asia.
- Heavy precipitation is significantly intensifying across the region, with human activity identified as a robust contributing factor.
- Projections for heavy precipitation show a median increase of over 15% in 50-year extreme events if global warming reaches 4°C.
- The likelihood of increased hot extremes and decreased cold extremes is considered 'virtually certain' at higher warming thresholds.
High confidence in a human contribution to the observed increase in the intensity and frequency of hot extremes and decrease in the intensity and frequency of cold extremes.
Asian Precipitation Trends and Projections
- Human influence is likely a contributing factor to the observed intensification of heavy precipitation across the Asian continent.
- Future projections indicate that the intensification of heavy rainfall becomes 'virtually certain' at a 4°C global warming level compared to pre-industrial times.
- The Russian Arctic faces a robust projected increase in the frequency and intensity of heavy precipitation, with 50-year extreme events expected to increase by over 25% at high warming levels.
- Data for the Arabian Peninsula currently shows a lack of agreement on observed trends due to insufficient historical evidence.
- Climate models (CMIP6) consistently project that both the intensity and frequency of heavy precipitation will increase across all studied Asian sub-regions as temperatures rise.
Human influence likely contributed to the observed intensification of heavy precipitation.
Projected Precipitation Extremes in Asia
- Climate models project a robust increase in both the intensity and frequency of heavy precipitation across West Central Asia and West Siberia.
- At a 4°C warming level, the intensity of 50-year extreme precipitation events is projected to increase by more than 15% compared to a 1°C warming baseline.
- Confidence levels for the intensification of heavy precipitation rise significantly as global warming thresholds increase from 1.5°C to 4°C.
- Under extreme warming scenarios, the intensification of heavy precipitation in West Central Asia is considered virtually certain compared to pre-industrial levels.
- Data from CMIP5 and CMIP6 simulations consistently show that annual maximum 1-day and 5-day precipitation amounts will exceed historical norms.
CMIP6 models project a robust increase in the intensity and frequency of heavy precipitation.
Intensifying Precipitation in East Siberia
- CMIP6 climate models project a robust increase in both the intensity and frequency of heavy precipitation events across East Siberia.
- At a 4°C warming level, the intensity of 50-year extreme precipitation events is projected to increase by more than 20% compared to 1°C warming levels.
- The likelihood of heavy precipitation intensification becomes 'virtually certain' at the 4°C warming threshold compared to both pre-industrial and recent past baselines.
- Observed trends already show an intensification of heavy precipitation in the region, though detection and attribution evidence remains limited.
- Projections for shorter-term warming (1.5°C) suggest a more modest but still significant 6% increase in annual heavy precipitation compared to pre-industrial levels.
Intensification of heavy precipitation: Virtually certain (compared with the recent past, 1995–2014) Virtually certain (compared with pre-industrial)
East Asian Precipitation Projections
- Climate models indicate a robust increase in the intensity and frequency of heavy precipitation across East Asia and the Russian Far East.
- At a 4°C warming level, the intensity of 50-year extreme precipitation events is projected to increase by more than 25% compared to 1°C warming levels.
- While observed trends show an intensification of heavy rainfall, there remains low confidence in the direct attribution of specific events to human-induced climate change.
- Projections for the Russian Far East suggest that intensification of heavy precipitation is 'virtually certain' under high-warming scenarios.
- The data shows a clear scaling effect where higher global temperature thresholds lead to progressively more severe annual Rx1day and Rx5day precipitation events.
Median increase of more than 25% in the 50-year Rx1day and Rx5day events compared to the 1°C warming level.
Projected Heavy Precipitation Intensification
- CMIP6 climate models project a robust increase in both the intensity and frequency of heavy precipitation events across various regions.
- At a 4°C warming level, median increases in heavy precipitation events (Rx1day and Rx5day) are projected to exceed 20% to 25% compared to pre-industrial levels.
- Confidence levels for the intensification of heavy precipitation increase significantly as global warming levels rise from 1.5°C to 4°C.
- Specific regions like the Tibetan Plateau and East Central Asia show evidence of observed trends in heavy precipitation intensification.
- The likelihood of extreme precipitation changes is described as 'virtually certain' in high-warming scenarios compared to pre-industrial baselines.
Median increase of more than 20% in the 50-year Rx1day and Rx5day events compared to the 1°C warming level.
Intensification of Heavy Precipitation
- CMIP6 climate models project a robust increase in both the intensity and frequency of heavy precipitation events across various warming scenarios.
- For 50-year extreme rainfall events, median increases are projected to exceed 20% to 25% when compared to the 1°C warming level.
- Annual maximum precipitation metrics (Rx1day and Rx5day) show significant upward trends, with some projections exceeding 30% compared to pre-industrial levels.
- Regional analysis of South Asia indicates a significant intensification of heavy precipitation, supported by multiple independent studies and CMIP5 simulations.
- Confidence levels for these intensifications range from 'Likely' to 'Virtually certain' as warming levels and comparison baselines increase.
CMIP6 models project a robust increase in the intensity and frequency of heavy precipitation.
Southeast Asia Precipitation Projections
- Observed trends in South East Asia show a clear intensification of heavy precipitation across multiple scientific studies.
- While human contribution to specific extreme events is evident, scientists currently lack the data to generalize human-induced attribution across the entire region.
- Climate models (CMIP6) project that both the intensity and frequency of heavy precipitation will increase as global temperatures rise.
- At a 4°C warming level, the intensity of 50-year extreme rainfall events is projected to increase by more than 10% compared to current levels.
- Confidence levels for precipitation intensification transition from 'medium' to 'extremely likely' as the comparison shifts from recent history to pre-industrial baselines.
CMIP6 models project a robust increase in the intensity and frequency of heavy precipitation.
Asian Drought Trends and Projections
- The report evaluates meteorological, agricultural, and hydrological drought trends across Asian subregions like the Russian Arctic and Arabian Peninsula.
- Data for the Russian Arctic shows low confidence in observed trends due to limited evidence and inconsistent signals in soil moisture and runoff.
- Projections for the Russian Arctic suggest a potential decrease in meteorological drought severity at higher warming levels (4°C) based on consecutive dry days.
- The Arabian Peninsula suffers from significant data gaps and inconsistent signals, leading to low confidence in both historical trends and future drought projections.
- Human contribution to observed drought trends in these specific regions remains difficult to attribute due to limited evidence and model inconsistencies.
- The assessment highlights the complexity of climate modeling where different indices (like SPI, PDSI, and SRI) often yield conflicting results for the same region.
Low confidence: Inconsistent trends across models and subregions for surface and total soil moisture.
West Central Asia Drought Trends
- The region of West Central Asia shows medium confidence in observed increases of agricultural and ecological drought severity.
- Meteorological drought trends remain uncertain due to inconsistent data across subregions and varying indices like the SPI and CDD.
- There is low confidence regarding human contribution to these trends, with only limited evidence suggesting anthropogenic forcing has increased drought severity.
- Future projections for the region are characterized by mixed signals and inter-model spread, particularly concerning soil moisture levels.
- Data gaps and missing records in large fractions of the region significantly hinder the ability to establish high-confidence climate trends.
- At higher warming levels such as +4°C, there is medium confidence in increased drying across several metrics despite substantial model variability.
Low confidence: Mixed signal between different metrics, including total and surface soil moisture, PDSI and SPEI-PM.
West Siberia Drought Projections
- West Siberia shows a medium confidence trend in decreasing meteorological drought based on historical SPI and CDD indices.
- There is low confidence in human contribution to these trends due to limited evidence and mixed signals within the domain.
- Future projections for agricultural and ecological drought remain uncertain due to inconsistent trends among different metrics and climate models.
- A notable discrepancy exists between CMIP5 and CMIP6 models, with the latter showing soil moisture drying while the former suggests wetting.
- Hydrological drought projections exhibit medium confidence for increased severity at higher warming levels (+4°C), despite a large inter-model spread.
Difference in signal in CMIP6 vs CMIP5: CMIP6 models show drying in soil moisture, while CMIP5 models show wetting.
Drought Trends in East Siberia
- East Siberia shows medium confidence in a decreasing trend for meteorological drought duration and frequency.
- Agricultural and ecological drought data remain inconclusive due to inconsistent trends across different soil moisture indices and subregions.
- Hydrological drought observations are limited, though some studies suggest a slight increase in runoff over the late 20th century.
- Future projections for the region indicate a likely decrease in meteorological drought severity as global temperatures rise.
- There is a notable discrepancy between CMIP5 and CMIP6 climate models, with the former showing wetting and the latter showing drying in soil moisture.
- Overall confidence in human contribution to these specific regional drought trends remains low due to limited evidence and mixed signals.
Difference in signal in CMIP6 vs CMIP5: CMIP6 models show drying in soil moisture, while CMIP5 models show wetting.
Drought Trends in East Asia
- Scientific assessments of drought in the Russian Far East and East Asia show low confidence due to mixed signals across different studies and subregions.
- Meteorological drought projections for the Russian Far East suggest a potential decrease in drought severity as global temperatures rise, though evidence remains limited.
- Agricultural and ecological drought data reveal significant inconsistencies between CMIP5 and CMIP6 climate models, with some showing wetting and others showing drying trends.
- Human contribution to observed drought trends in these regions remains difficult to verify due to a lack of conclusive evidence and regional variability.
- Hydrological drought projections at higher warming levels (+4°C) indicate weak drying trends in summer seasons, but overall confidence remains low.
Difference in signal in CMIP6 vs CMIP5: CMIP6 models show drying in soil moisture, while CMIP5 models show wetting.
East Asian Drought Trends
- Scientific assessments show low to medium confidence in drought trends across East Asia due to significant subregional inconsistencies.
- Agricultural and ecological drought has increased since 1990, particularly in northern China, Japan, and the Russian territories.
- Hydrological drought shows a medium confidence increase, specifically impacting northern China and the Yangtze River basin.
- Model projections for 1.5°C and 2°C warming scenarios remain uncertain, with conflicting signals between different climate indices and spatial regions.
- Human activity, including anthropogenic forcing and agricultural practices, is tentatively linked to intensified soil moisture deficits in specific areas like northern China.
Most of the drying trend took place from 1990, with wetting trend beforehand.
Asian Drought Trends and Projections
- Hydrological drought trends in the Yangtze River are primarily driven by precipitation changes, though potential evaporation and human water management also contribute.
- Agricultural intensification in northern China has been identified as a key factor in the worsening of soil moisture and runoff drought conditions.
- East Central Asia shows a medium confidence trend toward decreasing meteorological drought severity, particularly in frequency metrics.
- There is significant scientific uncertainty regarding future drought projections due to low signal-to-noise ratios and inconsistent results across different climate models.
- Confidence levels for many regional drought trends remain low because of limited evidence and conflicting signals between various drought indices like SPI and SPEI-PM.
Drought conditions in northern China (soil moisture and runoff) have been intensified by agriculture.
Regional Drought Trends and Projections
- The Tibetan Plateau shows low confidence in drought trends due to inconsistent data and a low signal-to-noise ratio in climate models.
- South Asia exhibits medium confidence in an observed increase in meteorological drought, with drying being the dominant trend despite subregional differences.
- Projections for the Tibetan Plateau suggest a slight tendency toward wetting and a decrease in drought, though uncertainty remains high across different models.
- Climate model performance for the South Asian monsoon is generally rated as poor, complicating long-term projections for the region.
- Agricultural and ecological drought assessments across these regions are hampered by limited evidence and conflicting results between various indices and subregions.
Overall poor climate model performance for South Asia monsoon in CMIP5 and CORDEX.
Drought Trends in Southeast Asia
- Scientific assessments of meteorological and hydrological drought in Southeast Asia show low confidence due to inconsistent trends across subregions and models.
- While historical data is often contradictory, the 2015 equatorial Asia drought has been specifically attributed to anthropogenic warming effects.
- Projections for a 1.5°C to 2°C temperature increase remain uncertain, with different models (CMIP5 vs. CMIP6) showing conflicting wetting and drying signals.
- At a 4°C warming level, there is medium confidence in an increase in drying, particularly within CMIP6 and CORDEX simulations.
- Specific regional studies highlight Indonesia as being at risk for increased dry days and precipitation deficits linked to extreme El Niño events.
The equatorial Asia drought of 2015 has been attributed to anthropogenic warming effects.
Climate Trends in Australasia and SEA
- South East Asia shows low confidence in drought trends due to inconsistent data across various soil moisture and hydrological indices.
- Australasia exhibits significant observed increases in the intensity and frequency of hot extremes alongside a decrease in cold extremes.
- There is robust evidence attributing the rise in extreme temperatures in Australasia to human-induced climate change.
- Future projections for Australasia indicate a robust increase in the intensity of 50-year heat events as global warming levels rise.
- At 4°C of global warming, the intensity of extreme temperature events in Australasia is projected to increase by more than 2.5°C compared to the 1°C warming level.
- Discrepancies exist between CMIP5 and CMIP6 models regarding drying versus wetting trends in South East Asia, complicating long-term projections.
Robust evidence of a human contribution to the observed increase in the intensity and frequency of hot extremes and decrease in the intensity and frequency of cold extremes.
Australasian Climate Extreme Projections
- CMIP5 and CMIP6 simulations provide robust evidence for a significant increase in the intensity and frequency of hot extremes across Australasia.
- Human influence is cited as a very likely contributor to the observed historical increase in heat extremes and the corresponding decrease in cold extremes.
- Future projections indicate that at a 4°C global warming level, increases in hot extremes and decreases in cold extremes are virtually certain compared to pre-industrial levels.
- In Northern Australia, median increases in the intensity of 50-year extreme temperature events are projected to exceed 0.5°C for every 1°C of global warming.
- The data shows a consistent trend where the reduction in cold extremes mirrors the intensification of heatwaves across all studied sub-regions.
Human influence very likely contributed to the observed increase in the intensity and frequency of hot extremes and decrease in the intensity and frequency of cold extremes.
Australian Temperature Extreme Projections
- Scientific models show a robust increase in the intensity and frequency of hot extremes (TXx events) across Central Australia.
- There is a corresponding robust decrease in the frequency and intensity of cold extremes (TNn events) as global temperatures rise.
- Researchers have high confidence that human activity has contributed to these observed shifts in temperature extremes.
- Projections indicate that at a 4°C warming level, increases in hot extremes become 'virtually certain' compared to pre-industrial levels.
- CMIP6 models predict a median increase of over 3.5°C in annual temperature extremes compared to the pre-industrial era.
High confidence in a human contribution to the observed increase in the intensity and frequency of hot extremes and decrease in the intensity and frequency of cold extremes.
Escalating Temperature Extremes in Australia
- Climate models project a robust increase in the intensity and frequency of maximum temperature extremes (TXx) across Eastern Australia.
- There is a corresponding robust decrease in the intensity and frequency of minimum temperature extremes (TNn), indicating a significant loss of cold events.
- Human influence is identified as a likely contributor to the observed shifts in temperature extremes compared to pre-industrial levels.
- Projections indicate that annual temperature extremes could increase by more than 4°C compared to pre-industrial levels in certain scenarios.
- The likelihood of increasing hot extremes is categorized as 'virtually certain' when comparing future projections to the recent past.
Median increase of more than 4°C in annual TXx and TNn compared to pre-industrial (11.SM)
Australian Temperature Extreme Projections
- Climate models show a robust increase in the intensity and frequency of hot extremes (TXx) across Eastern and Southern Australia.
- There is a corresponding significant decrease in the intensity and frequency of cold extremes (TNn) as global temperatures rise.
- Human influence is identified as a likely contributor to the observed shifts in temperature extremes within these regions.
- At a 4°C warming level, increases in hot extremes and decreases in cold extremes are considered virtually certain compared to pre-industrial levels.
- CMIP6 simulations project median increases of over 2.5°C in 50-year extreme events when compared to a 1°C warming baseline.
Human influence likely contributed to the observed increase in the intensity and frequency of hot extremes and decrease in the intensity and frequency of cold extremes.
Escalating Temperature Extremes in New Zealand
- Climate models (CMIP5 and CMIP6) show a robust increase in the intensity and frequency of hot extremes across New Zealand.
- There is a corresponding significant decrease in the intensity and frequency of cold extremes compared to pre-industrial levels.
- Projections indicate that at a 4°C warming level, increases in hot extremes are considered virtually certain compared to both the recent past and pre-industrial eras.
- Human influence is identified as a likely contributor to the observed shifts in temperature extremes.
- Specific metrics like TXx (annual maximum temperature) and TNn (annual minimum temperature) are projected to rise by more than 2.5°C under high-warming scenarios.
Human influence likely contributed to the observed increase in the intensity and frequency of hot extremes and decrease in the intensity and frequency of cold extremes.
Australasian Climate Extreme Projections
- CMIP6 models project a robust increase in the intensity and frequency of hot extremes (TXx) across Australasia as global temperatures rise.
- Cold extremes (TNn) are projected to decrease significantly in both frequency and intensity compared to pre-industrial levels.
- At a 4°C warming level, the increase in hot extremes is considered 'virtually certain' compared to the pre-industrial era.
- Heavy precipitation projections show a median increase of over 10% in 50-year extreme events if global warming reaches 4°C.
- While evidence for observed trends in heavy precipitation remains limited in some regions, confidence in intensification grows with higher warming scenarios.
- Specific regional data for Northern Australia indicates an observed intensification of heavy precipitation, though attribution remains complex.
CMIP6 models project a robust increase in the intensity and frequency of TXx events and a robust decrease in the intensity and frequency of TNn events.
Australian Heavy Precipitation Projections
- CMIP6 climate models project a robust increase in the intensity and frequency of heavy precipitation across various Australian regions.
- In Central Australia, median increases in 50-year extreme precipitation events are projected to exceed 10% compared to a 1°C warming level.
- Confidence levels for precipitation intensification vary significantly depending on the baseline, ranging from low confidence relative to the recent past to high confidence relative to pre-industrial levels.
- Eastern Australia shows a lack of agreement on historical trends, though models still project significant future increases in annual extreme rainfall events.
- Long-term projections suggest that annual Rx1day and Rx5day events could increase by more than 20% compared to pre-industrial benchmarks in certain scenarios.
CMIP6 models project a robust increase in the intensity and frequency of heavy precipitation.
Australasian Climate Extreme Projections
- Southern Australia and New Zealand show limited historical evidence for heavy precipitation trends, leading to low confidence in current detection and attribution.
- Climate models project inconsistent changes for heavy precipitation in these regions at lower warming levels of 1.5°C and 2°C.
- At a 4°C warming scenario, there is high confidence in the intensification of heavy precipitation frequency and intensity for both Southern Australia and New Zealand.
- Projected 50-year extreme precipitation events are expected to increase by over 10% in Southern Australia and over 15% in New Zealand under high-warming scenarios.
- Northern Australia has shown a decrease in the frequency and intensity of meteorological droughts with medium confidence, though human attribution remains uncertain.
CMIP6 models project an increase in the intensity and frequency of heavy precipitation (Li et al., 2021; 11.SM).
Drought Projections and Model Uncertainty
- Climate models show significant disagreement regarding Standardized Precipitation Index (SPI) projections, leading to low confidence in future trends.
- Consecutive dry days (CDD) show a slight increase in CMIP6 models, though historical CMIP5 data often lacked statistical significance.
- Agricultural and ecological drought metrics present inconsistent signals, with some studies suggesting a decrease in frequency but not intensity.
- Anthropogenic factors are linked to specific events like the 2018 drought, where extreme temperatures increased atmospheric evaporative demand.
- Hydrological drought projections remain highly uncertain due to a lack of long-term data and limited regional studies.
- Soil moisture trends exhibit a large inter-model spread, making it difficult to establish robust projections for surface or column moisture.
Lewis et al. (2020) supported an anthropogenic attribution of 2018 drought associated with more extreme temperatures that exacerbated atmospheric evaporative demand (AED) and evapotranspiration, and depleting soil moisture.
Australian Drought Trends and Projections
- Central Australia shows medium confidence in a historical decrease of meteorological drought frequency and intensity, though attribution to human activity remains low.
- Projections for Central Australia at various global warming levels (GWL) indicate low confidence due to inconsistent or non-robust changes across different climate models.
- Agricultural and ecological drought assessments for Central Australia are hampered by a lack of studies and inconsistent data regarding soil moisture.
- Eastern Australia currently exhibits low confidence in historical drought trends, with various studies showing inconsistent results or no significant trends.
- Future projections for Eastern Australia suggest a medium confidence in the increase of meteorological droughts as global warming reaches the +2°C and +4°C thresholds.
- The data highlights a significant discrepancy between different modeling systems like CMIP6 and CORDEX, particularly regarding precipitation-based drought indices.
Medium confidence: Increased drying for some metrics or part of domain for soil moisture and SPEI-PM with stronger changes for SPEI-PM.
Australian Drought Projections and Trends
- The report assesses observed and projected drought trends in Eastern and Southern Australia across meteorological, agricultural, and hydrological categories.
- In Eastern Australia, there is currently low confidence in observed agricultural drought trends due to inconsistent data across various scientific studies.
- Projections for Eastern Australia indicate that agricultural and ecological droughts will increase with high confidence at a 4°C global warming level.
- Southern Australia shows mixed signals in meteorological drought observations, with some regions experiencing wetting while others experience drying.
- Anthropogenic forcing, including greenhouse gases and aerosols, is linked to the increased frequency and intensity of meteorological droughts in Southern Australia.
- Confidence in drought projections generally increases as the global warming level (GWL) rises from 1.5°C to 4°C.
Enhanced AED-driven by extreme temperatures increased the severity of the 2019 drought.
Regional Drought and Temperature Projections
- Southern Australia shows medium confidence in increasing drying signals, particularly in the southeast and southwest regions.
- New Zealand faces low confidence in drought trends due to inconsistent data and a lack of comprehensive studies across meteorological and hydrological metrics.
- Central and South America exhibit a likely increase in the intensity and frequency of hot extremes alongside a decrease in cold extremes.
- Human contribution to temperature extremes in Central and South America is supported by robust evidence and attribution studies.
- Climate models project a consistent increase in the intensity of maximum temperature events (TXx) across all studied warming levels (1.5°C to 4°C).
Most subregions show a likely increase in the intensity and frequency of hot extremes and decrease in the intensity and frequency of cold extremes.
Climate Extremes in Central America
- Climate models project a robust increase in the intensity and frequency of hot extremes (TXx) across Central and South America.
- Conversely, there is a projected robust decrease in the intensity and frequency of cold extremes (TNn) as global temperatures rise.
- Human contribution to these observed shifts in temperature extremes is noted with high confidence by researchers.
- At a 4°C warming level, the increase in hot extremes is considered virtually certain compared to pre-industrial levels.
- Specific data for Southern Central America indicates a median increase of over 0.5°C in 50-year extreme events relative to current warming levels.
High confidence in a human contribution to the observed increase in the intensity and frequency of hot extremes and decrease in the intensity and frequency of cold extremes.
Caribbean Climate Extreme Projections
- Climate models show a robust increase in the intensity and frequency of hot extremes (TXx) alongside a significant decrease in cold extremes (TNn).
- Observed trends in the Caribbean already align with future model projections, showing significant shifts in temperature extremes.
- At a 4°C global warming level, the intensity of annual hot and cold extremes is projected to increase by more than 3.5°C compared to pre-industrial levels.
- There is medium confidence that human activity has contributed to the observed increase in hot extremes and decrease in cold extremes in the region.
- The likelihood of these extreme temperature shifts is categorized as 'virtually certain' when comparing future projections to both the recent past and pre-industrial eras.
Strong evidence of changes from observations that are in the direction of model-projected changes for the future.
Escalating Temperature Extremes
- Climate models project a robust increase in the intensity and frequency of hot extremes (TXx) alongside a significant decrease in cold extremes (TNn).
- In North-Western South America, there is robust evidence of a human contribution to these observed shifts in temperature patterns.
- Projections indicate that annual temperature extremes could rise by more than 3.5°C compared to pre-industrial levels in certain scenarios.
- The likelihood of increased heat and decreased cold is categorized as 'virtually certain' when comparing future projections to the recent past and pre-industrial eras.
- Data from CMIP5 and CMIP6 models consistently show that even a 1°C warming level leads to measurable increases in the intensity of 50-year extreme events.
Medium confidence in a human contribution to the observed increase in the intensity and frequency of hot extremes and decrease in the intensity and frequency of cold extremes
South American Temperature Extremes
- Climate models project a robust increase in the intensity and frequency of hot extremes (TXx) across North-Western and Northern South America.
- There is high confidence that human activity has contributed to the observed increase in heat events and the simultaneous decrease in cold extremes.
- Projections indicate that at a 4°C warming level, the increase in hot extremes and decrease in cold extremes become virtually certain.
- In North-Western South America, 50-year extreme temperature events are projected to increase by more than 2°C compared to the 1°C warming level.
- Data from CMIP6, CMIP5, and regional climate models consistently show a significant downward trend in the frequency of cold nights (TNn).
High confidence in a human contribution to the observed increase in the intensity and frequency of hot extremes and decrease in the intensity and frequency of cold extremes.
Projected Extremes in South America
- Climate models project a robust increase in the intensity and frequency of hot extremes (TXx) alongside a significant decrease in cold extremes (TNn).
- There is medium confidence that human activity has contributed to the observed shifts in temperature extremes within the South American Monsoon region.
- At a 4°C warming level, the intensity of annual hot and cold extremes is projected to increase by more than 4.5°C compared to pre-industrial levels.
- The likelihood of increased hot extremes is categorized as 'virtually certain' under high-warming scenarios compared to both the recent past and pre-industrial eras.
- Data from CMIP6, CMIP5, and regional climate models consistently show a trend toward more frequent and severe heat events across all projected warming tiers.
Median increase of more than 3°C in the 50-year TXx and TNn events compared to the 1°C warming level and more than 4.5°C in annual TXx and TNn compared to pre-industrial.
Escalating Temperature Extremes in South America
- Climate models show a robust increase in the intensity and frequency of hot extremes (TXx) alongside a significant decrease in cold extremes (TNn).
- In North-Eastern South America, annual temperature extremes are projected to rise by more than 4°C compared to pre-industrial levels in high-warming scenarios.
- There is medium confidence that human activity has contributed to the observed shifts in temperature intensity and frequency.
- Projections for hot extremes are categorized as 'virtually certain' when compared to both the recent past and pre-industrial eras.
- Data from CMIP6, CMIP5, and RCM simulations consistently indicate a shift toward more frequent and severe heat events across the studied regions.
Median increase of more than 4.5°C in annual TXx and TNn compared to pre-industrial.
South American Climate Extremes
- North-Eastern South America (NES) shows a likely increase in the intensity and frequency of hot extremes and a corresponding decrease in cold extremes.
- There is medium confidence that human activity has contributed to the observed shifts in temperature extremes across the NES region.
- Projections for NES at a 4°C warming level indicate that increases in hot extremes and decreases in cold extremes are virtually certain.
- South-Western South America (SWS) has already experienced significant increases in hot extremes and significant decreases in cold extremes.
- CMIP6 models for the SWS region project a robust increase in the intensity of 50-year heat events, potentially exceeding 3°C at higher global warming levels.
At 4°C warming, an increase in the intensity and frequency of hot extremes is virtually certain compared with the recent past.
South-Eastern South America Climate Extremes
- South-Eastern South America has experienced significant increases in the intensity and frequency of hot extremes alongside decreases in cold extremes.
- There is robust evidence and medium confidence that human activity has contributed to these observed shifts in temperature extremes.
- Climate models project that as global warming reaches 2°C, the intensity of 50-year extreme heat events will increase by more than 1°C compared to current levels.
- Under a 4°C warming scenario, the intensity and frequency of hot extremes are described as 'virtually certain' to increase compared to the recent past.
- The data shows a consistent trend across multiple modeling generations (CMIP3, CMIP5, and CMIP6) regarding the shift toward a hotter regional climate.
Increase in the intensity and frequency of hot extremes: Virtually certain (compared with the recent past, 1995–2014)
Shifting Temperature Extremes in SSA
- There is high confidence that hot extremes are increasing in intensity and frequency while cold extremes are decreasing.
- Human contribution is cited with high confidence as a primary driver for these observed shifts in temperature extremes.
- Projections for Southern South America (SSA) show a robust increase in the intensity of TXx (hottest day) events across all warming levels.
- At a 4°C warming level, the increase in intensity and frequency of hot extremes is considered virtually certain compared to pre-industrial levels.
- CMIP6 models indicate that median increases in 50-year temperature extremes could exceed 2.5°C when global warming reaches the 4°C threshold.
- Despite clear future projections, some historical data for Southern South America remains inconsistent or insufficient for certain trend analyses.
High confidence in a human contribution to the observed increase in the intensity and frequency of hot extremes and decrease in the intensity and frequency of cold extremes
Climate Extremes in Latin America
- The text outlines projected shifts in temperature and precipitation extremes across Central and South America at various global warming thresholds.
- Increases in the intensity and frequency of hot extremes are considered virtually certain at higher warming levels compared to pre-industrial times.
- Conversely, a decrease in the frequency and intensity of cold extremes is also projected with the highest level of scientific certainty.
- Heavy precipitation is expected to intensify across the continent, with median increases in extreme rainfall events exceeding 10% at 4°C of warming.
- Data for South Central America remains inconsistent, leading to lower confidence in specific precipitation projections for that sub-region.
- The transition from 1.5°C to 4°C of warming significantly elevates the statistical confidence and likelihood of these extreme weather shifts.
CMIP6 models project a robust increase in the intensity and frequency of heavy precipitation.
Regional Climate Extreme Projections
- The Caribbean and North-Western South America currently face significant data gaps, leading to low confidence in observed precipitation trends.
- Human contribution to extreme weather events has been identified in specific instances but cannot yet be generalized across these regions.
- Climate models (CMIP5, CMIP6, and RCMs) show high levels of inconsistency regarding future precipitation changes for the Caribbean and North-Western South America.
- Northern South America shows a projected increase in the intensity and frequency of heavy precipitation as global temperatures rise.
- At a 4°C warming level, Northern South America is projected to see a median increase of over 15% in 50-year extreme precipitation events.
- Confidence levels for precipitation intensification generally increase from low to medium as the projected warming threshold moves from 1.5°C to 4°C.
Insufficient data and a lack of agreement on the evidence of trends.
South American Precipitation Projections
- Observational data for North-Eastern South America remains insufficient, with existing trends generally lacking statistical significance.
- Human influence on specific extreme weather events has been detected, though these findings cannot yet be generalized across the region.
- Climate models (CMIP5, CMIP6, and RCMs) show inconsistent projections, leading to low confidence in short-term precipitation changes.
- CMIP6 models project a significant increase in the intensity and frequency of heavy precipitation as global warming levels rise.
- At a 4°C warming level, median increases in heavy precipitation events are projected to exceed 15% to 20% compared to pre-industrial levels.
- Scientific confidence in the intensification of heavy precipitation increases when comparing future scenarios against pre-industrial baselines rather than the recent past.
Evidence of a human contribution for some events (S. Li et al., 2020), but cannot be generalized.
South American Precipitation Trends
- South-Eastern South America (SES) shows a significant observed intensification of heavy precipitation with high confidence in its continued increase.
- South-Western South America (SWS) and Southern South America (SSA) currently suffer from insufficient data coverage and non-significant observed trends.
- While human contribution is evident in specific extreme events, it cannot yet be generalized across all regional precipitation patterns.
- Climate models (CMIP6) project that heavy precipitation intensity in SES could increase by over 20% at higher warming levels compared to pre-industrial times.
- Projections for SWS remain inconsistent across different modeling frameworks, leading to low confidence in future precipitation changes for that specific region.
Median increase of more than 8% in the 50-year Rx1day and Rx5day events compared to the 1°C warming level and more than 20% in annual Rx1day and Rx5day.
Central American Climate Projections
- Heavy precipitation intensity is projected to increase significantly, with median increases of over 15% for 50-year extreme events at higher warming levels.
- Confidence in the intensification of heavy precipitation scales with temperature, moving from 'Low' at current levels to 'Likely' or 'Very Likely' at 4°C warming.
- Southern Central America shows mixed historical signals for meteorological and agricultural droughts, leading to low confidence in observed human-driven trends.
- Future drought severity in the region is projected to increase with high confidence only at the 4°C warming threshold across multiple metrics like soil moisture and SPEI-PM.
- The data highlights a paradoxical shift where both extreme heavy rainfall and drought severity are expected to intensify as global temperatures rise.
Median increase of more than 15% in the 50-year Rx1day and Rx5day events compared to the 1°C warming level.
Regional Drought Confidence Assessments
- The data reveals a consistent pattern of low to medium confidence regarding drought trends across the Caribbean and North-Western South America.
- Meteorological drought projections for the Caribbean show medium confidence in increased drought duration despite mixed historical signals.
- Agricultural and ecological drought assessments are complicated by inconsistent trends between surface soil moisture and total column soil moisture.
- CMIP6 simulations demonstrate a substantial spread between models, contributing to the 'low confidence' rating in several subregions.
- In North-Western South America, different metrics like PDSI-PM and SPEI-PM often provide conflicting signals of wetting versus drying.
- Hydrological drought data remains the most sparse, frequently cited as having 'limited evidence' across the studied regions.
Total soil moisture shows a median decrease in a large sample of CMIP6 simulations but substantial spread between models.
South American Drought Projections
- The report assesses observed and projected drought trends across North-Western South America, Northern South America, and the South American Monsoon region.
- Northern South America shows a clear escalation in drought severity projections, moving from medium confidence at +1.5°C to high confidence at +4°C warming.
- Agricultural and ecological drought metrics in Northern South America exhibit high agreement among studies for increased severity under extreme warming scenarios.
- The South American Monsoon region currently shows medium confidence in the increasing frequency and severity of meteorological droughts.
- Confidence levels for human contribution to observed trends remain generally low across these regions due to limited evidence and inconsistent signals in historical data.
- Hydrological drought projections for North-Western South America remain uncertain with low confidence across all temperature increase thresholds.
High confidence: Increase in drought severity with different metrics and high agreement between studies.
South American Drought Projections
- North-Eastern South America shows high confidence in observed increases of drought duration based on multiple meteorological studies.
- Human contribution to meteorological drought in the region remains at low confidence due to limited or conflicting evidence.
- Agricultural and ecological drought severity is projected to increase with high confidence as global temperatures rise toward the +4°C threshold.
- Hydrological drought projections exhibit lower confidence levels compared to meteorological ones, often due to limited evidence or mixed signals in current modeling.
- Confidence in drought severity increases generally scales with the degree of global warming, showing more robust agreement at +2°C and +4°C levels.
- Different drought metrics, such as soil moisture and PDSI-PM, occasionally yield inconsistent signals, complicating subregional trend analysis.
High confidence: Increase in drought severity with different metrics and high agreement between studies.
Regional Drought Trends and Projections
- South-Western South America shows medium confidence in increased drought duration and severity, particularly in Central Chile between 2010 and 2018.
- Human-induced climate change is identified with medium confidence as a contributor to long-term drying trends in the South-Western region.
- South-Eastern South America exhibits low confidence in observed trends due to mixed signals across different subregions and drought metrics.
- Projections for a 4°C temperature increase show high confidence in increased drought severity across multiple metrics and high agreement between studies.
- Hydrological drought data remains largely uncertain with low confidence due to limited evidence and inconsistent streamflow signals across subregions.
High confidence: Increase in drought severity with different metrics and high agreement between studies.
Global Drought Trends and Projections
- The data reveals a complex landscape of drought trends across different regions, often characterized by low confidence due to mixed signals between studies and models.
- Agricultural and ecological drought metrics, such as soil moisture and PDSI-PM, frequently show inconsistent trends depending on the specific subregion analyzed.
- Southern South America (SSA) shows medium confidence in the observed increase of meteorological drought frequency and severity.
- Confidence levels for projected drought changes generally increase with higher global warming thresholds, specifically at 2°C and 4°C levels.
- Hydrological drought assessments are often hampered by limited evidence, though some regions show high confidence in increased severity under extreme warming scenarios.
Low confidence: Mixed signals between studies and models.
European Temperature Extremes Projections
- All European subregions show a very likely increase in the intensity and frequency of hot extremes alongside a decrease in cold extremes.
- There is robust evidence that human contribution is responsible for the observed shifts in temperature extremes across the continent.
- CMIP6 climate models project that the magnitude of these temperature shifts scales directly with the level of global warming.
- At a 4°C warming level, the intensity of 50-year extreme heat events is projected to increase by more than 5°C compared to the 1°C warming level.
- In Greenland and Iceland, observed changes in temperature extremes are already aligning with future model projections.
- The likelihood of extreme heat becomes 'virtually certain' compared to pre-industrial levels as global warming reaches the 2°C and 4°C thresholds.
All subregions show a very likely increase in the intensity and frequency of hot extremes and decrease in the intensity and frequency of cold extremes.
Escalating Climate Extremes
- Climate models project a robust increase in the intensity and frequency of maximum temperature (TXx) events across multiple regions.
- There is a corresponding robust decrease in the intensity and frequency of minimum temperature (TNn) events, signaling a decline in extreme cold.
- In the Mediterranean and Greenland/Iceland regions, human contribution to these shifting temperature extremes is identified with medium to high confidence.
- Projections for a 4°C warming scenario indicate that increases in hot extremes and decreases in cold extremes are virtually certain compared to pre-industrial levels.
- Median increases in 50-year extreme temperature events are expected to outpace the average global warming level, often exceeding 1°C to 2.5°C relative to pre-industrial baselines.
Median increase of more than 1°C in the 50-year TXx and TNn events compared to the 1°C warming level (Li et al., 2021) and more than 2.5°C in annual TXx and TNn compared to pre-industrial (11.SM)
Escalating European Temperature Extremes
- CMIP6 climate models project a robust increase in the intensity and frequency of hot extremes (TXx) alongside a significant decrease in cold extremes (TNn).
- At a 4°C warming level, the increase in intensity and frequency of hot extremes is considered virtually certain compared to both pre-industrial and recent past levels.
- Data indicates a median increase of more than 5°C in annual temperature extremes compared to pre-industrial levels under high-warming scenarios.
- There is robust evidence that human influence has already contributed to the observed shifts in temperature extremes across Western and Central Europe.
- Projections for 1.5°C and 2°C warming levels show a progressive and 'very likely' escalation of heat events, with intensity increases exceeding the global mean warming.
Median increase of more than 3.5°C in the 50-year TXx and TNn events compared to the 1°C warming level and more than 5°C in annual TXx and TNn compared to pre-industrial.
Escalating Temperature Extremes in Europe
- Climate models project a robust increase in the intensity and frequency of maximum temperature (TXx) events across Eastern Europe.
- There is a corresponding robust decrease in the intensity and frequency of minimum temperature (TNn) events, signaling a decline in extreme cold.
- Median increases in 50-year extreme temperature events are projected to exceed 5.5°C in high-warming scenarios compared to the 1°C warming level.
- Human influence is identified as a likely contributor to the observed shifts in both hot and cold extremes since the pre-industrial era.
- Future projections indicate that increases in hot extremes are 'virtually certain' under continued global warming compared to the recent past.
Median increase of more than 5.5°C in the 50-year TXx and TNn events compared to the 1°C warming level.
Projected European Temperature Extremes
- Climate models project a robust increase in the intensity and frequency of hot extremes (TXx) across Northern and Eastern Europe.
- There is a corresponding robust decrease in the intensity and frequency of cold extremes (TNn) as global temperatures rise.
- Human influence is identified as a likely contributor to the observed shifts in temperature extremes already recorded in these regions.
- At a 4°C warming level, the increase in hot and cold extremes is considered virtually certain compared to pre-industrial levels.
- Projections indicate median increases of over 4.5°C in 50-year extreme events when global warming reaches high-tier thresholds.
Human influence likely contributed to the observed increase in the intensity and frequency of hot extremes and decrease in the intensity and frequency of cold extremes.
Escalating Climate Extremes in Europe
- CMIP6 models project a robust increase in the intensity and frequency of hot extremes (TXx) alongside a significant decrease in cold extremes (TNn).
- At higher warming levels, median increases in 50-year extreme temperature events are projected to exceed 4.5°C compared to pre-industrial levels.
- Human influence is identified as a likely contributor to the observed historical trends of rising heat and diminishing cold.
- The certainty of these shifts increases with the degree of global warming, reaching 'virtually certain' status at the 4°C threshold.
- Heavy precipitation in Europe is showing a significant intensification, with robust evidence linking this trend to human activity.
- Projections for 1.5°C, 2°C, and 4°C global warming scenarios indicate a consistent increase in the frequency of heavy one-day and five-day rainfall events.
CMIP6 models project a robust increase in the intensity and frequency of TXx events and a robust decrease in the intensity and frequency of TNn events.
Projected Intensification of Heavy Precipitation
- CMIP6 climate models project a robust increase in both the intensity and frequency of heavy precipitation events globally.
- Human influence is identified as a likely contributor to the observed intensification of extreme rainfall compared to pre-industrial levels.
- Specific metrics like the 50-year Rx1day and Rx5day events are projected to increase by over 30% in some scenarios compared to a 1°C warming level.
- Confidence levels for these intensifications range from 'High Confidence' to 'Virtually Certain' depending on the region and warming threshold.
- Regional variations exist, with high confidence in intensification for Greenland and Iceland, while the Mediterranean shows a lack of agreement in trend evidence.
CMIP6 models project a robust increase in the intensity and frequency of heavy precipitation.
Heavy Precipitation Projections in Europe
- CMIP6 climate models project a robust increase in both the intensity and frequency of heavy precipitation events across the Mediterranean and Western and Central Europe.
- In the Mediterranean, 50-year extreme precipitation events are projected to increase by more than 8% compared to the 1°C warming level.
- Western and Central Europe show a projected increase of over 15% in annual Rx1day and Rx5day events under a 4°C warming scenario compared to pre-industrial levels.
- Confidence levels for the intensification of heavy precipitation scale with global warming levels, reaching 'High confidence' at 4°C for both the Mediterranean and Western/Central Europe.
- While observed trends in Western and Central Europe show intensification, there remains some disagreement among individual studies regarding detection and attribution.
- Short-term (Rx1day) and medium-term (Rx5day) precipitation extremes generally show more significant increases than long-term (Rx30day) metrics in the Mediterranean.
CMIP6 models project a robust increase in the intensity and frequency of heavy precipitation.
European Heavy Precipitation Projections
- Northern and Eastern Europe show significant observed intensification of heavy precipitation events based on recent historical data.
- Human contribution to intensified winter precipitation in Northern Europe is supported by robust evidence, though summer trends remain less certain.
- CMIP6 models project that both the intensity and frequency of heavy precipitation will increase across all European regions as global temperatures rise.
- At a 4°C warming level, the intensity of 50-year extreme precipitation events is projected to increase by more than 15% compared to the 1°C warming level.
- Confidence levels for the intensification of heavy precipitation increase significantly when comparing future projections against pre-industrial baselines.
- The Mediterranean region, including Northern Africa and Southern Europe, shows medium confidence in the intensification of heavy precipitation events.
Median increase of more than 15% in the 50-year Rx1day and Rx5day events compared to the 1°C warming level.
Projected Precipitation and Drought Trends
- CMIP6 models project a robust increase in both the intensity and frequency of heavy precipitation events globally.
- Extreme precipitation events, such as 50-year Rx1day and Rx5day, are expected to increase by more than 15% compared to the 1°C warming level.
- There is high confidence in a human contribution to the observed intensification of heavy precipitation during winter months.
- Climate models indicate high confidence in changes to flood seasonality and an increase in extreme snow-melt events.
- In the Greenland and Iceland regions, there is currently low confidence regarding observed drought trends due to limited data and studies.
- Projections for Iceland suggest a potential decrease in meteorological drought frequency based on the Standardized Precipitation Index.
High confidence in a human contribution to the observed intensification of heavy precipitation in winter.
Mediterranean Drought Confidence Levels
- Scientific confidence in historical meteorological drought trends remains low due to mixed signals and high regional variability in precipitation data.
- Climate models (CMIP5 and CMIP6) show medium confidence in projected declines of both winter and summer precipitation as global warming progresses.
- There is high confidence that drought intensity and frequency will increase in the Mediterranean, particularly in the southern regions, under higher warming scenarios.
- Agricultural and ecological droughts show a medium confidence of increase, linked to soil moisture deficits and water-balance metrics.
- Attribution of specific events, such as the 2016–2017 southwestern Europe drought, to human-induced climate change is supported by medium confidence studies.
Drought intensity and frequency increase with high confidence, particularly in the southern Mediterranean.
Mediterranean Drought Projections
- The Mediterranean region is experiencing a significant decrease in soil water availability during drought events compared to the 1971–2000 baseline.
- Drought duration and frequency have increased since the pre-industrial era, with high confidence in these trends for both agricultural and ecological drought types.
- Future projections indicate that at +2°C of warming, the drought signal will be twice as large as the response seen at +1.5°C.
- Under a +4°C warming scenario, the decrease in soil water availability is projected to be more than three times larger than at the +1.5°C threshold.
- Historical data from tree rings and hydrological models confirm a long-term drying trend in Southern Europe and the Iberian Peninsula dating back to the 18th and 19th centuries.
- While climate change attribution is clear for summer soil moisture decreases, some grid-cell scale uncertainties remain regarding the emergence of specific water-balance deficits.
Large decreasing soil water availability during drought events compared to 1971–2000, even when accounting for adaptation to mean conditions; more than three times larger signal compared to response at +1.5°C.
Mediterranean Hydrological Drought Projections
- The Mediterranean region is experiencing a high-confidence increase in the frequency and severity of hydrological droughts, particularly in its northern areas.
- Human activity, including rising temperatures and land-use changes, is identified with medium confidence as a primary driver of these drought trends.
- Projections at a +2°C warming level suggest a 30% to 50% decrease in annual runoff for regions like the Iberian Peninsula, Southern France, and Greece.
- Under a +3°C warming scenario, the magnitude of droughts is expected to increase five-fold compared to the pre-industrial baseline.
- At +4°C of warming, models indicate a very large decrease in soil moisture and a 40% to 60% increase in the number of dry days.
- The signal-to-noise ratio for these hydrological changes is considered strong, indicating a clear departure from historical climate variability.
Model-based assessment shows with medium confidence a human fingerprint on increased hydrological drought, related to rising temperature and atmospheric demand.
European Drought Trends and Projections
- Southern Europe is identified as the strongest global hot spot for drought, with model agreement on a 40–60% decrease in spring-summer runoff.
- Western and Central Europe (WCE) show medium confidence in increasing agricultural and ecological droughts based on soil moisture models.
- Observed trends in meteorological drought for WCE remain low confidence due to inconsistent signals across different indices like dry spell frequency and dry day counts.
- Future projections for WCE indicate that drought frequency and severity will likely increase at +2°C and +4°C warming levels, particularly during the summer season.
- Hydrological drought trends in Western and Central Europe currently show weak or insignificant signals with low confidence in detection and attribution.
Very strong decrease (40–60%) of total runoff in spring-summer half-year in southern Europe.
European Drought Trends and Projections
- The report evaluates observed and projected drought trends across Eastern Europe and the Alps using various climate models like CMIP5, CMIP6, and CORDEX.
- Western regions and the Alps show medium confidence in increased drying of surface runoff compared to pre-industrial levels.
- Eastern Europe (EEU) exhibits low confidence in drought trends due to inconsistent or insignificant changes in meteorological and soil moisture data.
- Hydrological drought projections remain uncertain in many domains because of a lack of studies and conflicting signals between different simulation models.
- Increasing global temperatures (1.5°C to 4°C) are expected to cause geographical variations, with some areas experiencing wetting while others face increased low-flow magnitudes.
Medium confidence: Increase in drying, mostly in western part of domain: summer season surface runoff compared to pre-industrial.
Northern Europe Hydrological Projections
- Northern Europe shows a projected decrease in the frequency and severity of meteorological droughts based on standard precipitation indices.
- There is medium confidence in a weak increase in annual runoff, though eastern Europe may see a 20% decrease in total runoff during warm seasons.
- Agricultural and ecological drought signals remain inconsistent across different soil moisture indices and warming levels.
- Human activity has been attributed with medium confidence as a contributing factor to the observed decrease in drought frequency in the region.
- Projections for higher warming levels (+2°C to +4°C) suggest stronger drying signals specifically in summer and over Scandinavia compared to the UK.
Weak increase in probability of low flow but low signal-to-noise ratio
Climate Extremes and Regional Trends
- Hydrological drought trends in Northern Europe remain weak and inconsistent, with significant variation across sub-regions and time frames.
- There is low confidence in drought projections due to conflicting results between Earth System Models (drying) and CORDEX simulations (wetting).
- North America shows a likely increase in the intensity and frequency of hot extremes alongside a decrease in cold extremes.
- Human influence is cited as a very likely contributor to the observed shifts in temperature extremes across the North American continent.
- Future projections indicate a robust increase in extreme heat events, with median temperature increases exceeding 4.5°C at the 4°C global warming level.
Inconsistent changes, generally with drying in ESMs (CMIP5, CMIP6) and wetting in CORDEX.
Climate Extremes in North Central America
- Scientific models indicate it is virtually certain that hot extremes will increase in intensity and frequency compared to pre-industrial levels.
- There is a corresponding virtual certainty that the intensity and frequency of cold extremes will continue to decrease across the region.
- Observational data from North Central America shows significant increases in heat events, aligning with long-term model projections.
- CMIP6 models project that at a 4°C warming level, the intensity of 50-year extreme temperature events could increase by more than 3.5°C.
- There is medium confidence that human activity has contributed to these observed shifts in temperature extremes.
- The magnitude of these projected climatic changes increases proportionally with the level of global warming.
The magnitude of projected changes increases with global warming.
Escalating Climate Extremes
- Scientific data indicates a significant increase in the frequency and intensity of hot extremes alongside a corresponding decrease in cold extremes.
- There is high confidence and statistical likelihood that these shifts are already occurring compared to both pre-industrial levels and the recent past.
- Western North America (WNA) shows specific evidence of human contribution to these observed changes in temperature extremes.
- Climate models (CMIP6) project a robust and continuing increase in the intensity of TXx (hottest day) events as global warming progresses.
- Projections suggest that at higher warming levels, the median increase for 50-year extreme heat events could exceed 5°C compared to baseline levels.
- The data reflects a transition where extreme heat events once considered rare are becoming 'virtually certain' or 'extremely likely' in the future.
Evidence of a human contribution to the observed increase in the intensity and frequency of hot extremes and decrease in the intensity and frequency of cold extremes.
Climate Extremes in North America
- Scientific models project a robust increase in the intensity and frequency of hot extremes across North American regions.
- A corresponding decrease in the intensity and frequency of cold extremes is expected as global temperatures rise.
- At a 4°C warming level, the median increase for extreme heat events in Central North America is projected to exceed 5.5°C compared to pre-industrial levels.
- While observed trends in Central and Eastern North America have been historically weak or inconsistent, human contribution is evident in specific events.
- The certainty of these shifts increases significantly with higher global warming thresholds, moving from 'likely' to 'virtually certain' in many projections.
Median increase of more than 4.5°C in the 50-year TXx and TNn events compared to the 1°C warming level and more than 5.5°C in annual TXx and TNn compared to pre-industrial.
North American Climate Extremes
- Climate models project a robust increase in the intensity and frequency of maximum temperature (TXx) events across North America.
- There is a corresponding robust decrease in the intensity and frequency of minimum temperature (TNn) events as global warming progresses.
- At a 4°C warming level, the increase in hot extremes and decrease in cold extremes are considered virtually certain compared to pre-industrial levels.
- Evidence from CMIP6 models indicates that 50-year extreme temperature events could increase by more than 5°C relative to a 1°C warming baseline.
- Human contribution to these observed trends in temperature extremes is supported by robust evidence and multiple simulation studies.
Median increase of more than 5°C in the 50-year TXx and TNn events compared to the 1°C warming level.
Shifting Temperature Extremes in NWN
- North-West North America is experiencing significant increases in the intensity and frequency of hot extremes alongside a decrease in cold extremes.
- There is robust evidence and high confidence that human activity has contributed to these observed temperature shifts.
- CMIP6 climate models project a robust continuation of these trends, specifically targeting TXx (hottest day) and TNn (coldest night) metrics.
- At a 4°C warming level, projections indicate a median increase of more than 5°C in 50-year extreme events compared to the 1°C warming level.
- The likelihood of increasing hot extremes is categorized as 'virtually certain' when comparing future projections to pre-industrial levels.
High confidence in a human contribution to the observed increase in the intensity and frequency of hot extremes and decrease in the intensity and frequency of cold extremes
North American Climate Extreme Projections
- Climate models show a robust increase in the intensity and frequency of hot extremes (TXx) alongside a significant decrease in cold extremes (TNn).
- At a 4°C global warming level, the intensity of 50-year extreme temperature events is projected to increase by more than 4°C compared to recent levels.
- There is high confidence that human activity has contributed to the observed trends in temperature extremes across North America.
- Heavy precipitation events are significantly intensifying, with human influence identified as a robust driver of these changes.
- Projections for heavy precipitation indicate a median increase of over 6% in the intensity of 50-year extreme rainfall events at a 2°C warming threshold.
Median increase of more than 4°C in the 50-year TXx and TNn events compared to the 1°C warming level (Li et al., 2021) and more than 5°C in annual TXx and TNn compared to pre-industrial.
North American Precipitation Projections
- Climate models project a robust increase in the intensity and frequency of heavy precipitation across North America as global temperatures rise.
- Human influence is identified as a likely contributor to the observed intensification of heavy precipitation events already occurring in the region.
- At a 4°C warming level, the intensification of heavy precipitation is considered virtually certain compared to both the recent past and pre-industrial levels.
- Specific projections for North Central America indicate a median increase of over 15% in 50-year extreme precipitation events at higher warming thresholds.
- While some sub-regions like Western North America show inconsistent historical trends, future projections consistently point toward increased extreme weather risks.
At the 4°C warming level, intensification of heavy precipitation is virtually certain compared with the recent past.
North American Precipitation Intensification
- Central and Eastern North America show significant observed trends in the intensification of heavy precipitation events.
- There is medium confidence that human activity has contributed to the observed increase in heavy rainfall intensity.
- Climate models project that a 4°C warming scenario would lead to a robust increase in precipitation intensity exceeding 10% compared to pre-industrial levels.
- Confidence in these projections increases significantly as the global warming level rises from 1.5°C to 4°C.
- The frequency and intensity of 50-year extreme weather events are expected to rise across all studied North American regions.
Evidence of a human contribution to the observed intensification of heavy precipitation.
Heavy Precipitation Climate Projections
- Current observational data shows limited evidence of significant precipitation trends in Canada and North-East North America.
- Human contribution to specific extreme weather events has been identified, though these findings cannot yet be generalized across all regions.
- CMIP6 models project a robust increase in both the intensity and frequency of heavy precipitation as global temperatures rise.
- At a 4°C warming level, the intensity of 50-year extreme precipitation events is projected to increase by more than 15%.
- Confidence levels for the intensification of heavy precipitation range from medium at 1.5°C warming to 'extremely likely' at 4°C warming.
CMIP6 models project a robust increase in the intensity and frequency of heavy precipitation.
Projected North American Precipitation Extremes
- CMIP6 climate models project a robust increase in both the intensity and frequency of heavy precipitation events across North American regions.
- At higher warming levels, median increases in 50-year extreme precipitation events (Rx1day and Rx5day) are projected to exceed 20% compared to the 1°C warming level.
- While historical trends show a lack of agreement in some regions like North-West North America, there is evidence of human contribution to specific extreme events.
- The confidence in the intensification of heavy precipitation increases significantly with the degree of global warming, moving from 'Likely' to 'Virtually certain' at higher thresholds.
- Projections for annual Rx1day, Rx5day, and Rx30day metrics consistently show upward trends across multiple simulation models including CMIP5 and RCMs.
CMIP6 models project a robust increase in the intensity and frequency of heavy precipitation.
North American Drought Projections
- Current observed trends in North and Central American meteorological droughts show low confidence due to inconsistent changes in frequency and duration.
- Human contribution to historical drought patterns in these regions remains difficult to isolate with high confidence due to limited evidence and precipitation noise.
- Projections indicate that as global temperatures rise to +2°C and +4°C, there is medium to high confidence in increased drought duration and severity for North Central America.
- Agricultural and ecological droughts in Western North America show a medium confidence of increase, though specific subregional trends remain inconsistent.
- Hydrological drought projections remain largely uncertain across the studied regions, with mixed signals among various climate models and metrics.
- At a +4°C warming threshold, models show a high confidence in increased meteorological drought severity for the majority of the North Central American region.
High confidence: Increase in meteorological drought severity in the majority of models.
Climate Change and Drought Trends
- Human-induced climate change has significantly contributed to soil moisture deficits in Western North America over the last two decades.
- Increased atmospheric evaporative demand (AED) and higher temperatures were primary drivers in intensifying the 2012–2014 California drought.
- There is medium confidence that drought severity will increase in Western North America, though results vary based on the specific soil moisture metrics used.
- Hydrological droughts are becoming more frequent and intense in regions dependent on snowpack reservoirs, such as the Colorado basin.
- In Central North America, there is medium confidence in a decrease in the duration and frequency of meteorological droughts.
- Scientific confidence levels vary across regions due to inconsistent signals between different climate models and observational data.
Williams et al. (2015) and Griffin and Anchukaitis (2014) concluded that increased AED has had an increased contribution to drought severity over the last decades, and played a dominant role in the intensification of the 2012–2014 drought in California.
North American Drought Projections
- Central North America shows low confidence in current agricultural drought trends due to mixed signals across various soil moisture metrics.
- Human influence on soil moisture deficits is linked to increased evapotranspiration driven by rising temperatures.
- Projections for Central North America indicate a medium to high confidence in increased drought severity as global temperatures rise from +1.5°C to +4°C.
- Hydrological drought trends in the Missouri and Colorado basins show strong spatial variability, complicating regional assessments.
- Eastern North America exhibits inconsistent drought trends across models and metrics, leading to generally low confidence in current observations.
- At a +4°C warming level, most models converge on an increase in drought severity for Eastern North America, despite weaker signals at lower warming thresholds.
Human influence on surface soil moisture deficits due to increased evapotranspiration caused by higher temperatures.
North American Drought Trends
- Scientific assessments show low confidence in observed hydrological drought trends for Eastern North America due to significant spatial variability and limited evidence.
- Meteorological drought in North-East North America is projected to decrease with medium confidence as global temperatures rise to 2°C and 4°C.
- Agricultural and ecological drought metrics exhibit mixed signals, with inconsistencies between total column soil moisture and surface soil moisture models.
- Human contribution to regional drought trends remains difficult to ascertain, currently categorized under low confidence across multiple sub-regions.
- Projections for 4°C warming scenarios suggest a stronger tendency toward drying in some metrics, yet model spread remains a significant barrier to certainty.
Low confidence: Inconsistent trends between models, metrics and studies based on total and surface soil moisture.
North-West North America Drought Trends
- Scientific assessments of drought in North-West North America show low confidence in observed trends due to mixed signals and conflicting regional data.
- There is medium confidence that meteorological drought severity will decrease as global temperatures rise, particularly at the 2°C and 4°C warming levels.
- Hydrological and agricultural drought projections remain uncertain, with models providing inconsistent evidence regarding soil moisture and runoff.
- Strong seasonality is noted in some runoff studies, suggesting a pattern of decreasing summer runoff and increasing winter runoff.
- Human contribution to these regional drought trends currently has low confidence due to limited and inconsistent evidence across various metrics.
Some evidence (medium confidence) for strong seasonality of trends, with decrease in summer and increase in winter.
Climate Extremes Bibliography
- The text provides a comprehensive list of academic citations focusing on the projection and historical analysis of climate extremes across diverse global regions.
- Research highlights include drought projections in Southern Africa and the United States, as well as extreme temperature trends in Turkey and the Iberian Peninsula.
- Several studies investigate the impact of global warming levels (specifically 1.5 and 2 degrees) on precipitation and temperature indicators.
- Innovative methodologies are presented, such as integrating human behavior dynamics into flood risk assessments and using standardized soil moisture indices for drought forecasting.
- The bibliography covers a wide temporal range, from continental-scale temperature variability over the past two millennia to modern-day compound hazards in a warming world.
Integrating human behaviour dynamics into flood disaster risk assessment.
Climate Extremes Bibliography
- This section provides a comprehensive list of academic references focusing on the projection and observation of climate extremes across diverse geographical regions including South Korea, West Africa, and the United States.
- Several studies examine the specific impacts of global warming levels, such as 1.5°C, on climate extremes in developing nations like Botswana and Pakistan.
- Research highlights the increasing risk of hydrological extremes, specifically river flooding and sub-daily precipitation intensity in the Indian subcontinent.
- The bibliography includes critical reviews of IPCC assessment limitations and the progress made in observing long-term global changes in temperature and precipitation.
- Emerging research explores the 'compound dry-hot extremes' and the biophysical impacts of global forest cover changes on the climate system.
A century of observations reveals increasing likelihood of continental-scale compound dry-hot extremes.
Climate Science Bibliography and Impacts
- The text documents extensive research on global forest vulnerability, specifically focusing on tree mortality and die-off caused by hotter droughts in the Anthropocene.
- A significant portion of the citations examines climate extremes in the Arabian Peninsula, including trends in temperature, drought indices, and extreme precipitation.
- Research highlights the poleward migration of destructive tropical cyclones during the 20th century, indicating shifting geographic risks.
- Studies investigate the physiological mechanisms of forest decline, identifying hydraulic and carbon stress as primary drivers of climate-induced die-off.
- The bibliography includes foundational IPCC reporting on the impacts of 1.5°C global warming and the necessity of strengthening global responses.
Meta-analysis reveals that hydraulic traits explain cross-species patterns of drought-induced tree mortality across
Climate Extremes Bibliography
- This bibliographic section documents scientific research on the attribution of extreme weather events to anthropogenic greenhouse gas emissions.
- Several studies highlight the increasing risk of synchronous crop failures and climate-forced production variability across global agricultural regions.
- Research indicates that tornadoes in Europe are a significant and historically underestimated meteorological threat.
- The text references the complex relationship between drought-related fires and carbon emissions, specifically noting how fires can offset gains made in reducing deforestation.
- Multiple entries focus on the hydrological impacts of climate change, including flash flood frequency in Britain and fragmented flood patterns across the United States.
Tornadoes in Europe: An Underestimated Threat.
Global Hydroclimatic Research Bibliography
- The text provides a comprehensive list of scientific studies focusing on extreme precipitation and flood trends across diverse regions including Spain, Brazil, and Saudi Arabia.
- Several citations investigate the historical and future risks of persistent droughts using both climate model simulations and paleoclimate data.
- Research highlights the relationship between large-scale atmospheric circulation patterns and hydroclimatic shifts in the Northeastern United States and the Northern Hemisphere.
- The bibliography includes specific investigations into the 'stilling phenomenon' and the impact of measurement intervals on wind speed data trends.
- Studies address the detection of anthropogenic influence on record-breaking temperature events and tropical cyclone activity under warming scenarios.
Multidecadal to multicentury scale collapses of Northern Hemisphere monsoons over the past millennium.
Climate Extremes Bibliography
- This section provides a comprehensive list of scientific citations focusing on the intensification of extreme weather events globally.
- Research highlights include the rapid intensification of hurricanes in the Atlantic and changes in tropical cyclone activity in the Indian Ocean.
- Several studies examine the relationship between global warming and the increasing frequency of heavy precipitation and flooding across diverse regions like the Amazon, the Himalayas, and the Yellow River.
- The text references critical advancements in climate modeling, specifically the impact of higher spatial resolution on predicting precipitation extremes.
- Investigations into drought patterns are noted, linking oceanic drivers to widespread summer droughts in the United States and evaluating drought propagation in Spain.
Recent intensification of Amazon flooding extremes driven by strengthened Walker circulation.
Climate Science Bibliographic References
- The text provides a comprehensive list of academic citations focusing on global drought patterns and hydrological indicators.
- Research highlights include the systematic characterization of historic droughts in the UK and the Middle East.
- Several studies examine the impact of climate change on specific regions, including South America, West Africa, and the Philippines.
- The citations cover diverse meteorological phenomena such as flash droughts, snowmelt rates, and extra-tropical cyclones.
- A significant focus is placed on the use of standardized indicators and climate models to predict future temperature variability and rainfall.
Climate models predict increasing temperature variability in poor countries.
Climate Extremes Bibliography
- The text provides a comprehensive list of academic citations focusing on weather and climate extreme events.
- Key research areas include the role of Arctic sea ice in North American cold spells and the development of flexible regional climate models.
- Several studies examine soil moisture dynamics and land-atmosphere feedbacks that amplify aridity under global warming.
- The citations cover diverse geographical regions including the Sahel, Alaska, the Southern Levant, and the United States.
- Research highlights include the intensification of rainfall in West Africa and the use of new-generation geostationary satellites for meteorological observation.
Land–atmosphere feedbacks amplify aridity increase over land under global warming.
Climate Science Bibliographic References
- The text provides a comprehensive list of academic citations focusing on extreme weather events and climate modeling.
- Several studies highlight the increasing risk of compound flooding in coastal regions due to anthropogenic climate change.
- Research identifies significant shifts in tropical cyclone intensity and the acceleration of intensification rates.
- Regional climate impacts are explored, including heatwaves in Brazil and the role of ENSO in Australian and African droughts.
- Methodological advancements are cited, such as the MESMER tool for emulating Earth system model temperatures at the grid-point level.
Higher probability of compound flooding from precipitation and storm surge in Europe under anthropogenic climate change.
Climate Extremes Bibliography
- The text provides a comprehensive list of scientific citations focusing on the intersection of anthropogenic warming and hydrological shifts.
- Research highlights include the changing timing and magnitude of European floods, indicating a significant shift in continental water cycles.
- Several studies document the 'megadrought' in central Chile and the Canadian prairies, attributing these drying trends to human influence.
- The citations explore complex global patterns, such as extreme-rainfall teleconnections and the hydrogeomorphic response of flash floods.
- Methodological concerns are raised regarding climate models potentially underestimating the intensity of heavy rainfall in extratropical regions.
- The bibliography connects specific extreme events, like the 2015 Chennai rainfall, to broader oceanic and atmospheric warming trends.
Models are likely to underestimate increase in heavy rainfall in the extratropical regions with high rainfall intensity.
Climate Extremes and Ecological Impacts
- The bibliography highlights research on projected hydroclimate changes in Andean basins and the added value of dynamical downscaling in complex South American terrains.
- Several studies examine the intersection of drought, wildfires, and forest carbon cycling, emphasizing the vulnerability of tropical and temperate forests to moisture demand.
- Paleotempestological records provide a 2500-year perspective on hurricane activity and intense storm frequency in the Gulf of Mexico and Florida.
- Research identifies increasing variability in severe weather events, including tornado occurrences in the United States and heatwave severity in major global cities.
- Atmospheric blocking is analyzed as a primary driver for European temperature extremes and multiyear streamflow droughts in regional catchments.
Hanging by a thread? Forests and drought.
Climate Extremes Bibliography
- The text provides a comprehensive list of scientific citations focusing on extreme weather events, including droughts, floods, and tropical cyclones.
- Several studies examine the historical context of climate events, such as the 1540 European 'Megadrought' and low-flow events in France dating back to 1871.
- Research highlights the complex relationship between ocean warming and continental climate, specifically challenging the 'wet-get-wetter, dry-get-drier' paradigm over land.
- A significant portion of the research focuses on the Southern Hemisphere, investigating rainfall trends in New Zealand and the impact of greenhouse warming on El Niño and the Indian Ocean Dipole.
- The citations explore the attribution of specific extreme events, such as the Australian Millennium Drought and heavy rainfall in Southeast China, to human-induced climate change.
The Response of Precipitation Minus Evapotranspiration to Climate Warming: Why the “Wet-Get-Wetter, Dry-Get-Drier” Scaling Does Not Hold over Land.
Climate Research Bibliography
- The text provides a comprehensive list of academic citations focusing on tropical cyclone modeling and genesis indices.
- Several studies examine the influence of large-scale climate patterns like ENSO and the Madden-Julian Oscillation on storm formation.
- Research highlights include regional climate projections for Europe, Portugal, and the Mediterranean, specifically regarding precipitation and temperature extremes.
- The bibliography covers the performance of high-resolution models in simulating future intensity-duration-frequency curves for rainfall.
- Specific attention is given to the role of atmospheric fronts and gridding algorithms in the statistical analysis of climate data.
Diagnosis of the MJO modulation of tropical cyclogenesis using an empirical index.
Climate Research Bibliography
- The text provides a comprehensive list of scientific citations focusing on extreme weather events across diverse global regions.
- Several studies analyze the historical trends and future projections of tropical cyclones in the Australian and Typhoon Committee regions.
- Research highlights the relationship between rising temperature extremes and cereal crop productivity in India.
- Multiple entries investigate the spatial analysis of heat waves and climate extremes specifically within Sub-Saharan Africa.
- The bibliography includes technical assessments of extratropical cyclone activity and its impact on seasonal temperatures in both hemispheres.
- Urbanization is identified as a critical factor intersecting with climate change to influence urban temperature patterns.
Projected Significant Increase in the Number of Extreme Extratropical Cyclones in the Southern Hemisphere.
Climate Extremes Research Bibliography
- The text provides a comprehensive list of academic citations focusing on weather and climate extremes, specifically within the context of Chapter 11 of a larger report.
- A significant portion of the research examines anthropogenic warming and its direct link to increased hot droughts and precipitation extremes in China.
- The citations compare various climate modeling generations, such as CMIP3, CMIP5, and CMIP6, to assess their performance in simulating extreme events.
- Research topics extend to biophysical effects of land use, such as afforestation in the Southeast United States and irrigation impacts on global surface temperatures.
- Studies also investigate specific meteorological drivers, including convective available potential energy, quasi-biweekly oscillations, and thermodynamic drivers of rainfall.
Anthropogenic warming has caused hot droughts more frequently in China.
Climate Attribution and Regional Extremes
- The text provides a comprehensive bibliography of scientific studies focusing on the attribution of extreme weather events to anthropogenic climate change.
- Research highlights include the analysis of specific regional events such as the 2013 northern India flood and the 2003 European heatwave.
- Several studies examine the shifting probabilities of temperature extremes, noting a dramatically increasing chance of extremely hot summers in Europe.
- Methodological advancements are documented, including the development of the HadGEM3-A-based system for attributing weather-related extreme events.
- The collection covers diverse geographical regions including the Asian-Australian monsoon zone, South America, and the United Kingdom.
Dramatically increasing chance of extremely hot summers since the 2003 European heatwave.
Climate Extremes Bibliography
- The text provides a comprehensive list of academic references focusing on weather and climate extreme events, specifically within Chapter 11 of a larger scientific report.
- Key research topics include the modeling of Northern Hemisphere summer heat extremes and the exploration of future fire weather spaces in southeast Australia.
- Several citations address the historical evaluation and future prediction of extratropical cyclones and record-breaking hurricane seasons in the North Pacific.
- Significant attention is given to hydroclimate issues, including groundwater depletion in the United States and unprecedented drought risks in the American Southwest.
- The references highlight the use of paleoclimate contexts to understand modern megadroughts and long-term climate projections over the last millennium.
Evapotranspiration depletes groundwater under warming over the contiguous United States.
Climate Extremes and Historical Analogues
- Scientific literature examines how modern greenhouse gas levels could trigger heatwaves exceeding the duration and intensity of the 1930s Dust Bowl.
- Research highlights the amplification of natural drought variability by climate change, specifically focusing on the North American mid-twentieth-century drought.
- Studies investigate the weakening of Northern Hemisphere summer circulation and its link to Arctic amplification.
- Regional assessments cover diverse climate hazards, including frost occurrence in Australia, precipitation extremes in Romania, and mid-summer droughts in Central America.
- New modeling techniques are being used to measure compound flood potential from the simultaneous occurrence of river discharge and storm surges.
Present-day greenhouse gases could cause more frequent and longer Dust Bowl heatwaves.
Climate Extremes Reference Bibliography
- This section provides a comprehensive list of scientific citations focusing on weather and climate extreme events in a changing global environment.
- Key research themes include the increasing frequency and intensity of droughts, particularly under the influence of global warming and hydroclimatic trends.
- Several studies examine regional impacts, such as wind speed trends in Turkey, temperature extremes in Mongolia, and rainfall declines in Australia attributed to greenhouse gases.
- The bibliography highlights emerging meteorological phenomena, including the poleward migration of tropical cyclones and the occurrence of 'flash droughts' in the U.S. Great Plains.
- Research also explores the intersection of human activity and climate, such as the cooling effects of cropland management and the remote impacts of Asian irrigation on African rainfall.
Asian irrigation, African rain: Remote impacts of irrigation.
Climate Extremes and Regional Modeling
- Research highlights the use of speleothems as high-resolution archives for understanding paleoflood history.
- Multiple studies evaluate the performance of CMIP5 and CMIP6 models in simulating temperature and rainfall extremes across South America, India, and Australia.
- Human-managed factors, such as irrigation practices in India, are shown to significantly influence summer monsoon rainfall and extreme weather events.
- Regional climate downscaling is scrutinized for its 'added value' and its ability to represent specific phenomena like Australian East Coast Lows.
- Projections for West and Central Africa indicate significant shifts in hydroclimatic regimes and climate extremes at 1.5°C and 2°C warming thresholds.
- Anthropogenic forcing is linked to increased risks of severe thunderstorm environments and drought susceptibility in North America.
Choice of Irrigation Water Management Practice Affects Indian Summer Monsoon Rainfall and Its Extremes.
Climate Extremes Bibliography
- This section provides a comprehensive list of scientific citations focusing on weather and climate extreme events in a changing global environment.
- Research highlights include the quantification of global warming's influence on unprecedented climate events and the specific impacts of heat and drought on plant physiology.
- Several studies examine regional phenomena, such as cloudbursts in the Indian Himalayas, western disturbances, and increasing heat waves in the terrestrial Arctic.
- The literature explores the complex relationship between land-atmosphere interactions, snow-atmosphere coupling, and their roles in temperature variability.
- A significant portion of the research investigates the correlation between precipitation extremes and changes in flood magnitude or freshwater resource risks at 1.5°C and 2°C warming thresholds.
Growth and photosynthetic responses in Brassica napus differ during stress and recovery periods when exposed to combined heat, drought and elevated CO2.
Climate Extremes Bibliography
- The text provides a comprehensive list of academic citations focusing on global and regional climate extremes, specifically temperature and precipitation.
- Research highlights the role of land surface feedback constraints in reducing uncertainty for future midlatitude daily heat extremes.
- Multiple studies document the intensification of precipitation in both the world's wet and dry regions, suggesting a global shift in hydrological cycles.
- Regional analyses cover specific areas including the Arab region, Northeast Asia, China, and Caribbean small islands like Trinidad and Tobago.
- The bibliography includes critical assessments of climate models (CMIP5 and CMIP6) and their ability to simulate observed changes and attribution of extremes.
- Specific extreme events, such as the 2013 and 2015 European heatwaves, are analyzed in the context of rapid summer warming trends since the mid-1990s.
More extreme precipitation in the world’s dry and wet regions.
Climate Extremes and Soil Moisture
- The bibliography highlights critical research on the harmonization of multi-satellite surface soil moisture data to evaluate global trends.
- Regional climate modeling efforts, particularly through the CORDEX framework, focus on projecting temperature and precipitation extremes in Africa and Europe.
- Research explores the specific impact of soil moisture on reshaping midlatitude daily summer temperatures and the potential for underestimated drying threats.
- Studies investigate the climatological variability of fire weather and the compounding effects of concurrent cyclones, fronts, and thunderstorms.
- A significant portion of the literature addresses abrupt climate shifts and the scaling of precipitation extremes with temperature in the Mediterranean and MENA regions.
Midlatitude daily summer temperatures reshaped by soil moisture under climate change.
Climate Extremes Bibliography
- The text provides a comprehensive list of scientific citations focusing on the dynamics of extreme weather events across various global regions.
- Research highlights include the increasing frequency of persistent precipitation extremes and the shifting timing of snowmelt-related streamflow in the United States.
- Several studies investigate the link between atmospheric circulation patterns and specific regional crises, such as droughts in the Amazon and heatwaves in Europe.
- The bibliography documents severe ecosystem impacts, including large-scale mangrove diebacks in Australia linked to extreme weather events.
- Methodological advancements are noted through the development of updated global datasets like HadEX3 for tracking temperature and precipitation extremes.
Large-scale dieback of mangroves in Australia’s Gulf of Carpentaria: a severe ecosystem response, coincidental with an unusually extreme weather event.
Climate Extremes Bibliography
- This section provides a comprehensive list of academic references focusing on weather and climate extreme events in a changing global environment.
- Key research highlights the increasing intensity of the strongest tropical cyclones and the rising efficiency of tornado days in the United States.
- Several studies utilize downscaling of CMIP5 and CMIP6 climate models to project future tropical cyclone activity and rainfall probabilities, such as those for Hurricane Harvey.
- Regional climate assessments cover diverse geographical areas including East Asia, Southern Africa, Turkey, Mexico, and the Southeastern USA.
- The literature explores the roles of atmospheric forcing and soil moisture deficits in driving heat waves and unprecedented droughts in regions like Mongolia and South America.
- Research also examines the links between oscillation indices (like the North Atlantic and Arctic Oscillations) and local climate trends such as frost-free seasons.
The increasing intensity of the strongest tropical cyclones.
Climate Research Bibliography and Citations
- The text provides a comprehensive list of academic citations focusing on the intensification of tropical cyclones and extreme rainfall patterns.
- Several studies examine the role of aerosols and black carbon in worsening droughts and altering storm intensity in South Asia and the United States.
- Research highlights the impact of land use and climate change on river flows, streamflow variability, and regional climate extremes.
- Specific regional analyses cover climate projections and temperature extremes in Australia, Central Asia, Morocco, and Ethiopia.
- The data explores the relationship between El Niño-induced droughts and increased fire activity and smoke pollution in Indonesia.
- New methodologies are discussed for flood risk management and the evaluation of regional climate ensembles like CORDEX.
Indonesian fire activity and smoke pollution in 2015 show persistent nonlinear sensitivity to El Niño-induced drought.
Climate Extremes Bibliography
- The text provides a comprehensive list of scientific citations focusing on weather and climate extreme events within a changing global environment.
- Research highlights include the intensification of mesoscale convective systems and rainfall extremes specifically over Eastern and Western Africa.
- Several studies examine the anthropogenic contribution to heavy precipitation and high-temperature extremes, confirming that observed increases align with theoretical models.
- The bibliography covers regional climate impacts, such as temperature extremes in Italy, precipitation changes in Switzerland, and the emergence of Category 5 cyclones in the South Indian Ocean.
- Ecological consequences are addressed through studies on biosphere responses to heatwaves in Russia and the hydraulic effects of drought on Amazonian trees.
Observed heavy precipitation increase confirms theory and early models.
Climate Research Bibliography
- The text provides a comprehensive list of academic citations focusing on the intensification of extreme weather events due to anthropogenic climate change.
- Several studies examine regional impacts, specifically focusing on extreme rainfall trends in Central Africa, China, and Australia.
- Research highlights include the link between Arctic amplification and mid-latitude extreme weather, as well as the increasing frequency of marine heatwaves.
- The bibliography covers hydrological shifts, such as streamflow droughts in Europe and reservoir evaporation in the Western United States.
- Evidence is presented regarding the lengthening of the dry season in the Amazon and the changing dynamics of the Asian Summer Monsoon.
- The collection includes assessments of global vulnerability to climate-related hazards and the ranking of tornado outbreaks in the United States.
Evidence linking Arctic amplification to extreme weather in mid-latitudes.
Climate Extremes and Attribution Research
- The bibliography documents extensive research into the attribution of extreme weather events, specifically linking global warming trends to the California droughts of 2012–2014.
- Multiple studies examine the influence of Indo-Pacific sea-surface temperatures and anthropogenic factors on severe droughts and poor harvests in East and Southern Africa.
- The text highlights advancements in climate data sets, such as the Centennial Trends Greater Horn of Africa precipitation data and improved infrared precipitation algorithms.
- Research includes the simulation of 'medicanes' (Mediterranean hurricanes) and tropical cyclones, focusing on the impacts of ocean-atmosphere coupling and increased model resolution.
- Regional climate studies explore diverse phenomena, ranging from precipitation indices in Croatia and seasonal droughts in Australia to the biogeophysical effects of afforestation in Europe.
Anthropogenic Enhancement of Moderate-to-Strong El Niño Events Likely Contributed to Drought and Poor Harvests in Southern Africa During 2016.
Global Climate Impact Bibliography
- The bibliography documents extensive research on extreme weather events, including the 2010–2018 'megadrought' in central Chile and the 2016/17 European drought.
- Multiple studies focus on the hydrological changes in Asia, specifically examining precipitation extremes and evapotranspiration in the Tibetan Plateau and Loess Plateau.
- Research highlights the increasing risks of 'multiple breadbasket failure' as global temperatures rise between 1.5 and 2°C.
- Long-term projections extend to 2300 CE, particularly regarding coastal flood hazards and increasing flood heights in New York City.
- Regional climate assessments cover diverse geographies including the Greater Horn of Africa, Brazil, and the western USA, focusing on heat waves, fire potential, and snowpack loss.
Increasing risks of multiple breadbasket failure under 1.5 and 2°C global warming.
Climate Extremes Bibliography
- The text provides a comprehensive list of scientific references focusing on extreme precipitation, streamflow, and drought patterns across diverse global regions.
- Several studies evaluate the effectiveness of climate modeling frameworks, such as CORDEX and CMIP5, in capturing regional climate information.
- Research highlights the complex relationship between global warming and hydrological changes, including the scaling of precipitation relative to temperature.
- Specific geographic focus is given to the Mediterranean basin, East Africa, the European Alps, and Northwest China regarding historical and future climate shifts.
- The bibliography includes investigations into the sources of continental precipitation and the transport of moisture across oceanic and terrestrial boundaries.
Potential Increase in Hazard From Mediterranean Hurricane Activity With Global Warming.
Climate Research Bibliography: Extremes and Hydrology
- The text consists of a scholarly bibliography documenting research on global climate dynamics, specifically focusing on extreme weather events and hydrological changes.
- Several studies examine the increasing frequency and duration of Arctic warming events and the amplification of seasonal cold extremes in the Northern Hemisphere.
- Significant attention is given to the relationship between soil moisture, aridity indices, and terrestrial carbon uptake under various global warming scenarios.
- Regional climate impacts are highlighted, including historical flood records in the Colorado River, California drought severity, and future climate projections for Australia.
- The research explores the socioeconomic exposure to global droughts and the normalization of hurricane damage estimates in the United States over the last century.
How unusual is the 2012–2014 California drought?
Scientific Bibliography of Climate Extremes
- The text provides a comprehensive list of peer-reviewed scientific citations focusing on the detection and attribution of anthropogenic climate change.
- Research highlights include the intensification of hourly rainfall extremes and the increasing risk of meteorological droughts across Europe.
- Several studies examine the global and regional trends in river flow and freshwater resources, linking changes directly to human-induced warming.
- The bibliography covers diverse geographical impacts, including heat waves in China, monsoon variability in India, and hurricane simulations in the Atlantic.
- Advanced modeling techniques, such as CMIP6 and high-resolution convection-permitting simulations, are cited as key tools for projecting future weather extremes.
Australian tropical cyclone activity lower than at any time over the past 550–1,500 years.
Climate Research Bibliography
- The text provides a comprehensive list of academic citations focusing on extreme weather events, including hurricanes, droughts, and intense rainfall.
- Several studies examine regional climate impacts, specifically targeting the Caribbean, Europe, Africa, Japan, and the Silk Road Economic Belt.
- Research highlights include the phenomenon of hurricane stalling along the North American coast and its direct implications for increased rainfall.
- A notable scientific finding identifies a 'weak linkage' between the heaviest rainfall events and the tallest storm structures.
- The bibliography tracks long-term trends in environmental variables such as snow albedo feedback, river flows in the UK, and wind speeds over the Southern Ocean.
Weak linkage between the heaviest rainfall and tallest storms.
Climate Extremes Bibliography
- The text documents scientific research on the attribution of extreme weather events, such as the 2013 New Zealand drought, to anthropogenic climate change.
- Several studies examine how regional exposure to heat extremes is exacerbated by the combination of population dynamics and uneven temperature emergence.
- Research highlights the use of high-resolution simulations and large-ensemble regional models to project future changes in tropical cyclone activity and extreme precipitation.
- The bibliography includes investigations into the physiological impacts of climate change on nature, specifically carbon starvation and hydraulic strategies in trees during droughts.
- A significant portion of the citations focuses on regional climate impacts in diverse areas including Sub-Saharan Africa, Indonesia, the European Alps, and Japan.
Carbon starvation during drought-induced tree mortality – are we chasing a myth?
Climate Science Bibliography and References
- The text provides a comprehensive list of academic citations focusing on extreme weather events, including heat waves in Russia and droughts in Europe and North America.
- Several studies examine the intensification of the hydrological cycle and extreme precipitation patterns in response to global warming.
- Research highlights the role of human water management in exacerbating hydrological droughts, specifically in regions like California.
- The citations include methodological advancements in climate modeling, such as convection-permitting models and improved pattern scaling for impact studies.
- A significant portion of the research investigates the spatiotemporal dynamics of droughts and their propagation across continental landmasses.
Intensification of hydrological drought in California by human water management.
Climate Extremes Bibliography
- The text provides a comprehensive list of scientific citations focusing on the attribution of extreme weather events to climate change between 2013 and 2018.
- Research highlights include the role of storm temporal patterns in increasing flood risks within developed urban watersheds.
- Several studies examine the biogeophysical impacts of land-use management and its potential to mitigate or amplify regional warming and heatwaves.
- The bibliography covers diverse geographical regions, including the Mediterranean, Central America, and Australia, regarding drought and climate variability.
- A significant portion of the literature explores the 'Evaporative Demand Drought Index' and the relationship between evapotranspiration and water crises.
Multi-hazard dependencies can increase or decrease risk.
Climate Research Bibliography
- The text provides a comprehensive list of academic citations focusing on the intensification of extreme weather events due to climate change.
- Key research areas include the increasing frequency of Mediterranean droughts and the anatomy of the 2012 Great Plains drought.
- Several studies examine the relationship between global warming and the rising intensity of hurricanes and tropical cyclones.
- The bibliography highlights regional impacts, specifically record-breaking heatwaves in Australia and heavy precipitation trends in the United States.
- The citations include significant institutional reports, such as the IPCC Special Report on the impacts of 1.5°C global warming.
Anatomy of an extreme event.
Climate Extremes Bibliography
- The text provides a comprehensive list of scientific citations focusing on the attribution of extreme weather events to human-induced climate change.
- Research highlights include the impact of increasing atmospheric CO2 on record-breaking fire weather in Australia and carbon emissions from Southeast Asian fires.
- Several studies examine regional shifts in precipitation and temperature extremes, specifically in the Northeast United States, China, and the Peruvian Altiplano.
- The bibliography documents the use of regional climate models and statistical downscaling to project future drought and flood characteristics globally.
- Investigations into atmospheric circulation patterns and sea surface temperature biases reveal the complexities of simulating tropical cyclones and temperature trends.
Fire carbon emissions over maritime southeast Asia in 2015 largest since 1997.
Climate Science Bibliography
- The text provides a comprehensive list of academic citations focusing on extreme weather events and their attribution to climate change.
- Several studies specifically examine the role of human-induced global warming in Japanese heat waves and heavy rainfall events.
- Regional climate variability is explored through research on extreme precipitation in Pakistan, North India, and Northeastern North America.
- The bibliography includes significant institutional reports from the IPCC regarding disaster risk management and the physical science basis of climate change.
- Research also addresses the agricultural impacts of rapid-onset droughts and seasonal temperature contrasts in various global regions.
The July 2018 High Temperature Event in Japan Could Not Have Happened without Human-Induced Global Warming.
Climate Extremes Bibliography
- The text provides a comprehensive list of scientific references focusing on weather and climate extreme events in a changing global environment.
- Key IPCC special reports are cited, covering the impacts of 1.5°C global warming, land degradation, and the state of the ocean and cryosphere.
- Regional studies examine specific phenomena such as precipitation trends in Finland, flood non-stationarity in Australia, and hailstone variability in the U.S. Great Plains.
- Methodological research is highlighted, including regional climate downscaling over Europe and the attribution of extreme events through bias correction.
- The literature explores the complex relationship between heavy precipitation and actual river discharge, noting they do not always trend together.
Examining why trends in very heavy precipitation should not be mistaken for trends in very high river discharge.
Climate Extremes and Attribution Bibliography
- The text documents scientific research into anthropogenic contributions to extreme weather events, specifically flooding in the Upper Yellow River Basin.
- Several studies focus on the regional impacts of climate change in China, including soil moisture trends, precipitation extremes in Xinjiang, and climate model evaluations.
- Global environmental shifts are addressed through research on record-breaking warming in the Amazon rainforest and variations in global wildfire danger.
- The bibliography highlights the 'attribution' of extreme events, seeking to distinguish between human-forced responses and natural internal climate variability.
- Research extends to the study of atmospheric rivers over the Northwestern Pacific and the increasing frequency of temperature extremes during global warming slowdowns.
Behind the veil of extreme event attribution.
Climate Extremes Bibliography
- The text provides a comprehensive list of scientific citations focusing on the intensification and structural changes of tropical cyclones in warmer climates.
- Several studies examine regional weather phenomena, such as the 'Senjo-Kousuitai' band-shaped precipitation systems that cause localized heavy rainfall in Japan.
- Research highlights the recurring challenge of drought in the Middle East and the Mediterranean, specifically investigating the role of radiative forcing versus internal variability.
- The bibliography includes attribution studies that link specific extreme events, like the 2015 record low rainfall in Tasmania, to climate change and El Niño.
- Methodological advancements are noted through the use of high-resolution 2-km mesh nonhydrostatic models and large ensemble projects for studying climate variability.
Quasi-Stationary Band-Shaped Precipitation Systems, Named as “Senjo-Kousuitai”, Causing Localized Heavy Rainfall in Japan.
Climate Extremes Bibliography
- The text provides a comprehensive list of academic citations focusing on the modeling and observation of extreme weather events globally.
- Research highlights include the intensification of summer downpours and the use of high-resolution convection-permitting models to improve precipitation forecasts.
- Several studies examine regional climate shifts, specifically focusing on drought trends in Africa, heat waves in Southern Europe, and temperature extremes in Pakistan and Russia.
- The bibliography addresses the risks associated with global warming thresholds, comparing the impacts of a 1.5°C versus a 2.0°C increase on rare climate extremes.
- Technical papers explore the intersection of natural hazards, such as the simultaneous occurrence of storm surges and river discharge extremes in delta regions.
- The collection includes investigations into the role of tropical cyclones in global rainfall patterns and the simulation of these storms in response to increased CO2 levels.
Risks from Climate Extremes Change Differently from 1.5°C to 2.0°C Depending on Rarity.
Climate Extremes and Attribution Research
- The text provides a comprehensive bibliography of scientific studies focused on the attribution of extreme weather events to human-induced climate change.
- Research highlights include the evaluation of precipitation extremes across Asia and systematic model errors in African climate hindcasts.
- Multiple studies analyze specific regional events, such as the 2013 Korean heatwave, Indonesian droughts, and record-breaking heat in Australia.
- The bibliography underscores the role of anthropogenic influences in increasing the frequency and intensity of temperature record-breaking globally.
- Methodological advancements are noted, including the use of high-resolution coupled climate models and the CMIP6 multi-model ensemble for extreme indices.
- The collection emphasizes the importance of spatial and temporal framing when attributing individual extreme events to global warming trends.
Climate change turns Australia’s 2013 big dry into a year of record-breaking heat.
Climate Extremes and Cyclone Research
- The text provides a comprehensive bibliography of scientific studies focusing on drought projections and precipitation extremes in Australia and Japan.
- Several citations examine the intensification and frequency of tropical cyclones, including global climatology of cyclone eyes and Atlantic hurricane activity.
- Research highlights the impact of global warming levels, specifically 1.5°C and 2°C, on dry and wet cycles in West Africa.
- Studies investigate the intersection of hydrology and climate, such as the coincidence of storm surges and extreme discharges in European deltas.
- The bibliography includes critical assessments of human influence on precipitation trends and the detection of climate change in extreme weather events.
The co-incidence of storm surges and extreme discharges within the Rhine–Meuse Delta.
Climate Extremes Bibliography
- The text provides a comprehensive list of scientific citations focusing on weather and climate extreme events in a changing global environment.
- Several studies examine the shifting dynamics of tropical cyclones, including their poleward migration, slowing translation speeds, and increasing intensity over recent decades.
- Research highlights the growing risk of concurrent climate hazards, such as simultaneous droughts and heatwaves in major agricultural 'breadbasket' regions.
- The bibliography includes investigations into how plant physiological responses to rising CO2 levels influence global runoff intensity and flood risks.
- Atmospheric patterns like Rossby waves and hemispheric wave-7 patterns are linked to the synchronization of extreme weather events across the globe.
- The citations cover diverse geographical impacts, ranging from drought propagation in the United States to ecosystem changes driven by El Niño events.
Amplified Rossby waves enhance risk of concurrent heatwaves in major breadbasket regions.
Climate Research Bibliography
- The text documents a comprehensive list of scientific studies focusing on extreme weather events, including storms, tropical cyclones, and heavy rainfall.
- Several citations explore the relationship between soil moisture anomalies and atmospheric circulation, highlighting their role in subseasonal forecast skill.
- Regional climate trends are examined in detail, specifically focusing on temperature indices in South Africa and desiccation trends in the South Asian monsoon.
- The research addresses methodological challenges, such as inconsistencies between long-term storminess trends in reanalysis data versus direct observations.
- Hydrological impacts are a key theme, with studies synthesizing climate change projections for large river basins and analyzing rain-on-snow flood variability.
Inconsistencies Between Long-Term Trends in Storminess Derived From the 20CR Reanalysis and Observations.
Climate Extremes Bibliography
- The text provides a comprehensive list of scientific citations focusing on weather and climate extreme events in a changing global environment.
- Research highlights include high-resolution atmospheric modeling of precipitation changes in East Asia and Panama using the MRI-AGCM3.2 model.
- Several studies investigate the anthropogenic influence on specific historical events, such as the 2018 European heat wave and Hurricane Sandy.
- The citations cover diverse geographical impacts, including sea ice-free summers in the Arctic, inundation patterns in the Amazon Basin, and monsoon shifts in Nigeria.
- Significant attention is given to tropical cyclone hazards, including their translation speeds, genesis scenarios, and observed changes in the Typhoon Committee Region.
Hurricane Sandy before 1900 and after 2100.
Climate Research Bibliography
- The text provides a comprehensive list of academic citations focusing on the attribution and projection of extreme climate events.
- Several studies highlight the increasing frequency and intensity of heatwaves in regions like Australia, Central Europe, and the Middle East.
- Research explores the critical role of vegetation physiology and land-cover change, such as deforestation, in altering local and global hydrologic cycles.
- The citations include investigations into specific drought events, such as those in the Amazon and the U.S. Southwest, under various warming scenarios.
- A significant portion of the work addresses the 'new normal' for temperature extremes within the context of the Paris Agreement warming limits.
Historical deforestation locally increased the intensity of hot days in northern mid-latitudes.
Climate Extremes Bibliography
- The text provides a comprehensive list of scientific citations focusing on the intensification of extreme weather events globally.
- Research highlights that very hot summers in the Northern Hemisphere, measured by wet bulb globe temperature, are projected to become the norm within 20 years.
- Multiple studies examine the emergence of anthropogenic signals in extreme precipitation patterns, particularly over China and South America.
- The data suggests that widespread persistent changes to temperature extremes have occurred earlier than climate models previously predicted.
- Comparative analyses of 1.5°C and 2°C warming scenarios illustrate the significant additional risks posed by even a half-degree of global temperature increase.
Recent Very Hot Summers in Northern Hemispheric Land Areas Measured by Wet Bulb Globe Temperature Will Be the Norm Within 20 Years.
Climate Extremes and Hydrological Research
- The bibliography highlights extensive research into precipitation and temperature extremes across Asia, particularly focusing on Singapore and Northwest China.
- Several studies examine the complex relationship between vegetation cycles and soil moisture, suggesting that earlier spring greening can exacerbate summer drying.
- Research indicates that precipitation extremes may be more sensitive to aerosol forcing than to greenhouse gas forcing in climate models.
- The text documents investigations into the increasing risks of hurricane surges and sea-level rises along the United States East Coast and Florida.
- Regional climate studies in the Mediterranean and Central Asia emphasize the contrasting impacts of global warming on drought and climate extremes.
- Data from Northwest China reveals coherent trends in wind speeds and changing pan evaporation rates in arid environments over several decades.
Summer soil drying exacerbated by earlier spring greening of northern vegetation.
Climate Extremes Bibliography
- The bibliography documents research on the global distribution of the most intense, deepest, and largest precipitation systems.
- Several studies highlight the increasing rates of hurricane precipitation and the intensification of drought extremes in China over the last half-century.
- Research indicates that human interventions, such as the Three Gorges Dam, have directly caused downstream lake shrinkage and severe droughts.
- A significant finding suggests that future droughts will become less predictable as global snowpack continues to decline.
- The text includes critical theoretical discussions on the inherent impracticality of establishing a single, universal definition for drought.
The Three Gorges Dam causes downstream lake shrinkage and severe droughts.
Global Climate Attribution Bibliography
- The text provides a comprehensive list of scientific studies focusing on the attribution of extreme weather events to human-induced climate change.
- Research highlights include the analysis of streamflow droughts in the Iberian Peninsula and the 2011 East African drought.
- Several studies examine regional shifts in temperature and precipitation, specifically focusing on heat waves and heavy rainfall in China and Argentina.
- Long-term historical perspectives are included, such as European summer temperature reconstructions dating back to Roman times and British flooding since 1750.
- The bibliography covers diverse hydrological impacts, including evapotranspiration changes in Slovenia and the expansion of the tropical climate zone.
European summer temperatures since Roman times.
Meteorological Research Bibliography
- The text provides a comprehensive list of academic citations focusing on extreme weather events and climate change impacts.
- Research topics include the evaluation of medium-range forecasts for major events like Hurricane Sandy.
- Several studies examine regional shifts in precipitation, such as monsoonal rainfall in India and flooding trends in the central United States.
- The bibliography highlights the use of high-resolution simulations to predict changes in hail and flood risks in mountainous regions.
- Scientific inquiries explore the relationship between anthropogenic climate change and planetary wave resonance.
- Data analysis covers diverse geographical areas including the Amazon, Northeast Brazil, Romania, and the Colorado mountains.
Extreme Hail Storms and Climate Change: Foretelling the Future In Tiny, Turbulent Crystal Balls?
Climate Research Bibliography
- The text provides a comprehensive list of scientific citations focusing on hydroclimate changes and extreme weather events across various global regions.
- Several studies highlight the increasing severity and frequency of droughts in Europe, the Mediterranean, and the United States' largest river basins.
- Research explores the attribution of extreme events, such as the 2014 Horn of Africa drought and the 2012–16 Northeast Brazil drought, to human-induced climate change.
- The bibliography includes investigations into compound extremes, such as the simultaneous occurrence of high winds and heavy precipitation.
- Data from paleoclimate archives and national climate studies are cited to provide historical context and future projections for temperature and precipitation trends.
Twentieth-century hydroclimate changes consistent with human influence.
Climate Extremes Bibliography
- The text provides a comprehensive list of scientific citations focusing on regional climate extremes in Syria, the Eastern Mediterranean, and the Arctic.
- Several studies examine the human impact of global warming, specifically regarding deadly heat stress and increased mortality during Indian heat waves.
- Research highlights the vulnerability of forests, predicting widespread conifer mortality and shifts in forest dynamics due to chronic temperature rise.
- Regional climate modeling explores the specific consequences of 1.5°C and 2°C warming thresholds for Southern and Central Africa.
- The bibliography includes investigations into coastal risks, such as storm tides in Fiji and sea-level extremes in Australia.
- Methodological advancements are noted, including the development of the Evaporative Demand Drought Index and calls for more systematic exploration of extremes in energy modeling.
Darcy’s law predicts widespread forest mortality under climate warming.
Climate Science Bibliographic References
- The text provides a comprehensive list of scientific citations focusing on global meteorological trends and extreme weather events.
- Key research areas include the intensification of landfalling typhoons in the northwest Pacific and the amplification of extreme precipitation due to sea warming.
- Several studies examine terrestrial near-surface wind speeds and their specific implications for global evaporation rates.
- Regional climate assessments cover diverse geographies including the Mediterranean Basin, Greenland, Northern Chile, Canada, and New Zealand.
- Ecophysiological research highlights the consequences of climate change on tree species performance and survival mechanisms.
Less bluster ahead? ecohydrological implications of global trends of terrestrial near-surface wind speeds.
Climate Extremes and Hydrological Impacts
- Scientific literature documents the increasing frequency and intensity of mega-heatwaves driven by soil desiccation and atmospheric heat accumulation.
- Research highlights the dwindling flow of the Colorado River, attributed to warming-driven loss of reflective snow cover which accelerates evaporation.
- Studies explore the compounding risks of sea level rise and fluvial flooding, creating complex challenges for coastal and riverine management.
- Regional climate modeling focuses on the reliability of predicting precipitation extremes and drought trends in specific areas like India and the central United States.
- Evidence suggests a common climatic threshold across diverse vegetation types that triggers widespread drought-induced tree die-off.
Colorado River flow dwindles as warming-driven loss of reflective snow energizes evaporation.
Climate Research Bibliography
- The text documents a wide range of studies on extreme weather events, including heat waves in the Mediterranean and intense rainstorms.
- Research highlights the shifting behavior of tropical cyclones, specifically their poleward movement and structural changes in global climate models.
- Several studies focus on hydrological impacts, such as drought persistence errors in climate models and a 250-year inventory of European droughts.
- The bibliography includes evidence of the 'broad threat to humanity' posed by cumulative climate hazards intensified by greenhouse gas emissions.
- Specific regional impacts are explored, such as storm surge projections in Japan and climate index comparisons between arid and humid basins in Mexico.
Broad threat to humanity from cumulative climate hazards intensified by greenhouse gas emissions.
Climate Extremes and Global Projections
- The bibliography documents significant shifts in temperature and precipitation trends across diverse regions including Egypt, the West African Sahel, and Tanzania.
- Research highlights the increasing frequency of extreme weather events, such as severe cyclonic storms in the Arabian Sea and major hurricanes in the North Atlantic.
- A critical projection suggests that historically hottest summers could become the norm for over half the global population within just two decades.
- Studies examine the causes of hydrological changes, including exceptionally low snowpack in the western United States and drying trends in northern hemispheric soil moisture.
- The text references the emerging field of paleotempestology and the necessity of bias correction in regional climate models to accurately assess river runoff and land climate impacts.
Historically hottest summers projected to be the norm for more than half of the world’s population within 20 years.
Climate Research Bibliography
- The text provides a comprehensive list of scientific citations focusing on high-resolution climate modeling and extreme weather events.
- Several studies examine the intensification and changing global distribution of category 4 and 5 hurricanes and typhoons.
- Research highlights regional climate impacts, including severe heat waves in India and drought characteristics in South Africa and Central America.
- The citations explore the relationship between global warming and the increased frequency of rare, extreme precipitation events.
- Specific environmental phenomena are addressed, such as tornadogenesis in Japan and the impact of the Three-Gorges Dam on flooding in China.
- The data includes investigations into how anthropogenic sulfate aerosols and CO2 enrichment affect regional climates and vegetation.
Frequency of extreme precipitation increases extensively with event rareness under global warming.
Climate Extremes Bibliography
- The text provides a comprehensive list of scientific citations focusing on extreme weather events, including heat waves, droughts, and floods.
- Research highlights regional climate impacts in diverse geographical areas such as Pakistan, Greece, Saudi Arabia, East Africa, and the U.S. Midwest.
- Several studies evaluate the accuracy of climate models (like CMIP5) in replicating historical trends and projecting future risks under various warming scenarios.
- A significant portion of the literature examines the relationship between rising global temperatures and the intensity of extreme precipitation and sea-level rise.
- The citations emphasize the collaborative nature of climate science, featuring community efforts to standardize cyclone detection and tracking algorithms.
Regional climate model simulations of extreme air temperature in Greece. Abnormal or common records in the future climate?
Climate Extremes Bibliography
- This bibliographic list documents scientific research on the sensitivity and dynamic amplification of extreme precipitation events.
- Several studies focus on regional climate impacts, specifically examining drought variability in India and the effects of global warming on the African continent.
- Research highlights the increasing threats to European infrastructure from heavy precipitation and the rising frequency of storm surges in the western North Pacific.
- The text includes historical reconstructions of tropical cyclone activity using geological evidence like sand beach ridges in Australia.
- Multiple entries explore the complex relationship between climate change and snowfall, including the contrasting responses of mean versus extreme wet snowfall in Japan.
Sand beach ridges record 6000 year history of extreme tropical cyclone activity in northeastern Australia.
Climate Extremes Bibliography
- The text provides a comprehensive list of academic citations focusing on extreme weather events, including heavy rainfall, heatwaves, and droughts.
- Several studies examine the Greater Horn of Africa and East Africa, projecting changes in temperature and precipitation under various global warming scenarios.
- Research highlights the emergence of 'flash droughts' in the United States, characterized by rapid onset and significant impacts on soil moisture and vegetation.
- The bibliography includes critical work on event attribution, attempting to distinguish between natural variability and anthropogenic climate change in specific disasters.
- Regional case studies cover diverse geographies, including the 2010 Russian heatwave, Swedish precipitation simulations, and water shortages in Southeast Brazil.
Flash droughts: A review and assessment of the challenges imposed by rapid-onset droughts in the United States.
Climate Attribution and Extremes Bibliography
- The text provides a comprehensive list of scientific citations focusing on the attribution of extreme weather events to human-induced climate change.
- Key research areas include the intensification of heavy precipitation events in regions like England, Wales, and India over several decades.
- Several studies examine the drivers of severe droughts, specifically highlighting the Western Cape water crisis and changes in dry-season water availability.
- The bibliography addresses the 'attribution question,' exploring how anthropogenic greenhouse gases increase the probability of high-impact events like Storm Desmond.
- Research also touches on the limits of human adaptability, projecting future temperatures in Southwest Asia that may exceed survivability thresholds.
- Methodological challenges are highlighted, including the difficulty of understanding extreme weather changes in lower-income countries and quantifying statistical uncertainty.
Future temperature in southwest Asia projected to exceed a threshold for human adaptability.
Climate Extremes and Hydrological Impacts
- Scientific literature documents the increasing risk of severe urban droughts, specifically highlighting the potential for 'Day Zero' scenarios in the 21st century.
- Research indicates that anthropogenic influences are significantly altering the intensity and behavior of major tropical cyclone events.
- Studies of the Amazon Basin reveal contrasting patterns in extreme drought episodes across different years, suggesting complex regional climate drivers.
- Urbanization is identified as a key factor in the intensification and increased spatial variability of extreme monsoon rainfall.
- Climate modeling explores the global implications of 1.5°C versus 2°C warming on extreme river flows and precipitation indices.
- Satellite data from the Orbiting Carbon Observatory tracks massive increases in carbon release during El Niño events, linking climate cycles to atmospheric composition.
Increasing risk of another Cape Town “Day Zero” drought in the 21st century.
Climate Research Bibliography
- The text provides a comprehensive list of academic citations focusing on extreme weather events, including precipitation trends and heatwaves.
- Several studies examine the specific impact of anthropogenic forcing on extreme weather, particularly in Australia and Southwestern Europe.
- Research highlights the evolving definition and measurement of 'extreme' precipitation and heatwaves in a changing climate.
- The bibliography includes specialized topics such as flash droughts, crop evapotranspiration, and the regional effects of aerosol emissions.
- A significant portion of the literature focuses on the Southern Hemisphere, specifically Australian temperature variability and midlatitude cyclones.
Flash droughts present a new challenge for subseasonal-to-seasonal prediction.
Climate Extremes Bibliography
- The text provides a comprehensive list of scientific citations focusing on the attribution of extreme weather events to climate change.
- Key research areas include the analysis of specific regional disasters, such as floods in France, Bangladesh, and the Alps, and droughts in Ethiopia.
- Several studies examine the mechanisms behind urban heat islands and the shifting patterns of heat waves in South America and the United States.
- The bibliography highlights methodological advancements, including protocols for probabilistic extreme event attribution and multi-model forecasting for wildfires.
- Research also addresses the physical dynamics of precipitation extremes, specifically the role of cyclones and atmospheric temperature in extratropical regions.
A protocol for probabilistic extreme event attribution analyses.
Climate Extremes Bibliography
- The text provides a comprehensive list of academic citations focusing on the intensification of global hydrological droughts and terrestrial water storage under climate change.
- Several studies examine the increasing frequency and volume of extreme precipitation events, specifically focusing on convective storms and hourly rainfall intensity.
- Research highlights regional climate modeling efforts, such as EURO-CORDEX, to assess severe weather hazards like damaging hail and heatwaves in Europe and North America.
- The bibliography includes investigations into human influence on record-breaking temperature events, including extreme cold in China and heatwaves in the Euro-Mediterranean region.
- Methodological advancements are noted in the homogenization of satellite soil moisture data and the evaluation of extratropical storm tracks in CMIP6 simulations.
Prein, A.F. et al., 2016b: The future intensification of hourly precipitation extremes.
Climate Research Bibliography
- The text provides a comprehensive list of academic citations focusing on regional climate trends, specifically in Iran, India, and the Indus River basin.
- Several studies examine the impact of irrigation and land-use changes on soil moisture and transboundary water flow in regions like North China and Jordan.
- Research highlights include projections of future precipitation extremes and heatwaves across Europe and the Alpine Region using multi-model assessments.
- The bibliography covers specialized meteorological phenomena such as 'Medicanes' in the Mediterranean and 'Atmospheric Rivers' affecting Europe and North America.
- Multiple entries focus on the development and application of soil moisture databases and land-surface model simulations for drought management.
Defining “Atmospheric River”: How the Glossary of Meteorology Helped Resolve a Debate.
Climate Extremes Bibliography
- The text provides a comprehensive list of scientific citations focusing on weather and climate extreme events across diverse global regions.
- Research highlights include the anatomy of Indian heatwaves and the impact of anthropogenic forcing on rainfall patterns in Victoria, Australia.
- Several studies examine Mediterranean climate dynamics, specifically focusing on winter dry spells and intense coastal precipitation events.
- A significant portion of the references investigates tropical cyclone activity, including human influence on Hurricane Florence and the impact of atmospheric dust.
- The bibliography covers advanced modeling techniques, such as convection-permitting regional simulations and high-resolution global models for cyclone simulation.
- Regional studies extend to mesoscale convective systems in the Amazon basin and record-breaking heat events in Northeast Asia.
Forecasted attribution of the human influence on Hurricane Florence.
Climate Research Bibliography
- The text lists academic studies focusing on the intensification of extreme weather events, including heavy rainfall in the French Mediterranean and thermal extremes in West Africa.
- Several citations explore the role of atmospheric rivers and compound events, which occur when multiple climate hazards like storm surges and precipitation happen simultaneously.
- Research highlights the impact of human-induced climate change on specific disasters, such as the increased magnitude of precipitation during Hurricane Harvey.
- The bibliography includes assessments of global freshwater availability and the simulation of tropical cyclones using high-resolution climate models.
- Regional studies examine specific environmental shifts, such as snowpack trends in the western USA mountains and streamflow droughts in Southern South America.
The role of atmospheric rivers in compound events consisting of heavy precipitation and high storm surges along the Dutch coast.
Climate Extremes and Global Projections
- The text provides a comprehensive bibliography of scientific studies focusing on the increasing frequency and intensity of heat waves, particularly in Europe and India.
- Research highlights the emergence of 'medicanes'—hurricane-like Mediterranean cyclones—and their projected risks under various climate models.
- Multiple studies examine the shifting patterns of extreme precipitation, including a noted threefold rise in widespread extreme rain events over central India.
- The bibliography addresses the hydrological impacts of climate change, specifically focusing on pluvial flood risks and the occurrence of droughts in European and tropical forest ecosystems.
- Scientific investigations explore the link between anthropogenic influences and specific extreme weather events, such as the 2014 rainfall in New Zealand.
- The collection includes regional assessments of climate vulnerability in diverse areas such as the Hindu Kush Himalaya, the Mediterranean, and North-Western Germany.
Death from drought in tropical forests is triggered by hydraulics not carbon starvation.
Climate Research Bibliography
- This section provides a comprehensive list of academic citations focusing on extreme weather events and climate variability across diverse global regions.
- Key research topics include the increasing frequency and intensity of heatwaves in Europe and Africa, as well as drought patterns in North America and New Zealand.
- Several studies evaluate the limitations of CMIP5 climate models, specifically their failure to accurately simulate historical trends in the Indian monsoon.
- The bibliography highlights the role of anthropogenic factors, such as warming and aerosol removal, in exacerbating soil moisture droughts and temperature distributions.
- Regional climate assessments cover a wide geographical range, including Kazakhstan, Brazil, Argentina, and the Bay of Bengal.
When will unusual heat waves become normal in a warming Africa?
Climate Extremes Bibliography
- The text provides a comprehensive list of scientific citations focusing on extreme weather events, including heatwaves in Iberia and the United Kingdom.
- Several studies investigate the intensification of precipitation and flooding, specifically examining events in West Africa, South America, and the United Kingdom.
- Research highlights the role of land-atmosphere interactions and vapor-pressure deficits in limiting tree growth and exacerbating hot Eurasian summers.
- The bibliography includes assessments of climate simulations aimed at comparing the impacts of 1.5°C versus 2°C global warming scenarios.
- Multiple entries explore the joint probability of nonstationary climate risks, such as the simultaneous occurrence of severe warm and dry conditions.
Multidimensional risk in a nonstationary climate: Joint probability of increasingly severe warm and dry conditions.
Climate Research Bibliography
- The text provides a comprehensive list of academic citations focusing on extreme weather events like heatwaves, droughts, and floods.
- Several studies examine the role of atmospheric blocking and spatial resolution in modeling European and Russian climate extremes.
- Research by Scheff and others investigates the relationship between CO2 levels, terrestrial aridity, and historical drought indices.
- The bibliography highlights the impact of global warming limits, specifically comparing the differential effects of 1.5°C versus 2°C.
- Specific regional hazards are addressed, including glacier lake outburst floods in Peru and urban precipitation modification by aerosols.
- The collection explores the physical drivers of climate variability, such as sea surface temperature (SST) and the amplification of 'mega-heatwaves' via upwind droughts.
Amplification of mega-heatwaves through heat torrents fuelled by upwind drought.
Climate Extremes Bibliography
- The text lists academic research focusing on the mechanics and regional impacts of weather and climate extremes, specifically regarding hydrological and atmospheric changes.
- Several studies investigate the origins of major droughts, such as the 2011–2014 California drought and soil moisture depletion in the southern Great Plains.
- Research highlights the role of plant physiological responses to CO2 and how missing these factors can lead to underestimating future regional warming.
- The bibliography covers specialized meteorological phenomena including explosive extratropical cyclones, tropical convective energy (CAPE), and glacial lake outburst floods in the Himalayas.
- Multiple entries examine the interaction between oceans and the atmosphere, particularly concerning vapor pressure deficits and moisture transport during torrential rainfall events.
Regional climate model projections underestimate future warming due to missing plant physiological CO2 response.
Climate Extremes and Feedback Bibliography
- The bibliography highlights critical research on the persistence of hot temperature extremes, noting there has been no pause in their increase.
- Several studies investigate the complex interactions between soil moisture and climate, specifically how these feedbacks influence CMIP5 climate projections.
- Research explores the relationship between the Paris Agreement's 1.5°C warming target and the resulting regional climate impacts and allowable CO2 emissions.
- The text includes investigations into biological vulnerabilities, such as the mechanisms of tree mortality through hydraulic failure and carbon starvation during climate stress.
- A significant focus is placed on shifting weather patterns, including the poleward migration of tropical cyclone formation and the expansion of the Hadley cell.
- The collection addresses a paradox in hydrology: why flooding may not be increasing at the same rate as precipitation extremes.
If precipitation extremes are increasing, why aren’t floods?
Climate Extremes Bibliography
- The text provides a comprehensive list of academic citations focusing on the physical drivers and future projections of extreme weather events.
- Several studies examine the specific impact of urbanization on Indian summer monsoon rainfall and general precipitation patterns.
- Research highlights the role of atmospheric circulation and convective mixing as primary sources of uncertainty in climate sensitivity and projections.
- The bibliography includes regional analyses of heat waves and droughts in diverse locations such as Ukraine, China, Korea, and the Amazon.
- Newer methodological frameworks, such as the 'storylines' approach, are introduced to better represent physical uncertainties in climate change.
- Comparative studies evaluate the consistency between station observations and reanalysis data for identifying extreme temperature events.
Storylines: an alternative approach to representing uncertainty in physical aspects of climate change.
Climate Science Bibliography
- The text provides a comprehensive list of academic citations focusing on the attribution of record-breaking temperature and precipitation extremes.
- Several studies examine the specific impacts of anthropogenic warming on droughts, fires, and CO2 emissions in equatorial Asia during El Niño events.
- Research highlights include projections of an ice-free Arctic under the Paris Agreement and the evaluation of climate extreme indices in CMIP5 models.
- The bibliography covers historical climate events, such as the global famine of 1876–78 and severe precipitation in northern India in 2013.
- Technical papers explore the influence of greenhouse gases versus aerosols on wet and dry conditions and the classification of floods in mountainous regions.
Singh, D. et al., 2018: Climate and the Global Famine of 1876–78.
Climate Extremes and Hydrological Impacts
- Research indicates an increasing potential for intense tropical and subtropical thunderstorms as a direct consequence of global warming.
- Studies evaluate the efficacy of dynamic regional models versus global models in projecting the complexities of the Indian monsoon.
- Analysis of climate extreme indices in South America reveals emerging signals of both warming and wetting trends across the continent.
- Investigations into European heat waves and pluvial flooding highlight the growing role of anthropogenic warming in driving extreme weather events.
- Scientists are refining multi-model projections of temperature extremes by utilizing land-atmosphere coupling diagnostics to improve accuracy.
- Hydrological research distinguishes between climatic drivers and geomorphic changes in determining shifting trends in global flood hazards.
Warming and wetting signals emerging from analysis of changes in climate extreme indices over South America.
Climate Research Bibliography
- The text provides a comprehensive list of academic citations focusing on the hydrologic cycle and extreme weather events.
- Several studies investigate the human influence on tropical cyclone intensity and their poleward migration patterns.
- Research highlights include the development of soil moisture drought indices and the evaluation of global drought trends since 1950.
- Geographic focus areas range from the Amazon basin and Central Africa to the Korean Peninsula and the Argentine Pampas.
- The citations explore the interplay between aerosols, greenhouse gases, and sea-surface temperatures in driving heatwaves and rainfall changes.
Aerosol versus greenhouse gas effects on tropical cyclone potential intensity and the hydrologic cycle.
Climate Extremes Bibliography
- The text provides a comprehensive list of scientific citations focusing on the increasing frequency and severity of drought events globally and specifically in Europe.
- Research highlights the evolution of heating and cooling degree-days in Europe, projecting significant changes through the year 2100.
- Studies examine the feedback loops between soil moisture and temperature during summer heatwaves, particularly in Western Europe.
- The bibliography includes evaluations of CMIP6 model simulations regarding extreme precipitation and tropical cyclone behavior under various climate scenarios.
- Regional focus is given to the Caribbean and Australia, documenting historical trends in temperature extremes, rainfall, and pan evaporation.
Will drought events become more frequent and severe in Europe?
Climate Research Bibliography
- The text provides a comprehensive list of academic citations focusing on the attribution and projection of extreme weather events.
- Significant research is highlighted regarding the frequency and intensity of tropical cyclones under global warming scenarios.
- Regional climate studies examine specific impacts in Europe, Africa, China, and the Arctic, particularly focusing on temperature and rainfall extremes.
- Several papers investigate the differences in climate impacts between 1.5°C and 2°C of global warming.
- The bibliography includes specialized studies on atmospheric drivers such as Saharan dust, Hadley circulation, and cloud-radiative feedbacks.
Ongoing Poleward Migration of Tropical Cyclone Occurrence Over the Western North Pacific Ocean.
Climate Extremes Bibliography
- The text provides a comprehensive list of academic references focusing on extreme weather events, including heat waves, droughts, and precipitation changes.
- Significant research highlights the increasing risk of extreme summer heat and heat waves in China, attributed to both global warming and urbanization.
- Studies examine regional climate shifts in diverse areas such as the Hindu Kush Himalaya, Indonesia, Southeast Asia, and California.
- Research explores the complex relationship between vegetation and climate, specifically how plant responses to CO2 levels influence drought severity assessments.
- The bibliography includes critical perspectives on how the IPCC and climate scientists should improve the communication and assessment of climate change risks.
Climate Science Needs to Take Risk Assessment Much More Seriously.
Global Climate Extremes Bibliography
- The text lists academic studies focusing on the historical trends and future projections of extreme rainfall in regions like Peninsular Malaysia, Nepal, and China.
- Research highlights a robust shift in climate zones over West Africa and prolonged drought risks in the Middle East due to anthropogenic climate change.
- Several papers investigate the specific roles of human-induced warming versus natural variability in extreme events, such as the 2015 Japanese heat wave.
- Studies examine the influence of aerosols on tropical cyclone activity and the environmental properties of catastrophic storm surges like Typhoon Haiyan.
- The bibliography includes technical analyses of moisture flux convergence and convective parameters to understand the dynamics of extreme precipitation intensity.
A Persistent Japanese Heat Wave in Early August 2015: Roles of Natural Variability and Human-Induced Warming.
Climate Extremes Bibliography
- The text documents a significant increase in extreme Sahelian storms, which have tripled in frequency since 1982 according to satellite data.
- Research highlights the complex relationship between soil moisture and precipitation, suggesting afternoon rain is more likely to occur over drier soils.
- Multiple studies examine the role of human intervention, such as irrigation, in mitigating the intensity of hot temperature extremes.
- The bibliography covers diverse geographical weather phenomena, including thunderstorms over Lake Victoria, floods in Alberta and Montreal, and tropical cyclones in the Southwest Pacific.
- Scientific focus is placed on the '1.5 vs 2.0 dilemma,' comparing the impacts of different global warming targets on Caribbean climates and future heat extremes.
Frequency of extreme Sahelian storms tripled since 1982 in satellite observations.
Climate Research Bibliography
- The text lists academic studies focusing on the intensification of hydrological cycles and river flooding under various global warming thresholds.
- Several citations examine the evolution of hurricane intensity and tropical cyclone genesis, particularly along the U.S. East Coast and North Atlantic.
- Research includes the evaluation of CMIP5 and CMIP6 climate models regarding historical temperature extremes and precipitation consistency.
- Specific regional studies address fire risk in China, drought in England and Wales, and tornado-spawning cyclones in Japan.
- The bibliography highlights the human influence on environmental hazards and the necessity for adaptation strategies in response to extreme weather events.
The Exceptional 2018 European Water Seesaw Calls for Action on Adaptation.
Climate Extremes and Attribution Bibliography
- The text provides a comprehensive list of academic citations focusing on the attribution and projection of extreme weather events globally.
- Research highlights include the study of 'medicanes' (Mediterranean hurricanes) and the future evolution of extreme precipitation in the Mediterranean region.
- Several studies investigate the specific causes of regional anomalies, such as the cold Eastern U.S. winters of 2014 and 2015, often finding they are not directly symptomatic of climate change.
- The bibliography covers diverse meteorological phenomena including supertyphoons, tornadoes from squall lines, and mesoscale convective complexes over Indonesia.
- Significant attention is given to hydrological impacts, specifically soil moisture trends in the Czech Republic and flood hazard observations in Africa.
- Methodological challenges are addressed, such as the credibility of global fluvial flood risk analysis and the application of bias correction for precipitation projections.
Extreme Eastern U.S. Winter of 2015 Not Symptomatic of Climate Change.
Climate Research Bibliography
- The text documents extensive research into extreme weather events, specifically focusing on heavy rainfall and flooding in Japan and Europe.
- Several studies examine the attribution of human influence on record-breaking temperatures and droughts in regions like Kenya and Central Europe.
- Research highlights the intersection of climate change and infrastructure, such as the increased costs to pavement systems due to rising temperatures.
- The bibliography includes foundational policy documents, notably the adoption of the Paris Agreement by the UNFCCC.
- Scientific investigations explore complex environmental feedbacks, including soil moisture-precipitation interactions and the impact of CO2 on vegetation and streamflow.
The twenty-first century Colorado River hot drought and implications for the future.
Climate Extremes and Hydrology References
- The text provides a comprehensive list of academic citations focusing on the intersection of climate change and extreme hydrological events.
- Several studies examine the attribution of specific disasters, such as the 2010 Pakistan floods, the 2011 Thailand floods, and Hurricane Harvey, to anthropogenic climate change.
- Research highlights the evolution of land surface models and the Land Surface, Snow and Soil moisture Model Intercomparison Project (LS3MIP) in predicting soil moisture and drought.
- A significant portion of the literature explores the 'human-modified world,' reframing how droughts are defined and managed in the context of human intervention and catchment structure.
- The citations cover diverse geographical regions, including southeast Australia's Millennium Drought, extreme heat in India, and flood-inducing precipitation in Louisiana.
Drought in a human-modified world: Reframing drought definitions, understanding, and analysis approaches.
Climate Science Bibliographic References
- The text lists academic publications focusing on the attribution of extreme weather events, such as the Australian bushfires and European heatwaves, to anthropogenic climate change.
- Research explores the mitigation of cold waves in northern midlatitudes and the potential to keep global temperature increases below 2°C via RCP2.6 scenarios.
- Several studies examine the dynamics of extreme precipitation and forest fire danger, specifically within the Mediterranean and European regions.
- The bibliography highlights the role of regional climate modeling (EURO-CORDEX) in projecting future climate impacts and understanding atmospheric stilling.
- Investigations into hydrological droughts and water scarcity reveal how human interventions cause scarcity hotspots to shift downstream over time.
Water scarcity hotspots travel downstream due to human interventions in the 20th and 21st century.
Climate Extremes Bibliography
- The text provides a comprehensive list of scientific references focusing on hydrological changes and climate extremes across various global regions.
- A significant portion of the research examines the drivers of drought, specifically the role of atmospheric evaporative demand and temperature rise.
- Studies investigate the impact of human interventions, such as reservoirs and irrigation, on river regimes and streamflow trends.
- The bibliography covers diverse geographical areas including Southern Europe, the Caribbean, Central America, the Nordic Arctic, and Southeast Asia.
- Research highlights include the influence of global mean temperature and ENSO on extreme rainfall and the simulation of tropical cyclones using GCMs.
Unraveling the influence of atmospheric evaporative demand on drought and its response to climate change.
Climate Extremes Bibliography
- The text provides a comprehensive list of scientific citations focusing on the intensification of extreme weather events globally.
- Research highlights the role of soil moisture-atmosphere feedbacks in amplifying temperature extremes and precipitation projections.
- Multiple studies document the human-induced nature of concurrent hot extremes across the Northern Hemisphere and Canadian temperature shifts.
- The bibliography includes critical assessments of compound flooding risks and the impact of atmospheric rivers on extreme winds.
- Significant attention is given to the relationship between rising sea surface temperatures and the amplification of summer precipitation.
- The citations explore the intersection of human water consumption and the intensification of hydrological droughts worldwide.
Concurrent 2018 Hot Extremes Across Northern Hemisphere Due to Human-Induced Climate Change.
Climate Extremes Bibliography
- This section provides a comprehensive list of academic references focusing on regional climate extremes, particularly in China and Australia.
- Research highlights include the attribution of human-induced climate effects on specific events like Hurricane Harvey's extreme rainfall.
- Several studies examine the spatiotemporal patterns of heat waves, hot spells, and temperature extremes using CMIP5 simulations and regional models.
- The bibliography covers hydrological changes, including global lake evaporation acceleration and the shifting evaporative demand over land.
- Studies explore the dependence between high sea levels and river discharge, which significantly increases flood hazards in global deltas.
Quantitative attribution of climate effects on Hurricane Harvey’s extreme rainfall in Texas.
Climate Science Bibliographic References
- The text provides a comprehensive list of scientific citations focusing on the modeling and observation of extreme weather events.
- Several studies examine the specific impacts of global warming at thresholds of 1.5, 2, and 3 degrees Celsius.
- Research highlights the 'deadly combination' of heat and humidity, particularly focusing on the 2015 heatwaves in India and Pakistan.
- The bibliography includes technical evaluations of the CMIP6 and CAM5.1 climate models regarding their horizontal resolution and predictive skill.
- Multiple entries investigate the anthropogenic influence on tropical cyclone intensity and the frequency of extremely hot days.
The Deadly Combination of Heat and Humidity in India and Pakistan in Summer 2015.
Climate Extremes Bibliography
- The text provides a comprehensive list of scientific citations focusing on the detection and attribution of human influence on extreme weather events.
- Several studies examine the historical context of extreme heat, including a comparison of the record-breaking 1540 European summer against modern heatwaves.
- Research highlights the increasing global trends in annual maximum daily precipitation and the changing intensity of short-duration extreme rainfall.
- The bibliography covers diverse geographical regions, including the Hindu Kush Himalaya, China, Australia, North America, and the tropical Western Pacific.
- Specific environmental factors such as soil moisture, forest extent, and surface roughness are analyzed for their impact on temperature and wind speed observations.
An underestimated record breaking event – why summer 1540 was likely warmer than 2003
Climate Science Bibliography
- The text provides a comprehensive list of academic citations focusing on the drivers of regional forest drought stress and tree mortality.
- Several studies highlight the significant contribution of anthropogenic warming to extreme events, including the California drought and North American megadroughts.
- Research explores the relationship between atmospheric moisture demand and record-breaking wildfire seasons in the Southwestern United States.
- The citations cover diverse geographical regions, including the Hindu Kush Himalayan region, the Okavango basin in Africa, and the Missouri River basins.
- Technical analyses investigate the impact of human interventions, such as dam-triggered land use changes and reservoir operations, on hydrological cycles.
Temperature as a potent driver of regional forest drought stress and tree mortality.
Climate Extremes and Hydrological Research
- Scientific literature documents a robust increase in extreme summer rainfall intensity in China over the last four decades.
- Research indicates a projected global increase in compound dry and hot events, which pose unique risks compared to single-variable extremes.
- Studies explore the dominant role of stratospheric ozone depletion in driving extreme precipitation and temperature trends in Southeastern South America.
- Hydrological investigations identify causes for declining streamflows in major systems like the Colorado River and evaluate reservoir evaporation rates.
- Climate modeling comparisons between CMIP5 and CMIP6 assess the accuracy of precipitation simulations and future drought trends under specific warming targets.
- The intersection of environmental shifts and public health is highlighted through research on the global impact of wildfires.
Recent Trends in Extreme Precipitation and Temperature over Southeastern South America: The Dominant Role of Stratospheric Ozone Depletion in the CESM Large Ensemble.
Climate Research Bibliography
- The research examines the propagation from meteorological to hydrological drought, specifically focusing on human impacts in northern China.
- Multiple studies utilize high-resolution global nonhydrostatic models to project changes in tropical cyclone activity, structure, and cloud height under greenhouse warming.
- Evidence suggests a significant increase in the number of tropical cyclones approaching Tokyo and a slowdown of typhoon translation speeds in mid-latitudes.
- Investigations into plant physiology reveal how elevated CO2 levels affect stomatal response and overall vegetation-driven hydrologic changes.
- Large ensemble climate projections are used to assess long-term storm surge impacts and the disconnection between atmospheric drying and continental runoff.
Slowdown of Typhoon Translation Speeds in Mid-latitudes in September Influenced by the Pacific Decadal Oscillation and Global Warming.
Climate Extremes Bibliography
- The text provides a comprehensive list of scientific citations focusing on the intensification of extreme precipitation in arid and transitional regions of Asia.
- Several studies investigate the anthropogenic influence on extreme temperature indices, specifically within China and the Tibetan Plateau.
- Research highlights the relationship between Arctic warming and the persistence of winter Ural blocking, which leads to extreme cold events in Eurasia.
- The bibliography includes assessments of moisture transport and upper-tropospheric troughs in relation to heavy rainfall events in Japan.
- Large-ensemble climate models are utilized to predict future changes in tropical cyclone activity and precipitation within extratropical cyclones.
- The citations explore atmospheric teleconnection patterns and their impacts on surface temperature anomalies across North America.
Increased Quasi Stationarity and Persistence of Winter Ural Blocking and Eurasian Extreme Cold Events in Response to Arctic Warming.
Climate Extremes and Hydrological Research
- The bibliography highlights extensive research into the increasing frequency and severity of droughts and compound extreme events in China.
- Studies evaluate the performance of CMIP5 and CMIP6 climate models in simulating soil moisture and extratropical cyclones.
- Research indicates that rising atmospheric vapor pressure deficit is a significant factor in reducing global vegetation growth.
- Specific regional assessments focus on thermal extremes in Pakistan and the intensification of flash droughts in Southern Africa.
- Global-scale hydrological models are being used to account for human impacts on mean and extreme runoff patterns.
- Agricultural impacts are quantified through studies on wheat yield losses caused by heat waves, droughts, and water excess.
Increased atmospheric vapor pressure deficit reduces global vegetation growth.
Climate Extremes Bibliography
- The text provides a comprehensive list of scientific references focusing on the modeling and observation of extreme weather events.
- Several studies investigate the behavior of tropical cyclones, including their poleward migration, motion changes, and sensitivity to modeling parameters.
- A significant portion of the research addresses drought trends and hydrological changes in regions such as Ethiopia, South Asia, and China.
- Comparative studies highlight the increased hazards to population and productivity when global warming reaches 2.0°C versus 1.5°C.
- Research also covers precipitation extremes and scaling in Central Europe and the Hindu Kush Himalayan region.
- The bibliography includes technical assessments of variable-resolution global models and algorithmic detection of climate data.
Larger Drought and Flood Hazards and Adverse Impacts on Population and Economic Productivity Under 2.0 than 1.5°C Warming.
Climate Research Bibliography: Zhang et al.
- A collection of scientific citations focusing on extreme weather events, including temperature shifts and precipitation changes.
- Several studies highlight the impact of anthropogenic forcing on climate patterns in China and the Tibetan Plateau.
- Research explores the intersection of urbanization and natural disasters, specifically regarding Hurricane Harvey in Houston.
- The data examines global land monsoon regions and the increasing frequency of extreme precipitation linked to global warming.
- Specific regional reports cover climate shifts in Canada, Australia, and the western North Pacific tropical cyclone activity.
Urbanization exacerbated the rainfall and flooding caused by hurricane Harvey in Houston.
Climate Extremes Bibliography
- The text provides a comprehensive list of scientific citations focusing on the intersection of climate change and extreme weather events.
- Research highlights include the impact of wildfires on environmental thermodynamics and the intensification of severe convective storms.
- Several studies examine the relationship between urban signatures and regional patterns of extreme precipitation in metropolitan areas.
- Significant attention is given to the dynamics of tropical and extratropical cyclones, including their frequency, rainfall area, and atmospheric river intensity.
- The bibliography covers diverse meteorological phenomena such as global drought trends, surface wind speed declines, and heat stress indicators.
- The citations reflect a global scope, with specific focus on North America, the China Seas, and the Northern Hemisphere lands.
Wildfire Impact on Environmental Thermodynamics and Severe Convective Storms.
Climate Research Bibliography
- The text provides a comprehensive list of academic citations focusing on climate modeling and extreme weather events across Australia, China, and Southeast Asia.
- Several studies investigate the attribution of specific record-breaking events, such as the 2017 Yangtze River Delta heatwave and the 2016 Wuhan extreme precipitation.
- Research highlights the complex role of land-atmosphere feedbacks in exacerbating soil drought and atmospheric aridity.
- The citations include evaluations of regional climate simulations and projections of water futures to support evidence-based decision making.
- Studies examine the impact of global warming levels, specifically 1.5°C and 2°C thresholds, on seasonal temperature extremes in Southeast Asia.
Land–atmosphere feedbacks exacerbate concurrent soil drought and atmospheric aridity.
Drought Metrics and Climate Extremes
- The text provides a comprehensive bibliography of research focusing on compound climate events and high-resolution simulations of future scenarios.
- Meteorological drought is defined primarily by precipitation deficits, utilizing indices like the Standardized Precipitation Index (SPI) and Consecutive Dry Days (CDD).
- Excess atmospheric evaporative demand (AED) is identified as a critical driver for agricultural and ecological droughts, impacting vegetation stress.
- Agricultural drought is characterized by soil moisture deficits, though monitoring is limited by sparse ground-based networks and relatively recent satellite data.
- Physically-based models, such as Penman–Monteith, are preferred for estimating evaporative demand over simpler temperature-based empirical estimates.
- The research highlights the increasing complexity of 'compound events' where multiple climate drivers interact to heighten environmental risks.
AED is an upper bound for actual ET but also induces additional vegetation stress under dry conditions.
Drought Indices and Regional Projections
- Soil moisture is computed using a variety of meteorological variables including precipitation, radiation, wind, temperature, and humidity.
- Hydrological drought is defined by deficits in streamflow and surface water, typically measured through indices like the Standardized Runoff Index (SRI).
- Atmospheric-based indices like the SPEI and PDSI combine precipitation and atmospheric evaporative demand (AED) for monitoring and early warning.
- The Mediterranean region shows high confidence in the observed increase of hot extremes and hydrological droughts.
- Future projections for the Mediterranean indicate that at 4°C of global warming, increases in hot extremes are virtually certain.
- While atmospheric indices are vital for early warning, they are explicitly not intended to serve as direct proxies for soil moisture or water balance.
These indices are not intended to be a soil moisture or water-balance proxy.
Regional Climate Extreme Projections
- The data provides a detailed breakdown of climate extreme projections across various African and Asian sub-regions, including the Sahara, West Africa, and Siberia.
- Hot temperature extremes show a consistent 'Virtually Certain' (V.C.) or 'Extremely Likely' (E.L.) increase across almost all regions as global warming reaches 4°C.
- Heavy precipitation events are projected to increase with high confidence in many regions, particularly in the Russian Arctic and Siberia, as temperatures rise.
- Agricultural and ecological droughts show varying levels of confidence, with significant increases predicted for Western and Eastern Southern Africa at higher warming thresholds.
- The data distinguishes between observed historical trends and future projections at 1.5°C, 2°C, and 4°C warming levels relative to pre-industrial baselines.
High confidence (including likely, very likely, extremely likely and virtually certain changes) increases.
Regional Climate Extreme Projections
- The data provides high-confidence projections for increasing hot temperature extremes across diverse global sub-regions including East Asia, South Asia, and Australia.
- Heavy precipitation events are projected to increase with medium to high confidence in several regions, particularly as global warming reaches the 4°C threshold.
- Agricultural and ecological droughts show varying confidence levels, with significant increases projected for Southern Australia and South-Central America at higher warming levels.
- The report utilizes a standardized confidence scale ranging from 'Low' to 'Virtually Certain' to categorize the likelihood of observed and attributed climate changes.
- Projections are benchmarked against both pre-industrial baselines and the more recent 1995–2014 period to illustrate escalating risks at 1.5°C, 2°C, and 4°C warming.
High confidence (including likely, very likely, extremely likely and virtually certain changes) increases.
Climate Extremes Across Sub-regions
- The data tracks confidence levels for changes in hot temperature extremes, heavy precipitation, and various forms of drought across global sub-regions.
- Confidence in the increase of hot temperature extremes reaches 'virtually certain' levels across almost all listed regions at the 4°C warming threshold.
- Agricultural and ecological droughts show high confidence of increasing in specific regions like the Mediterranean and South America as temperatures rise.
- Heavy precipitation events are projected to increase with medium to high confidence in Northern Europe and the Mediterranean at higher warming levels.
- The data compares projected changes against two distinct baselines: the pre-industrial era and the more recent 1995–2014 period.
High confidence (including likely, very likely, extremely likely and virtually certain changes) increases
North American Climate Extremes
- The data tracks confidence levels for changes in extreme heat, heavy precipitation, and drought across various North American regions.
- Hot temperature extremes show a consistent trend of high confidence increases across all listed regions, including Central and Eastern North America.
- Heavy precipitation events are projected to increase with high confidence in most regions, particularly in Central and Eastern North America.
- Agricultural and ecological drought risks show varying confidence levels, with medium to high confidence of increases in Western and Central North America.
- Hydrological drought trends generally show lower confidence levels for change compared to heat and precipitation extremes across the continent.
High confidence (including likely, very likely, extremely likely and virtually certain changes) increases
Climate Extremes Assessment
Weather and Climate Extreme Events in a Changing Climate.
Climate Extremes Assessment Framework
Box 11.2 | Changes in Low-likelihood, High-impact Extremes
Human Influence on Climate Extremes
- Human-induced greenhouse gas emissions are now an established cause of increased frequency and intensity in weather and climate extremes.
- Certain recent extreme heat events are considered extremely unlikely to have occurred without human interference in the climate system.
Some recent hot extreme events would have been extremely unlikely to occur without human influence on the climate system.
Escalating Global Temperature Extremes
- Future warming scenarios predict that temperature extreme intensity will increase proportionally to global warming levels, potentially quadrupling as warming moves from 1.5°C to 3°C.
Relative to present-day conditions, changes in the intensity of extremes would be at least double at 2°C, and quadruple at 3°C of global warming, compared to changes at 1.5°C of global warming.
Intensifying Precipitation and Drought Trends
- Atmospheric moisture capacity increases by approximately 7% for every 1°C of warming, leading to more frequent and intense extreme weather events.
- Projected 4°C warming could triple the frequency of rare 50-year precipitation events.
At the global scale, the intensification of heavy precipitation will follow the rate of increase in the maximum amount of moisture that the atmosphere can hold as it warms (high confidence), of about 7% per 1°C of global warming.
Drought Trends and Extreme Storms
- At 4°C of global warming, approximately 50% of all inhabited regions are expected to experience significant increases in agricultural and ecological droughts.
- The land carbon sink is expected to become less efficient under high-emission scenarios due to soil moisture limitations.
There is high confidence that the land carbon sink will become less efficient due to soil moisture limitations and associated drought conditions in some regions in higher-emissions scenarios.
Escalating Climate Extremes and Surprises
- Global food security is at risk as concurrent extremes are projected to affect multiple critical crop-producing regions simultaneously, especially above 2°C of warming.
With increasing global warming, some compound events with low likelihood in past and current climates will become more frequent, and there is a higher chance of occurrence of historically unprecedented events and surprises.
Scaling Climate Extremes
- Annual maximum one-day precipitation increases by approximately 7% per 1°C of warming, following the Clausius–Clapeyron relation.
The frequency of hot temperature extremes, the number of heatwave days and the length of heatwave seasons in various regions also scale well, but nonlinearly, with global mean temperatures.
Mechanisms of Climate Extremes
- Polar amplification weakens north-south temperature gradients, reducing cold air advection and potentially increasing the persistence of weather patterns like heatwaves.
While the water vapour feedback always amplifies the initial temperature increases (positive feedback), the lapse rate feedback amplifies near-surface temperature increases (positive feedback) in mid- and high latitudes but reduces temperature increases (negative feedback) in tropical regions.
Thermodynamics and Precipitation Extremes
- Increased latent heat release from higher moisture levels can intensify storms by strengthening convective updrafts and cyclonic circulation.
The extra latent heat released within storms has been shown to increase precipitation extremes by strengthening convective updrafts and the intensity of the cyclonic circulation.
Circulation Patterns and Climate Extremes
- While the overall amplitude of ENSO variability may remain stable, the frequency of extreme ENSO-related precipitation events is projected to increase.
Changes in weather systems come with changes in the frequency and intensity of extreme winds, extreme temperatures, and extreme precipitation, on the backdrop of thermodynamic responses of extremes to warming.
Regional Forcing and Climate Extremes
- Decreases in European aerosol concentrations since the 1990s have contributed to extreme heat as far away as north-east Asia through atmospheric feedbacks.
King et al. (2016b) show that aerosol-induced cooling delayed the timing of a significant human contribution to record-breaking heat extremes in some regions.
Regional Feedbacks and Climate Extremes
- Heatwaves and droughts can mutually amplify through a cycle of increased evapotranspiration, soil drying, and heightened sensible heat flux.
Finally, extreme events may also regionally amplify one another.
Projected Extreme Temperature Frequencies
- The frequency of extreme temperature events increases significantly as global warming levels rise, with 50-year events showing more dramatic relative increases than 10-year events.
Extreme temperatures are defined as the maximum daily temperatures that were exceeded on average once during a 10-year period (10-year event, blue) and once during a 50-year period (50-year event, orange) during the 1850–1900 base period.
Climate Extremes and Anthropogenic Forcing
- The Arctic is projected to experience the most extreme temperature shifts, with the coldest days warming at triple the rate of global warming.
Highest increase of temperature of coldest days is projected in Arctic regions, at about three times the rate of global warming.
Projected Climate Extreme Trends
- Compound events, such as concurrent heatwaves and droughts, will increase in frequency and intensity with every additional 0.5°C of warming.
High confidence that concurrent heatwaves and droughts will continue to increase under higher levels of global warming, with higher frequency/ intensity with every additional 0.5°C of global warming.
Climate Surprises and High-Impact Risks
- Scientific 'low confidence' in high-impact risks reflects a lack of data and knowledge rather than the impossibility of the events occurring.
The low confidence does not by itself exclude the possibility of such events occuring, rather it indicates a poor state of knowledge.
Extremes in a Non-Stationary Climate
- Events previously considered extreme, such as the 2018 Northern Hemisphere heatwaves, are becoming statistically common even at 1°C of warming.
As warming continues, the climate moves further away from its historical state we are familiar with, resulting in an increased likelihood of unprecedented events and surprises.
Escalating Risks of Compound Extremes
- The rapid pace of global warming creates a high confidence that societies will face historically unprecedented events and climate surprises.
With increasing global warming, some compound events with low likelihood in past and current climate will become more frequent, and there is a higher chance of historically unprecedented events and surprises.
Defining and Measuring Climate Extremes
- The sensitivity of an extreme event to global warming depends on its definition; temperature magnitude changes often scale linearly, while frequency changes can be exponential.
In the case of temperature extremes, changes in magnitude have been shown to often depend linearly on global surface temperature, while changes in frequency tend to be nonlinear and can, for example, be exponential for increasing global warming levels.
Contextualizing Extremes via Paleoclimate Records
- Historical evidence suggests that droughts of greater magnitude and duration than those in the instrumental record occurred during the preceding millennium.
Natural archives may be sensitive only to intense environmental disturbances, and so only sporadically record short-duration or small spatial-scale extremes.
Paleoclimate Evidence of Extremes
- Recent droughts in California and the Levant appear unprecedented in severity and duration compared to the last several centuries.
Recent observed drought extremes in some regions – such as the eastern Mediterranean Levant, California in the USA, and in the Andes – do not have precedents within the multi-century periods reconstructed in these studies, in terms of duration and/or severity.
Historical Climate Extremes Comparison
- Historical flood magnitudes in regions like Central Europe and East Asia have frequently exceeded those found in modern instrumental records.
In regions, such as Europe and China, that have rich historical flood documents, there is strong evidence of high-magnitude flood events over pre-instrumental periods.
Attributing Extreme Weather Events
- A significant limitation of conditional attribution is that the fixed variables, such as sea surface temperatures, may themselves be influenced by climate change.
These highly conditional approaches have also been called ‘storylines’ and can be useful when applied to extreme events that are too rare to otherwise analyse.
Emergence of Climate Extremes
- A difference of only 0.5°C in global warming, such as the gap between 1.5°C and 2°C, results in detectable differences in temperature extremes across most regions.
Overall, signals for extremes emerge very early for TXx, already below 0.2°C in many regions (Figure 11.8a,b), and at around 0.5°C in most regions.
Mapping Global Warming Levels
- High-emission scenarios like SSP5-8.5 are projected to reach the 2°C threshold as early as the 2032–2051 window.
Thereby, a given GWL is potentially reached a few years earlier or later in different realizations of the same model due to internal variability.
Global Warming Levels vs Scenarios
- Slow-responding variables like ice sheet volume and sea level rise are highly dependent on the timing and pathway taken to reach a warming level.
Slow-responding variables such as ice volumes of glaciers and ice sheets respond with a substantial delay and, due to their inertia, the response depends on when a certain GWL is reached.
Global Trends in Temperature Extremes
- Daily minimum temperature extremes (TNn) are warming faster than daily maximums, with the Arctic seeing particularly high increases in night-time temperatures.
Warming of land mean TNn is even higher, with about 3°C of warming since 1960.
Global Trends in Temperature Extremes
- Arctic annual minimum temperatures have risen at three times the rate of global surface temperatures since the 1960s.
Arctic annual minimum temperatures have increased at about three times the rate of global surface temperature since the 1960s.
Attributing Temperature Extremes
- Anthropogenic warming is estimated to be responsible for approximately 75% of moderate daily hot extremes occurring over land.
As much as 75% of the moderate daily hot extremes (above 99.9th percentile) over land are due to anthropogenic warming.
Attributing Extreme Temperature Events
- Recent studies identify an 'infinite risk ratio' for certain extreme events, meaning they are virtually impossible without human-induced climate change.
Several studies of recent events from 2016 onwards have determined an infinite risk ratio (a fraction of attributable risk, or FAR, of 1), indicating that the occurrence probability for such events is close to zero in model simulations without anthropogenic influences.
Scaling of Temperature Extremes
- The probability of extreme events increases nonlinearly, meaning rare events like 100-year heatwaves become disproportionately more frequent as warming progresses.
In the Arctic winter, the rate of warming of the temperature of the coldest nights is about three times the rate of global warming.
Urbanization and Heavy Precipitation Trends
- Urbanization intensifies extreme precipitation through mechanisms like the urban heat island effect and physical structures that impede atmospheric motion.
Urbanization intensifies extreme precipitation, especially in the afternoon and early evening, over the urban area and its downwind region.
Escalating Extreme Precipitation Projections
- A 2.0°C warming level is projected to more than double the frequency of 100-year extreme precipitation events compared to a 1.5°C scenario.
The CMIP5 model simulations show that the frequency for present-day climate 20-year extreme precipitation is projected to increase by 10% at the 1.5°C global warming level, and by 22% at the 2.0°C global warming level.
Atmospheric Demand and Drought Feedbacks
- Soil moisture deficits create self-intensifying feedback loops where reduced evapotranspiration leads to further atmospheric dryness and potential flash droughts.
In addition, soil moisture plays a role in drought self-intensification under dry conditions in which ET is decreased and leads to higher AED, an effect that can also contribute to triggering flash droughts.
Global Warming and Drought Projections
- Increased soil moisture limitation is projected to cause higher vegetation stress, which may reduce the efficiency of the global land carbon sink.
This stresses the dominant influence of ET (as a result of increased AED) in intensifying agricultural and ecological droughts in the warm season in many locations, including mid- to high latitudes.
Global Tropical Cyclone Trends
- A global poleward migration of the latitude where cyclones reach peak intensity has been identified, potentially linked to the expansion of the tropics.
The first metric – the mean latitude where TCs reach their peak intensity – exhibits a global and regional poleward migration during the satellite period.
The Nature of Compound Events
- Spatially concurrent extremes are increasingly threatening global food security by affecting multiple breadbasket regions simultaneously.
Many major weather- and climate-related catastrophes are inherently of a compound nature.
Human Influence on Concurrent Extremes
- Recent concurrent extreme events, such as the 2018 heatwaves and heavy rainfall in Japan, are virtually certain to have been impossible without human-induced global warming.
Hence, it is virtually certain that these 2018 concurrent events would not have occurred without human-induced global warming.