Corporate Finance
Overview unavailable.
The Vernimmen Finance Legacy
- The text serves as a collection of high-level endorsements for 'Corporate Finance: Theory and Practice', commonly known as 'The Vernimmen'.
- Industry leaders from organizations like the World Bank and Apax Partners highlight the book's long-standing relevance across decades of their careers.
- The manual is praised for its unique ability to merge rigorous theoretical frameworks with practical, real-world applications and common-sense reasoning.
- Academic and professional experts emphasize the book's comprehensive coverage, ranging from basic financial analysis to complex M&A transactions.
- The authors maintain the book's relevance through a monthly newsletter and regular updates that reflect evolving market developments.
- The text is positioned as an essential 'bible' for a diverse audience, including students, investment bankers, and industrial chairmen.
The Vernimmen is a true bible of corporate finance. With regular updates through their monthly newsletter and upgrades, the authors have made it applicable to any place, any time.

Publication and Copyright Information
- This text represents the fourth edition of 'Corporate Finance: Theory and Practice' published in 2014 by John Wiley and Sons.
- The publisher asserts strict copyright protections under the UK Copyright, Designs and Patents Act 1988, prohibiting unauthorized reproduction.
- The book is available in multiple formats, including print, electronic, and print-on-demand, with some variations in supplemental media.
- A legal disclaimer clarifies that neither the publisher nor the authors provide professional services or warranties regarding the book's contents.
- The work is cataloged by both the Library of Congress and the British Library, identifying it as a comprehensive resource on business enterprise finance.
It is sold on the understanding that the publisher is not engaged in rendering professional services and neither the publisher nor the author shall be liable for damages arising herefrom.
Corporate Finance Foundations
- The text introduces a prestigious team of authors including Pascal Quiry, Maurizio Dallocchio, Yann Le Fur, and Antonio Salvi, all of whom bridge the gap between high-level academic finance and professional M&A practice.
- It honors the legacy of Pierre Vernimmen, a legendary dealmaker who advised on the creation of LVMH and authored the definitive French financial textbook that serves as the foundation for this work.
- The comprehensive table of contents outlines a structured journey from fundamental financial analysis and cash flow mechanics to complex market theories and investment rules.
- The curriculum covers the diverse landscape of financial securities, including bonds, shares, options, and hybrid products, emphasizing the calculation of risk and required rates of return.
- The final sections focus on strategic corporate policies such as capital structure, dividend practices, and advanced financial engineering including IPOs, LBOs, and mergers.
Pierre Vernimmen, who died in 1996, was both an M&A dealmaker (he advised Louis Vuitton on its merger with Moët Henessy to create LVMH, the world luxury goods leader) and a finance teacher at HEC Paris.
The Philosophy of Corporate Finance
- The book integrates financial analysis with strategic and economic evaluation as a prerequisite for valuation.
- The authors bridge the gap between academic theory and professional practice based on their experience in M&A and investment.
- A primary focus is placed on enduring conceptual frameworks rather than transient technical methods.
- Corporate financiers are described as intermediaries who market financial securities to investors and bankers.
- The text emphasizes a value-oriented mindset over a traditional focus on costs or earnings.
A good financial manager listens to customers and sells them good products at high prices.
The Return to Reason
- Financial analysis is re-emerging as the cornerstone of economic decision-making following periods of market euphoria.
- A firm's long-term survival depends strictly on its ability to remain solvent and create value for shareholders.
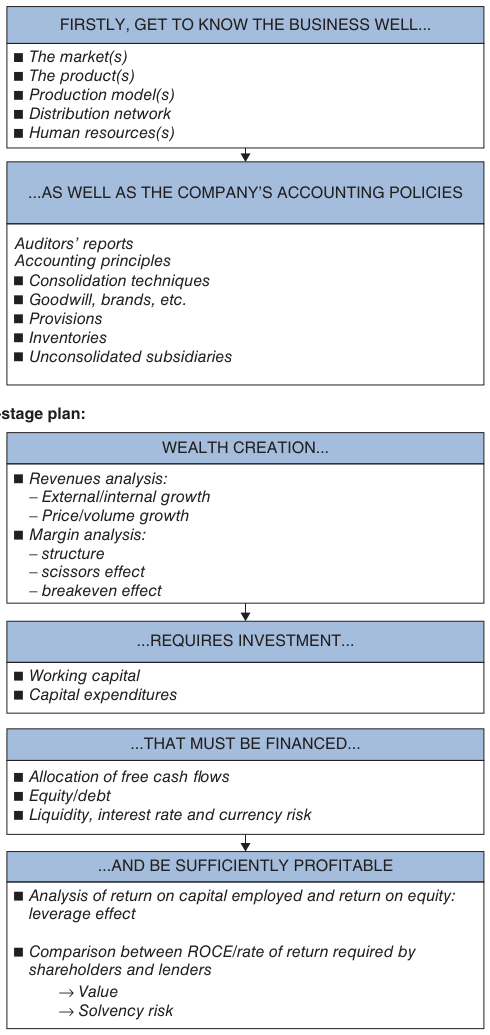
- The text outlines a rigorous framework for analysis including financial mechanics, accounting standards, and wealth generation.
- Section IV critiques the modern obsession with earnings per share and return on equity, which can distract from true value creation.
- The curriculum integrates theoretical concepts like agency theory and signal theory into practical corporate financial policies.
When share prices everywhere are rising, why stick to a rigorous approach? For one thing, to avoid being caught in the crash that inevitably follows.

Corporate Finance Learning Resources
- The book covers advanced corporate finance topics including mergers, LBOs, restructuring, and the intersection of finance and strategy.
- Pedagogical features include over 800 problems with solutions, a comprehensive index, and a one-page 'crib sheet' summarizing the entire 1000-page text.
- The companion website vernimmen.com offers free access to financial data for over 16,000 global companies and an Excel file with detailed problem solutions.
- Authors provide a direct communication channel via a letterbox, promising responses to reader questions within 72 hours.
- A free monthly newsletter supplements the text by analyzing topical financial problems, research papers, and current market statistics.
We’ve used the last page of the book to provide a crib sheet (the nearly 1000 pages of this book summarised on one page!).
Acknowledgements and Financial Symbols
- The authors express gratitude to a wide network of contributors, including academic peers, MBA students, and technical staff who refined the manuscript.
- A heartfelt dedication is made to the authors' families and friends for their patience during the long years of the book's production.
- The text transitions from personal acknowledgements to a comprehensive glossary of corporate finance abbreviations and symbols.
- The symbols list covers essential valuation metrics such as DCF, EBITDA, and NPV, alongside complex financial instruments like DECS and CVRs.
- The section establishes the book's dual purpose as both a foundational textbook for students and a reference guide for practicing professionals.
And last but not least to Françoise, Anne-Valérie, Enrica and Annalisa; our children Paul, Claire, Pierre, Philippe, Soazic, Solène and Aymeric and our many friends who have had to endure our endless absences over the last years.
The Role of Corporate Finance
- The financial manager serves as a vital intermediary between the real economy of goods and services and the complex world of financial markets.
- Traditional views define the financial manager as a buyer of capital focused on minimizing costs from bankers and shareholders.
- A modern perspective frames the financial manager as a seller of financial securities who aims to maximize their market value.
- The text distinguishes between the business manager, who handles operations and physical assets, and the financial manager, who manages capital supply.
- Corporate finance operates within a capital market economy where money is treated as the primary commodity for transaction.
The financial manager is at the crossroads of the real economy, with its industries and services, and the world of finance, with its various financial markets and structures.
The Financial Manager's Dual Role
- The traditional view defines the financial manager as a purchaser of capital whose primary goal is to minimize the cost of funds.
- This procurement role involves negotiating interest rates, value dates, and commissions with bankers and intermediaries.
- An alternative perspective frames the financial manager as a salesman who seeks to maximize the selling price of financial securities.
- In this 'salesman' model, the focus shifts from minimizing interest rates to maximizing the market value of the company's instruments.
- The capital market can be viewed symmetrically: the supply of securities equals the demand for capital, and vice versa.
- Ultimately, the equilibrium price in this market can be expressed either as the cost of funds or as the value of the security.
That said, let’s now take a look at the financial manager’s job from a different angle: he is not a buyer but a seller; his aim is not to reduce the cost of the raw material he buys but to maximise a selling price.
The Financial Manager as Salesman
- Interest rates and security values move in opposite directions, establishing a fundamental theorem that minimizing financing costs is synonymous with maximizing security value.
- Viewing the financial manager as a seller of securities shifts the focus toward understanding and satisfying the specific needs of capital suppliers.
- Financial markets are subject to trends and fashions, requiring managers to repackage financial products like convertible bonds or syndicated loans to meet current demand.
- Relying solely on the lowest cost of capital as a decision-making criterion is flawed because it ignores the varying risk levels faced by different investors.
- Short-sighted decisions, such as over-leveraging short-term debt or granting mortgages for minor rate decreases, can jeopardize a company's long-term survival.
- The phrase 'it doesn't cost anything' should be banished from corporate finance and replaced with an analysis of an action's impact on total value.
The most dangerous thing a financial manager can say is, “It doesn’t cost anything.”
The Essence of Financial Instruments
- A financial instrument is fundamentally a contract defined as a schedule of future cash flows executed over time.
- Holding a security represents the right to receive cash flows, while issuing one represents a commitment to pay them.
- The transition from paper documents to intangible book entries highlights that the core of finance is the underlying information and contract.
- Time is the critical element that introduces risk, as various external factors can disrupt promised payments regardless of a borrower's intent.
- Financial logic transforms physical goods and services into cash flows, allowing real assets like sugar or property to be traded as fungible financial instruments.
- Markets facilitate the negotiation between issuers seeking funds and investors seeking rights to future obligations.
Time, or the term of the financial security, introduces the notion of risk.
Defining Financial Instruments
- The distinction between a real asset and a financial asset often depends on the investor's motivation rather than the physical object.
- Financial securities are undifferentiated and can be held by many investors simultaneously, unlike unique physical assets like specific buildings.
- Mathematically, every financial instrument is defined as a series of future cash flows scheduled over a specific timeframe.
- Debt instruments represent a binding commitment from a borrower to repay a lender with interest.
- Loans transform into financial securities when they become negotiable and listed on secondary markets, such as bonds or commercial paper.
The distinction between a real asset and a financial asset is therefore subtle but fundamental.
Types of Financial Instruments
- Debt securities like commercial paper and treasury bills represent short-term loans where returns are contractually fixed or floating rather than profit-dependent.
- Equity securities represent capital contributions where investors bear industrial risk in exchange for profit shares and corporate voting rights.
- Limited liability structures protect shareholders by capping their potential losses at the amount of their initial investment.
- Hybrid securities created through financial engineering blur the lines between debt and equity to meet specific corporate and investor needs.
- Options represent a unique class of instruments that provide the holder with rights rather than obligations regarding future financial actions.
- Financial instruments exist on a broad spectrum ranging from strict commitments to flexible rights, all valued within the context of active markets.
Financial imagination knows no bounds. Keep in mind that these instruments are like the cherry on the top.
Primary and Secondary Markets
- A financial security exists independently of its issuer once launched, serving as a vehicle for various investor strategies.
- The primary market is the venue for 'newly-minted' securities where entities like corporations and governments raise fresh capital.
- The secondary market facilitates the trading of 'used' securities, allowing assets to change hands without creating new financial instruments.
- Liquidity is the defining feature of the secondary market, allowing investors to convert assets into cash quickly without significant price disruption.
- The secondary market is essential for long-term investments like equity, as it provides the only exit strategy for shareholders.
- While conceptually distinct, the two markets are functionally integrated, together balancing financing needs with available capital.
Once launched by its issuer, a financial security lives a life of its own.
Secondary and Derivative Markets
- Secondary markets operate independently of issuers, allowing investors to trade existing securities without affecting the company's capital formation statistics.
- The quality and liquidity of a secondary market directly dictate the success and pricing of the primary market for new securities.
- Financial managers must monitor secondary markets because they price the company's 'raw material' and facilitate the trading of voting rights and corporate control.
- Derivative markets, including futures and options, allow managers to hedge financial risks or take leveraged speculative positions with limited initial capital.
- The financial manager ultimately sells the management's reputation as the core value proposition behind any security issued.
Think about it: who would want to buy a financial security on the primary market, knowing that it will be difficult to sell it on the secondary market?

The Financial Manager's Mandate
- The financial manager's primary role is transforming industrial and commercial assets into financial instruments for diverse investor groups.
- A company's ability to distribute cash is strictly limited by its business operations; paying creditors or dividends without profit jeopardizes long-term health.
- Market perception acts as a real-time valuation of management quality, where poor performance leads to prohibitive yields and falling security prices.
- Investors are driven by expected rates of return rather than altruism, requiring the company to meet or exceed specific financial benchmarks.
- Value creation occurs only when investment returns exceed the cost of capital, while falling short leads to 'corporate purgatory' and value destruction.
- The financial manager must act as a strategic dealmaker, balancing the competing motivations and power dynamics of various capital providers.
If not, if the company is consistently falling short of this goal, it will destroy value, turning what was worth 100 into 90, or 80. This is corporate purgatory.

The Strategic Financial Manager
- The financial manager acts as a 'party-pooper' by rejecting projects that fail to meet profitability thresholds.
- A core responsibility is ensuring the company's assets generate a rate of return equal to or greater than investor requirements.
- Financial managers must act as strategists, recommending the sale of underperforming units to reallocate capital to efficient divisions.
- Modern financial management requires mitigating external risks such as interest rate fluctuations and currency volatility.
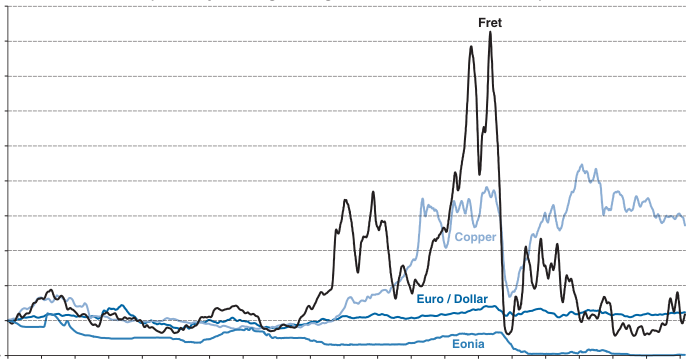
- Global operations create a 'multi-headed dragon' of risk where commodity prices and exchange rates dictate performance.
Its performance depends not only on the price of copper but also on the exchange rate of the US dollar vs. the Swiss franc, because it uses the dollar to make purchases abroad and receives payment in dollars for international sales.
The Evolving Role of CFOs
- Managing interest rate and exchange rate risks is essential as inaction can lead to severe financial consequences.
- Derivative markets allow treasurers to manage long-term risk efficiently without inflating the company balance sheet.
- The modern CFO has transitioned from a traditional accountant to a strategic leader skilled in marketing, negotiation, and risk management.
- Former CFOs are increasingly becoming top candidates for CEO positions at major global corporations like Siemens and Michelin.
- Effective financial management focuses on selling financial securities at high values rather than simply minimizing the cost of funds.
- A comprehensive understanding of corporate finance requires mastering financial analysis, market valuation, and value creation.
We are far from the CFOs of the sixties who were mainly top-of-the-class accountants!
The Roles of Financial Management
- The financial manager acts as a salesman who must understand investor needs to successfully market the company's securities.
- Value creation depends entirely on generating a rate of return that meets or exceeds the rate required by investors.
- A critical role of the manager is acting as a 'party-pooper' by rejecting investment projects that do not meet the cost of funds.
- The manager must transform real assets into financial assets while ensuring operational performance is protected from financial volatility.
- Failure to create value leads to declining security prices, management turnover, or eventual bankruptcy.
He must be a “party-pooper”, a “Mr No” who examines every proposed investment project under the microscope of expected returns and advises on whether to reject those that fall below the cost of funds available to the company.
Foundations of Financial Analysis
- Financial securities are defined as tradable contracts representing a series of future cash flows to be received according to a specific timetable.
- The secondary market vastly outweighs the primary market in volume, with trillions in shares exchanged compared to billions in new issuances.
- Risk and return are inextricably linked, with shares carrying higher risk than debt because returns are not guaranteed and creditors have priority.
- Market anticipation is the most critical factor in valuing securities, often outweighing current automatic reactions to interest rate changes.
- Firms face a strategic trade-off between lower short-term interest rates and the significant liquidity risk of constant refinancing.
- Cash flow is established as the fundamental building block for both security valuation and corporate financial analysis.
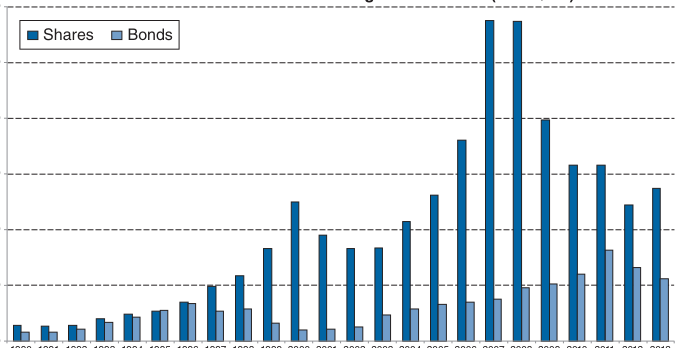
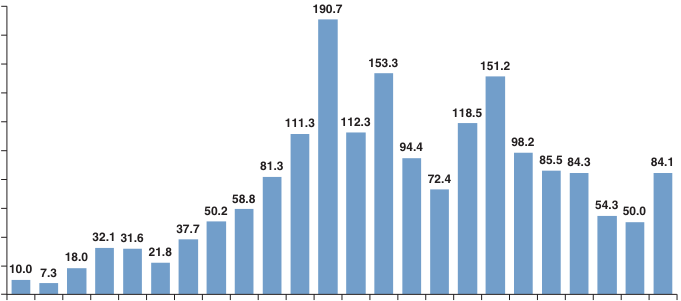
In 2013, worldwide, listed companies issued $191bn worth of new shares, whereas the value of shares exchanged was $52 467bn.
Cash Flow and Operating Cycles
- Financial managers reclassify cash flows into specific categories to analyze past trends and project future budgets.
- Company activities are divided into industrial/commercial processes (operating and investment) and financing activities (debt and equity).
- The operating cycle involves a time lag between the purchase of raw materials and the final sale of goods, which varies by industry.
- The length of the operating cycle can range from a single day in the newspaper business to seven years in the cognac industry.
- Credit terms from suppliers and to customers further complicate cash flow, as daily receipts rarely match daily sales.
A company processes raw materials as part of an operating cycle, the length of which varies tremendously, from a day in the newspaper sector to seven years in the cognac sector.
Operating and Investment Cash Flows
- Operating cash flow represents the net balance of cash generated by a company's day-to-day activities within a specific period.
- The length of an operating cycle varies by industry, typically increasing in duration as the end product becomes more sophisticated.
- Operating cash flow is uniquely objective because it remains independent of accounting policies like depreciation or inventory valuation.
- Investment outflows are distinguished from operating outlays by their long-term perspective, higher risk, and role as prerequisites for new activities.
- While operating cycles involve recurring timing differences, investments are intended to span and support multiple future operating cycles.
The outlay on the chest freezer seems to be a prerequisite. It forms the basis for a new activity, the success of which is unknown.
Investment and Free Cash Flow
- Investment is defined as the deliberate decision to forgo immediate gratification and consumption in exchange for greater future returns.
- The investment cycle is distinguished from the operating cycle by its significantly longer duration and its goal of enhancing future operating cash flows.
- Capital expenditures are financially justified only if the resulting inflows exceed the initial outlays by a margin that meets the investor's expected return.
- Free cash flow, the difference between operating cash flow and net capital expenditure, is a primary metric for valuation and determining funding needs.
- Financial resources, provided by shareholders and debtholders, exist to bridge the timing gaps between cash outflows and subsequent receipts.
Only the very puritanically minded would take more pleasure from buying a microwave than from spending the same amount of money at a restaurant!

The Dynamics of Financing Cycles
- Financial resources are provided with the expectation of rewards such as dividends, interest payments, or capital gains.
- Shareholders' equity serves as the cornerstone of the financial system, bearing the primary business risk in exchange for decision-making control.
- Debt capital involves firm commitments to repay principal and interest regardless of the company's operational success or failure.
- The financing cycle acts as the 'flip side' of investment and operating cycles, bridging the gap when free cash flow is negative.
- Lenders prioritize financial health and certainty of repayment, seeking to avoid direct exposure to the company's inherent business risks.
- Surplus cash flows are typically directed into short-term marketable securities to ensure liquidity and generate modest financial income.
The debt cycle is the following: the business arranges borrowings in return for a commitment to repay the capital and make interest payments regardless of trends in its operating and investment cycles.
Cash Flow and Debt Dynamics
- Short-term financial investments should be viewed as the opposite of debt rather than independent assets.
- Financial analysis is most effective when reasoning in terms of debt net of short-term investments and financial income.
- A simplified cash flow statement tracks the net decrease in debt by balancing operating, investment, and financing flows.
- Capital expenditures are strategic outlays designed to enhance the operating cycle and generate higher long-term profitability.
- Free cash flow is defined as the operating cash flow remaining after accounting for capital expenditure outlays.
- The operating cycle is defined by the inherent time lag between production costs and commercial receipts.
As a result, investors forego immediate use of their funds in return for higher cash flows over several operating cycles.
Financing Cycles and Debt Dynamics
- Companies with negative free cash flow must bridge funding gaps by raising equity or debt capital through the financing cycle.
- Equity returns are inherently unpredictable and tied to business success, whereas debt requires fixed repayments regardless of performance.
- Debt is conceptualized as an advance on future operating receipts, fundamentally guaranteed by the company's existing shareholders' equity.
- Financial analysis should focus on net debt and net financial expense by accounting for cash and marketable securities.
- Operating cash flow is distinct from accounting profit and serves as the primary source for satisfying both lenders and shareholders.
Accordingly, debt represents an advance on the operating receipts generated by the investment that is guaranteed by the company’s shareholders’ equity.

Cash Flow and Wealth Creation
- The text outlines a practical exercise for calculating monthly and annual cash flow requirements for a subsidiary with specific inventory and payment cycles.
- It emphasizes that negative free cash flows from operations and investments must be bridged by resources from the financial cycle, such as debt or equity.
- Operating cash flow is identified as the company's 'raison d'être,' which must remain positive in the long term to ensure business survival.
- Free cash flow represents the surplus available to lenders and shareholders after all operating and investment outlays have been settled.
- The transition from cash flow analysis to the income statement marks a shift toward understanding how various business cycles create accounting wealth.
- A distinction is made between cash flow and accounting profit, noting that insolvency is the inability to meet financial obligations regardless of theoretical profit.
If it is not positive in the long term, the company will be in trouble.
Wealth Versus Cash Flow
- Wealth and cash are distinct financial concepts that students and professionals often confuse.
- Purchasing an asset at market price or taking out a loan does not change net worth, only the composition of assets and liabilities.
- The income statement measures additions to and deductions from wealth, whereas the cash flow statement tracks the movement of liquid funds.
- Earnings represent the net change in wealth over a specific period, resulting from the difference between revenues and costs.
- The operating cycle is the primary engine for wealth creation, involving the transformation of resources into market-recognized value.
- Some financial transactions impact cash without affecting wealth, while others destroy wealth without immediate cash consequences.
Spending money does not necessarily make you poorer. Likewise, receiving money does not necessarily make you richer.
Earnings and the Investing Cycle
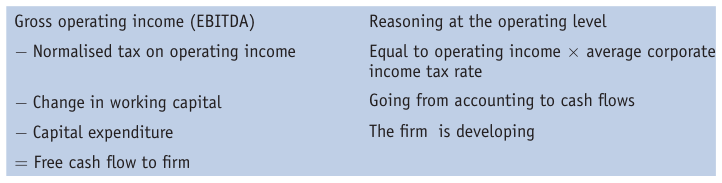
- Gross operating profit, or EBITDA, represents the balance of revenues and cash costs before non-cash expenses like depreciation.
- Investing activities are distinct from the income statement because they represent a use of funds that retains value rather than destroying wealth.
- Fixed assets undergo depreciation and amortization to account for the loss of value through use, which are considered non-cash costs based on accounting assessments.
- Impairment losses recognize unforeseen diminutions in value for tangible and intangible assets that are not related to daily operations.
- The fundamental distinction between operating costs and fixed assets lies in whether a resource is consumed during production or used repeatedly without being destroyed.
- Practical accounting often struggles to categorize certain outlays, such as advertising, which could be viewed as either a periodic charge or the creation of a long-term brand asset.
Without wishing to philosophise, we note that the act of creation always entails some form of destruction.
Operating Income and Financing Cycles
- Operating profit or EBIT represents the wealth generated by a company's core industrial and commercial activities, excluding financial operations.
- A fundamental distinction is made between the 'real world' of operations and the 'realms of finance' when calculating earnings.
- Repayments of debt principal are not considered expenses on the income statement because they do not decrease the company's net wealth.
- Interest payments on debt are recorded as expenses because they represent a genuine outflow of wealth to creditors.
- Net earnings and financial interest are both methods of distributing the wealth created by the company to different stakeholders.
- Dividends and share buy-backs are treated as cash position choices for shareholders rather than costs that measure wealth creation.
Just as common sense tells us that securing a loan does not increase wealth, neither does repaying a borrowing represent a charge.
Extraordinary Items and Income Formats
- Extraordinary items like natural disasters or government expropriations are categorized separately because they are infrequent and beyond management's control.
- Disinvestment is a strategic entrepreneurial activity that generates exceptional inflows and capital gains or losses, often complicating financial forecasting.
- Net income serves as a wealth indicator rather than a cash indicator, incorporating non-cash items like depreciation while ignoring unrealized value increases.
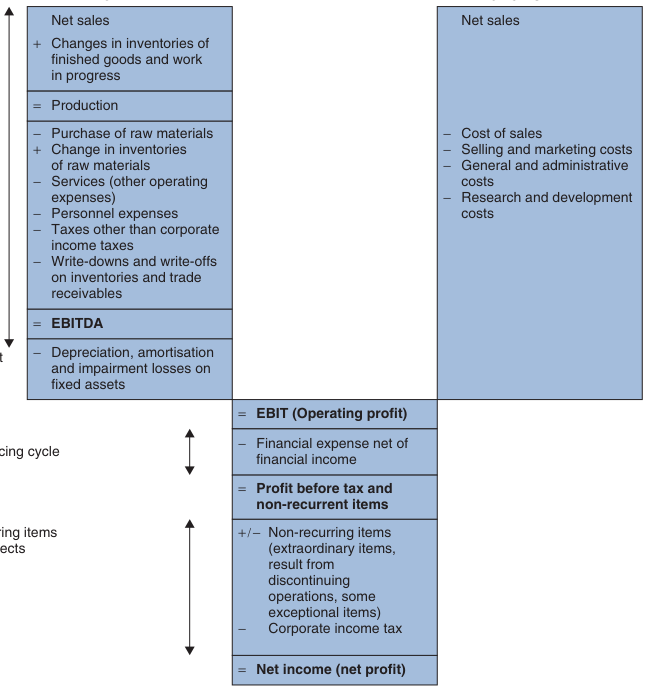
- Income statements are primarily formatted either 'by function' (e.g., cost of goods sold) or 'by nature' (e.g., personnel expenses and raw materials).
- While different countries favor specific formats, such as the US preferring 'by function,' the resulting operating profit remains identical regardless of the method used.
The best-laid plans may fail, while others may lead down a strategic impasse. Put another way, disinvesting is also a key part of an entrepreneur’s activities.
Income Statement Presentation Formats
- The 'by-function' income statement format allocates costs to specific corporate departments such as production, marketing, R&D, and administration.
- Global adoption of these formats varies significantly by country, with the UK and Morocco favoring 'by-nature' reporting while Germany and Japan lean toward 'by-function'.
- In a by-function model, personnel and depreciation expenses are fragmented across different categories based on the employee's role or the asset's use.
- A primary advantage of the by-function approach is that it clearly identifies the gross margin by subtracting the cost of sales from net sales.
- A significant drawback for analysts is that the by-function format obscures the distinction between operating and investment processes by hiding total depreciation.
On the other hand, it does not differentiate between the operating and investment processes since depreciation and amortisation is not shown directly on the income statement.
The By-Nature Income Format
- The by-nature income statement format is traditional in continental Europe and categorizes costs as they are incurred rather than by their function.
- This format is simpler for small companies to implement because it requires no complex allocation of expenses across departments.
- To maintain the accrual principle, adjustments must be made for changes in inventory to ensure the statement compares like with like.
- The format focuses on total production for the period rather than just the cost of goods sold.
- A logical disadvantage is that inventory changes can be misinterpreted as independent revenue or expenses rather than mere cost adjustments.
The transfer of these purchases to inventory does not destroy any wealth. Instead, it represents the formation of an asset, albeit probably a temporary one, but one that has real value at a given point in time.
Accounting Formats and EBITDA
- The by-nature format records all costs incurred during a period and adjusts for inventory changes, while the by-function format focuses on the cost of goods sold.
- EBITDA serves as a measure of profit generated by the operating cycle, independent of fixed asset valuation or taxation systems.
- A fundamental distinction exists between cash flow and wealth creation; spending money on assets does not necessarily reduce net worth.
- Inventory valuation methods significantly impact EBITDA, making the by-nature format useful for highlighting the magnitude of inventory changes.
- EBIT represents the profit from both operating and investment cycles, which is then allocated to financial expenses, taxes, and net income.
Spending money does not necessarily make you poorer and neither does receiving money necessarily make you any richer.
Accounting Principles and Wealth Creation
- The text explores the fundamental distinction between cash flow and wealth creation through complex R&D and acquisition scenarios.
- It challenges the assumption that EBITDA or net income directly translates to liquid cash or immediate shareholder enrichment.
- The section highlights the accounting treatment of inventories, depreciation, and non-cash expenses in different income statement formats.
- It examines the impact of asset sales and debt repayment on various levels of profitability, from operating profit to net income.
- The exercises require distinguishing between 'by-nature' and 'by-function' income statements to assess a company's financial health.
Analyse the similarities and the differences between cash and wealth, looking at, for example, investment in real estate and investment in research.


Financial Analysis and Reporting Exercises
- The text presents practical accounting exercises involving the creation of income statements using both 'by-nature' and 'by-function' formats.
- A case study of an Indian barrel manufacturer illustrates how inventory changes and production costs impact the calculation of EBIT.
- A magazine startup scenario explores the divergence between accounting profit and cash flow statements during the initial years of operation.
- The material distinguishes between wealth creation (accounting profit) and cash liquidity, noting that borrowings do not constitute income.
- The exercises emphasize that depreciation is a non-cash charge that reduces taxable income without requiring an immediate cash outflow.
- The text highlights that different asset classes, such as real estate versus R&D, have vastly different implications for wealth versus cash flow.
Confusion between additions to and deductions from wealth (which is an accounting issue) and cash: in the former, new borrowings do not add wealth to cover the losses.
Earnings and Income Statement Analysis
- The text distinguishes between cash receipts and accounting revenues, highlighting that non-cash expenses like depreciation represent an accounting valuation of destroyed wealth.
- Inventory adjustments are used to counterbalance costs in the income statement, ensuring that unsold products do not unfairly impact the current year's net income.
- Capital gains from the sale of fixed assets are typically treated as exceptional or non-recurring items unless the company's primary business is the regular sale of such assets.
- Financial managers face a measurement dilemma regarding non-cash and deferred charges because these figures are based on subjective accounting decisions rather than direct cash flow.
- A comparison of 'by-nature' and 'by-function' income statements demonstrates that while presentation formats differ, the resulting EBIT remains identical.
- Small company margins can appear artificially high when owners opt for lower wages and higher dividends to take advantage of more favorable tax rates.
A non-cash expense is a charge which does not reflect a specific expense, but an accounting valuation of how much wealth has been destroyed.

Earnings and Balance Sheet Fundamentals
- The text illustrates the 'by-function' income statement, categorizing costs into sales, marketing, and administrative buckets to arrive at EBIT.
- A practical example of a magazine startup demonstrates how advance subscription payments can serve as a primary financing mechanism for a project.
- Financial analysis transitions from a dynamic view of inflows and outflows to a static 'snapshot' of balances at a specific point in time.
- The balance sheet is defined as the arithmetic sum of all historical inflows and outflows since the inception of the business.
- Assets are categorized into fixed or non-current assets, representing items required for the operating cycle that are not consumed immediately.
If you can convince your clients to pay their subscription before they get the first issue, they will basically finance the project!
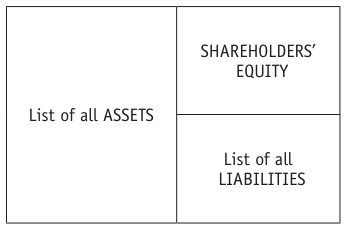
Anatomy of the Balance Sheet
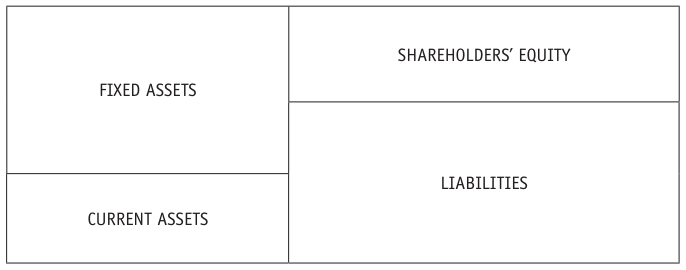
- The balance sheet is structured around the fundamental principle of double-entry accounting, where assets must always equal the sum of equity and liabilities.
- Assets are categorized into fixed assets (tangible and intangible) and current assets, which represent items that 'turn over' during the operating cycle like inventory and cash.
- Global accounting standards vary in presentation, with Europeans typically listing fixed assets first while North American and Japanese firms prioritize liquidity by starting with cash.
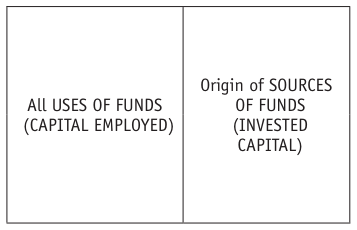
- A capital-employed perspective focuses on how a company uses and sources funds to drive its operating cycle and calculate rates of return.
- A solvency-and-liquidity perspective views the balance sheet as a list of everything owned versus everything owed to assess bankruptcy risk and net book value.
According to the algebra of accounting, assets and resources (equity and liabilities) always carry the opposite sign, so the equilibrium of the balance sheet is always maintained.
Capital Employed Balance Sheet Analysis
- Capital-employed analysis focuses on the 'stocks' of capital within an operating cycle rather than just cash inflows and outflows.
- Fixed assets should be categorized into operating and non-operating assets to identify core business investments versus disposable resources.
- Working capital represents the net balance between operating costs incurred but not yet used (inventories/receivables) and charges not yet paid (payables).
- A positive working capital balance indicates a need for financing, while a negative balance represents a rare source of funds generated by operations.
- The text argues against defining working capital as current assets minus current liabilities, as this conflates operating and financing cycles.
If negative, it represents a source of funds generated by the operating cycle. This is a nice – but rare – situation!
Working Capital and Capital Employed
- Operating working capital is calculated by combining inventories and trade receivables, then subtracting trade payables.
- Financial analysis requires adjusting working capital to exclude abnormal or speculative inventory levels and unusually long supplier payment periods.
- Working capital is independent of fixed asset valuation but is heavily influenced by inventory methods and provisioning policies.
- Non-operating working capital acts as a catch-all category for non-recurring items like amounts due on fixed assets and extraordinary items.
- Capital employed represents the total net amounts devoted to both operating and investing cycles, financed by equity and net debt.
Where it is permanent, the abnormal portion should be treated as a source of cash, with the suppliers thus being considered as playing the role of the company’s banker.
Debt and Capital Analysis
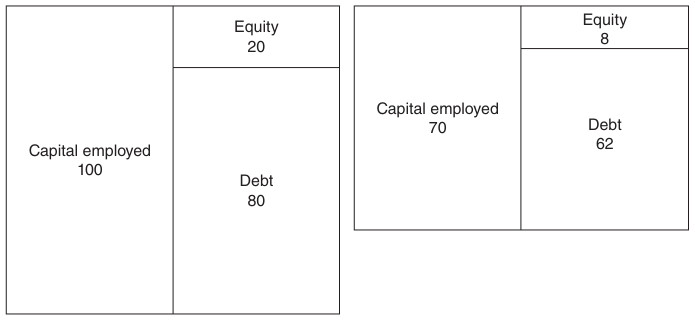
- Gross debt is defined as the sum of all medium-term, long-term, and short-term financial borrowings regardless of maturity.
- Net debt is calculated by subtracting cash, equivalents, and marketable securities from the total gross debt.
- A company with negative net debt is described as having 'net cash,' indicating its liquid assets exceed its total borrowings.
- Capital employed is the sum of fixed assets and working capital, which must equal the total invested capital (equity plus net debt).
- Solvency and liquidity analysis serves as a risk assessment tool for creditors and a valuation checklist for shareholders.
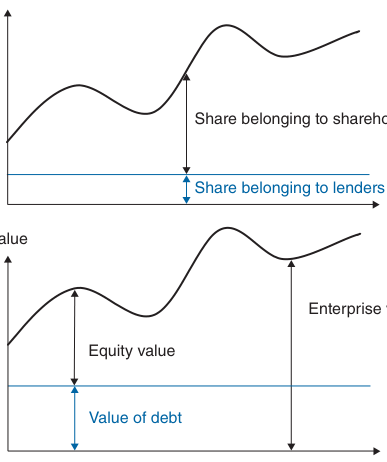
- In a liquidation scenario, shareholders' equity acts as the ultimate guarantee because creditors' claims are prioritized.
In a capitalist system, shareholders’ equity is the ultimate guarantee in the event of liquidation since the claims of creditors are met before those of shareholders.
Liquidity and Solvency Fundamentals
- Balance sheet items must be reclassified by duration to assess liquidity, distinguishing between short-term and long-term obligations based on a one-year threshold.
- Liquidity is defined by the speed at which assets are monetized through the operating cycle compared to the contractual maturity of liabilities.
- A fundamental rule of finance dictates that current assets must exceed short-term liabilities to provide a margin of safety for creditors.
- There is a structural tension between the predictable, contractual maturity of liabilities and the unpredictable, risk-prone liquidity of assets.
- Solvency is the measure of a company's ability to honor commitments during liquidation, occurring when shareholders' equity remains positive.
- The book value of equity represents the net asset value, calculated as the sum of all assets minus all existing and potential liabilities.
Consequently, the clearly defined maturity structure of a company’s liabilities contrasts with the unpredictable liquidity of its assets.
Capital Employed and Balance Sheets
- Acquirers often apply stricter valuation methods by including contingent liabilities and excluding intangible assets of zero value.
- The capital-employed balance sheet provides a snapshot of a company's cumulative inflows and outflows, categorized into assets and resources.
- Operating working capital is calculated by netting trade receivables and inventories against trade payables and social security liabilities.
- Invested capital is the sum of group equity and adjusted net debt, which must equal the total capital employed by the firm.
- Fixed assets represent the long-term investments made by a company, including tangible assets, goodwill, and equity in associated companies.
This very often applies to most intangible assets owing to the complexity of the way in which they are accounted for.
Capital Employed and Liquidity
- Capital employed is defined as the sum of fixed assets and working capital, representing the total resources used by a business.
- Invested capital, consisting of shareholders' equity and net debt, serves as the financing counterpart to capital employed.
- Net debt is calculated by subtracting cash, equivalents, and marketable securities from total bank and financial borrowings.
- Solvency analysis evaluates a company's ability to honor commitments during liquidation, while liquidity focuses on meeting obligations through ordinary business operations.
- The text distinguishes between operating working capital, driven by the business cycle, and non-operating working capital.
- A series of practical exercises challenges the reader to classify financial items and differentiate between accounting 'stocks' and 'flows'.
Solvency measures the company’s ability to honour its commitments in the event of liquidation, whereas liquidity measures its ability to meet its commitments up to a certain date by monetising assets in the ordinary course of business.
Reconciling Earnings and Cash Flow
- The text distinguishes between capital-employed analysis for fund usage and solvency-and-liquidity analysis for asset listing.
- It highlights that while income statements and cash flow statements use different methodologies, they must eventually converge over time.
- Specific industry dynamics, such as movie rights or pay TV, significantly alter the timing between invoicing and actual cash inflow.
- The transition from earnings to net debt change is identified as a fundamental step in understanding a company's financial mechanics.
- Assets are categorized by liquidity, ranging from listed securities to specialized physical plant equipment.
But common sense tells us that a rich woman will sooner or later have cash in her pocket, while a poor woman is likely to be strapped for cash – unless she should make her fortune along the way.
Earnings to Cash Flow
- Operating receipts differ from sales figures because of payment terms granted to customers and the timing of invoice settlements.
- Changes in inventories of finished goods are accounting entries that must be reversed in cash flow analysis because they have no immediate cash impact.
- Operating payments are derived from operating costs by adjusting for supplier credit terms and the difference between materials purchased versus materials used.
- The gap between accounting earnings and actual cash flow is primarily composed of timing differences related to deferred payments and deferred charges.
- The transition from EBITDA to operating cash flow is calculated by subtracting the change in operating working capital.
But this is merely an accounting entry to deduct from operating costs, those costs that do not correspond to products sold. It has no impact from a cash standpoint.
Earnings to Cash Flow
- The change in operating working capital represents the timing difference between wealth created (EBITDA) and actual operating cash flows.
- A positive change in working capital indicates a financing requirement, while a negative change acts as a source of funds.
- Capital expenditures impact the cash flow statement immediately upon purchase but are spread across the income statement via depreciation.
- The income statement and cash flow statement diverge significantly because accounting depreciation involves no actual cash outflow.
- Financing cycles involve inflows like new borrowings and outflows like dividends, which are treated differently in accounting versus cash analysis.
- Analyzing changes in working capital is considered a fundamental pillar of financial analysis due to the potential scale of timing differences.
As we shall see, it is important to remember that timing differences may not necessarily be small, of limited importance, short or negligible in any way.
From Earnings to Cash Flow
- Distinguishes between financial expenses that affect both earnings and cash versus capital movements that only impact cash.
- Explains that corporate income tax is a charge for state-provided infrastructure and services despite being a cash outflow.
- Provides a structural bridge between the income statement and the cash flow statement to calculate the decrease in net debt.
- Highlights the necessity of adding back non-cash charges like depreciation and amortization to net income to determine actual cash flow.
- Identifies the timing differences in the operating cycle, specifically working capital, as a key factor in cash availability.
- Notes that investing and financing cycles create fund movements that do not immediately impact net income.
Lastly, corporate income tax represents a charge that appears on the income statement and a cash payment to the State which, though it may not provide any financing to the company, provides it with a range of free services and entitlements, e.g. police, education, roads, etc.
Defining and Calculating Cash Flow
- Cash flow is calculated by adding non-cash charges like depreciation and amortization back to net income to show total internal financing.
- Traditional accountants distinguish between financial expenses and debt repayments, viewing the former as wealth reduction and the latter as liability management.
- To maintain relevance and avoid artificial volatility, cash flow should ideally exclude non-recurring items and capital gains or losses on asset disposals.
- The calculation of cash flow differs in consolidated accounts, where equity-accounted income is replaced by actual dividends received from associates.
- There is no universal definition of 'cash flow,' and the term is often used interchangeably with free cash flow or operating cash flow, requiring careful verification.
Lastly, readers should beware of cash flow as there are nearly as many definitions of cash flow as there are companies in the world!
Analyzing Cash Flow Cycles
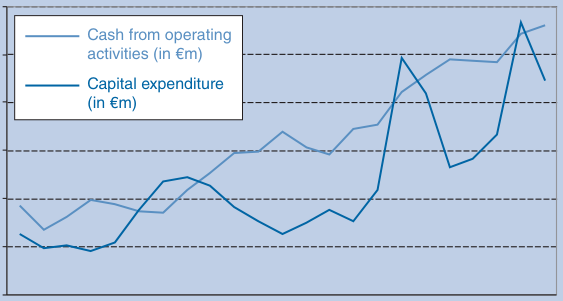
- Cash flow from operating activities is derived by adjusting raw cash flow for timing differences in the operating working capital cycle.
- The investment cycle tracks capital expenditures, asset disposals, and changes in long-term financial assets.
- The financing cycle encompasses capital increases, dividend payments, share buy-backs, and changes in net debt.
- Net debt is presented as a superior metric for assessing a company's true indebtedness compared to simple cash and equivalents.
- Most corporate cash flow statements utilize the indirect method, starting with net income and reconciling down to cash position changes.
- The Indesit case study illustrates how free cash flow is calculated by subtracting investing activities from operating activities.
Net debt reflects the level of indebtedness of a company much better than cash and cash equivalents or than cash and cash equivalents minus short-term borrowings, since the latter are only a portion of the debt position of a company.
From Earnings to Cash Flow
- The transition from income statement to cash flow perspective requires recreating operating cash flows by adjusting for timing differences and inventory changes.
- Operating working capital accounts for the gap between the generation of wealth (EBITDA) and actual operating cash flow.
- Capital expenditures create a disconnect between cash and income because the former records immediate payment while the latter spreads costs over a useful life.
- The cash flow statement treats capital and remuneration for financing differently than the income statement, which only shows interest and taxes.
- Net debt must be managed globally because increasing cash through long-term debt does not improve a company's actual net financial position.
- Cash flow only translates into actual cash on hand once adjusted for operating working capital, investment cycles, and financing cycles.
Cash on the balance sheet has increased but net debt is still the same.
Cash Flow vs Accounting Profit
- The text distinguishes between accounting wealth (net income) and cash position, noting that non-cash expenses like depreciation reduce profit but not cash.
- Cash flow is not a direct measure of wealth creation because it ignores the 'wealth destruction' caused by the wear and tear of fixed assets.
- Operating cash flow differs from EBITDA primarily due to changes in working capital, such as unpaid invoices and inventory fluctuations.
- Net debt is identified as a more reliable metric than cash position because year-end cash balances are easily manipulated compared to total indebtedness.
- Pure accounting entries, such as capital increases via incorporation of reserves, have no impact on the cash flow statement.
- The provided financial forecast illustrates how a company can experience negative cumulative cash balances despite consistent sales and production.
No, cash flow is not a measure of increase in wealth because it does not take into account depreciation, which reflects the wear and tear of fixed assets and thus a source of wealth destruction.
Earnings to Cash Flow
- The text provides a detailed walkthrough of financial statements for a Spanish subsidiary, illustrating the transition from net earnings to cash flow.
- Two different formats for the cash flow statement are presented, highlighting how EBITDA and net income serve as different starting points for analysis.
- The subsidiary demonstrates rapid financial recovery, with capital expenditures and working capital increases nearly repaid within three years.
- The balance sheet data tracks the evolution of capital employed and net debt, showing a shift from initial investment to a net cash position by 2016.
- The transition to Chapter 6 introduces the concept of consolidated accounts, which treat a group of companies as a single economic entity.
This outfit is profitable the first year, and capital expenditure and increase in working capital (30 + 36) are nearly entirely paid back at end-2016 after only three years of activity. It is almost too good to be true!
Principles of Consolidated Accounts
- Consolidated accounts aim to present a group of companies as a single financial entity rather than a collection of separate book values.
- Any firm exercising exclusive control or significant influence over other companies is generally required to prepare and certify group-level reports.
- Since 2005, listed European companies and many global groups have been mandated to follow IFRS accounting principles for consolidation.
- The scope of consolidation is determined by the parent company's material influence, typically assumed at a threshold of 20% of voting rights.
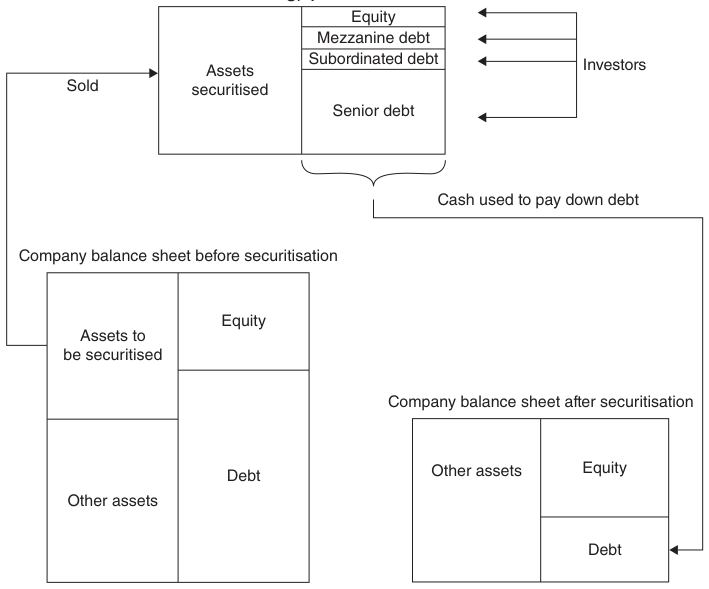
- Consolidation replaces the historical cost of a parent's investment with the actual assets, liabilities, and equity of the subsidiary.
- Two primary methods exist for reporting: full consolidation for controlled subsidiaries and the equity method for associates with significant influence.
The basic principle behind consolidation consists of replacing the historical cost of the parent’s investment in the company being consolidated with its assets, liabilities and equity.
Mechanics of Full Consolidation
- Full consolidation is triggered by control, defined as the power to direct strategic policies to access benefits, often through majority voting rights or board control.
- Under IFRS, exclusive control is the primary criterion, whereas US GAAP traditionally focuses on majority voting rights but can encompass minority-held entities.
- The process involves transferring all of a subsidiary's assets, liabilities, revenues, and costs directly onto the parent company's financial statements.
- Parent company investments in the subsidiary are eliminated and replaced by the subsidiary's actual accounts to avoid double counting.
- Minority interests represent the portion of equity and net income belonging to third-party shareholders and are reported separately from the parent's equity.
- While minority interests count as equity for solvency analysis, they are excluded from the group's valuation as they belong to external parties.
Nevertheless, the definition is broader and can encompass companies in which only a minority is held (or even no shares at all!).
Consolidation and Equity Accounting
- Full consolidation assumes a parent company economically controls 100% of a subsidiary's assets and liabilities, regardless of the legal ownership percentage.
- Minority interests represent the specific portion of equity and net income belonging to outside shareholders in a partially-owned subsidiary.
- The equity method is required when a parent company exerts significant influence, typically defined as holding at least 20% of voting rights.
- Significant influence is evidenced by board participation, strategic decision-making, or technical dependence rather than just ownership stakes.
- The International Accounting Standards Board (IASB) views the equity method as a valuation tool rather than a true consolidation method.
- Under the equity method, the carrying amount of shares is replaced by the group's proportional share of the associate's equity and net income.
This is true from an economic, but not from a legal, perspective.
The Equity Method and Control
- The equity method replaces the historical cost of an investment with the parent company's share of the associate's equity and net income.
- Accounting for associates via the equity method is described as a reevaluation of participating interests rather than a full consolidation of assets and liabilities.
- A significant limitation of the equity method is that it fails to reflect the group's total risk exposure or liabilities regarding the associate.
- The scope of consolidation is determined by the level of control, which is primarily measured by the percentage of voting rights held.
- Control is generally assumed at a 50% voting threshold or through de facto control, distinguishing it from the simple level of ownership.
The equity method of accounting is more a method used to reevaluate certain participating interests than a genuine form of consolidation.
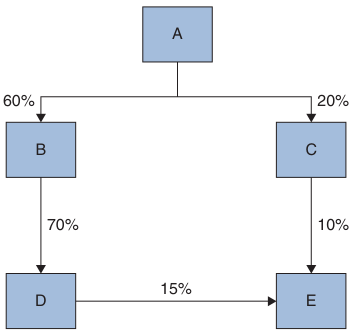
Ownership Levels and Consolidation Scope
- Ownership level is a financial concept representing the parent company's claim on capital, distinct from the power-related concept of control.
- The ownership level is calculated as the sum of the products of direct and indirect percentage stakes across a corporate hierarchy.
- Full consolidation uses ownership levels to allocate net income and reserves between the parent company and minority interests.
- Excluding subsidiaries from consolidation can be a tactic to hide losses or liabilities, often utilizing Special Purpose Vehicles (SPVs).
- Modern accounting standards like IFRS and US GAAP require consolidation of SPVs if the parent company bears the residual risks or enjoys the majority of benefits.
- Proforma financial statements are essential for analysts to compare performance consistently when the scope of consolidation changes.
These techniques have been developed to make certain consolidated accounts look more attractive.
Understanding Goodwill and Acquisitions
- Acquisition prices often exceed a target company's book value due to unrecorded assets like patents, market share, or brand reputation.
- Buyers may pay a premium to capture potential synergies, such as cost reductions or revenue enhancements, or to block competitors from entering a market.
- The difference between the purchase price and equity is split into latent capital gains on specific assets and a residual amount known as goodwill.
- Under the purchase method, acquired assets and liabilities are revalued to fair market value and aligned with the parent company's accounting policies.
- Goodwill is not amortized but must undergo an annual impairment test to ensure its market value remains at least equal to its recorded book value.
The buyer may be ready to pay a high price for a target just to prevent a new player from buying it, entering the market, and putting the current level of the buyer’s profitability under pressure.
Goodwill and Acquisition Accounting
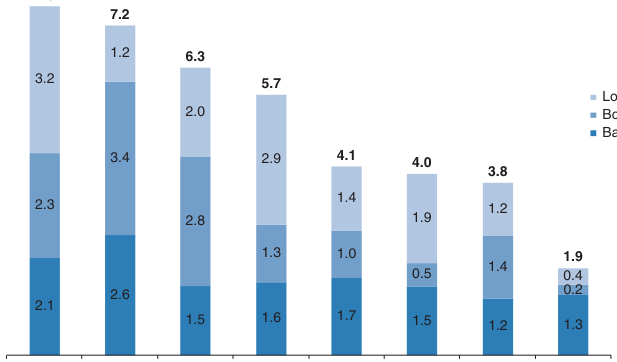
- The acquisition of Bulgari by LVMH illustrates how the purchase price is allocated between tangible assets, brand revaluation, and residual goodwill.
- LVMH paid a significant premium over Bulgari's equity, resulting in the creation of €1,375m in new goodwill after adjusting for brand value and liabilities.
- Under IFRS, negative goodwill is treated as an immediate profit in the income statement, though it occurs only under specific circumstances.
- Financial analysts are advised to treat goodwill impairment as a non-recurring item and exclude it from earnings per share or return calculations.
- Goodwill is viewed as having a limited lifespan because market competition eventually erodes the high profitability initially gained through an acquisition.
- While impairment charges are non-cash items, they represent a genuine decrease in company wealth and shareholder equity value.
As we know, goodwill has a limited lifespan in view of the competition prevailing in the business world that will, sooner or later, erode too high a profitability obtained after an acquisition.
Acquisitions and Consolidation Mechanics
- Overpaying for acquisitions with shares is just as detrimental as using cash, as it results in shareholder dilution without proportional growth.
- The 'cake and guests' analogy illustrates how wealth diminishes when asset growth fails to outpace the increase in the number of shares issued.
- Financial analysts use 'adjusted income' in specific sectors to neutralize the P&L impact of asset revaluations following a merger.
- Consolidation requires harmonizing accounting data across subsidiaries to eliminate discrepancies caused by local tax laws or varying valuation methods.
- The consolidation process is simplified by the fact that consolidated accounts are generally not used for calculating taxable income.
They accept this dilution because they take the view that the size of the cake will grow at a faster rate (e.g. by 30%) than the number of guests invited to the party (e.g. by over 25%).
Mechanics of Financial Consolidation
- Consolidation requires the elimination of intra-group transactions to prevent the reporting of fictitious gains or double-counting profits.
- Significant transactions affecting net income, such as intra-group inventory profits and dividends, must be reversed to maintain financial accuracy.
- Non-fundamental transactions, including parent-to-subsidiary loans, are eliminated through netting to reflect the group's true debt levels.
- Translating foreign subsidiary accounts is complicated by fluctuating exchange rates and varying inflation rates that can distort asset values.
- Fixed assets in soft-currency countries may maintain their value due to inflation offsetting devaluation, whereas liquid assets depreciate in tandem with the currency.
An entirely fictitious gain would show up in the group’s accounts if the relevant products were merely held in stock by the subsidiaries rather than being sold on to third parties.
Foreign Subsidiary Consolidation Methods
- The closing rate method is the standard for economically independent subsidiaries, translating all assets and liabilities at the balance sheet date exchange rate.
- The temporal method is used for integrated subsidiaries, distinguishing between monetary items at closing rates and non-monetary items at historical rates.
- Currency translation differences are handled differently across methods, appearing either in shareholders' equity or directly on the income statement.
- Hyperinflationary environments require a specialized method involving restatements via a general price index to account for chronic currency devaluation.
- Consolidation is mandatory for groups where a parent company holds at least 20% of voting rights, aiming to present the group as a single financial entity.
A hyperinflationary country is one where inflation is both chronic and out of control.
Mechanics of Consolidated Accounts
- Full consolidation replaces parent company investments with the subsidiary's total assets and liabilities when voting rights exceed 50%.
- The equity method is applied for associates where the parent holds significant influence, typically between 20% and 50% of voting rights.
- A critical distinction exists between the level of control (voting rights) and the ownership level (capital share) for accounting purposes.
- Goodwill is recorded as an intangible asset when a parent pays more than the book value for a company's equity.
- Consolidation requires the elimination of intra-group transactions, such as dividends and internal profits, to ensure data consistency.
- Foreign subsidiary accounts are translated using either the closing rate or temporal method, with special rules for hyperinflationary economies.
The level of control is used to determine which consolidation method is applied. The ownership level is used to separate the group’s interests from minorities’ interests in equity and net income.
Consolidation Methods and Complex Accounting
- The text provides a practical exercise comparing full consolidation (80% stake) with the equity method (20% stake) for a group's financial statements.
- Full consolidation results in the inclusion of minority interests, reflecting the portion of a subsidiary's equity and earnings not owned by the parent group.
- Goodwill is defined as the premium paid over the fair value of a subsidiary's net assets and must be tested annually for impairment.
- The equity method is described not as a consolidation of line items but as a method for revaluing the investment asset based on the associate's performance.
- A paradox exists where a group can register a profit or loss without receiving cash due to changes in their share of a subsidiary's equity.
This chapter is rather different from the others. It is not intended to be read from start to finish, but consulted from time to time, whenever readers experience problems interpreting, analysing or processing a particular accounting item.
Navigating Complex Financial Accounts
- The text outlines a three-pronged methodology for analyzing complex financial issues: economic substance, accounting treatment, and financial resolution.
- A comprehensive list of complex line items is provided, ranging from accruals and deferred taxes to off-balance sheet commitments and stock options.
- Accruals are defined as mechanisms to transfer revenue or costs between the profit and loss statement and the balance sheet to ensure they match the correct period.
- Prepaid costs and deferred income are identified as key components of operating working capital rather than just static accounting entries.
- Cash assets are strictly defined as highly liquid, short-term investments with negligible risk of value change to qualify as cash equivalents.
- The methodology encourages readers to develop independent problem-solving skills for financial issues not explicitly covered in the text.
To accrue basically means to transfer revenue or costs from the P&L to the balance sheet.
Accounting for Complex Assets
- The 2007-2008 liquidity crisis revealed that many supposedly safe monetary investments were actually volatile and illiquid.
- Financial analysts must distinguish between assets contributing to operating earnings and those that are purely financial investments to properly calculate net debt.
- Construction contracts are typically accounted for using the percentage of completion method to spread profits across the duration of long-term projects.
- The completed contract method, used in some US contexts, is more conservative as it defers revenue recognition until project completion but provisions for all anticipated losses immediately.
- Analysts monitor changes in construction accounting methods because shifts can be used to artificially manipulate a company's reported net income.
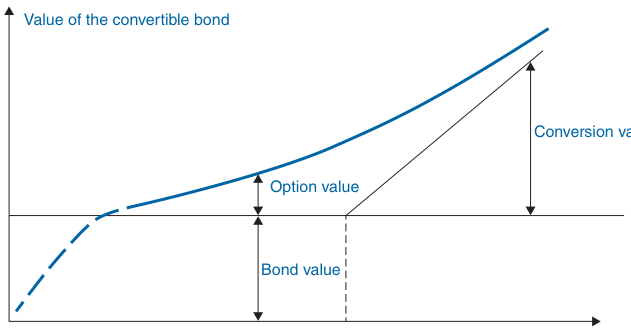
- Convertible bonds are treated as compound financial instruments under IFRS, requiring allocation between debt and equity accounts upon issuance.
Analysts should be aware of changes in accounting methods for construction contracts as such changes may indicate an attempt to artificially improve the published net income for a given year.
Accounting for Convertible Bonds
- Convertible bonds are hybrid instruments composed of a straight bond component and a call option.
- Initial accounting splits the instrument into debt based on fair borrowing rates and equity for the remainder.
- Financial analysts should classify convertibles based on the likelihood of conversion rather than fixed labels.
- If the share price exceeds the conversion price, the bonds should be treated as equity and interest expenses reversed.
- When the share price is below the conversion price, the instruments are treated as standard borrowings.
- Deferred tax assets and liabilities arise from temporary differences between taxable and book values of assets.
For instance, if the share price already lies well above the conversion price, the bonds are very likely indeed to be converted, so they should be treated as equity.
Managing Deferred Tax Accounting
- Accounting profit and taxable profit often diverge due to timing differences in when revenues and charges are recognized.
- Permanent differences occur when specific items, such as tax penalties or fines, are never considered for tax purposes and thus do not trigger deferred tax.
- Temporary differences between an asset's book value and its tax base create deferred tax liabilities or assets on the balance sheet.
- Deferred tax liabilities often arise from asset revaluations during consolidations or capitalized costs that are immediately tax-deductible.
- Deferred tax assets can be generated from tax-loss carryforwards or provisions that only become deductible when a liability actually materializes.
- Companies are required to recognize all deferred tax liabilities, but assets are only recognized if it is probable they will be used to reduce future payments.
Deferred tax assets arising from tax losses should be recognised when it is probable that the deferred tax asset can be used to reduce tax to be paid.
Mechanics of Deferred Taxation
- IFRS standards strictly prohibit the discounting of deferred tax assets and liabilities to their net present value.
- Contingent taxation, such as taxes triggered by future asset sales or dividend distributions, is not recorded on the balance sheet.
- Deferred tax assets often lack economic underpinnings and do not represent actual cash flows or amounts currently due from tax authorities.
- Tax-loss carryforwards are recognized as assets only if there is a reasonable expectation of future profits to offset them.
- Financial analysts should treat deferred tax assets as fixed assets rather than working capital, as they cannot be sold for cash.
- Discrepancies between real cash flows and accounting entries often arise from provisions like retirement benefits that are not immediately tax-deductible.
It is important to recognise that deferred taxation does not represent an amount of tax currently due to or from the tax authorities, but consists of accounting entries with, most of the time, no economic underpinnings and with no corresponding cash flows.
Accounting for Deferred Taxes
- Deferred tax assets and liabilities arise from timing differences between accounting recognition and actual tax payments.
- A deferred tax credit on a balance sheet represents tax already paid that is considered a future expense from an accounting perspective.
- Unlike physical inventories, deferred tax assets have no intrinsic monetary value and are often viewed as accounting constructs rather than liquid assets.
- Asset revaluation during consolidation creates deferred tax liabilities to account for the gap between book value and tax basis.
- The authors advocate for simplifying financial analysis by canceling deferred tax assets against provisions or deducting liabilities from goodwill.
Unlike inventories of raw materials which have been paid for and which are also a future expense, deferred tax has no monetary value.
Dilution and Hedging Accounting
- Dilution profits occur when a subsidiary issues new capital at a valuation higher than its book value without the parent company participating.
- Accounting for dilution results in a non-recurrent gain on the parent's books, representing the implicit profit of a partial deemed sale.
- Financial analysts should disregard dilution gains as they do not involve cash flow and do not reflect a company's recurring earning power.
- Financial hedging instruments like swaps and options are used to mitigate risks from fluctuating exchange rates, interest rates, or commodity prices.
- Under IFRS, derivatives must generally be recorded at fair value on the balance sheet, with value changes impacting the income statement.
- Hedge accounting is a complex system that allows companies to offset these value changes, provided they can prove the hedge is perfectly adjusted to the risk.
They are, by their very nature, non-recurring. Otherwise, the group would soon not have any subsidiaries left.
Fair Value and Cash Flow Hedges
- Fair value hedges protect against changes in the value of existing assets or liabilities, such as fixed-rate debt.
- Cash flow hedges secure the value of future transactions, such as a chocolate producer fixing the price of cocoa.
- IFRS rules allow companies to offset gains and losses on the income statement to prevent accounting distortions.
- Financial analysts must distinguish between speculative transactions and genuine hedging operations.
- Operating hedges should be integrated into EBIT and capital employed, while financial hedges are attached to net debt.
The application of these principles could lead to an absurd situation.
Impairment and Intangible Assets
- Impairment losses are capital reserves set aside to cover anticipated decreases in the value of tangible and intangible assets.
- The recoverable value of a Cash Generating Unit (CGU) is determined by the higher of its value in use or its net selling price.
- Financial analysts typically treat impairment on tangible assets as non-recurring, while impairments on goodwill are viewed as non-operating items.
- Intangible assets like brands and customer lists cannot be recognized if they are internally generated; they must be expensed as incurred.
- Start-up costs, including incorporation and advertising, are expensed under IFRS and should be deducted from equity by analysts as they hold no intrinsic value.
Internally generated goodwill, brands, mastheads, publishing titles and customer lists should not be recognised as intangible assets.
Accounting for Intangible Assets
- Research costs are generally expensed immediately under IFRS due to their unpredictable nature, while development costs can be capitalized if specific feasibility and marketability criteria are met.
- US GAAP maintains a stricter stance than IFRS, generally prohibiting the capitalization of research and development costs except for specific web developments.
- Financial analysts are cautioned to monitor capitalized development costs closely, as they can sometimes be used to mask operational losses.
- Brands and market share are only recorded on balance sheets when acquired from third parties, creating a valuation gap for companies with internally grown brands.
- Major luxury groups like LVMH carry massive brand values on their balance sheets, often treating them as assets with indefinite lives that are tested for impairment rather than amortized.
- While some conservative analysts value brands at zero, the text argues that brands are essential components of a company's true economic value.
For instance, what value would a top fashion house or a consumer goods company have without its brands?
Intangibles and Inventory Valuation
- The book value of intangible assets often inversely correlates with their actual market value due to tax minimization strategies and accounting policies.
- Ailing companies may inflate intangible assets to artificially maintain positive net profit and shareholders' equity.
- Inventories are categorized into raw materials, work in progress, and finished goods, each with specific valuation rules based on acquisition or production costs.
- Production costs must be calculated based on normal activity levels to avoid deferring losses and artificially inflating current year profits.
- IFRS and US GAAP differ slightly on the inclusion of interim interest payments in inventory costs, though general administrative costs are typically excluded.
- The choice between weighted average cost, FIFO, and identified purchase cost methods significantly impacts a company's reported net income.
To sum up, our approach to intangible fixed items is as follows: the higher the book value of intangibles, the lower their market value is likely to be; and the lower their book value, the more valuable they are likely to be.
Inventory Valuation and Financial Analysis
- The IASB prohibits the LIFO method for interchangeable items, while US GAAP continues to permit it alongside FIFO and weighted average cost.
- During inflationary periods, the FIFO method results in higher reported net income compared to LIFO by valuing withdrawals at the oldest, lowest costs.
- Changes in inventory valuation methods must be disclosed as they can artificially inflate profits or mask losses, complicating period-to-period comparisons.
- Managers may be reluctant to scale down production during low demand because running down overvalued inventory leads to a decrease in net income.
- Analysts are advised to prioritize cash flow from operating activities over net income when inventory valuations are speculative or lack market benchmarks.
- Inventory valuation methods generally have no impact on a company's actual cash position, excluding tax-related effects.
Inventories are merely accruals (deferred costs), which are always slightly speculative and arbitrary in nature, even when accounting rules are applied bona fide.
Inventory Valuation and Leases
- The text advocates for replacement cost accounting to recognize inventory gains and losses immediately rather than waiting for sales.
- Delayed recognition of losses, as seen in the Japanese banking crisis, can exacerbate financial instability compared to immediate write-downs.
- Leases are categorized into operating leases and finance leases, with the latter transferring most ownership risks and rewards to the lessee.
- Finance leases are capitalized under IFRS, appearing as both fixed assets and financial debt on the balance sheet.
- Accounting for finance leases replaces rental costs with depreciation and financial expenses on the income statement.
The companies would have recognised losses in one year and then posted decent profits the next instead of resorting to all kinds of creative solutions to defer losses.
Leases and Off-Balance-Sheet Commitments
- Operating leases are treated as rents rather than capitalized assets, which can obscure a company's true fixed-cost burden and breakeven point.
- Sale and leaseback transactions require specific accounting adjustments where capital gains are deferred for finance leases but recognized immediately for operating leases.
- Off-balance-sheet commitments represent unrealized transactions, such as contingent assets or liabilities, that are disclosed in notes rather than the main balance sheet.
- Financial analysts must scrutinize these commitments to assess 'accounting ingenuity' and identify impending financial obligations like purchase commitments or guarantees.
- Under IFRS rules since 2009, firms are required to account for all potential liabilities even if they are difficult to measure, increasing transparency for investors.
It is therefore very important to analyse off-balance-sheet items because they reflect: the degree of accounting ingenuity used by the company.
Accounting for Employee Benefits
- Employee benefits encompass a wide range of commitments including pensions, severance payments, healthcare benefits, and life insurance.
- Defined contribution plans are straightforward to account for as the employer's obligation is limited to making regular payments to an external organization.
- Defined benefit plans require complex accounting because the employer guarantees a specific level of future benefits based on salary and length of service.
- The liability for defined benefit plans is calculated using the projected unit credit method, which incorporates demographic assumptions like mortality and staff turnover.
- Annual net pension costs in the income statement consist of service costs, interest costs, and the theoretical return on plan assets.
- International and US accounting standards now require the inclusion of all employee liabilities, including post-retirement medical costs and severance payments.
The method used to assess the actuarial value is the projected unit credit method, which models the benefits vested with the entire workforce of the company at the assessment date.
Accounting for Pensions and Preference Shares
- Retirement benefit provisions should be treated as financial debt rather than simple operating liabilities, functioning similarly to zero-coupon bonds.
- Financial analysts should separate pension service costs from interest costs, classifying the latter as financial charges rather than operating expenses.
- Preference shares occupy a hybrid space between equity and debt, often offering fixed dividends and liquidation priority in exchange for no voting rights.
- Under IFRS, preference shares are classified based on 'substance over form,' becoming debt if they include mandatory redemption or fixed dividends.
- Provisions act as an anticipation of future costs, reducing net income in the year they are set aside to neutralize the impact when the actual charge occurs.
- The classification of preference shares as equity depends on whether returns are linked solely to earnings and if there is no repayment commitment.
Our view is that provisions for retirement benefit plans are very similar to a financial liability vis-à-vis employees.
Restructuring and Employee Incentives
- Restructuring provisions are used to cover costs like site closures and redundancies, often smoothing future earnings performance.
- Accounting standards require a formal decision and announcement to third parties before a restructuring liability can be recorded.
- Financial analysts debate whether restructuring charges should be classified as operating or non-operating items.
- The authors argue that in a rapidly changing world, restructuring is often structural and should be charged against operating profit.
- Provisions for decommissioning industrial sites, such as nuclear plants, are treated as net debt due to their long-term nature.
- Stock options are used to align the interests of senior executives with shareholders by providing financial gains based on company value.
The whole crux of the matter boils down to whether restructuring provisions should be recorded under operating or non-operating items: the former are recurrent in nature, unlike the latter.
Accounting for Stock Options
- Stock options are valued at grant date using standard pricing models and expensed over the vesting period as a service-related cost.
- While stock options dilute existing shareholders by issuing shares below market value, they do not technically make the company poorer as assets and debts remain unchanged.
- The text argues against booking stock options as an accounting charge, noting that they strengthen solvency rather than leading to potential bankruptcy.
- Financial analysts are advised to either deduct the value of options from capital employed or use the treasury method to calculate fully diluted equity.
- Tangible assets, including land and equipment, represent the physical backbone of a company alongside intangible assets.
How then can the granting of stock options or free shares be booked as a charge? For us, this just doesn’t make sense.
Tangible Assets and Treasury Shares
- Tangible assets are typically recorded at historical cost, which often fails to reflect their true market value for financial analysts.
- While IFRS allows for fair value revaluation of assets, most companies avoid this due to the complexity of annual measurements.
- Capitalizing expenses as assets boosts immediate net income but creates a long-term drag on earnings through increased depreciation charges.
- Analysts should focus on changes in fixed assets over time rather than static snapshots to better understand a company's financial health.
- Treasury shares are deducted from equity under IFRS, and any subsequent sale is treated as a capital increase rather than a profit or loss.
- Financial analysts should treat share repurchases as a capital reduction and subtract treasury shares from the total count when calculating earnings per share.
Though it may be an exaggeration, we can say that they have no more value than certain start-up costs.
Foundations of Financial Analysis
- Financial analysis serves as a critical tool for shareholders, lenders, and rating agencies to evaluate a company's economic health.
- A successful analysis must begin with a strategic and economic assessment of the sector, production model, and ownership structure.
- Analysts must critically examine accounting rules and auditors' reports to understand how economic reality is translated into figures.
- Relying solely on numerical data without context leads to sterile, descriptive reports that fail to provide predictive insights.
- The ultimate goal of financial analysis is to identify potential problems before they manifest in the numbers and cause financial loss.
Since the aim of financial analysis is to portray a company’s economic reality by going beyond just the figures, it is vital to think about what this reality is and how well it is reflected by the figures before embarking on an analysis of the accounts.
The Practice of Financial Analysis
- Financial analysis serves both shareholders and lenders by evaluating a company's value creation, solvency, and liquidity.
- Despite different end goals, both parties utilize identical techniques because long-term solvency is fundamentally tied to value creation.
- The discipline is more of a practical application than a rigid theory, often requiring common sense and sector knowledge over complex formulas.
- Analysts must frequently adjust published accounting figures to better reflect the underlying economic and financial reality of a business.
- The ultimate goal is a global assessment that matches a company's stated policies against its actual performance and cash flow.
- An analyst's true effectiveness is measured by their ability to detect concealed problems or artificial earnings rather than their technical sophistication.
Analysts’ effectiveness is not measured by their use of sophisticated techniques but by their ability to uncover evidence of the inaccuracy of the accounting data or of serious problems being concealed.
Economic Analysis of Companies
- Competent analysts must distinguish between temporary operational glitches and chronic weaknesses by evaluating a company's global economic model.
- Financial accounts often represent a compromise between different concerns, requiring analysts to look past non-recurrent profits to see true operating ratios.
- Economic analysis relies more on straightforward reasoning and common sense than on encyclopedic sector knowledge.
- A comprehensive analysis focuses on four pillars: market position, production models, distribution networks, and human motivation.
- A market should be defined by its specific competitive dynamics rather than by broad statistical or institutional sector definitions.
Naturally, it is impossible to appreciate the finer points of financial analysis without grasping the fact that a set of accounts represents a compromise between different concerns.
Defining and Segmenting Markets
- A market is defined by consistent consumer behavior and needs rather than broad economic sectors.
- Pay-TV operators compete against cinema and live events for entertainment time rather than traditional ad-supported television.
- Effective market segmentation must account for geographical and logistical realities, such as the global nature of footwear versus the local constraints of cement.
- Companies strive to create unique niches, like the iPad, to gain temporary protection from rivals before inevitable competition arrives.
- In mature economies with low population growth, businesses must shift from organic volume growth to value growth through innovation and premium pricing.
- The transition to value growth, such as selling specialty breads, carries the risk of competitors undercutting prices on basic versions of the product.
Apple, with its iPad, has created a product that is neither a PDA nor a computer but a unique product.
Analyzing Market Growth Dynamics
- Competitors often respond to premium offerings by focusing on unembellished, low-cost alternatives like pre-prepared dough.
- Predicting the duration of market growth is notoriously difficult, as evidenced by historical misjudgments regarding products like coffee.
- Growth in developed economies is driven by a complex interplay of technology, demographics, lifestyle shifts, and environmental factors.
- The product lifecycle dictates that markets transition from rapid, insensitive expansion to economic sensitivity during maturity.
- In the decline phase, price competition intensifies, yet remaining participants can achieve high margins with minimal investment.
The famous 17th century letter writer Mme de Sévigné once forecast that coffee was just a fad and would not last for more than a week.
Market Dynamics and Risk Factors
- High growth sectors like solar or video games often yield poor financial returns due to oversupply and overestimation of future demand.
- Mature or declining markets, such as tobacco, can paradoxically generate superior returns on capital for remaining dominant players.
- Replacement products are significantly more sensitive to economic cycles than original equipment, as consumers delay upgrades during recessions.
- The perceived safety of 'essential' sectors like food is often undermined by shifting consumer habits and preferences.
- Traditional barriers to entry are eroding globally due to deregulation, technological disruption, and internationalization.
- Digital distribution and piracy have dismantled the market dominance once held by major industry oligopolies like the record labels.
Conversely, tobacco, which is one of the most mature markets in existence, generates a very high level of return on capital employed for the last few remaining companies operating in the sector.
Market Share and Competition
- High market share reduces business volatility by fostering customer loyalty and strengthening bargaining power with suppliers.
- Market share metrics are irrelevant in sectors like construction where bidding processes prevent long-term customer-supplier links.
- The value of market share is dependent on its ability to create value; growth achieved through unsustainable price-slashing is ultimately pointless.
- Dominating a small niche is often more profitable and strategically sound than maintaining a mediocre presence in a massive market.
- The motivations of competitors, such as cooperatives pursuing scale over profit, can make it nearly impossible for profit-driven firms to thrive.
- In mature markets, small rivals often trigger destructive price wars, whereas large rivals may ignore specialized niches to avoid low-gain risks.
For instance, a large share of a small market is far more valuable than middling sales in a vast market.
Competitive Drivers and Value Chains
- Price-driven competition focuses on cost control, automation, and economies of scale to maintain market share in commodity sectors.
- Product-driven competition relies on differentiation through quality, service, and brand image to foster customer loyalty.
- The value chain encompasses all stages from raw materials to distribution, increasingly involving 'grey matter' and services as primary inputs.
- Analyzing value chains helps identify structural weaknesses and participants who lack the maneuverability to survive economic crises.
- Production models, whether in-house or subcontracted, determine a company's financial flexibility during market fluctuations.
- Analysts must look beyond temporary good performance to identify where not to invest based on underlying industrial inconsistencies.
Increasingly in our service-oriented society, grey matter is the raw material, and processing is replaced by a series of services involving some degree of added value.
Evolution of Industrial Production Models
- Industrial organizations evolve through four distinct stages: Project, Workshop, Mass Production, and Process-specific production.
- Mass production relies on high working capital and semi-finished inventories to maintain flexibility, making it susceptible to relocation in emerging markets.
- Process-specific production, emerging in the 1970s, utilizes just-in-time logistics to eliminate inventories but creates extreme vulnerability to supply chain disruptions.
- Innovation naturally shifts over time from the product's performance and features to the efficiency and cost-minimization of the production process itself.
- Strategic alignment is critical, as companies must match their production model to their specific volume requirements and business strategy.
A strike affecting a supplier or subcontractor may bring the entire group to a standstill.
Production Outsourcing and Distribution
- Investing in production facilities too early is risky; capital is better spent on innovation and marketing to anchor the product in the market.
- Modern value creation has shifted from manufacturing to research, design, and marketing, leading to the rise of specialized industrial giants like Foxconn.
- Distribution systems serve three critical roles: logistics, advice/service, and financing through inventory risk-taking.
- A producer's success is inextricably linked to the efficiency of its distribution network, despite common squabbles over price margins.
- Direct-to-consumer distribution models offer superior market data and faster response times but require significant capital and specialized human skills.
A producer will never be efficient if the distribution network is inefficient.
Distribution Strategy and Shareholder Dynamics
- Direct control over distribution is essential for brands driven by image and quality, as seen in Burberry's strategy to buy back franchises.
- Indirect distribution models minimize investment but create a dangerous 'inertia effect' that delays a producer's response to market shifts.
- In price-sensitive markets, producers should prioritize manufacturing efficiency over distribution, utilizing the Internet as a low-cost channel.
- A company's value must eventually transcend the charisma of its founder by establishing strategic positions and economic rents.
- Inside shareholders offer high commitment but risk making poor financial decisions due to emotional ties or personal obstinacy.
- The distinction between inside and outside shareholders determines whether a company pursues prestige and scale or purely financial returns.
If end customers slow down their purchases, it may take some time before the end retailer becomes aware of the trend and reduces its purchases from the wholesaler.
Corporate Governance and Culture
- Outside shareholders provide financial discipline but may lack resolve during crises.
- Incentive systems like stock options align manager interests with shareholders but can lead to talent flight during downturns.
- Monolithic corporate cultures often struggle with diversification and acquisitions due to rigid methodologies.
- Accounting principles must be scrutinized as deviations often signal an attempt to hide a grim economic reality.
- Conflicts among founding family members or major shareholders can paralyze a company's operations.
It is an ideal system when everything is going well, but highly dangerous in the event of a crisis because it exacerbates the company’s difficulties.
The Financial Detective's Framework
- Novice analysts often struggle by producing descriptive comments without establishing causal links or internal consistency.
- Effective financial analysis functions like a detective investigation, seeking logical sequences and identifying disruptive factors that signal future problems.
- The core of all financial analysis is the principle that wealth creation requires investment which must be financed and provide sufficient return.
- The analytical process begins with the structure of earnings and sales trends, which set the backdrop for the company's growth stage.
- A complete analysis must integrate margins, capital employed, and financing policy to determine overall profitability and value creation.
- The ultimate goal is to verify if a company can honor its creditor commitments and create value for its shareholders.
Financial analysts are detectives, constantly on the lookout for clues, seeking to establish a logical sequence, as well as looking for any disruptive factor that may be a prelude to problems in the future.
Foundations of Financial Analysis
- Financial analysis requires a deep understanding of a company's business model, including its products, production methods, and distribution networks.
- A comprehensive analysis must evaluate wealth creation by comparing return on capital employed (ROCE) against the required rates of return from shareholders.
- Trend analysis is essential for identifying warning signals and forecasting future performance, typically requiring at least three years of historical data.
- The effectiveness of trend analysis is limited by data comparability issues, such as changes in accounting rules or significant shifts in a company's business model.
- External analysts face a structural disadvantage due to the time lag between the end of a financial year and the public release of accounting data.
All too often we have seen lazy analysts look at the key profit indicators without bothering to take a step back and analyse trends.
Comparative and Normative Analysis
- Comparative analysis evaluates a company's performance relative to industry peers to determine relative viability rather than absolute health.
- Benchmarking relies on standardized data from central banks and rating agencies to establish sector-specific medians and averages.
- The method faces limitations due to the vague definition of industry sectors and the risk of 'mass delusion' where entire sectors become overvalued.
- Normative analysis applies specific rules of thumb, such as the bed-per-night cost in hotels or debt-to-EBITDA ratios for general solvency.
- Financial norms are often statistically derived and lack conceptual robustness, meaning highly profitable companies can often afford to ignore them.
- Credit ratings represent a specialized form of continuous solvency assessment conducted by major agencies like Moody's and Standard & Poor's.
After all, profitable companies can afford to do what they want, and some may indeed appear to be acting rather whimsically, but profitability is what really matters.
Credit Scoring and Risk Assessment
- Financial risk is determined by a borrower's ability to pay and the specific legal characteristics or guarantees of the debt.
- Rating agencies perform deep strategic and financial analyses, focusing on operating margins, return on capital, and debt coverage ratios.
- Credit scoring serves as an automated, pre-emptive check-up tool to identify potential corporate failure two to three years in advance.
- The Z-score method, pioneered by Edward Altman, uses a weighted linear equation of financial ratios to produce a single risk metric.
- A Z-score below 1.1 indicates a high probability of failure, while a score above 2.6 suggests the company is likely to remain healthy.
The basic idea is to prepare ratios from companies’ accounts that are leading indicators (i.e. two or three years ahead) of potential difficulties.
Scoring Techniques and Expert Systems
- Scoring techniques improve upon traditional ratio analysis by weighting specific financial ratios based on their ability to distinguish failing companies from healthy ones.
- The effectiveness of these models is limited by their reliance on historical data, requiring frequent updates to remain relevant in changing economic environments.
- Scoring equations are typically specialized for small and medium-sized enterprises and lack accuracy when applied to large corporations or different business objectives.
- The use of these techniques can create a self-fulfilling prophecy where a negative score causes suppliers and banks to withdraw support, hastening a company's collapse.
- Expert systems represent the application of artificial intelligence to financial analysis, using rule-based knowledge to mimic human reasoning and provide recommendations.
Prior awareness of the risk of failure (which scoring techniques aim to provide) may lead some of the companies’ business partners to adopt behaviour that hastens their demise.
Foundations of Financial Analysis
- Financial analysis serves two primary purposes: assessing value creation for shareholders and determining solvency for lenders.
- The process requires a prerequisite examination of a company's market position and the integrity of its accounting principles.
- A standard analysis follows a four-stage cycle: wealth creation, capital investment, financing methods, and return on investment.
- Analysts utilize three main methodologies: trend analysis of past performance, comparative analysis against peers, and normative analysis based on financial rules of thumb.
- Advanced evaluation tools include credit ratings for large market-traded groups and automated scoring techniques for predicting failure in small to medium-sized companies.
Otherwise, there is no need to study the accounts, since they are not worth bothering with, and the company should be avoided like the plague as far as shareholders, lenders and employees are concerned.
Financial Analysis and Value Chains
- The text outlines the complex value chain of the frozen chicken industry, from genetic research and hatcheries to high-speed slaughterhouses processing 20,000 birds per hour.
- It presents a case study of Guizzardi, an Italian raincoat manufacturer, to demonstrate how external economic shocks like labor cost hikes and currency fluctuations impact financial health.
- The exercises emphasize the importance of simulating crisis scenarios, such as rising raw material costs and oil prices, when evaluating a company's future stability.
- Financial data from the Norne group illustrates the discrepancy between recurring net income and total income when accounting for items that impact comparability.
- The material serves as a practical guide for performing financial analysis by linking operational value chain steps to quantitative fiscal performance.
20 000 chickens are anaesthetised, decapitated, processed and frozen per hour, then exported mainly to the Middle East.
Financial Analysis and Economic Strategy
- Value creation for shareholders is the primary indicator of a company's solvency and long-term viability for lenders.
- Effective financial analysis requires a deep understanding of market dynamics, competitive positioning, and the specific accounting principles applied.
- Strategic positioning within a value chain is critical, as certain segments possess structural weaknesses that make outsourcing preferable to direct investment.
- Market sensitivity varies by product type; replacement markets are highly vulnerable to economic downturns as consumers can postpone purchases.
- Historical financial data should be used primarily as a tool to understand the present and forecast future performance.
- The case of Enron serves as a warning that non-audited figures and unconventional cash flow reporting are significant red flags for impending failure.
In a value chain, there are positions of structural weakness, where it is better to let others invest, even if it means handling them through supply contracts.
Bibliography and Margin Analysis
- The text provides a comprehensive bibliography of foundational business literature covering supply chain management, marketing, and competitive strategy.
- It lists essential resources for understanding industrial organization and the dynamics of product and process innovation.
- A specific focus is placed on financial reporting, highlighting texts that help detect 'creative accounting' and 'financial shenanigans.'
- The references include seminal works on automated financial analysis and the prediction of corporate bankruptcy using discriminant analysis.
- The section transitions from these academic and professional references into a new chapter focused on the structure of margin analysis.
The Financial Number Game: Detecting Creative Accounting Practices
The Strategy of Margins
- Financial analysis is fundamentally driven by company strategy rather than just raw numbers.
- Operating profit (EBIT) is the primary focus for analysts because it reflects recurring performance better than net income.
- Companies may attempt to manipulate operating profit by shifting charges to non-recurring or financial categories.
- Trend analysis of revenues and costs is only valuable if it helps predict future performance based on historical data.
- A company's strategic power is the ultimate determinant of whether it can maintain superior margins over its competitors.
- Effective income statement analysis requires a qualitative approach to understand the 'why' behind the quantitative figures.
If financial analysis were a puppet, company strategy would be pulling its strings
Sales Growth and Margin Analysis
- Continental European accounting formats provide more granular data on raw materials and personnel costs than Anglo-Saxon functional formats.
- Sales growth is the fundamental cornerstone of financial analysis, requiring a breakdown of volume, price, organic, and external growth factors.
- Analysts must separate external growth from organic growth to ensure a 'like-for-like' comparison of a company's actual performance.
- Rapidly growing companies face unique risks regarding operating cost management and increased cash requirements.
- Price trend analysis reveals strategic positioning, such as whether a company is moving toward high-value products or passing efficiency gains to customers.
- Currency fluctuations and changes in the product mix can significantly distort sales figures in consolidated accounts.
Sales growth forms the cornerstone for all financial analysis.
Analyzing Production and Margins
- Sales analysis requires breaking down data into volume, price, product, and regional trends while adjusting for currency effects.
- Production is an accounting concept that combines sales at selling price with inventory changes and internal work valued at cost.
- A growth rate in production that exceeds sales growth can signal dangerous overproduction or the artificial overstatement of inventory values.
- Production for own use can be used by management to superficially boost book profits if the amounts are unusually high.
- Gross margin serves as a strategic indicator in industrial sectors, representing the difference between production and raw material costs.
- External analysts often struggle to separate price and volume effects in raw materials due to the lack of granular management data.
An unusually high amount may conceal problems and an effort by management to boost book profit superficially.
Value Added and Margin Analysis
- Gross trading profit serves as a vital strategic indicator specifically for the retail, wholesale, and trading sectors.
- Value added measures the wealth a company creates beyond the goods and services it purchases from third parties.
- The calculation of value added differs between by-nature and by-function income statements, incorporating elements like EBIT, personnel costs, and depreciation.
- Analysts use value added primarily to determine a company's degree of vertical integration within its specific industry sector.
- The concept of value added loses its analytical utility when companies maintain special contractual ties with suppliers rather than market-based relationships.
- Personnel costs are theoretically variable but function as fixed costs in the short term, requiring analysis of both volume and price effects.
In the food sector, food processing companies usually establish special relationships with the farming industry. As a result, a company with a workforce of 1000 may actually keep 10 000 farmers in work.
Personnel Costs and EBITDA
- Employee productivity is measured through ratios comparing sales, production, or value added against the average headcount.
- External analysts must account for the inertia of personnel costs, as the full financial impact of hiring or layoffs often takes a full year to materialize.
- EBITDA serves as a critical microeconomic indicator, representing the core difference between operating revenues and cash operating charges.
- The EBITDA margin is a central metric for financial analysis because it remains unaffected by non-cash charges like depreciation and amortization.
- Calculating EBITDA requires adjusting for various operating costs, including impairment losses on current assets and provisions for litigation or retirement benefits.
If 100 additional staff members are hired throughout the year, this means that only 50% of their salary costs will appear in the first year, with the full amount showing up in the following period.
EBITDA and Operating Profit Analysis
- EBITDA margin fluctuations are driven by production costs, personnel expenses, and sales price effects.
- Competitive pressures are making it increasingly difficult for modern companies to maintain positive EBITDA margin trends.
- Sector-specific data reveals that industries requiring heavy investment, like mining, necessitate higher margins to achieve sufficient returns.
- Operating profit (EBIT) is derived by subtracting non-cash operating costs like depreciation and amortization from EBITDA.
- Financial analysts should exclude non-recurring impairment losses from EBIT to maintain a more accurate view of recurring performance.
- Companies often attempt to artificially boost operating profit by relegating negative charges to 'Other income and costs' lines.
The emphasis placed by analysts on operating performance has led many companies to attempt to boost their operating profit artificially by excluding charges that should logically be included.
Margin Analysis and Profit Allocation
- Operating profit (EBIT) definitions vary significantly between companies, requiring analysts to scrutinize exactly which non-recurring items or capital gains are included.
- Historical data from 2000–2015 reveals distinct margin behaviors across sectors, highlighting the extreme volatility of the steel industry compared to the stability of food retail.
- EBIT is fundamentally distributed among three primary stakeholders: lenders (interest), shareholders (net income), and the government (taxes).
- While most industrial firms report net financial expenses, some sectors like large-scale retail can generate net financial income due to substantial negative working capital.
- Financial income and expenses encompass a wide range of items beyond simple interest, including foreign exchange gains or losses on debt and disposals of marketable securities.
We believe it is vital for readers to avoid preconceptions and to analyse precisely what is included and what is not included in operating profit.
Analyzing Financial Performance Components
- Net financial expense reflects a company's debt burden and interest rates rather than its operating cycle or price effects.
- The distinction between recurring and non-recurring items is critical for analysts, as some 'exceptional' items like restructuring may actually be recurrent in large groups.
- International accounting standards often blend extraordinary items into operating profit, forcing analysts to manually define recurring operating profit.
- Corporate income tax analysis requires monitoring the effective tax rate to identify aggressive tax optimization or the use of tax-loss carryforwards.
- The 'tax proof' table in financial notes is essential for reconciling the theoretical tax rate with the actual rate paid by the company.
- Goodwill impairment and income from associates require specific investigation into their origins and reasons for depreciation.
In large groups, closure of plants, provisions for restructuring, etc. tend to happen every year in different divisions or countries and should consequently be treated as recurring items.
Income Statements and Margin Analysis
- Equity-accounted associates require detailed separation into operating and financial items to accurately assess their contribution to net income.
- Analyzing minority interests is a strategic tool for identifying which specific subsidiaries are driving a group's overall profitability.
- Standard income statements are categorized into 'by-nature' formats for individual accounts and 'by-function' formats for consolidated accounts.
- The 'by-nature' format focuses on production, value added, and EBITDA, while the 'by-function' format highlights cost of sales and recurring operating profit.
- The 'scissors effect' describes a critical financial phenomenon where diverging trends between revenues and costs lead to a decline in earnings.
An analysis of minority interests often proves to be a useful way of working out which subsidiary(ies) generate(s) the group’s profits.
The Scissors Effect Dynamics
- The scissors effect occurs when the divergence between revenue and cost trends leads a company into financial deficit.
- A company's strategic position determines its ability to mitigate this effect by passing cost increases to customers.
- Profit reduction is often driven by statutory price freezes, psychological reluctance to raise prices, or poor internal cost control.
- The scissors effect can also work positively when revenue growth outpaces costs or efficiency gains reduce expenses.
- The stability principle suggests that net income is an equilibrium that may resist external shocks if competitors face similar pressures.
- Analysts must evaluate the delayed impact of price adjustments based on a company's relative strength in the marketplace.
A company’s accounts are littered with potential pitfalls, which must be sidestepped to avoid errors of interpretation during an analysis.
Dynamics of Margin Analysis
- Financial analysis must account for the complex relationship between production costs, competitor margins, and consumer price sensitivity.
- Regulatory changes and external factors, such as government mandates or new competitors, often disrupt a company's natural strategic direction.
- Pre-emptive action allows companies in less competitive markets to raise prices immediately in anticipation of future cost increases.
- Inertia effects occur when intense competition prevents companies from quickly passing increased production costs onto their customers.
- The champagne industry exemplifies pre-emptive pricing, where poor harvests trigger price hikes years before the product reaches the market.
Such action is taken even though it will be another two or three years before the champagne comes onto the marketplace.
Inflation and Investment Distortions
- High inflation incentivizes companies to overinvest and overproduce early to lock in lower nominal costs.
- Excessive inventory accumulation becomes a common strategy to capture inflation gains that offset carrying costs.
- Cautious firms risk being 'steamrolled' by competitors who use artificial inflation gains to lower consumer prices.
- Major capital expenditures often depress short-term operating performance through increased R&D, labor, and financial costs.
- Underinvestment can be used to artificially inflate current margins at the expense of long-term value creation and future growth.
Any players opting for a more cautious approach during such periods of madness may find themselves steamrollered out of existence.
Margin Analysis and Market Volatility
- Indesit faced extreme sales volatility in Eastern Europe and Russia, including a 46% drop in 2009 followed by a brief catch-up period.
- The decline in profitability was driven by the strong euro, industry-wide deflation in white goods, and aggressive market share gains by LG and Samsung.
- Despite shifting production to low-cost countries like Poland, Indesit's operating margin halved in 2013 due to excess Western European manufacturing capacity.
- The significant labor cost disparity—€24 per hour in Western Europe versus €5-6 in Poland or Turkey—severely impacted competitive margins.
- Financial analysis must prioritize operating profit as it reveals the strength of a company's strategic position relative to its competitors.
- Key factors in margin formation include sales volume, production levels, raw material costs, personnel productivity, and depreciation policies.
This is absolutely vital because a company that fails to sell its products or services to its customers above their cost is doomed.
Income Statement Dynamics
- Operating profit allocation involves net financial expenses, non-recurring items, and corporate income taxes.
- The 'scissors effect' occurs when diverging trends in revenues and charges reveal the strength of a company's strategic position.
- Financial distress is often a symptom of profitability failing to cover risk rather than just high expenses.
- Analyzing non-recurring items and minority interests is essential for understanding the sustainability of net results.
- Sector-specific cost structures, such as personnel costs or R&D, define the operational profile of different industries.
Diverging trends in revenues and charges produce a scissors effect, which may be attributable to changes in the market in which the company operates.
Margin Analysis and Operating Leverage
- Financial results must be scrutinized to distinguish between recurring operational income and extraordinary, non-recurring gains.
- The 'scale effect' suggests margins should increase with growth, but market share competition often forces price cuts that erode these gains.
- Operating leverage creates a link between sales volatility and profit fluctuations based on a company's specific cost structure.
- Breakeven analysis identifies the critical activity level where total revenue exactly offsets total costs, resulting in zero earnings.
- Past earnings growth of 30% or more should not be extrapolated into the future without accounting for structural and cyclical shifts.
Costs are not like problems, people do not like them to be fixed
Fundamentals of Breakeven Analysis
- The breakeven point is the specific sales level where total revenue exactly equals total costs, resulting in zero profit or loss.
- Cost classification into fixed and variable categories is not static; it depends heavily on the time horizon being analyzed.
- In the long term, all costs are considered variable, whereas in the very short term, almost all costs are fixed.
- The contribution margin, calculated as sales minus variable costs, is the critical metric used to cover fixed costs and generate profit.
- Operating leverage measures a company's sensitivity to sales fluctuations, showing how small changes in turnover can lead to disproportionate changes in operating profit.
- Breakeven points can be calculated at different levels, including operating breakeven and points that account for payments to providers of funds.
If a company is unable to adjust its cost base, it is not a viable company.
The Three Levels of Breakeven
- Operating breakeven is identified as a dangerous metric because it ignores the cost of capital and the necessity of generating returns for investors.
- Financial breakeven incorporates interest costs but still fails to account for the return on equity, which is the fundamental driver of value creation.
- Total breakeven is the recommended metric, adjusting the cost base to include the specific profit levels required to satisfy shareholder expectations.
- High debt levels increase earnings instability because interest charges act as fixed costs that amplify the volatility of operating profits.
- A company is considered to be in an unstable position if its sales are less than 10% above its financial breakeven point.
- The 2008–2009 crisis highlighted that even a 20% safety margin above breakeven can be rapidly eroded during severe economic downturns.
Operating breakeven is a dangerous concept because it disregards any return on capital invested in the company, while financial breakeven understates the actual breakeven point because it does not reflect any return on equity, which is the basis of all value creation.
Breakeven Analysis and Earnings Stability
- Breakeven analysis, or cost–volume–profit analysis, is a critical tool for assessing earnings stability, real power, and forecast accuracy.
- A company's proximity to its breakeven point determines its earnings instability; the closer it is, the more a small change in sales impacts net income.
- Operating leverage explains why profits can grow significantly faster than sales in companies with low margins or high fixed costs.
- High fixed costs increase the volatility of earnings, making certain sectors like steel or cars particularly vulnerable to sudden market collapses.
- Analysts must distinguish between genuine performance growth and the mathematical sensitivity caused by operating near the breakeven threshold.
The closer a company is to its breakeven point, the higher its earnings instability.
Operating Leverage and Profitability
- Operating leverage determines how sensitive a company's earnings are to changes in sales volume based on its fixed cost structure.
- Companies with high fixed costs, like Pirelli, experience much more volatile earnings swings compared to low-fixed-cost service groups like Compass.
- High profits during peak economic cycles may reflect temporary favorable conditions rather than long-term structural profitability.
- Assessing a company's true earnings power requires adjusting for cyclical trends and the specific impact of operating leverage.
- Variance analysis helps distinguish whether earnings declines are caused by sales volume drops, rising fixed costs, or shifting variable cost ratios.
- The 'cost structure effect' can often account for half of a company's earnings decline during a slump.
The operating leverage, which accelerates the pace of growth or contraction in a company’s earnings triggered by changes in its sales performance, means that the significance of income statement-based margin analysis should be kept in perspective.
Breakeven and Industrial Strategy
- Companies in cyclical sectors often mistakenly raise their breakeven points through heavy investment instead of seeking flexible cost structures.
- Outsourcing and lean cost structures are essential for surviving boom and bust cycles in industries like construction.
- Capital-intensive sectors should prioritize equity financing over debt to avoid compounding sales volatility with financial leverage.
- A company's breakeven point serves as the critical link between its financial decisions and its industrial strategy.
- When falling below the breakeven point, companies must restructure operations or boost margins rather than chasing unprofitable sales growth.
- Debt financing increases the financial breakeven point, whereas equity financing can attenuate the impact of market swings on the bottom line.
Only companies that have maintained a lean cost structure through a strategy of outsourcing have been able to survive the successive cycles of boom and bust in the sector.
The Breakeven Point Trap
- Management risks entering a vicious circle where lowering the breakeven point inadvertently shrinks the business, necessitating further cuts.
- Breakeven analysis is a dynamic concept, and earnings often fall much further than mathematical formulas predict during market contractions.
- Cyclical downturns frequently trigger price wars that compress contribution margins while simultaneously increasing fixed costs like interest and inventory.
- In industries with inflexible supply, such as shipping or paper, a minor volume glut of 5% can cause disproportionate price collapses of 30% to 50%.
- Effective financial forecasting requires analyzing competitive structures rather than simply applying fixed growth rates to historical income statements.
In many cases, a vicious circle sets in, as the measures taken to lower breakeven trigger a major business contraction, compelling the company to lower its breakeven point further, thereby sparking another business contraction, and so on.
Financial Analysis and Forecasting
- Financial analysts use normalized earnings to project a company's future profitability based on sector-specific risk and return profiles.
- Strategic margins are determined by qualitative factors such as barriers to entry, business maturity, and brand strength.
- A significant risk in forecasting is the tendency to prioritize theoretical future margins over a company's current actual performance.
- The Indesit case study illustrates how linear regression can be used to estimate fixed and variable costs when company data is incomplete.
- Indesit's financial health declined between 2010 and 2013 as its breakeven point rose by 10% while sales simultaneously dropped by 7%.
Its drawback lies in the fact that analysts may be tempted to overlook the company’s actual margin and concentrate more on its future, theoretical margins.
Understanding Breakeven Points
- The breakeven point is the level of activity where total revenues cover total costs, resulting in zero profit.
- Breakeven is not a fixed value but depends on the time period and the classification of costs as fixed or variable.
- There are three distinct levels of analysis: operating breakeven, financial breakeven, and total breakeven which includes the cost of equity.
- A company's distance from its breakeven point determines the stability of its earnings and the significance of its performance trends.
- High fixed costs increase operating leverage, making a company more sensitive to economic fluctuations and increasing earnings volatility.
- Strategic choices between economies of scale and industrial flexibility directly impact the breakeven point and potential earnings power.
The further away a company lies from its breakeven point, the more stable its earnings and the more significant its earnings trends are.
Financial Analysis and Risk Exercises
- The text presents a series of conceptual questions regarding the optimal capital structure for different industries, such as oil refineries versus Internet start-ups.
- It challenges students to evaluate the implications of debt levels for financial directors in capital-intensive industries like cement production.
- Practical exercises require the calculation of breakeven points before and after financial costs using comparative income statements of multiple companies.
- The material covers the classification of costs, asking students to distinguish between fixed and variable components of personnel costs and bonuses.
- Case studies, such as the Hoyos and Schmidheiny groups, provide raw data for analyzing operating leverage, capital expenditure programs, and the impact of debt financing.
A company’s net income, which was 0.2% of sales in year 1, leaps by 40% in year 2. State your views.
Operating Leverage and Breakeven Analysis
- The text explores the relationship between fixed costs, variable costs, and a company's sensitivity to sales fluctuations, known as operating leverage.
- High fixed-cost structures necessitate financing through equity to mitigate the risk of cyclical business activity.
- Personnel costs are identified as a critical variable that can become 'out of control' if not managed relative to production levels and local labor laws.
- Financial leverage, specifically debt capital, significantly increases a company's breakeven point and overall financial risk.
- Structural improvements are distinguished from general economic upturns by analyzing if fixed costs rise at a slower pace than production capacity.
Variable costs, but they become a source of scandal when they become fixed costs.
Working Capital and Investment
- Value creation in finance necessitates investment in either fixed assets or working capital.
- Working capital represents the net amount of money 'frozen' within a company's operating cycle.
- The primary components of working capital are inventories, customer receivables, and accounts payable.
- Analysts typically measure working capital as a percentage of annual sales or turnover to gauge business efficiency.
- A high working capital ratio indicates that a significant portion of annual sales is tied up and requires external funding.
- Working capital can be expressed as a number of days of sales by multiplying the percentage ratio by 365.
In other words, if the working capital turnover ratio is 25% (which is high), this means that 25% of the company’s annual sales volume is “frozen” in inventories and customer receivables not financed by supplier credit.
The Duality of Working Capital
- Working capital represents the balance of accounts directly related to a company's operating cycle, traditionally viewed as highly liquid.
- While individual components like inventory and receivables are consumed or collected quickly, they are constantly replaced by new assets.
- This constant replacement creates a 'permanent requirement' for capital that is as essential to a going concern as fixed assets.
- In seasonal businesses, working capital fluctuates but rarely hits zero, maintaining a baseline level of permanent necessity.
- Managers often mistakenly focus on seasonal peaks while ignoring the significant portion of working capital that remains fixed year-round.
Working capital is two-sided. From the point of view of balance sheet value, it is liquid. From a going-concern point of view, it is permanent.
Analyzing Working Capital Realities
- External analysts must distinguish between year-end balance sheet figures and a company's actual permanent working capital requirements.
- Companies often engage in 'window dressing' by choosing fiscal year-end dates when working capital requirements are at their lowest seasonal points.
- Distressed companies may artificially inflate trade credit, while others may over-pay suppliers to avoid appearing excessively cash-rich.
- Year-to-year comparisons of working capital are more informative than isolated snapshots as they eliminate seasonal impacts and reveal operational trends.
- Working capital turnover ratios, such as Days Sales Outstanding (DSO), serve as tools to uncover the hidden operational realities behind accounting balances.
- The complexity of varying payment terms and manufacturing processes makes calculating precise turnover ratios difficult but necessary for analysis.
Bordeaux vineyards close on 30 September, Caribbean car rental companies on 30 April. They choose these dates because that is when the working capital requirement shown on their balance sheets is lowest. This is pure window dressing.
Calculating Working Capital Ratios
- Financial analysts must adjust sales and purchase figures for VAT to ensure consistency between balance sheet items and income statement data.
- The Days' Payables Outstanding (DPO) ratio measures the average time a company takes to pay its suppliers, calculated using accounts payable and total purchases.
- Inventory turnover ratios can be calculated globally to analyze trends or broken down into specific components like raw materials and finished goods.
- The Days' Inventory Outstanding (DIO) reflects the duration raw materials are held, the length of the production cycle, and the time taken to sell finished products.
- When detailed cost of goods sold data is unavailable, analysts must use approximations based on sales prices to estimate inventory turnover.
- Accurate working capital analysis requires careful reconciliation of dissimilar data points to reflect the true operational efficiency of a business.
If it is detailed enough, you can calculate true turnover ratios. If not, you will have to settle for approximations that compare dissimilar data.
Limits of Ratio Analysis
- Turnover ratios can be highly misleading for seasonal businesses, potentially producing extreme figures that do not reflect actual payment terms.
- Standard ratios lack granularity, failing to distinguish between different customer types like government agencies which often have unique payment behaviors.
- Analysts must choose between using average annual ratios for general insights or more precise, recent data for in-depth audits.
- Working capital evaluation is more critical in Continental Europe than in Anglo-Saxon countries due to differences in intercompany financing and payment cultures.
- In a stable business model, working capital requirements typically grow in direct proportion to increases in sales volume.
- Financial forecasting must explicitly account for the additional cash flow needs generated by business growth and its impact on working capital.
To take an extreme example, imagine a company that makes all its sales in a single month. If it grants payment terms of one month, its number of days’ receivables at the end of that month will be 365.
Managing Working Capital Growth
- Working capital often grows faster than sales during expansion due to management's focus on strategy over operational rigor.
- Vertical integration and structural changes can cause working capital to increase disproportionately to business volume.
- Increases in working capital represent a real use of funds and should be analyzed with the same scrutiny as capital expenditures.
- Successful companies maintain independence by creating a corporate culture that actively strives to contain working capital growth.
- Modern efficiency techniques like just-in-time inventory and outsourcing have led to a shrinking working capital trend in many European sectors.
- Inflationary periods can force working capital to rise even when production quantities remain stagnant due to increased costs and receivables.
When a company is growing, the increase in working capital constitutes a real use of funds, just as surely as capital expenditures do.
Working Capital During Recession
- A sudden drop in sales triggers a three-phase reaction in a company's working capital management.
- Initially, working capital rises as production remains high while receivables stretch out due to customer financial distress.
- The second phase involves a paradoxical inflation of working capital as production cuts reduce accounts payable faster than inventories can be cleared.
- Full recovery to a proportional working capital level typically requires a year-long crisis and significant psychological adjustment by management.
- Vertical expansion through acquisitions increases value added but also permanently lengthens the production cycle and increases working capital requirements.
- Reducing working capital without fire-sale liquidations generally takes at least nine months to improve the bottom line.
During a recession, working capital has a paradoxical tendency to grow; then, despite restructuring measures, it still doesn’t budge.
Dynamics of Negative Working Capital
- Negative working capital occurs when companies collect cash from customers before paying their suppliers, creating a favorable timing mismatch.
- This financial structure is common in industries like e-commerce, food retail, and subscription services where inventory turns faster than payment terms.
- Low or negative working capital allows companies to fund rapid expansion internally without needing to seek external capital or bank loans.
- Management can become trapped by 'cash blindness,' such as refusing to sell a loss-making division because its negative working capital is subsidizing other units.
- Unprofitable companies can survive temporarily through high sales growth, using the resulting cash inflows to mask operating deficits until growth slows.
- Cultural and legal differences, such as title-of-goods laws in Germanic countries, significantly impact the feasibility of aggressive payment terms.
The wake-up call is pretty tough when growth slows down and payment difficulties appear.
Dynamics of Intercompany Credit
- Historical credit restrictions in Mediterranean countries led companies to use payment terms as a workaround for bank limitations and price controls.
- In the USA, two-part trade credit with steep discounts for early payment results in lower accounts payable and serves as an early warning system for financial distress.
- Supplier credit functions as a financial shock absorber, where suppliers act as 'unwitting bankers' for customers who lack the collateral to secure traditional bank loans.
- Intercompany credit represents a significant risk factor, often acting as the primary catalyst for the domino effect in corporate bankruptcies.
- The scale of intercompany credit is a direct manifestation of the balance of power and strategic positioning between a company and its business partners.
- Negative working capital in half of the Euro Stoxx 50 industrial groups highlights the strategic advantage of leveraging supplier credit.
Suppliers know that they will not have complete control over payment terms. They have unwittingly become bankers.
Analyzing Capital Expenditure Strategies
- A low ratio of net to gross fixed assets suggests aging equipment that may temporarily boost margins through low depreciation but threatens long-term competitiveness.
- Comparing capital expenditure to annual depreciation reveals whether a company is expanding, maintaining, or liquidating its industrial base.
- Aggressive investment programs, such as those exceeding 50% of existing net fixed assets, carry significant risks regarding economic shifts and cost control.
- There is no direct immediate link between current capital expenditure and operating cash flow, as new assets must integrate with existing ones to produce value.
- Sustainable investment strategies must eventually result in increased operating cash flow to prove profitability and avoid financial distress.
- Management hubris can lead to overinvestment where capital spending outpaces cash flow growth, signaling a disregard for fundamental profitability.
Be on the lookout for companies that, for reasons of hubris, grossly overinvest, despite their cash flow from operating activities not growing at the same rate as their investments.
Analyzing Capital Expenditure Risks
- The relationship between capital expenditure and operating cash flow is the most critical metric in a cash flow statement.
- Companies with investment levels far below cash flow risk 'living off' existing assets while their production equipment becomes technologically obsolete.
- High capital expenditure indicates a value-creation project where future cash flows are highly uncertain and dependent on new investment profitability.
- A virtuous circle of growth is achieved when an investment policy grows cash flow at the same rate as capital expenditure.
- Divestments must be scrutinized to determine if they are strategic rejuvenations or desperate measures to cover cash flow shortages.
- External growth through acquisitions carries significant risks including integration failures, obscured financial analysis, and overpayment.
Naturally, the risk in this situation is that the company is resting on its laurels, and that its technology is falling behind that of its competitors.
Working Capital and Strategic Power
- Indesit maintains a negative working capital ratio, indicating strong bargaining power over suppliers and an efficient operating cycle.
- Working capital is described as both liquid and permanent, as individual accounts are settled but immediately replaced by new operating cycle components.
- During economic downturns, Indesit prioritized debt reduction over capital expenditure, cutting investment to half of depreciation levels in 2009-2010.
- Working capital often paradoxically increases during recessions because restrictive measures take time to manifest, only subsiding as the recession ends.
- The level of working capital serves as a strategic indicator, reflecting the balance of power between a company, its customers, and its suppliers.
Working capital is therefore both liquid and permanent.
Evaluating Investment and Working Capital
- Investment policy is assessed by the age of fixed assets, the ratio of capital expenditure to depreciation, and the resulting impact on operational cash flow.
- A company's financial health depends on investments eventually translating into increased cash flows; failure to do so leads to financial distress.
- Working capital dynamics are explored through various scenarios, including the impact of inflation, recession, and aggressive customer credit policies.
- The text emphasizes that high sales or increased EBITDA do not necessarily equate to success if they are offset by bloated inventories or poor credit management.
- Practical financial analysis requires calculating working capital ratios and operating cash flows based on production cycles and payment terms.
Any investment policy should, sooner or later, translate into increasing cash flows from operations. If not, the company will face financial difficulties.
Working Capital and Financial Analysis
- The text provides practical exercises for calculating working capital requirements based on inventory rotation, supplier credit, and customer payment terms.
- It highlights the impact of operational variables such as VAT, payroll taxes, and salary percentages on a company's cash position.
- Financial performance is analyzed through the lens of EBITDA and operating cash flow, specifically during economic recessions.
- The data illustrates how business seasonality and accounting rules influence the calculation and interpretation of working capital.
- Case studies like Air Liquide and the cognac industry are used to demonstrate long-term investment policies and extreme inventory cycles.
Change your CFO or offer him a Vernimmen book!
Working Capital and Investment Cycles
- The text provides a detailed breakdown of working capital components, calculating the total value in days of sales for inventories, receivables, and payables.
- A historical analysis of Air Liquide illustrates a cyclical relationship between capital expenditure (capex) and cash flow generation.
- Air Liquide's strategy involves periods of heavy investment followed by 'reaping' phases where capex is reduced and operating cash flow remains high.
- The data shows that stagnant cash flows often trigger a new wave of doubled capital expenditure to stimulate future growth.
- The section concludes with an extensive bibliography on trade credit, working capital efficiency, and the impact of political uncertainty on investment cycles.
Tell me how you’re financed and I’ll tell you who you are
Dynamic and Static Financing Analysis
- Financial evaluation requires both a dynamic analysis of cash flow cycles and a static analysis of current debt obligations.
- A virtuous financing circle occurs when operating cash flows are sufficient to cover interest, dividends, and debt repayment, allowing for sustainable growth.
- A vicious circle arises when low operating cash flows or constant reinvestment needs force a company to borrow perpetually just to survive.
- Static analysis focuses on the immediate risk of illiquidity by comparing asset financing to free cash flow and examining debt term structures.
- Operating cash flow is the most critical metric, determined by business growth rates, operating margins, and working capital requirements.
- High net income can be deceptive if it is driven by asset value increases rather than profitable trade activity, leading to hidden vulnerability.
If the circle is a virtuous one... the company will gradually be able to grow and, as it repays its debt, it will be able to borrow more (the origin of the illusion that companies never repay their loans).
Free Cash Flow and Financing
- Free cash flow after interest determines whether a firm must seek external funding or can return capital to stakeholders.
- Financial analysis focuses on three primary levers: equity capital issues, debt policy, and dividend policy.
- Debt fluctuations should be analyzed to determine if a firm is optimizing its financial structure or funding massive investment projects.
- The text rejects the 'common-sense' rule that capital expenditure should be strictly limited to operating cash flow.
- Modern financial theory suggests that every division should be self-financing based on its risk-adjusted profitability rather than relying on 'cash cows'.
- Investment decisions should be driven by marginal profitability relative to the required rate of return, not just available cash.
With the development of financial markets, every division whose profitability is commensurate with its risk must be able to finance itself.
Analyzing Debt Repayment Capacity
- Financial theory suggests that a company's financing cycle must be balanced against its investment cycle to ensure long-term solvency.
- The most reliable method for assessing debt capacity is projecting future cash flow statements from a detailed business plan.
- A company's ability to raise emergency equity depends heavily on its shareholder structure, with core shareholders providing more stability than fragmented ownership.
- The net debt to EBITDA ratio serves as a primary 'quick-and-dirty' metric for lenders to evaluate a firm's leverage and repayment speed.
- A ratio of 2.5 times EBITDA is generally viewed as a critical threshold, beyond which a company's debt load is considered heavy and potentially risky.
A value of 2.5 is considered a critical level, below which the company should generally be able to meet its repayment obligations.
Leverage Ratios and Sector Stability
- The net debt to EBITDA ratio serves as a primary indicator for credit risk, with ratios exceeding 5 or 6 typically classifying debt as high-yield or junk bonds.
- Lenders prioritize cash flow predictability over raw earnings, favoring sectors like utilities and food retail due to their stable revenue streams.
- The relevance of the net debt/EBITDA ratio diminishes in businesses where working capital fluctuations significantly impact actual cash availability.
- Historical data from 2000–2015 shows that capital-intensive sectors like utilities and telecom maintain consistently higher leverage than volatile sectors like IT or luxury goods.
- Asset tangibility plays a crucial role in borrowing capacity, as real estate in food retail provides collateral value independent of the primary business operations.
When the value of the ratio exceeds 5 or 6, the debt becomes “high-yield”, the politically correct term for “junk bonds”.
Solvency and Liquidity Ratios
- The Interest Coverage Ratio (ICR) measures a firm's ability to meet interest obligations, with a 3:1 ratio serving as the critical threshold for lender confidence.
- Modern rating agencies prioritize the ratio of cash flow to net debt over traditional accounting metrics to better reflect actual repayment capacity.
- The debt-to-equity ratio is criticized as an outdated measure of solvency because equity only serves to repay loans during bankruptcy, not in normal operations.
- A company's ability to carry debt is highly industry-dependent; high-margin utilities can support more leverage than thin-margin travel companies.
- Illiquidity occurs when the maturity of a company's assets exceeds the maturity of its liabilities, creating a mismatch between cash receipts and disbursements.
- Using the market value of equity rather than book value provides a more realistic, albeit volatile, perspective on a company's financial standing.
The debt-to-equity ratio is still computed by some analysts. It is an unfortunate illustration of inertia of concepts in finance.
Managing Liquidity and Maturity Mismatch
- Illiquidity occurs when asset maturity exceeds liability maturity, forcing companies to find new funding to bridge the gap.
- A liquid balance sheet ensures that for every maturity period, the cash generated from assets exceeds the liabilities coming due.
- Failure to maintain liquidity results in a loss of independence, as the company must 'borrow from Peter to pay Paul' to survive.
- The current ratio and quick ratio (acid test) are primary metrics used by banks to monitor a borrower's ability to meet short-term obligations.
- The quick ratio specifically excludes inventories, treating them as fixed assets that cannot be liquidated rapidly in an emergency.
- A quick ratio below 1 indicates a high risk of bankruptcy if short-term lenders withdraw payment facilities.
Analysing liquidity means analysing the risk the company will have to “borrow from Peter to pay Paul”.
The Current Ratio Evolution
- Traditional analysis mandates a current ratio above one to provide a buffer against business risks like inventory loss or bad debt.
- A current ratio below one indicates that fixed assets are being financed by short-term borrowings, creating a potential liquidity mismatch.
- Modern financial analysis has shifted focus from maturity dates to the choice between equity capital and financial debt.
- Financing permanent working capital with short-term resources leaves a company defenseless during a liquidity crisis.
- Companies with high working capital needs, such as champagne producers, often rely on equity markets for stable funding.
- While revolving credits are common, full and permanent reliance on them can exhaust borrowing capacity and inflate interest costs.
The company that does so will be defenceless in the event of a liquidity crisis, which could push it into bankruptcy.
Working Capital and Financial Risk
- Short-term borrowing to finance permanent working capital creates a dangerous trap where repayment requires liquidating the company's operations.
- Companies with high export volumes or construction projects often lack sufficient equity, relying on risky revolving credits that fail during downturns.
- Negative working capital is not necessarily a weakness; it can represent a more robust financial structure if fixed assets are primarily equity-financed.
- While companies with negative working capital react faster in crises, they remain vulnerable to sudden changes in supplier payment terms or legislative shifts.
- A contraction in business volume for negative working capital firms triggers a cash drain that can rapidly destabilize the entire financial structure.
A short-term loan that finances permanent working capital cannot be repaid by the operating cycle except by squeezing that cycle down, or in other words, by beginning to liquidate the company.
Financial Analysis and Liquidity
- Indesit's 2009 overhaul initially boosted cash flow to historic highs, but subsequent years saw a decline that failed to fully cover dividends.
- A collapse in EBITDA during 2013 caused the debt-to-EBITDA ratio to double, rising from a moderate level to 2.3.
- Despite rising debt ratios, the group maintained strong short-term liquidity through cash reserves and 400 million euros in undrawn credit lines.
- Dynamic financial analysis relies on the cash flow statement to ensure operating activities cover investments, repayments, and dividends.
- Static analysis evaluates solvency using the net debt/EBITDA ratio, which generally should not exceed a value of 4 for healthy repayment capacity.
But in 2013 it collapsed to €178m versus €245m the previous year pushing the debt to EBITDA ratio to 2.3 in 2013.
Financial Analysis and Cash Flow
- The text presents a series of practical exercises and case studies focused on interpreting cash flow statements and corporate debt structures.
- Comparative data for major corporations like Vodafone, Carrefour, and Peugeot illustrate how different industries manage capital expenditure and debt reduction.
- The material emphasizes that high debt-to-equity ratios, such as National Grid's 1.9, must be evaluated against the company's ability to generate consistent cash flow.
- Short-term financing risks are highlighted, specifically the danger of being unable to refinance low-interest loans upon their rapid maturity.
- Liquidity analysis is explored through the lens of asset-liability matching, questioning whether current assets can sufficiently cover maturing liabilities.
How would you pay off a loan in three months? You run the risk of not being able to raise new funds when your cheap loan matures.
Corporate Profitability and Cash Flow
- The text contrasts various corporate financial states, ranging from high-growth companies with cash deficits to mature firms capable of debt reduction.
- Ivankovic and Moser srl exemplify the 'vicious circle' where poor working capital management or declining operations lead to heavy debt and potential bankruptcy.
- Ringkvist AB represents a 'virtuous circle' where investments generate sufficient operating cash to fund growth, dividends, and debt stabilization simultaneously.
- Corporate efficiency is defined by a company's ability to deliver returns that meet or exceed the requirements of both lenders and shareholders.
- Profitability analysis serves as the ultimate assessment of whether a company's wealth creation justifies its capital expenditure and financing structure.
The company is forced to call on its shareholders to bail it out.
Measuring Capital Profitability
- Profitability is defined as the ratio of wealth created to the capital invested, distinct from margins which only measure earnings relative to sales volume.
- Return on Capital Employed (ROCE) is the primary metric for analysts, calculated as net operating profit after tax (NOPAT) divided by capital employed.
- ROCE is the product of two distinct drivers: the operating margin and the asset turnover rate.
- Different industries achieve similar ROCE through varying strategies, such as high-margin/low-turnover satellite operators versus low-margin/high-turnover retailers.
- Return on Equity (ROE) measures net income against shareholders' equity, often adjusted by analysts to exclude goodwill impairment and non-recurring items.
- Consistency in methodology, such as choosing between opening or closing capital figures, is more critical for long-term comparison than the specific method chosen.
Much ink has been spilled over the issue of whether opening or closing capital employed or an average of the two figures should be used.
The Mechanics of Leverage
- The leverage effect explains the relationship between a company's return on equity (ROE) and its return on capital employed (ROCE).
- Wealth generation is driven by operating profit, which is then apportioned between interest payments for debtholders and net income for shareholders.
- Financial leverage allows a company to deliver an ROE that exceeds the return generated by its core industrial and commercial activities.
- The mechanism relies on a surplus where the ROCE is higher than the after-tax cost of debt, with that surplus accruing to shareholders.
- Leverage is a double-edged sword that can either amplify returns into a 'corporate nirvana' or depress them into a financial nightmare.
Readers should pause for a second to contemplate this corporate nirvana, which apparently consists in making more money than is actually generated by a company’s industrial and commercial activities.
The Leverage Effect Mechanics
- Financial leverage allows a company to increase its return on equity (ROE) by using debt to finance assets that generate returns higher than the cost of borrowing.
- The 'leverage effect' only functions positively when the return on capital employed (ROCE) exceeds the after-tax cost of debt.
- If ROCE falls below the cost of debt, the leverage effect reverses, creating a deficit that reduces the ROE below the level of the ROCE.
- Taxation must be factored into these calculations because interest expenses provide a tax shield, effectively reducing the net cost of borrowing.
- The relationship between debt and equity can be mathematically modeled to show how surplus or deficit from borrowed funds is attributed directly to shareholders.
When the return on capital employed falls below the cost of debt, the leverage effect of debt shifts into reverse and reduces the return on equity.
The Mechanics of Financial Leverage
- Return on Equity (ROE) is defined as the sum of the Return on Capital Employed (ROCE) and the leverage effect.
- The leverage effect is determined by the spread between a company's ROCE and its after-tax cost of debt, multiplied by its gearing ratio.
- Financial leverage acts as a double-edged sword, magnifying returns when ROCE exceeds debt costs but reversing when ROCE falls or interest rates soar.
- Negative net debt, or surplus cash, can actually depress ROE if the return on short-term investments is lower than the return generated by the company's core operations.
- The Burberry case study illustrates how a highly profitable firm can see its ROE diluted by holding large amounts of cash yielding minimal interest.
- Historical data across European sectors shows that ROCE and ROE vary significantly by industry, with sectors like Pharmaceuticals and Media maintaining consistently high returns.
The leverage effect goes into reverse once return on capital employed falls below the cost of debt.
Analyzing ROCE and Leverage
- The text provides a comparative analysis of Return on Capital Employed (ROCE) and Return on Equity (ROE) across various European sectors from 2000 to 2015.
- A global improvement in ROCE was observed starting in 2000, followed by a significant downturn beginning with the 2008 financial crisis.
- Discrepancies between ROE and ROCE in sectors like telecoms are attributed to high debt levels required for capital-intensive operations.
- The leverage effect is calculated by comparing the after-tax ROCE against the after-tax cost of debt, multiplied by the company's gearing ratio.
- Specific financial data points from the income statement and balance sheet, such as EBIT and net debt, are essential for determining a firm's true return on equity.
The explanation lies in the level of debt, which is generally high for telecoms operators as it is a capital-intensive sector and lower in the automotive industry, which exhibits poorer visibility.
Analyzing Leverage and Equity Returns
- The text provides a quantitative breakdown of Return on Equity (ROE) by combining Return on Capital Employed (ROCE) with the leverage effect.
- Two fundamental accounting equations are emphasized to ensure consistency: Capital Employed equals equity plus net debt, and Operating Profit after tax equals net income plus net financial expense.
- Goodwill impairment can artificially inflate return figures by removing significant capital from the balance sheet, creating a 'deceptively high' nominal return.
- Analysts are advised to use gross goodwill figures and add back impairments to shareholders' equity to maintain a realistic view of capital requirements.
- The text suggests that losses carried forward should ideally be corrected in book equity calculations, though this is often difficult due to data accessibility.
- Consolidated financial statements introduce specific complexities regarding the treatment of associate companies and goodwill accounting.
Just because whole chunks of capital appear to have vanished into thin air from a balance sheet perspective does not mean that shareholders will give up their normal rate of return requirements on the capital that has done a perfectly legitimate disappearing act under accounting standards.
Accounting for Capital and Profitability
- Income from associates can be classified as either financial income or operating profit depending on whether the group is financial or industrial in nature.
- Companies in sectors like retail often operate with negative capital employed because their negative working capital exceeds their net fixed assets.
- For firms with negative capital employed, shareholders' equity serves primarily as a guarantee for lenders rather than a means of financing capital expenditure.
- Calculating ROCE for companies with high cash reserves requires including short-term financial investments to reflect how financial income influences product pricing.
- Book-based profitability indicators have limitations because balance sheet debt figures may not accurately reflect average debt levels or seasonal fluctuations.
- Internal analysts have a distinct advantage over external ones as they can use restated or average figures to correct anomalous leverage effect results.
Companies with negative capital employed usually have high negative working capital exceeding the size of their net fixed assets.
Limits of Book Returns
- Book-based returns on capital and equity are insufficient financial metrics because they fail to account for risk.
- Managers may make unwise decisions if they rely solely on accounting returns as a primary objective.
- Return on equity can be artificially inflated through leverage, increasing company risk without appearing in accounting formulas.
- Market valuations naturally adjust for book profitability, creating a disconnect between book value and market value.
- Accounting indicators are useful for historical analysis and control but should not be used to project future required rates of return.
It is easy to boost book returns on equity by gearing up the balance sheet and harnessing the leverage effect.
The Leverage Effect Strategy
- The 'forging ahead regardless' strategy combines high capital expenditure with low margins to capture market share during growth periods.
- Companies using this strategy rely on debt to bridge the gap between low cash flows and high investment needs, artificially boosting ROE through leverage.
- While leverage can inflate returns, it is inherently unstable and can lead to collapse when market growth slows, as seen with Suntech in 2013.
- Long-term growth in return on equity is only sustainable when driven by increasing return on capital employed (ROCE) rather than financial engineering.
- The leverage effect creates real value only in specific scenarios, such as periods of high inflation or as a disciplinary mechanism in highly indebted firms.
- The case of Indesit illustrates how a decline in ROCE below investor expectations can force a company to seek external partners for survival.
This was the strategy of Suntech, the Chinese world leader in solar panels, which enabled it to take a lion’s share of its market, or as a consultant would put it, to move down its experience curve, but which was also the source of its collapse in 2013.
The Mechanics of Leverage
- Financial leverage acts as a double-edged sword, boosting return on equity (ROE) only when the return on capital employed (ROCE) exceeds the cost of debt.
- Book returns like ROCE and ROE are historical accounting measures that fail to account for risk or current market valuations.
- The leverage effect does not create intrinsic value because any increase in potential profit is offset by a proportional increase in financial risk.
- Long-term sustainable return on equity is fundamentally dependent on a healthy return on capital employed rather than capital structure manipulation.
- The primary utility of the leverage effect is identifying whether equity returns stem from operational efficiency or aggressive debt levels.
Although it may boost return on equity, it leads to an increase in risk that is proportional to the additional profit.
Financial Performance and Leverage Analysis
- The text provides a comparative financial analysis of major corporations like L’Oréal and Carlsberg, focusing on asset structures and working capital.
- It explores the relationship between Return on Capital Employed (ROCE) and Return on Equity (ROE) through the lens of the leverage effect equation.
- The data highlights how debt can amplify returns for shareholders but simultaneously increases the financial risk profile of the company.
- A 'nirvana' state in business is described as achieving high margins with low capital expenditure, though this typically invites aggressive competition.
- The analysis suggests using gross figures rather than net figures for goodwill to avoid artificially inflating book returns through impairment losses.
It’s like nirvana, high margins and low capex will generate high returns.
Analyzing ROCE and Leverage
- The relationship between Return on Capital Employed (ROCE) and the cost of debt determines whether financial leverage boosts or depresses Return on Equity (ROE).
- Consistency in calculation is vital, particularly regarding the inclusion of income from associates and the choice between marginal or actual tax rates.
- A high ROE can be a deceptive indicator of performance if it is driven by 'unbridled' leverage rather than strong underlying operating profitability.
- The case of L’Oréal demonstrates how large, low-yield investments can significantly drag down an otherwise high ROCE.
- Financial risk increases dramatically when a company's ROCE declines while it simultaneously increases debt to maintain a 'mirage' of high equity returns.
Group A’s improvement is merely a mirage because it is attributable entirely to a stronger and stronger leverage effect while its return on capital employed is steadily declining.
Solvency and Value Creation
- Financial analysis must ultimately determine if a company can remain solvent and generate returns higher than the cost of capital.
- Solvency is defined as the ability to honor all commitments by liquidating assets if operations cease.
- Equity acts as a financial life raft, absorbing capital losses to protect the company from immediate insolvency during liquidation.
- The true value of assets in a liquidation scenario depends heavily on their independence from company operations and the existence of a secondary market.
- There is a fundamental link between value creation and solvency, as persistent failure to create value typically leads to insolvency.
Since, by definition, a company does not undertake to repay its shareholders, its equity represents a kind of life raft that will help keep it above water in the event of liquidation.
The Spiral of Debt
- Company solvency is fundamentally tied to the level of shareholders' equity relative to business risks and total commitments.
- Loss-making firms lose the benefit of the tax shield on debt, forcing them to bear the full cost of financial expenses and deepening their deficit.
- A common but dangerous response to declining equity is raising additional debt, which increases interest costs and creates a cumulative negative effect.
- In a crisis, the market value of equity collapses much faster than the book value, often leading to a situation where debt exceeds the total value of the firm.
- The 'gearing' or debt-to-equity ratio can soar rapidly during a downturn, frequently necessitating restructuring or leading to bankruptcy.
This scenario shows how debt can spiral in the event of a crisis!
Value Creation and Net Assets
- The fundamental principle of value creation is that return on capital employed must exceed the total cost of capital.
- Net assets represent the difference between total assets and liabilities, serving as a primary indicator of shareholders' equity.
- Calculating net assets is complex due to variables like goodwill, intangible assets, and unrealized capital gains.
- Consolidated accounts present unique challenges for net asset calculation because of minority interests and group structures.
- A company's survival as an independent entity often depends on its ability to secure financing during economic crises.
- The text recommends using individual accounts and the proportional method for more accurate consolidated net asset figures.
A company will be able to create value during a given period if the return on capital employed (after tax) that it generates exceeds the cost of the capital (i.e. equity and net debt) that it has raised to finance capital employed.
Reverse Cash Flow Analysis
- Delayed accounting documents are a primary indicator of severe business distress and potential failure.
- Analysts use reverse cash flow statements to estimate earnings by working backward from changes in net debt.
- Struggling companies often have deficient information systems that produce obsolete data by the time it is published.
- Net debt and working capital components can be estimated rapidly even when formal accounting systems are subpar.
- A decline in cash not linked to investment or financing activities serves as an undeniable signal of operating losses.
- In specific sectors like construction or defense, cash flow is often a more reliable profitability indicator than reported earnings.
It may perhaps surprise some readers to see that we have often used cash flow statements in reverse, i.e. to gauge the level of earnings by working back from the net decrease in debt.
Solvency and Value Creation
- Indesit's 2013 performance demonstrates a paradox where a company remains solvent despite significant value destruction for shareholders.
- A company is technically solvent if its net assets—the difference between total assets and total liabilities—remain positive upon liquidation.
- Value creation is only achieved when the after-tax return on capital employed exceeds the weighted cost of the capital used to finance it.
- Market capitalization can remain high despite poor returns if investors anticipate a strategic merger or acquisition at a premium.
- For distressed companies with unavailable accounts, a 'reverse cash flow statement' starting from debt reduction can reveal the scale of survival-threatening losses.
This value destruction for the year 2013 is not reflected in the market capitalisation (€1034m) being significantly above the book value of equity.
Financial Analysis and Markets
- The text contrasts the financial health of three major corporations in 2012: Yell (near bankruptcy), Nestlé (excellent stability), and Peugeot (weak value destruction).
- Key financial metrics such as the debt-to-EBITDA ratio and Return on Capital Employed (ROCE) are used to determine solvency and equity value.
- Consolidated accounts are highlighted as essential for identifying risks in heavily geared affiliates and parent companies with insufficient dividend flow.
- The primary role of the financial system is defined as bridging the gap between economic agents with surplus resources and those with financial deficits.
- Investors in capital markets seek two distinct types of returns: the risk-free interest rate for the time value of money and a premium for taking on risk.
This company is on the verge of bankruptcy. This is Yell, the UK phone book company, in 2012 just before its restructuring.
Direct and Indirect Finance
- Direct finance involves the financial system acting as a broker to match suppliers of funds directly with those in need.
- Indirect finance, or intermediation, occurs when institutions like banks collect deposits to issue loans, acting as a gatekeeper.
- In direct finance, transactions do not appear on the broker's balance sheet, whereas intermediaries record all funds as assets and liabilities.
- Intermediaries earn profit through the 'spread,' which is the difference between the interest earned on loans and the interest paid to depositors.
- Modern economies are undergoing disintermediation, where companies and individuals bypass banks to interact directly with capital markets.
- The development of capital markets allows companies to move beyond simple debt financing toward more diverse funding options.
The intermediary’s balance sheet and income statement thus function as holding tanks for both parties – those who have surplus capital and those who need it.
Bank-Based vs Market-Based Economies
- Bank-based economies rely on central bank refinancing and government-influenced interest rates rather than market equilibrium.
- The bank-based model is inextricably linked to high inflation, which encourages corporate debt by offering zero or negative real interest rates.
- In credit-based systems, savings rates are low and capital flows toward tangible assets like real estate rather than corporate securities.
- Market-based economies prioritize the direct issuance of shares and bonds to investors, reducing the role of traditional bank intermediation.
- In a market-driven model, banks pivot their business toward brokerage services and lending to households or small businesses without market access.
It is difficult to be wise when everybody else is behaving like a fool.
The Rise of Capital Markets
- Financial disintermediation is forcing banks to align their lending and deposit rates with volatile market forces.
- The shift from credit-based to capital market economies has changed the nature of financial risk from cash flow reliability to security valuation.
- European economies have transitioned into capital market systems where financial managers act primarily as sellers of securities.
- Positive real interest rates and the financing of budget deficits through bonds have accelerated the growth of global capital markets.
- The core functions of a financial system extend beyond supply and demand to include risk management, information dissemination, and conflict resolution.
During a stock market crash, for example, a company’s share price might sink even though its published earnings exceed projections.
Functions of Financial Systems
- Financial systems provide diverse means of payment, such as credit cards and electronic transfers, to facilitate transactions beyond physical currency.
- The system enables the pooling of funds for massive projects and allows companies to subdivide capital so investors can diversify their holdings.
- Capital is distributed across time and space, allowing individuals to borrow for homes or save for retirement while shifting surpluses between global economies.
- Risk management tools like mutual funds and insurance allow individuals to pool risks and avoid the catastrophic loss of single-asset exposure.
- Financial institutions lower the cost of information by providing price signals and expert analysis that would be too expensive for individuals to conduct alone.
- The system creates liquidity, allowing investors to convert assets like shares into cash more easily than physical investments like a neighbor's factory.
Imagine if every-thing could only be paid for with bills and coins!
Evolution of Modern Banking
- Contractual relationships in finance often suffer from information asymmetry and monitoring difficulties between investors and managers.
- The historical distinction between commercial and investment banks has blurred due to mega-mergers and the repeal of the Glass-Steagall Act.
- Large financial conglomerates now pursue a 'universal bank' or 'one-stop shopping' model to gain competitive advantages through scale.
- Post-crisis regulations in the US and France have attempted to re-separate retail deposits from speculative market activities.
- Retail banking operates on thin margins using industrial-scale organization, while Corporate and Investment Banking (CIB) focuses on sophisticated services for large entities.
If the fund manager does not uphold his end of the bargain, the market will lose confidence in him.
Banking Roles and Market Efficiency
- Investment banks serve as essential intermediaries, facilitating IPOs, capital increases, and the issuance of complex instruments like convertible bonds.
- The 'matchmaker' role of banks is most evident in trading rooms, where they connect corporate issuers with investors in debt and equity markets.
- Beyond financing, banks provide risk hedging for commodities and foreign exchange, while also engaging in proprietary speculation.
- The 2008 financial crisis highlighted that no specific banking model is immune to failure; success depends more on management quality than institutional structure.
- The Efficient Market Hypothesis suggests that security prices instantaneously reflect all available information, making future price movements inherently unpredictable.
- Eugene Fama's framework for market efficiency relies on three primary tests: price predictability, event response, and the impact of insider information.
The investment bank’s trading room is where its role as “matchmaker” between the investor and the issuer takes on its full meaning.
The Efficient Market Hypothesis
- Weak-form efficiency posits that past price and volume data cannot predict future returns, rendering technical analysis and trend-based models worthless.
- Semi-strong efficiency suggests that market prices instantly reflect all publicly available information, including financial reports and corporate announcements.
- The Ubisoft case study demonstrates semi-strong efficiency, where a game delay announcement caused an immediate 24% price collapse.
- Strong-form efficiency implies that even insider information cannot provide an edge, though this requires rigorous regulatory enforcement to be true in practice.
- In an efficient market, professional managers typically underperform the market average by an amount roughly equal to their management fees.
- Market efficiency is maximized when information access is cheap, transaction costs are low, and liquidity is high.
In fact, in an efficient market, the experts’ performance is slightly below the market average, in a proportion directly related to the management fees they charge!
Drivers of Market Efficiency
- Market efficiency relies on the immediate discounting of future expected gains into today's stock prices.
- Transaction costs, including brokerage and underwriting fees, act as friction that slows the market's reach toward equilibrium.
- High liquidity is essential for efficiency as it allows new information to be integrated into share prices rapidly through frequent trading.
- Illiquid securities carry a risk premium, effectively rewarding investors for the difficulty of trading in inefficient conditions.
- Investor rationality is a prerequisite for efficiency, requiring that market participants act consistently with the information they receive.
The premium is tantamount to a reward for putting up with illiquidity, i.e. when the market is not functioning efficiently.
Market Efficiency and Behavioral Anomalies
- Research since the 1960s has identified numerous anomalies that challenge the Efficient Market Hypothesis, including excess volatility and price noise.
- Dual listings and closed-end funds demonstrate that identical dividend streams can trade at different prices for extended periods, complicating arbitrage.
- Calendar and meteorological anomalies suggest that factors like the day of the week or even the weather can statistically influence stock performance.
- Eugene Fama defends market efficiency by questioning the methodologies used to identify these anomalies, particularly regarding market overreaction.
- Behavioral finance emerges as a counter-theory, suggesting that investor irrationality and psychological factors drive market movements.
- Interdisciplinary research involving neuroscientists and psychologists aims to understand how environment and circumstances influence economic choices.
There is consistent observation that stock prices perform better when the sun shines than when it rains.
Behavioral Finance and Market Mimicry
- Investors exhibit loss aversion, taking higher risks to avoid certain losses while preferring guaranteed smaller gains over risky larger ones.
- The lack of investor rationality creates long-term market anomalies that arbitrage fails to correct efficiently.
- André Orléan identifies informational and self-mimicry as drivers of market behavior, where collective belief creates self-fulfilling prophecies independent of economic reality.
- Program trading and automated liquidation thresholds can exacerbate mimetic behavior, leading to extreme volatility like the 2010 'flash crash'.
- While behavioral finance highlights the flaws in efficient market theory, it currently lacks the comprehensive modeling required to fully replace neoclassical frameworks.
- Market participants are categorized into three primary roles: hedgers seeking risk protection, speculators, and arbitrageurs.
This could drive an asset manager mad!
Hedging Versus Speculation
- Hedging protects a company's profit margins by isolating business value from capital market fluctuations.
- Speculation is the deliberate assumption of risk based on predictions of future asset values.
- Professional traders act as speculators by buying low and selling high to profit from market movements.
- Most investors are speculators by nature because any prediction of future cash flow involves an element of betting on the future.
- Speculators provide a vital economic service by assuming the risks that hedgers and other market participants wish to avoid.
- The distinction between hedging and speculation lies in whether risk is being transferred away or actively sought out.
Not surprisingly their motto is “ Buy low, sell high, play golf! ”
Speculation and Arbitrage Dynamics
- Speculators provide essential market utility by assuming exchange rate and intermediation risks that companies seek to avoid.
- Speculative bubbles occur when market forces become divorced from economic reality, driven by self-sustaining cycles of buying.
- The collapse of a bubble is often accelerated by speculators liquidating positions to repay loans used for initial purchases.
- Arbitrageurs profit from price discrepancies across different markets without assuming the directional risk inherent in speculation.
- The actions of arbitrageurs drive markets toward equilibrium by equalizing prices for the same security across different exchanges.
- While theoretically risk-free, practical arbitrage requires high liquidity and often exists on the frontier of speculative behavior.
Once a sufficient number of speculators think that a stock will rise, their purchases alone are enough to make the stock price rise.
The Mechanics of Arbitrage
- Arbitrageurs eliminate market imperfections by buying and selling until disequilibrium is reduced to zero.
- The constant activity of arbitrage ensures that all prices for a given asset remain equal at any specific point in time.
- Market efficiency and liquidity are dependent on the simultaneous presence of hedgers, speculators, and arbitrageurs.
- Individual investors often blur the lines between roles, such as a speculator performing partial hedges or a hedger speculating on remaining positions.
- The financial system serves to bridge the gap between agents with surplus funds and those with funding needs through direct or indirect finance.
- The term 'hedge fund' is often a misnomer, as these entities typically engage in high-stakes speculation rather than risk mitigation.
Throughout this book, you will see that financial miracles are impossible because arbitrage levels the playing field between assets exhibiting the same level of risk.
Dynamics of Modern Financial Markets
- The global economy has transitioned from a credit-based system reliant on bank loans to a capital market economy focused on shares and bonds.
- Financial systems serve critical functions by pooling investor funds for large projects and allowing for portfolio diversification through subdivided equity.
- Market efficiency is driven by liquidity and information availability, but is frequently hindered by irrational human behavior and mimicry.
- A healthy market requires the interaction of three distinct players: hedgers who avoid risk, speculators who assume it, and arbitrageurs who correct price discrepancies.
- Banks have evolved from traditional lenders into advisors that facilitate corporate access to complex equity and bond markets.
The last of these factors probably constitutes the biggest hindrance to market efficiency because human beings cannot be reduced to a series of equations.
Market Intermediaries and Efficiency
- Brokers act as connectors between buyers and sellers for a commission, while market makers profit from the spread between buy and sell prices.
- Market efficiency is tested by examining if public information, such as accounting indicators or anticipated losses, is already priced into securities.
- Inefficiencies are identified when specific groups, like company managers, can consistently achieve higher-than-average profits through insider knowledge.
- Behavioral finance is introduced as a field that accounts for the non-rational psychological factors influencing investor decision-making.
- Market inefficiency poses a greater risk to small companies because low liquidity can cause their share prices to deviate from stable values for extended periods.
Small companies, since the limited number of investors interested in their shares means that their liquidity is low and that their share prices could shift away from a stable value for long periods.
Financial Markets Bibliography
- The text provides a comprehensive list of academic and professional resources focused on macroeconomic topics and global credit bubbles.
- It highlights foundational theories of market efficiency, including seminal works by Eugene Fama and Burton Malkiel.
- A significant portion of the bibliography is dedicated to empirical evidence of market anomalies, such as the 'size effect' and 'day of the week' returns.
- The references bridge the gap between classical rational market theories and modern critiques involving financial risk and systemic crises.
- The list includes practical data sources, such as the World Federation of Exchanges, for accessing global stock market statistics.
J. Fuller, M. Jensen, Just say no to Wall Street: Putting a stop to the earnings game, Journal of Applied Corporate Finance, 14(4), 27–40, Winter 2002.
Time Value and Capitalisation
- The time value of money is a fundamental economic concept essential for progress, even in risk-free environments.
- Financial techniques like discounting and net present value are described as essential reflexes that must be mastered by practitioners.
- Simple total return calculations can be misleading when evaluating long-term investments without accounting for annual compounding.
- The concept of capitalisation assumes that annual revenue flows are reinvested to produce additional interest over time.
- A 1700% total return over ten years does not equate to a 170% annual return due to the mechanics of compound interest.
These are more than just tools, but actual reflexes that must be studied and acquired.
The Power of Compound Interest
- Calculating long-term returns requires more than simply dividing the total gain by the number of years.
- Capitalizing income involves reinvesting returns so they become part of the principal capital for future periods.
- Compound interest occurs when previously earned interest begins to generate its own interest in subsequent years.
- The mathematical relationship for growth over time is expressed by the capitalization formula: Vn = Vo * (1 + r)^n.
- Foregoing the immediate receipt of income is the necessary trade-off for achieving exponential capital growth.
Capitalising income means foregoing receipt of it. It then becomes capital and itself begins to produce interest during the following periods.
The Power of Capitalisation
- Terminal capital is defined as a function of the initial investment value, the rate of return, and the duration of the investment.
- The absence of intermediate income during an investment's lifespan must be offset by a significantly higher terminal valuation to maintain a competitive rate of return.
- Small changes in the timing of cash flows or the capitalisation rate lead to exponential differences in terminal value over long periods.
- A sum capitalised at 15% over 20 years results in a terminal value six times higher than the same sum capitalised at 5%.
- The logic of capitalisation applies equally to equity valuations and industrial projects where early-stage income is often non-existent.
After 20 years, a sum capitalised at 15% is six times higher than a sum capitalised at one-third the rate (i.e. 5%).
The Mechanics of Discounting
- Discounting is the process of calculating the present value of future cash flows to account for the depreciation of value over time.
- Financial precision requires tracking actual cash flows at the exact moment of receipt rather than when they are legally due.
- The discounting factor, a multiplier below 1, is used to mathematically express that future money is worth less than money held today.
- Investors use discounting to determine the maximum price they are willing to pay for an asset based on their required rate of return.
- Discounting and capitalization are inverse operations of the same phenomenon: the time value of money.
- A sum received in the future is always worth less than the same sum received today because it cannot be immediately spent or reinvested.
To discount is to “depreciate” the future. It is to be more rigorous with future cash flows than present cash flows, because future cash flows cannot be spent or invested immediately.
Valuation and Net Present Value
- Discounting is the inverse of capitalization, used to convert future cash flows into their present value equivalents.
- The present value of a financial security is defined as the sum of all its future cash flows discounted by a specific rate.
- Net Present Value (NPV) represents the difference between a security's calculated present value and its current market price.
- In efficient markets, investor activity pushes NPV toward zero, meaning the market price eventually aligns with the security's fair value.
- The NPV concept applies beyond securities to any capital investment, such as factory construction or product launches, representing the wealth created by the outlay.
In efficient, fairly valued markets, net present values are zero, i.e. market value is equal to present value.
Discounting and Present Value Rules
- Net present value (NPV) and the discounting rate share an inverse relationship, where higher required returns lead to lower asset valuations.
- The discounting factor for each year represents the depreciation of future cash flows based on the investor's demand for a greater return over time.
- Annuity formulas allow for the simplification of present value calculations for constant cash flows over a fixed number of years.
- Perpetuities represent infinite constant cash flow streams, where the present value is calculated simply as the cash flow divided by the discount rate.
- Growth formulas can be applied to both finite annuities and infinite perpetuities to account for cash flows that increase annually at a fixed rate.
The higher the discounting rate, the more future cash flow is depreciated and, therefore, the lower is the present value.
Time Value of Money
- Capitalisation determines the future value of a sum by applying compound interest over a specific duration.
- Discounting is the inverse of capitalisation, calculating the present value of future cash flows based on required rates of return.
- Net Present Value (NPV) measures value creation or destruction by finding the difference between present value and purchase price.
- Present value and NPV share an inverse relationship with discount rates; as rates rise, values fall.
- Financial calculations must prioritize the actual timing of cash receipts and payments over their due dates.
- In equilibrium markets, net present values typically gravitate toward zero.
The higher the discount rate, the lower the present value and net present value, and vice versa.
Financial Valuation and Time Value
- The text presents a series of conceptual questions and practical exercises focused on Net Present Value (NPV) and the mechanics of discounting cash flows.
- It explores the inverse relationship between interest rates and present value, challenging the reader to identify market equilibrium conditions.
- Practical scenarios include comparing immediate payment discounts versus installments for services like pilot licensing and evaluating luxury assets like Francis Bacon paintings.
- The exercises highlight the power of compounding over long durations, using historical hypotheticals such as investments dating back to 33 AD.
- The distinction between financial and industrial markets is raised to prompt discussion on where positive NPV opportunities are more likely to be found.
If instead of throwing his 30 pieces of silver away in 33 AD, Judas had invested them at 3% per annum, how much would his descendants get in 2014?
Investment Decision Exercises
- The text presents a series of practical exercises focused on calculating Net Present Value (NPV) and internal rates of return.
- Scenarios include valuing perpetual incomes, growing annuities, and comparing the costs of leasing versus purchasing assets like parking spaces and real estate.
- Financial problems explore the long-term impact of discount rates on the valuation of securities and the diminishing difference between 40-year and perpetual cash flows.
- The exercises apply capital budgeting principles to personal career decisions, such as the net present value of pursuing an MBA versus continued employment.
- Retirement planning and pension fund growth are addressed through calculations of compound interest and required annual savings targets.
You have found your dream house and you have the choice between renting it with a lease in perpetuity for €12 000 or buying it.
Time Value of Money Answers
- The text provides solutions to exercises regarding Net Present Value (NPV), discounting, and the mechanics of compound interest.
- Discounting is defined as a method to account for the interest rate that remunerates the foregoing of immediate spending, independent of inflation or risk.
- Compound interest is highlighted as a powerful force where interest is earned on previously accumulated interest, leading to exponential growth over time.
- The text notes that arbitrage opportunities and market disequilibria are more frequent in industrial markets than financial markets due to the time required for physical execution.
- Financial decisions are occasionally framed against non-monetary value, such as the aesthetic pleasure of owning art versus the mathematical return on capital.
Over a very long period a small change in return creates huge differences.
The Internal Rate of Return
- The Internal Rate of Return (IRR) is defined as the specific discounting rate that results in a Net Present Value (NPV) of zero.
- While the term 'yield to maturity' is typically used for financial securities, 'IRR' is the standard terminology applied to capital expenditure projects.
- Calculating IRR involves solving for the discount rate where the market value of an investment equals the present value of its future cash flows.
- Beyond a 40-year horizon, additional income has a diminishing impact on present value calculations, often becoming negligible.
- Investors use IRR as a primary decision-making tool to compare expected returns against their required rate of return for a specific risk level.
If net present value (NPV) is inversely proportional to the discounting rate, then there must exist a discounting rate that makes NPV equal to zero.
IRR vs NPV Decision Making
- An investment is considered viable only when its internal rate of return (IRR) exceeds the investor's required rate of return.
- At fair market value, the internal rate of return is identical to the market return, resulting in a net present value (NPV) of zero.
- While IRR and NPV yield identical 'buy or sell' conclusions for single projects, they can provide conflicting signals when comparing multiple investments.
- The conflict between IRR and NPV often arises from differences in investment duration and the scale of value creation over time.
- Investment A shows a higher IRR (27.8%) over a short term, while Investment B shows a higher NPV (2.40) over a longer seven-year period.
- In cases of contradiction, NPV is generally preferred as it measures the total absolute value created rather than just a percentage rate.
If the cash flow schedule is the same, then calculating the NPV by choosing the discounting rate and calculating the internal rate of return (and comparing it with the discounting rate) are two sides of the same mathematical coin.
Reinvestment Rates and MIRR
- The standard Internal Rate of Return (IRR) assumes that interim cash flows are reinvested at the project's own IRR, which is often an unrealistically high and non-recurrent rate.
- Market competition and arbitrage tend to drive net present values toward zero, meaning exceptional returns eventually converge toward the required rate of return.
- The Modified Internal Rate of Return (MIRR) solves the reinvestment problem by compounding cash flows at the required rate of return to find a project's terminal value.
- Using MIRR reconciles discrepancies between NPV and IRR, providing a more realistic comparison between projects with different cash flow timings or initial outlays.
- Standard IRR calculations can fail when projects exhibit multiple internal rates of return, making the NPV rule a more reliable decision-making tool in complex scenarios.
While that is theoretically possible, it is the strong (and optimistic) form of the theory because competition among investors and the mechanisms of arbitrage tend to move net present values towards zero.
IRR Limitations and Loan Amortization
- The Internal Rate of Return (IRR) can fail as a decision tool when projects have no IRR or multiple IRRs due to unconventional cash flows.
- Net Present Value (NPV) is the superior metric for ranking investment opportunities and should be used whenever IRR results are ambiguous.
- Nominal interest rates serve as the basis for calculating debt service, which is the sum of interest and principal repayments over time.
- Bullet repayment structures involve paying only interest during the loan term with the entire principal due at maturity.
- Constant amortization and equal installment methods provide alternative ways to structure debt, with the latter resulting in a constant annuity.
- A loan's nominal interest rate is equivalent to its internal rate of return when the NPV of the loan's cash flows is zero.
Investments with “unconventional” cash flow sequences are rare, but they can happen.
Internal Rate and Loan Structures
- The internal rate of return (IRR) and nominal interest rate are identical when calculations are annual and principal repayment coincides with interest payments.
- Standard amortized loans involve a constant annuity where the interest portion decreases as the principal is gradually paid down.
- Zero-coupon loans differ by deferring all interest and principal payments until maturity, resulting in a single large future value payment.
- The timing of interest payments significantly alters the effective cost of a loan, even if the nominal interest amount remains the same.
- Paying interest semi-annually rather than annually represents an opportunity cost for the borrower, as funds cannot be reinvested during the interim.
In the first case you pay €5, instead of investing it for six months as you could have done in the second.
Nominal vs Effective Rates
- Nominal interest rates can be misleading because they do not account for the frequency of interest payments within a year.
- The effective annual rate provides a standardized benchmark by calculating the 'interest on interest' generated through compounding.
- Financial officers must prioritize the timing of disbursements, as the time value of money dictates that a euro today is worth more than a euro tomorrow.
- Two rates are considered equivalent only if they result in the same future value for the same principal over the same duration.
- Increasing the frequency of compounding—from annually to daily or even continuously—progressively raises the effective cost for the borrower and the return for the lender.
To avoid comparing apples and oranges, a financial officer must take into account the effective date of disbursement.
Effective vs Proportional Rates
- Continuous interest rates can be calculated using the mathematical constant e to determine annual equivalent rates.
- Proportional rates are defined by a direct ratio to time periods, such as 5% for six months being proportional to 10% per year.
- Effective annual rates and proportional rates are distinct concepts that should never be confused when evaluating financial costs.
- Proportional rates often hide the true cost of a loan, as they fail to account for the compounding effects captured by the effective annual rate.
- In short-term money markets, the proportional rate is typically lower than the effective annual rate, potentially misleading borrowers.
- Standard financial practice assumes the use of effective annual rates to ensure comparability across different investment and bond market instruments.
Proportional rates serve only to simplify calculations, but they hide the true cost of a loan.
Foundations of Interest Rates
- Interest rates serve as the theoretical foundation for discounting cash flows to account for the passage of time.
- Net Present Value (NPV) represents the difference between an investment's present value and its market value, typically equaling zero in an equilibrium market.
- The internal rate of return (IRR) is the discount rate that results in a zero NPV, but it assumes cash flows are reinvested at that same rate.
- While IRR is useful for evaluating single assets, NPV is the superior metric for choosing between multiple competing financial or industrial investments.
- Nominal interest rates differ from yield to maturity when interest is paid on a non-annual basis, requiring careful mathematical conversion.
- Proportional rates are merely tools for calculating specific interest payments and do not reflect the true economic value of different maturities.
The internal rate of return should be handled with care, as it is based on the implicit assumption that cash flows will be reinvested at the same rate.
Investment Decision Rule Exercises
- The text presents a series of quantitative problems focused on calculating yield to maturity (YTM) across various timeframes and compounding frequencies.
- It challenges the reader to compare different investment structures, such as small returns on large sums versus large returns on small sums.
- Practical scenarios involve bank offers with different compounding periods, requiring an understanding of how quarterly versus half-yearly rates affect terminal value.
- The exercises cover loan repayment schedules, specifically contrasting fixed annual installments with constant amortization methods.
- Bond valuation concepts are explored through the relationship between issue price, nominal value, and the resulting yield to maturity.
Is it better to make a small percentage on a very large amount or a large percentage on a small amount?
Internal Rate of Return Fundamentals
- The text clarifies that yield to maturity (YTM) does not measure absolute value creation, making Net Present Value (NPV) a superior metric for decision-making.
- It distinguishes between proportional rates, which relate linearly to time periods, and equivalent rates, which produce identical sums over the same duration.
- The relationship between discount rates and present value is inverse; a single yield to maturity exists where the present value of future cash flows equals the investment price.
- Investment duration is a critical factor, as a lower yield over a long period can create more value than a high yield over a negligible timeframe.
- Complex financial scenarios, such as specific cash flow patterns, can result in multiple internal rates of return for a single investment.
- Practical exercises demonstrate the impact of commissions, management fees, and capitalization frequency on the actual cost and yield of financial instruments.
If the discount rate increases, present value will drop and will never again be equal to the market price of the investment.
Risk and Return Fundamentals
- Risk is defined as the uncertainty regarding future asset values and cash flows, serving as the essential 'spice' of finance.
- While numerous factors can impact an asset's value, financial practice aims to consolidate these diverse risks into a single measurable figure.
- Industrial and commercial risks, such as technological breakthroughs or labor strikes, directly lower cash flow expectations and stock value.
- Financial risks include liquidity, solvency, and interest rate fluctuations, which can cause capital or opportunity losses even if an issuer meets its commitments.
- Macro-level threats like systemic risk, political instability, and inflation can lead to the collapse of the financial system or the depreciation of recovered capital.
- Regulatory changes and ethical failures, such as fraud or insider trading, represent significant external and internal threats to investor returns.
For better or for worse, without risk, finance would be quite boring!
The Nature of Financial Risk
- Risk is categorized into economic risks stemming from the real economy and financial risks arising from external market events.
- The concept of a 'risk-free rate' is a linguistic convenience, as risk is an omnipresent factor that can never be truly eliminated.
- Investor perception of uncertainty reduces security value even before a specific risk event materializes.
- Modern finance treats the risk of asset revaluation and devaluation as fundamentally the same, focusing on the existence of volatility itself.
- Fluctuations in value are driven by changes in expected cash flows or the discount rates applied to those flows, as demonstrated by interest rate sensitivity.
The so-called risk-free rate, to be discussed later, is simply a manner of speaking.
Security Valuation and Risk Volatility
- Security values fluctuate based on company-specific factors like cash flow projections and market-wide factors like interest rate changes.
- Currency exchange rate shifts can create a paradox where a domestic investor loses money while a foreign investor gains on the same asset.
- Financial risk is formally defined and measured by the volatility of a security's price or rate of return using variance and standard deviation.
- While equities are highly volatile in the short term, historical data suggests that risk tends to dissipate over long-term investment horizons.
- Successful long-term investing requires the emotional fortitude to withstand massive market collapses, such as the 57% loss seen in UK stocks in 1974.
It sometimes requires strong nerves not to give in to the temptation to sell when prices collapse, as happened with stock markets in 1929, 1974, September 2001 and October–November 2008.
Measuring Financial Risk and Return
- The text critiques the 'normal' Gaussian distribution model, noting that extreme market variations occur more frequently than theory suggests.
- Historical 'worst-case scenarios' such as the total disappearance of Russian and German markets highlight the catastrophic potential of tail risks.
- While investment risk tends to diminish over long timeframes, human investors are constrained by short-term needs and psychological stamina.
- The rate of return is defined as the sum of income and capital gains or losses relative to the initial investment value.
- Expected return is calculated as a probability-weighted average of all possible outcomes in an uncertain environment.
- Standard deviation, derived from the square root of variance, remains the primary statistical tool for quantifying investment risk.
In worst-case scenarios, it must not be overlooked that some financial markets vanished entirely.
Measuring Market and Specific Risk
- Financial risk is mathematically defined by the variance and standard deviation of returns around an expected outcome.
- Overall risk is composed of two distinct elements: market (systematic) risk and specific (idiosyncratic) risk.
- Market risk stems from macroeconomic factors like interest rates and inflation that affect all securities to varying degrees.
- Specific risk is unique to an individual company, resulting from internal events like factory fires, mismanagement, or product obsolescence.
- Because market and specific risks are independent, they can be calculated using a Pythagorean relationship where the square of overall risk equals the sum of the squares of its components.
While the holder of a government bond is sure to receive his coupons (unless the government goes bankrupt!), this is far from true for the shareholder of an offshore oil drilling company.
Understanding the Beta Coefficient
- The beta coefficient measures a security's sensitivity to market fluctuations, acting as a key indicator of market-linked volatility.
- A security's total risk is mathematically decomposed into market risk, which is proportional to beta, and specific risk, which is independent of market variations.
- Beta is calculated as the slope of a regression line comparing security returns against market returns, often referred to as the characteristic line.
- A beta greater than 1 indicates the security is more volatile than the market, while a beta below 1 suggests it is less affected by market swings.
- Empirical data shows that beta values are dynamic; for example, Orange's beta dropped from 1.83 to below 1 as the telecom industry matured.
- While most equities fall between 0.5 and 1.5, extreme cases like Bank of America (2.7) or McDonald's (0.4) illustrate the wide range of sensitivity across sectors.
The higher the beta, the greater the market risk borne by the security.
Determinants of Beta and Risk
- A security's beta is driven by its sector's sensitivity to the economy, with cyclical industries like temporary work or automotive showing higher volatility.
- Operational and financial leverage, specifically high fixed costs and high debt levels, increase a company's breakeven point and elevate its beta.
- Information transparency and management quality influence risk, as poor visibility leads the market to factor higher uncertainty into the share price.
- Higher forecast earnings growth typically results in a higher beta because future cash flows are more sensitive to changes in valuation assumptions.
- Portfolio diversification allows investors to balance risk and return by combining assets with different characteristics, such as Heineken and Ericsson.
- The risk of a combined portfolio is not just a weighted average of individual risks but is determined by the covariance between the securities.
There is an old saying in North America, “As General Motors goes, so goes the economy”.
Risk Reduction via Diversification
- The correlation coefficient measures the degree to which two asset returns move together, ranging from -1 to 1.
- Portfolio risk is generally lower than the weighted average of individual asset risks because most stocks are not perfectly correlated.
- Diversification allows investors to either reduce risk for a specific return level or improve returns for a specific risk level.
- Globalisation has increased the correlation between Western markets, making emerging markets and sector-based diversification more critical for risk management.
- Data from 2009-2014 shows significant negative correlations between certain markets, such as the United States and Morocco, offering unique hedging opportunities.
Only a correlation coefficient of 1 creates a portfolio risk that is equal to the average of its component risks.
Correlation and Portfolio Diversification
- The correlation coefficient between assets is the primary driver of the effectiveness of portfolio diversification.
- Perfect positive correlation offers no risk reduction, while perfect inverse correlation could theoretically eliminate risk entirely.
- In real-world markets, assets like Ericsson and Heineken are typically positively but imperfectly correlated due to shared economic conditions.
- Efficient portfolios are defined as those providing the maximum possible return for a specific level of risk.
- The 'efficient frontier' represents the optimal set of asset combinations that an investor should choose to maximize the risk-return ratio.
As long as the correlation coefficient is below 1, diversification will beefficient.
The Efficient Frontier and Risk-Free Assets
- The efficient frontier represents the set of portfolios that provide the maximum possible return for a given level of risk.
- Investors must choose portfolios based on their personal risk appetite, as there is no single universally optimum portfolio.
- Increasing the number of stocks in a portfolio allows an investor to improve the efficient frontier through diversification.
- Risk-free assets, typically represented by short-term government bills, have a standard deviation of zero and a certain return.
- Combining a risky asset with a risk-free asset creates a linear relationship between the portfolio's expected return and its risk.
- Investors can leverage their positions by borrowing at the risk-free rate to buy more risky assets, though this increases total portfolio risk.
Traditionally, this is illustrated with government bonds, even if assuming that the government cannot go bankrupt is becoming harder and harder.
The Market Portfolio and Efficiency
- The optimal investment strategy involves holding the market portfolio (M) and adjusting risk through risk-free assets.
- The market portfolio must contain all existing shares weighted by market capitalization to maintain market equilibrium.
- The Capital Market Line (CML) represents the most efficient portfolios, connecting the risk-free rate to the market portfolio.
- Under the assumption of homogeneous expectations, all rational investors will hold the same efficient frontier and market portfolio.
- The separation theorem suggests investors should focus on the market as a whole rather than individual stocks, adjusting risk via leverage or risk-free holdings.
To understand why, suppose that stock i was not in portfolio M. In that case, nobody would want to buy it, since all investors hold portfolio M.
Portfolio Management and Investment Strategies
- Financial theory suggests that optimal portfolios must lie on the Capital Market Line, combining the market portfolio with risk-free assets.
- The global asset management industry is a massive economic force, overseeing approximately €24 trillion in assets as of 2013.
- Index tracking and ETFs represent the investment strategy most aligned with market efficiency and modern portfolio theory.
- Top-down investment strategies prioritize asset classes and international markets over the selection of individual securities.
- Bottom-up stock-picking focuses on fundamental analysis to identify undervalued 'rare pearls' where intrinsic value exceeds market price.
The goal of the bottom-up approach is to find that rare pearl, i.e. the stock that is undervalued by the market.
Investment Strategies and Market Psychology
- Fundamental investors seek intrinsic value, categorizing stocks into growth, value, or yield based on industry maturity and dividend potential.
- Technical analysts, or chartists, ignore intrinsic value to focus on short-term price trends and transaction volumes.
- Chartists rely on behavioral psychology rather than mathematical theory, assuming investor reactions to market patterns are predictable.
- Key technical tools include moving averages and the identification of support and resistance levels to predict price breakouts.
- Fundamentalists view markets as long-term predictable, chartists see short-term predictability, and efficient market theorists deny any predictability.
- Alternative management and hedge funds utilize derivatives and market volatility to seek high returns regardless of price direction.
Technical analysis is not based directly on any theory. It is based more on psychology than mathematics.
Hedge Funds and Risk Dynamics
- Hedge funds utilize leverage and short-selling strategies to provide diversification that is theoretically decoupled from traditional equity and bond markets.
- Institutional interest in hedge funds has surged, with assets under management reaching approximately $2400bn by the end of 2013.
- Total financial risk is categorized into systematic market risk and intrinsic diversifiable risk, which are mathematically independent of one another.
- The beta coefficient measures a security's sensitivity to market fluctuations and is influenced by operating costs, debt levels, and information transparency.
- Funds of funds serve as intermediaries that package elite hedge fund management for a broader range of investors who may face entry barriers.
Short-seller funds, for example, bet that a stock will fall by borrowing shares at interest and sell-ing them, then buying them back after their price falls and returning them to the borrower.
Portfolio Theory and Efficient Frontiers
- Portfolio risk is lower than the average risk of individual shares because share returns are rarely perfectly correlated.
- The efficient frontier represents the set of portfolios that provide the highest possible return for a specific level of risk.
- Choosing an optimal portfolio on the efficient frontier is a subjective decision based on an individual's specific risk appetite.
- The capital market line is formed by combining risk-free assets with the market portfolio to create superior efficiency.
- Investors can adjust their risk levels by either investing in risk-free government bonds or by taking on debt to increase market exposure.
- Despite the theoretical ideal of market portfolios, many investment strategies still favor specific securities over broad diversification.
The choice then becomes an individual one, and every investor chooses the portfolio according to his personal appetite for (or aversion to) risk.
Financial Risk and Return Exercises
- The text presents a series of conceptual questions regarding the stability of beta coefficients and the statistical laws governing long-term risk.
- It explores the mechanics of diversification, specifically questioning the diminishing marginal benefits of adding securities to a portfolio.
- A case study on European equity correlation coefficients (1970-2009) highlights the increasing integration of global markets and its impact on geographic diversification.
- Practical investment scenarios are used to distinguish between specific risk and market risk, including the role of the market portfolio and the efficient frontier.
- The exercises require calculating returns and beta coefficients using historical data from the ENI share and the Italian market index.
Are you surprised by the table above? Does it prove that there is nothing to gain by geographic diversification?
Portfolio Risk and Return Exercises
- The text presents quantitative problems focused on adjusting portfolio standard deviation to meet specific risk targets.
- Calculations involve determining the proportions of specific stocks, such as Heineken and Ericsson, within a given portfolio.
- Exercises require computing expected returns and standard deviations for various asset weightings between two companies.
- The problems emphasize the impact of correlation between securities on the overall risk profile of a portfolio.
- Students are tasked with plotting results graphically to visualize the relationship between risk and return.
The correlation between the return on these two shares is 25%.
Risk and Return Fundamentals
- Volatility is primarily measured by the standard deviation of an asset's rate of return, while market risk is defined by the correlation between a security and the broader market.
- A security's risk profile is influenced by its operating cost structure, financial leverage, and the growth rate of its earnings.
- Specific risk can be mitigated through diversification, but the law of large numbers dictates that risk is never completely eliminated from a portfolio.
- Financial analysis is described as a paradox: it is necessary for market rationality and equilibrium, yet its immediate impact on prices can effectively 'kill' its own long-term value.
- The risk-free asset is theoretically defined as a zero-coupon government bond indexed to inflation, though price fluctuations before maturity remain a persistent risk.
Financial analysis contributes very little, as it must be acted upon immediately and the results seen in the share price – financial analysis kills financial analysis.
Risk Premium and Portfolio Theory
- The text provides practical solutions for calculating stock returns, market indices, and beta coefficients to measure relative risk.
- It emphasizes that mutual funds serve as accessible models for market portfolios that would be difficult for individuals to replicate alone.
- Investors can adjust their risk exposure by either adding risk-free assets or using debt to finance larger positions in a diversified portfolio.
- The required rate of return is determined by adding a specific risk premium to the risk-free rate based on the security's volatility relative to the market.
- A fundamental assumption of this valuation approach is that the investor already maintains a perfectly diversified portfolio.
A ship in a harbour is safe but that is not what ships are built for
Risk Diversification and CAPM
- Risk premium is only relevant when an investor manages a diversified portfolio rather than a single investment.
- The primary distinction between an entrepreneur and a financial investor is that the former faces a 'life or death' scenario with a single asset.
- The Capital Asset Pricing Model (CAPM) posits that rational investors seek to maximize returns while minimizing specific risk through diversification.
- In a fairly valued market, investors are only compensated for market risk (non-diversifiable risk) rather than total risk.
- The required rate of return is calculated as the risk-free rate plus a market risk premium adjusted by the security's beta.
As his assets are not diversified, it is a matter of “life or death” for the firm that the investment succeeds.
The Equity Risk Premium
- The equity risk premium represents the difference between the expected market return and the risk-free rate, typically averaging 3–6% in developed economies.
- Historical risk premiums vary significantly by country over the long term, ranging from 1.8% in Italy to 6.3% in the USA.
- The Capital Asset Pricing Model (CAPM) utilizes the expected risk premium, which is derived by discounting future cash flows rather than relying solely on historical data.
- A stock's beta coefficient measures its non-diversifiable risk, meaning a highly volatile stock can have a low beta if it is loosely correlated with the broader market.
- Market risk premiums are dynamic and sensitive to economic stability, having spiked to 10% during the 2008 financial crisis before receding.
So it is possible to have a stock that is, on the whole, highly risky but with a low β if it is only loosely correlated with the market.
The Securities Market Line
- The securities market line (SML) determines the required rate of return based solely on market risk, which is the only risk remunerated.
- Shifts in the SML illustrate market changes: parallel shifts indicate interest rate fluctuations, while pivoting shifts reflect changes in the risk premium.
- The position of a stock relative to the SML serves as a valuation tool, where stocks above the line are undervalued and those below are overvalued.
- The Capital Asset Pricing Model (CAPM) faces modern challenges, as the number of stocks required for effective diversification has risen from 20 to 50 since the 1970s.
- The practical application of CAPM is hindered by the difficulty of defining a truly risk-free rate, as even long-term government bonds are subject to interest rate and inflation risks.
A study by Campbell et al. (2001) shows that diversification is increasingly complex and that, whereas in the 1970s a portfolio of 20 stocks reduced risk significantly, today at least 50 are required to achieve the same result.
CAPM and Market Risk
- Short-term interest rates are increasingly viewed as a more rational risk-free rate than long-term rates due to lower solvency and reinvestment risks.
- A true market portfolio is theoretically impossible to construct as it must include all acquirable assets, not just financial ones.
- While diversification allows a large portfolio to approximate the market, recent studies suggest an increasing number of assets are required to achieve this limit.
- The Capital Asset Pricing Model (CAPM) relies on anticipated data that is not directly observable, forcing a reliance on historical and macroeconomic forecasts.
- The primary weakness of the beta coefficient is its instability over time, as it attempts to condense vast amounts of information into a single figure.
- The assumption that markets are always at fair value is challenged by the prominence of technical analysis and the widening gap between high and low beta stocks during crises.
The main criticism of beta is its instability over time. It boils down a large amount of information into a single figure, and this strength becomes its weakness.
Beyond the CAPM Model
- The Capital Asset Pricing Model (CAPM) is increasingly viewed as just one theoretical explanation rather than a universally accepted truth.
- The Arbitrage Pricing Theory (APT) expands on CAPM by replacing the single market factor with multiple macroeconomic variables like inflation and manufacturing output.
- The Fama-French model utilizes company-specific factors such as price-to-book value and market capitalization to explain historical returns.
- Empirical evidence suggests that liquidity, size, and even past performance significantly influence required rates of return, often contradicting efficient market theory.
- Despite their criticisms of CAPM, alternative models often lack its conceptual simplicity and have yet to provide a superior theoretical replacement.
Other factors can be added to this list, including P/E, market capitalisation, yield and even past performance (which is a direct contradiction of efficient market theory).
Liquidity Premiums and Market Equilibrium
- The 'market plane' model incorporates a liquidity premium alongside the standard market premium to calculate expected returns, particularly for small-cap stocks.
- Classical financial theory assumes markets are in constant equilibrium and that price movements follow a random path based on the arbitrage principle.
- Alternative theories suggest that extreme market events, such as crashes, occur more frequently than predicted by the random walk hypothesis.
- Mandelbrot’s fractal theory challenges efficient market theory by suggesting that prices have 'memory' and are not independent of past performance.
- The CAPM is limited by its single-period nature, failing to distinguish between short-term and long-term interest rates or the complexities of the yield curve.
This assumption does not fit with the efficient market theory, not only because the statistical rule for modelling prices is different but more importantly because Mandelbrot’s assumptions imply that prices have memory.
Dynamics of the Yield Curve
- The yield curve reflects market expectations regarding long-term inflation, central bank monetary policy, and national debt management.
- A 'normal' upward-sloping curve typically indicates economic recovery, driven by low short-term rates and expectations of future growth.
- Inverted yield curves, where short-term rates exceed long-term rates, often signal an impending recession or a lack of market liquidity.
- The theory of market segmentation, which suggests short-term and long-term markets are disconnected, has largely been replaced by integrated interest rate models.
- Investors influence the curve's shape by balancing capital gain expectations from falling long-term rates against the costs of short-term financing.
In contrast, when a recession follows a period of growth, the yield curve tends to reverse itself (with long-term rates falling below short-term rates).
Interest Rates and Liquidity Premiums
- Long-term interest rates are mathematically derived as the geometric average of current and anticipated future short-term rates.
- The shape of the yield curve serves as a market signal; an upward slope typically indicates that investors anticipate a future rise in interest rates.
- The preferred habitat theory suggests that investors have specific timeframe preferences and require premiums to move into less desirable maturities.
- Liquidity preference theory posits that investors naturally favor the short term and must be compensated with a premium to commit to long-term investments.
- The Capital Asset Pricing Model (CAPM) defines the required rate of return based on market risk rather than total or diversifiable risk.
Even if investors anticipate fixed short-term rates, the yield curve will slope upward due to the liquidity premiums.
Asset Pricing and Yield Curves
- The Capital Asset Pricing Model (CAPM) faces criticism for its reliance on market equilibrium and the practical difficulty of determining beta coefficients.
- The Arbitrage Pricing Theory (APT) offers an alternative by incorporating multiple variables like inflation and economic growth rather than a single market rate.
- Yield curves represent the relationship between interest rates and bond maturity, typically rising due to liquidity premiums but potentially inverting during recessions.
- Rigorous valuation of fixed-income securities requires discounting each individual cash flow by the specific rate corresponding to its maturity on the yield curve.
- Yield to maturity serves as a simplified average of various interest rates rather than a precise measure for each specific payment period.
In order to be more rigorous, it is necessary to discount each flow with the interest rate of the yield curve corresponding to its maturity.
Financial Risk and Return Exercises
- The text presents a series of review questions and exercises focused on the Capital Asset Pricing Model (CAPM) and the Arbitrage Pricing Theory (APT).
- It explores the relationship between beta coefficients, risk premiums, and the required rate of return for various global stocks.
- Specific scenarios challenge the reader to distinguish between total risk (standard deviation) and systematic risk (beta) in different market contexts.
- The exercises cover advanced valuation concepts including liquidity premiums, zero-coupon curves, and reinvestment risks.
- Practical problems require calculating whether specific shares like Walmart or Volkswagen are undervalued based on their beta and market risk premiums.
An experiment was recently carried out where a child, an astrologer and a financial analyst were each given €10 000 to invest for eight years. Who do you think achieved the best results?
Risk and Required Returns
- The Capital Asset Pricing Model (CAPM) emphasizes that specific risk is not remunerated because it can be diversified away, leaving only market risk as the basis for required returns.
- A low risk premium relative to actual risk levels suggests a market may be overvalued and prone to a steep correction.
- Liquidity plays a critical role in valuation, as investors demand higher returns for illiquid assets, leading to lower earnings multiples for smaller companies.
- Negative beta securities are exceptionally rare and valuable because they act as a hedge, increasing in value when the broader market declines.
- Bond valuation involves distinguishing between standard yield curves and zero-coupon curves to account for reinvestment risk and inflation.
These types of shares are very rare and very valuable, because they go up when the market falls!
The Required Rate of Return
- The text provides a comprehensive bibliography of foundational financial literature covering the Capital Asset Pricing Model (CAPM) and its historical evolution.
- It includes practical exercises and solutions for calculating risk premiums and determining if specific stocks are overvalued or undervalued.
- Key academic debates are highlighted, including the Arbitrage Pricing Theory (APT) and the Fama-French three-factor model.
- The section addresses the 'liquidity premium,' exploring how market illiquidity and bid-ask spreads impact the cost of capital.
- Resources are provided for accessing empirical data, such as the Fama-French model parameters available through Dartmouth's data library.
Undervalued: Imperial Tobacco, UBS. Correctly valued: Walmart. Overvalued: Volkswagen, ING.
Bonds and Financial Securities
- Financial managers secure company funding by selling various securities including debt, equity, options, and hybrids to investors.
- A bond is defined as a debt security with a maturity exceeding one year, representing a formal obligation to repay funds with interest.
- Debt securities differ from bank loans primarily because they can be traded on secondary markets like stock exchanges and money markets.
- The growth of bond markets has been fueled by disintermediation and the increasing difficulty of obtaining traditional bank loans.
- In 2013, corporate issuers represented only a small fraction (6%) of the euro-denominated bond market compared to state and financial institutions.
Or “rendering what is fixed, volatile, and what is volatile, fixed”
Fundamentals of Corporate Bonds
- Corporate bonds offer higher yields than government bonds to compensate investors for increased risk.
- The India Motors bond case study illustrates key features such as a 4.25% annual coupon and a seven-year maturity period.
- Nominal or face value serves as the basis for interest calculations and typically represents the amount repaid at maturity.
- Bonds can be issued at par, at a premium, or at a discount relative to their face value depending on market conditions.
- Redemption structures vary widely, including bullet repayments, constant amortization, or even selection by lottery.
- Provisions like call and put options allow for early redemption by the issuer or the bondholder, respectively.
Other methods exist, such as determining which bonds are redeemed by lottery… there is no end to financial creativity!
Bond Mechanics and Yield
- Bond repayment can be secured by guarantees or collateral, though corporate bonds like the India Motors example are often unsecured.
- The nominal interest rate or coupon is applied to the par value of the bond to determine periodic payments.
- Bonds sold at a discount, where the issue price is lower than the par value, provide investors with additional remuneration upon redemption.
- Coupon payment frequency varies from monthly to annually, while zero-coupon bonds defer all interest until the bond matures.
- The yield to maturity is a more accurate measure of return than the nominal rate because it accounts for issue discounts and payment timing.
- For the India Motors bond, a 4.25% nominal rate results in a 4.33% yield to maturity due to the initial purchase discount.
As a result, the nominal rate is not very meaningful.
Bond Yields and Market Spreads
- Yield to maturity serves as a rate of return for investors and an actuarial cost for issuers, though it relies on the strong assumption of reinvested interest.
- The actual cost of borrowing for an issuer is influenced by intermediation fees, paying agent commissions, and corporate tax deductions on coupon payments.
- Spreads represent the risk premium an issuer pays over a benchmark rate, such as the Interest Rate Swap (IRS) or government bond yields.
- Credit quality and market risk appetite are the primary drivers of spread width, which tends to expand significantly during financial crises.
- Once a bond enters the secondary market, its price and yield fluctuate independently of the historical cost recorded in the borrower's accounts.
- Secondary market yields represent an opportunity cost for the borrower, indicating the current 'real' cost of issuing new debt.
The situation of European countries during the euro crisis has generated some peculiar cases whereby, for example, the German government could borrow at negative interest rates.
Bond Pricing and Assimilation
- Bond prices are quoted as a percentage of nominal value rather than absolute currency to facilitate easier comparison across different denominations.
- Market prices are quoted 'net of accrued interest' to prevent artificial price fluctuations caused by proximity to coupon payment dates.
- Yield to maturity serves as the primary metric for evaluating bond value, as nominal price percentages do not reflect the actual cost or risk-adjusted return.
- Companies use 'assimilation' to issue new bonds with identical features to existing ones, increasing liquidity and reducing administrative costs.
- While assimilation benefits marketability, it creates a financial risk for the issuer by concentrating debt maturity on a single date.
- The market is transitioning from fixed-income securities to floating-rate bonds, where cash flows follow preset rules rather than fixed schedules.
Otherwise, the price of a bond with a 15% coupon would be 115 just before its coupon payment date and 100 just after.
Floating-Rate and Index-Linked Bonds
- Floating-rate bonds use coupons indexed to market rates plus a spread, effectively canceling out interest rate risk for both issuers and investors.
- The price of a variable-rate bond typically stays close to par value because the discount rate and the coupon rate reset in tandem.
- The primary driver of price volatility for floating-rate securities is a change in the issuer's solvency or credit risk rather than market interest rate fluctuations.
- Spreads are fixed at issuance based on creditworthiness, but the market's perception of that risk can cause the bond's value to fluctuate over time.
- Index-linked securities can be tied to various benchmarks, such as inflation, oil prices, or share prices, to protect investors against specific economic risks.
This cancels out the interest rate risk since the issuer of the security is certain of paying interest at exactly the market rate at all times.
Debt Securities and Interest Rates
- European reference rates like EONIA, EURIBOR, and LIBOR serve as the foundational benchmarks for valuing money-market transactions and debt instruments.
- Debt security holders face three primary risks: interest rate risk, coupon reinvestment risk, and credit risk.
- The value of a fixed-rate bond is inversely related to market interest rates, meaning prices fall when rates rise and vice versa.
- Modified duration is a critical metric that quantifies the sensitivity of a bond's price to a specific change in interest rates.
- Interest Rate Swaps (IRS) function by equating the present value of fixed-rate payments with floating-rate payments, typically using Euribor as the floating leg.
The value of a fixed-rate debt instrument is not fixed. It varies inversely with market rates: if interest rates rise, its value declines; if interest rates fall, its value appreciates.
Bond Sensitivity and Modified Duration
- Modified duration measures the percentage change in a bond's price relative to fluctuations in market interest rates.
- The risk to a bondholder's capital is not merely theoretical, as historical data shows significant volatility in both long-term and short-term rates.
- Mathematically, modified duration represents the slope of the tangent to the price/yield curve, which is hyperbolic rather than linear.
- The sensitivity of a bond to interest rate changes increases significantly as the maturity date extends further into the future.
- Secondary factors influencing duration include the coupon rate and the current market rate level, with lower rates generally increasing sensitivity.
Since this forms part of a hyperbolic curve, the slope of the tangent is not constant and moves in line with interest rates.
Bond Duration and Immunization
- Portfolio managers adjust modified duration to maximize capital gains or minimize losses based on interest rate forecasts.
- Convexity measures the speed of a bond's price appreciation or depreciation relative to interest rate fluctuations.
- Coupon reinvestment risk acts as a mirror image to capital risk, where rising rates cause capital losses but higher reinvestment yields.
- Immunization occurs when the gain from reinvested coupons offsets the capital loss from price changes, or vice versa.
- Duration is defined as the discounted average life of all cash flows and represents the time horizon needed to protect a portfolio from interest rate risk.
- Zero-coupon bonds are unique because their duration is equal to their remaining life and they eliminate reinvestment risk entirely.
Convexity expresses the speed of appreciation or the sluggishness of depreciation in the price of the bond if interest rates decline or rise.
Bond Ratings and Default Risk
- Default risk is assessed through traditional financial analysis, credit scoring, and ratings issued by dominant agencies like Standard & Poor’s, Moody’s, and Fitch.
- Agencies provide both short-term and long-term ratings for various entities, including sovereign states, municipalities, banks, and private corporations.
- Ratings are categorized into 'investment grade' (AAA to BBB-) and 'speculative grade' (BB and below), with the latter indicating higher uncertainty and default probability.
- The rating system includes outlooks (stable, positive, or negative) and watchlists to alert investors of potential changes due to corporate events like mergers or acquisitions.
- Historical data shows a stark correlation between ratings and failure rates, with only 0.8% of AAA issuers defaulting over 15 years compared to 31% of B-rated issuers.
From the sample of international issuers rated by Standard & Poor’s over 15 years, 0.8% of issuers rated AAA failed to pay an instalment on a loan, while 31% of issuers rated B defaulted.
Bond Ratings and Valuation
- The credit market maintains a strict divide between investment grade and speculative grade bonds, which dictates institutional investment eligibility.
- Rating agencies in Europe typically work with management to access privileged information, though they occasionally issue unsolicited ratings based on public data.
- Companies can choose to keep their credit assessments confidential as 'shadow ratings' if they are dissatisfied with the result or do not need public disclosure.
- The rating process is a qualitative and quantitative endeavor that evaluates sector positioning, financial data, and future financing strategies.
- Yield to maturity serves as the primary criterion for investors to evaluate opportunities and represents the opportunity cost of refunding for issuers.
- Obtaining and maintaining a credit rating involves significant financial costs, ranging from initial fees to substantial annual maintenance charges.
If the company does not require a public rating immediately (or if it does not like the rating allocated!), it may request that it be kept confidential, and it is then referred to as a shadow rating.
Bond Mechanics and Risk Metrics
- Bonds are defined by diverse parameters including redemption methods, nominal rates, and coupon frequencies which cause yield to maturity to deviate from coupon rates.
- Fixed-rate securities are subject to interest rate risk, where bond values move inversely to market rate fluctuations.
- Price sensitivity is measured through modified duration and convexity, which track the percentage change and speed of price movements respectively.
- Immunization strategies use bond duration to protect portfolios against the dual threats of capital risk and coupon reinvestment risk.
- Floating-rate securities offer lower volatility by indexing coupons to market rates, though they still carry some price variation.
- All debt securities face default risk, quantified by credit ratings and expressed as a 'spread' over risk-free rates based on issuer solvency.
Convexity, the second derivative of price with respect to interest rates, expresses the speed of appreciation or the sluggishness of depreciation in the price of the bond if interest rates decline or rise.
Bond Valuation and Yield Exercises
- The text presents a series of technical exercises focused on the inverse relationship between interest rates and bond prices.
- It explores the determinants of an investor's required rate of return, including inflation, asset risk, and government bond rates.
- Specific problems address the calculation of yield to maturity, duration, and modified duration for fixed-rate and zero-coupon bonds.
- The material introduces complex bond structures, such as two-tranche offerings with inverse interest rate behaviors based on market yield fluctuations.
- Practical applications involve calculating credit spreads and valuing corporate debt relative to government benchmarks.
If you thought that interest rates were going to rise, which tranche would you choose?
Bond Valuation and Debt Analysis
- The text defines fundamental bond mechanics, including nominal value for coupon calculation and yield to maturity as the rate equating present value to price.
- Duration is characterized as a discounted average life of a bond, influenced more significantly by the remaining life of the instrument than by market rate fluctuations.
- Shareholder equity is conceptualized as a put option, allowing owners to transfer assets to lenders if the firm's value falls below its debt obligations.
- The document provides specific exercise solutions regarding tranche pricing, where certain bond classes may rise in value alongside interest rates while others fall.
- A comprehensive bibliography lists key academic and professional resources covering credit ratings, yield spreads, and fixed-income risk management.
It is the value of a put allowing the shareholders to sell the assets of the firm to the lenders if at maturity the value of assets is below the redemption price of the debts.
Short-Term Marketable Debt
- Commercial paper serves as a short-term negotiable debt security with maturities typically ranging from one day to one year.
- These instruments allow companies to bypass the banking system and borrow directly from investors at rates close to the money market.
- The European market is split between the unregulated London-based ECP market and the regulated French TCN market, though the STEP label has helped homogenize documentation.
- While credit ratings are technically optional, they are practically essential for market access and often require backup credit lines from banks.
- The 2008 financial crisis highlighted the volatility of these markets, as commercial paper markets virtually closed following the Lehman Brothers bankruptcy.
These backup lines came into their own at the end of 2008 when the commercial paper market virtually closed for several weeks following the bankruptcy of Lehman Brothers.
Private Placements and Bank Debt
- Private placements serve as a hybrid financing tool between traditional bank loans and standard bond issues, targeted at qualified institutional investors.
- These instruments allow mid-size and large corporations to access long-term capital without the necessity of a formal credit rating.
- The rise of 'shadow banking' and private placements is driven by increased bank solvency constraints which have limited traditional loan offerings.
- Bank debt products like bilateral or syndicated loans remain essential for tailored financing and as backup mechanisms for corporate cash flow.
- While bank loans offer flexibility, private placements often involve stringent covenants and less room for renegotiation compared to traditional banking relationships.
- Short-term options such as overdrafts and commercial loans provide immediate liquidity but carry higher interest costs and collateral requirements for smaller firms.
The documentation usually includes some stringent covenants and investors in such products may show much less flexibility than banks when it comes to renegotiation.
Commercial and Syndicated Loan Structures
- Commercial loans are priced based on the bank's refinancing rate plus a margin of 0.10% to 1.50% depending on borrower creditworthiness.
- Revolving credit facilities (RCF) provide flexible, off-balance-sheet liquidity where firms pay an engagement fee only on undrawn amounts.
- Bridge loans offer high-cost, short-term financing for quick investments or acquisitions, often repaid once long-term funding is secured.
- Syndicated loans allow multiple banks to share the risk of large facilities exceeding €50m, managed by a mandated lead arranger.
- Club deals and master credit agreements provide streamlined financing through a firm's primary 'house banks' without broader market syndication.
- Firm underwriting by a single bank can ensure transaction confidentiality, which is vital during sensitive operations like acquiring listed companies.
This type of loan is costly as it presents a significant risk for the lender. Its development is highly dependent on the activity of the mergers and acquisitions market.
Master Agreements and Loan Documentation
- Master agreements centralize credit facilities for global subsidiaries, allowing them to access funding under the same conditions as the parent company.
- Centralization provides structural economies by pooling cash, harmonizing financing costs, and reducing administrative overhead.
- Loan documentation explicitly defines the mechanics of the credit, including interest rates, amortization schedules, and specific use of funds.
- Covenants serve as protective measures for banks, ranging from affirmative financial ratios to negative restrictions on dividends and asset pledges.
- Specific legal clauses like 'cross default' and 'material adverse change' allow lenders to demand repayment if the borrower's overall financial health deteriorates.
- The loan market exhibits cyclicality, with documentation and spreads tightening significantly during periods of low liquidity like the 2008 financial crisis.
Cross default clauses specify that if the company defaults on another loan, the loan which has a cross default clause will become payable even if there is no breach of covenant or default of payment on this loan.
Discounting and Factoring Mechanics
- Discounting allows a company to receive immediate cash by selling commercial bills of exchange to a bank at a discount.
- Traditional discounting with recourse requires the company to assume the bankruptcy risk of its customers if the bill remains unpaid.
- Non-recourse discounting functions as a straight sale of receivables, allowing companies to remove debt from their balance sheets.
- Factoring expands on discounting by providing additional services such as receivables recovery and insurance against unpaid bills.
- Accounting standards like IFRS and US GAAP typically require discounted bills with recourse to be reported as debt rather than sales.
Factoring is like discounting with additional services!
Mechanics of Asset Leasing
- Lease contracts involve fixed payments from a lessee to a lessor for asset usage rights, with tax-deductibility varying by accounting classification.
- Operating leases are short-term agreements where the lessor retains obsolescence risk and the lessee can typically cancel the contract.
- Financial or capital leases cover the asset's entire economic life, are non-cancellable, and transfer most risks and rewards to the lessee.
- IFRS principles require finance leases to be capitalized on the balance sheet, while operating lease payments are generally expensed.
- Firms utilize leasing to bypass borrowing limits, avoid restrictive bond covenants, or engage in sale-and-lease-back transactions to free up capital.
- While operating leases offer off-balance-sheet financing, they do not truly reduce a firm's financial risk as lenders monitor the associated cash-flow obligations.
Thus, the lessee bears little or no risk if the asset becomes obsolete.
Sale-Leasebacks and Export Credits
- Sale and lease back operations allow companies to transfer assets off the balance sheet to reduce debt or free up cash for new developments.
- Major global corporations in retail, hospitality, and healthcare frequently use these operations to monetize their real estate holdings.
- Restructuring via sale-leasebacks requires careful analysis of tax impacts, capital gains, and the shift from depreciation to rent expenses.
- Export credit provides a financial mechanism where banks pay suppliers directly, insulating the supplier from payment default and currency risk.
- Buyer's credit agreements are strictly financial, requiring repayment regardless of any commercial disputes between the importer and exporter.
- Securitization serves as a method for financial institutions to convert illiquid customer loans into negotiable securities.
The credit agreement also specifies that the transaction is purely financial, since the borrower must repay the funds notwithstanding any disputes that may arise in the course of its business with the exporter.
Mechanics of Asset Securitisation
- Securitisation involves pooling various loans or receivables into a Special Purpose Vehicle (SPV) to diversify risk through the law of large numbers.
- The SPV issues a range of securities, from equity to senior debt, allowing investors to choose risk-return profiles that match their specific requirements.
- Credit enhancement techniques, such as over-collateralisation, insurance policies, or credit lines, are used to boost the credit ratings of the issued securities.
- Industrial companies use securitisation to liquefy their balance sheets by isolating high-quality assets like inventories or receivables to obtain preferential financing rates.
- While the subprime crisis severely damaged the bank asset securitisation market, industrial securitisation remains viable for transparent, high-quality assets.
In short, the whole balance sheet can be made liquid.
The Mechanics of Project Finance
- Project financing relies on the specific cash flows and assets of a large-scale venture rather than the general creditworthiness of the borrower.
- Originating in the 1930s oil industry, this technique allows for massive investments in infrastructure, mining, and energy by isolating risk in separate entities.
- Lenders face significantly higher risks than conventional loans, potentially becoming the involuntary owners of complex assets like oil tankers or amusement parks.
- Success depends heavily on the contractor's reputation and ability to manage complex construction timelines and cost overruns.
- The structure is unsuitable for new technologies with uncertain cash flows and requires a stable political environment to ensure repayment.
- International organizations and export agencies often play a critical role by providing guarantees or direct funding for projects in developing regions.
But it is all too easy to become intoxicated by the sophistication and magnitude of such financial structures and their potential returns.
Project Risk Lifecycle
- Project risks are categorized into three distinct phases: setup, construction, and operations.
- The planning stage involves significant financial risk due to the high cost of feasibility studies and the uncertainty of project materialization.
- Construction represents the period of highest risk because capital is being spent without any immediate revenue generation.
- Cost overruns and delays are considered standard occurrences in large-scale, complex projects.
- Financial risks during construction can be mitigated through specialized insurance or contractual obligations where contractors cover excess costs.
But, of course, the greatest risk occurs during construction, since any loss can only be recouped once the facilities are up and running!
Project Financing Risk Management
- Project risk exposure peaks at the transition from construction to operations, when all funds are disbursed but revenue generation remains uncertain.
- Contractual mechanisms like performance bonds and independent arbitrators are used to mitigate risks of non-completion or client refusal of installations.
- Operating risks are hedged through 'take or pay' contracts, which require payment regardless of delivery, or less restrictive 'take and pay' agreements.
- Market and foreign exchange risks are managed through rigorous market research, specific contract revision clauses, and currency matching or swaps.
- Abandonment risk occurs when industrial managers and bankers disagree on project viability, requiring clear contractual rules for decision-making.
- Political and sovereign risks, such as arbitrary regulatory changes or cash shortages, remain significant threats that may require state-backed underwriting.
Risk exposure culminates between the end of construction and the start of operations.
Debt Products and Share Fundamentals
- Firms utilize diverse financing methods beyond traditional loans, including asset-based options like factoring, securitization, and leasing.
- Commercial paper programs require bank backup lines to mitigate liquidity risks if short-term markets become inaccessible.
- Small companies face restricted debt choices because limited issuance amounts lead to illiquidity in market-based products.
- Factoring distinguishes itself from simple discounting by offering additional services such as debt collection and insurance against bad debt.
- Shares represent a unique security class characterized by non-redemption and uncertain revenue flows, compensated by voting rights.
- The stock market functions as a mechanism for shareholders to realize their investment through disposal rather than repayment by the firm.
A share or a stock is a security that is not redeemed – the investment can only be realised through a disposal – and whose revenue flows are uncertain.
Basics of Stock Analysis
- Shares typically carry voting rights as compensation for risk, though companies may issue non-voting preference shares or multi-class shares to concentrate control.
- Earnings Per Share (EPS) measures theoretical value creation by dividing net attributable profit by the total number of shares.
- Financial analysts often calculate 'fully diluted EPS' to account for equity-linked securities like convertible bonds and stock options.
- Dividend Per Share (DPS) represents the portion of earnings distributed to shareholders, which can be paid from current or retained profits.
- The dividend yield is a market-based ratio of the last dividend to the current share price, averaging around 3% in Western markets.
- Historical data across European sectors shows significant yield volatility, with industries like Telecom and Utilities often providing higher returns than Biotechnologies.
For our purposes, this is more of a compensation for the risk assumed by the shareholder than a basic characteristic of stock.
Metrics of Shareholder Value
- The payout ratio measures the percentage of earnings distributed as dividends, reflecting a trade-off between immediate income and future growth potential.
- Companies transition from growth stocks to income stocks as they mature, often increasing their payout ratios as reinvestment opportunities diminish.
- Equity book value represents the historical accounting estimate of shareholder investment, distinct from current market valuation.
- Total Shareholder Return (TSR) combines dividend yield and capital gains to reflect the internal rate of return over a specific period.
- Market liquidity, determined by free float and trading volume, is essential for ensuring that a share price remains a relevant and reliable metric.
- The cost of equity is derived from the risk-free rate plus a market risk premium, serving as the expected rate of return for investors.
Loyalty is (unfortunately) not a financial concept and a skyrocketing share price
Market Capitalisation and Multiples
- Liquidity is determined by both free float and daily trading volumes, which dictate how quickly institutional investors can enter or exit positions.
- Market capitalisation represents the total market value of equity, though acquiring a controlling interest usually requires paying a premium above this price.
- Investors use multiples to compare stock prices against financial metrics, facilitating arbitrage based on perceived company quality versus market price.
- The EBIT multiple estimates enterprise value by relating operating profit to the total value of the firm's capital employed.
- Enterprise value is calculated as the sum of equity market value and net debt, providing a capital-structure-neutral view of a company's worth.
- Multiples can be interpreted as the number of years required to recover an investment if profits remain constant, or the price paid for each euro of profit.
Most often, a premium must be paid.
Drivers of EBIT Multiples
- Financial analysts primarily use current or future operating profit to determine enterprise value through EBIT multiples.
- The growth rate of operating profit is a primary driver, as investors pay a premium today for anticipated future earnings expansion.
- Risk profiles act as a counterweight to growth; high-risk companies often trade at lower multiples despite high growth expectations.
- Interest rates maintain a strong inverse correlation with multiples, as higher rates increase required returns and depress asset values.
- The EBIT multiple serves as a benchmark for comparing a specific company's valuation against the broader market.
- While EBIT multiples are popular for enterprise valuation, the Price to Earnings (P/E) ratio remains a simpler alternative for share price estimation.
Analysts and investors in fact do not take the expected growth rate for granted. Thus, they tend to counterweight the effects of the growth rate with the robustness of these estimates.
Understanding the P/E Ratio
- The Price/Earnings (P/E) ratio represents the market value of a company relative to its net income or earnings per share.
- Conceptually, the P/E ratio expresses the number of years of earnings an investor is buying to recover their initial investment.
- Forward-looking earnings (N+1 or N+2) are often used for fast-growing or loss-making companies to provide a more representative valuation.
- P/E ratios are influenced by market efficiency, where higher growth prospects lead to higher multiples, while higher interest rates and perceived risk lead to lower multiples.
- Unlike the EBIT multiple, the P/E ratio accounts for financial structure risk in addition to operating asset risk.
- Historical data shows extreme volatility in P/E ratios during market bubbles, such as the TMT sector in 2000 where biotechnology reached a multiple of 180.5.
This means that if EPS remains constant, the investor will have to wait eight years to recover his investment, while ignoring the residual value of the investment after eight years, omitting the discount and assuming that he receives all of the EPS.
The Inverse P/E Fallacy
- The inverse P/E ratio, or earnings yield, is frequently but incorrectly used as a proxy for an investor's required rate of return.
- This approximation is only valid in rare scenarios where a company has zero growth and a 100% dividend payout ratio.
- For growing companies, the earnings yield typically underestimates the required return, potentially leading to significant valuation errors.
- In mature or declining companies, the inverse P/E may overestimate the required return, reflecting expectations of negative growth.
- A very low earnings yield indicates that shareholders are pricing in strong future earnings-per-share growth to justify their investment.
Using the inverse P/E to approximate required rate of return would seriously underestimate the latter – a big mistake.
Alternative Valuation Multiples
- Sales multiples are often used for small businesses or pre-profit startups but are criticized for ignoring actual profitability and assuming normative returns.
- EBITDA multiples are preferred in capital-intensive sectors like telecoms to bypass subjective depreciation methods, though they risk overvaluing low-margin firms.
- Free cash flow multiples are theoretically sound as they represent distributable funds, but their high volatility due to capital expenditure cycles limits their use to mature industries.
- The Price to Book Ratio (PBR) links market value to equity, where a ratio above one typically indicates that the Return on Equity exceeds the shareholders' required rate of return.
- Volume-based metrics such as 'number of clicks' or 'subscribers' are viewed skeptically as they assume uniform revenue and margins per unit across different companies.
They have often been used in the past, in times of bull markets, to value Internet or biotech companies, for example, as such companies did not show a positive EBIT!
Market Equilibrium and PBR Dynamics
- The Price-to-Book Ratio (PBR) is fundamentally driven by the relationship between a company's Return on Equity (ROE) and its required rate of return.
- Efficient markets prevent PBR from staying below 1.0 indefinitely through sector consolidation, while high PBRs are eventually tempered by new market entrants.
- Historical data across pan-European sectors shows significant volatility in PBR, with sectors like Biotechnologies and Real Estate often maintaining higher ratios than Utilities or Financials.
- The case of Indesit demonstrates that a high PBR and P/E ratio can be justified by anticipated earnings recovery even when current ROE is significantly below the required return.
- Stock market analysis requires aligning share price consistency with the firm's financial performance and historical market data.
A sector cannot show equity value below book value for long as sector consolidation will soon intervene and re-establish balance, assuming that markets are efficient.
Adjusting Share Data for Technical Factors
- Financial analysis requires qualifying a share's profile by examining volatility, dividend policy, and its classification as a growth, cyclical, or defensive stock.
- Historical share price data must be adjusted for technical changes to ensure comparability, avoiding the mistake of 'mixing apples with oranges.'
- Free share awards increase the number of shares without changing the company's equity value, necessitating an adjustment coefficient to normalize past prices.
- Rights issues with exercise prices below the current market value trigger a detachment of rights that requires a specific mathematical adjustment of historical data.
- The adjustment coefficient for free shares is calculated by dividing the original number of shares by the total number of shares post-issuance.
- Accurate valuation relies on aligning market multiples with internal financial metrics like Return on Equity (ROE) and expected market returns.
“Let’s not mix apples with oranges.” This old saying applies to the adjustment of per-share data after the detachment of rights and for free share awards and rights issues which, from a technical point of view, can modify the value of a stock.
Adjusting for Dilution and Rights
- Stock performance data must be retroactively adjusted using a coefficient when rights are detached to ensure historical prices are comparable to current values.
- Financial managers must account for potential dilution from equity-linked securities like convertible bonds and warrants when calculating per-share metrics.
- The 'treasury method' for warrants assumes the company uses exercise proceeds to buy back its own shares, partially offsetting the dilutive impact.
- An alternative 'investment of funds method' assumes exercise proceeds are reinvested at a specific rate of return to calculate fully diluted earnings per share.
- Only 'in-the-money' securities are factored into dilution calculations, as out-of-the-money options are unlikely to be exercised.
As you have seen, the adjustment consists in rewriting past stock performance to make it comparable to today and tomorrow, and not the reverse.
Stock Market Analysis and Multiples
- The treasury method for warrant exercise assumes a company's best investment is buying back its own shares, though alternative rates like WACC can be used.
- Comprehensive stock analysis requires evaluating liquidity and shareholder base before comparing stock performance to financial metrics like P/E and dividends.
- The Price to Earnings (P/E) ratio is driven by future earnings growth and moves inversely to interest rates and perceived risk.
- Inverse P/E only equals the shareholders' required rate of return under specific equilibrium conditions where all profits are paid out.
- Valuation multiples like EBIT and PBR must be adjusted for past transactions like stock splits and future events like bond conversions to remain accurate.
- Dividend analysis focuses on the payout ratio and yield, reflecting the balance between reinvested earnings and shareholder returns.
However, the treasury method assumes that the best investment for a company is to buy back its own shares.
Valuation and Share Analysis
- The text provides a comparative analysis of different share types, distinguishing between growth stocks with high capital gain expectations and income stocks with high dividend payouts.
- Specific company profiles like ArcelorMittal, Belgacom, and Hermès are used to illustrate how P/E ratios reflect growth expectations, risk levels, and value creation.
- Financial metrics such as ROE, PBR, and payout ratios are analyzed to determine if a company is meeting shareholder requirements or destroying value.
- The relationship between leverage and returns is highlighted, noting that exceptional ROE can sometimes be explained by high debt levels rather than organic performance.
- The section concludes with practical exercises and solutions for calculating missing financial indicators based on market risk premiums and risk-free rates.
Hermès is a fast-growing company, this is reflected in its high P/E and its low dividend policy.
The Foundations of Options
- Options represent a sophisticated method of remunerating risk beyond simple net present value calculations.
- Many complex financial instruments, such as convertible bonds and credit facilities, are actually combinations of options and safer assets.
- Options theory serves as a versatile strategic tool for corporate decision-making, limited only by a manager's imagination.
- A call option provides the right to buy an underlying asset, while a put option provides the right to sell it.
- The core value of an option lies in the right, but not the obligation, to trade at a predetermined price within a specific timeframe.
The haunted house, or how to pay for being frightened!
Mechanics of Financial Options
- Options are financial contracts granting the right, but not the obligation, to buy (call) or sell (put) an underlying asset at a fixed strike price.
- A fundamental distinction exists between US-style options, exercisable at any time during a period, and European-style options, exercisable only on a specific date.
- The contract is inherently asymmetric: the buyer holds the rights while the seller assumes all obligations if the buyer chooses to exercise.
- The premium is the price paid by the buyer to the seller as compensation for the seller's lopsided risk and lack of rights.
- Rational exercise of an option only occurs when the market price is favorable relative to the strike price, such as a call option when the market price exceeds the strike.
The buyer of any option has the right but not the obligation, whereas the seller of any option is obliged to follow through if the buyer requests.
The Theoretical Basis of Options
- Options are fundamentally defined by an asymmetry of risk where buyers have limited loss potential but sellers face unlimited risk.
- The existence of options is entirely dependent on uncertainty; in a risk-free environment with a known future, options would serve no purpose.
- Options can be viewed as pure financial products because their sole function is the remuneration of risk.
- The concept of put-call parity demonstrates that combining a long call and a short put is equivalent to a forward purchase of the underlying asset.
- Market pricing ensures that all risk premiums, including those in options, are essentially a form of insurance against an uncertain future.
Options would not exist if the future were known with certainty. In a risky environment, options remunerate the risk of an uncertain future.
Put-Call Parity and Intrinsic Value
- Combining a long call and a short put with the same strike and maturity creates a synthetic position equivalent to buying the underlying asset with borrowed funds.
- The principle of put-call parity allows investors to manufacture synthetic options by combining the underlying asset, risk-free borrowing, and a complementary option.
- There are eight equivalent ways to express the relationship between calls, puts, underlying assets, and risk-free debt.
- Intrinsic value represents the immediate gain possible if an option were exercised, defined as the positive difference between the asset price and the strike price.
- Options are categorized as 'in the money', 'at the money', or 'out of the money' based on whether their intrinsic value is positive or zero.
When we have three investment opportunities on an underlying asset, we can always recreate the fourth, as long as we can borrow and invest in the risk-free asset!
Option Valuation and Time Value
- Options are categorized as out of the money, at the money, or in the money based on the relationship between the underlying asset price and the strike price.
- The total value of an option is the sum of its intrinsic value and its time value.
- Time value represents the probability that the asset price will move favorably before the option matures, effectively capturing 'everything that could happen' over time.
- As an option approaches its maturity date, its time value progressively diminishes until it reaches zero at expiration.
- The value of a call option is bounded: it must be at least equal to its intrinsic value but can never exceed the value of the underlying asset itself.
- Six primary factors determine an option's value: underlying asset price, strike price, volatility, maturity, risk-free rate, and dividends.
In more concrete terms, time value represents “everything that could happen” from now until the option matures.
Determinants of Option Value
- The value of call and put options is fundamentally tied to the strike price, with calls losing value and puts gaining value as the strike price increases.
- Volatility is a primary driver of option pricing; higher volatility increases the potential for sharp price swings, thereby raising the value of both calls and puts.
- Time to maturity acts as a value multiplier, as longer durations provide more opportunities for the underlying asset's price to fluctuate favorably.
- The risk-free rate creates a cash advantage for call buyers by allowing them to defer payment of the strike price, effectively acting as a purchase on credit.
- Dividends and coupons negatively impact call options because they reduce the underlying asset's price upon payment, often prompting early exercise of American-style options.
- While interest rates influence pricing, they generally have a significantly smaller impact on an option's market value compared to volatility or asset price.
As an option is nothing more than pure remuneration of risk, the greater that risk is, the greater the remuneration must be, and thus the option’s value.
Arbitrage Logic in Option Valuation
- Traditional cash flow discounting fails for options because risk levels fluctuate constantly based on how far the option is 'in the money.'
- The binomial model uses arbitrage logic to value options by creating a replicating portfolio of the underlying asset and debt.
- A replicating portfolio must yield the same terminal cash flows as the option to ensure their current market values are identical.
- Delta represents the specific ratio of shares required to duplicate an option's profit profile, serving as a hedge ratio.
- While the two-state model is an oversimplification, it can be expanded into infinite sub-periods to reflect realistic market volatility.
Since the two combinations produce the same cash flows, regardless of what happens to the share price, their values are identical.
The Black–Scholes Option Model
- The Black–Scholes model provides a mathematical framework for pricing European-style options by creating a risk-neutral portfolio of assets and options.
- It functions as a continuous-time version of the binomial model, assuming that underlying asset prices follow a log-normal distribution.
- The formula calculates call option value based on the current asset price, the strike price's present value, volatility, and time to maturity.
- Key variables influencing the model include the asset's delta, the risk-free interest rate, and the instantaneous standard deviation of returns.
- The model relies on specific theoretical assumptions such as no dividends, constant volatility, and perfectly rational market participants.
- While revolutionary, the original model has been adapted by others like Merton and Garman-Kohlhagen to account for dividends and currency fluctuations.
It is based on the construction of a portfolio composed of the underlying asset and a certain number of options such that the portfolio is insensitive to fluctuations in the price of the underlying asset.
Option Valuation and Volatility
- American-style call options on non-dividend-paying stocks are identical in value to European-style calls because early exercise sacrifices time value.
- The Black-Scholes model can be adapted for dividend-paying shares by subtracting the discounted dividend from the current share price.
- Volatility is the only unknown variable in the Black-Scholes formula, as all other criteria like strike price and maturity are fixed.
- Market operators use the Black-Scholes model 'backwards' to calculate implied volatility from market prices, treating volatility itself as a tradable asset.
- Managing option portfolios requires understanding sensitivity parameters, such as Delta and Gamma, to measure risk against underlying asset fluctuations.
This practice is so entrenched that options market traders trade anticipation of volatility directly.
Option Greeks and Sensitivity
- Delta measures the sensitivity of an option's value to changes in the price of the underlying asset, ranging from 0 to 1 for calls and -1 to 0 for puts.
- The delta of an option serves as an 'underlying equivalent,' allowing managers to hedge positions by equating a specific number of options to a share of stock.
- Gamma represents the 'delta of the delta,' measuring how the delta itself fluctuates in response to movements in the underlying asset's price.
- Theta quantifies the impact of time decay, representing the loss in an option's value as it approaches expiration, regardless of price movement.
- Delta can be interpreted as a rough probability of an option expiring in-the-money, particularly for options near maturity with low volatility.
Options are like people: they run down with time.
Vega, Volatility, and Model Risk
- Vega measures the sensitivity of an option's value to changes in implied volatility, with at-the-money options being the most sensitive.
- The VIX index serves as a benchmark for market volatility, though historical data shows that market returns frequently defy Gaussian distribution assumptions.
- The Black-Scholes model is criticized for using log-normal distributions that significantly underestimate the probability of extreme market crashes.
- Model risk has emerged as a critical concern for financial institutions that rely on biased mathematical frameworks for pricing and hedging.
- The 'volatility smile' phenomenon reveals a market anomaly where implied volatility varies by strike price, contradicting the Black-Scholes assumption of a single volatility figure.
In practice, it is impossible to create a position that is neutral on all criteria at once. No return is possible when taking no risk. No pain, no gain!
The Fundamentals of Options
- Options are versatile financial instruments used for hedging risks, valuing equity, and resolving conflicts between management and ownership.
- A call option provides the right to buy an asset, while a put option provides the right to sell, both at a predetermined strike price.
- The value of an option is comprised of its intrinsic value and a time value that remunerates the passing of time.
- Six key variables determine option pricing: underlying asset price, strike price, volatility, maturity, risk-free rate, and dividends.
- Standard valuation frameworks like the Black-Scholes and binomial models are used to calculate the premium for the risk being transferred.
The basis of an option is the remuneration of risk. The option cannot exist in a risk-free environment and it thrives on risk.
Option Theory and Applications
- The text explores the theoretical foundations of option pricing, specifically questioning why time value cannot be negative despite potential drops in intrinsic value.
- It examines the practical utility of options in arbitrage and speculation, highlighting their unique role in financial risk management.
- A scenario is presented regarding the impact of corporate dividend policies on the value of employee stock options.
- The Black-Scholes model is identified as a central pillar of modern financial valuation and theoretical contribution.
- A real-world analogy is provided through the 'Nacheinlasskarten' ticket system in Berlin, which functions as a complex, high-risk financial derivative.
If the legitimate ticket holder for the seat arrives before the concert starts, the holder of the Nacheinlasskart must give up his/her seat and leave the hall.
Option Valuation and Mechanics
- Options function as promises to buy or sell assets, with values derived from strike price, volatility, interest rates, and maturity.
- Selling call options carries unlimited risk because the potential value of the underlying asset can rise indefinitely.
- The leverage effect in options is significant; a 17% rise in a share price can result in a 133% increase in the option's value.
- Arbitrage occurs if an option's market value falls below its intrinsic value, allowing for immediate profit through exercise and sale.
- The 'industrialisation' of options was made possible by mathematical methods for calculating the value of conditional assets.
- Hedging strategies, such as collars, allow investors to protect against price drops by sacrificing potential gains above a certain threshold.
Because a 17% rise in the value of Google’s share will lead to a 133% rise in the value of the option, and a 25% drop in the value of the share will lead to a 92% fall in the value of the option.
The Mechanics of Hybrid Securities
- Hybrid securities often appear to lower financing costs through lower interest rates, but this is a misconception when adjusted for risk.
- Sophisticated hybrid products can signal to the market that a company is struggling to attract traditional investors.
- The appeal of these complex instruments is often explained by agency theory, signaling theory, and the fundamental asymmetry of information.
- Financial markets are subject to trends where investors seek novelty to feel they are participating in 'high finance'.
- A warrant is a specific hybrid security that grants the holder the right to subscribe to new securities at a fixed price and time.
- Warrants are frequently used as 'equity kickers' to sweeten a deal before being detached and traded as independent securities.
Investors have a great appetite for novelty, especially if it gives them the feeling of doing high finance!
Warrants and Financial Securities
- Warrants are financial instruments that allow holders to subscribe to shares at a fixed price within a specific timeframe.
- Financial institutions now issue covered warrants on existing securities, which are backed by the institution's own holdings rather than the original company.
- Unlike standard call options, warrants often have long lifespans of two to three years, complicating traditional valuation models like Black-Scholes.
- The value of equity warrants is sensitive to dividend payments, which lower the underlying share price and consequently the warrant's value.
- Subscription warrants cause dilution because their exercise creates new shares and generates cash inflows for the issuing firm.
- Advanced traders use modified binomial and Black-Scholes models to account for the specific volatility and dilution effects of warrants.
There being no limits to the imagination, some players have not hesitated in creating warrants on baskets of existing securities (such as indices).
Dynamics of Hybrid Securities
- Agency theory views hybrid securities, like bonds with equity warrants, as tools to resolve conflicts between managers, creditors, and shareholders.
- Managers gain financial flexibility by setting specific exercise prices and subscription periods to control the timing and volume of capital increases.
- While warrants offer potential gains, they carry a significant opportunity cost if share prices soar far above the fixed exercise price.
- Investors can split these instruments, allowing risk-averse parties to hold the bonds while speculators trade the volatile warrants.
- Existing shareholders can use warrants to maintain company control with less capital, though this strategy significantly increases their risk profile.
- Market volatility remains a critical factor, as speculative bubbles can leave high-priced warrants entirely unexercised and worthless.
In a context of rising interest rates and falling share prices, however, holders of bonds cum warrants suffer the downside risks of both debt and equity securities instead of combining their advantages.
Warrants and Convertible Bonds
- Warrants serve as versatile financial tools used to facilitate capital increases, debt cancellations, and management incentivization.
- In debt restructuring, equity warrants can reconcile the divergent interests of creditors and shareholders by offering potential upside in exchange for cancelled debt.
- Redeemable warrants allow issuers to force exercise once share prices hit a specific threshold, effectively acting as a 'soft call' clause.
- Convertible bonds combine traditional debt with the option to exchange the bond for company shares during a predetermined period.
- While warrants and convertibles offer flexibility, they carry the risk of future equity dilution for existing shareholders.
- The popularity of hybrid securities often peaks during depressed financial markets due to their inherent flexibility for both issuers and investors.
The reader must nevertheless be wary of throwing in “free” equity warrants as a miracle remedy to ensure the success of a deal.
Mechanics of Convertible Bonds
- The conversion ratio determines how many shares a bondholder receives and is adjusted for corporate actions like mergers or buy-backs to protect investor rights.
- A conversion premium represents the percentage a stock price must rise above its current market value for conversion to be more attractive than cash redemption.
- Issuers often include call provisions, such as 'hard' or 'soft' calls, allowing them to force redemption or conversion under specific time or price conditions.
- To prevent shareholder dilution, some issuers reserve the right to provide the cash equivalent of shares upon conversion rather than issuing new equity.
- The total value of a convertible bond is derived from three components: its investment value as straight debt, its immediate conversion value, and its time-sensitive option value.
- At low firm values, the security behaves like straight debt, while at high firm values, its price is primarily driven by the underlying share performance.
The option to take advantage of whichever is greater in the future – the straight bond value or the conversion value – raises the value of the convertible over both the straight bond and the conversion value.
The Mechanics of Convertible Bonds
- Convertible bonds transition through three primary behavior zones—share, bond, and hybrid—depending on the underlying stock price.
- A 'high-risk zone' exists where a sharp drop in share price causes the bond to trade based on default risk rather than its investment floor.
- Investors value convertibles for their 'defensive' quality, as the bond component provides a price floor against equity market volatility.
- Issuers benefit from lower interest rates and the potential to issue equity at a premium, though this often leads to future shareholder dilution.
- Despite being marketed as a 'miracle product,' the benefits of convertibles are balanced by the cost of issuing future shares below market value.
No, there are no miracles in finance. At best, one can find mirages, and this is one.
The Mechanics of Convertible Bonds
- IFRS accounting standards now require companies to record interest expenses based on market rates for ordinary bonds, diminishing the perceived accounting advantage of lower coupon rates.
- The low interest rate of a convertible bond is essentially a trade-off where the issuer sells call options to investors in exchange for cheaper debt financing.
- Agency theory suggests convertibles resolve conflicts between creditors and shareholders by protecting creditors from risky management decisions through the option of equity conversion.
- The matching hypothesis explains that young, high-growth firms like Tesla use convertibles to align debt obligations with their initially volatile cash flows.
- Signaling theory posits that companies prefer convertibles over direct equity issues to avoid the negative market perception that their shares are currently overvalued.
The apparent cost of the convertible bond is low only because its true cost is partly hidden.
Convertibles and Preference Shares
- Convertible bonds serve as 'backdoor equity' for young, growing firms that face high distress costs from debt but want to avoid immediate stock dilution.
- Large corporations use convertible bonds to diversify their investor base and access specialized capital markets more efficiently.
- Preference shares offer economic advantages, such as priority dividend claims and cumulative payouts, in exchange for limited voting rights.
- Issuing preference shares can improve a company's credit rating because analysts and agencies generally categorize them as equity rather than debt.
- The term 'preferreds' is broad and can encompass various instruments, requiring investors to scrutinize specific security characteristics.
- Convertible debt can mitigate the 'overinvestment problem' by allowing capital to be converted to equity only when real investment options prove valuable.
Convertible bonds cause expensive dilution, but it occurs when the firm can afford it!
Dynamics of Preference Shares
- Preference shares can be customized with adjustable rates, participation in earnings, or tax-deductible trust structures.
- The valuation of preference shares involves adjusting ordinary share prices for specific advantages, liquidity discounts, and the absence of voting rights.
- Banks frequently issue preference shares to bolster regulatory capital while maintaining the financial characteristics of debt.
- Despite their utility, preference shares often trade at a significant discount due to low liquidity and complex issuance requirements.
- Financial analysts typically reclassify preference shares as debt, even if central banks and rating agencies treat them as equity.
Firms issuing this security get the tax shield of debt and keep leverage low (because preference shares are treated like equity by analysts and rating agencies).
Preference Shares and Hybrid Securities
- Preference shares allow companies to raise capital without diluting the voting control of existing family or majority shareholders.
- The market for preference shares has declined in public exchanges as investors increasingly favor a single, high-volume share class.
- Hybrid securities have blurred the lines between debt and equity, often functioning as 'equity in drag' to gain tax advantages.
- Deeply subordinated debt acts as a perpetual instrument with no fixed repayment date, ranking just above common equity in liquidation.
- Issuers of subordinated debt can often cancel interest payments without triggering default, provided certain solvency conditions are met.
Much of this innovation represents 'equity in drag' (Bulow et al. , 1990).
Hybrid Securities and Mandatory Convertibles
- Subordinated debt securities can absorb losses through nominal value reduction and non-payment of interest, often blurring the line between debt and equity.
- Rating agencies use hybrid treatment for these securities, assigning an 'equity content' percentage based on specific terms and conditions.
- Mandatory convertibles differ from standard convertible bonds because they must be redeemed in shares rather than cash, offering less downside protection.
- These instruments are frequently used as opportunistic tools for companies to deleverage balance sheets when direct equity issuance is unattractive.
- The valuation of share-redeemable bonds is a calculation of the present value of interest payments plus the present value of the shares received at redemption.
- Investors, particularly hedge funds, are attracted to mandatory convertibles for their high yield and the ability to offset stock exposure.
Mandatory convertibles are hybrid securities, which automatically convert into a predetermined number of shares dependent on the stock price at the time of conversion.
Exchangeable Bonds and Hybrids
- Exchangeable bonds allow holders to redeem debt for shares in a company other than the issuer.
- At maturity, the issuer either loses the asset and the liability or retains the shares while paying out cash.
- The primary difference between exchangeable and convertible bonds is the specific entity's default risk.
- Issuers like Solidium use these instruments to raise capital at low apparent interest rates, though they risk selling assets below future market value.
- Hybrid securities often mask the true cost of financing and may signal that a company is struggling to issue standard debt or equity.
- In equilibrium markets, all financing sources have the same risk-adjusted cost regardless of their complex structure.
Many of these hybrids give the impression of lowering the company’s cost of financing. Do not believe it!
Mechanics of Hybrid Securities
- Agency and signalling theories explain why companies issue hybrid securities to resolve conflicts or signal value.
- A convertible bond is valued as the sum of a traditional fixed-rate bond and a call option on the company's shares.
- Lower coupon rates on convertibles are not a free lunch but rather compensation for the embedded call option granted to investors.
- Subscription warrants allow for gradual equity dilution and can be issued alone or attached to other securities.
- Hybrid securities like preference shares and mandatory convertibles offer flexible alternatives to traditional debt and equity.
- The choice of hybrid product depends on a company's specific needs regarding control, share volatility, and perceived risk.
A convertible bond is like a traditional bond, generally one bearing a fixed rate, except that it also gives the holder the right to exchange it for one or more shares.
Convertible Bonds and Dilution Analysis
- The text explores the mechanics of convertible bonds, highlighting that they offer downside protection in exchange for limited upside participation compared to direct share ownership.
- Volatility in the underlying share price is positively correlated with the conversion premium of the bond.
- Financial exercises demonstrate how to calculate fully diluted earnings per share (EPS) under different scenarios, such as bond conversion or the exercise of warrants.
- The cost of hybrid securities is complex, often described as a minimum interest rate plus the value of an embedded option.
- Preference shares may trade at a discount to ordinary shares due to significantly lower liquidity, despite their preferential rights.
- The impact of warrants on EPS can be calculated using different methodologies, including the short-term investment of proceeds or the share buy-back method.
A convertible bond does not offer the same percentage of upside participation in the share price as the share itself, but in return it offers downside protection.
Hybrid Securities and Market Entry
- The bibliography highlights extensive research into convertible bonds, exploring their potential underpricing and the motivations behind their issuance in European and global markets.
- Theoretical frameworks suggest convertible debt serves as a 'backdoor' to equity financing or a tool to manage asymmetric information between firms and investors.
- Hybrid securities like tracking stocks and exchangeable bonds are categorized as complex instruments that blur the traditional lines between debt and equity.
- The transition from bank-based financing to direct market financing requires firms to actively market their securities to a broad, anonymous investor base.
- Foundational financial theories, including the Black-Scholes model and agency cost theory, provide the underlying logic for how these hybrid instruments are priced and structured.
Bank finance was beautiful in its simplicity – whenever a company needed funds, it turned to its bank.
The Mechanics of Selling Securities
- Companies aim to maximize security prices while ensuring investors receive a return to maintain future market access.
- Market efficiency relies on pricing in all public information, whereas asymmetric information prevents assets from reaching fair value.
- Issuers and banks must bridge information gaps through legal prospectuses, management presentations, and analyst valuations.
- Underwriting banks face a conflict of interest, balancing their mandate from the issuer with their long-term relationship with investor clients.
- The complexity of an offering is determined by the company's existing market profile, the risk level of the security, and the target investor demographic.
- Banks serve four primary roles in an offering, starting with deal arrangement and the strategic circulation of information.
In any offering the bank’s exact positioning is always ambiguous.
The Securities Issuance Process
- Banks conduct due diligence and research to verify a company's financial health and strategy before a public offering.
- The distribution phase involves sales teams marketing securities to investors and establishing an equilibrium price in the after-market.
- Underwriting serves as a financial guarantee where the bank assumes market risk by ensuring securities find buyers at an agreed price.
- Large offerings typically require a syndicate of multiple banks with specialized roles ranging from global coordinators to co-managers.
- The global coordinator or lead manager oversees the entire deal structure, including the selection of the syndicate and the allocation of securities.
The bank thus assumes a certain market risk. The magnitude of this risk will depend on the type of guarantee and on the timing of the commitment.
Securities Underwriting and Book-Building
- A bought deal represents the highest level of commitment where banks purchase securities directly from the issuer to resell them.
- Firm underwriting agreements act as a secondary safety net, requiring banks to buy securities only if investor interest is insufficient.
- The book-building process serves as a risk-mitigation tool by gauging investor demand and pricing before banks commit to a deal.
- Best efforts agreements are rare in formal markets because the lack of a guarantee can undermine investor confidence.
- Book-building allows for discretionary allocation of securities and helps determine the optimal price for the seller.
- Smaller companies or distressed firms often rely on best efforts deals because banks are unwilling to take on the full risk of the offering.
Book-building allows the banks running the transaction to limit their risk, by assuring them that investors are willing to buy the securities.
Equity Offering Adjustment Mechanisms
- Underwriters use extension clauses to increase the number of shares sold by up to 25% if market demand proves stronger than anticipated.
- The 'greenshoe' option allows banks to stabilize post-offering prices by over-allocating shares and then buying them back or exercising warrants.
- Clawback clauses provide flexibility to reallocate share tranches between different investor groups, such as moving unsold retail shares to institutional buyers.
- Lock-up agreements prevent major shareholders from selling additional stock for a set period, ensuring market stability after a new placement.
- Private placements allow companies to bypass rigorous public disclosure rules and market authority supervision by targeting a limited group of investors.
This is called a greenshoe (named after the first company to use it).
The Mechanics of IPO Discounts
- New stock issues typically rise 10-15% above their initial price, while secondary offerings are usually discounted by 2-5%.
- Pricing discounts serve as a mechanism to overcome information asymmetry between sellers who know the company and investors who know the market.
- The 'winner's curse' phenomenon requires discounts to protect uninformed investors who might otherwise only receive full allocations of poor-quality deals.
- Underwriting banks utilize discounts to reduce their own risk and ensure institutional client demand is met during the marketing phase.
- The magnitude of the discount is directly proportional to the level of information asymmetry and the illiquidity of the security being offered.
- Modern IPOs generally combine underwritten deals for institutional investors with specific offerings for retail investors and employees.
Uninformed investors cannot distinguish which issues are really attractive and thus are exposed to the winner’s curse.
The Book-Building Process
- Book-building is the primary mechanism for institutional tranches in IPOs and dictates the final price for retail offerings.
- The initial phase involves banks structuring the deal, conducting due diligence, and designing the marketing campaign.
- A pre-marketing execution phase uses analyst research and 'warm-up' meetings to gauge investor sentiment before the official launch.
- During the formal marketing period, management conducts roadshows and one-on-one meetings within a 15% price range.
- Investor intentions are recorded in an order book, which determines the final sale price based on demand and price sensitivity.
The notes are presented to investors during “warm-up” meetings, which help test investor sentiment.
The Mechanics of Book-Building
- Banks minimize risk by delaying firm underwriting agreements until shares are immediately allocated to investors.
- The bank's commitment acts as a market signal that mitigates information asymmetry between the company and potential buyers.
- Discretionary allocation allows issuers to select a shareholder base that balances different investment timelines to ensure aftermarket stability.
- Academic theories suggest that IPO discounts and allocations are often used as rewards for information disclosure or to favor high-profit institutional clients.
- The book-building process provides flexibility by allowing price adjustments during the marketing phase based on real-time demand.
The bank derives high profits from its large institutional clients (in particular thanks to trading revenues). They will, therefore, favour them in the primary transactions in granting large allocations and driving the pricing down.
Retail Public Offering Mechanisms
- Retail public offerings involve setting a price range before the sale, with the final price determined by market demand and approved by authorities.
- Allocation of shares to retail investors is often based on supply-demand ratios, sometimes including discounts or fee exemptions to encourage participation.
- Fixed-price offerings set a specific price independent of market conditions, often leading to sharp price increases if the initial price is set too low.
- Minimum-price offerings require buyers to specify a floor price, with the exchange centralizing orders and potentially eliminating extreme price outliers.
- Ordinary full listings allow shares to trade under normal market conditions with a set minimum price and specific limits on price appreciation during initial trading.
In a minimum-price offering, some orders may be shut out entirely, and orders at very high prices are paradoxically eliminated.
Foreign Listings in US Markets
- Companies seek foreign listings, primarily in the US, to expand their shareholder base and access a wider pool of capital.
- Private placements under Rule 144A allow companies to sell shares to Qualified Institutional Buyers (QIBs) without SEC registration.
- American Depositary Receipts (ADRs) serve as negotiable instruments issued by US banks that represent shares in foreign companies.
- ADR levels range from Level 1 (OTC trading only) to Level 3, which allows for public fund-raising but requires full SEC registration.
- A full listing of ordinary shares provides the most direct access to US institutional investors who may be restricted from buying foreign-listed stocks.
This decision is not so unusual – over 3000 foreign companies are listed in the US!
Depositary Receipts and Capital Increases
- Depositary Receipts (DRs) vary by market, including ADRs for US public markets, Rule 144A for institutional buyers, and GDRs for international markets.
- Ordinary registered shares generally offer higher liquidity and lower transaction costs compared to depositary structures by avoiding arbitrage and depositary fees.
- Capital increases for listed companies are primarily driven by whether the firm intends to reward current shareholders or attract a new investor base.
- Rights issues utilize pre-emptive subscription rights and significant price discounts to ensure transaction success despite potential market volatility.
- Unlisted companies determine issue prices based on shareholder cash needs or private placements rather than market price fluctuations.
- Legal constraints prevent shares from being issued below par value, necessitating accounting adjustments like par value reduction if market prices are too low.
The price is set at a significant discount to the market price, so that the transaction will go through even if the share price drops in the run up to the listing of new shares.
Mechanics of Rights Issues
- Rights issues are the preferred method for small investors as they acknowledge loyalty and provide an option to raise cash by selling subscription rights.
- Geographical preferences vary significantly, with rights issues being rare in the US and Japan but mandatory in much of Continental Europe.
- Banks typically underwrite these issues at a 15–30% discount to the market price to mitigate the risk of price drops during the 10-day subscription period.
- Pre-emptive rights protect existing shareholders from dilution by allowing them to maintain their proportional ownership regardless of the discount offered.
- The total value of the new shares plus the subscription rights remains equivalent to the stock's market value, neutralizing the impact of the discounted offer price.
- Capital increase strategies differ between listed and unlisted companies depending on whether the goal is to accommodate current or new shareholders.
No bank will guarantee a price near the current market price because, the longer the subscription period, the greater the risk of a drop in price.
Pre-emptive Subscription Rights
- Subscription rights allow existing shareholders to maintain their proportional stake in a company during a new share issue.
- These rights function similarly to short-term call options, where the strike price is the issue price of the new shares.
- Shareholders are protected from dilution because the rights can be sold on the market if the holder chooses not to subscribe.
- The theoretical value of a right is determined by the spread between the pre-deal share price and the issue price, adjusted by the ratio of new to old shares.
- The 'Theoretical Ex-Right Price' (TERP) represents the share value after the rights have been detached from the original shares.
The subscription right is similar to a call option whose underlying is the share, whose strike price is the issue price of the new shares and whose exercise period is that of the capital increase.
Mechanics of Share Issuance
- Subscription rights require a significant discount to the current share price to ensure deal completion despite market volatility during the 10-day window.
- Issues without pre-emptive rights rely heavily on banking syndicates to market shares to new investors and often include greenshoe options for over-allotment.
- Regulatory frameworks often limit the maximum discount allowed on non-pre-emptive issues to protect existing shareholders from excessive dilution.
- Priority periods offer existing shareholders a first look at new shares when pre-emptive rights are absent, though these periods cannot be traded on the market.
- Equity lines allow companies to issue warrants to banks that are exercised on demand, providing a flexible way for younger firms to raise capital over time.
This is a double-edged sword as, once the deal is launched and the rights issued, nothing can delay the capital increase, even if the share price drops significantly during the deal.
Mechanics of Block Trades
- Block trades involve selling large quantities of shares that exceed normal daily trading volumes without crashing the market price.
- Unlike rights issues, block trades do not raise new capital for the company but represent a transfer of existing ownership.
- Accelerated book-building allows these transactions to be completed in a matter of hours with minimal involvement from top management.
- Public retail offerings for block trades are restricted by specific volume thresholds to ensure market stability.
- In a 'bought deal,' a bank assumes the risk by purchasing the entire block at a discount before reselling it to investors.
The bank is then taking a significant risk and will only buy the shares at a discount to the market price.
Bought Deals and Bond Markets
- Bought deals allow sellers to offload shares instantly at a fixed price, shifting the risk of resale to investment banks overnight.
- While bought deals offer certainty, they often come at a steeper discount and can lead to poor share performance if banks dump stock quickly.
- Investment banks sometimes take aggressive losses on large transactions just to improve their standing in industry league tables.
- Credit ratings have become essential benchmarks in the bond market, creating a sharp divide between investment-grade and high-yield issuers.
- The transition to the euro has facilitated a pan-European bond market, enabling massive corporate issues that frequently exceed one billion euros.
- Bond placement techniques have evolved from competitive bidding toward book-building to avoid the risk of aggressive pricing that alienates future investors.
A number of large transactions (in particular when governments are sellers) have led to heavy losses for investment banks in charge.
The Mechanics of Book-Building
- Book-building allows lead banks to determine market-driven pricing by sounding out investor interest before the issue price is finalized.
- The 'grey market' period allows for the trading of shares before they technically exist, with the lead bank intervening to maintain price stability.
- Bond issuance timelines vary significantly based on the issuer's frequency in the market and whether they are targeting international investors.
- Companies can use 'umbrella prospectuses' under Euro Medium-Term Notes (EMTNs) to tap into capital markets rapidly when conditions are favorable.
- High-yield bond markets in Europe are a relatively recent development, emerging in the late 1990s as an alternative to bank loans for risky firms.
Shares are traded on the grey market without, technically, even existing.
Specialized Bond Placement Strategies
- Private placements are tailored to specific investor appetites, primarily targeting insurance companies and pension funds seeking long-term, low-liquidity assets.
- The private placement market is accessible to non-rated firms and requires a prospectus that is not widely distributed to the public.
- Convertible bonds function as debt instruments with an embedded equity option, allowing investors to redeem the bond for shares if the stock price rises sufficiently.
- High-yield or non-investment grade bonds require a lengthy eight-to-nine-week issuance process involving intensive due diligence and aggressive marketing.
- Information asymmetry is minimized in convertible bond issues because the equity component protects the investor and the market price provides clear valuation data.
Holders of convertible bonds are entitled to all information put out by the issuer to its shareholders, while the share price tells them precisely how much the CB’s option component is worth.
Syndicated Loan Mechanics
- Syndicated loans are collective bank loans that function similarly to bond issues but are not classified as securities.
- The process is led by Mandated Lead Arrangers (MLAs) who handle advisory, placement, and sometimes the initial 'bought deal' of the loan.
- A typical transaction takes approximately two months to complete, moving from term sheet negotiation to final fund delivery.
- Banks often participate in syndicates with low profit margins primarily to maintain strategic relationships with corporate clients.
- Participation is frequently leveraged as a 'pledge' to secure future lucrative roles in M&A advisory or market transactions.
- Equity offerings differ from loans by focusing on bridging the information gap between issuers and investors to achieve the highest share price.
Membership of a syndicate sometimes even comes with the stipulation that it will be remunerated through an implicit or explicit pledge from the company to choose the bank as the lead on its next market transaction or as an advisor on its next M&A deal.
Mechanisms of Selling Securities
- Investment banks manage risk through book-building, where they only commit to a deal after recording investor appetite in an order book.
- Bought deals represent a higher risk for banks as they purchase securities directly from the issuer before placing them with investors.
- Initial Public Offerings (IPOs) often combine institutional underwritten deals with retail offerings that use either price ranges or fixed prices.
- Capital increases for listed companies utilize pre-emptive subscription rights to protect existing shareholders from dilution, functioning similarly to call options.
- The speed and method of bond issuance are primarily determined by the company's credit rating, with investment-grade firms having more flexibility.
- Convertible bonds and syndicated loans follow specialized placement procedures that leverage existing banking relationships and investor guarantees.
A pre-emptive subscription right is akin to a call option.
Equity and Debt Issuance Mechanics
- The text explores the technical differences between share and bond issues, noting that equity requires more extensive disclosure due to higher investor risk.
- A 'bought deal' is identified as the most risky placement procedure for banks because they assume the full market risk of the securities before resale.
- The 'greenshoe' mechanism in financial underwriting is functionally equivalent to a call option granted by the company to the banks.
- Shareholders participating in capital increases via pre-emptive rights are protected from wealth loss despite price drops because they acquire new shares at a discount.
- Convertible bonds are highlighted for their rapid placement speed, offering the downside protection of debt combined with the upside potential of equity.
Which placement procedure carries the most risk for a bank? A bought deal, as a risk is taken that the market will change before the shares can be sold.
IPO Research and Bibliography
- The text provides a comprehensive bibliography of academic research focused on the mechanics of Initial Public Offerings (IPOs).
- Key research themes include the comparison between bookbuilding, fixed-price strategies, and auction-based IPO methods.
- A significant portion of the literature addresses the 'new equity puzzle' and the persistent phenomenon of IPO underpricing.
- The sources explore the strategic behavior of investment bankers in determining offer prices and the allocation of new shares.
- Studies examine the role of institutional investors and the efficiency of the pricing process during different market cycles.
- The bibliography highlights the dominance of bookbuilding over auctions in modern financial markets.
Why don’t issuers get upset about leaving money on the table in IPOs?
Value and Corporate Finance
- This section provides a comprehensive bibliography of academic research on international equity sourcing, specifically focusing on Depositary Receipts and global shares.
- The text lists critical studies on the costs of raising capital through bonds, examining economies of scale in underwriting fees and external financing costs.
- It highlights the regulatory and market impacts of Rule 144A debt offerings and the role of private placements in corporate finance.
- The transition to Section III marks a shift from financial instruments to the core concepts and theories of value creation within a firm.
- The central premise of the upcoming chapters is that maximizing corporate value is fundamentally achieved by minimizing costs.
- The text introduces investment decision processes as the primary mechanism for influencing a company's overall market worth.
No, Sire, it’s a revolution!
Investment Returns and Capital Value
- A profitable investment is defined as one that increases the market value of capital employed rather than just maintaining asset levels.
- Enterprise value, or the value of capital employed, is distinct from equity value as it does not subtract net debt.
- Value creation occurs instantly when the expected return on an investment exceeds the rate of return required by investors.
- If an investment's return matches the market's required rate, the net present value is zero and no economic value is created or lost.
- Investments yielding less than the cost of capital result in an immediate loss of enterprise value, regardless of the initial cash outlay.
- Empirical data from European telecom companies confirms a correlation between the ROCE/WACC ratio and the enterprise value relative to book value.
An investment of 100 that always yields 15% in a market requiring a 10% return is worth 150 (100 × 15%/10%).
The Issuer's Perspective
- A company's liabilities are a financial representation of its industrial and operating assets.
- The rate of return required by investors constitutes a direct financial cost to the issuing company.
- Investors exert power by refusing to finance companies that fail to offer acceptable risk/reward trade-offs.
- Financial markets impose immediate sanctions through the continuous revaluation of existing securities.
- A lower valuation of capital employed can lead to severe financing difficulties and eventual bankruptcy.
- The financial manager's primary role is to ensure transparency between the company's assets and its market representation.
In doing so, he is merely giving tit for tat: an unhappy investor will sell off his securities, thus lowering prices.
Value Creation and Financial Policy
- The valuation of equity is the primary driver of a company's worth during normal operations, while creditors only take control during financial distress.
- Financial decisions should be judged solely by their impact on the value of capital employed rather than accounting metrics like earnings or costs.
- A 'financial sanction' occurs when company decisions negatively impact the market valuation of its shares and debt securities.
- Value creation is distinct from accounting profit; an investment can increase earnings but still destroy value if it fails to meet the investor's required rate of return.
- Corporate financial policy aims to maximize value for fund providers, incorporating a risk premium into the required rate of return.
- The text questions whether financial managers can create value through financing choices alone, independent of the company's industrial and commercial assets.
Financial shortsightedness consists of failing to distinguish between cost and reduction in value, or between income and increase in value.
The Value Additivity Rule
- The equilibrium theory of markets suggests that financial engineering does not inherently increase a company's valuation.
- The value additivity rule dictates that the market value of a diversified company is equal to the sum of its individual parts.
- Arbitrage ensures that if a company's price deviates from the sum of its components, investors will exploit the gap until equilibrium is restored.
- This principle applies to debt as well; the total value of a company remains the same whether it is financed by debt or equity.
- Investors can replicate diversification or leverage in their own portfolios, meaning they will not pay a premium for a company to do it for them.
- Financial value is only created through industrial and commercial synergies, not through mere portfolio diversification at the corporate level.
So why should they pay for an operation they can carry out themselves at no cost?
The Value of Diversification
- The text explores whether combining assets creates value beyond their individual worth, often referred to as the '2 + 2 = 5' synergy.
- Managers often make acquisition decisions, such as LVMH's purchase of Bulgari, that imply a lower required rate of return for subsidiaries than for independent firms.
- A fundamental question is raised regarding whether corporate diversification reduces financing costs and provides a permanent competitive advantage.
- Financial theory suggests that markets only remunerate systematic or market risks that cannot be eliminated through diversification.
- Because investors can diversify their own portfolios, the reduction of unsystematic risk at the corporate level does not necessarily lower the required rate of return.
We must not be misled into believing that a lower degree of risk must be always matched by a lower required rate of return.
The Myth of Financial Synergy
- Corporate value remains unchanged by ownership structure unless management improves the return on capital employed.
- Purely financial diversification creates no value because investors can diversify their own portfolios at no cost.
- Value creation is the result of industrial synergies where the sum of cash flows increases, often described as the 2 + 2 = 5 effect.
- Financial engineering and earnings per share manipulations do not inherently increase a company's underlying value.
- The market values a company based on the perceived risk and profitability of its industrial and commercial operations.
- The rule of value additivity dictates that value cannot be created simply by adding or subtracting assets already in equilibrium.
The financial investor does not want to pay a premium in the form of lower returns for something he can do himself at no cost by diversifying his portfolio.
Value and Organization Theories
- The equilibrium theory of markets serves as an ideal framework but often fails to account for individual interests and real-world complexities.
- Financial decisions become a zero-sum struggle between different stakeholders, such as shareholders and creditors, when total capital value remains static.
- Riskier investments can redistribute value from creditors to shareholders even if the investment is priced at equilibrium.
- The financial manager's primary role shifts from simple analysis to that of a negotiator balancing these competing internal interests.
- Information asymmetry challenges neoclassical assumptions, as managers typically possess more internal data than outside investors.
- Signalling theory emerges as a necessary tool to address the gap between management knowledge and market perception.
In a way, it is the paradise that all financial managers strive for, while secretly hoping never to reach such a perfect state of boredom.
The Power of Financial Signaling
- Asymmetric information is the standard in financial markets, often leading to the undervaluation of companies by misinformed investors.
- Financial expertise alone is insufficient for managers; they must actively shape market sentiment through strategic communication.
- A true financial signal is not a verbal statement but a concrete financial decision that carries potential negative consequences for the decision-maker.
- Investors evaluate signals based on whether the issuer's interests align with their own, favoring actions like management reinvestment.
- Market credibility is maintained by supervisory authorities who penalize misleading information to ensure fair financing costs.
- Markets quickly identify and punish dishonest signaling, making the reputation of management a secondary factor to the substance of their actions.
It is a real financial decision, taken freely and which may have negative financial consequences for the decision-maker if it turns out to be wrong.
Signalling and Agency Theories
- Signalling theory posits that corporate financial decisions serve as communicative signals from managers to investors regarding a company's health.
- Information asymmetry can result in undervalued shares, leading to suboptimal investment levels and a preference for debt financing.
- Agency theory views the corporation not as a single entity, but as a complex web of contractual relationships between parties with conflicting interests.
- The principal-agent relationship creates risks where managers may prioritize personal security or company size over shareholder wealth maximization.
- Mechanisms such as stock options and debt obligations are used to align managerial incentives with the interests of shareholders.
- Debt acts as a disciplinary tool, forcing managers to maximize cash flows to avoid bankruptcy and subsequent job loss.
Debt plays a role as well since it has a constraining effect on managers and encourages them to maximise cash flows so that the company can meet its interest and principal payments.
Agency Costs and Free Riders
- Debt can act as a disciplinary tool that aligns the interests of management and shareholders by forcing a focus on cash flow maximization.
- Agency costs arise from the divergence of interests between principals and agents, including monitoring expenses, bonding costs, and residual losses.
- Research indicates that firms managed by non-shareholding CEOs often suffer from lower margins and asset turnover rates compared to owner-managed firms.
- The concept of corporate governance is intellectually rooted in the comparison between financial theory and organizational theory.
- Free rider behavior occurs when an individual investor benefits from the sacrifices or transactions of others without participating themselves.
- Strategic dilemmas, such as responding to takeover bids or restructuring bank debt, are often complicated by the conflicting interests of individual versus collective stakeholders.
Maybe debt is the modern whip! This is sometimes referred to as “the discipline of debt”.
The Pursuit of Economic Rent
- Extraordinary returns are only possible when a company possesses a strategic advantage that creates market imperfections.
- In a state of perfect competition, the net present value of a project should theoretically be zero.
- Corporate strategy focuses on building barriers to entry to secure economic rents, which are returns exceeding the required rate for a given risk.
- Economic rents are inherently temporary as they attract competitors, technological disruption, or antitrust intervention.
- Share prices adjust immediately to strategic shifts, reflecting the present value of future returns rather than waiting for them to accrue.
- Tax optimization serves as a secondary lever for value creation, provided it does not introduce disproportionate risk.
There are no impregnable fortresses, only those for which the right angle of attack has not yet been found.
Taxation and Financial Decisions
- The text identifies key tax variables including capital gains versus ordinary income and the treatment of financial expenses.
- It highlights the importance of tax groups and the strategic use of tax-loss carryforwards in corporate finance.
- A core principle is established that financial decisions should rarely be made based solely on tax considerations.
- Delaying an asset sale for a better tax rate risks a market value decline that may exceed any potential tax savings.
- The section emphasizes the trade-off between tax optimization and market exposure risk.
Our experience tells us that taking a financial decision solely on the basis of tax considerations is rarely the right thing to do.
The Foundations of Value Creation
- Value is created only when the rate of return on an investment exceeds the required rate of return relative to its risk.
- The theory of markets in equilibrium suggests that competition and deregulation naturally erode economic rents and entry barriers over time.
- Financial synergies, diversification, and debt do not create value for investors because individuals can replicate these actions at no cost.
- Signal theory addresses information asymmetry, where specific financial decisions act as signals to correct market valuations.
- Agency theory explores the conflicting interests of shareholders, managers, and creditors, forming the basis for modern corporate governance.
Financial synergies do not exist.
Value Creation and Corporate Signaling
- Distinguishes between the genuine creation of value through innovation and productivity versus the mere transfer of value through tax reduction or oligopolies.
- Explores how financial decisions, such as dividend changes or shareholder equity subscriptions, serve as market signals regarding a company's health.
- Examines the 'conglomerate discount' and how diversified business structures can inadvertently increase the cost of equity.
- Analyzes the relationship between a company's rate of return and the required market rate to determine if an investment truly generates wealth.
- Discusses the agency theory behind requiring managers to invest significant personal wealth into their own company's shares to align interests.
Can a signal be sent if there is no cash flow?
Value Creation and Corporate Strategy
- Value is created when investment returns exceed the required rate of return or when financing is secured below market rates.
- Synergy occurs when the value of a combined entity exceeds the sum of its individual parts through cost reduction or product improvement.
- Conglomerates often suffer from a 'conglomerate discount,' where the whole is worth less than its parts due to inefficient capital allocation.
- Economic rent allows for returns above the required rate based on temporary market imbalances or specific strategic advantages.
- A financial decision only serves as a true signal if it is made freely and carries negative consequences for management if proven wrong.
- Agency theory addresses the conflict between managers' personal diversification interests and the financial criteria of shareholders.
A decision can only be qualified as a signal if it is taken freely and if there is a viable alternative.
Evolution of Value Creation Indicators
- The financial industry has developed a confusing array of acronyms and indicators to measure value creation, ranging from traditional accounting metrics to modern stock market criteria.
- Companies often exploit the lack of standardized guidelines by selecting indicators that best serve their immediate interests, sometimes changing them routinely.
- Indicators are categorized by their ease of manipulation, sensitivity to financial markets, and their fundamental nature (accounting, economic, or hybrid).
- There is a historical trend moving from easily manipulated accounting figures like Net Profit toward more robust measures like EVA, MVA, and TSR.
- As investors gain experience and financial markets exert more influence, the ability of companies to manipulate performance data significantly diminishes.
However, in practice some companies use the lack of clear guidelines and standards to choose indicators that best serve their interests at a given time, even if this involves the laborious task of changing indicators on a routine basis.
Evolution of Financial Indicators
- Traditional earnings per share (EPS) are easily manipulated through 'window dressing' and accounting adjustments.
- Return on Equity (ROE) can be artificially inflated by increasing debt levels, which masks higher risk without creating real value.
- Return on Capital Employed (ROCE) has become the primary measure of economic performance because it avoids the leverage bias of ROE.
- Cash flow metrics for a single year are often meaningless and easy to manipulate, requiring a focus on long-term drivers like ROCE.
- True value creation is only confirmed when the return on capital employed exceeds the weighted average cost of capital (WACC).
- Financial indicators must account for risk and the cost of financing to provide an accurate picture of a company's health.
Even though ROE might look more attractive, no “real” value has been created since the increased profitability is cancelled out by higher risk not reflected in accounting data.
Measuring Corporate Value Creation
- Economic Value Added (EVA) or economic profit measures value creation in currency units rather than percentages.
- Net Present Value (NPV) is the most precise indicator of value creation, though it is difficult for external analysts to calculate accurately.
- Market indicators like Total Shareholder Return (TSR) and Market Value Added (MVA) are highly sensitive to stock market volatility and investor expectations.
- A company can show strong economic performance, such as a high ROCE, while its stock market indicators remain flat or decline.
- Stock market measures reflect future anticipations, whereas economic indicators focus on past performance, making them complementary tools.
- The fundamental rule of financial management is to allocate resources only when the Net Present Value is positive.
In a bull market, a company with mediocre economic performance may have flattering TSR and MVA.
Value Creation and Economic Profit
- Value creation is defined as the difference between the enterprise value and the book value of capital employed, reflecting investor expectations of future rents.
- The shift from accounting costs to financial costs requires evaluating securities based on the required rate of return rather than explicit book values.
- Net Present Value (NPV) remains the most reliable financial criterion, especially when analyzing complex hybrid securities where simple cost concepts fail.
- Economic Value Added (EVA) measures annual wealth creation by deducting the cost of both debt and equity from operating profits.
- A company only creates value when its Return on Capital Employed (ROCE) exceeds its Weighted Average Cost of Capital (WACC).
- NPV is mathematically linked to EVA, representing the sum of all future economic profits discounted at the weighted average cost of capital.
The innovative aspect of EVA is that it identifies the income level at which value is created.
Metrics for Value Creation
- Calculating Economic Value Added (EVA) requires shifting from accounting to economic perspectives by restating capital items like goodwill, exceptional losses, and deferred taxes.
- EVA serves as a decentralized management tool but carries the risk of encouraging short-termism and underinvestment at the expense of future value.
- Cash Flow Return on Investment (CFROI) measures the internal rate of return on existing projects and indicates value creation when it exceeds the weighted average cost of capital.
- Market Value Added (MVA) represents the difference between a company's market capitalization and its book value of equity, serving as a market-based performance metric.
- The complexity and numerous accounting adjustments required for these tools often serve as a barrier to entry and a justification for specialized consultancy services.
Such accounting expertise typically represents a barrier to entry for others seeking to perform the same analyses.
Measuring Market Value Creation
- Market Value Added (MVA) measures value creation by comparing market value to the actual capital invested, offering a more relevant metric than share price alone.
- MVA is mathematically linked to economic profit, which is calculated as capital employed multiplied by the spread between ROCE and WACC.
- Total Shareholder Return (TSR) combines share price appreciation and dividends to show the actual return realized by an investor over a specific period.
- Calculating TSR over long durations (5 to 10 years) is essential to smooth out market volatility and bubbles, such as the 2000 tech crash.
- While accounting criteria like EPS and net profit are commonly used by boards, they are flawed because they ignore the opportunity cost of capital and are subject to manipulation.
- Market efficiency debates suggest that MVA can be volatile and outside management control, yet this volatility is an inherent reality of financial markets.
However, those who do not believe in market efficiency contend that MVA is flawed because it is based on market values that are often volatile and out of the management’s control.
The Earnings Per Share Fallacy
- Accounting metrics like EPS and equity per share are often used despite ignoring risk and the true cost of equity.
- Artificially boosting accounting ratios does not automatically create shareholder value or guarantee a higher share price.
- The popularity of EPS stems from misconceptions that accounting data directly dictates company value regardless of method changes.
- A financial decision that increases EPS may simultaneously lower the P/E ratio if it increases the company's risk profile.
- Acquisitions financed by debt can mathematically increase net profit while failing to create actual economic value or synergy.
In order to maximise value, it is simply not enough to maximise these ratios, even if they are linked by a coefficient to value or the required rate of return.
The Fallacy of EPS Growth
- Earnings per share (EPS) can increase significantly through debt-financed acquisitions even when the transaction destroys shareholder value.
- Value destruction occurs when the premium paid for an acquisition exceeds the present value of the synergies created, regardless of the accounting impact on EPS.
- The 'mechanical effect' of merging companies with different P/E ratios can cause EPS dilution even when strong industrial synergies are creating real value.
- EPS is an accounting metric rather than a measure of value, and its growth only reflects value creation under specific conditions of constant risk, growth, and financial structure.
- A higher P/E ratio in the market can compensate for diluted EPS if the acquisition improves the company's overall growth prospects and industrial synergies.
At the risk of being repetitious, a word of warning about the widespread fallacy that EPS growth equals value creation.
The Fallacy of Accounting Returns
- Earnings Per Share (EPS) is an unreliable metric for value creation because it fails to account for changes in risk profiles and growth rates following acquisitions.
- Accounting rates of return, including ROE, ROCE, and CFROI, are limited by their reliance on historical accounting data rather than market-based requirements.
- A company may mistakenly reject profitable diversification if it uses its current high return on capital as a hurdle rate instead of the investors' required rate of return.
- Value is created whenever an investment's return exceeds the cost of capital, even if that investment lowers the company's overall average return on capital employed.
- Conversely, an investment can increase a company's average return while still destroying value if the return remains below the rate required by investors.
And yet the return on capital employed fell by 20% to 17.5%, demonstrating that this criterion is not relevant.
Accounting Ratios vs Value Creation
- Accounting measures like ROE and ROCE can deceptively show improvement even when an investment destroys economic value by failing to meet the required rate of return.
- Financial managers often operate in a 'closed system' of book returns, ignoring the external minimum criteria set by the financial system.
- There is a persistent disconnect between corporate decision-making based on flattering accounting metrics and the actual creation of shareholder value.
- The concept of value creation is often unfairly blamed for layoffs and cost-cutting, whereas sustainable value actually stems from innovation and growth.
- Managers have a fiduciary duty to prioritize the financial interests of shareholders, as pursuing vague alternative objectives often leads to failure across all goals.
Financial managers typically choose those measures that will demonstrate the creation, rather than the destruction, of value.
Measuring Corporate Value Creation
- Net Present Value (NPV) is identified as the only true financial tool for measuring value creation, though it is difficult for external analysts to calculate.
- Financial tools like Economic Value Added (EVA) measure wealth increases above standard remuneration but are susceptible to short-term manipulation.
- Market-based tools such as Market Value Added (MVA) and Total Shareholder Return (TSR) reflect long-term value but are often distorted by market volatility.
- Accounting indicators like EPS and ROE are popular due to their simplicity but fail to account for risk or the cost of equity.
- Sustainable value creation is presented as the essential prerequisite for a company to meet social, environmental, and growth-related goals.
- The lack of a universal standard allows companies to selectively use metrics that present their performance in the most favorable light.
Fortunately, there is more to life than finance. Yet in finance, there is just one overrid-ing objective – creating value – and only by meeting this objective can one achieve all the others.
Value Creation Assessment Exercises
- The text presents a series of critical questions regarding the relationship between Economic Value Added (EVA) and market performance.
- It challenges the assumption that Earnings Per Share (EPS) fluctuations are direct indicators of value creation or destruction during mergers.
- The exercises explore the limitations of profitability metrics like ROCE and the necessity of restating balance sheets for accurate financial analysis.
- The material addresses the paradox of negative EVA coinciding with rising market equity values, highlighting the role of investor expectations.
- It questions the ethical and economic implications of value creation through cost-cutting measures such as layoffs versus product development.
If you were stranded on a desert island with only one criterion for measuring value creation, which would you want to use?
Measuring Economic Value Creation
- The text critiques Economic Value Added (EVA) as a rebranded concept that often fails to account for long-term investment cycles.
- Total Shareholder Return (TSR) is dismissed as intellectual trickery unless measured over a minimum five-year period to smooth market volatility.
- Value creation is theoretically infinite through new product development, whereas cost-cutting has a finite ceiling.
- The relationship between earnings per share (EPS) and value creation is not absolute; EPS can drop even when a deal potentially improves growth or risk profiles.
- Market Value Added (MVA) can remain positive even when current EVA is negative, reflecting investor hope for future mergers or turnarounds.
Take a concept that has existed for years, give it a new trendy name and the full media treatment and you’ve got EVA.
Investment Criteria and Financial Analysis
- The text establishes that the mathematical principles of present value and internal rate of return (IRR) apply equally to industrial investments and financial securities.
- Net Present Value (NPV) is identified as the superior criterion for measuring value creation and selecting or rejecting investment opportunities.
- While NPV and IRR yield identical results for simple 'yes or no' decisions, NPV is the more reliable metric when choosing between mutually exclusive projects.
- The analysis emphasizes the use of incremental cash flows as the primary data point for making sound financial decisions.
- Alternative investment criteria are acknowledged as existing within accounting contexts but are dismissed as less relevant for modern financial management.
When it is simply a matter of deciding whether or not to make an investment, NPV and IRR produce the same outcome.
Investment Criteria and Value Creation
- Net Present Value (NPV) serves as the primary metric for determining if an investment creates or destroys value based on risk-adjusted cash flows.
- While negative NPV projects are occasionally pursued for strategic positioning, they must eventually be offset by value-creating projects to avoid corporate ruin.
- The Internal Rate of Return (IRR) is a popular secondary metric, though it is conceptually inferior to NPV because it assumes unrealistic reinvestment rates.
- Usage of financial tools varies by demographics, with MBA graduates and large firms favoring NPV, while smaller firms and older managers often rely on intuition or the payback ratio.
- A common error in financial management is discounting project cash flows at the group's cost of capital rather than a rate specific to the project's unique risk profile.
- Sound investment decisions should prioritize incremental cash flows over accounting data to ensure accurate valuation.
All other things being equal, decisions about projects with an NPV of zero are akin to tossing a coin in order to decide whether or not to go ahead.
Principles of Investment Analysis
- Investment returns must be assessed using actual cash flows rather than accounting income or expenses.
- Accounting measures like depreciation are irrelevant because they do not represent actual cash movements.
- Only incremental flows—the specific changes in cash position caused by the project—should be considered.
- Sunk costs already incurred must be ignored as they do not affect the future value creation of a new decision.
- Potential cannibalization of existing product sales must be factored into the investment's return calculation.
- Focusing solely on marginal contributions can occasionally lead to overcapacity and price wars in specific sectors.
It would be absurd to carry out an investment simply because the preparations were costly and one hopes to recoup funds that, in any case, have already been spent.
The Opportunity Principle
- Financial managers prioritize market value over historical book value, treating assets as commodities to be bought or sold based on current worth.
- The opportunity principle dictates that holding an asset is functionally equivalent to choosing to buy it at its current market price.
- CFOs must act as 'asset dealers,' maintaining a detached perspective that views no business activity as inherently essential or permanent.
- Investment decisions should be evaluated solely on operating and investment flows, strictly excluding financing costs to avoid double-counting.
- Separating financing from investment flows ensures that the Net Present Value (NPV) and Internal Rate of Return (IRR) are not artificially skewed.
Theoretically, a financial manager does not view any activity as essential, regardless of whether it is one of the company’s core businesses or a potential new venture.
Investment Criteria and Financial Leverage
- Using debt to finance investments can artificially inflate NPV and IRR, creating a misleading sense of profitability.
- As debt levels rise, the required return on equity must also increase to compensate shareholders for the heightened financial risk.
- It is a fallacy to compare a project's IRR directly to the cost of debt, as debt availability depends on equity acting as collateral.
- Investment valuations should typically be performed on an after-tax basis to account for depreciation, tax shields, and subsidies.
- Consistency is vital in financial modeling: discount rates must match the currency, inflation expectations, and tax status of the cash flows.
- Comprehensive investment assessment requires planning the amount and timing of operating, investment, and extraordinary cash flows.
We recommend using after-tax valuations because a world without taxes only exists in textbooks!
Forecasting Investment Cash Flows
- Financial managers must account for residual value beyond the explicit forecast horizon, as economic value often persists after accounting depreciation reaches zero.
- Operating flows are calculated by adjusting EBITDA for corporate taxes, focusing specifically on the incremental income and expenses generated by the investment.
- Working capital requirements must be deducted from cash flows because, although the capital is eventually retrieved, the time lag creates a significant discounting cost.
- Investment flows include tangible, intangible, and financial assets and must be recorded based on actual payment dates rather than accounting accruals.
- Extraordinary flows, such as anticipated litigation or tax audits, should be included on an after-tax basis, typically within the first two years of a forecast.
A euro capitalised today in working capital can be retrieved in 10 years’ time, but it will not be worth the same.
The Payback Period Criterion
- The payback period measures the time required to recover an initial investment outlay through cumulative cash flows.
- Financial managers often use an arbitrary cut-off date to reject projects that do not return capital quickly enough, especially in high-risk scenarios.
- A major flaw of the payback rule is that it prioritizes liquidity over value, potentially leading to the rejection of projects with positive Net Present Value (NPV).
- The standard payback calculation ignores the time value of money, though this can be mitigated by using a discounted payback period.
- While useful for simple productivity improvements and encouraging employee suggestions, the method fails to account for cash flows occurring after the payback threshold.
- Return on Capital Employed (ROCE) is introduced as an alternative metric, measuring wealth created against the fixed assets and working capital used.
Clearly, when the perceived risk on the investment is high, the company will look for a very short payback period in order to get its money back before it is too late!
ROCE Versus Internal Rate of Return
- Return on Capital Employed (ROCE) is heavily influenced by accounting biases, specifically the book value of assets and chosen depreciation methods.
- A project's intrinsic profitability remains unchanged regardless of accounting choices, yet ROCE can fluctuate significantly based on straight-line versus declining balance depreciation.
- Unlike Internal Rate of Return (IRR), accounting rates of return fail to account for the timing of cash flows and often overstate actual returns.
- While ROCE is flawed as a primary investment criterion, it serves as a vital financial control tool to verify if anticipated returns are manifesting in the books.
- Discrepancies between IRR and ROCE should be scrutinized to understand the distribution of income flows and the impact of terminal value.
- When capital is rationed, the Present Value Index (PVI) is the preferred metric to rank projects that exceed the firm's budget constraints.
Do you really believe that just changing an accounting method can influence the intrinsic profitability of a project? Of course not, and this example clearly illustrates the flaw inherent in the criteria.
Investment Criteria and Capital Allocation
- The Profitability Value Index (PVI) allows financial managers to rank projects by their Net Present Value relative to initial outflows, ensuring optimal capital allocation when funds are limited.
- Net Present Value (NPV) remains the primary criterion for investment decisions because it directly measures the value creation of a project.
- Secondary metrics like Internal Rate of Return (IRR), payback ratio, and return on capital employed provide additional perspectives on yield, liquidity, and financial control.
- Accurate investment analysis requires focusing exclusively on incremental free cash flows rather than accounting revenues or book values.
- Financial managers must disregard financing methods, such as loans or dividends, to maintain a consistent focus on the project's marginal contribution to the company.
- The gap between financial theory and business practice is narrowing as NPV and IRR become the standard tools for corporate decision-making.
This involves calculating the investment’s marginal contribution to the company’s cash flows; reason in terms of opportunity – i.e. in financial values and not in book values.
Investment Criteria and Exercises
- The text presents a series of theoretical questions regarding the nuances of investment evaluation, including the treatment of working capital, inflation, and negative operating cash flows.
- Practical exercises require the calculation of Net Present Value (NPV) and Internal Rate of Return (IRR) for industrial plant extensions and equipment replacements.
- Specific scenarios explore the financial impact of tax rates, depreciation methods, and the sale of existing assets on the overall value of a new investment.
- Case studies examine complex decision-making processes such as government-subsidized transport contracts and 'make vs. buy' decisions for industrial components.
- The material highlights potential mathematical anomalies in investment metrics, such as problems encountered when calculating payback ratios with fluctuating cash flows.
What problem do you come up against when calculating the payback ratio?
Investment Criteria and Financial Analysis
- A Frankfurt parking and petrol station project requires evaluating accounting returns versus internal rate of return (IRR) over a 30-year concession.
- The discrepancy between average annual returns and IRR highlights the impact of time value of money on capital budgeting.
- A manufacturing replacement analysis for Robin plc compares the sunk costs of existing machinery against the efficiency gains of new technology.
- The Robin plc case demonstrates how tax credits on capital losses and reduced per-unit labor and material costs influence cash flow schedules.
- Pincer plc's credit policy evaluation weighs the benefits of increased sales volume against the rising costs of capital and bad debt risks.
- The exercises emphasize that optimal financial decisions require balancing incremental revenue with the cost of extended payment periods.
Why is the IRR not equal to the average of the annual returns on the project?
Investment Criteria and Exercise Solutions
- The text provides detailed numerical solutions for capital budgeting exercises, focusing on Net Present Value (NPV) and Internal Rate of Return (IRR).
- It demonstrates the calculation of cash flows by accounting for EBITDA changes, working capital shifts, and tax implications over multi-year periods.
- Specific scenarios address the financial impact of replacing old machinery, including tax credits on capital losses and incremental depreciation savings.
- The solutions highlight the limitations of certain metrics, such as the average accounting return being skewed by heavily depreciated assets in later years.
- Negative cash flows are explicitly defined as part of capital expenditure, treated similarly to the purchase of fixed assets in financial modeling.
- A comprehensive bibliography lists academic resources and surveys on the practical application of capital budgeting techniques in corporate finance.
No, never, negative flows are part of capital expenditure in finance just as the purchase of a fixed asset is.
Fundamentals of Capital Cost
- The cost of capital (WACC) is a fundamental finance metric used to discount cash flows for NPV and determine enterprise value.
- A critical distinction exists between the cost of equity and the overall cost of capital, which includes both debt and equity components.
- In an equilibrium market, the cost of capital is determined solely by the systematic risk of the company's assets-in-place.
- Economic characteristics such as fixed-to-variable cost ratios and sensitivity to the economic climate directly dictate a sector's cost of capital.
- Predictability of cash flows and future growth rates significantly influence the rate of return required by investors.
The cost of capital depends solely on the risk of the assets-in-place, specifically its systematic risk, since unsystematic or specific risks are not remunerated.
Capital Structure and Asset Beta
- A company's cost of capital is fundamentally determined by the risk of its operating assets rather than its specific mix of debt and equity financing.
- In a perfect market, changing capital structure through debt-financed share buy-backs is neutral for diversified investors and does not alter the overall cost of capital.
- The cost of equity and debt are dependent variables derived from the asset risk, the overall cost of capital, and their respective weightings.
- The direct method for calculating the cost of capital utilizes the Capital Asset Pricing Model (CAPM) with an 'unlevered beta' or asset beta.
- Asset betas are generally lower than equity betas because they exclude the additional financial risk introduced by net debt.
- Different industries exhibit varying asset betas, ranging from low-risk utilities and spirits to high-risk sectors like construction and life insurance.
Since a company’s liabilities merely provide a “screen” between the asset side of the company and the financial market, the rate of return required to satisfy investors is equal to the risk-free rate plus a risk premium related to the company’s activity.
Calculating Asset Beta and WACC
- Asset beta represents the risk of a company's underlying assets, excluding the impact of financial leverage.
- While analysts often assume debt beta is zero for low-leverage firms, high leverage causes debt to behave more like equity.
- The common formula incorporating tax shields relies on Modigliani-Miller assumptions that often fail in real-world scenarios.
- Practical limitations include the fact that even top-rated companies like Microsoft must pay a credit spread over the risk-free rate.
- The Weighted Average Cost of Capital (WACC) serves as the market-based rate of return required by all providers of funds.
In these cases, debt then begins to behave more like equity in terms of beta characteristics.
The Cost of Capital Pitfalls
- The Weighted Average Cost of Capital (WACC) is the most common method for determining capital costs but is frequently misapplied in financial simulations.
- Increasing debt levels appears to lower the cost of capital on paper because debt is cheaper than equity, but this ignores the resulting rise in risk premiums.
- Financial reality dictates that as leverage increases, the cost of both equity and debt must rise to compensate for higher financial risk.
- Cost of capital is a forward-looking financial concept based on expected returns, not an accounting concept based on historical or effective returns.
- Calculations must be based on current market data and the Capital Asset Pricing Model (CAPM) rather than accounting figures like Book Value or ROE.
While the arithmetic may be correct, this is totally wrong financially.
Market Values in Capital Cost
- The cost of debt is defined by current refinancing rates based on present economic standing rather than historical contract rates.
- Required rates of return for both shareholders and debtholders must be calculated using market values instead of book values.
- Using book values for liabilities and equity can be highly misleading as they often deviate significantly from actual market prices.
- Yield to maturity for bonds is derived from closing market prices rather than the face value of the instrument.
- For unlisted companies, the cost of capital is estimated by benchmarking against publicly traded peers of comparable size and risk profile.
The Nestlé shareholder does not require a 16% return on book equity of CHF 62.6bn, but a 6.3% return on market capitalisation of CHF 212bn!
Project Risk and Capital Cost
- Distinguishing between the firm's overall cost of capital and the specific cost of capital for a project is essential for accurate valuation.
- Greenfield projects or investments in new geographies require a risk premium, often around 2%, added to the standard cost of capital.
- The cost of capital should reflect the project's specific industry and geographic risks rather than the specific source of financing used.
- Using the cost of debt or equity directly to evaluate a project leads to erroneous investment choices, potentially favoring lower-return projects over higher ones.
- Valuation dilemmas involving circular logic between equity value and capital cost can be solved through target structures, iterative Excel calculations, or direct methods.
- A project's risk profile and its corresponding WACC may evolve over time, requiring adjustments based on the investment's maturity.
As a result, this reasoning has led the company to undertake the investment yielding the lower return (6% vs. 8%) for the same level of risk.
Calculating Capital Costs Globally
- Diversification does not inherently reduce the cost of capital because it only eliminates unsystematic risk, which the market does not reward.
- Multinational companies must use discount rates that reflect the systematic risks of the specific country where a project is located, rather than their home country.
- Emerging markets present practical challenges for valuation due to the lack of reliable local risk-free rates and significant financial market data.
- The Bancel and Perrotin system calculates emerging market capital costs by adding a sovereign spread to a developed market's risk-free rate.
- Industry-specific beta coefficients should be derived from developed markets as they reflect sector sensitivity rather than country-specific factors.
- Financial analysts must ensure that the currency used for cash flow projections matches the currency denomination of the discount rate to avoid valuation errors.
A British company investing in Russia, for example, should not use a discount rate based on British data just because its suppliers of funds are British.
Capital Cost and Financial Structure
- The cost of capital for companies with structural net cash should be calculated by treating cash as negative debt, resulting in a cost of capital higher than the cost of equity.
- A company's cost of equity is a weighted average of the required return on operating assets and the lower return generated by cash reserves.
- Practitioners often mistakenly equate the cost of capital with the cost of equity for cash-rich firms, ignoring the risk-mitigating effect of cash.
- Financial distress does not inherently increase a company's cost of capital because bankruptcy risk is considered a specific rather than a systematic risk.
- While distressed firms face extremely high costs of equity due to high leverage, the low weight of equity in their capital structure keeps the overall cost of capital stable.
- Maintaining a consistent cost of capital across a sector allows distressed firms the theoretical possibility of recovery through new investments.
Bankruptcy risk is a specific risk and not a systematic risk, and it should therefore not be taken into account by the cost of capital.
The Cost of Capital Illusion
- Using debt to lower capital costs is often offset by shareholders raising their required rate of return due to increased risk.
- Highly efficient global companies like Google and Toyota often avoid leverage despite having low bankruptcy risk.
- Risk-reducing measures like outsourcing or long-term contracts often result in lower margins, neutralizing the benefit to the cost of capital.
- Diversification fails to lower the cost of capital because it only reduces specific risk rather than market risk.
- True value creation comes from improving return on capital employed rather than attempting to manipulate the cost of capital.
- The cost of capital is dynamic and reflects a company's business profile, as seen in Bouygues' shift from construction to telecoms.
In short, in a perfect world in which investors had diversified portfolios, one man’s gain would be another man’s loss.
The Cost of Capital
- The cost of capital, or WACC, is a fundamental corporate finance concept used for investment decisions and business valuation.
- It is determined by the risk of capital employed and exists independently of the final capital structure.
- Calculation methods include direct analysis of asset beta, weighted averages of equity and debt, or direct observation of capital value.
- Diversified companies and those operating in multiple countries must account for multiple costs of capital based on sector and regional risks.
- Managers have limited ability to create value by manipulating the cost of capital, as lower risk typically correlates with lower returns.
The only hope that they have is of providing better information to the market.
Cost of Capital Case Studies
- The text provides practical exercises for calculating the net present value (NPV) of investments both before and after tax considerations.
- A detailed case study of the Cyclone group examines three distinct sectors: equipment sales, maritime shipping, and shipyard operations.
- Financial analysis reveals that while the shipyard division is currently unprofitable, the group remains economically cohesive and carries very little debt.
- The cost of capital is calculated individually for each division, showing how risk profiles (beta) and capital structures influence required returns.
- The group's overall cost of capital is determined to be 8.60%, reflecting a weighted average of its diverse maritime business segments.
There is the possibility that the current capital allocation may not be optimal, given the co-existence of profitable divisions and a non-profitable division.
Risk and Investment Analysis
- Traditional valuation methods like DCF and WACC provide useful parameters but fail to fully capture an investor's exposure to risk.
- Mathematical criteria alone are insufficient for predicting the future of complex industrial investments.
- Investors utilize various risk analysis techniques to look beyond the basic information provided by Net Present Value (NPV).
- A significant shortcoming of traditional risk analysis is the failure to account for the value of managerial flexibility.
- Options theory is emerging as a crucial tool for assessing modern concepts in investment analysis and valuing strategic flexibility.
Attempting to predict the future is too complicated (if not impossible!) to be done using mathematical criteria alone.
Assessing Investment Risk
- The business plan serves as the primary tool for modeling a firm's future and identifying parameters that significantly impact project value.
- Risk is categorized by an investor's level of control, distinguishing between endogenous factors like costs and exogenous factors like exchange rates.
- Sensitivity analysis tests project viability by isolating variables such as volume or discount rates to see their specific impact on Net Present Value.
- Firms typically utilize three-scenario modeling—pessimistic, realistic, and optimistic—to prepare for various macroeconomic shifts.
- A 'crash test' or worst-case scenario is used to determine the risk of bankruptcy and the maximum debt capacity a project can safely sustain.
- Monte Carlo simulations provide a sophisticated mathematical approach by assigning probability distributions to key variables to forecast outcomes.
The investor, in particular if he is not familiar with the sector (which is usually the case of financial investors) may be tempted to build a very pessimistic scenario (worst-case scenario or crash test).
Risk Analysis and Real Options
- Monte Carlo simulations generate a Net Present Value (NPV) risk profile by sampling probability distributions of key variables like market share and fixed costs.
- The certainty equivalent method discounts risky future cash flows by converting them into guaranteed amounts and applying a risk-free rate.
- Conventional risk analysis techniques are fundamentally limited by the assumption that investment decisions are irreversible.
- Managers possess inherent flexibility to abandon, postpone, or extend projects as new information becomes available during implementation.
- Standard NPV and discount rates fail to account for the strategic value of managerial flexibility in response to random events.
Assuming that an investment is irreversible disregards the fact that corporate managers, once they get new information, generally have a number of options.
The Value of Real Options
- Industrial managers possess the ability to adjust investments based on evolving market conditions and prospective returns.
- The flexibility to increase, reduce, or postpone an investment project mirrors the strategic position of a financial manager holding an option.
- Conventional financial analysis often fails to account for the intrinsic value provided by investment flexibility.
- Real options represent the right, but not the legal obligation, to modify industrial projects as new information emerges.
- These opportunities are frequently referred to as hidden options because investors may not recognize or admit to having a margin for maneuver.
Industrial managers who have some leeway in managing an investment project are in the same position as financial managers holding an option.
The Value of Real Options
- Real options theory provides a framework for analyzing investment uncertainties as potential sources of value rather than just risks.
- For a real option to exist, a project must possess high underlying volatility and the potential for investors to acquire precise, actionable information over time.
- A critical requirement for option value is the ability to significantly and irrevocably modify a project based on new information.
- Industries like publishing and pharmaceuticals derive significant value from 'out of the money' innovations that may become profitable as markets evolve.
- Operational flexibility, such as building a modular factory that can be expanded, creates tangible value by allowing managers to react to demand shifts.
- The initial investment in a new business often acts as a call option, where the strike price is the start-up cost for future opportunities.
If the industrial manager cannot use the additional information to modify the project, he does not really have an option but is simply taking a chance.
Evaluating Real Options
- Real options allow investments to be judged by their ability to offer recurring flexibility throughout their lifecycle, such as power plants that can switch fuel sources.
- The option to contract or reduce business acts as a put option, allowing investors to cut variable costs or cancel unrealized portions of a project if market demand is low.
- Postponing a project provides time value by allowing for better information gathering, though this is only viable if the investor has secured exclusive rights to prevent competitor entry.
- Staged investments provide a series of options where progress can be halted at every new call for financing if the project's viability becomes doubtful.
- The option to abandon is an asymmetrical right that allows a manager to exit a project permanently, similar to a shareholder's right to default in a levered company.
- Real options theory provides a framework for determining the optimal start date and the value of maintaining future ownership of land, patents, or licenses.
Thus, hanging on to it today means keeping open the option to abandon at a later date.
The Value of Real Options
- Option theory suggests that uncertainty combined with flexibility increases the overall value of an industrial project.
- Higher underlying volatility leads to greater option value, which contrasts with traditional net present value calculations.
- The time value of an option diminishes as the exercise date approaches because information accumulation reduces environmental uncertainty.
- Uncertainty is eventually replaced by intrinsic value as discounted cash flows are adjusted based on emerging market realities.
- Strategic choices such as deferring, expanding, or abandoning a project allow firms to manage risk dynamically over time.
It tells us that the higher the underlying volatility, and thus the risk, the greater the value of an option.
The Value of Real Options
- Traditional Net Present Value (NPV) analysis can lead to incorrect investment decisions by assuming projects must be launched immediately.
- The 'real option' approach allows a company to postpone investment to gain critical market information, such as which technical standard will prevail.
- Postponing a project may sacrifice immediate revenue but provides the valuable flexibility to abandon the project if conditions are unfavorable.
- By treating a license as a call option, a project that appears to destroy value under NPV can actually represent a significant gain.
- The binomial method is used to quantify the value of this flexibility, factoring in risk-free rates and potential future outcomes.
- Ignoring real options in competitive bidding or strategic planning can lead to massive undervaluation of assets and missed opportunities.
According to the NPV criteria, the project destroys £3m in value and the company should reject the licensing offer. This would be a serious mistake!
Real Options and Expanded NPV
- Real options analysis utilizes sophisticated binomial models and replicating portfolios to value investment flexibility.
- The Expanded Net Present Value (ENPV) combines traditional passive NPV with the value of real options to assess complex projects.
- Quantifying real options is most critical when the initial NPV is negative, as flexibility can potentially turn a project viable.
- Interdependency between options, such as abandonment versus reduction, means their values cannot simply be summed together.
- Despite its theoretical appeal, the methodology faces practical hurdles including complex mathematical communication and difficulty in estimating volatility.
The traditional net present value approach assumes that there is only one possible outcome.
Risk and Investment Analysis
- Traditional risk analysis methods like breakeven and sensitivity analysis assume investment decisions are irreversible and lack flexibility.
- Real options provide a framework for valuing project flexibility, allowing managers to adjust course based on new information.
- The three prerequisites for real options are project uncertainty, the arrival of new information over time, and the ability to make significant changes.
- While powerful, real options can be misused to justify inflated valuations, such as during the 2000 Internet bubble.
- Practitioner usage of these tools is inversely correlated to their complexity, with scenarios used frequently and real options used very rarely.
In turn, these can be used to justify the unjustifiable, e.g. stock prices during the Internet bubble in 2000 or 3G licences in 2001.
Real Options and Expanded NPV
- Expanded net present value is calculated by adding the value of real options to the traditional net present value of a project.
- The inherent uncertainty in industrial projects creates value through flexibility, though this uncertainty diminishes over time as it is replaced by intrinsic value from discounted flows.
- Real options theory provides a framework for valuing investment flexibility that traditional NPV, scenario construction, and Monte Carlo methods may fail to capture fully.
- The practical application of real options is particularly attractive to operations managers because it accounts for the value of managerial adaptability.
- Investment risk can be mitigated through structured arrangements, such as partial capital guarantees or buy-back clauses in the event of project failure.
The uncertainty inherent in the flexibility of an industrial project creates value, but this uncertainty declines as time goes by.
Real Options and Risk Analysis
- The text explores the application of real options to investment decisions, emphasizing management's margin for maneuver in uncertain environments.
- Real options are presented as tools that highlight flexibility and the ability to adapt to new market conditions or competitive landscapes.
- Strategic land acquisition is cited as a real option that provides gains even if a primary bid fails, by creating leverage in negotiations with competitors.
- Financial modeling of these options involves calculating Internal Rate of Return (IRR) and evaluating project volatility to price 'put' options that limit potential losses.
- The section concludes with an extensive bibliography of academic and practical resources for Monte Carlo simulations and stochastic forecasting.
The whole problem lies in the valuation of this option (the volatility of the value of the project must be evaluated).
Core Valuation Techniques
- Valuation is not merely a mathematical exercise but requires deep accounting skills and a thorough understanding of a firm's business model.
- The direct method values equity capital directly, while the indirect method calculates enterprise value first and then subtracts net debt.
- The fundamental approach focuses on intrinsic value by discounting future streams of dividends or free cash flows to their present value.
- The pragmatic approach relies on market efficiency, using peer comparisons and multiples to infer value by analogy with similar assets.
- While options theory was once popular for valuing 'new economy' stocks, it has largely fallen out of favor in practical equity valuation.
- The ultimate goal of valuation is to understand why market values and discounted present values differ and to predict their eventual convergence.
Nevertheless, we want to stress that valuation is not a simple use of mathematical formula, it requires the valuator to have good accounting and tax skills.
Fundamental Enterprise Valuation
- Enterprise value is determined by calculating the present value of future after-tax cash flows discounted at the weighted average cost of capital.
- The valuation process involves an explicit forecast period followed by a terminal value calculation for the years beyond.
- Free cash flow is derived by adjusting EBITDA for normalized taxes, changes in working capital, and capital expenditures.
- Valuation is inherently subjective and influenced by whether the party is a buyer or a seller, making DCF analysis a vital negotiation tool.
- Forecast horizons must balance visibility and relevance, typically ranging from a few years for tech firms to decades for utilities.
It is all right for a business plan to be optimistic – our bet is that you have never seen a pessimistic one – the important thing is how it stands up to scrutiny.
Indesit Financial Projections and Valuation
- The text examines financial projections for Indesit produced by Kepler Chevreux, forecasting a slow recovery of operating margins to pre-crisis levels.
- Return on Capital Employed (ROCE) is projected to reach 12.6% by 2018, a target the author notes as potentially aggressive compared to historical performance.
- A discounted cash flow analysis using a weighted average cost of capital (WACC) of 8.7% yields a present value of €359m for the explicit forecast period.
- The text details the technical challenges of calculating terminal value, which represents the company's worth once specific business projections lose their meaning.
- The Gordon–Shapiro formula is introduced as the standard method for determining terminal value based on normalized cash flow and perpetual growth.
- The author cautions that normalized free cash flow must remain consistent with long-term investment strategies and working capital growth rather than just the final year's performance.
Concerning the growth rate to perpetuity, do not get carried away:
Calculating Terminal Value and Growth
- Perpetual growth rates must be grounded in reality and cannot significantly exceed the long-term growth rate of the overall economy.
- Projecting a growth rate higher than the sum of inflation and GDP growth implies a company will eventually dominate the entire global economy.
- Terminal value can be calculated using a growth rate to perpetuity or an exit multiple, though the latter is discouraged for mixing intrinsic and comparative values.
- A terminal value exceeding book value assumes a company can maintain a return on capital employed (ROCE) above its cost of capital indefinitely.
- In specific sectors like mining, terminal value is often equated to book or liquidation value, assuming economic profit drops to zero after the forecast period.
For example, if the anticipated long-term inflation rate is 2% and real GDP growth is expected to be 2%, then if you choose a growth rate g that is greater than 4%, you are implying that the company will not only outperform all of its rivals but also will eventually take control of the economy of the entire country or indeed of the entire world (trees do not grow to the sky)!
Terminal Value and Cash Flow Fade
- Economic profit is rarely sustainable indefinitely as return on capital employed (ROCE) tends to converge toward the weighted average cost of capital (WACC).
- The 'cash flow fade' methodology models the gradual decline of a company's margins or asset turnover until ROCE equals the cost of capital.
- At the conclusion of the fade period, a company's enterprise value is theoretically equal to the book value of its capital employed.
- While strategic strength might suggest a permanent premium over the cost of capital, economic theory generally rejects the idea of perpetual excess returns.
- The model is also applicable to value-destroying companies, though users must first determine if the firm will survive long enough to undergo restructuring.
- Accurate valuation requires subtracting net debt from the calculated enterprise value to determine the final equity value for shareholders.
Our experience tells us that no economic profit can be sustained forever.
Calculating Net Debt Value
- Net debt is theoretically the present value of future cash outflows, including interest and principal, discounted at the market cost of borrowing.
- While book value is a common approximation, market value should be used when interest rates have shifted or the company's solvency has changed significantly.
- Seasonal business cycles and 'window-dressing' can distort year-end debt figures, requiring the use of monthly averages to find true funding needs.
- Off-balance sheet items like factoring and securitization must be added back to the debt total to reflect the real level of leverage.
- Provisions for future charges like restructuring must be deducted from the company value if they are not already accounted for in the business plan's cash flows.
Some companies also perform year-end “window-dressing” in order to show a very low level of net debt.
Adjusting Enterprise Value
- Pension liabilities should generally be treated as debt, with the net present value of future outflows subtracted from enterprise value.
- Unconsolidated investments not reflected in cash flows must be added back using market value or separate valuation methods.
- Tax-loss carryforwards represent a distinct asset that should be valued by discounting future tax savings at the cost of equity.
- Minority interests must be deducted from enterprise value, ideally through separate subsidiary valuation or by applying group multiples.
- Deferred tax liabilities are typically excluded from debt equivalents because they are rarely paid out in practice.
We advise discounting savings at the cost of equity capital as they are directly linked to the earnings of the company and are as volatile (if not more so).
Discounted Cash Flow Analysis
- Equity value can be derived by subtracting the market value of dilutive instruments like warrants and options from the enterprise value.
- The DCF method provides a rational anchor during market euphoria by focusing on a company's real economic performance rather than multiples.
- Minority discounts are generally inconsistent with DCF unless the majority shareholder is actively mismanaging the company or diverting cash flows.
- The method is highly sensitive to assumptions and future predictions, which can lead to significant volatility in the resulting valuation.
- A major drawback is the heavy reliance on terminal value, which often accounts for more than half of the total company valuation.
It also makes it easier to keep your feet closer to the ground during periods of market euphoria, excessively high valuations and astronomical multiples.
Valuation Methods and Multiples
- The Dividend Discount Model (DDM) has largely fallen out of favor due to the arbitrary nature of dividend growth rate projections.
- DDM remains relevant for mature sectors with high visibility and stable payouts, such as utilities and real estate.
- Discounting free cash flow to equity is a preferred method for valuing banks because their financial structures are strictly regulated and stable.
- The peer-group comparison approach assumes market efficiency and values a company based on its profit-generating capacity relative to similar firms.
- Multiples such as P/E, EBITDA, and EBIT are influenced by macroeconomic factors including interest rates, risk, and expected growth.
- Transaction multiples reflect actual historical sale prices, whereas trading multiples are derived from the current market values of listed peers.
This method is not an easy one to carry out if there is regular change in the financial structure which prompts regular change in the cost of equity.
Market Multiples and Valuation
- Peer group selection requires matching companies not just by sector, but by operating characteristics like ROCE and growth rates.
- Multiples are categorized into two groups: those based on enterprise value (capital employed) and those based on equity value.
- Enterprise value multiples typically use NOPAT, EBIT, or EBITDA as denominators to reflect profit-generating capacity before interest.
- Equity multiples, such as the P/E ratio, focus on net income or cash flow after interest expenses have been deducted.
- When calculating multiples across different fiscal years, the current market value of capital employed remains constant as it already reflects future expectations.
- Accurate EBIT multiples often require restating operating income to exclude non-recurring items and normalize profitability.
Note that we use the same value of capital employed in all three cases, as current market values should reflect anticipated changes in future operating results.
Valuation Multiples and Their Pitfalls
- The EBIT multiple is used to value enterprise and equity value by applying industry averages to a company's operating income.
- EBITDA multiples are popular in capital-intensive industries because they neutralize differences in depreciation methods across companies.
- A significant risk of EBITDA multiples is the potential to overvalue low-margin companies that may actually have zero or negative EBIT.
- Industry-specific multiples like page views or turnover are often used for non-profitable firms but can lead to inflated valuations, as seen during the Internet bubble.
- Equity-based multiples, such as the P/E ratio, focus on net profit but can be distorted by a company's specific financial structure and debt levels.
But if the cost structure of Group B remains the same in the future, its EBIT will never be positive; if that is the case, why should an investor pay a single cent for such a company?
Pitfalls of P/E Multiples
- Applying a Price/Earnings (P/E) ratio directly to companies with different debt levels leads to significant valuation errors.
- The P/E ratio is flawed for cross-company comparison because it fails to account for the specific cost and volume of a firm's debt.
- Financial analysts prefer multiples of EBIT or EBITDA to remove the bias introduced by varying capital structures.
- Enterprise value should be calculated using NOPAT multiples before subtracting debt to find the true value of equity.
- Transaction multiples differ from market multiples by including a 'control premium,' typically around 25%, reflecting anticipated synergies.
- While transaction multiples offer a 'majority value,' they are often difficult to apply due to a lack of public data on private deals.
Although it looks logical, this reasoning is flawed. Applying a P/E ratio of 25 to Valeria’s net income is tantamount to applying a P/E of 25 to Valeria’s NOPAT less a P/E of 25 applied to its after-tax interest expense.
Advanced Valuation and SOTP Methods
- Relying on simple means or medians for valuation multiples is discouraged as it masks significant disparities and extreme outliers within a sample.
- Analysts should use linear regressions to link multiples to specific drivers like growth or margins, allowing for more precise positioning within a peer group.
- The R-squared value serves as a critical guide for determining which financial criteria are most relevant to a specific industry's valuation.
- The Sum-of-the-Parts (SOTP) method is essential for valuing conglomerates where consolidated accounts provide an overly generalized view of the business.
- SOTP involves revaluing individual assets and liabilities to their market reality rather than relying on historical book values.
- When valuing diversified groups, central costs and parent company debt must be deducted from the aggregate value of the individual subsidiaries.
Try to understand why the differences exist in the first place rather than to bury them in a mean or median value that has little real significance.
Sum-of-the-Parts Valuation Methods
- The sum-of-the-parts method requires valuing each individual asset and liability using consistent estimates across different methodologies.
- Valuation types range from market value and value in use to liquidation value, which represents a fire-sale price minus a discount.
- This approach is most effective when assets have independent market values, such as real estate or aircraft, rather than specialized industrial equipment.
- When valuing tangible assets, it is more practical to value functional groups of assets that can operate on a standalone basis rather than decomposing them into tiny units.
- Inventory valuation typically follows book value unless items are obsolete, though companies with long production cycles may see significant revaluation gains.
It makes no sense to value the land on which a warehouse has been built; it makes more sense to value the combination of the land and the buildings on it.
Valuing Intangible Assets and Taxes
- The revaluation of inventories like spirits and champagne impacts future income taxes by decreasing future profits.
- Intangible assets such as brand names and lease rights are now considered essential components of a company's total value.
- There are three primary methods for valuing brands: replacement cost, royalty payment discounting, and the 'excess profit' utility method.
- The 'excess profit' method is intellectually appealing but difficult to apply due to the lack of generic control products for benchmarking.
- Tax implications of a sum-of-the-parts valuation vary significantly depending on whether the acquirer intends to liquidate the company or maintain it as a going concern.
- Buying shares instead of assets prevents asset revaluation, leading to lower depreciation expenses and higher tax burdens for the acquirer.
We will not hide the fact that this approach, while intellectually appealing, is very difficult to apply in practice, because often there is no generic “control” product to use as a benchmark.
Deceptive Asset Valuations
- Sum-of-the-parts values are often mistakenly viewed as safe, but they can actually indicate high speculation regarding resale prices.
- A high net asset value relative to cash flow implies that a company's worth is heavily weighted toward its terminal value rather than immediate returns.
- Asset-based valuation is most appropriate for small companies or those with liquid assets like aircraft or cinemas.
- Discrepancies between valuation methods should be analyzed for underlying causes rather than simply averaged together.
- When sum-of-the-parts value exceeds DCF value, it suggests a company is valued more for its past than its future, signaling a need for divestment.
In fact, when we say that a company has a high net asset value, it means that from a free cash flow point of view, the company’s terminal value is high compared with the value of intermediate cash flows.
Valuation Methods and Strategic Arbitrage
- Asset stripping and piecemeal sales in the 1980s and late 2000s demonstrated that a company's individual parts can sometimes be worth more than the whole.
- The 'super-profit' method calculates goodwill by discounting the difference between actual operating profit and normative operating profit based on capital costs.
- Discrepancies between peer-comparison values and DCF values signal whether a company should pursue an IPO or remain private.
- Higher transaction multiples compared to market multiples suggest a trade sale via competitive bidding is the most lucrative exit strategy.
- Sellers typically favor DCF models due to optimistic business plans, while buyers use peer comparisons to negotiate lower entry prices.
A seller usually favours the DCF method as it is based upon a business plan which is rarely built on pessimistic assumptions!
The Lifecycle Theory of Value
- A company's net asset value and cash flow value diverge and converge predictably throughout its lifecycle from founding to decline.
- During the growth phase, cash flow value typically exceeds net asset value as the market anticipates future profitability and intangible expertise.
- At maturity, these two values tend to align as profit trends normalize and payout ratios increase.
- In the decline phase, cash flow value drops below net asset value, signaling that the company's assets are no longer generating sufficient returns.
- Valuation is inherently speculative and involves extrapolating past results into an uncertain future, making ranges more useful than precise figures.
- The ultimate goal of valuation is not mathematical precision but providing a basis for negotiation to arrive at an agreed price.
Precision is the domain of negotiation, the goal of which is to arrive at an agreed price.
Corporate Control and Strategic Premiums
- The market for corporate control is an extension of the broader financial market, sharing the same valuation principles and price correlations.
- Modern financial regulations have established the 'sacrosanct principle' of equality, ensuring minority shareholders receive the same premiums as majority owners.
- Entrepreneurs often resist this equality, viewing minority shareholders as passive beneficiaries of the founder's personal energy and risk.
- A control premium is only justifiable in an efficient market if the new owner can extract more value than the previous one through synergies or improved management.
- Strategic value—derived from economies of scale, tax benefits, or pooled resources—is the true driver behind the 20% to 30% premiums paid during acquisitions.
It is difficult to convince entrepreneurs that the roles of management and shareholders can be separated and that they must be compensated differently – and especially that the risk assumed by all types of shareholders must be rewarded.
Strategic Value and Control Premiums
- Strategic value represents the maximum price a trade buyer will pay, combining standalone value with potential synergies and operational improvements.
- Trade buyers often outbid financial buyers because they can extract unique synergies that a standalone investment fund cannot.
- The difference in valuation between buyers stems from differing cash flow projections rather than the discount rate, which remains constant for the asset.
- Overestimating strategic value or overpaying for geographic presence can lead to 'rude awakenings' if synergies fail to materialize or are already priced in.
- The concept of a 'minority discount' is often unjustified as minority shareholders have a proportional claim on cash flows, though they may lack liquidity.
- Majority shareholders often pay a premium to buy out minorities to gain the total control necessary to fully implement strategic synergies.
But some industrial groups go overboard, buying companies at twice their standalone value on the pretext that their strategic value is high or that establishing a presence in such-and-such geographic location is crucial.
Liquidity and Minority Discounts
- Minority stake discounts often stem from a lack of liquidity rather than the size of the stake itself.
- Illiquidity increases share price volatility, leading investors to apply higher discount rates to compensate for risk.
- Liquidity discounts can exceed 50% in cases where exit options are restricted, yet may vanish if a small stake shifts the balance of power.
- Listed companies with small free floats can enter a 'vicious circle' where low liquidity leads to a lack of analyst coverage and further undervaluation.
- The Discounted Cash Flow (DCF) method values a firm by discounting future free cash flows at the weighted average cost of capital (WACC).
- Enterprise value is determined by the sum of discounted cash flows during a forecast period and a terminal value calculated to perpetuity.
Some listed firms can suffer from an undervaluation due to reduced liquidity of the share, so analysts do not publish research and it then becomes a vicious circle.
Comparative and Asset Valuation
- The peer group method estimates enterprise value using EBIT or EBITDA multiples from comparable market or transaction data.
- Sum-of-the-parts valuation aggregates individual assets and subsidiaries while accounting for complex tax implications and intangible assets.
- Discrepancies between different valuation methods provide critical insights for financial engineering and corporate decision-making.
- Strategic value typically exceeds standalone financial value due to industrial synergies, which become the primary focus of price negotiations.
- Control value is redefined as the strategic value derived specifically from synergies within the broader capital market.
The essence of negotiation lies in determining how the strategic value pie will be divided between the buyer and the seller, with both parties trying, unsurprisingly, to obtain the largest possible share.
Corporate Valuation Exercises
- The text presents a series of conceptual questions regarding the valuation of diverse entities, ranging from wine estates to companies in decline.
- It explores the nuances of Discounted Cash Flow (DCF) analysis, including the impact of working capital changes and the validity of control premiums.
- Practical exercises require calculating equity value using net profit forecasts, discount rates, and terminal value multiples.
- The material contrasts different valuation methodologies, such as peer-comparable multiples (EV/EBITDA and P/E) versus cash flow based models.
- Specific case studies involve complex financial scenarios, such as high-tech recapitalization and the valuation of conglomerates with significant minority holdings.
Why can we say that the mean or the median figure is the choice of an indecisive person?
Valuation Techniques and Market Realities
- Minority shareholders in private companies face significant liquidity discounts because their stakes are difficult to sell compared to publicly traded stocks.
- Information asymmetry often forces buyers to pay less for an asset, though strategic goals like market entry can justify higher premiums.
- The volatility of a company's value is highlighted by the fact that a one-third drop in profits can lead to a disproportionate 80% reduction in total value.
- Valuation methods like DCF and sum-of-the-parts are essential, but terminal value calculations must respect the rule that returns on capital cannot exceed the cost of capital indefinitely.
- Synergy gains and improved management efficiency are primary drivers for value creation in mergers, acquisitions, and leveraged buyouts.
- The timing of a sale is critical, as the most advantageous period to sell a company is during a stock market peak.
Trees do not grow until they reach the sky – ROCE cannot be higher than WACC forever.
Capital Structure and Market Theory
- The text introduces the fundamental debate regarding whether an optimal capital structure exists to maximize enterprise value.
- It distinguishes between accounting-based leverage effects and the financial reality of capital costs.
- The author suggests a provocative conclusion that the leverage effect may be 'useless' within the framework of financial theory.
- Weighted Average Cost of Capital (WACC) is defined as the minimum return a company must generate to avoid ruin.
- The WACC formula is presented as a weighted balance of the required returns from both debt lenders and equity shareholders.
Jumping directly to the conclusion, this part of the book could be renamed “the uselessness of the leverage effect in finance”!
The Financial Value of Capital
- Finance shifts the focus from historical accounting costs to future projections of risk and return.
- Enterprise value is defined as the sum of the market value of equity and the market value of net debt.
- The model assumes infinite durations for debt and investments to simplify calculations using perpetual bond analytics.
- Accounting metrics like ROCE and ROE are replaced by forward-looking required rates of return such as WACC.
- Debt and equity are distinguished by their priority in liquidation and the independence of debt returns from company performance.
In finance, everything is about the future – return, risk and value.
Equity Risk and Capital Structure
- Equity holders bear the primary risk of a firm because they are only entitled to residual cash flows after all debt obligations are met.
- Unlike debt, equity lacks a repayment commitment and is often wiped out entirely during corporate bankruptcy or liquidation.
- Voting rights are a logical consequence of risk-bearing, ensuring those with the most to lose have the power to oversee management.
- Leverage creates a scenario where small fluctuations in total enterprise value result in significant volatility for equity value.
- Conventional wisdom suggests an optimal capital structure exists by balancing cheaper debt with the increasing risk-premium demanded by shareholders.
- In a theoretical tax-free environment, the goal of capital structure is to minimize the weighted average cost of capital to maximize firm value.
Voting rights are not a fourth difference between equity and debt and are only a logical consequence of the first three differences.
Theories of Optimal Capital Structure
- Traditional theory suggests an optimal capital structure exists where the weighted average cost of capital (WACC) is minimized through a specific balance of debt and equity.
- As debt increases, the expected return on equity rises to compensate shareholders for bankruptcy risk, eventually offsetting the benefits of cheaper debt financing.
- Beyond a certain leverage threshold, both the cost of equity and the cost of debt increase, leading to a decline in total enterprise value.
- The Modigliani-Miller (MM) theorem challenges this by arguing that in a perfect market without taxes or friction, capital structure does not affect a firm's value.
- MM's theory relies on the principle of arbitrage, suggesting that investors can replicate corporate leverage themselves, making the firm's specific debt policy irrelevant.
In a perfect market, they have no reason to pay companies to do something they can handle themselves at no cost.
The Modigliani-Miller Arbitrage Principle
- The enterprise value of a company remains independent of its financing policy in a perfect capital market.
- Shareholders in a levered firm face higher equity costs because they bear both operating risk and capital structure risk.
- Investors can replicate a firm's leverage through personal borrowing to achieve higher returns at the same risk level, a process known as arbitrage.
- Market arbitrage forces the values of identical firms with different capital structures to align as investors sell overvalued shares to buy undervalued ones.
- As leverage increases, the cost of equity rises to counterbalance the cheaper cost of debt, maintaining a constant weighted average cost of capital.
- Even when accounting for bankruptcy risk, the theory holds because debtholders begin to share the risk, slowing the rate of increase for equity costs.
This arbitrage will cease as soon as the enterprise values of the two companies come into line again.
Capital Structure and Value
- The total value of an asset remains constant regardless of whether it is financed through debt, equity, or a combination of both.
- Modigliani and Miller's 1958 theory posits that in a tax-free universe, there is no such thing as an optimal capital structure that enhances asset value.
- The weighted average cost of capital (WACC) is determined by the nature of the company's assets rather than its specific method of financing.
- While leverage increases expected returns for shareholders, it also increases risk, meaning value cannot be created simply by changing the financial structure.
- In a theoretical perfect market, any perceived advantages of a specific capital structure would be neutralized by arbitrage.
- The absence of taxes is a key assumption in this model, as real-world 'distortions' like tax benefits often change the calculation of optimal debt.
As Merton Miller explained when receiving the Nobel Prize for Economics, 'it is the size of the pizza that matters, not how many slices it is cut up into.'
Capital Structure and Market Theory
- The text explores the relationship between financial leverage and the weighted average cost of capital (WACC) in perfect markets.
- It challenges the assumption that increasing debt necessarily lowers the overall cost of capital by highlighting the rising cost of equity.
- Mathematical exercises demonstrate how to calculate WACC and equity costs under different debt-to-equity ratios.
- The concept of arbitrage is introduced as a mechanism that stabilizes company valuations regardless of their capital structure.
- The text provides formulas for calculating the beta of shares and debt to measure risk adjustments following capital reductions or debt increases.
Show how you can increase this amount without altering the amount of your investment or increasing the level of risk.
Capital Structure and Cost of Equity
- The cost of equity is directly influenced by the risk of capital employed and the specific risk of the capital structure.
- Shareholders' required returns increase as debt increases because equity alone bears the residual risk of the capital employed.
- The weighted average cost of capital (WACC) remains constant in a tax-free world because the benefits of 'cheap' debt are offset by the rising cost of equity.
- Arbitrage opportunities exist when companies with identical assets have different market values due to their financing structures.
- Financial risk is determined by market values and rates rather than accounting book values.
- Modigliani and Miller's seminal theories suggest that there is no such thing as 'good financing' to create value compared to good investment.
No, this would be too good to be true and all companies would have huge debts.
Capital Structure and Tradeoff Models
- The theoretical enterprise value remains constant regardless of debt levels, yet real-world financial managers must navigate complex biases to optimize financing.
- The 'tradeoff model' suggests that capital structure is primarily determined by balancing the benefits of tax shields against the potential costs of financial distress.
- Beyond taxes, capital structure is influenced by information asymmetries, agency costs, and the disciplining role that debt plays for management.
- Financing choices often serve as a mechanism to reduce conflicts of interest between shareholders, managers, and lenders.
- While corporate income tax makes debt attractive due to the deductibility of interest, over-reliance on tax optimization can lead to poor industrial outcomes.
Rather than being simply a search for value, the choice of financing is far more an endeavour to reduce conflicts of interest between shareholders and managers or share-holders and lenders.
The Debt Tax Shield
- Corporate income tax creates a significant financial incentive for companies to use debt financing over equity.
- Interest expenses are tax-deductible, allowing creditors to be paid from pre-tax income, whereas dividends are paid from post-tax profits.
- The enterprise value of a levered company is equal to its unlevered value plus the present value of the tax savings generated by debt.
- To benefit from this 'tax shield,' a company must generate sufficient operating profit to cover its interest expenses.
- There is ongoing debate regarding whether tax savings should be discounted at the cost of debt or the cost of equity to determine their present value.
- The value of the tax shield increases in proportion to the maturity of the debt and the total amount of leverage used.
Allowing interest expenses to be deducted from companies’ tax base is a kind of subsidy the state grants to companies with debt.
The Costs of Financial Distress
- Bankruptcy serves as a market mechanism to reallocate assets from inefficient firms to more profitable ventures.
- While theoretically neutral for diversified investors, bankruptcy incurs significant direct costs such as legal fees and redundancy payments.
- Indirect costs of distress include lost trade credit, reduced productivity, and the inability to fund profitable new projects.
- The trade-off model suggests firm value is maximized by balancing tax shields against the present value of bankruptcy costs.
- Excessive leverage eventually eliminates tax advantages once a company ceases to generate sufficient taxable profit.
- The optimal capital structure follows the conventional wisdom that some debt is beneficial, but too much is destructive.
One person’s loss is another person’s gain!
Taxes and Capital Structure
- The optimal debt ratio is theoretically reached when tax savings from borrowing are perfectly offset by the costs of potential financial distress and bankruptcy.
- Empirical studies suggest that the net tax advantage of debt is significantly reduced, from nearly 10% to roughly 4.3%, when personal taxation is factored into the equation.
- Miller's 1977 research argues that personal taxes paid by investors can effectively cancel out corporate tax benefits, potentially rendering capital structure irrelevant once more.
- The 'complete' tax shield formula incorporates corporate tax rates alongside personal tax rates on both interest income and equity returns to determine true value.
- Focusing exclusively on tax reduction can lead corporate managers to make suboptimal strategic decisions that ignore broader economic complexities.
Corporate managers who focus too narrowly on reducing tax charges may end up making the wrong decisions.
Personal Taxes and Debt Shields
- The primary objective of a firm shifts from minimizing corporate tax to minimizing the present value of all taxes paid by both bondholders and shareholders.
- When personal income taxes on interest are higher than those on dividends or capital gains, the traditional corporate tax advantage of debt is significantly eroded.
- Empirical data suggests that tax savings on debt only become substantial when leverage is exceptionally high, often exceeding market averages.
- In specific jurisdictions like the UK or the Netherlands, the tax burden on personal interest income can entirely offset the corporate tax savings of debt.
- Governments are increasingly implementing 'notional interest' deductions on equity or limiting interest deductibility to rebalance the tax treatment of different capital structures.
The value created by debt must thus be measured in terms of the increase in net income for investors (shareholders and creditors).
Debt as Management Control
- Non-shareholder executives naturally prefer cash accumulation over debt to avoid the operational constraints and risks associated with repayment obligations.
- Shareholders utilize debt as a disciplinary tool, forcing managers to generate liquidity and avoid wasteful spending to prevent bankruptcy and job loss.
- Leveraged companies demonstrate greater flexibility and responsiveness during crises, reacting faster to financial distress than unleveraged counterparts.
- The 'too big to fail' phenomenon represents a moral hazard where excessive debt encourages reckless expansion rather than management discipline.
- LBOs maximize this incentive structure by combining high debt levels with management equity stakes, creating a 'carrot and stick' environment for performance.
The explicit cost of debt is a simple yet highly effective means of controlling a firm’s management team.
Signalling and Debt Policy
- Mature, profitable companies with limited investment opportunities are primary candidates for Leveraged Buyouts (LBOs) to prevent value-destroying diversification.
- Debt serves as a disciplinary mechanism that forces management to prioritize enterprise value over wasteful spending of free cash flow.
- Signalling theory posits that managers use debt to communicate private, optimistic information about future cash flows to less-informed investors.
- For financial signals to be credible, there must be a significant penalty for misleading the market, such as the risk of bankruptcy or executive dismissal.
- An increase in gearing acts as a public declaration of confidence in the firm's ability to meet higher financial obligations even in adverse conditions.
The only value created by debt is the fact that it forces managers to improve enterprise value.
Signalling and Pecking Order
- Capital structure changes serve as signals to the market because managers possess inside information about a firm's future prospects.
- Announcements of capital increases typically cause share prices to drop by 3% as investors assume managers believe the stock is currently overvalued.
- Debt issuance is viewed more favorably than equity because it implies managers are willing to risk liquidation sanctions to back their forecasts.
- The 'Pecking Order Theory' ranks internal financing as the most preferred method, followed by low-risk debt, with capital increases as the last resort.
- Managerial actions, such as selling personal stakes, act as highly negative signals regarding the company's future cash flows.
- Regulatory requirements for directors to disclose shareholdings exist to mitigate the information asymmetry between insiders and the public.
They put their money where their mouths are.
The Pecking Order Theory
- Information asymmetry between managers and investors must be mitigated through active communication like road shows and prospectuses.
- The pecking order theory suggests that companies follow a specific hierarchy when choosing sources of financing.
- Managers prioritize internal financing because it requires the least effort and avoids the high intermediation costs of share issues.
- Corporate managers view different financing types with equal lack of enthusiasm as costs remain relative to their specific risks.
- Capital structure design is not arbitrary but is driven by the desire to limit external friction and transaction costs.
The pecking order is determined by the law of least effort.
Capital Structure and Market Imperfections
- Modigliani and Miller's model suggests debt is attractive because tax-deductible interest creates a valuable tax shield for corporations.
- The benefits of high debt are countered by the rising probability of bankruptcy costs and the personal tax disadvantages for individual investors.
- Information asymmetry leads managers to prefer debt over equity as a signal of confidence and to avoid issuing undervalued shares.
- The pecking order theory posits that firms prioritize internal cash flow, then debt, and only use equity as a last resort to minimize costs.
- Agency theory views debt as a disciplinary tool that forces managers to focus on efficiency and prevents wasteful spending on risky projects.
- Leveraged Buyouts (LBOs) create value by motivating managers through the intense pressure of debt repayment and lucrative profit-sharing incentives.
LBOs create value, not on the basis of the accounting illusion of the leverage effect, but thanks to the high motivation of managers who are under pressure to repay debts.
Capital Structure and Debt
- The text presents a series of theoretical questions regarding why managers are often wary of debt despite potential tax advantages.
- It explores the practical application of Modigliani and Miller's 1963 theory versus observed market behaviors like the pecking order theory.
- The exercises challenge the stability of optimal debt-to-equity ratios and how they should be calculated using book versus market values.
- Signal theory is introduced as a framework for understanding how debt levels can communicate a company's perceived value to the market.
- Quantitative problems require calculating the weighted average cost of capital (WACC) and enterprise value under varying tax rates and leverage scenarios.
- The section questions whether capital structure theories can ever achieve the mathematical certainty of option pricing models like put/call parity.
In your view, can the theories of capital structure described in this chapter be proven with as much certainty as, say, the put/call parity described in Chapter 23 that deals with options?
Capital Structure and Tax Theories
- The primary advantage of debt in capital structure is the present value of tax savings generated by tax-deductible financial expenses.
- Bankruptcy is fundamentally caused by inadequate profits relative to risk, rather than simply carrying excessive debt levels.
- The trade-off theory suggests enterprise value is the sum of unlevered value and tax savings minus the present value of bankruptcy costs.
- Managers may resist high debt levels to protect their job security, as increased financial risk correlates with a higher likelihood of job loss.
- Market value is preferred over book value for assessing debt capacity because it reflects the company's actual ability to meet repayments.
- Optimal capital structure is dynamic and non-mathematical, shifting with changes in interest rates, tax laws, and market volatility.
A company goes bankrupt because its present and expected profits are inadequate compared with its risk, and not because it is carrying too much debt.
Capital Structure and Taxation
- The text provides a comprehensive bibliography of foundational and modern research on the Modigliani-Miller propositions and capital structure.
- A comparative exercise illustrates how different national tax regimes, such as those in the Netherlands and Tunisia, create varying incentives for debt versus equity.
- Quantitative problems demonstrate the calculation of firm value adjustments based on interest expenses, tax shields, and cost of capital.
- The literature review covers the evolution of financial theory from corporate tax corrections to the personal tax advantages of equity.
- Specific focus is given to the 'disciplining role of debt' and its impact on agency costs, financial distress, and stakeholder theory.
In The Netherlands, debt receives more favourable tax treatment, while in Tunisia, equity enjoys better tax breaks.
Foundations of Capital Structure
- The text provides a comprehensive bibliography of seminal academic works focusing on corporate ownership and management buyouts.
- It highlights key literature regarding financial asymmetries and the 'pecking order theory' of corporate finance.
- A significant portion of the references explores the application of signaling theory to how firms determine their capital structure.
- The bibliography addresses the tangible and indirect costs of financial distress, including empirical evidence from the automotive industry.
- It catalogs essential research on agency theory, specifically examining the conflicts between managerial behavior and ownership structure.
- The section serves as a bridge between Chapter 33's organizational theories and Chapter 34's focus on debt, equity, and options.
Corporate financing and investment decisions when firms have information investors do not have
Shareholders Versus Creditors
- The primary distinction between debt and equity lies in the probability distribution of their expected returns.
- Shareholders face a return range from zero to infinity, while creditors are capped at the contracted rate of return.
- Limited liability is the defining innovation of the 19th-century corporation, protecting shareholders from losses exceeding their investment.
- In default scenarios, shareholders can effectively 'hand over' the company and its liabilities to the lenders.
- Corporate structure can be analyzed through the lens of options theory by viewing equity and debt as distinct financial instruments.
- The relationship between these two groups is defined by the legal restriction of shareholder liability in modern capitalism.
When a company defaults, shareholders hold a “trump card” that allows them to hand the company, including its liabilities, over to the lenders.
Equity as a Call Option
- Shareholders in a levered company effectively hold a call option on the firm's assets with an exercise price equal to the debt amount.
- If the enterprise value exceeds the debt at maturity, shareholders exercise their option by repaying lenders and keeping the residual value.
- If the enterprise value is lower than the debt, shareholders invoke limited liability and abandon the option, leaving the company to the lenders.
- Lenders are viewed as having sold a put option to shareholders, assuming the risk of becoming 'unwilling owners' if the firm defaults.
- The value of this put option represents the credit risk premium, which is the difference between the risk-free rate and the actual cost of debt.
- This framework defines the value of equity as the value of a European call option on the capital employed.
In other words, they have “bought” the company in exchange for the outstanding amount of debt.
Debt, Equity and Options Theory
- Corporate debt can be viewed as a risk-free loan combined with a short put option sold by the lender to the shareholders.
- The credit risk premium represents the price of a put option on the company's capital employed.
- Shareholders exercise their put option to discharge debt by transferring ownership of assets to creditors if the asset value falls below the debt level.
- Equity is functionally equivalent to a call option on the company's capital employed with a strike price equal to the debt's face value.
- The relationship between equity, debt, and enterprise value aligns with the fundamental put-call parity of financial options.
- Enterprise value is mathematically defined as the value of the call option plus the risk-free value of debt minus the value of the put option.
The lender sells the shareholders a put option at an exercise price that is equal to the debt to be repaid.
Equity as a Call Option
- Equity can be modeled as a call option on a firm's capital employed, where the debt repayment amount serves as the exercise price.
- The value of equity consists of intrinsic value and time value, the latter representing the hope that enterprise value will exceed debt by maturity.
- In cases of financial distress where enterprise value is lower than debt, equity may have zero intrinsic value but retains positive time value.
- Higher volatility in a company's industrial or economic risk actually increases the time value of its equity from an options perspective.
- The options method is particularly relevant for valuing high-risk projects like the Channel Tunnel or biotech start-ups where traditional valuation fails.
- As enterprise value increases far beyond debt levels, the risk of default vanishes and the cost of debt approaches the risk-free rate.
The present value of equity (8) can only be explained by the time value, which represents the hope that, when the debt matures two years hence, enterprise value will have risen enough to exceed the amount of debt to be repaid.
Equity as a Call Option
- The options method is particularly useful for valuing companies with high debt levels or significant operational risk.
- Equity value can be decomposed into intrinsic value and time value, where time value represents the potential for future asset appreciation.
- Debt value is calculated as the risk-free value of the debt minus the value of a put option on the company's assets.
- Rescheduling debt to longer maturities increases the time value of equity, which is a critical strategy for companies in financial distress.
- As a company's risk profile increases, the time value of equity and the value of the put option (risk premium) account for a larger portion of the total value.
This is why it is so important for companies in distress to reschedule debt payments, preferably at very long maturities.
Options Theory and Capital Structure
- Options theory provides a framework for understanding how corporate financial decisions create value transfers between shareholders and creditors.
- Equity in a levered firm can be modeled as a call option on the company's assets, where the exercise price is the face value of the debt.
- Increasing a company's debt to fund shareholder dividends can significantly increase equity value while simultaneously devaluing existing bonds.
- Creditors suffer losses when capital structure changes occur that they did not anticipate or protect against through covenants.
- The implicit yield on debt rises as leverage increases, reflecting the higher risk profile of the capital employed relative to the debt obligations.
- Financial decisions in equilibrium assume assets are traded at fair value, yet structural shifts can still result in a zero-sum transfer of wealth.
The existing creditors have lost out because they were not able to anticipate the change in corporate structure and have been harmed by the dividend distribution.
Options Theory and Debt Dynamics
- Options theory explains why equity value remains positive even when debt levels appear to exceed total asset value on an accounting basis.
- Increasing corporate debt can result in a direct transfer of value from existing creditors to shareholders by increasing the risk profile of the debt.
- Exchanging low-risk assets for high-volatility assets redistributes wealth to shareholders because their equity acts as a call option on the company's assets.
- Extending the maturity of debt increases the time value of the equity 'option,' effectively costing creditors even if the nominal debt amount remains unchanged.
- These value transfers are often predicated on creditors underestimating the strategic power shareholders wield over investment and capital decisions.
The old debt, which has become less risky, has, in fact, “confiscated” some of the value to the benefit of creditors and the detriment of shareholders.
Managing Shareholder and Creditor Conflicts
- Option pricing models like Black-Scholes are used by firms like KMV to assess default risk and satisfy Basel III banking requirements.
- Hedge funds utilize capital structure arbitrage and credit default swaps to exploit price discrepancies between a firm's debt and equity.
- Hybrid financial securities like convertible bonds serve as a mechanism to neutralize the call options shareholders hold over creditors.
- Restrictive covenants act as a deterrent, forcing immediate debt repayment if violated to prevent shareholders from taking excessive risks.
- Liquidity risk arises because the duration of a firm's free cash flows is typically much longer than the maturity of its debt obligations.
Covenants act like an atomic bomb that aim at convincing shareholders not to spoil lenders.
The Asset Liability Refinancing Gap
- Firms face significant interest rate and liquidity risks when refinancing debt, particularly during major market crises.
- The Asset Liability Refinancing Gap (ALRG) arises when the duration of a firm's free cash flows exceeds the duration of its debt.
- In stable economic conditions, the ALRG has negligible value, but it becomes a massive liability during liquidity crises for firms with imminent deadlines.
- The value of equity is calculated by subtracting both net debt and the ALRG from the total value of capital employed.
- Successful refinancing or share issues can paradoxically increase share prices by eliminating the high cost of the ALRG, even if the debt itself is discounted.
And the phenomenon can pick up speed if the current lenders try and hedge their risks by selling short the firm’s shares, hoping to gain on this short-selling what they will lose as a result of the decline in the value of their debt.
Equity as a Call Option
- Applying option theory to corporate finance reveals that equity acts as a call option on a company's operating assets with the debt value as the strike price.
- The 'expropriation effect' occurs when value is transferred from creditors to shareholders through increased risk, debt rescheduling, or asset substitution without cash flow changes.
- Leveraging a company to distribute dividends or invest increases creditor risk, often causing share value to diminish less than the actual payout.
- Unlike the simple book leverage effect, the relationship between shareholders and lenders is defined by diverging interests and risk profiles.
- If operating assets exceed debt value at maturity, shareholders exercise their option; if not, they default and creditors seize the assets.
- Financial decisions must be assessed not just in terms of return, but through the lens of risk transfers between different stakeholders.
This is called the expropriation effect, where some of the value of the claims is confiscated without any exchange of flows.
Debt Equity and Options Theory
- Lending to a company can be modeled as investing in assets at no risk while selling a put option to shareholders.
- Equity value is divisible into intrinsic value and time value, where time value represents the hope that enterprise value will exceed debt at maturity.
- High-risk projects can transfer value from creditors to shareholders even if the project's net present value is zero.
- Dividend payouts financed by asset sales increase creditor risk and simultaneously boost shareholder equity value.
- Financial decisions must be evaluated not just for overall value creation but for how they redistribute value between stakeholders.
Time value is the hope that when the debt matures, enterprise value will have risen to exceed the amount of the debt to be repaid.
Debt, Equity and Options Theory
- The text presents financial exercises that apply option pricing theory to corporate capital structures, treating equity as a call option on a firm's assets.
- Case studies explore how changes in enterprise value and volatility impact the valuation of debt and equity for both stable and high-risk companies.
- The exercises highlight the potential conflict of interest between shareholders and creditors during capital increases or dividend payouts.
- A paradox is examined where a capital increase might create value for the firm but not necessarily serve the immediate interests of existing shareholders.
- The answers section clarifies that equity in distressed firms is primarily composed of 'time value,' representing the hope that asset values will rise before debt maturity.
Can you give an example of a kind of company where shareholders’ equity is made up of pure time value?
Options Theory in Capital Structure
- Equity is modeled as a call option on a firm's assets, where the strike price represents the face value of the debt.
- Capital increases can paradoxically destroy shareholder value by transferring wealth to creditors through reduced default risk.
- Corporate actions like capital reductions or dividend payouts can shift value from creditors to shareholders without creating net firm value.
- The volatility of underlying assets directly impacts the valuation of shares and the risk profile of corporate debt.
- The Black-Scholes and Merton models provide the foundational framework for analyzing corporate liabilities as contingent claims.
The capital increase creates value for the creditors (2.1 for A and 10.1 for B), but destroys the same amount of shareholder value.
Investment Priority and Capital Structure
- The primary driver of value creation is the selection of profitable investments rather than the specific design of a capital structure.
- Financial markets are highly liquid and efficient, meaning arbitrage quickly eliminates opportunities to create value through security pricing.
- Industrial markets are 'viscous' due to regulatory and technological barriers, making competitive arbitrage slower and more difficult than in finance.
- A company with profitable assets can always resolve financing issues by restructuring its liabilities or finding new funding sources.
- No amount of clever financing or favorable terms can compensate for a fundamentally poor investment decision.
- The speed at which a failing company's position deteriorates is directly linked to the size and nature of its debt obligations.
Good financing can never make up for a bad investment.
True Cost of Financing
- The required rate of return is determined solely by the risk profile of the investment, regardless of the investor's nationality or the financing method used.
- Financial theory suggests it is impossible to link specific financing to an investment to lower costs, as only systematic risk is rewarded by the market.
- Managers often mistakenly conflate accounting costs, such as low dividend yields or coupon rates, with the true financial cost of capital.
- Internal financing and hybrid securities are frequently mispriced by observers because their apparent cash flow cost is zero or deceptively low.
- While debt has a visible accounting cost, its true impact lies in its potential to either accelerate growth or force a company into insolvency during downturns.
- A financing source is only a 'bargain' if it brings in more than its market value, such as an undervalued option embedded in a convertible bond.
Debt can plunge the company into the ditch if its runs into difficulties; on the other hand, it can turn out to be a turbo-charger that enables the company to take off at high speed if it is successful.
Evolution of Capital Structure
- The cost of equity is counter-intuitively linked to company performance, appearing high when a firm is successful and nearly nil during financial distress.
- There is no universal optimal capital structure; instead, it is a firm-specific policy that must evolve over time.
- Historical shifts in capital structure trends are often driven by macroeconomic factors like interest rates and market volatility.
- The late 1990s saw a return to debt-heavy financing due to record-low nominal interest rates, contrasting with the debt-averse early 1990s.
- Modern corporate strategy emphasizes maintaining low gearing to preserve financial flexibility during periods of economic uncertainty.
- Data from 1994 to 2013 shows a long-term trend of companies paying down debt to build borrowing capacity for future crises.
If a company is successful, the cost of a share issue will appear to be much higher, as shareholders will receive much higher dividends than they initially expected.
Capital Structure and Economic Cycles
- Inflation and negative real interest rates often trigger a period of overinvestment and excessive corporate borrowing.
- During inflationary periods, shareholders may benefit from low financing costs even if the underlying return on investment is poor.
- Disinflationary environments typically force companies to deleverage due to high real interest rates and sluggish economic growth.
- Equity capital serves a dual purpose: financing investments and acting as a safety net or guarantee for creditors.
- High equity levels provide a 'time buffer' during crises, allowing firms to restructure and survive while leveraged competitors fail.
- While equity provides stability, it can also lead to management complacency, allowing non-performing firms to persist longer than they should.
Like insurance, equity financing always costs too much until the crisis happens, in which case one is happy to have a lot of it.
Capital Structure Decision Criteria
- Surveys of top executives reveal that credit rating preservation is a higher priority than tax savings or bankruptcy costs when choosing capital structure.
- Over half of finance directors prioritize financial flexibility to ensure they have capacity for future investment opportunities or potential crises.
- Despite theoretical criticism from academics, earnings per share (EPS) dilution remains the primary concern for practitioners considering capital increases.
- Capital structure is not determined by a single formula but by a complex compromise of market constraints, competitor behavior, and management character.
- The lifecycle of a company and its specific economic sector play significant roles in shaping its long-term financing strategy.
This criterion seems to us a bit outmoded, but we will address it nonetheless in a following section.
The Quest for Financial Flexibility
- Finance directors prioritize flexibility because current financing choices directly constrain or enable future strategic options.
- Exhausting borrowing capacity today forces a reliance on equity markets, which may be closed or prohibitively expensive during economic crises.
- Issuing equity is strategically advantageous as it preserves and even increases future borrowing capacity for unexpected opportunities.
- Maintaining financial flexibility is viewed as a real option, allowing companies to act on unforeseen investments without capital constraints.
- Effective CFOs manage flexibility by securing undrawn credit lines and maintaining active communication with diverse capital markets.
- Diversifying funding sources across bonds, loans, and securitized receivables ensures a company can pivot quickly when one market is distressed.
The desire to retain flexibility prompts the company to carry less debt than the maximum level it deems bearable, so that it will at all times be in a position to take advantage of unexpected investment opportunities.
The Power of Debt Ratings
- Financial markets are replacing banking intermediaries as the primary economic driver, elevating the influence of ratings agencies.
- CFOs are increasingly prioritizing rating targets over share price targets to maintain financial stability.
- Protecting bondholder value through high ratings serves as a defensive mechanism to prevent traumatic share price drops.
- Step-up coupons create direct financial penalties for downgrades, forcing management to monitor credit health closely.
- High credit ratings ensure financial flexibility, allowing companies to access bond markets even during volatile periods.
- Start-ups are effectively barred from debt markets due to a lack of credit history and negative cash flows, necessitating equity financing.
A downgrade is traumatic and messy and almost always leads to a fall in the share price.
The Lifecycle of Capital Structure
- Mature companies with predictable cash flows and tangible assets possess the qualities creditors crave, while equity investors often find them unappealing due to low growth.
- Industrial ventures typically begin with equity financing and transition toward debt as they become institutionalized and risk diminishes.
- Companies with high fixed operating costs, such as steel or energy, prefer equity to avoid the compounding risk of fixed interest payments during cyclical downturns.
- The specificity of an asset dictates its collateral value; highly specialized equipment is difficult to finance with debt because it lacks resale value.
- Shareholder preferences significantly influence financing, as some owners block equity issues to avoid dilution while others avoid debt to minimize personal risk.
- Research indicates that firm size is a primary driver of debt levels, with larger companies generally carrying higher proportions of debt.
In short, it has everything a creditor craves. In contrast, an equity investor will find little to be enthusiastic about: not much growth, not much risk, thus not much profitability.
Designing Capital Structure
- Market inefficiencies create fleeting opportunities for cheap financing, but relying on them is risky and can damage investor relations.
- A company's capital structure is relative to its industry, and carrying higher debt than competitors increases vulnerability during cyclical downturns.
- Business leaders generally prefer taking industrial or commercial risks over financial risks to avoid imperiling their long-term strategies.
- The choice of leverage is often subjective and influenced by a manager's personal history and risk tolerance, such as those shaped by the Great Depression.
- Financial success through high debt is statistically rare, as the 'nightmare' of financial distress often outweighs the dream of wealth multiplication.
The investor will bear in mind that, statistically, his dream of multiplying his wealth through judicious use of debt will be the nightmare of the company in financial distress.
Analyzing Debt and Liquidity
- Simulation models using spreadsheet software are preferred over mean forecasts for establishing a company's future capital structure and profitability.
- Liquidity risk is defined as the inability to meet financial obligations or secure new financing, often occurring when investor confidence evaporates during a crisis.
- Analysts use free cash flow simulations to test whether a company can repay borrowings under various debt levels and repayment terms without rescheduling.
- Debt increases a company's breakeven point because interest payments act as a fixed cost that must be covered regardless of sales volume.
- In high-debt scenarios, analysts must focus on the volatility of free cash flows and 'worst-case' scenarios to identify when a liquidity situation becomes critical.
In a truly serious financial crisis, companies can no longer obtain the financing they need, no matter how good they are.
Leverage and Earnings Per Share
- Return on equity must be analyzed by distinguishing between economic return on capital and the effects of financial leverage.
- Debt financing only increases net profit and earnings per share (EPS) if the after-tax return on investment exceeds the after-tax cost of debt.
- While debt can prevent the share dilution associated with equity financing, it introduces higher financial risk for the shareholder.
- A comparative simulation shows that debt-financed investments may yield higher EPS in the long run despite initial interest expenses.
- The acceleration of EPS growth through debt is a purely arithmetic result and does not inherently signify superior value creation.
The faster growth of EPS with debt financing is a purely arithmetic result; it does not indicate greater value creation.
Capital Structure and Financing Costs
- Financial markets are typically in equilibrium, meaning all sources of financing have the same risk-adjusted economic cost regardless of their apparent cost.
- The choice between debt and equity is not driven by cost but by macroeconomic conditions, such as inflation-adjusted interest rates and growth prospects.
- Financial flexibility is a key strategic driver, as equity financing preserves future borrowing capacity while excessive debt limits future options.
- Industry maturity dictates structure, where high-risk startups rely on equity and stable, cash-rich companies leverage debt.
- Simulations of financial leverage reveal trade-offs including accelerated earnings per share growth at the expense of degraded solvency and a higher breakeven point.
Companies in the same business sector often mimic each other (what matters is to be no more foolish than the next guy!).
Capital Structure and Financing Design
- The text explores the fundamental tension between financial cost and apparent cost in capital structure decisions.
- It challenges the notion that borrowing can create intrinsic value, contrasting it with the practical necessity of leverage for growth.
- Specific scenarios examine the unique financing constraints of start-ups, including the necessity of staged financing rounds versus a single large injection.
- The material addresses the strategic trade-off between maintaining financial flexibility and utilizing full borrowing capacity.
- Quantitative exercises compare equity and debt financing models by tracking Earnings Per Share (EPS) growth and return on equity over time.
How do you reconcile these two statements: 'You can’t make money without borrowing money' and 'Borrowing can’t create value.'
Capital Structure and Financing Logic
- The text emphasizes that creating value through financing plans is difficult because investment returns must exceed the cost of capital before financing becomes relevant.
- It challenges common financial myths, noting that borrowing does not create value for perfectly diversified portfolios and that liquidity risk is often overlooked.
- Strategic financial flexibility is prioritized, as finance directors prefer to retain 'room to manoeuvre' rather than exhausting debt capacity.
- The relationship between risk and debt is clarified: as a business becomes less risky, its capacity to be financed with debt actually increases.
- Start-ups are cautioned against debt financing due to the dangerous mismatch between certain cash outflows and uncertain cash inflows.
No, because it would be far too risky for a start-up, requiring certain outflows from uncertain inflows.
Equity Capital and Shareholder Returns
- The text provides an extensive bibliography of academic research focusing on corporate capital structure, debt maturity, and financial flexibility.
- Key research themes include the impact of credit ratings, managerial traits like overconfidence, and industry-specific effects on financial decisions.
- A transition is made from theoretical references to the practical application of equity capital policy, specifically regarding dividends and share buy-backs.
- The section emphasizes that equity capital policy is a fundamental pillar of corporate finance that requires in-depth analysis of both debt and liquidity.
- The introduction to Chapter 36 signals a shift toward the mechanics of returning cash to shareholders as a core financial strategy.
It’s all grist to the mill
Capital Allocation and Risk
- Net income must either be reinvested into the business or returned to shareholders via dividends and buy-backs.
- Funds should only be reinvested if the expected yield meets or exceeds the risk-adjusted cost of capital.
- Retaining excess cash that only earns short-term interest rates can lead to value destruction for shareholders.
- Business risk should primarily be financed through equity to avoid liquidity crises during economic downturns.
- Mature companies with stable cash flows can safely increase gearing and replace equity with debt financing.
- Dividend policy serves as a primary tool for adjusting a firm's capital structure as it reaches economic maturity.
In this context, it is very likely that shareholders will value it at less than a cent given the low return provided.
The Trap of Internal Financing
- Internal financing aligns the immediate interests of managers, creditors, and shareholders by avoiding external oversight and reducing tax burdens.
- Relying solely on internal cash flow creates an artificial internal market that risks misallocating resources into unprofitable sectors.
- A lack of external financial reckoning can lead to lower rates of return compared to the broader capital markets.
- The ideal financial principle involves distributing all earnings and requesting new funding for projects, though tax and transaction costs make this difficult.
- While internal financing appears to have a nil cost in the short term, it acts as a long-term 'time bomb' due to lack of shareholder control.
- True shareholder value is only created when equity value increases by more than the total amount of reinvested earnings.
The result is that a policy of reinvesting cash flow can prove to be a time bomb for the company.
The Cost of Retained Earnings
- Internal financing is not free; it carries an opportunity cost equivalent to the cost of equity capital.
- Retaining earnings is financially identical to paying out dividends and simultaneously raising new equity capital.
- All investments, regardless of their specific funding source, must earn at least the weighted average cost of capital to create value.
- Reinvesting in projects with returns lower than the cost of capital results in a 'market sanction' where company value increases by less than the amount invested.
- A company can appear to satisfy shareholders with steady returns while actually destroying half the value of every euro reinvested.
For each €1 the shareholders reinvested in the company, they can hope to get back only €0.50. Of what they put in, fully half was lost – a steep cost in terms of foregone earnings.
The Mechanics of Internal Financing
- Reinvesting cash flow acts as a machine transforming money into value, but it destroys wealth if the return on investment is lower than the cost of capital.
- Growth in the book value of equity through reinvestment does not guarantee a symmetrical increase in market value or shareholder wealth.
- Owner-managers often face a 'wake-up call' when they realize their business is worth less than its book value due to years of unprofitable reinvestment.
- While reinvestment was historically favored for tax advantages over dividends, shifting tax policies and shareholder activism have reduced this preference.
- Internal financing functions as a forced capital increase that reduces creditor risk, effectively transferring value from shareholders to lenders.
Beware of “cathedrals built of steel and concrete” – companies that have reinvested to an extent not warranted by their profitability!
Mechanics of Internal Financing
- Internal financing acts as a 'blank cheque' for managers, often creating significant agency conflicts with shareholders due to a lack of external oversight.
- The growth rate of a firm's equity is mathematically determined by the product of its Return on Equity (ROE) and its earnings retention ratio.
- At a constant capital structure, the growth in book equity dictates the potential growth in debt and total capital employed.
- The internal growth model links operational metrics like revenue and EBITDA growth directly to the reinvestment of earnings.
- Financial leverage can amplify the internal growth rate by adjusting the Return on Capital Employed (ROCE) based on the cost of debt.
Internal financing represents a blank cheque for managers without any control by shareholders.
Dynamics of Corporate Growth Potential
- The growth rate of a company's capital is fundamentally determined by the rate of return on capital, the cost of debt, capital structure, and the dividend payout ratio.
- In an equilibrium state, equity, debt, net profit, and earnings per share all grow at a synchronized pace known as the company's growth potential.
- Internal growth models often rely on the strong assumption that returns on reinvested organic growth match the returns on initial assets.
- If a company reinvests earnings into projects with zero return, the book equity growth slows and the return on equity (ROE) inevitably declines.
- The growth rate of earnings per share is specifically linked to the marginal rate of return on new investments rather than the average historical return.
- Earnings growth is mathematically defined as the product of the marginal rate of return on equity and the earnings retention ratio.
The rate of growth of net profit (and earnings per share) is linked to the marginal rate of return, not the average.
The Dividend Irrelevance Theory
- In a market equilibrium, shareholders are indifferent between receiving a dividend or an equivalent capital gain.
- Reinvesting earnings at the cost of equity increases the company's value by the exact amount of the retained profit.
- Dividend policy does not create lasting value; it merely adjusts the composition of a shareholder's wealth between cash and equity.
- The payment of a dividend causes an immediate and equivalent drop in the share price, as demonstrated by the Lagardère case study.
- Comparing dividends to employee salaries is a fallacy because dividends do not increase total wealth, whereas salaries do.
- Successful firms like Berkshire Hathaway prove that shareholder remuneration can be achieved entirely through capital appreciation without dividends.
Dividends do not enrich shareholders. They simply modify their wealth composition, like a transfer from the left to the right pocket.
The Signaling Power of Dividends
- Equilibrium market theory struggles to explain why dividends exist, leading to the development of signaling theory as a primary justification.
- Dividends serve as a credible communication tool because they require actual cash, making them difficult for struggling companies to fake or imitate.
- Maintaining dividend levels during temporary earnings dips signals management's confidence that growth will resume shortly.
- A reduction in dividends is not always negative; it can signal that a company has identified new, high-value investment opportunities.
- Agency theory suggests managers may prefer retaining earnings to avoid disclosure requirements or to fund low-risk, ego-driven projects.
- Research indicates that companies with excess internal cash often make less profitable investments, suggesting that 'money burns a hole in managers' pockets.'
Paying dividends is one such policy because it requires the company to have cash. A company that is struggling is not able to imitate a company that is prospering.
Dividends as Managerial Discipline
- Poor management performance leads to share price declines, exposing companies to the threat of hostile takeovers or tender offers.
- Michael Jensen’s agency theory posits that free cash flow represents the potential for managerial waste, which outside firms can capture through acquisitions.
- Generous dividend policies act as a disciplinary tool by reducing the cash reserves available for managers to invest without external oversight.
- By paying out earnings, companies become dependent on capital markets for new financing, forcing managers to justify projects to skeptical investors.
- While high dividends reduce information asymmetry, they are balanced against the high administrative costs of frequent capital increases and creditor opposition.
- Shareholder preference for dividends fluctuates over time, driven by psychological factors and the desire for tangible returns despite the theoretical neutrality of payouts.
A good example of this attitude was provided by John Rockefeller in the 1920s: “Do you know the only thing that I like? To cash in my dividends!”
Returning Cash to Shareholders
- Market reactions to dividend policies are often driven by fads, where optimism favors reinvestment and pessimism favors immediate distribution.
- Private and family-owned firms frequently use dividends to provide shareholders with liquidity for personal expenses and tax obligations without diluting ownership.
- Share buy-backs can be used strategically to modify a company's shareholder base and consolidate control for those who choose not to sell.
- Internal financing is often perceived as 'free,' but its true opportunity cost can lead to value destruction if reinvested at rates lower than the cost of capital.
- Returning cash to shareholders serves a macroeconomic function by reallocating capital from mature industries to high-growth start-ups.
- Dividend payments act as a signaling mechanism to the market, indicating stable cash flows and disciplining management against wasteful spending.
The trap for the unwitting is that internal financing has no explicit cost, whereas its true cost – which is an opportunity cost – is quite real.
Internal Financing and Equity
- The text explores the strategic implications of internal financing on a company's shareholder base and power dynamics.
- It questions the common positive perception of internal financing versus the risks of over-reliance on it.
- The relationship between reinvested earnings and the weighted average cost of capital is highlighted as a critical growth metric.
- Specific financial scenarios are examined, such as the impact of reinvestment on call option holders and family-owned businesses.
- The text addresses the market's potential sanctions for companies that fail to balance internal resources with external capital market discipline.
What is the market’s sanction for over-reliance on internal financing?
Dynamics of Dividend Policy
- Retaining earnings serves to isolate companies from capital markets and reduces risk for creditors while benefiting holders of stock options.
- Dividend payments result in a direct drop in share price equal to the payout amount, theoretically leaving shareholder wealth unchanged to prevent arbitrage.
- The decision to pay dividends is influenced by the Return on Capital Employed (ROCE) relative to the cost of capital and the company's growth stage.
- Agency theory suggests that dividend payments can reduce management flexibility and mitigate potential conflicts by returning excess cash to shareholders.
- Specific industries, such as tobacco, maintain high payout ratios due to low growth opportunities and a need to satisfy investor demand for yield.
Do you think tobacco companies have high or low payout ratios? Why? ... (but also in order to drug shareholders like they drug their customers!)
Dividend Policy and Leverage Risks
- The text provides mathematical formulas for calculating debt-to-equity ratios based on growth rates, dividend payout ratios, and cost of capital.
- A case study of Dubai illustrates the 'death spiral' effect, where high leverage used to finance fast growth leads to bankruptcy during economic crises.
- A financial model demonstrates how the leverage effect can turn negative when interest expenses begin to exceed operating earnings.
- The bibliography lists foundational empirical studies on dividend catering, where firms adjust payouts to meet investor demand.
- Signalling theory is highlighted through research exploring whether dividend changes reflect past performance or future expectations.
- Agency theory is referenced to explain dividends as a mechanism to mitigate conflicts of interest between managers and shareholders.
Dubai is a good example of a death spiral with a high leverage effect.
Dividends and Share Buy-backs
- The distribution of cash to shareholders can occur through ordinary dividends, exceptional dividends, share buy-backs, or capital reductions.
- The two primary metrics for evaluating dividend payments are the rate of growth of dividends per share and the payout ratio.
- A company's payout ratio is calculated by dividing the dividend by the net profit, with European averages sitting around 45% in 2013.
- Setting a dividend yield objective is often futile because the market, not the company, determines the share price and thus the resulting yield.
- Investors systematically re-evaluate a company's value immediately upon the public announcement of dividend amounts.
- Payout policies vary significantly across European industries, ranging from 0% in companies like Nokia and Peugeot to over 80% in firms like Deutsche Telekom.
It is the shareholder who, when evaluating the company, determines the desired yield, not the other way round.
Dividend Policy and Market Credibility
- Managers often use the payout ratio as a buffer, allowing it to rise during poor earnings years to maintain a steady dividend per share.
- A consistent dividend profile is essential for cyclical companies to signal stability and management's long-term strategic coherence.
- Frequent fluctuations in dividend payments are viewed negatively by investors and can damage a company's share price performance.
- Long-term dividend sustainability is more important than short-term smoothing; the payout must eventually align with actual earnings profiles.
- High payout ratios tend to reduce stock price volatility, causing the equity to behave more like a fixed-income bond.
The share price of a company that pays out all its earnings in dividends will behave much like the price of a bond.
Dividend Policies and Payment Methods
- The concept of duration links high payout ratios to lower share price volatility, as immediate cash returns reduce long-term risk.
- Low-dividend policies force shareholders to sell shares to realize gains, which can weaken family control in private firms.
- Interim dividends allow boards to smooth cash flows by paying fractions of the annual dividend in advance without AGM approval.
- Stock dividends allow companies to retain cash while satisfying shareholders, though they create tax liabilities without providing liquidity.
- The practice of paying dividends in shares saw a resurgence during the 2008 financial crisis as banks sought to preserve cash and meet Basel III regulations.
- Shareholders may exploit stock dividends by selling discounted shares immediately, a practice that can negatively impact the market price.
If selling the company’s shares is a “crime” – and some managers come close to regarding it as one – then a low-dividend policy is an inducement to crime.
Dividends and Share Buy-Backs
- Companies may offer preferential dividends to reward loyal shareholders who hold stock for extended periods, typically over two years.
- Special or exceptional dividends are one-time payments of high value triggered by specific events like subsidiary disposals or legal settlements.
- Share buy-backs allow listed firms to repurchase their own stock, which can then be cancelled to reduce capital or held as treasury stock.
- Treasury shares are unique in that they lose their voting rights and dividend eligibility while being held by the issuing company.
- From a financial perspective, a proportional share buy-back followed by cancellation is functionally identical to a dividend payment.
- Buy-backs are often used strategically to facilitate the exit of large minority shareholders or to manage stock option programs.
Treasury shares lose their voting right and their right to a dividend.
Mechanisms of Share Buy-backs
- Companies can reduce authorized capital by lowering share par values or initiating tender offers to shareholders.
- Dutch auctions allow shareholders to specify a selling price within a range, with the company selecting the lowest price to meet its repurchase target.
- Share buy-backs can also be executed through the issuance of put warrants, granting shareholders the right to sell shares at a fixed price.
- Capital decreases increase creditor risk, prompting legal protections that allow creditors to demand guarantees or early loan repayment.
- The financial impact of a buy-back on earnings per share (EPS) and book value depends heavily on the market price relative to the cost of debt.
If he chooses a high selling price, he will increase his proceeds provided that the shares are accepted by the company, but he reduces the probability that shares will be accepted for repurchase.
The Mechanics of Share Buy-backs
- Share repurchases impact earnings per share (EPS) based on the relationship between the earnings yield (E/P) and the after-tax cost of debt.
- Accretion occurs when the reciprocal of the P/E ratio is higher than the interest rate paid on the debt used to fund the buy-back.
- Mechanical increases in EPS do not inherently indicate value creation; true value depends on buying shares below their intrinsic worth.
- The text refutes the idea that replacing equity with debt lowers the weighted average cost of capital, citing Modigliani and Miller's theories.
- Buy-backs serve as a vital tool for reallocating capital from mature, cash-rich businesses to faster-growing sectors of the economy.
- Historical data shows that share buy-back volumes are highly cyclical, fluctuating significantly with economic conditions and market stability.
The reader who has absorbed the lessons of Modigliani and Miller and understands that cost of capital is independent from capital structure (remember “the size of a pizza is the same no matter how you slice it”?) may be indulgent.
Techniques for Distributing Excess Cash
- Ordinary dividends are rigid financial commitments that signal management's confidence in the long-term sustainability of future earnings.
- Share buy-backs and extraordinary dividends offer greater flexibility for distributing temporary cash surpluses without creating expectations of regularity.
- The choice of distribution method serves as a market signal; buy-backs often suggest management believes the stock is undervalued.
- Extraordinary dividends are considered the most neutral distribution method as they are non-recurring and benefit all investors equally.
- Cyclical companies tend to prefer share buy-backs over dividends because they do not require a long-term commitment to maintain payout levels.
- Historical data shows a significant rise in share buy-backs among large European companies until the 2008 financial crisis, followed by a sharp decline.
Any change in the dividend policy raises concerns about the future evolution of the business model and creates expectations regarding the medium-term sustainability of the new level of dividends.
Dividends vs Share Buy-backs
- Dividends do not alter shareholding structures, whereas buy-backs can increase the control percentage of remaining shareholders.
- Share buy-backs are often preferred by management because they do not typically require the downward adjustment of stock option exercise prices.
- The distribution of dividends mechanically reduces stock prices, which can negatively impact the potential capital gains for stock option holders.
- Historical data shows a sharp decline in dividend-paying US companies from 1978 to 1999, likely driven by the rise of executive stock options.
- Buy-backs may create a psychological effect, leading unsophisticated investors to believe the stock price will naturally increase.
It also leaves unsophisticated investors believing that the stock price will go up.
Dividends and Share Buy-Backs
- Taxation levels significantly influence whether shareholders prefer traditional dividends or share repurchases, with capital gains often taxed more favorably.
- Under equilibrium market theory, dividend policy is theoretically neutral as shareholder wealth remains the same whether cash is distributed or reinvested.
- Signaling theory suggests that dividend changes act as a communication tool, where increases signal future prosperity and cuts warn of potential trouble.
- Agency theory views dividends as a control mechanism that reduces the free cash flow available for managers to spend without shareholder oversight.
- The ultimate decision to distribute cash should depend on whether the company's marginal rate of return exceeds its weighted average cost of capital.
- Capital decreases and share buy-backs can be used to return funds when investment projects are scarce or to signal that a company's stock is undervalued.
A rise in the dividend signals good news; a cut signals bad news.
Mechanics of Capital Reduction
- Reducing equity capital through debt can artificially inflate earnings per share (EPS) without necessarily creating real economic value.
- Debt-financed capital decreases are sound when they reallocate funds from mature, cash-rich companies to high-growth ventures.
- Capital reductions serve as a strategic tool to prevent corporate over-investment and inefficient diversification.
- Value creation from buy-backs only occurs if shares are undervalued, debt forces operational discipline, or internal reinvestment returns are below the cost of capital.
- The text provides a series of technical questions to evaluate dividend policies, signaling theory, and the impact of capital structure on shareholder wealth.
But make no mistake, this has only a remote association with value creation.
Dividends and Share Buy-Backs
- The text explores the financial mechanics and strategic implications of share buy-back programs versus dividend distributions.
- Case studies analyze how the price of a buy-back relative to book value affects earnings per share (EPS) and overall shareholder wealth.
- The material addresses agency theory, suggesting that managers with stock options often prefer buy-backs over dividends because dividends can lower share prices.
- Creditors may view share buy-backs negatively as they represent a transfer of value from debt holders to shareholders by increasing financial risk.
- Market signaling is discussed, where bonus shares or dividend maintenance can serve as indicators of a company's future profitability and stability.
No, because high dividends hold down the price of the shares on which the manager holds stock options.
Dividends and Share Buy-Backs
- Debt obligations naturally reduce dividend payout ratios as interest and principal payments take priority over shareholder distributions.
- Management should return capital to shareholders whenever the marginal rate of return on internal investments falls below the cost of capital.
- Share buy-backs are often preferred by executives because, unlike dividends, they do not mechanically reduce the share price and the subsequent value of stock options.
- Earnings Per Share (EPS) increases during a buy-back only if the reciprocal of the P/E ratio exceeds the after-tax cost of debt used to fund the purchase.
- Maintaining a zero-dividend policy is only justifiable as long as the company generates adequate returns on reinvested earnings; otherwise, shareholders become relatively poorer.
Why would you want to pay 200 for shares that you believe are worth 150?
Corporate Payout Policy Bibliography
- The text provides a comprehensive list of academic literature focusing on dividend policies and share buybacks from 1956 to 2012.
- Key research themes include the 'disappearing dividends' phenomenon and the subsequent debate over their reappearance in global markets.
- Several studies explore the 'catering theory,' suggesting that firms adjust payout methods based on prevailing investor sentiment and preferences.
- The bibliography highlights the evolving relationship between traditional dividends and the increasing use of stock repurchases as a substitution method.
- Research also examines the impact of payout decisions on different stakeholders, specifically comparing wealth effects for stockholders versus bondholders.
The irrelevance of the MM dividend irrelevance theorem.
The Mechanics of Share Issues
- A share issue is fundamentally a sale of shares by current shareholders, even though they do not receive the cash proceeds directly.
- To maintain their current ownership percentage and avoid dilution, existing shareholders must subscribe to the new issue in proportion to their current holdings.
- A capital increase forces the company to confront market value as an internal management factor rather than just an external performance metric.
- The proceeds of a share issue benefit the company's treasury, potentially increasing earnings for shareholders and reducing risk for creditors.
- The process creates a complex dynamic of value sharing between pre-existing shareholders and new investors.
A share issue, which conceptually is a sale of shares at market value, has the effect of reintroducing this value-sanction via the company’s treasury, i.e. its cash balance.
Debt, Equity, and Dilution
- Debt financing allows a company to raise capital while maintaining full autonomy, provided contractual interest and principal obligations are met.
- Issuing new shares involves selling rights to future earnings and corporate control, effectively enlarging the company's equity 'cake' while redistributing its slices.
- When new shares are issued to outside parties, existing shareholders experience dilution, which is a decrease in their percentage ownership of the company.
- The cost for a new shareholder to acquire a specific percentage of a company is higher during a capital increase than a secondary sale because the total value of the company rises by the amount of the new investment.
- Dilution can be avoided if existing shareholders participate in a capital increase in exact proportion to their current holdings, effectively selling new shares to themselves.
A capital increase is simply a sale of shares. It implies sharing the parameters of the company.
Dynamics of Share Issuance
- A share issue creates value only if the issuance price deviates from the true value of the stock, potentially benefiting the company at the expense of new investors.
- The true cost of equity is not the immediate dividend but the rate of return required by the market to maintain the share price.
- In distressed companies, new equity often transfers value to creditors by reducing the risk of their claims, making debt more valuable.
- Capital increases serve as a transparency mechanism, forcing disclosures that reduce information asymmetry between managers and shareholders.
- The process of raising capital often masks an underlying conflict of interest between existing and new shareholders despite the rhetoric of partnership.
What is new here is the conflict between old and new shareholders, under the cover of the oft-repeated hypocrisy that “we are all partners” in the same company.
The Signaling of Share Issues
- Issuing new shares often signals to the market that management believes the current share price is overvalued.
- A capital increase typically results in a 3-5% downward adjustment in share price as investors react to negative signals or market dilution.
- New equity injections decrease financial leverage, which can inadvertently transfer value from shareholders to creditors by reducing company risk.
- Dilution of control occurs when existing shareholders do not subscribe to new issues in proportion to their current holdings.
- Pre-emptive subscription rights are often used to protect current shareholders, allowing them to maintain their equity percentage or trade the rights for value.
If one believes in asymmetry of information, a share issue ought to be a signal that the share price is overvalued.
Dilution and Anticipation Mechanisms
- Standard dilution calculations often overestimate the impact on shareholders when pre-emptive subscription rights are involved.
- Real dilution is best calculated on an aggregate basis by comparing the proceeds of the capital increase to the total post-transaction equity value.
- The anticipation mechanism ensures that value creation from new investments is captured by existing shareholders rather than new ones.
- Market prices often reflect future growth opportunities and capital increases before they occur, leading to high P/E ratios.
- New shareholders typically receive only their required rate of return, as the 'added value' of new projects is priced in upon announcement.
The anticipation mechanism operates in such a way that new shareholders will not receive an excess rate of return.
Capital Increases and EPS Dilution
- A capital increase causes an instantaneous change in earnings per share (EPS), resulting in either dilution or accretion.
- EPS changes are mechanical and do not necessarily indicate the creation or destruction of shareholder value.
- Dilution occurs whenever the reciprocal of the P/E ratio is greater than the rate of return on the new investments.
- Companies with high P/E ratios can easily enhance EPS through share issues even if the underlying investment is not exceptionally profitable.
- The 'earnings-enhancing' label is often used by companies to make capital increases sound more attractive to the market.
This demonstrates once again that earnings per share are not a reliable indicator of value creation or destruction.
Capital Increases and EPS Dilution
- Short-term EPS dilution often occurs after a capital increase because funds are not yet earning their required rate of return.
- Financial analysts typically distinguish between three types of dilution: instantaneous, risk-free reinvestment, and full reinvestment forecasting.
- Long-term value creation depends on whether the investment's rate of return eventually offsets the initial dilution of earnings per share.
- High price-to-earnings (P/E) ratios present a strategic opportunity where issuing new shares is highly advantageous for a company.
- A capital increase significantly boosts financial power when a company's market value exceeds its book value, allowing for parallel debt increases.
- The relationship between market capitalization and book value determines the actual growth in value per share following a capital injection.
With the wisdom that derives from experience, and notwithstanding what any theory might indicate, we could almost say that whenever P/Es are high, it is a crime for a company not to issue new shares!
Mechanics of Share Issues
- The impact of a share issue on control depends heavily on the relationship between the market value and the book value of the equity.
- In equilibrium market theory, the cost of a capital increase is a forward-looking cost of equity rather than a simple dividend or earnings yield.
- Value is created for existing shareholders only if the capital increase successfully captures value from the newly deployed funds.
- Capital increases often send a negative signal to the market suggesting shares are overvalued, requiring management to counter this perception.
- Real dilution occurs when a shareholder's equity rights are reduced, which must be distinguished from short-term changes in financial parameters like EPS.
- A capital increase can shift value from shareholders to lenders by reducing the company's overall risk profile and improving debt ratings.
The a priori negative signal that any capital increase sends – namely, that the shares are overvalued – has to be countered.
Capital Increases and Shareholder Equity
- The text explores the theoretical value and strategic purpose of subscription rights in corporate capital increases.
- It examines the impact of new share issues on Earnings Per Share (EPS) and book value in both the short and long term.
- The material addresses the complexities of share issues for family-owned companies and the signaling effects of overvaluation.
- Mathematical exercises demonstrate how to calculate technical dilution, adjustment coefficients, and subscription ratios.
- A case study of Saint-Gobain's 2009 share issue provides a real-world application of pre-emptive subscription rights and market capitalization analysis.
- The text investigates the role of investment banks and how underwriting commissions can be analyzed through the lens of options theory.
Show that if all shareholders subscribe to the capital increase, the issue price does not matter.
Mechanics of Share Issues
- Capital increases involve different types of dilution including apparent, real, and technical dilution.
- Pre-emptive subscription rights protect existing shareholders by allowing them to maintain their proportional ownership.
- Underwriting commissions function as a put option where the company buys the right to sell shares to a bank at a guaranteed price.
- Large discounts in share issues act as a cushion against market volatility and reduce risk for underwriting banks.
- Arbitrage occurs when investors buy rights and short sell shares, often limited by the low liquidity of the rights market.
- The financial impact of a share issue on Earnings Per Share (EPS) and book value depends on the returns of the projects financed.
The commission represents the price of the put option that the company buys from the bank.
Implementing a Debt Policy
- Debt policy implementation involves structuring gross debt and determining optimal cash reserves on the balance sheet.
- Effective strategy requires managing long-term relationships with various debt providers beyond simple product selection.
- Key structural parameters include choosing between bond or bank markets, currency types, and interest rate formats.
- Lenders prioritize repayment security, often requiring a choice between asset-backed collateral or cash-flow-based lending.
- Collateralizing assets can lower financing costs but imposes significant operational restrictions, such as the inability to sell those assets.
Implementing a debt policy goes beyond the simple choice of the parameters of the debt products issued or contracted, and includes the strategy of relationships over time between the firm and its various debt providers.
Asset-Backed and Market Financing
- Asset-backed loans, such as pawning, use specific material assets as both the basis and collateral for the loan amount.
- Critics argue that asset-backed financing contradicts financial logic, which suggests financing should support overall cash flows rather than specific transactions.
- Isolating guarantees through asset-backing may lower specific loan costs but risks increasing the cost of other, non-guaranteed financing.
- Project finance represents the extreme of this logic, isolating economic risks to cater to specific investor preferences and potentially lower total costs.
- While small companies are often limited to bank loans, medium and large eurozone companies are increasingly shifting toward market-based debt like private placements.
- Market financing allows companies to bypass the 'screen' of financial institutions' balance sheets to reach investors directly.
In a world in equilibrium, if backing a loan with an asset makes it possible to reduce the cost of financing, there is a risk that the corollary could be an increase in the cost of other financings which do not have this guarantee.
Bank Loans vs Bond Markets
- Bank loan interest rates often fail to reflect the true cost of financing because banks use low rates as loss leaders to sell other financial products.
- Bond market financing provides the real cost of capital as investors price the debt based on a direct assessment of counterparty risk.
- Issuing bonds requires higher transparency and ongoing costs, including credit ratings and continuous investor communication.
- Bank loans offer superior flexibility for companies, allowing them to draw down funds exactly when needed rather than in a single lump sum.
- While bond financing is growing in the Eurozone, bank debt remains the dominant source of capital at 81%, a sharp contrast to the US market.
The interest rate at which the market is prepared to buy the company’s bonds, given its appreciation of the risk, is the real cost of financing the company.
Bonds Versus Bank Loans
- Financial markets impose high liquidity requirements, often requiring a minimum of €5m, which effectively restricts small and medium-sized enterprises from issuing listed debt.
- Bond markets offer significantly longer maturities and bullet repayments compared to the shorter, installment-based structures typical of bank loans.
- The process of tapping debt markets is lengthy and uncertain, making it unsuitable for companies undergoing major strategic upheavals or facing market volatility.
- Bank loans provide superior flexibility for renegotiation and fund drawdown, whereas bond terms are difficult to change due to the need for collective investor approval.
- Despite higher costs, some treasurers prefer bond markets to maintain independence from banks and avoid restrictive covenants.
- Maturity selection is driven by liquidity forecasts, often favoring deferred repayment or bullet bonds when immediate cash flow is negative.
The treasurer of a group may choose to tap the bond market, even if the cost is higher, so as to avoid falling into the hands of banks and to retain flexibility.
Implementing a Debt Policy
- Treasurers categorize financial resources into long, medium, and short-term maturities to align with specific forecasting periods.
- Financing strategies involve prioritizing the least expensive resources for predictable needs while using flexible credit lines for unforeseen requirements.
- Borrowing in foreign currencies solely for lower interest rates is a dangerous speculative mistake that exposes the company to significant exchange rate risk.
- The choice between fixed and floating rates is independent of loan maturity, as long-term debt can be indexed to short-term rates or modified via swaps.
- While floating rates have historically been cheaper over the last 30 years, fixed rates are often preferred for the certainty they provide to the income statement.
It’s taking a very big foreign exchange risk for a very small interest rate saving, it’s playing against economic theory and it is certainly not this type of activity that shareholders signed up to finance.
Debt Structure and Risk Management
- Financial directors often act as speculators by choosing between fixed and floating rates based on interest rate forecasts.
- Heavily indebted or cyclical companies frequently use fixed rates as a form of insurance against rising costs.
- Debt seniority is categorized into senior, chirographic, and subordinated debt, creating a hierarchy of repayment priority.
- Subordinated debt improves a company's solvency for other creditors but requires higher interest rates to compensate for increased risk.
- Covenants act as 'rendez-vous' clauses that can trigger immediate debt repayment if financial ratios or performance thresholds are breached.
Under the cover of good management, he becomes a speculator, taking out debt at a floating rate when he thinks that interest rates are going to fall and at a fixed rate when he finds that current interest rates are very low.
Loan Agreement Covenants
- Investment and production covenants prevent asset substitution and protect debtholders from the firm adopting riskier business profiles.
- Debt-related clauses limit subsequent borrowing through specific financial ratios to ensure existing claims are not diluted in value.
- Dividend payment restrictions prevent shareholders from draining company cash through massive distributions or share buy-backs at the expense of lenders.
- Change of control clauses allow lenders to demand immediate repayment or renegotiate terms if the borrower's ownership changes.
- Covenants act as a 'bugbear' for financial directors by reducing operational flexibility and creating potential for public humiliation if breached.
- Lenders may grant waivers for covenant breaches in exchange for higher interest rates or specific fees, reflecting the increased risk profile.
Covenants are often the bugbear of the financial director as they are sources for reducing room for future manoeuvre.
Debt Renegotiation and Cash Reserves
- Companies frequently renegotiate loan terms to align with changing cash flows, take advantage of better interest rates, or remove restrictive covenants.
- Statistical data shows that loan renegotiation is nearly universal for long-term debt, with a 98% probability for loans exceeding five years.
- Renegotiating bond debt is significantly more complex than bank loans due to the high number of dispersed investors and lack of direct negotiation power.
- Bond restructuring methods include market buybacks, exchange offers for new securities, or formal bondholder meetings to vote on contract modifications.
- Global corporate balance sheets have shown a steady increase in cash holdings since the early 2000s across the USA, Europe, and Japan.
- A significant portion of corporate cash is often restricted by foreign exchange controls, tax implications, or operational requirements like customer advance payments.
Roberts and Sufi (2009) have shown that in the USA, the probability that a loan will be renegotiated before the end of its term is 27% for loans of less than one year, and 72% for loans of between one and three years, 94% for those between three and five years and close to 100% (98%) for those of over five years.
Strategic Value of Cash
- Cash reserves serve operational needs such as covering store requirements and seasonal working capital fluctuations.
- The 2008 liquidity crisis prompted financial directors to maintain precautionary cash buffers to avoid sudden insolvency.
- Holding significant cash allows firms to gain market share over less liquid competitors and seize unexpected investment opportunities.
- Large cash balances act as a signaling mechanism to reassure clients and shareholders of a firm's long-term stability.
- For R&D-heavy industries, cash acts as a hedge against volatile cash flows and reduces overall investment risk.
- Strategic timing often results in a lag between divesting assets and reinvesting the proceeds into new acquisitions.
The liquidity crisis in the autumn of 2008 showed that cash can disappear as quickly as water in sand.
Optimizing Banking Relationships
- Concentrating banking business with a limited number of institutions fosters long-term trust and deeper institutional knowledge.
- Providing banks with 'side business' like foreign exchange and M&A mandates increases their earnings without requiring additional equity commitments.
- Limiting the number of banking partners ensures that the available side business is substantial enough to keep each bank motivated and attentive.
- Diversifying debt sources across bonds, commercial paper, and private placements protects against liquidity crunches in the banking sector.
- Maintaining significant cash reserves is essential for navigating economic volatility and seizing sudden acquisition opportunities.
In this area, the financial director should take good heed of the advice given by Saint Matthew: “Watch ye, therefore, for ye know not the day nor the hour”.
Strategic Financial Flexibility
- Maintaining financial flexibility through undrawn credit lines and cash reserves acts as an insurance policy with inherent costs.
- Extending debt maturity to align with free cash flow profiles helps companies avoid liquidity crises during economic shocks.
- Active management of commercial paper markets ensures ongoing investor relationships and prevents the appearance of desperation.
- Successful financial policy involves renegotiating or eliminating restrictive covenants to maintain operational room for maneuver.
- Asset-backed financing and sophisticated financial products often carry hidden downsides despite their lower apparent costs.
- Diversifying financing sources is essential but requires a balance between liquidity access and the complexity of managing multiple instruments.
But, like any insurance policy, flexibility has a financial cost.
Implementing a Debt Policy
- The treasurer's primary objective is to minimize debt costs while maintaining maximum financial flexibility.
- Small and medium-sized enterprises (SMEs) are often restricted to bank financing due to the high barriers of entry for financial markets.
- Collateral and senior debt structures are used to isolate economic risks and lower interest rates for lenders.
- Subordinated debt serves as a middle ground between senior debt and equity, offering higher returns for increased risk.
- Effective debt management requires maintaining cash reserves to handle unexpected events and seize investment opportunities.
- Financial directors should cultivate relationships with multiple banks to diversify funding sources and carefully manage debt maturity.
A good debt policy is a policy that leaves cash on the balance sheet in order to be able to deal with the unexpected and to reduce risk, to reassure the company’s partners and to enable it to seize investment opportunities.
Corporate Debt and Financing Exercises
- The text outlines fundamental theoretical questions regarding debt covenants, asset-backed financing, and the strategic role of cash on balance sheets.
- It explores the tactical decision-making process between fixed and floating interest rates based on market expectations and income statement impacts.
- A detailed case study of Saint-Gobain's 2009 bond issuance and 2010 exchange offer illustrates the practical complexities of debt refinancing.
- The exercises challenge the reader to distinguish between the nominal cost of debt and the actual economic value when bonds are traded or exchanged at different market rates.
- The section addresses the logistical and financial trade-offs involved in diversifying debt sources and renegotiating with creditors.
What is the treasurer who takes out debt over five years at a fixed rate betting on?
Implementing a Debt Policy
- Companies utilize diverse financing structures to lower lender risk and secure more favorable interest rates than their internal constraints would otherwise allow.
- The shift from bank loans to bond markets is driven by Basel III restrictions and the desire to diversify creditor bases for long-term financing.
- Covenants act as a protective mechanism for lenders, forcing management to renegotiate terms if they attempt to increase the company's risk profile.
- Managing debt involves a trade-off between interest rate stability and debt value stability, with accounting standards often hiding fluctuations in the latter.
- Maintaining a market presence, such as through credit ratings or commercial paper, is a necessary cost for preserving future financial maneuverability.
- Renegotiating bond debt is significantly more complex than bank debt due to the high number of individual investors involved compared to a small pool of banks.
Accordingly you have to choose your source of instability, knowing that in accounting, fluctuations in the value of debt are only recognised, at best, in the notes to the account.
Saint-Gobain's Debt Exchange Strategy
- Saint-Gobain utilized public exchange offers to extend debt maturity and improve the company's cash position without issuing unnecessary new debt.
- The exchange process requires the company to buy back bonds at market value plus a premium rather than at par value.
- The company aimed to lock in lower interest rates available in 2010 for a longer period compared to their previous debt.
- Psychological factors influenced the decision, as management wanted to 'clean up' the high-interest debt issued during the 2008-2009 financial crisis.
- Financially, a company remains burdened by the high interest rates of an initial issue until its original maturity, regardless of subsequent exchange offers.
Public exchange offers are also a way for them to clean up the past, even though from a strictly financial point of view, once a company has issued a bond at a rate of 8.25% over a five-year period, regardless of what it does next, even if it exchanges it like a bond at a lower interest rate, it will continue to bear the con-sequences.
Financial Engineering and Start-ups
- The text provides an extensive bibliography of academic research focusing on corporate cash holdings, debt covenants, and creditor control rights.
- It introduces the section on Financial Management, specifically focusing on corporate governance and the strategic decisions handled by investment bankers.
- Key investment banking activities discussed include IPOs, asset sales, mergers, demergers, and corporate restructuring.
- The author highlights the 'really big adventure' of starting a company, noting that while most fail, success requires talent, luck, and vision.
- A primary financial characteristic of a new company is the extreme volatility of capital employed, which translates to very high risk for the entrepreneur.
We do hope that our readers will not spend whole nights on these topics, unlike investment bankers!
The Risk of Start-ups
- Many entrepreneurs launch with a product or service before establishing a viable economic model for profitability.
- The success of Google illustrates that a sustainable revenue model, such as search-based advertising, often emerges years after the initial innovation.
- High failure rates are universal across sectors, with only 29% of US companies surviving their first decade due to the non-linear nature of development.
- Start-up growth is a series of critical hurdles, where a 'no' at any stage requires a pivot or a return to the drawing board.
- The founder is the essential catalyst who provides the vision and charisma necessary to convince investors and employees to face extreme uncertainty.
- Entrepreneurs represent the financial opposite of diversified investors, concentrating all their risk into a single, often volatile, asset.
Setting up a company is the riskiest segment of the economy, but also the most necessary for ensuring the renewal of economic life.
The Entrepreneurial Financing Landscape
- Entrepreneurs operate on passion and human drive rather than the cold, probabilistic risk-management logic of financial managers.
- Start-ups face an immediate and critical need for external financing because they often endure years of negative cash flow before reaching profitability.
- Venture investors rely on a 'power law' model where one massive success out of ten investments must compensate for numerous total losses.
- Investors take an active, hands-on role to mitigate high risks, providing the lonely entrepreneur with essential networking, experience, and strategic distance.
- The valuation of early-stage companies is characterized by extreme volatility and speculation, as seen in the dramatic price fluctuations of biotech start-ups.
The entrepreneur does not reason in terms of probability like the financial manager. His aim is not financial. It is, above all, human.
Equity Versus Debt Financing
- Companies without established economic models or tangible assets should prioritize equity capital over debt.
- Debt is unsuitable for startups because fixed interest and principal repayments conflict with unpredictable cash flows.
- Entrepreneurs require significant flexibility to pivot, adapt, or discard products based on early customer feedback.
- The pressure of debt can distract founders from their core mission by imposing rigid financial timeframes.
- Over-reliance on debt, including convertible bonds, is a common mistake made by founders trying to avoid equity dilution.
Entrepreneurs are completely wrapped up in their adventures and can’t allow themselves to be distracted or have their timeframes dictated by debt, ticking away like a time bomb.
Financing Strategies for Start-ups
- The primary goal for early-stage companies is proving viability rather than minimizing equity dilution.
- Risk-heavy ventures should be financed exclusively with equity capital until an economic model is proven.
- Debt is only appropriate for start-ups with tangible assets like vehicles or equipment that hold secondary market value.
- Staged financing rounds prevent entrepreneurs from receiving a 'blank cheque' and ensure capital is tied to specific milestones.
- Multiple funding rounds act as a governance mechanism to resolve agency conflicts and reallocate capital from failing projects to promising ones.
Better to have a small stake in a company that has had the time it needs to prove that it is viable, than a large stake in a company that is heading for bankruptcy.
Start-up Financing and Goodwill Risks
- Successive financing rounds allow entrepreneurs to negotiate higher share prices at each stage, effectively limiting dilution as the company proves its value.
- Goodwill represents the gap between equity value and actual investment, often resulting in investors paying significantly higher share prices than founders.
- Extreme valuation gaps, sometimes reaching 100 times the founder's price, create high-risk scenarios for companies that have yet to prove their concept.
- Failure to meet initial roadmap targets can lead to a 'poisonous atmosphere' between investors facing capital losses and founders holding capital gains.
- Initial investors may refuse to participate in subsequent funding rounds to avoid admitting previous valuation errors to their investment committees.
We’ve seen investors pay 100 times more for their shares than the entrepreneurs, which is a considerable amount of goodwill for a company that has yet to prove itself!
The Perils of High Goodwill
- Initial high valuations create a 'ratchet mechanism' that massively dilutes entrepreneurs if the company fails to meet early expectations.
- Failure to secure follow-on funding from original investors sends a toxic signal to the market, often leading to liquidation.
- A proposed alternative involves issuing all shares at the same price initially, with entrepreneurs earning 'goodwill' through performance-based options.
- Aligning the entry price for all shareholders ensures that investors and founders share the same interests when navigating inevitable setbacks.
- The psychological challenge of this model is that passionate entrepreneurs may feel like mere employees if they do not hold significant early equity.
- Behavioral finance plays a critical role, as the entrepreneur's 'possessed' mindset is essential for the company's survival.
He should always be thinking about his project, night and day, like a soul possessed!
Financing the Start-up Journey
- Excessive initial goodwill and overly optimistic business plans can create 'hand grenade' scenarios for entrepreneurs, leading to future deadlocks or punishing ratchet clauses.
- Early-stage equity typically begins with 'love money' from friends and family, often motivated by personal loyalty rather than purely financial returns.
- Crowdfunding and business angels provide critical bridge financing, offering not just capital but also concept validation and professional networking.
- Venture capital and corporate venture funds enter for high-potential projects, with the latter serving as a strategic watch for established industrial groups.
- Debt financing is largely unavailable and ill-advised for start-ups until a business model is proven, unless backed by independent assets or state guarantees.
- The progression of investors—from incubators to stock market listings—reflects the increasing scale and decreasing risk of the maturing company.
In the end, an overly optimistic business plan is not in the interests of the entrepreneur, who could find himself sitting on a hand grenade from which he himself has pulled the pin!
Financing and Shareholder Dynamics
- Supplementary financing sources for start-ups include subsidies, repayable advances, honor loans, and research tax credits.
- The relationship between entrepreneurs and investors is formalised through a shareholders’ agreement signed during the funding process.
- The balance of power in negotiations fluctuates based on market conditions, shifting from entrepreneurs in the late 1990s to investors today.
- Investors prioritize the quality of the founding team, often requiring long-term commitment through lock-up and vesting clauses.
- Incentive structures like stock options and warrants are used to maintain founder motivation even after significant equity dilution.
In 2000, before the Internet bubble burst, entrepreneurs were in a strong position, but positions have been reversed and now it is investors who hold most of the cards.
Protecting Venture Capital Investments
- Investors use liquidation preferences to ensure they recover their initial capital before founders profit from an early sale.
- Ratchet clauses protect early investors from dilution if subsequent funding rounds occur at a lower valuation.
- The inclusion of protective clauses is often a direct response to high 'goodwill' valuations demanded by entrepreneurs at the start.
- Full implementation of a ratchet clause can lead to severe dilution of founders, potentially damaging their long-term motivation.
- Pay-to-play provisions may be used to restrict ratchet benefits only to those investors who continue to support the company in new rounds.
This is only the flip side of the greediness of the entrepreneur, who may have insisted on the investors paying goodwill before the relevance of the concept and the viability of the business model had been proved.
Investor Exit and Control Clauses
- Investment funds utilize specific clauses to ensure they can liquidate their stakes and distribute income within a set timeframe.
- Drag-along and tag-along clauses protect majority and minority shareholders respectively during potential company sales or changes in control.
- Investors often demand veto rights over critical decisions like hiring key staff or strategy shifts through qualified majority requirements.
- The financial management of a start-up is defined by the 'burn rate,' which measures the months of survival remaining based on cash reserves.
- Implementing forced sale clauses is practically difficult if the original entrepreneur is unwilling to cooperate with potential buyers.
- Effective start-up management requires constant monitoring of cash positions and meticulous planning for subsequent fundraising rounds.
Having said that, implementing this clause is very difficult because if the entrepreneur doesn’t want to sell, he will not be very convincing when trying to get a buyer to make an offer.
Start-up Financing and Valuation
- Managers must initiate new funding rounds six to nine months before cash depletion to avoid operational collapse.
- Fundraising timing is a tactical dilemma between proving development milestones and maintaining negotiation leverage.
- Traditional valuation methods like DCF and multiples are often impractical due to negative earnings and volatile business plans.
- The real option method is rarely used because requiring entrepreneurs to model bankruptcy scenarios is psychologically demoralizing.
- Venture capital professionals rely on pragmatic, specialized methods rather than standard academic financial models.
Drawing up a business plan that makes sense and that is also optimistic is complicated, but asking an entrepreneur to draft different versions, including one which leads to bankruptcy, is counter-productive.
The Venture Capital Method
- The venture capital method is a hybrid valuation approach combining multiples and discounted cash flows to value young companies.
- Valuation begins by estimating a future exit value, typically four to seven years out, based on P/E ratios of mature industry peers.
- Future equity value is discounted to the present using exceptionally high rates, ranging from 20% for pre-IPO firms to 60% for start-ups.
- These high discount rates are not standard costs of capital; they account for the high probability of bankruptcy and the tendency for business plans to be overly optimistic.
- The required return also compensates the investor for the illiquidity of the shares and the value of non-financial contributions like managerial advice and networking.
- The model can be adjusted for multiple rounds of fundraising, recalculating post-money valuations as the company matures and the risk profile decreases.
If they appear to be high, it is because they integrate the risk of the start-up going bankrupt.
Venture Capital Dilution Mechanics
- Initial investors must secure a larger initial equity stake to offset the dilutive effects of subsequent funding rounds.
- The issuance of more shares to compensate for future dilution effectively lowers the entry share price for the first investor.
- Target rates of return, such as 60% for early-stage and 40% for later-stage investors, dictate the necessary equity percentages.
- The venture capital method can be used in reverse to determine the implicit internal rate of return (IRR) of a proposed share price.
- Success of these mathematical models relies entirely on the company meeting its projected terminal value and business plan milestones.
All of these correct arithmetical calculations assume, for these rates of return to be achieved, that reality will correspond to the projections. Now that’s another story!
Startup Financing and Growth
- Example.com secured initial funding with low dilution by leveraging pre-developed algorithms and founder sacrifices, such as forgoing salaries.
- The company strategically raised capital even when cash was available to ensure operational stability and facilitate high-quality recruitment.
- Successive funding rounds were timed to coincide with technical milestones like alpha and beta launches, which significantly boosted share prices.
- A high-risk fourth round was delayed until only three months of cash remained, successfully maximizing valuation through user growth metrics.
- The freemium model and global expansion resulted in the founders retaining 41% ownership despite contributing only 1% of the total capital.
- The startup phase is characterized by extreme volatility, the 'demigod' status of founders, and the necessity of hands-on investor involvement.
For example, it is easier to recruit a good IT developer when your cash can cover 24 months of cash burn rather than three!
Financing the Startup Venture
- Equity capital is the essential financing mechanism for startups because it provides the necessary time to validate unproven business models.
- Financing typically occurs in sequential rounds triggered by development milestones to manage risk and optimize valuation for founders.
- Debt is generally inappropriate for startups unless they possess significant independent assets, as they lack stable operating cash flows.
- Financial management in early-stage companies focuses primarily on 'cash runway'—the number of months remaining before the next funding round.
- Traditional valuation methods are often replaced by hybrid models combining multiples and discounted cash flows due to the unreliability of long-term forecasts.
- High initial goodwill payments can lead to founder deadlock or devastating dilution if business plan targets are not met.
If goodwill is paid at the start by investors, the founders will be less diluted but they will be taking a major risk of deadlock if the business plan is not met, which is the rule rather than the exception when it comes to start-ups.
Venture Capital Valuation Exercises
- The text presents complex financial scenarios involving pre-money and post-money valuations for start-ups.
- It explores the impact of liquidation preferences and shareholders' agreements on the distribution of exit proceeds.
- The exercises analyze the effects of full ratchet clauses on equity dilution during subsequent funding rounds.
- Performance-based incentives are examined through call options linked to the Internal Rate of Return (IRR) achieved by investors.
- The commentary highlights the 'congenital optimism' of entrepreneurs, noting that business plans often represent best-case rather than likely outcomes.
- High discount rates in venture capital are framed as a tool to offset the inherent risk and the high probability of start-up failure.
Pessimists do not start up companies. The business plan does not represent the most likely outcome or the average outcome, but the best possible outcome.
Venture Capital Mechanics and Dilution
- Business plans used for valuations rarely align with eventual reality, leading to complex contractual adjustments.
- Shareholder agreements are designed to prevent entrepreneurs from selling too quickly by redistributing gains to business angels.
- The 'full ratchet' clause can lead to the drastic dilution of founders, potentially reducing their equity to negligible levels.
- Milestone-based IRR targets and linear interpolations are preferred over fixed intervals to better align investor returns with company performance.
- Founders whose equity is severely diluted through ratchet clauses often require new incentives to maintain their motivation.
- Venture capital financing relies on sequential investments and specific legal frameworks to manage the high risks of start-ups.
The ratchet clause has resulted in the drastic dilution of the founders, whose motivation will have to be rekindled, one way or another.
The Importance of Shareholder Structure
- Shareholder structure is often overlooked in academic finance but is a primary focus for investment bankers in practice.
- The distribution of ownership and voting rights determines the balance of power between shareholders and managers, highlighting key agency theory concerns.
- Shareholder objectives vary significantly, ranging from wealth and power to serving as a functional tool for suppliers or customers, as seen in cooperatives.
- Internal conflicts and disagreements among shareholders have the potential to completely paralyze a company's operations, especially in family-owned firms.
- Ownership and voting rights are distinct concepts that can be decoupled through mechanisms like multiple voting rights or holding company cascades.
What a cast of characters!
Shareholder Structure and Governance
- Shareholder structure analysis examines the distribution of power and the distinction between economic rights and voting control.
- The transparency of shareholder agreements varies significantly between listed and unlisted companies, affecting the accuracy of external analysis.
- Nominee agreements allow for shareholder anonymity but carry significant legal risks and are often difficult to enforce during financial distress.
- The Annual General Meeting serves as the primary forum for shareholders to exercise decision-making power over board appointments and capital changes.
- Corporate governance distinguishes between Ordinary General Meetings for routine business and Extraordinary General Meetings for structural changes.
- Global legal frameworks define specific supermajority thresholds, such as two-thirds or three-quarters, for major corporate transformations.
If the issuer runs into trouble during the life of the nominee agreement, the original shareholder will be loath to buy back the shares at a price that no longer reflects reality.
Minority Rights and Corporate Control
- Corporate governance laws across major economies typically require a supermajority (often 3/4 or 2/3) for fundamental structural changes like mergers or capital adjustments.
- Minority shareholders holding a 'blocking minority' possess significant veto power over changes to company articles, objectives, and capital structures.
- The influence of a blocking minority is most potent during periods of financial distress or rapid growth when restructuring and new capital are essential.
- Small shareholders without a blocking minority are often limited to being 'naysayers' or 'thorns' in management's side, though shareholder activism is rising as a defense tool.
- Global ownership patterns vary significantly, with family-owned models dominating in Europe (e.g., Italy and Spain) while widely spread ownership prevails in the USA and UK.
In other words, a small shareholder can be a thorn in management’s side, but no more.
Evolution of Corporate Ownership
- Family-owned structures are declining in capital-intensive sectors like telecoms and energy where massive investment requirements exceed private family resources.
- Modern financial markets favor diversification over concentrated family risk, leading to the dilution of traditional family control.
- Research suggests family-owned firms often outperform others because concentrated wealth provides a stronger incentive for rigorous management monitoring.
- Private equity funds serve as critical intermediaries, specializing in venture capital, development capital, or leveraged buyouts (LBOs) based on company maturity.
- LBO funds frequently seek full control to restructure companies away from the scrutiny of minority shareholders and public market pressures.
- Private equity investments are typically time-bound, with professional managers seeking exits through resales or IPOs within a ten-year window.
Having most of your wealth in one single company or group is a strong incentive to properly monitor its managers or to act responsibly as its manager.
Dynamics of Corporate Ownership
- Private equity funds act as professional shareholders that align management incentives with value creation through debt pressure and reporting.
- Institutional investors like pension funds and banks influence market prices and increasingly use voting power to challenge corporate governance issues.
- Activist funds represent a more aggressive subset of institutional investors that publicly pressure management for specific financial changes.
- The decline of traditional European financial holding companies has shifted the landscape toward emerging market conglomerates and more fragmented ownership.
- Employee-shareholders provide a loyal, non-volatile capital base that typically strengthens the position of existing management and majority owners.
- Incentive schemes such as ESOPs and direct ownership are used to minimize agency costs by turning employees into stakeholders.
They are professional shareholders who have only one aim – to create value – and they do not hesitate to align the management of companies they invest in with that objective.
Employee Ownership and State Influence
- Companies use free shares and stock options to incentivize employees, particularly in service and fast-growing sectors where human capital is the primary asset.
- Employee shareholding programs often include lock-up clauses and vesting periods to ensure long-term alignment and limit immediate market flowback.
- Concentrated employee ownership carries significant risk, as it compounds an individual's financial exposure to their employer's stability.
- In crisis situations, employee-shareholders may prioritize job security over necessary corporate restructuring, potentially hindering a firm's recovery.
- While direct government ownership in major industries is declining, sovereign wealth funds are emerging as powerful, though often opaque, global financial actors.
Prudent investment principles dictate that the employee should not invest too heavily in the shares of the company that pays their salaries, because in so doing they, in fact, compound the “everyday life” risks they are running.
Shareholder Agreements and Joint Ventures
- Sovereign wealth funds from nations like Norway, China, and Singapore manage trillions in assets and hold significant stakes in global firms.
- Shareholders' agreements serve as confidential legal documents that define governance and future relationships beyond standard articles of association.
- Governance clauses in these agreements dictate board composition, dividend policies, and major capital expenditure decisions.
- Exit clauses such as tag-along and drag-along rights protect minority and majority interests during the sale of shares.
- Joint ventures often face 'boardroom paralysis' due to 50/50 ownership structures, especially when business performance fluctuates.
- Mechanisms like the 'shotgun clause' or 'Dutch clause' are used to resolve deadlocks by forcing one partner to buy out the other at a set price.
These often-ephemeral companies can easily fall victim to boardroom paralysis.
Costs of Corporate Defense
- Defensive measures against takeovers incur significant financial costs and can lead to a higher cost of capital for the company.
- Regulatory frameworks for takeover defenses vary by country, with the UK and France being more stringent than Germany or the USA.
- Concentrated ownership structures often correlate with more flexible regulations and higher levels of management protection.
- Defensive strategies are categorized into four types: separating management from financial control, controlling shareholder changes, strengthening loyal shareholders, and exploiting legal protections.
- The principle of 'one share, one vote' is increasingly favored by shareholders, making dual-class share structures more controversial.
From a purely financial point of view, this is perfectly normal: there are no free lunches!
Corporate Control and Holding Structures
- Dual-class shares allow for a separation of financial rights and voting power, enabling founders to maintain control with minimal capital.
- French law utilizes double-voting rights based on holding duration rather than permanent share classes.
- Cascading holding companies allow investors to control industrial assets with a small fraction of total capital through multi-tiered ownership.
- Holding structures provide tax advantages by allowing dividends to be reinvested with a lower tax burden than personal income tax.
- Limited share partnerships (LSP) create a total separation between the management of a firm and its financial ownership.
- Complex shareholding structures often lead to conflicts between controlling groups and 'trapped' minority shareholders.
Although he holds only 13% of the capital of this industrial company, the investor uses a cascade of holding companies to maintain control of the industrial company.
Corporate Governance and Control Mechanisms
- Limited share partnerships (LSPs) decouple management control from financial ownership, allowing executives to hold power through by-laws rather than share volume.
- General partners in an LSP face unlimited liability but possess extensive powers, while limited partners act as shareholders with liability restricted to their investment.
- Non-voting shares offer investors a trade-off, providing preferential dividends or fixed returns in exchange for relinquishing voting rights.
- The 'right of approval' clause allows companies to vet potential new shareholders, serving as a defensive mechanism to maintain a specific balance of power.
- If a company rejects a share sale under an approval clause, it or a designated third party must typically buy back those shares at an agreed or appraised price.
- While common in private or family-owned firms, right of approval clauses are generally prohibited in listed companies to ensure market liquidity.
Theoretically, the chief executive of a limited share partnership can enjoy absolute and irrevocable power to manage the company without owning a single share.
Controlling Shareholder Structure
- Pre-emption clauses grant existing shareholders priority rights to acquire shares before they are offered to external parties.
- These rights typically exclude transfers involving inheritance, marital property liquidation, or sales to immediate family members.
- While approval and pre-emption clauses control ownership structure, they cannot indefinitely block a sale if existing shareholders refuse to buy.
- Companies may issue reserved shares to friendly third parties or sovereign wealth funds to dilute the influence of hostile challengers.
- Strategic mergers and asset contributions from family holdings serve as mechanisms to consolidate and strengthen corporate control.
For example, to fend off a challenge from Spanish-owned ACS, the German construction group Hochtief issued 9% of its share capital to the sovereign wealth fund Qatar Holding in December 2010.
Defensive Corporate Governance Strategies
- Companies use reserved capital increases to dilute hostile stakes or introduce friendly shareholders, though this risks a gradual loss of control to the new allies.
- Share buy-backs and cancellations increase the ownership percentage of non-selling shareholders, effectively consolidating control for large stakeholders.
- Employee shareholdings often serve as a defensive buffer, as employees typically support existing management to maintain stability during hostile bids.
- Warrants can be issued that only become exercisable during a takeover attempt, diluting the acquirer's stake and making the bid more expensive.
- Legal protections such as 'golden shares' allow governments to veto ownership changes in sensitive sectors like defense, media, and finance.
- Voting caps can be implemented to limit any single shareholder's influence, regardless of the actual number of shares they own.
The strike price of the warrant is usually very attractive but the warrants can only be exercised if a takeover bid is launched on the company.
Corporate Defences and Group Structures
- Voting caps serve as a potent defence mechanism by limiting the voting power of large shareholders unless they acquire a supermajority of shares.
- Strategic assets and poison pills, such as patents or licensing agreements, are used to deter takeovers but are often legally contested and difficult to implement.
- Change-of-control provisions in vital contracts or golden parachutes can make acquisitions significantly more expensive and complex for outsiders.
- Listing subsidiaries through carve-outs allows a parent company to access equity financing and provide better management incentives without altering the group's core structure.
- Regulatory requirements in specific sectors, such as media, often mandate minority ownership or public listings for subsidiaries.
- Excessive decentralization and listing of subsidiaries can transform a parent company into a mere financial holding company.
If he truly wants to take control, he has to “up the ante” and bid for all of the shares.
Cascade Structures and Subsidiary Listing
- Listing subsidiaries allows parent companies to exploit high market multiples and use 'paper' rather than cash for acquisitions.
- Partial ownership of subsidiaries can lead to tax inefficiencies and the loss of tax consolidation benefits if ownership falls below specific thresholds.
- The 'Matryoshka doll' or cascade structure allows a controlling family to dominate large industrial groups with minimal direct financial interest.
- A major risk of cascade structures is the 'holding company discount,' where the market values the chain at less than the sum of its parts.
- Financial health in a cascade depends on cash flow reaching the top; if profits are trapped at the bottom, shareholders feel their capital is 'working for free.'
- Leverage in intermediate holding companies is dangerous because they lack direct operating assets and rely entirely on dividend flows.
As a newly minted CEO, you may be tempted to structure your group as a Russian Matryoshka doll, like Groupe Arnault and LVMH.
The Holding Company Discount
- Holding companies often trade at a market capitalization lower than the sum of their underlying assets, a phenomenon known as the holding company discount.
- This discount significantly increases the cost of capital for parent companies, sometimes doubling it compared to their operating subsidiaries.
- Key drivers of the discount include tax inefficiencies, administrative overhead, and reduced liquidity for the holding company's shares.
- Market conditions influence the discount size, with bull markets narrowing the gap and bear markets widening it to over 30%.
- Discounts exceeding 25% often signal a power struggle where investors prefer to finance operating assets directly rather than through a holding structure.
In effect, the cost of capital for a parent holding company which has stock that trades at a 50% discount is twice the cost of capital of the operating subsidiary.
Corporate Structure and Shareholder Dynamics
- Conglomerates often suffer from a 'conglomerate discount' where the market value is less than the sum of individual assets due to fears of poor resource allocation.
- Modern investors prefer 'pure play' stocks over conglomerates to maintain control over their own portfolio diversification and avoid head office costs.
- Persistent valuation discounts in conglomerates frequently trigger spin-offs or hostile takeover bids unless management is proven to be exceptionally efficient.
- The landscape of shareholder categories is shifting from traditional family-owned models toward institutional investors, private equity, and sovereign wealth funds.
- Employee-shareholders provide a stabilizing, non-volatile presence in a company's capital structure compared to more active institutional investors.
- Defensive measures used to maintain control, such as double-voting shares, often carry a cost by preventing investors from realizing takeover premiums.
The difference, the conglomerate discount, generally reflects investors’ fears that resources will be poorly allocated.
Corporate Governance and Control
- Companies employ various financial engineering techniques, such as reserved capital increases and poison pills, to strengthen the position of loyal shareholders and prevent hostile takeovers.
- The most effective defense against a change of control is maintaining high operating performance and a strong share price to ensure shareholder loyalty.
- Listing subsidiaries through carve-outs provides access to equity capital but risks turning the parent company into a financial holding company with potential valuation discounts.
- Market discounts often apply to shares with low liquidity, holding companies, or shares without voting rights, which ultimately increases the cost of capital.
- Family-run businesses face long-term instability due to portfolio diversification needs and tax burdens, often leading to eventual sales or the need for tax breaks.
- Management compensation in stock can reduce agency costs but contradicts financial theory because employees' risks become overly concentrated and undiversified.
The best protection against a change of control is a good operating performance and a high share price which make shareholders happy and loyal.
Corporate Structure and Ownership
- The text distinguishes between stable and unstable shareholding structures and their impact on managerial control.
- Managers in stable structures face lower risks of takeover bids compared to those in widely held or unstable firms.
- The relationship with financial investors is a critical variable in determining whether a firm remains protected from hostile acquisitions.
- A comprehensive bibliography highlights the 'agency costs' associated with controlling minority shareholders and family business groups.
- Academic research explores the 'parent company puzzle' where a holding company may be valued at less than the sum of its individual parts.
The parent company puzzle: When is the whole worth less than one of the parts?
The World of Listed Companies
- Public listing provides immediate market feedback on financial management through real-time share price fluctuations.
- Stock exchanges offer superior efficiency and speed for capital access compared to the complex negotiations of private financing.
- Listing serves as a disciplinary mechanism where poor management is punished by low share prices or hostile takeover offers.
- While IPOs provide liquidity for minority shareholders, small-cap stocks may still suffer from low daily trading volumes unless they capture market interest.
- Public status forces majority shareholders to prioritize financial metrics like EPS and dividends over purely personal strategic preferences.
Poor management is punished by poor share price performance or worse – from management’s point of view – by a takeover offer.
Dynamics of Public Listings
- Public listing imposes significant transparency and communication restrictions on management compared to private ownership.
- A stock market presence serves as a powerful form of international advertising and enhances brand recognition among stakeholders.
- Listed companies gain the flexibility to use their shares as currency for acquisitions and access additional capital markets.
- Parent companies can unlock value through carve-outs, listing subsidiaries to boost the parent company's overall market valuation.
- Low market capitalization or trading volume can deter institutional investors and lead to high share price volatility.
- The preparation for an Initial Public Offering (IPO) typically requires a minimum of six months for management to restructure and prepare.
If the company communicates well, the listing constitutes a superb form of “free” advertising, on an international scale;
Preparing for Public Listing
- Companies must transition from private or family-run accounting standards to rigorous reporting procedures required for listed entities.
- Legal and operating structures must be overhauled to ensure full ownership of vital assets and independence from parent groups or non-operational family members.
- Corporate governance must be modernized through the introduction of independent directors, board committees, and sustainable dividend policies.
- Financial restructuring is often necessary, particularly for companies under leveraged buyouts (LBOs) that need to deleverage before going public.
- A clear 'equity story' must be developed to communicate the company's strategy simply and effectively to potential market investors.
- While most companies list in their home country for better valuation, some global brands choose international exchanges like Hong Kong for strategic reasons.
The company will also have to retain the services of a law firm, an accounting firm and possibly a PR agency.
Listing Strategies and IPO Sizing
- Foreign listings impose significant financial reporting constraints and costs without guaranteeing increased liquidity or valuation.
- Emerging market companies benefit most from secondary listings in global hubs like London or New York to compensate for underdeveloped local markets.
- The size and structure of an IPO must balance the cash-out needs of existing shareholders with the company's capital requirements for growth.
- A pure secondary offer where existing shareholders sell all stakes is avoided as it sends a highly negative signal to potential investors.
- Lock-up clauses and capital increases are used as strategic tools to reassure the market and temper negative perceptions during the listing process.
For example, the sale of all of the existing shares on the market by existing shareholders is rarely considered, as this would send a very negative signal to the market.
The Mechanics of IPO Underpricing
- Initial Public Offerings typically see share price increases of 9% to 16% shortly after flotation, indicating a consistent market discount.
- Information asymmetry between sellers and investors necessitates underpricing to ensure a smooth transaction and satisfy market demand.
- Signal theory suggests that because selling shares can be perceived negatively, sellers must 'leave money on the table' to attract buyers.
- Underpricing protects less-informed retail investors from the 'winner's curse,' ensuring they remain in the market to provide necessary liquidity.
- A successful IPO requires intrinsic company quality, including clear growth prospects and management experience, relative to listed peers.
- The high rate of cancelled or postponed IPOs demonstrates that flotation is a high-risk process where success is never guaranteed.
In seeking to retain these investors, who provide valuable and necessary liquidity to the market, IPOs are carried out at a discount.
The Art of the IPO
- Signalling theory suggests that issuing new shares for investment is viewed more favorably by markets than existing owners selling their stakes.
- Successful IPOs require strategic marketing tactics like 'pilot fishing' and securing anchor investors to build market confidence.
- Behavioral finance techniques, such as managing price expectations and intentional undervaluation, are used to ensure a positive post-listing price bounce.
- The first days of trading are psychologically critical; a price drop immediately after an IPO creates a lasting negative impression on investors.
- Post-IPO life imposes strict constraints on management, including the pressure of daily valuation and the need for constant earnings management.
- Public listing can impact employee morale and risk hostile takeovers if the market value deviates significantly from the company's actual performance.
On the other hand, slightly undervaluing the share when it is listed means that the price will rise by a few percentage points during its first days of listing. This puts everybody in a good mood!
The Public to Private Transition
- Companies consider delisting when the administrative and indirect costs of being public outweigh the benefits of market visibility and capital access.
- A lack of stock liquidity, particularly for smaller firms, often renders a public listing theoretical rather than functional for institutional investors.
- Major shareholders may initiate a delist if they believe the market price significantly undervalues the company's intrinsic worth.
- The transition requires a public tender offer and often involves a 'squeeze-out' of minority shareholders once a high ownership threshold is met.
- Despite no change in control, delisting offers typically include a premium similar to takeover bids to satisfy minority shareholders and regulators.
- Going private is not a permanent state, as companies can cycle between public and private status depending on their strategic needs.
Because this is a form of property expropriation, the price of the operation is analysed very closely by the market regulator.
The Dynamics of IPOs
- A stock market listing provides liquidity for shareholders, though this benefit is often restricted to large corporations or the initial offering period for smaller firms.
- The IPO process is a rigorous six-month undertaking requiring structural legal reviews, governance adaptations, and the creation of a compelling 'equity story'.
- Shares are typically sold at a 10 to 20% discount relative to the first listed price, a phenomenon often attributed to information asymmetry between the company and the market.
- The decision to list involves balancing the company's capital requirements with existing shareholders' desires and prevailing market constraints.
- Delisting becomes a viable strategic option when a company no longer needs public funding or when trading liquidity drops to an inefficient level.
At the time of the IPO, shares are generally sold on the market at a discount of between 10 to 20% compared with the first listed price.
IPO Dynamics and Financial Analysis
- The text provides a detailed multi-year income statement and balance sheet for a company, showing a dip in net earnings and sales projected for 2009 followed by a recovery in 2010.
- A dividend policy analysis reveals a significant payout ratio spike to 170% in 2007, suggesting a major capital distribution prior to the IPO process.
- The case study explores the strategic motivations for an IPO, including gaining access to new funding sources and increasing visibility with suppliers and employees.
- The text highlights the trade-offs of going public, such as the loss of privacy and the risk of a culture shift versus the benefit of providing liquidity to existing shareholders.
- It addresses the conflict between the financial focus of minority shareholders and the long-term strategic approach of managing shareholders, citing Hermès as a successful reconciliation of both.
This highlights the conflict between the very financial approach of minority shareholders and a wider approach of managing shareholders.
The Strategic Logic of IPOs
- The transition to a public company often forces a shift from arbitrary dividend policies to more transparent, standardized payout ratios.
- IPOs conducted solely through the sale of existing shares by a parent company do not alter the subsidiary's balance sheet or income statement.
- Listing on a public exchange serves as a strategic tool for enhancing corporate visibility and securing diverse future funding sources.
- Parent companies may use partial IPOs to liquidate stakes for debt repayment or to pivot capital toward high-growth luxury divisions.
- The decision to go public is frequently influenced by the inability to find a single private buyer for a majority stake.
- Academic research suggests that IPO timing and pricing are heavily influenced by market liquidity and competitive product market dynamics.
Perhaps PPR was unable to find a buyer for a majority stake in CFAO or perhaps it wanted to retain exposure to CFAO’s value creation while at the same time cashing in part of its stake.
Value-Based Corporate Governance
- Corporate governance is examined through the lens of value creation rather than just legal compliance.
- The concept gained prominence following major financial scandals like Enron and WorldCom in the early 2000s.
- A shift from family-owned to widely held shareholding structures has increased the need for shareholder control over management.
- Governance encompasses the legal framework, management appointments, internal controls, and the rights of various stakeholders.
- The effectiveness of a governance system is measured by its ability to inspire investor confidence through efficiency, transparency, and ethics.
- Governance is not a one-size-fits-all model; it varies significantly based on a firm's nationality and specific shareholding structure.
There is only corporate governance that in practice inspires investors’ confidence (or not) in the way in which decisions are taken within the firm, based on whether the following five principles are respected: efficiency, responsibility, transpar-ency, fairness and ethics.
Foundations of Corporate Governance
- Company law defines the field of possibilities for corporate governance, with major legislation like the Sarbanes-Oxley Act reshaping management responsibility.
- Best practice codes and guidelines supplement legal frameworks, though they are often non-binding recommendations rather than strict laws.
- Governance priorities vary significantly by country, ranging from employee rights in Germany to the role of banks in Japan and cross-shareholdings in Italy.
- Transparency has increased dramatically over the last two decades, particularly regarding board operations and the previously taboo subject of executive compensation.
- The 'say on pay' mechanism allows shareholders to vote on management compensation, serving as either a consultative or binding check on corporate leadership.
- Financial incentives such as stock options are used to align the interests of managers with shareholders by linking personal gain to company share price.
Transparency surrounding the compensation of managers and directors is also recommended. For a long time, this was a taboo subject.
Management Compensation and Board Independence
- Stock options can inadvertently encourage short-termism and financial fraud, leading to the rise of alternative equity-based compensation.
- A significant portion of executive pay in Europe, ranging from one-third to three-quarters, is now directly linked to economic performance.
- Public disclosure of management share transactions is essential because these trades serve as critical signals to the market.
- The controversy surrounding 'golden parachutes' has led to recommendations that severance be capped and tied to forced departures or strategic shifts.
- Corporate governance codes increasingly mandate that boards maintain independence from management to define strategy effectively.
- The definition of an 'independent director' remains a point of contention, focusing on the absence of links that could compromise free will.
Stock options are not, however, a cure-all, as the short-term vision they encourage may sometimes tempt management to conceal certain facts when disclosing financial information and, in extreme cases, they may even consider committing fraud.
Evolving Board Dynamics and Governance
- The focus on director independence often overshadows more critical traits like competence, availability, and the courage to challenge management.
- Modern boards have shifted from an unrealistic mandate of 'running the company' to a more realistic role of strategic oversight and direction.
- The rise of specialized committees—such as audit, compensation, and risk—allows boards to produce higher quality oversight through focused reporting.
- Shareholder power is frequently undermined by dual-class share structures, such as those used by Google and Facebook, which decouple capital from voting rights.
- Governance can be improved by removing administrative barriers to voting and mandating participation from institutional shareholders.
The importance given to the need for independent directors on the board tends to overshadow the importance of other more vital matters, such as their competence, their availability and their courage when it comes to standing up to management.
Corporate Governance and Board Structures
- Corporate boards generally follow three organizational models: a one-tier structure with a combined CEO/Chairman, a dual structure with separate roles, or a two-tier supervisory and executive board system.
- While separating management and oversight roles is theoretically more effective for shareholder control, real-world success depends more on individual integrity and competence than structural design.
- Global practices vary significantly by country, with the USA and UK favoring one-tier structures while Germany and the Netherlands mandate two-tier systems with employee representation.
- The transition of a former CEO to the role of Chairman is a contentious issue; it is discouraged in the UK to protect the new CEO's autonomy but valued in France and Germany for institutional knowledge.
- Ultimately, the text argues that an outstanding manager with concentrated power is preferable to a poor manager who is strictly controlled by a separate board chair.
Even if extremely well controlled by the chairman of the board, a poor manager will remain a poor manager!
Foundations of Corporate Governance
- The debate over combining management and control functions remains open, requiring case-by-case assessment of shareholder structure and leadership personality.
- Corporate governance has evolved through the simplification of group structures, such as unwinding cross-holdings and listing only parent companies to protect minority shareholders.
- Agency theory serves as the primary intellectual foundation for governance, addressing the inherent power struggle between shareholders and managers.
- Governance systems aim to prevent managers from misappropriating revenues at the expense of creditors, employees, and society.
- Effective governance acts as a preventative measure against information asymmetry by ensuring transparency and structured financial communication.
The classic theory is of little or no help in understanding corporate governance. What it does is reduce the company to a black box, and draws no distinction between the interests of the different parties involved in the company.
Entrenchment and Governance Value
- Agency theory issues are minimal in small firms where management and ownership are unified, reducing information asymmetry.
- Entrenchment theory posits that managers may intentionally make themselves difficult and expensive to replace to secure their positions.
- Managerial entrenchment acts as a defensive reaction to strict corporate governance, often leading to increased discretionary authority.
- Institutional investors are willing to pay a significant premium for companies with strong governance, especially in emerging markets.
- Empirical studies indicate that high governance ratings correlate with superior stock performance on indices like the FTSE 300.
- Effective governance systems create the most value in legal environments where local laws provide weak investor protections.
Managerial entrenchment and corporate governance do not make good bedfellows.
The Power of Dominant Shareholders
- Companies with a major shareholder holding 30% to 50% of capital often outperform those with widely held shares.
- Dominant shareholders are highly motivated to succeed because the firm represents their primary professional tool and personal fortune.
- Family-owned firms like Bouygues demonstrated superior risk management by avoiding overpriced UMTS licenses during the Internet boom.
- Strong management motivation is a more reliable guarantee of shareholder value than a perfect system of corporate governance.
- While corporate governance reduces agency costs, there is little proven correlation between strict compliance and long-term financial performance.
- Corporate governance serves as a framework of common-sense rules to prevent inequitable treatment of minority shareholders.
The minority shareholders of France Télécom and Vivendi Universal probably wish that their managers had been a little less gung-ho!
Corporate Governance and Value
- Research indicates that robust corporate governance frameworks generally enhance firm value, particularly in large organizations.
- The impact of governance is most significant in countries with weak legal frameworks where internal oversight compensates for external regulatory gaps.
- Small firms often find the costs of sophisticated governance systems prohibitive and unnecessary due to the alignment of manager and shareholder roles.
- The text poses critical questions regarding the effectiveness of independent directors versus competent and courageous ones in preventing financial failure.
- The relationship between governance structures and the cost of capital remains a central inquiry in financial engineering.
- Case studies of major firms like Suez and Nestlé highlight the ongoing debate over one-tier versus two-tier board structures and CEO-chairman separation.
For small firms, the cost of introducing a sophisticated system of corporate governance can be prohibitive.
Principles of Corporate Governance
- Agency theory suggests that unlisted companies often face lower agency costs because shareholders are more closely aligned with management.
- Stock options can incentivize value creation but may also lead to risky behavior and a neglect of dividends if managers focus solely on option value.
- Effective corporate governance reduces the cost of capital by mitigating risks associated with poor management and fraud.
- The separation of control and management roles can lead to personal conflicts and increased administrative complexity.
- Board committees risk becoming isolated decision-making bodies rather than preparing the full board for informed collective action.
- Corporate governance is equally applicable to state-run companies to manage inherent conflicts of interest between the state and managers.
The position of director is not a just a fancy title, it’s a job like any other.
Corporate Governance Research Bibliography
- The text provides an extensive bibliography of academic research focusing on the mechanics of corporate governance and financial engineering.
- Key research areas include the relationship between managerial compensation, such as stock options, and firm performance within the S&P 500.
- Studies examine the composition of boards, specifically the roles of CEOs versus CFOs and the impact of 'independent' versus 'inside' directors.
- A significant portion of the literature explores how investor protection and legal environments influence corporate valuation across different countries.
- The section concludes by transitioning into the practical application of these theories in 'Taking Control of a Company' from an investment banking perspective.
Does the Rolodex Matter? Corporate Elite’s Small World and the Effectiveness of Boards of Directors
The Dynamics of M&A Waves
- Company valuations are subjective and depend on the specific expectations of synergies held by both the buyer and the seller.
- Successful negotiation involves finding an equilibrium where the seller receives a premium over standalone value and the buyer retains a portion of the anticipated synergy value.
- Mergers and acquisitions historically occur in waves, shifting from the conglomerate-building of the 1960s to the sector consolidation seen in the 1990s and 2010s.
- The method of payment—cash versus shares—often correlates with market valuations, with share-based deals predominating when corporate valuations are high.
- Market mispricing drives M&A activity, as overvalued companies use their stock as currency to acquire undervalued targets before market corrections occur.
It’s usually only in hindsight that we say we made a killing and that the party on the other side of the transaction was totally wrong!
Drivers of Corporate Consolidation
- Market conditions dictate payment methods, with cash being preferred during bearish periods to avoid share dilution and value loss.
- Technological innovation cycles typically lead to merger waves as start-ups seek the financial stability and scale of established groups.
- The shift from national to global market scopes forces companies to merge to achieve the critical mass necessary for international competition.
- Deregulation and privatization initiatives, particularly in Europe and the US, have catalyzed restructuring across the energy, transport, and telecom sectors.
- The transition from credit-based to market-based financial systems has empowered shareholders to demand higher returns, often triggering takeovers when performance lags.
- Stagnant organic growth in mature economies drives managers to seek mergers as a primary vehicle for finding new growth drivers.
The seller receives cold, hard cash which will not lose value as shares might, while the buyer is reluctant to issue new shares at prices he considers to be a discount to their intrinsic value.
The Mechanics of M&A
- Companies utilize acquisitions to achieve immediate economies of scale, reducing unit costs through increased production volume and R&D consolidation.
- Mergers facilitate rapid market expansion by leveraging geographic or product complementarity, such as combining regional presences or service palettes.
- Acquisitions serve as a strategic shortcut to bypass barriers to entry and secure first-mover advantages in fast-growing or maturing sectors.
- Increased corporate stature through merging allows firms to absorb the high financial and human risks inherent in global competition and intensive research.
- Human factors, including succession issues in family-owned businesses, frequently necessitate the sale of companies to ensure their survival.
- Despite potential benefits, roughly half of all mergers fail because synergies are overestimated while implementation costs and timelines are underestimated.
Approximately one out of two fail because the promised synergies never materialise.
Negotiating Corporate Acquisitions
- M&A success is heavily influenced by the quality and speed of the integration process rather than just the initial deal structure.
- Negotiation strategies must balance price objectives with non-financial goals such as employee safety, management control, and limited guarantees.
- The choice between private negotiations and auctions is context-dependent, as academic research suggests neither strategy is inherently superior.
- Private negotiations prioritize extreme confidentiality and psychological leverage, often managed by investment bankers to maintain secrecy.
- The Memorandum of Understanding (MOU) serves as a moral commitment that allows management to seek board approval before a legal contract is finalized.
- Despite various complex clauses and conditions, price remains the most critical parameter in the final stages of any negotiation.
The only absolute rule about negotiating strategies is that the negotiator must have a strategy.
Negotiating Company Acquisitions
- Memorandums of understanding can actually hinder progress if both parties are already firmly committed to the negotiation.
- Agreements in principle establish irrevocable commitments and specific terms, pending regulatory approvals.
- Financial sweeteners are often psychological tools used to bridge valuation gaps without changing the underlying value of the company.
- Techniques like earnout clauses and deferred payments allow buyers to manage risk while meeting the seller's symbolic price demands.
- Earnout provisions are particularly vital in service-based industries where retaining key personnel is essential for post-acquisition success.
Recognise that we are out of the realm of finance here and into the confines of psychology, and that this arrangement fools only those who want to be fooled.
The Corporate Auction Process
- Auctions utilize a structured, multi-phase schedule to foster competition among potential buyers and maximize the final sale price.
- The process begins with a 'teaser' and non-disclosure agreement, followed by an information memorandum and non-binding offers in Phase I.
- Phase II involves a short list of candidates who gain access to a restricted data room and management meetings before submitting binding offers.
- Sellers may grant exclusivity to a single bidder based on a pre-emptive offer, forcing a final decision within a set timeframe.
- The final selection depends not only on the financial bid but also on the buyer's specific markups to the Share Purchase Agreement.
- Auctions provide sellers with a faster timeline and a defensible paper trail to prove they obtained the highest possible market value.
Competition sometimes generates a price that is well in excess of expectations.
The M&A Auction Process
- The auction process for selling a company is highly sensitive to timing and requires sound financial health to prevent credibility loss if the deal fails.
- A typical M&A timeline spans three to five months, involving information memorandums, non-disclosure agreements, and due diligence phases.
- Sellers often find themselves in a position of weakness during final negotiations when only one buyer remains, making it difficult to walk away.
- Representations and warranties serve as a mechanism to secure the existence of assets and the absence of hidden liabilities rather than guaranteeing valuation.
- The first part of a 'reps & warranties' clause involves the seller certifying the legal registration and physical substance of the company's assets.
Should the negotiations fall apart at this stage, it could spell trouble for the seller because he would have to go back to the other potential buyers, hat in hand.
Warranties and Sale Finalization
- The seller provides representations and warranties regarding the company's financial health, tax status, and prudent management during the transitional period.
- Equity capital guarantees protect the buyer against pre-sale value decreases, often secured by holdbacks in escrow accounts or bank guarantees.
- Additional clauses may address executive roles, shareholder agreements, and the timing of audits to prevent deal-poisoning before an agreement is reached.
- Consummation of the deal is frequently delayed by regulatory hurdles, including competition commission approvals in Europe and the USA.
- A dual-track process allows a seller to simultaneously pursue a private sale and an IPO to maximize the final transaction price.
An audit often detects problems in the company, poisoning the atmosphere, and can serve as a pretext to abandoning the transaction.
Acquiring Listed Companies
- Negotiations for public companies must prioritize the transparent and equal treatment of minority shareholders to ensure market integrity.
- Acquirers often begin by 'stake-building' through open market purchases or financial derivatives like total return swaps to gain an initial foothold.
- Regulatory bodies enforce mandatory disclosure thresholds, often starting as low as 3%, to prevent investors from gaining control of a company in secret.
- Failure to disclose crossing a capital threshold typically results in the immediate loss of voting rights for the acquirer.
- Because open market accumulation is inefficient for full control, buyers eventually launch public takeover bids to all shareholders.
- Public offers are categorized by payment method (cash vs. shares), intent (hostile vs. recommended), and legal status (voluntary vs. mandatory).
Regulatory disclosure requirements allow minority shareholders to monitor stake-building and prevent an acquirer from getting control of a company little by little.
Financing and Dynamics of Takeovers
- The choice between cash and share-based financing signals whether a purchaser believes their own stock is currently undervalued or overvalued.
- Cash offers provide immediate psychological credibility and increase gearing, while share exchanges allow target shareholders to participate in future synergies.
- Accounting impacts like Earnings Per Share (EPS) growth depend on the relative P/E ratios of the companies and the after-tax cost of debt.
- Hostile takeovers often begin as unsolicited offers that only become 'recommended' after the bidder improves the terms or price.
- Approximately 15% of major corporate mergers, including those forming giants like Pfizer and BNP Paribas, originated from hostile bids.
If the board rejects the offer, it becomes hostile. This does not mean that the offer will not succeed but just that the bidder will have to fight management and the current board of directors during the offer period to convince shareholders.
Mandatory Offers and Market Certainty
- Mandatory offer rules require buyers crossing specific ownership thresholds to offer to buy out all remaining shareholders, though this is notably absent in US regulations.
- Mandatory offers generally face tighter constraints than voluntary ones, often requiring cash payments and limited conditional terms.
- Market regulations mandate that offers must be fully funded at launch, often backed by a bank guarantee, to prevent market disruption from failed financing.
- Offers are typically required to be unconditional, preventing bidders from using internal approvals as a way to withdraw from the deal.
- Market authorities act as gatekeepers to ensure transparency, equal treatment of shareholders, and the accuracy of offer documentation.
- While Material Adverse Change (MAC) clauses exist in some jurisdictions, they are rarely triggered and require extreme circumstances to be valid.
It should be noted that in the US, there is no mandatory offer and an acquirer can theoretically buy a majority of the capital of a listed company without having to launch an offer to the minority shareholders.
Defensive Strategies in Takeovers
- Companies facing secret market share accumulation generally have more defensive flexibility than those facing formal takeover bids.
- Secrecy in market purchases allows targets to invoke shareholder control mechanisms and recruit 'friendly' investors to inflate share prices.
- Formal takeover bids are strictly regulated, often requiring shareholder ratification for defensive measures in countries like the UK and Netherlands.
- Regulatory frameworks often suspend board proxies during offer periods to ensure shareholder equality and prevent market upheaval.
- Active defense options include finding a 'white knight' bidder, launching a counter-bid on the predator, or executing strategic capital increases.
- Information campaigns are a primary non-transactional defense, aiming to convince shareholders that future value exceeds the offered premium.
The reason behind this disparity is the secrecy surrounding shares bought up on the market compared with rules of equality and transparency applied to takeover bids.
Hostile Takeover Defense Strategies
- Defensive measures often require shareholder approval at an EGM, which can be difficult if hedge funds or investors seeking a takeover premium vote against them.
- The 'white knight' strategy involves finding a friendly bidder, though these rescuers can sometimes turn 'grey or black' once they successfully acquire the target.
- A Pac-Man defense, where the target attempts to buy the hostile bidder, triggers a communications war over which management team is better suited for the merged entity.
- Poison pill warrants serve as a powerful negotiation tool, often traded away by management in exchange for a higher offer price for shareholders.
- Legal action is frequently used as a tactical delay mechanism, buying management time while courts review claims of market regulation violations or insider trading.
Likewise, the “ white knight ” can sometimes turn grey or black when the rescue offer actually succeeds.
Takeover Defences and Global Regulations
- Anti-takeover measures typically result in higher offer prices rather than the total abandonment of a bid.
- Hostile bids often evolve into friendly mergers or lead to a loss of independence through 'white knight' interventions.
- The most effective corporate defence is maintaining a loyal shareholder base through strong financial performance and transparent communication.
- National regulations vary significantly regarding the threshold for mandatory bids, ranging from 15% in India to 33.3% in Switzerland.
- Most jurisdictions, including France, Germany, and the UK, allow for a 'squeeze-out' of minority shareholders once a buyer reaches a 90-95% ownership threshold.
- The United States is unique among the listed countries for having no specific regulatory threshold that triggers a mandatory bid for all remaining shares.
In our view, loyal shareholders can be the best defence.
European Directive on Public Offers
- The EU directive establishes core principles for cross-border takeovers, including equal treatment of shareholders and the requirement for secured financing before a bid announcement.
- Management of target companies is legally obligated to act in the company's interest and allow shareholders to make independent decisions regarding the bid.
- A mandatory takeover bid is triggered when a shareholder gains effective control, requiring them to offer to buy all remaining equity-linked securities.
- The floor price for mandatory bids is strictly regulated as the highest price paid by the acquirer in the 6 to 12 months preceding the offer.
- Anti-takeover defense regulations remain controversial and flexible, allowing member states to decide whether to ban 'poison pills' or suspend voting right restrictions during a bid.
- Post-takeover, multiple voting rights and restrictions typically vanish at the first general meeting if the bidder achieves a qualified majority.
Some countries feared that by limiting anti-takeover defences, Europe would be at a disadvantage to the US, which does allow such practices.
Mechanics of Corporate Control
- European directives establish 'squeeze-out' rights allowing majority shareholders to force the sale of minority stakes once a 90-95% threshold is reached.
- M&A activity is driven by a combination of macroeconomic shifts like globalization and microeconomic needs for scale and market entry.
- Negotiation strategies involve a trade-off between the confidentiality of private deals and the competitive pricing of private auctions.
- Standard deal components include memorandums of understanding, representations and warranties, and earnout clauses to mitigate buyer risk.
- Public takeovers of listed companies are governed by stock market watchdogs to ensure transparency and equal treatment of all shareholders.
The art of negotiation consists of allocating the value of the synergies expected from a merger or acquisition between the buyer and the seller.
M&A Mechanics and Strategy
- Private negotiations offer confidentiality but risk excluding potential candidates, whereas auctions create a competitive market at the cost of privacy.
- Minority shareholders benefit from public offers by gaining the right to sell shares at the same price as majority holders.
- Post-acquisition integration is identified as the critical factor for determining the long-term success of a merger or acquisition.
- Earnout clauses are essential in the service sector to mitigate risks associated with unpredictable human resource impacts following a deal.
- Representations and warranties protect against hidden liabilities but cannot guarantee the fairness of the purchase price.
- Investment banks primarily serve to manage information asymmetry between buyers and sellers during complex financial transactions.
The deal itself can have an unpredictable impact on human resources – the company’s main assets.
Corporate Control Bibliography
- This text provides a comprehensive bibliography of academic research focused on the mechanics and outcomes of corporate takeovers and mergers.
- Key themes include the 'hubris hypothesis' and the role of investor misvaluation in driving market-wide merger waves.
- Several citations explore the 'eat or be eaten' theory, suggesting firm size and survival are primary motivators for acquisition activity.
- The research addresses the 'post-merger performance puzzle,' questioning whether acquisitions actually create long-term value for shareholders.
- The list highlights the technical determinants of payment methods, such as the strategic choice between using stock or cash in cross-border deals.
Eat or be eaten: A theory of mergers and firm size, Journal of Finance , 64(3), 1291–1344, June 2009.
Mergers and Demergers
- The primary distinction in this chapter's analysis of mergers is the use of 100% share consideration rather than cash payments.
- A legal merger involves the absorption of one company by another, resulting in the acquired company ceasing to exist as a separate entity.
- Share contributions allow companies to remain separate legal entities while one becomes a subsidiary of the other through an exchange of stock.
- Modern market preferences for 'pure-play' companies have led to a resurgence in the popularity of demergers.
- The financial success of these deals hinges on resolving complex questions of valuation and power-sharing among the new entity's shareholders.
When the financial manager celebrates a wedding (or a divorce!)
Asset Transfers vs. Legal Mergers
- A transfer of assets involves Company B contributing its assets and liabilities to Company A in exchange for shares, rather than a direct merger of entities.
- The primary legal distinction lies in share ownership: in a merger, B's shareholders receive shares in A directly, whereas in an asset transfer, Company B itself becomes the shareholder of A.
- If Company B contributes all its assets, it transforms into a holding company that may exert control over Company A depending on the equity stake received.
- Despite these legal and structural differences, the economic outcome remains identical as the combined enterprise value and operating income do not change.
- Corporate restructurings frequently use asset transfers to move specific activities into subsidiaries or to facilitate strategic partnerships like the 2008 Vivendi/Activision deal.
The position of company B shareholders is therefore radically different, depending on whether the transaction is a legal merger or a simple transfer of assets.
Mechanics of Business Combinations
- The choice between cash and share-based acquisitions is arithmetically distinct but economically neutral unless synergies or market inefficiencies exist.
- Cash acquisitions do not increase a group's financial clout, whereas share exchanges create a combined entity with the pooled investment capacity of both firms.
- In a cash deal, selling shareholders exit with immediate value and zero risk, leaving the acquiring shareholders to bear all execution and synergy risks.
- All-share transactions distribute the risks and rewards of value creation or destruction between both sets of shareholders based on negotiated ownership percentages.
- The legal direction of a merger—who absorbs whom—is often less significant than the final percentage ownership held by the respective shareholder groups.
In a cash acquisition, selling shareholders pocket a portion of the value of synergies immediately; they do not bear any risk of implementation.
Mechanics of All-Share Transactions
- All-share acquisitions avoid cash outflows and are often structured to be tax-free since shareholders receive no liquid cash to pay capital gains taxes.
- Paying in shares allows companies to bypass financing constraints and merge with entities of equal or greater size.
- Management may use share-based deals strategically to dilute unwelcome shareholders or consolidate power through increased company size.
- The exchange ratio is determined by comparing per-share metrics like earnings, dividends, and share prices, or through full valuations for dissimilar companies.
- The relative value ratio is the ultimate determinant of the post-merger ownership structure and the distribution of power between the two sets of shareholders.
Some critics say that companies paying in shares are paying for their acquisitions with “funny money”; we think that depends on post-merger ownership structure and share liquidity.
Mechanics of Merger Dilution
- The exchange of shares in a merger is determined by a relative value ratio, which dictates how many new shares the acquiring company must issue to remunerate the target's shareholders.
- Post-merger financial metrics like sales, net income, and book equity are theoretically the sum of the two individual entities, though market value fluctuates based on investor sentiment.
- Dilution or accretion occurs when the agreed relative value ratio differs from the ratio of specific financial metrics such as book value or net income.
- Target shareholders may accept a dilution in book equity or net income in exchange for an accretion in market capitalization, often serving as a premium for loss of control.
- Earnings per share (EPS) and Price-to-Earnings (P/E) ratios are critical benchmarks for determining whether a share exchange is financially advantageous for the original shareholders.
It is likely to be a compensation for the loss of control of B shareholders who are now in a minority position in the new group.
Mechanics of Merger Synergies
- Earnings per share (EPS) automatically increase when an acquiring company with a high P/E ratio purchases a target with a lower P/E ratio.
- The valuation of synergies is a critical unknown, with potential multiples ranging from the acquirer's P/E to much lower market-adjusted figures.
- Investors typically value synergies at a lower multiple than either company because of the high managerial risk and historical failure rates of mergers.
- Market competition often forces merged entities to pass synergy-driven cost savings back to consumers, eroding long-term financial gains.
- Value creation in a merger is fundamentally derived from operational improvements like cost savings rather than purely financial engineering.
- The distribution of the 'synergy pie' between the two sets of shareholders is a primary subject of negotiation during the merger process.
Experience has shown that more than half of all mergers fail on this score; actual synergies are slower in coming; the amount of synergies is lower than originally announced.
The Bootstrap Game Dynamics
- The relative value ratio in a merger defines the negotiable range for synergy distribution between the two sets of shareholders.
- A successful merger premium must be high enough to win target shareholder approval but low enough to preserve value for the acquirer.
- The 'Bootstrap Game' occurs when a high P/E company acquires a lower P/E company, potentially causing a market rerating that increases the value for both parties.
- Acquirers with high share prices can use their 'highly valued paper' to fund acquisitions at a lower relative cost while boosting earnings per share.
- Long-term value creation depends on actual economic performance rather than the immediate accounting or P/E benefits of the transaction.
This model works only if company A keeps growing through acquisition, “kissing” larger and larger “sleeping beauties” and bringing them back to life.
Merger Direction and Demergers
- The direction of a merger is often dictated by administrative simplicity, such as a listed company absorbing an unlisted one to avoid complex share exchanges.
- Legal and psychological factors, including change-of-control clauses and the sentimental value of legacy brand names, influence which entity becomes the acquirer.
- Managerial power dynamics and the desire for EPS accretion frequently drive the decision of which company should technically lead the merger.
- Tax-loss carryforwards are a critical financial consideration, as the acquired company may lose these benefits depending on local jurisdiction and regulations.
- Demergers allow a group to split into distinct companies, distributing new shares to existing shareholders to provide them with greater investment flexibility.
There are others who wish to make a symbolic statement about where the power lies.
The Mechanics of Demergers
- Demergers occur through spin-offs, split-ups, or split-offs, often resulting in independent companies with initially identical shareholder bases.
- Market data suggests that demerged entities frequently outperform the market by eliminating the 'conglomerate discount' associated with diverse parent companies.
- Separating businesses reduces information asymmetry and allows specialized financial analysts to value 'pure-play' companies more accurately.
- Demergers increase corporate agility and motivation by removing suboptimal internal capital allocation and unnecessary conglomerate operating costs.
- The process makes smaller entities more attractive for takeovers, as acquirers no longer have to manage the risk of buying and then selling unwanted divisions.
- Lenders often view demergers as a risk due to increased cash flow volatility, leading to strict bond indentures that require debt renegotiation.
The market has trouble understanding conglomerates, a problem made worse by the fact that virtually all financial analysts are specialised by industry.
Mechanics of Mergers and Demergers
- Demergers and split-offs allow companies to separate unrelated business units, as seen in major examples like Cadbury and Dr Pepper.
- While demergers can unlock value, they risk liquidity discounts if the resulting entities are too small to attract sufficient investor interest.
- In emerging markets, large diversified conglomerates remain the dominant and successful model, contrasting with the Western trend of specialization.
- Modern financial theory suggests that groups containing unrelated businesses will eventually face pressure to split if they do not create synergistic value.
- Business combinations are primarily distinguished by their payment methods, involving either cash, shares, or a combination of both.
- All-share deals, including legal mergers and asset contributions, allow shareholders from both entities to share the ongoing risks and rewards of the new group.
If we wanted to be cynical, we might say that demergers represent the triumph of sloth (investors and analysts do not take time to understand complex groups) and selfishness (managers want to finance only the high-performance businesses).
Mechanics of Mergers and Demergers
- Mergers involve the mathematical addition of shareholders' equity, where the exchange ratio determines the relative power of each shareholder group in the new entity.
- A high P/E ratio allows an acquirer to increase its earnings per share (EPS) through share issuance, though this is often a mathematical artifact rather than immediate value creation.
- The 'magic kiss' effect occurs when a merged entity retains the high P/E ratio of the acquirer, implying the market believes the 'sleeping beauty' target has been revitalized.
- Value in a merger is primarily created through synergies, the distribution of which determines the premium paid to the target company's shareholders.
- Demergers serve as a strategic tool to eliminate the 'conglomerate discount' by spinning off far-flung divisions into independent, more focused companies.
- While demergers can increase managerial motivation and unlock trapped value, they also leave the newly independent companies more vulnerable to hostile takeovers.
We call this the “magic kiss” effect, because it implies that the company has only to “wake up” the “sleeping beauty” it has acquired.
Merger Mechanics and Value Creation
- The financial outcome of a merger is heavily dependent on the Price-to-Earnings (P/E) ratio of the acquiring company.
- A higher P/E ratio allows an acquirer to maintain greater control and achieve higher Earnings Per Share (EPS) post-merger.
- Value creation in mergers is primarily driven by operational synergies and the potential revaluation of the acquired entity's earnings.
- The exchange ratio and relative value are the critical levers for determining how power and wealth are distributed between the two sets of shareholders.
- Dilution of EPS is often a secondary concern compared to the fundamental question of whether the merger creates long-term value.
The higher a company’s P/E, the more it will get out of a merger.
Leveraged Buyouts and Corporate Restructuring
- Leveraged buyouts (LBOs) involve private equity funds acquiring companies primarily through debt financing.
- LBOs often drive operational improvements by aligning management incentives with high potential capital gains.
- The high debt burden creates significant pressure on management to optimize performance and pay down liabilities quickly.
- LBO success is frequently attributed to a unique corporate governance model that may outperform listed or family-owned structures.
- Academic research explores the nuances of corporate demergers, spin-offs, and the signaling effects of payment methods in M&A.
- The text questions whether financial investors create genuine value or if LBO success is sometimes a result of financial engineering.
Leverage on management! A leveraged buyout (LBO) is the acquisition of a company by one or several private equity funds who finance their purchase mainly by debt.
Mechanics of Leveraged Buyouts
- A Leveraged Buyout (LBO) involves creating a holding company to acquire a target company using significant debt and minimal equity.
- The debt incurred by the holding company is serviced and repaid using the cash flows generated by the target company's operations.
- LBOs result in a massive reduction of consolidated shareholders' equity, often replacing it with high-yield bonds and preference shares.
- The transaction structure allows for financial gearing and tax benefits, as dividends from the target to the holding company are often tax-free.
- LBOs are categorized by management involvement, including Management Buyouts (MBO), Management Buy-ins (MBI), and the hybrid BIMBO.
- Leveraged Build-ups (LBU) use the initial LBO as a platform to acquire further companies in the same sector to create industrial synergies.
Note that consolidated shareholders’ equity, on a revalued basis, is now 68% lower than it was prior to the LBO. An LBO leads to a massive destruction of equity.
LBO Structures and Exit Strategies
- Tax consolidation is a primary driver of LBO structures, allowing holding company debt costs to offset target company profits.
- When tax consolidation is restricted, firms may use a 'debt push down' via extraordinary dividends or share buy-backs to shift debt to the target.
- Financial investors typically maintain LBO investments for a short duration, usually between two and five years.
- Exit strategies include sales to trade buyers, initial public offerings (IPOs), or secondary LBOs involving other financial investors.
- Leveraged recapitalization serves as an alternative exit, where the target takes on new debt to pay dividends after initial debt reduction.
In other countries this is not the case, as the local tax administration argues it is contrary to the target’s interest to bear such a debt load.
LBO Dynamics and Target Selection
- LBO restructuring often involves debt-to-equity swaps or bankruptcy when cash flows fail to meet projections and shareholders refuse further investment.
- Successful exits for financial investors are facilitated by internal growth, cost-cutting, or strategic bolt-on acquisitions that increase company size.
- Ideal LBO targets are 'cash cows' with stable, predictable cash flows and low capital expenditure requirements to ensure debt serviceability.
- Sectors such as food, retail, and real estate are preferred due to their resilience against business cycle volatility and high barriers to entry.
- While some investors venture into high-growth or turnaround situations, market crises typically force a return to conservative, cash-flow-heavy targets.
The group’s LBO financing already packs a hefty financial risk, so the industrial risks had better be limited.
The Mechanics of LBOs
- Leveraged buyouts (LBOs) frequently serve as a succession solution for family-owned businesses reluctant to sell to competitors.
- Corporate divestitures and antitrust restrictions on trade buyers drive a significant portion of LBO activity in concentrated sectors.
- Secondary buyouts, where one private equity firm sells to another, now account for approximately 30% of all transactions.
- Public-to-private (P-to-P) deals allow undervalued listed companies to delist, though they carry high execution risks.
- Private equity sponsors demand high annual returns of 20-25% to compensate for the extreme risks associated with high gearing.
- LBO funds are structured to return capital to institutional investors upon liquidation, with partners earning 'carried interest' on gains.
Some sectors are so concentrated that only LBO funds can buy a target as the antitrust authorities would never allow a competitor to buy it.
LBO Debt Structures
- Small LBO transactions typically rely on a single bank lender, whereas larger deals involve complex pools of bankers and staple financing.
- The financial gearing of an LBO creates a four-tier hierarchy of repayment: senior debt, junior debt, mezzanine debt, and finally shareholders' equity.
- Senior debt is the primary layer of financing, usually totaling three to five times the target company's EBITDA.
- Senior debt is further divided into tranches A, B, and C, which vary in risk, interest rates, and repayment timelines ranging from six to nine years.
- Alternative financing methods like vendor loans and asset securitization are often employed to bridge the gap between debt and equity.
- The complexity of LBO financing reached its peak between 2005 and 2007 before many exotic financial products disappeared during the market downturn.
The high degree of financial gearing requires not only traditional bank financing, but also subordinated lending and mezzanine debt, which lie between traditional financing and shareholders’ equity.
LBO Debt Structures
- Senior debt serves as the primary LBO financing layer, typically priced at 400 to 600 basis points over short-term interest rates.
- The role of institutional investors and CDO funds in senior debt markets peaked in 2007 before significantly declining.
- High-yield bonds provide a liquid alternative for large-scale LBOs, offering bullet repayments and maturities up to ten years.
- Mezzanine debt acts as a hybrid instrument, combining cash interest, payment-in-kind (PIK) interest, and equity warrants.
- Mezzanine investors, or 'mezzaniners,' demand high returns near 15% and often require a seat on the board of directors.
- Subordinated debt layers allow companies to increase gearing beyond traditional bank limits and provide flexible cash flow upstreaming.
Given the associated risk, investors in mezzanine debt – “mezzaniners” – demand not only a high return, but also a say in management.
Evolution of LBO Financing Structures
- LBO financing has evolved to include complex securitization of entire operating cycles and receivables to fund buyouts.
- Small- and medium-sized deals often utilize unitranche debt, a hybrid instrument that simplifies the capital structure by sitting between senior and junior debt costs.
- Banks have developed highly inventive debt layers, including second lien debt and interim facility agreements, to bridge the gap between senior and mezzanine tranches.
- The 'equity bridge' represents a peak in financial risk-taking, where banks guarantee equity portions before syndicating them to other funds.
- Historical data shows a dramatic shift in leverage, with equity requirements dropping to 20% in 2007 before rebounding to 40-60% by 2014.
- The role of banks shifted from traditional lending to structuring and distributing debt through vehicles like CDOs and CLOs.
One would be hard pressed to find a more efficient way of increasing the risk of lenders!
LBO Management and Financing
- LBO financing ratios in Europe have fluctuated significantly, with debt-to-EBITDA ratios reaching over 6 times in specific high-profile acquisitions.
- Managers in an LBO are tasked with executing a business plan focused heavily on cash generation to service the acquisition debt.
- LBO funds require managers to invest significant personal capital, often through loans, to align their interests with the fund's success.
- The 'management package' offers a secondary leverage effect that can multiply personal investments five- to ten-fold if targets are met.
- While successful managers can eventually gain control of a company, failure of the business plan results in the total loss of their personal investment.
On the other hand, if the business plan fails, they will lose everything.
The Value Creation of LBOs
- Leveraged Buyouts (LBOs) often command higher purchase prices than trade buyers, despite trade buyers having potential industrial synergies.
- Tax savings from increased leverage are insufficient to explain LBO success when balanced against potential bankruptcy costs.
- Agency theory suggests that high debt levels act as a disciplinary tool, forcing management to maximize cash flow to meet debt obligations.
- The 'carrot-and-stick' approach combines the pressure of debt with equity incentives for managers to align their interests with shareholders.
- Empirical evidence shows LBOs often outperform peer companies in cash flow generation and return on capital employed.
- LBOs improve market fluidity by facilitating corporate restructuring and providing a more efficient governance model than many listed or family firms.
Management, motivated by a potentially big payoff and put under pressure by a heavy debt burden, will manage the company in the most efficient manner possible, increasing cash flows and hence the value of the company. It’s the carrot-and-stick approach!
Mechanics of Leveraged Buyouts
- A leveraged buyout (LBO) involves purchasing a company primarily through borrowed funds, using a holding company to funnel cash flow for debt repayment.
- LBOs serve as strategic solutions for family successions, corporate divestitures, or delisting undervalued public companies.
- The financial structure relies on tiered debt layers—senior, junior, and mezzanine—where lower priority correlates with higher risk and expected returns.
- Value creation in LBOs is driven less by tax shields and more by agency theory, where heavy debt burdens motivate management to optimize performance.
- LBO funds implement specialized governance policies that prioritize cash flow generation and value creation over traditional corporate or family management styles.
Instead, it appears that the heavier debt burden motivates management to do a better job managing the company, of which they are often destined to become shareholders themselves.
LBO Mechanics and Value Creation
- Leveraged Buyouts (LBOs) replace shareholders' equity with debt, creating a high-geared financial structure that increases both potential returns and financial risk.
- The success of an LBO relies on strong financial incentives for managers, the discipline of paying down debt, and regular strategic oversight from fund representatives.
- LBOs are unsuitable for start-ups due to volatile cash flows, and they typically operate under a meritocratic system rather than family-based governance.
- Exit strategies for LBO funds include Initial Public Offerings (IPOs), sales to trade buyers, secondary buyouts, or recapitalizations.
- The primary risks associated with LBOs involve business volatility, the high debt burden, and the inherent lack of liquidity in the investment.
- Academic research and bibliography suggest that LBO value creation is driven by improved operating performance and corporate governance shifts.
Meritocracy is the rule of the game, not being a member of the founding family.
Mechanisms of Corporate Bankruptcy
- Bankruptcy serves as a vital economic mechanism for reallocating production resources from inefficient firms to efficient ones.
- The root cause of financial distress is typically a lack of profitability due to poor strategy or high costs, rather than debt alone.
- Debt acts as an accelerator of financial failure, whereas a low-debt company might survive longer despite poor performance.
- Profitable companies can still face bankruptcy if they encounter liquidity crises or are unable to roll over short-term debt.
- Financial institutions use credit scoring and rating agencies to predict and avoid lending to companies at risk of liquidation.
A heavy debt burden does no more than accelerate financial difficulties.
Global Bankruptcy Systems
- Bankruptcy laws are among the least standardized legal mechanisms globally, with systems evolving rapidly and varying significantly by country.
- Procedures are generally categorized as either 'creditor-friendly,' focusing on liquidation and debt seniority, or 'debtor-friendly,' focusing on restructuring.
- Creditor-oriented systems, like that of the United Kingdom, aim to prevent financial distress by encouraging corporate self-discipline and increasing lender confidence.
- Debtor-oriented systems, such as Chapter 11 in the USA or French law, often allow management to remain in place to attempt a company turnaround.
- Key criteria for defining these procedures include whether management stays in place, if secured debts are excluded, and the level of voting power granted to creditors.
In such countries, firms exercise a kind of self-discipline and tend to keep their level of debt reasonable in order to avoid financial distress.
Bankruptcy Efficiency and Creditor Rights
- Research indicates that creditor-oriented bankruptcy processes are more efficient than debtor-friendly systems regarding recovery rates and costs.
- Lenders in the UK recover approximately 20% more on their claims compared to those in France due to more favorable legal frameworks.
- Mature financial markets experience higher bankruptcy rates because complex debt structures with multiple creditors make private restructuring difficult.
- The presence of Credit Default Swaps (CDS) can disincentivize lenders from restructuring, as they may recover more through a formal bankruptcy filing.
- Bank-based economies like Germany and France favor private restructuring over formal bankruptcy due to strong bilateral relationships between firms and banks.
This is especially true when a lender has already hedged itself though a credit default swap and will earn more from bankruptcy than in a reorganisation.
The Fall of Virgin Megastore
- Virgin Megastore France transitioned from a successful cultural flagship on the Champs-Élysées to a struggling entity under private equity ownership.
- The company's decline was driven by the rise of Amazon and the shift from physical media to digital formats.
- Despite attempts at restructuring and multiple takeover offers, the Commercial Court of Paris eventually ordered a total liquidation in 2013.
- Financial theory often views bankruptcy as a simple reallocation of assets, but real-world costs typically reach 4.5% of a company's value.
- The threat of bankruptcy serves as a crucial mechanism in signaling theory, making aggressive borrowing a credible sign of managerial confidence.
The incredible efficiency of Amazon, the ongoing development of digital music, books and videos at the expense of hardcopy formats and Virgin’s slow development on the digital market explain a situation that just could not be turned around.
Shareholder and Creditor Conflicts
- Creditors remain indifferent to shareholder decisions until a company approaches a financial precipice.
- Shareholders are incentivized to pursue high-risk projects near bankruptcy because they capture the upside while creditors bear the downside.
- Financial decisions in distressed firms often result in a zero-sum transfer of value between equity holders and debt holders.
- Reducing company risk through capital increases can paradoxically harm shareholders by transferring value to creditors.
- The free rider problem complicates debt restructuring when small lenders refuse to renegotiate terms alongside larger banks.
When the company is in good health, creditors are indifferent to shareholder decisions. But any decision that makes bankruptcy more likely, even if this decision is highly likely to create value overall for the company, will be perceived negatively by the creditors.
Dynamics of Corporate Restructuring
- Modern economies rely on limited liability, but gross negligence can force manager-shareholders to cover company debts with personal assets.
- Bankruptcy creates a fundamental conflict of timing: creditors favor rapid liquidation to preserve asset value, while managers and shareholders seek to delay it to maintain hope for a turnaround.
- Recovery rates in bankruptcy vary drastically by debt seniority, with senior creditors averaging 60% recovery compared to less than 25% for junior lenders.
- Restructuring is reserved for viable companies that require operational changes and a debt reduction to align with their actual cash flow capacity.
- Private workouts and Independent Business Reviews are critical tools for negotiating with diverse stakeholders to avoid the high costs of formal liquidation.
On the one hand, creditors want to accelerate the procedure and liquidate assets quickly, because the value of assets rapidly decreases when the company is “in the tank”.
Dynamics of Financial Restructuring
- Restructuring involves a complex recapitalisation process where existing or new shareholders provide funds to renegotiate and reschedule company debt.
- Shareholders and creditors face diverging interests, with shareholders seeking to minimize new equity injections while creditors weigh the risks of converting debt to equity.
- Legal systems often prioritize job preservation and company survival over creditor rights, complicating the power balance during negotiations.
- Clawback provisions and share warrants are frequently used as incentives to align the interests of creditors with the company's future profitability.
- Operational restructuring, including headcount reduction and asset sales, is essential for recovery but can trigger a 'vicious circle' if profitable assets are sold at fire-sale prices.
- The high-stakes nature of these negotiations often leads to dramatic, all-night sessions that only conclude when a hard deadline is reached.
This whole context explains that most restructuring negotiations finish in the early morning, after several all-night negotiating sessions, break-offs and unexpected dramatic turns in events.
Restructuring the Eurotunnel Debt
- Eurotunnel faced financial distress due to construction costs exceeding estimates by 80% and a debt-to-equity ratio of nearly 5 to 1.
- A new CEO appointed in 2005 utilized French bankruptcy law to protect the company while negotiating a massive reduction in debt obligations.
- The restructuring strategy involved playing senior and junior creditors against each other while ensuring shareholders didn't veto the deal.
- The final agreement converted €5.4bn of junior debt into equity and warrants, effectively making bondholders the new owners of the group.
- Senior debt was refinanced into a long-term €4.2bn loan with lower interest rates and a repayment schedule deferred until 2013.
- Post-restructuring, the market capitalization of the company nearly doubled and the value of the remaining debt stabilized near its face value.
The CEO stated repeatedly that he would not hesitate to declare Eurotunnel bankrupt, highlighting the fact that creditors, generally the most junior, would lose their entire investment in the process.
Bankruptcy and Financial Restructuring
- Bankruptcy is primarily triggered by a lack of profitability and liquidity rather than the absolute volume of debt, which only serves to accelerate financial distress.
- The Eurotunnel restructuring case demonstrates how senior creditors and shareholders can maintain or gain value while junior creditors often face significant losses due to weak negotiating positions.
- Global bankruptcy procedures vary significantly between 'creditor-friendly' and 'debtor-friendly' systems, yet all aim to balance liability repayment with social and industrial stability.
- Financial distress creates inherent agency conflicts between shareholders and creditors, as well as free-rider problems among different classes of creditors.
- The process incurs both direct legal costs and indirect costs, such as loss of credibility with suppliers and customers, which influence a firm's optimal capital structure.
This situation does not arise because the company has too much debt, but because it is not profitable enough.
Corporate Distress and Financial Engineering
- The Landmark car park case illustrates how economic volatility affects the distribution of cash flows between debt holders and shareholders.
- Investment decisions in distressed firms are complicated by the conflicting interests of creditors and equity holders regarding risk and financing.
- Alok Malpani and Sons represents a high-tech group in severe financial distress, characterized by negative net income and negative shareholders' equity.
- The proposed rescue plan for Alok Malpani involves a complex mix of capital increases, debt-to-equity conversions, and debt waivers.
- Financial engineering tools like warrants are utilized to incentivize senior creditors to accept losses in exchange for potential future upside.
- The exercises highlight that the ultimate beneficiaries of a restructuring plan depend on the valuation of new securities versus the face value of old debt.
Are conflicts that arise between shareholders and creditors a result of the way in which the company finances investments?
Bankruptcy and Restructuring Mechanics
- Bankruptcy costs directly reduce enterprise value, with higher debt levels increasing the present value of these costs.
- Legal frameworks in countries like France prioritize job preservation over long-term company viability during recovery plans.
- Companies in bankruptcy often experience temporary cash flow improvements because old debt repayments are frozen while customer payments continue.
- New lenders during restructuring require 'seniority' or higher ranking to ensure they are reimbursed before existing creditors.
- Managers typically exhibit a behavioral bias to postpone bankruptcy filings for as long as possible, often to the detriment of the firm's value.
- Asset disposals intended to meet immediate cash needs can inadvertently accelerate a company's plunge into bankruptcy if the most attractive assets are sold.
The disposal of the most attractive assets that became necessary to meet cash needs merely served to accelerate the group’s plunge into bankruptcy.
Managing Capital and Financial Risk
- The text transitions from a quantitative analysis of creditor and shareholder wealth post-restructuring to a comprehensive bibliography on corporate distress.
- A curated list of academic literature explores the costs of bankruptcy, comparing Chapter 7 liquidation with Chapter 11 reorganization.
- Research highlights how bankruptcy codes and debt enforcement vary significantly across different economic systems and international borders.
- The focus shifts to Section 5, which emphasizes that managing working capital and cash flows is a strategic necessity rather than a mundane task.
- Effective flow management serves as an early warning system for operational problems and is vital for a firm's survival in volatile markets.
Is it supply management or is it strategy? It’s finance, General!
The Dynamics of Working Capital
- Working capital functions as a commercial investment that facilitates business growth and customer acquisition.
- Customer and supplier credits represent a massive volume of commercial lending, exceeding short-term corporate bank loans threefold.
- Net debt and working capital often fluctuate in tandem, as evidenced by the global financial shifts of 2008 and 2009.
- Management of working capital varies significantly by sector, with industry and services facing distinct operational challenges.
- Reducing working capital is not always the optimal strategy, as high stock levels can prevent lost sales and maintain market equilibrium.
- Payment terms are culturally and geographically dependent, making rigid financial policies difficult to implement in certain markets like Italy.
Working capital is an investment, like any other, even if on occasion there is less choice involved (for example, when a customer “forgets” to pay by the due date and turns the supplier into its unwilling banker).
Dynamics of Working Capital
- Managing working capital is a timeless challenge centered on liquidity availability rather than just the cost of money.
- The risk of customer bankruptcy can trigger domino-like failures, leading to regulatory interventions like European payment period limits.
- Strategic support of suppliers during liquidity crises, such as the 2008 automotive bailouts, ensures supply chain continuity.
- Working capital levels are often a byproduct of strategic decisions like vertical integration or outsourcing to emerging markets.
- Financial arbitrage allows companies to trade higher working capital for better margins, such as paying cash for discounts.
This wasn’t a question of altruism, it was in Peugeot and Renault’s best interest, in order to avoid the bankruptcy of their suppliers, which would have threatened the continuity of their supplies.
Managing Working Capital Dynamics
- Companies can effectively 'buy cash' by offering discounts for early payment, though this strategy inevitably reduces profit margins.
- The priority of working capital management shifts based on the economic climate, with cash being 'king' during crises and growth taking precedence in good times.
- Structural improvements to working capital require organizational changes, such as linking sales commissions to actual payments rather than just orders.
- Operational efficiency measures, like eliminating slow-moving stock and preventing early supplier payments, offer easy ways to improve cash flow.
- Financial techniques like factoring or securitization can create a 'Potemkin village' effect, making working capital appear lower on balance sheets without truly reducing it.
- Working capital management is deeply influenced by corporate and regional culture, often shaped by past financial hardships or shareholder expectations.
But let’s not fool ourselves, working capital has not really been reduced, it has only been partly financed, and this part disappears from view in the same way that poverty is invisible in Potemkin villages.
Cultivating a Cash Culture
- Establishing a cash culture requires significant time, diplomacy, and the full support of general management to overhaul established practices.
- Engineering and R&D firms often struggle with cash sensitivity compared to firms led by managers with financial backgrounds.
- Setting too many competing objectives for division managers, such as growth and innovation alongside working capital reduction, can lead to total failure.
- A firm can be a market leader with high margins and returns while still maintaining poor working capital management.
- Managing receivables effectively involves negotiating terms, speeding up collections, and securing payments to avoid bad debts.
- The risk of payment default increases in direct proportion to the length of the payment period across different geographic regions.
If we set division managers multiple targets... and then we also ask them to reduce their working capital over and above the obvious waste that needs to be avoided, we are perhaps asking too much of them.
Managing Payment Terms and Delinquency
- Standard payment periods are dictated by company strategy, industry norms, and local customs.
- Exceptional payment terms offered by sales representatives must be balanced by higher prices or volumes to protect financial health.
- The EU Directive allows for significant late payment interest and penalties, though suppliers often hesitate to enforce them for fear of damaging relationships.
- Proactive communication, such as calling customers 15 to 30 days before a deadline, is the most effective way to ensure timely payment.
- Corrective measures for invoice errors should be handled immediately to remove any excuses for payment delays.
- Approximately 30% of large corporations with revenues over €300m fail to implement systematic payment reminder processes.
If this is not the case, then sales reps will have to go back on their word, which is never easy with a customer who has been allowed to slide into bad habits!
Managing Trade Receivables and Risk
- Effective working capital management requires identifying customers who use stalling tactics or have complex internal approval systems to delay payments.
- Establishing a rapid dispute settlement process is critical, as unpaid invoices often block new orders and 35% of groups lack a formal eradication process.
- Internal administrative efficiency, such as ensuring invoice accuracy and prompt issuance, is the most direct way to reduce payment delays.
- Companies should implement tiered credit limits to trigger solvency investigations or halt orders before a customer default causes bankruptcy.
- Proactive solvency checks on potential leads during sales prospecting can prevent future payment issues and identify higher-quality long-term customers.
As a defaulting customer can cause a company to go bankrupt, it is in the company’s best interests to protect its receivables from any risk in this regard.
Managing Credit and Receivables
- The credit manager balances customer risk assessment with sales optimization to manage trade receivables.
- Companies utilize collection firms or credit insurance to mitigate the impact of unpaid debts and insolvency.
- Credit insurance typically covers the entire customer portfolio to prevent adverse selection but requires an insurance excess of 10% to 30%.
- Alternative protection tools include bank guarantees, irrevocable documentary credits, and non-recourse factoring.
- Neglecting trade payables can lead to a company being blacklisted as a 'bad payer' by credit insurers, damaging its market reputation.
If a company pays after the contractual payment period and the supplier declares a default on payment to the insurance company, the company will be identified as a bad payer by the insurance company and this news will spread very quickly on the market.
Optimizing Working Capital Management
- Companies should centralize and align supplier payment periods to match the longest existing contractual terms.
- Discrepancies between contractual dates and actual payment practices often stem from administrative incompetence or early invoicing.
- Inefficient delivery validation procedures can trigger unnecessary new orders by making stock levels appear artificially low.
- Effective inventory management relies on accurate activity forecasting and the rapid transformation of raw materials into finished goods.
- Inventory is categorized into safety stocks for mitigating uncertainty and structural stocks linked to manufacturing cycles.
- The ultimate goal of payment management is to pay exactly on time, avoiding both late penalties and the loss of liquidity from early payments.
In the worst of cases, new orders will be triggered as the stocks in the system could appear to be abnormally low!
Strategic Inventory Management
- Companies like SEB and Carrefour have demonstrated that aggressive inventory reduction can cut stock levels by nearly 50% through logistics and IT improvements.
- Inventory management is a strategic trade-off between the financial cost of tied-up capital and the operational flexibility required to meet demand.
- Tactical waste reduction involves using the Wilson formula to balance ordering costs against storage risks and selling off dormant stock.
- Structural improvements include shifting production modes, optimizing factory locations, and simplifying product ranges to reduce unit stock variety.
- Effective working capital management requires cross-departmental collaboration between financial managers and operational leaders in sales, logistics, and production.
- Only 20% of companies currently link the variable remuneration of stock managers to performance-based inventory targets.
Inventories remain an investment which results from a play-off of financial cost versus the flexibility gained.
Managing Working Capital Dynamics
- Working capital is a strategic investment that requires a calculated trade-off between liquidity and profit margins.
- Reducing working capital often comes at the expense of EBIT or requires significant investment to modify the firm's economic model.
- During economic crises, firms prioritize cash generation through working capital reduction, whereas growth periods favor sales and margins.
- Effective management requires cross-departmental collaboration between financial managers and operational heads of logistics, production, and sales.
- Financial managers must utilize negotiation and teaching skills to influence operational policies over which they lack direct authority.
Working capital is the result of a play-off between liquidity and margins.
Working Capital and Financial Risk
- The choice between early payment discounts and extended credit terms serves as a critical signal of a client's liquidity and financial health.
- There is a direct correlation between the length of payment periods and the statistical probability of customer default.
- Working capital management is a cross-functional responsibility that extends beyond the duties of the financial manager.
- Companies facing debt covenant breaches may be tempted to manipulate financial reporting or operations at year-end to avoid restructuring.
- Vertical integration, whether upstream or downstream, typically results in an increase in a firm's working capital requirements.
- Mathematical modeling of sales, VAT, and collection times can quantify the specific cash flow impact of reducing payment periods.
What could a group be tempted to do if it fears that at the close of its financial year it will be unable to meet its debt covenants, resulting in the restructuring or possibly even the calling-in of this debt?
Managing Working Capital Dynamics
- Working capital management is a strategic endeavor involving trade-offs between commercial margins, production volume, and cash liquidity.
- Tightening working capital allows a firm to generate cash for debt reimbursement, which can significantly improve the internal rate of return for LBO funds.
- Late payments from customers are critical red flags that often signal underlying liquidity problems and a high risk of impending bankruptcy.
- Market reputation is highly sensitive to payment behavior, as credit insurers quickly disseminate information about 'bad payers' to other market participants.
- Effective cash flow management is not solely the responsibility of the finance department but requires coordination across marketing, logistics, and general management.
It takes a lot longer to start up a blast furnace than it does to start up a sewing machine!
Managing Cash Flows and Value Dates
- Cash flow management is the core treasury function, balancing inflows, outflows, and intra-group transfers.
- Modern treasury functions are largely automated, shifting the treasurer's role toward system design and supervision.
- A critical distinction exists between accounting balances, bank statements, and the treasurer's actual available cash.
- Value dating determines the specific point when funds begin or cease to accrue interest, which often differs from the transaction date.
- Effective cash management focuses on the periods when funds are truly available to maximize investment or minimize interest expense.
- The timing of customer bankruptcies often occurs just before payment, significantly increasing a company's financial risk exposure.
A 2-month payment period means 3 months of invoices, as customers generally go bankrupt just before a payment is due and not just after they have paid.
Value Dates and Account Balancing
- Value dates create a discrepancy between accounting balances and actual interest-bearing balances, often resulting in hidden costs for companies.
- Banks use value dates as a mechanism to charge for services by delaying credit availability and accelerating debit obligations.
- Standard bank current accounts are inefficient for long-term management due to high overdraft costs and negligible interest on credit balances.
- The treasury function's primary goal is to eliminate the simultaneous existence of debit and credit balances across multiple accounts.
- Modern cash management involves pooling surpluses into concentration accounts to automatically offset debits and optimize liquidity.
The company will therefore incur interest expense, even though its financial statements show a credit balance.
Banking Dynamics and Cash Budgeting
- Banks analyze customer return on equity by balancing unprofitable services against high-margin transactions.
- The industry is shifting toward fee-based models for administrative costs while linking interest rates to market benchmarks.
- The European Central Bank is challenging traditional 'value dates' to modernize and computerize transfers across the eurozone.
- Cash budgeting serves as a forward-looking tool to identify future liquidity surpluses and deficits.
- Effective cash forecasting allows treasurers to negotiate better loan rates and optimize investment returns by planning months in advance.
- Strategic liquidity management enables companies to leverage competition between banks and financial market investors.
It is easy to see that a better rate loan can be negotiated if the need is forecast several months in advance.
Stages of Cash Forecasting
- Annual cash budgets translate expected profit and loss accounts into material cash flow categories at the start of the year.
- Rolling cash budgets refine annual projections over one-to-six-month periods using actual inflow and outflow data.
- Day-to-day forecasting is the most precise stage, requiring analysis of individual bank accounts on a value date basis.
- Treasurers utilize differences in payment methods and value dates to manage liquidity and assess operational effectiveness.
- Modern IT and ERP systems have streamlined forecasting by processing business-wide information into instantaneous disbursement data.
- Uncertainties in forecasting often stem from the timing of receipts, such as delays between cheque collection and bank processing.
This is the basic task of all treasurers and the basis on which their effectiveness is assessed.
Optimizing Cash Flow Management
- Forecasting cash disbursements is difficult because the timing of creditor collections is often outside the debtor's control.
- Payment methods are most effective for cash budgeting when one party holds the initiative for both setting up and triggering the transfer.
- Cheques present the greatest challenge to treasurers due to unpredictable postal delays and varying creditor processing times.
- Large companies mitigate uncertainty by negotiating specific value dates with banks and monitoring the collection habits of major creditors.
- Inefficient collection of bills and notes can force debtors to freeze funds in non-interest-bearing accounts, creating an opportunity cost.
- Electronic payment methods generally offer higher utility for cash budgeting compared to paper-based instruments like cheques or promissory notes.
From this standpoint, establishing the actual date on which cheques will be paid represents the major problem facing treasurers.
Optimising Cash Management Strategies
- Treasurers must develop statistical rules to predict the collection habits of suppliers and the payment behaviors of customers.
- Different payment methods offer varying levels of flexibility regarding which bank accounts can be credited or debited.
- The lack of flexibility in standing orders and transfers complicates the process of balancing corporate accounts.
- Treasurers must meticulously manage account balances based on specific value dates associated with different payment tools.
- The implementation of the Single Euro Payment Area (SEPA) has harmonized cross-border transfers and debits within the eurozone.
- Despite SEPA, European countries maintain distinct historical preferences for specific payment tools like cheques or cards.
Each country has its own history and payment habits in Europe; these are far from being unified.
Optimizing Cash Management Techniques
- The concept of 'zero cash' represents the ideal state for corporate treasurers to minimize interest expenses, though it is never fully achievable due to unpredictable movements.
- Behavioral analysis of payment habits allows companies to calculate statistical averages for collection times and manage account balances with a strategic delay.
- Intercompany agreements and early payment discounts can reduce short-term borrowing costs, though enforcing penalties for non-compliance remains a commercial challenge.
- Lockbox systems accelerate the clearing process by having banks collect payments directly from PO boxes, bypassing the creditor's internal accounting delays.
- Systematic verification of complex bank charges and value dates is a critical treasurer responsibility to ensure financial accuracy and minimize transaction costs.
Our survey of account balancing naturally leads us to the concept of zero cash, the nirvana of corporate treasurers, which keeps interest expense down to a minimum.
Group Cash Pooling Strategies
- Reconciling bank documents with internal systems is essential to catch errors where standard terms are applied instead of negotiated ones.
- Group cash management functions as an additional layer of data processing that mirrors the principles used for individual SMEs.
- Centralized cash management, or cash pooling, creates an internal money market that offsets the liquidity needs of various subsidiaries.
- Pooling allows a group to capture the borrowing-lending margin that would otherwise be paid to financial institutions as profit.
- Centralization provides smaller subsidiaries with access to superior financing and investment terms typically reserved for large-scale market players.
The group will thus save on all the additional costs deriving from the inefficiencies of the financial markets (bank charges, brokerage fees, differences between lending and borrowing rates, etc.).
Economics of Cash Pooling
- Cash pooling generates genuine 'industrial' economies of scale by reducing redundant administrative costs and pooling hardware and software investments.
- Financial economies of scale are often illusory, as financing costs in a market economy are determined by risk levels rather than the sheer size of the entity.
- Centralization requires a robust real-time information system between the parent company and subsidiaries to ensure efficient fund movements.
- High levels of centralization can demotivate local managers and lead to missed opportunities for competitive local borrowing or specialized behavioral analysis.
- The most common form of pooling involves the centralization of balances and liquidity to manage group-wide cash from a single point.
Cash pooling may create a mass effect, leading certain banks concerned solely with their market share to overlook the link between risk and profitability!
Centralized Cash Management Strategies
- Hypercentralization occurs when a group's central department manages all incoming payments and disbursements, reducing subsidiaries to forecasting roles.
- Notional pooling allows groups to calculate interest based on a fictitious consolidated balance without physically transferring funds between accounts.
- Zero Balance Accounts (ZBA) involve daily automated balancing of subsidiary positions into a central concentration account.
- The choice between pooling methods is driven by managerial culture, local tax regulations, and the specific costs of banking services.
- While notional pooling offers flexibility and subsidiary independence, it creates complex legal networks and reciprocal guarantees that are difficult to manage.
This type of organisation may be described as hypercentralised.
Global Cash Management Strategies
- Multinational groups often utilize a two-tier pooling system involving local concentration banks and international overlay banks to navigate regulatory hurdles.
- The eurozone's interconnected payment systems allow for real-time, low-cost fund transfers, simplifying cross-border cash pooling.
- Payment factories are increasingly used to centralize supplier payments, reducing the total number of transactions for subsidiaries with shared vendors.
- Treasurers of financially distressed groups prioritize securing financing and liquidity over the optimization of financial expenses.
- Distressed firms may intentionally maximize short-term debt to ensure access to funds before credit lines are potentially cut off by banks.
- Maintaining excess cash through short-term investments acts as a form of insurance against liquidity risk for companies in difficulty.
When the going gets tough, the group will be able to draw on all of its credit lines, as long as it is still meeting its financial covenants, and place the funds in short-term investments.
Corporate Cash Management Strategies
- Companies often retain cash rather than paying down debt to avoid early repayment penalties and to maintain flexibility for future investments.
- The corporate treasurer's primary objective is not to maximize profit through risky speculation but to manage liquidity and security.
- Liquidity is the most critical factor in corporate investment, as treasurers must be able to convert assets back to cash quickly to meet unforeseen needs.
- Security of principal and interest is closely linked to liquidity, as exiting an investment early can lead to capital losses or prohibitive costs.
- Investment choices involve a trade-off between return, tax implications, and the ability to exit the position before maturity.
- Basic investment vehicles like interest-bearing current accounts and time deposits offer simplicity but often yield lower returns than the money market.
The corporate treasurer’s role in investing the company’s cash is nevertheless somewhat specific because the purpose of the company is not to make profits by engaging in risky financial investments.
Short-Term Investment Instruments
- Repurchase agreements (repos) allow entities to exchange securities for cash with a guaranteed buy-back, serving as a flexible alternative to time deposits.
- While repos were traditionally reserved for transactions exceeding €2m, money market mutual funds have lowered this threshold for smaller companies.
- Securities lending enables firms to improve yields by lending instruments to institutional investors for a fee without an initial exchange of cash.
- Treasury bills and notes offer the highest level of security and liquidity, though they are often less flexible than private market instruments.
- Certificates of deposit (CDs) provide a negotiable alternative to time deposits, allowing for secondary market trading to avoid early withdrawal penalties.
The only risk is that the borrower of the cash (the repo seller) will default.
Cash Management and Investment Vehicles
- Money-market mutual funds offer returns similar to the money market through daily appreciation in net asset value.
- The 2007 subprime crisis highlighted that 'dynamic' money-market funds seeking higher returns often carry significant hidden risks.
- Direct bond and equity investments require high technical expertise and constant monitoring due to significant capital risk and market volatility.
- Technological advancements are driving the centralization of corporate cash management, including trade payables and receivables.
- Treasurers must balance the trade-off between steady, regular progression in asset value and the pursuit of higher profitability.
The subprime crisis was a healthy (but costly!) reminder for some treasurers that an increase in return cannot be obtained without an increase in risk.
Modern Cash Management Strategies
- Companies are increasingly divided between viewing cash management as a strategic asset or a complex administrative risk.
- There is a growing trend toward centralizing cash management functions within large corporate groups.
- Outsourcing cash management to banks or specialized consulting firms has become a viable alternative for many organizations.
- The internet has democratized efficient international cash management systems for small and medium-sized enterprises.
- The core responsibilities of a treasurer include forecasting balances, minimizing dormant funds, and optimizing excess cash investment.
Some groups view cash management as a strategic function. Others see it as a complex administrative function that generates additional risks.
Corporate Cash Management Essentials
- Treasurers prioritize liquidity and security over yield when managing cash surpluses to ensure funds are available for borrowing requirements.
- Effective cash budgeting requires accounting for value dating, which is the specific date funds begin accruing interest or become available.
- Account balancing and cash pooling centralize subsidiary balances to minimize the spread between borrowing and investment rates.
- International cash pooling faces regulatory hurdles, often requiring a two-tier structure involving local banks and international banking groups.
- Investment options for excess cash are categorized by their liquidity in secondary markets, such as Treasury bills versus time deposits.
- Optimized management involves accelerating collections while extending supplier payment deadlines to maximize internal liquidity.
The value date is the date from which a credited amount accrues interest when paid into an interest-bearing account or becomes available when paid into a demand account.
Managing Cash and Financial Risks
- Corporate cash management focuses on reducing dormant funds and optimizing the costs of financing, investing, and risk management.
- Cash pooling and value dating are essential tools for balancing positions, though they can lead to lower accountability for subsidiaries.
- The 2008 financial crisis highlighted the dangers of underestimated risk in complex investments like CPDOs, which saw values plummet to 40%–75% of face value.
- Firms are cautioned against chasing higher returns by investing in lower-quality counterparts or longer-maturity securities that mask underlying liquidity risks.
- Increasing market volatility in exchange rates, interest rates, and raw materials has necessitated stricter regulatory frameworks and risk audit committees.
- Modern financial governance emphasizes transparency and the reinforcement of directorial power to manage systemic risks effectively.
It was either a fabulous arbitrage opportunity or an investment with a higher risk than apparent.
Foundations of Risk Management
- Risk is defined by two primary features: the intensity of potential loss and the frequency or probability of its occurrence.
- Financial risks are categorized into four types: market changes, recurrent statistical costs, volatility risks from exceptional events, and rare but catastrophic disaster risks.
- The risk management process begins with identification and mapping to determine the specific intensity and probability of various threats.
- Internal controls and prevention strategies act as a primary filter to mitigate risks at a low cost before seeking external insurance.
- Residual risk is the remaining exposure after internal controls are applied, which then dictates the final management and hedging strategy.
A disaster risk materialises once a century (for example, the explosion at the BP oil refinery in the Gulf of Mexico) but it can have a very high level of intensity.
The Strategy of Risk Management
- Managers must weigh the internal costs of managing risk against the market costs of hedging tools, often finding that a combination of options is the most effective solution.
- Corporate image and accounting standards, such as IAS 39, can influence hedging decisions by prioritizing public perception or income statement stability over pure economic logic.
- While efficient market theory suggests hedging diversified risks does not create value for investors, agency theory argues it protects managers and enables long-term strategic planning.
- Empirical evidence indicates that hedging reduces the cost of debt and prevents the erosion of enterprise value caused by cash flow volatility.
- Financial risks are categorized into four primary types: market risk, counterparty or credit risk, liquidity risk, and operating risks.
Even if the hedging decision does not create value, a company that is less exposed to the ups and downs of the market is, from a manager’s point of view, in a more comfortable position.
Operational and Financial Risk Management
- Operational risks encompass industrial accidents, technological obsolescence, and environmental or climate-related disruptions.
- Political and regulatory risks can fundamentally alter a company's competitive landscape or entire business model.
- Financial risk measurement varies in sophistication, with market risk tools like Value at Risk (VaR) being the most advanced.
- Market risk is defined by an operator's 'position,' where being 'long' risks a price drop and being 'short' risks a price increase.
- Unlike banks that actively trade positions, industrial companies often inherit market positions naturally through their commercial and financial activities.
At a given moment, a trader could even have a position that runs counter to his expectations.
Managing Corporate Financial Risks
- Currency risk is categorized into commercial, financial, and accounting positions based on business operations and asset holdings.
- Commercial currency risk involves the mismatch between revenue and cost currencies, which can create structural vulnerabilities against competitors.
- Financial currency risk arises from holding liabilities or assets, such as loans and investments, denominated in foreign currencies.
- Accounting currency risk stems from consolidating foreign subsidiaries and affects equity and translation differentials rather than net income.
- Interest rate risk varies between floating-rate exposure to rising benchmarks and fixed-rate exposure to opportunity costs during rate cuts.
- Beyond currencies and rates, companies must manage market-related risks for raw materials like oil, coffee, and semiconductors.
The group cannot hedge against possible losses several years in advance on sales that it has not yet made!
Measuring and Managing Financial Risks
- Value at Risk (VaR) quantifies the maximum potential loss of a portfolio within a specific timeframe and confidence interval based on historical data.
- A significant limitation of VaR is its reliance on normal distribution laws, which often underestimates the frequency of extreme market events.
- To address VaR's blind spots regarding catastrophic losses, firms utilize stress tests and expected shortfall calculations to model worst-case scenarios.
- Liquidity risk is assessed by comparing debt maturities against cash flow, with a warning that covenant breaches can accelerate repayment timelines.
- Financial risk management strategies generally fall into four categories: self-hedging, locking in prices, purchasing insurance, or immediate asset disposal.
VaR tells us absolutely nothing about the potential loss that could occur when stepping outside the confidence interval.
The Mechanics of Self-Hedging
- Self-hedging involves a company deliberately choosing to retain risk rather than transferring it to a third party, effectively treating risk as a predictable cost.
- This strategy is primarily viable for large corporations that can rely on the law of averages to manage regular negative events like devaluations or bankruptcies.
- Natural hedges, such as matching the currency of production costs and debt to the currency of sales, can diminish but not entirely eliminate risk.
- Captive insurance companies allow firms to act as their own insurers, collecting premiums and accessing the reinsurance market directly.
- Captive schemes offer advantages including tailor-made policies, tax optimization, and independence from the cyclical nature of the traditional insurance market.
- The approach addresses shortcomings in traditional insurance, such as limited coverage for specific risks like asbestos or gradual pollution.
Self-hedging is a strategy adopted by either irresponsible companies or a limited number of very large companies who serve as their own insurance company!
Risk Transfer and Forward Transactions
- Reinsurance allows primary insurers to transfer risk to secondary companies, while alternative risk financing products have been largely curtailed by IFRS standards.
- Forward transactions eliminate financial risk by locking in future prices or rates today, preventing both losses and potential gains from market shifts.
- These transactions allow entities to sell assets they do not yet possess or buy products before they are available, grounded in economic reality rather than abstraction.
- A forward transaction can be mathematically decomposed into spot selling or purchasing, borrowing, and lending operations.
- The forward exchange rate is determined by the spot price and the interest rate differential between two currencies, often resulting in 'swap points'.
- In currency markets, if the interest rate of the foreign currency is higher than the benchmark, the forward rate will be lower than the spot rate.
Forward transactions sometimes defy conventional logic, as they allow one to “sell” what one does not yet possess or to “buy” a product before it is available.
Currency Forwards and Interest Hedging
- Currency discounts and premiums are determined by the interest rate differentials between two currencies over a specific period.
- A forward contract locks in a specific exchange rate, providing certainty but creating an opportunity cost if market rates move favorably later.
- Treasurers can hedge future borrowing needs by calculating forward-forward rates based on the current yield curve.
- Hedging through simultaneous borrowing and reinvesting allows a firm to lock in future rates but incurs intermediation costs.
- The forward-forward rate represents the implied interest rate for a future period, such as a six-month loan starting in three months.
For example, if a treasurer sold his €100m forward at $1.5147, and the euro is trading at $1.5500 dollars at maturity, he will have to keep his word and bear an opportunity cost.
Forward Rate Agreements and Swaps
- A Forward Rate Agreement (FRA) allows a treasurer to lock in a future interest rate without actually borrowing or lending the principal amount.
- The 'notional amount' serves as a theoretical benchmark for calculating interest differentials and is never physically exchanged between parties.
- FRAs effectively hedge against rate fluctuations by ensuring the company pays or receives the difference between the market rate and a guaranteed rate.
- While FRAs are technically free of charge, banks profit through a margin between the buying and selling rates offered to companies.
- Interest rate swaps (IRS) function as a broader exchange of financial flows, allowing companies to convert fixed-rate debt into floating-rate debt or vice versa.
- These financial instruments enable companies to manage risk and alter their debt profiles without their original lenders seeing any change in the underlying debt.
The notional amount is the theoretical amount to which the difference between the guaranteed rate and the floating rate is applied.
Mechanics of Financial Swaps
- Financial flows are traded over the counter without impacting the balance sheet, allowing parties to modify interest or exchange rate terms.
- Interest rate swaps function as long-term portfolios of Forward Rate Agreements, typically ranging from one to 15 years without an exchange of principal.
- Currency swaps differ from standard interest rate swaps because they generally involve an exchange of principal at both the beginning and maturity of the contract.
- The flexibility of swaps allows corporate treasurers to customize duration, benchmark rates, and notional amounts to manage long-term exposure.
- Asset and debt swaps emerged as a solution for managing sovereign risk, preventing excessive debt concentration on a single debtor through credit ratings.
- Total return swaps expand the concept by allowing players to exchange the revenues and value changes of diverse assets like share indices or bond portfolios.
Unlike financial assets, financial flows are traded over the counter with no impact on the balance sheet, and allow the parties to modify the exchange or interest rate terms.
Insurance and Currency Options
- Insurance functions conceptually as an option where the premium paid represents the cost of transferring risk to a third party.
- Options provide company treasurers with a guaranteed price floor or ceiling while allowing them to benefit from favorable market movements.
- The cost of option premiums can be prohibitive, especially for businesses operating with low profit margins.
- Currency options allow firms to lock in exchange rates while retaining the right to use spot market rates if they are more advantageous.
- Over-the-counter options are often preferred over standardized contracts because they offer greater flexibility in amounts, dates, and strike prices.
- High premium costs have led to the development of complex and risky derivative products like lookback and barrier options.
But, as our reader has learned, there are no miracles in finance and the option premium is the price of this freedom.
Exotic Currency Options
- Asian options use average exchange rates to lower premiums and reduce risk for both parties.
- Lookback options eliminate opportunity costs by fixing the strike price at the asset's historical peak or trough.
- Options on options provide a low-cost hedging mechanism for companies bidding on foreign projects with uncertain outcomes.
- Barrier options activate or deactivate based on price limits, offering cheaper premiums but requiring active management.
- Complex financial products with 'staircase' profiles are often constructed by combining multiple barrier options.
- Treasurers using barrier options face significant operational risks if they fail to rehedge after a knock-out event.
If the company is not chosen for the bid, it simply gives up its option on the option.
Interest Rate Option Structures
- Interest rate options like caps and floors function as ceilings and floors for borrowing and lending rates, respectively.
- A collar or rate tunnel combines a cap and a floor to create a fluctuation zone, effectively reducing hedging costs through the sale of an option.
- Swaptions provide the right to enter into a swap agreement, with premiums often embedded into the swap rate rather than paid upfront.
- Barrier interest rate options offer lower premiums by only activating or deactivating if a specific benchmark rate is reached.
- Financial instruments like confirmed credit lines and credit insurance act as implicit options against liquidity and default risks.
Do not be too impressed by the lack of cost. This product is none other than a swap combined with an option to sell a swap.
Credit Derivatives and Market Structures
- Credit derivatives allow entities to decouple credit risk management from the actual ownership of assets or liabilities.
- Credit Default Swaps (CDS) function as insurance-like contracts where protection buyers pay premiums to transfer default risk to third parties.
- Beyond insurance, forward-type derivatives allow companies to lock in bond spreads for future issuances, hedging against margin volatility.
- While financial institutions dominate the market, industrial groups use these tools to manage client concentration and political risks.
- The transition from over-the-counter (OTC) transactions to organized markets addresses issues of counterparty risk and low liquidity through standardization.
We thus end up with an insurance product called an option on future spreads!
Futures Markets and Liquidity
- Specialized traders act as intermediaries to ensure the proper functioning and efficiency of futures markets.
- High standardization of futures contracts ensures fungibility and provides greater liquidity than the underlying assets.
- Major global exchanges like Eurex and CME dominate the trading of interest rate and commodity price contracts.
- Standardized options have emerged alongside liquid futures, allowing firms to hedge against price volatility.
- Currency risk management markets remain underdeveloped due to the historical dominance of banks in forward transactions.
Liquidity is often greater on futures than on the underlying asset, as, unlike the underlying assets, futures volumes are not limited by the amount actually in issue.
Futures Delivery and Arbitrage
- The mechanism of physical delivery ensures that futures contract prices remain tethered to the actual value of the underlying asset at maturity.
- Arbitrage trading forces the convergence of spot and futures prices, as investors would exploit any price discrepancies for immediate profit.
- In practice, over 95% of futures contracts are unwound through offsetting trades rather than physical delivery to avoid logistical costs.
- The theoretical possibility of delivery acts as a self-regulating market force even when physical exchange rarely occurs.
- Counterparty risk remains a critical concern, where one party may default on their commitment due to financial distress or extreme losses.
In reality, in more than 95% of cases, no underlying asset is delivered, as this would be costly and administratively complicated.
Clearing Houses and Leverage
- Counterparty risk is the primary market risk, but it is mitigated by clearing houses that act as the sole counterparty for all buyers and sellers.
- Clearing houses utilize initial deposits and daily margin calls to ensure all market operators can honor their financial obligations.
- The mechanism of daily debits and credits ensures that an operator's account remains positive, covering potential losses in real-time.
- Low initial deposits create a powerful leverage effect, allowing for returns that far exceed the percentage movement of the underlying asset.
- While leverage can lead to massive gains, it also creates systemic risks where losses can escalate beyond an operator's immediate liquidity.
- Despite the extreme volatility of financial crises, clearing houses have historically remained resilient and are being expanded to over-the-counter products.
The buyer is not buying from the seller, but from the clearing house. The seller is not selling to the buyer, but to the clearing house.
The Mechanics of Derivatives
- Futures markets operate as a zero-sum game where one operator's profit is exactly offset by another's loss.
- The primary purpose of derivatives is not wealth creation but the distribution of risk and enhancement of market liquidity.
- Leverage is an inherent characteristic of derivative products rather than a specific feature of organized exchanges.
- Clearing houses act as vital safeguards by ensuring market players can meet their financial obligations, preventing systemic chain reactions.
- Regulatory authorities are pushing for more derivatives to be handled by clearing houses to mitigate counterparty risk following the 2008 financial crisis.
- Over-the-counter markets remain significantly larger than organized exchanges, largely due to the prevalence of interest rate swaps.
A zero-sum game, not a senseless game. This is not only a zero-sum game but also a worthwhile game.
Managing Corporate Financial Risks
- Risk management has become a priority due to stricter regulations and investor demands for transparency.
- The five primary risks identified are market, counterparty, liquidity, operating, and political risks.
- Market risk is measured through position and Value at Risk (VaR), while liquidity is assessed by comparing debt repayments to cash receipts.
- Companies can respond to risk by self-hedging, locking in prices via forwardation, purchasing insurance/options, or disposing of risky assets.
- Hedging occurs on OTC markets for customization or stock exchanges for reduced counterparty risk.
- Techniques for measuring operating and political risks are still in their infancy compared to market risk metrics.
Risk management requires identification of risks, setting up controls, measuring the residual risk and lastly choosing a hedging strategy.
Financial Risk and Derivatives Exercises
- The text presents a series of technical questions and answers regarding international trade hedging, currency options, and futures contracts.
- It distinguishes between the roles of corporate treasurers and market traders, specifically regarding the appropriateness of arbitrage.
- Key financial concepts such as clearing houses, counterparty risk, and the liquidity of over-the-counter (OTC) products are explored.
- Practical calculation exercises involve determining future buy/sell prices and interest rates using spot prices and interest rate differentials.
- The distinction between hedging and speculation is highlighted, noting that over-hedging a position constitutes a speculative act.
No, there is no such thing as a perfect arbitrage, and there is always an element of speculation.
Managing Financial Risks and Strategy
- The text provides a comprehensive bibliography of academic research on corporate hedging, foreign exchange risk, and interest rate exposure.
- Practical exercises demonstrate the mechanics of arbitrage gains and the calculation of forward exchange rates and interest rate spreads.
- A critical distinction is made between risk management and financial speculation, emphasizing that treasurers should avoid unmeasurable counterparty risks.
- The bibliography extends into specialized fields including credit derivatives, catastrophe risk, and Value-at-Risk (VaR) modeling.
- The epilogue cautions against the 'finance-first' mentality, suggesting that finance should not be viewed as the most important function of a company.
We sincerely hope that after reading the 50 chapters of this book, you have not come away with the impression that finance is the most important function of the company!
Finance and Corporate Strategy
- The 'dictatorship of EPS' and excessive focus on short-term financial metrics can lead to the collapse of major media and industrial groups like Havas.
- Industrial strategies fail without healthy financial foundations, as evidenced by the debt-fueled acquisition of ABN AMRO by RBS during a downturn.
- A successful corporate environment requires financial policy to play 'second fiddle' to overarching strategy while still meeting return-on-investment criteria.
- Former CFOs can become successful CEOs only if they transition from a purely financial mindset to a strategic leadership approach.
- Corporate strategy is a dynamic function of shareholder goals, macroeconomic contexts, and the choice between internal or external growth.
So, we have a healthy situation when the company’s financial policy plays second fiddle to its strategy.
Industrial Strategy and Risk Returns
- Financial managers view industrial strategy as a tool to create barriers to entry that protect superior earnings from competitors.
- The 'Sisyphus' nature of entrepreneurship means high returns inevitably attract new entrants who eventually erode profit margins.
- Market equilibrium is driven by risk-return ratios: high returns attract competition while low returns lead to consolidation or exit.
- Industrial markets adjust to risk-return balance much slower than financial markets due to lower liquidity and higher exit barriers.
- Internal growth strategies focus on innovation and cost-cutting to maintain a competitive edge without external acquisitions.
- The Boston Consulting Group (BCG) identified a statistical link between accumulated production volume and the reduction of unit costs.
But, like Sisyphus, the entrepreneur must continually redo today what was done yesterday.
Internal Growth and Financial Strategy
- The experience curve demonstrates that companies with higher market share achieve lower industrial costs, creating significant barriers to entry for new competitors.
- Strategic activity fields follow a phased lifecycle—launch, growth, maturity, and decline—each requiring distinct financial approaches such as equity for launches and debt for maturity.
- Internal growth is constrained by a sustainable growth rate, which is the product of return on equity (ROE) and the retention ratio.
- Financial managers must balance aggressive R&D and marketing expenditures with rigorous control of working capital and inventory to support expansion.
- Effective financial policy utilizes the leverage effect to maintain high ROE even when heavy investments temporarily depress return on capital employed (ROCE).
New competitors are obliged to align their retail prices more or less with those of the company already on the market, while their cost prices will obviously be much higher.
Industrial Growth and Breakeven Strategy
- External growth industrial policy relies on the rapid mobilization of financial resources to acquire companies as opportunities arise.
- A company's financial stability is directly linked to its distance from the breakeven point, which determines sensitivity to sales fluctuations.
- Strategies that raise the breakeven point faster than activity levels increase the company's industrial risk.
- In cyclical sectors, minimizing fixed costs is essential to withstand downturns, making upstream integration a potential strategic error.
- While industrialization can be beneficial in growing sectors, it requires an accurate assessment of the growth period's duration.
- Shareholders, as legal owners, dictate strategy and financial policy, though their interests vary depending on their level of diversification.
In some sectors, upstream integration (control over suppliers) is a mistake, as it considerably raises the level of the company’s breakeven point and, accordingly, of its industrial risk.
The Family-Run Company Dilemma
- Family-run businesses often struggle with the overlap between personal assets and company assets, leading to financial policies that serve shareholder aims over theoretical best practices.
- Shareholders frequently choose to diversify the business itself rather than their personal portfolios to maintain control while mitigating risk.
- Growth-oriented family firms face a difficult choice between taking on dangerous levels of debt or diluting family control through equity issuance.
- Successful entrepreneurs like the Pernod and Ricard families demonstrate that diluting control to a minority stake can lead to massive value creation and global leadership.
- While financial engineering can temporarily disconnect voting rights from capital to delay dilution, these methods often result in a higher cost of capital and long-term inefficiency.
- The most sustainable long-term strategy often involves returning to the 'one share, one voting right' principle after a period of expansion.
A company that wishes to grow – but whose shareholders wish to avoid being diluted by capital increases to which they are unable to subscribe – is condemned to borrowing and will be fragile in times of crisis.
Managerial Incentives and Macroeconomic Forces
- Minority managers often manipulate financial policy, such as paying high dividends or avoiding capital increases, to maintain control and shareholder loyalty.
- Managers with little to no equity stake may prioritize personal power, media popularity, and job security over shareholder value.
- Non-shareholder managers may avoid debt to minimize bankruptcy risk and job loss, even if borrowing would benefit the company's growth.
- The macroeconomic environment, defined by growth rates, interest rates, and inflation, dictates the fundamental constraints of corporate strategy.
- Historical shifts from high-inflation environments to high real interest rates have exposed the fragility of companies built on 'inflation profits' and excessive debt.
- Current global trends of weak growth and massive deleveraging across all sectors create an uncertain future for corporate financial structures.
In some extreme cases, the goals of the manager could run contrary to those of the shareholders.
Global Corporate Market Leaders 2014
- The data provides a snapshot of the top 20 largest listed companies in Brazil, China, France, and a Benelux-heavy European list as of April 2014.
- China's market leaders are heavily dominated by state-owned banks and energy giants, with Petrochina and ICBC leading in market capitalization.
- The French market shows a diverse mix of energy, pharmaceuticals, and luxury goods, with Total and Sanofi holding the top positions.
- Brazil's corporate landscape features a strong presence of financial institutions and natural resource companies like Petrobras and Vale.
- Financial metrics such as Price-to-Book ratios and P/E ratios vary significantly across regions, reflecting different investor expectations and sector compositions.
China's market leaders are heavily dominated by state-owned banks and energy giants, with Petrochina and ICBC leading in market capitalization.
Global Corporate Financial Metrics 2014
- The data provides a detailed snapshot of the top 20 companies by market capitalization in France, Germany, India, and Italy as of April 2014.
- German industry leaders like Volkswagen and Siemens show massive headcounts and revenues, reflecting a strong manufacturing and engineering base.
- The Indian market exhibits high Price-to-Book ratios in sectors like technology (TCS) and consumer goods (ITC), suggesting high growth expectations or brand value.
- Financial institutions across Europe, such as Société Générale and Unicredit, generally show lower Price-to-Book ratios compared to industrial or luxury sectors.
- The luxury sector, represented by companies like Hermes and Christian Dior, maintains high valuation multiples despite smaller workforces compared to industrial giants.
1 Volkswagen 89 0.99 1.0 8.5 197.0 9.1 549 763
Global Corporate Financial Rankings 2014
- The data provides a detailed snapshot of market capitalization, price-to-book ratios, and price-to-earnings ratios for top companies in Japan, Russia, and the MENA region as of April 2014.
- Toyota Motor dominates the Japanese market with a capitalization of €134 billion, significantly outpacing other major players like Softbank and Mitsubishi UFJ.
- The Russian market is heavily concentrated in the energy sector, with Gazprom and Rosneft leading in both market value and net income.
- Financial institutions and telecommunications firms represent the largest market caps in the Morocco, Lebanon, and Tunisia grouping, though at a much smaller scale than Japan or Russia.
- Russian companies like Gazprom show remarkably low P/E ratios (2.4), suggesting a significant valuation discount compared to Japanese firms like Fast Retailing (37.0).
Gazprom 60 1.15 0.3 2.4 110.9 27.5 417 000
Global Corporate Financial Rankings 2013
- The data provides a comparative snapshot of the top 20 companies in Spain, Switzerland, and the United States based on 2013 market capitalization and financial performance.
- U.S. tech giants like Apple, Google, and Microsoft lead in market valuation, significantly outperforming the top firms in Spain and Switzerland in total scale.
- The Swiss market is dominated by pharmaceutical and consumer goods leaders such as Roche, Nestle, and Novartis, which show high price-to-book ratios.
- Spanish corporate leaders are primarily concentrated in the banking and energy sectors, with Santander and Inditex holding the top positions.
- Employment figures vary wildly across sectors, highlighted by Walmart's massive workforce of 2.2 million compared to high-value, low-headcount tech and finance firms.
WalMart 183 0.54 3.1 14.8 344.2 0.0 2 200 000
Corporate Finance Fundamentals and Rankings
- The text opens with a 2014 ranking of top global corporations like Shell, HSBC, and BHP Billiton, detailing their market value, turnover, and employee counts.
- It defines the financial manager's role as a multifaceted professional acting as a salesman of securities, a negotiator, and a risk manager.
- The curriculum outlines the transition from earnings to cash flow, emphasizing the importance of understanding operating and investment cycles.
- A significant portion of the material is dedicated to navigating complex accounting issues such as deferred tax, impairment losses, and off-balance-sheet commitments.
- The framework for financial analysis includes economic assessment, accounting policy reviews, and the use of expert systems and scoring techniques.
The financial manager is first and foremost a salesman of financial securities valued continuously by the financial markets.
Corporate Finance and Market Dynamics
- The text outlines the transition from internal financial analysis, such as working capital and CAPEX, to external market forecasting.
- It details the mechanics of investment decision rules, specifically focusing on Net Present Value (NPV) and Internal Rate of Return (IRR).
- A significant portion is dedicated to the relationship between risk and return, introducing the Capital Asset Pricing Model (CAPM) and the concept of the efficient frontier.
- The structure explores various financial instruments including bonds, shares, options, and hybrid securities like convertible bonds.
- It highlights the evolving theoretical landscape of finance, contrasting efficient market hypotheses with the emerging field of behavioural finance.
Another theoretical framework under construction: behavioural finance.
Corporate Finance and Value Creation
- The text outlines the fundamental mechanisms for selling securities, ranging from initial public offerings and block trades to syndicated loans and convertible bonds.
- A central theme is that the primary purpose of finance is the creation of value, explored through market equilibrium, organizational theories, and taxation.
- Net Present Value (NPV) is identified as the only truly reliable criterion for measuring value creation, despite the common use of accounting and market-based metrics.
- The cost of capital is analyzed as a reflection of asset risk, with a focus on whether corporate managers possess the agency to influence this cost.
- Capital structure theories are examined through various lenses, including perfect market assumptions, tax trade-offs, signaling, and information asymmetry.
- The final sections detail the practicalities of returning cash to shareholders via dividends and buy-backs, alongside the implementation of debt policies and covenants.
NPV, the only reliable criterion.
Corporate Governance and Financial Management
- The text outlines the lifecycle of a firm from start-up financing and initial public offerings to potential bankruptcy and restructuring.
- It details the mechanics of corporate control, including shareholder structures, mergers and acquisitions, and leveraged buyouts.
- A significant focus is placed on financial engineering, specifically how to value young companies and manage the relationship between entrepreneurs and investors.
- Operational financial management is addressed through the lens of working capital, cash flow optimization, and risk management strategies.
- The section connects financial theory to practical applications like underpricing in IPOs and the strategic use of all-share transactions.
To be or not to be listed?
Financial Index and Corporate Concepts
- The text serves as a comprehensive index for a finance textbook, covering topics from asset-backed loans to bankruptcy procedures.
- It highlights key theoretical frameworks such as Agency Theory, Arbitrage Pricing Theory (APT), and the Capital Asset Pricing Model (CAPM).
- Corporate governance and shareholder relations are addressed through entries on activist funds, annual general meetings, and anti-takeover defenses.
- The index details various banking and credit mechanisms, including syndicated loans, bilateral loans, and asset-liability refinancing gaps.
- Specific financial instruments and accounting treatments are listed, such as American Depository Receipts (ADRs), preference shares, and EBITDA adjustments.
Agency theory: and bankruptcy 857, 858; and corporate governance 790–1; and dividends 670–1; and LBOs 848.
Corporate Finance and Market Instruments
- The index covers foundational valuation models including the Black-Scholes model and the Capital Asset Pricing Model (CAPM) for determining risk and return.
- Extensive detail is provided on debt instruments, specifically the mechanics of bonds, convertible securities, and the differences between bank loans and bond markets.
- Corporate governance and structural oversight are addressed through entries on board independence, committee structures, and the role of the chairman.
- Equity and capital management strategies are explored, including share buy-backs, initial public offerings (IPOs), and the 'bootstrap game' in all-share deals.
- Accounting methodologies are contrasted, specifically the differences between by-function and by-nature income statements and their impact on EBITDA and operating profit.
“bootstrap game”, all-share deals 829
Corporate Finance Index and Concepts
- The text outlines the fundamental components of capital structure, including the trade-offs between taxation, signaling, and financial flexibility.
- It details the mechanics of cash flow management, emphasizing the importance of forecasting horizons, account balancing, and centralized pooling within groups.
- Capital expenditure (capex) is identified as a primary driver of operating performance and a critical factor in determining free cash flow.
- The index highlights various valuation methodologies, specifically focusing on the DCF method, CFROI, and multiples based on capital employed.
- Strategic financial decisions such as capital increases and share issues are linked to their direct impacts on earnings per share and real dilution.
Financial flexibility is the ability of a company to react to unexpected events and to seize opportunities as they arise.
Index of Corporate Finance Concepts
- The text provides a comprehensive index of financial terminology, ranging from accounting methods like consolidation and equity valuation to complex debt instruments.
- It highlights the structural aspects of corporate governance, including the role of boards of directors, transparency, and the exercise of shareholder power.
- Key valuation concepts are listed, such as the cost of capital, discounted cash flow (DCF) methods, and the impact of control premiums on strategic value.
- The index covers various forms of corporate financing and risk management, including commercial paper, syndicated loans, and the use of debt as a management control tool.
- Legal and regulatory frameworks are addressed through entries on shareholders' agreements, non-disclosure agreements, and conflict resolution via agency theory.
debt as means of 612–14control over a company, strengthening of 756–62 legal and regulatory protection 761–2loyal shareholders 760–1separating management from financial 757–9
Financial Index: Debt and Credit
- The index details the relationship between debt, bankruptcy risk, and optimal capital structure within financial markets.
- It highlights the role of covenants and restrictive clauses in loan agreements as tools for protecting debtholders and managing negotiations.
- Various debt instruments and financing sources are categorized, including commercial paper, bank loans, and bond markets.
- The text addresses credit risk management through credit ratings, credit default swaps (CDSs), and scoring systems.
- Structural decisions in debt policy are outlined, such as choosing between fixed or floating rates, maturity lengths, and currency types.
- The conflict between shareholders and creditors is explored through the lens of options theory and value transfer.
creditors: financial decisions, options theory 629–32; repayment of equity to 595; risk 622, 630, 697–8; and shareholders: conflict resolution 632–3; difference between 622; share issue 697–8; value transfer 664–5
Financial Index and Valuation Concepts
- The text provides a comprehensive index of financial terminology ranging from convertible bonds and credit ratings to complex valuation models.
- It details various components of Discounted Cash Flow (DCF) valuation, including terminal value, business plan horizons, and the Weighted Average Cost of Capital (WACC).
- Key concepts regarding shareholder equity are explored, specifically dilution of control, dividend discount models, and the signaling theory of dividends.
- Risk management and investment strategies are addressed through entries on diversification, beta impact, and the role of derivatives like futures and credit swaps.
- The index highlights the structural aspects of corporate finance, such as demergers, holding company discounts, and the disciplining role of debt in agency theory.
disciplining role of debt 484, 612–14
Corporate Finance Index: E-Section
- The index covers foundational earnings metrics including EBITDA, EBIT, and EPS, linking them to valuation multiples and capital structure choices.
- Economic analysis sections detail company market positioning, production systems, and the assessment of economic value added (EVA).
- Market theories are explored through the efficient market hypothesis, behavioral finance anomalies, and the concept of the efficient frontier in risk-return ratios.
- Enterprise Value (EV) is highlighted as a central metric for DCF methods, pension liability adjustments, and its independence from financing policy.
- Equity capital policy discussions span from start-up financing and shareholder agreements to debt policy implementation and cash distribution.
- Specific financial instruments and markets mentioned include European Commercial Paper (ECP), Euro Medium-Term Notes (EMTNs), and Exchange Traded Funds (ETFs).
Enterprise value (EV) independent of financing policy 598–600 link to equity value 596 multiples based on 569–70 and optimal capital structure 596–7 options theory analysis 622–8.
Corporate Finance Index Excerpts
- The text outlines mechanisms for returning cash to shareholders, including capital reduction, share buy-backs, and exceptional dividends.
- It details the complexities of share issues, focusing on the anticipation mechanism, dilution of control, and the impact on earnings per share (EPS).
- A significant portion is dedicated to valuation and return metrics, such as the Capital Asset Pricing Model (CAPM), Economic Value Added (EVA), and the Black-Scholes model for options.
- The index covers risk management and market volatility, specifically addressing the 2008 financial crisis, exchange rate fluctuations, and liquidity premiums.
- It highlights various financing instruments and structures, ranging from LBO funds and equity kickers to Euro medium-term notes and securitisation.
financial crises in the 2000s 644 brought on by a panic 652
Financial Management Index Overview
- The text provides a comprehensive index of financial management topics, ranging from agency theory and signalling to complex financial engineering.
- It categorizes various debt products including bank debt, bonds, commercial paper, and asset-based financing like securitisation.
- Key areas of financial strategy are highlighted, specifically focusing on capital structure choice, financial distress, and the lifecycle of financing.
- The index outlines the mechanisms of financial risk management, including forward transactions, insurance, and self-hedging strategies.
- Corporate restructuring and control are detailed through entries on leveraged buyouts (LBOs), mergers, demergers, and IPOs.
financial engineering: bankruptcy and restructuring 852–65; corporate structure choice 748–69; initial public offerings (IPOs) 770–81; LBO funds 752, 753; leveraged buyouts (LBOs) 837–50
Financial Index and Corporate Concepts
- The text provides a detailed index of financial terms ranging from share buy-back programmes to high-yield 'junk' bonds.
- Key valuation concepts are highlighted, including Free Cash Flow (FCF), Discounted Cash Flow (DCF) methods, and the Gordon-Shapiro formula.
- Risk management strategies are categorized through forward transactions, swaps, and various hedging tools for foreign exchange and interest rate fluctuations.
- Corporate governance and structural elements such as 'golden parachutes,' 'golden shares,' and the organization of group subsidiaries are indexed.
- The document references specific corporate examples like Ford, General Motors, and Heineken to illustrate dividend profiles and market risks.
'junk bonds' 206 LBO finance 844
Financial Index and Corporate Concepts
- The text provides a comprehensive index of financial terminology, covering valuation models like the Fama-French model and options theory.
- It details various hybrid securities including convertible bonds, mandatory convertibles, and warrants as tools for resolving shareholder-creditor conflicts.
- Corporate governance and management topics are addressed through incentive systems, director independence, and the impact of insider information.
- The index highlights the mechanics of Initial Public Offerings (IPOs), including execution, underpricing, and the transition from public to private status.
- Risk management concepts are categorized into idiosyncratic, illiquidity, industrial, and inflation risks, alongside hedging strategies.
Hybrid securities: resolving shareholder-creditor conflicts.
Financial Index: Interest and Investment
- The index details the mechanics of interest rates, including their relationship to bond coupon rates, government policy, and debt structuring.
- Internal financing is explored through the lenses of information asymmetry, shareholder-manager relationships, and its impact on value creation.
- The Internal Rate of Return (IRR) is categorized by its application in bond valuation, investment criteria, and its inherent limits such as multiple or non-existent rates.
- Investment criteria are expanded beyond NPV and IRR to include payback periods, present value index (PVI), and return on capital employed (ROCE).
- The text references international accounting standards (IASB and IFRS) regarding the treatment of leases, inventories, and currency translation.
- Investor behavior is analyzed through the dichotomy of rationality versus irrationality and the specific information requirements of institutional versus industrial investors.
investment choice more important than choice of capital structure
Corporate Finance Index: L-M
- The index covers the mechanics of Leveraged Buyouts (LBOs), including exit strategies, private equity sponsors, and the specific roles of lenders and sellers.
- It details the leverage effect, providing formulas for calculation and exploring its impact on enterprise value and capital structure.
- Legal and structural aspects of corporate finance are highlighted, such as EU directives, hostile bidder actions, and the preparation required for Initial Public Offerings (IPOs).
- Liquidity is addressed through various lenses, including liquidity ratios, risk management, and the 'liquidity discount' applied during company valuations.
- Debt instruments and management are categorized, ranging from junk bonds and syndicated loans to the complexities of LIBOR and interest rate swaps.
limited liability and bankruptcy 858; liquidity discount 336, 583, 719, 832; 'junk bonds' 206
Corporate Finance Index Excerpts
- The text provides a detailed index of corporate finance topics, ranging from market efficiency and behavioral finance to complex merger and acquisition strategies.
- It highlights the tension between managers and shareholders, specifically regarding internal financing, dividend policies, and the use of warrants for incentivization.
- Market risk is categorized through various lenses, including the Capital Asset Pricing Model (CAPM), beta coefficients, and Value at Risk (VaR) measurements.
- The index covers structural financial maneuvers such as leveraged buyouts (LBOs), management buy-ins (MBIs), and the mechanics of all-share merger deals.
- Valuation methodologies are extensively listed, including Market Value Added (MVA), Price to Book Ratios (PBR), and Sum of the Parts (SOTP) methods.
discipline imposed by dividend policy 670–1 inside information held by 614–15 of LBO company 847 risk manager, CFO as 10–11 and shareholders
Corporate Finance and Valuation Index
- The text outlines the mechanics of mergers and acquisitions, including the 'bootstrap game', dilution criteria, and the strategic use of exchange ratios.
- It details various valuation methodologies such as Net Asset Value (NAV), Net Present Value (NPV), and multiple-based valuations using EBITDA and EBIT.
- The role of minority shareholders is examined through the lens of corporate governance, takeover protection, and standalone minority value.
- Key financial concepts like the Modigliani-Miller theorem, leverage effects, and the distinction between net debt and equity value are indexed.
- Strategic negotiation processes in M&As are categorized into auctions, dual-track processes, and private negotiations.
“bootstrap game” 829dilution or accretion criteria 826–7direction of merger 830exchange ratio & relative value ratio 825–6synergies 827–9
Financial Index: Operations and Options
- The index outlines the distinction between operating and non-operating assets, emphasizing the role of working capital in the investment cycle.
- It details the mechanics of operating leverage and its impact on earnings before interest and taxes (EBIT) and net operating profit after tax (NOPAT).
- A significant portion of the text focuses on option theory, covering valuation criteria such as the Black-Scholes model, volatility, and time value.
- The document categorizes various capital structure theories, including optimal capital structure and the perfect markets theory approach.
- It provides a framework for understanding market instruments like over-the-counter (OTC) derivatives, credit derivatives, and their associated leverage effects.
impact of time, theta 421–2 impact of volatility, vega 422 implicit volatility 422 model risk 423
Financial Index: P to Profitability
- The index covers a broad spectrum of corporate finance mechanisms, ranging from defensive strategies like Pac-Man defenses and poison pills to structural elements like preference shares and partnerships.
- It details various valuation methodologies including Price to Earnings (P/E) ratios, Price to Book (PBR) ratios, and peer comparison techniques.
- The text highlights the technicalities of debt and equity, such as pari passu clauses, pre-emptive subscription rights, and the pecking order theory of capital structure.
- Risk management and portfolio theory are addressed through entries on the Capital Asset Pricing Model (CAPM), diversification, and political risk insurance.
- Operational finance concepts are indexed, including working capital management, payment terms, and the impact of production cycles on company liquidity.
Pac-Man defence 812... poison pills (strategic assets) 762 poison pill warrants 812
Financial Index and Corporate Valuation
- The text provides a comprehensive index of financial concepts ranging from profitability indicators like ROCE and ROE to complex derivative instruments.
- It details various valuation methodologies including real options, put-call parity, and the Capital Asset Pricing Model (CAPM).
- Corporate governance and regulatory frameworks are highlighted, specifically regarding takeover bids, disclosure requirements, and bankruptcy procedures.
- Debt management is explored through credit ratings, repayment structures, and the role of revolving credit facilities in corporate finance.
- Market dynamics such as investor rationality, random walk theory, and the impact of inflation on real interest rates are indexed for reference.
The Capital Asset Pricing Model (CAPM) properties and limits are explored alongside the arbitrage pricing theory (APT).
Financial Index and Risk Metrics
- The text provides a comprehensive index of financial performance metrics, specifically focusing on Return on Capital Employed (ROCE) and Return on Equity (ROE).
- It details the mechanics of risk analysis, covering mathematical approaches, real options, and the fundamental relationship between risk and return.
- The index outlines various methods for the sale of securities, including block trades, rights issues, and the role of investment banks in capital increases.
- Specific attention is given to risk management frameworks, including the measurement of financial risk and the CFO's role as a risk manager.
- It categorizes diverse financial instruments and concepts such as revolving credit facilities, risk-free assets, and the Capital Asset Pricing Model (CAPM).
shareholders exposure to operating risk 595–6, 598–9
Corporate Finance Index and Shareholder Dynamics
- The text provides a comprehensive index of financial mechanisms including Initial Public Offerings (IPOs), book building, and the role of institutional versus retail investors.
- It details the complex relationship between shareholders and managers, specifically focusing on agency theory, conflict resolution with creditors, and the dilution of control during share issues.
- Various methods of returning cash to shareholders are indexed, such as share buy-backs, dividends, and the impact of these actions on a company's capital structure.
- The document covers technical valuation and risk assessment tools, including Monte Carlo simulations, sensitivity analysis, and the Capital Asset Pricing Model (CAPM).
- Legal and structural frameworks for corporate transactions are listed, including share purchase agreements (SPA), leveraged buyouts (LBOs), and the 'reps and warranties' provisions in acquisitions.
shareholders and managers... agency theory 483–4... running the risk of the firm 595–6
Financial Index and Corporate Concepts
- The index covers a broad spectrum of equity concepts, ranging from basic share data and dividend payout ratios to complex multiple voting rights and squeeze-out mechanisms.
- Signalling theory is highlighted as a critical framework for understanding how debt policy, bankruptcy, and share issues communicate information in environments of asymmetric information.
- The text details the lifecycle and financial management of start-up companies, including entrepreneur-investor relationships, valuation methods, and high failure rates.
- Valuation methodologies are categorized into various approaches, such as the sum-of-the-parts (SOTP) method, discounted cash flow, and market multiples like P/E ratios.
- Risk management and market dynamics are addressed through topics like solvency analysis, credit ratings from agencies like S&P, and the use of special purpose vehicles (SPVs).
Signalling theory and asymmetric information; and bankruptcy; capital reductions; and debt policy; dividends; share issue.
Corporate Finance Index: S to U
- The index covers a broad spectrum of corporate finance topics including systemic risk, takeover regulations, and the mechanics of syndicated loans.
- Extensive focus is placed on taxation, specifically tax shields, deferred tax assets, and the impact of corporate versus personal taxes on financial decisions.
- Valuation methodologies are highlighted through terminal value calculations, trading multiples, and the sum-of-the-parts approach.
- The text details option pricing and risk management concepts such as theta, time value, and the Greeks, alongside the tradeoff model of debt.
- Operational finance elements are listed, including trade credit management, treasury functions, and the nuances of initial public offerings (IPOs).
transfer of value from creditors to shareholders 664–5, 857 from shareholders to creditors 697–8
Financial Index and Valuation Metrics
- The text provides a comprehensive index of financial valuation techniques, including discounted cash flow, peer-group comparisons, and the sum-of-the-parts method.
- It outlines the theoretical frameworks of value creation, citing agency theory, signaling theory, and the equilibrium theory of markets.
- A significant focus is placed on working capital management, detailing its relationship to company growth, recessionary impacts, and inventory turnover.
- The index covers complex financial instruments and risk metrics such as warrants, US-style options, and Value at Risk (VaR).
- Corporate governance and shareholder dynamics are addressed through entries on voting rights, shareholder agreements, and 'white knight' takeover defenses.
“white knight” 812Wilson formula 877“window-dressing” 565, 803working capital 47, 181–92
Financial Index and Licensing
- The text provides a detailed alphabetical index of financial terms ranging from security valuation to risk assessment models.
- Key concepts listed include various yield types such as dividend yields and yield to maturity, which is linked to the internal rate of return.
- The index covers specialized accounting and cash management strategies like zero balance accounts and the zero cash concept.
- Specific financial instruments like zero-coupon bonds and loans are referenced across multiple sections of the primary text.
- The document concludes with a reference to the Wiley End User License Agreement for digital access.
zero-sum game 8, 919Z-scores 135–6
The Vernimmen Finance Legacy
The Vernimmen is a true bible of corporate finance. With regular updates through their monthly newsletter and upgrades, the authors have made it applicable to any place, any time.
The Financial Manager as Salesman
- Minimizing financing cost is equivalent to maximizing security value, but only after adjusting for investor risk.
- “It doesn’t cost anything” should be replaced by analysis of an action’s impact on total value.
The most dangerous thing a financial manager can say is, “It doesn’t cost anything.”
The Financial Manager's Mandate
- Value is created only when investment returns exceed the cost of capital; falling short destroys value.
If not, if the company is consistently falling short of this goal, it will destroy value, turning what was worth 100 into 90, or 80. This is corporate purgatory.
Capital Employed Balance Sheet Analysis
- A positive working capital balance requires financing; a negative balance is a rare operating source of funds.
If negative, it represents a source of funds generated by the operating cycle. This is a nice – but rare – situation!
Ownership Levels and Consolidation Scope
- Excluding subsidiaries from consolidation can hide losses or liabilities, often through Special Purpose Vehicles.
These techniques have been developed to make certain consolidated accounts look more attractive.
Foundations of Financial Analysis
- Financial analysis must start with strategic and economic context; numbers alone produce sterile reports.
Since the aim of financial analysis is to portray a company’s economic reality by going beyond just the figures, it is vital to think about what this reality is and how well it is reflected by the figures before embarking on an analysis of the accounts.
Market Dynamics and Risk Factors
- High-growth sectors can yield poor returns through oversupply, while mature or declining markets may generate superior returns for dominant players.
Conversely, tobacco, which is one of the most mature markets in existence, generates a very high level of return on capital employed for the last few remaining companies operating in the sector.
The Financial Detective's Framework
- Effective financial analysis works like detective work, seeking causal links and early signals of future problems.
Financial analysts are detectives, constantly on the lookout for clues, seeking to establish a logical sequence, as well as looking for any disruptive factor that may be a prelude to problems in the future.
The Breakeven Point Trap
- In inflexible industries such as shipping or paper, a 5% volume glut can trigger price collapses of 30% to 50%.
In many cases, a vicious circle sets in, as the measures taken to lower breakeven trigger a major business contraction, compelling the company to lower its breakeven point further, thereby sparking another business contraction, and so on.
The Duality of Working Capital
- Although inventories and receivables turn over quickly, their constant replacement creates a permanent capital requirement.
Working capital is two-sided. From the point of view of balance sheet value, it is liquid. From a going-concern point of view, it is permanent.
Dynamics of Negative Working Capital
- Negative working capital can fund rapid expansion, but it can also create “cash blindness” that hides loss-making activities.
The wake-up call is pretty tough when growth slows down and payment difficulties appear.
Dynamics of Intercompany Credit
- Supplier credit can act as an unwitting bank loan and become the catalyst for domino bankruptcies.
Suppliers know that they will not have complete control over payment terms. They have unwittingly become bankers.
Analyzing Capital Expenditure Strategies
- A low ratio of net to gross fixed assets may temporarily boost margins through low depreciation, while threatening long-term competitiveness.
Be on the lookout for companies that, for reasons of hubris, grossly overinvest, despite their cash flow from operating activities not growing at the same rate as their investments.
Analyzing Debt Repayment Capacity
- Net debt/EBITDA is a quick leverage test; around 2.5× is often viewed as a critical risk threshold.
A value of 2.5 is considered a critical level, below which the company should generally be able to meet its repayment obligations.
Measuring Capital Profitability
- Different industries can reach similar ROCE through opposite models, such as high-margin/low-turnover satellites and low-margin/high-turnover retail.
Much ink has been spilled over the issue of whether opening or closing capital employed or an average of the two figures should be used.
The Mechanics of Leverage
- Leverage is a double-edged sword: it can amplify equity returns or turn them into a financial nightmare.
Readers should pause for a second to contemplate this corporate nirvana, which apparently consists in making more money than is actually generated by a company’s industrial and commercial activities.
Limits of Book Returns
- ROE can be artificially inflated by leverage, increasing risk without revealing it in the accounting ratio.
It is easy to boost book returns on equity by gearing up the balance sheet and harnessing the leverage effect.
Value Creation and Net Assets
- The core rule of value creation is that return on capital employed must exceed the total cost of capital.
A company will be able to create value during a given period if the return on capital employed (after tax) that it generates exceeds the cost of the capital (i.e. equity and net debt) that it has raised to finance capital employed.
The Efficient Market Hypothesis
- In efficient markets, professional managers typically underperform the market average by roughly their fees.
In fact, in an efficient market, the experts’ performance is slightly below the market average, in a proportion directly related to the management fees they charge!
Behavioral Finance and Market Mimicry
- Collective belief can create self-fulfilling market movements independent of economic reality.
This could drive an asset manager mad!
Valuation and Net Present Value
- In efficient markets, investor activity drives NPV toward zero as prices converge on fair value.
In efficient, fairly valued markets, net present values are zero, i.e. market value is equal to present value.
IRR vs NPV Decision Making
- IRR and NPV can conflict when comparing projects with different scale or duration; NPV is generally preferred because it measures total value created.
If the cash flow schedule is the same, then calculating the NPV by choosing the discounting rate and calculating the internal rate of return (and comparing it with the discounting rate) are two sides of the same mathematical coin.
Risk and Return Fundamentals
- Risk is the uncertainty surrounding future asset values and cash flows—the essential “spice” of finance.
For better or for worse, without risk, finance would be quite boring!
Determinants of Beta and Risk
- High fixed costs and high debt raise breakeven levels and increase a company’s beta.
There is an old saying in North America, “As General Motors goes, so goes the economy”.
Risk Diversification and CAPM
- In a fairly valued market, investors are compensated only for non-diversifiable market risk, not total risk.
As his assets are not diversified, it is a matter of “life or death” for the firm that the investment succeeds.
Bond Ratings and Default Risk
- Default rates track ratings sharply: over 15 years, 0.8% of AAA issuers defaulted versus 31% of B-rated issuers.
From the sample of international issuers rated by Standard & Poor’s over 15 years, 0.8% of issuers rated AAA failed to pay an instalment on a loan, while 31% of issuers rated B defaulted.
The Foundations of Options
- Many complex instruments—convertibles, credit facilities, and hybrids—are combinations of options and safer assets.
The haunted house, or how to pay for being frightened!
The Theoretical Basis of Options
- Options exist only because of uncertainty; in a risk-free future they would serve no purpose.
Options would not exist if the future were known with certainty. In a risky environment, options remunerate the risk of an uncertain future.
Determinants of Option Value
- Higher volatility increases the value of both calls and puts by raising the chance of favorable price swings.
As an option is nothing more than pure remuneration of risk, the greater that risk is, the greater the remuneration must be, and thus the option’s value.
Vega, Volatility, and Model Risk
- Black–Scholes is criticized for assuming log-normal distributions that underestimate extreme market crashes.
In practice, it is impossible to create a position that is neutral on all criteria at once. No return is possible when taking no risk. No pain, no gain!
The Mechanics of Convertible Bonds
- Convertibles are marketed as a “miracle product,” but lower coupons are balanced by the cost of future dilution.
No, there are no miracles in finance. At best, one can find mirages, and this is one.
The Mechanics of IPO Discounts
- IPO discounts help protect uninformed investors from the winner’s curse of receiving full allocations mainly in weak deals.
Uninformed investors cannot distinguish which issues are really attractive and thus are exposed to the winner’s curse.
Investment Returns and Capital Value
- Value is created immediately when an investment’s expected return exceeds the return required by investors.
An investment of 100 that always yields 15% in a market requiring a 10% return is worth 150 (100 × 15%/10%).
The Value Additivity Rule
- Investors can replicate diversification or leverage themselves, so they will not pay a premium for companies to do it for them.
So why should they pay for an operation they can carry out themselves at no cost?
The Power of Financial Signaling
- A real financial signal is a concrete decision with potential negative consequences, not a management statement.
It is a real financial decision, taken freely and which may have negative financial consequences for the decision-maker if it turns out to be wrong.
Evolution of Financial Indicators
- ROCE has become a key economic performance measure because it avoids the leverage bias embedded in ROE.
Even though ROE might look more attractive, no “real” value has been created since the increased profitability is cancelled out by higher risk not reflected in accounting data.
The Earnings Per Share Fallacy
- A decision can raise EPS yet lower the P/E ratio if it increases the company’s risk profile.
In order to maximise value, it is simply not enough to maximise these ratios, even if they are linked by a coefficient to value or the required rate of return.
Investment Criteria and Financial Analysis
- NPV is the superior investment criterion, especially when choosing between mutually exclusive projects.
When it is simply a matter of deciding whether or not to make an investment, NPV and IRR produce the same outcome.
Principles of Investment Analysis
- Only incremental cash flows matter; sunk costs already incurred must be ignored.
It would be absurd to carry out an investment simply because the preparations were costly and one hopes to recoup funds that, in any case, have already been spent.
The Opportunity Principle
- The opportunity principle says holding an asset is economically equivalent to buying it today at market price.
Theoretically, a financial manager does not view any activity as essential, regardless of whether it is one of the company’s core businesses or a potential new venture.
Fundamentals of Capital Cost
- In equilibrium, the cost of capital is determined by the systematic risk of the company’s operating assets.
The cost of capital depends solely on the risk of the assets-in-place, specifically its systematic risk, since unsystematic or specific risks are not remunerated.
Project Risk and Capital Cost
- Project valuation should use the project’s own risk profile, not the cost of the funding source used.
As a result, this reasoning has led the company to undertake the investment yielding the lower return (6% vs. 8%) for the same level of risk.
The Cost of Capital Illusion
- Trying to lower WACC with debt is usually offset by shareholders demanding higher returns for higher risk.
- True value creation comes from improving ROCE, not manipulating the cost of capital.
In short, in a perfect world in which investors had diversified portfolios, one man’s gain would be another man’s loss.
Risk Analysis and Real Options
- Standard NPV and discount rates often miss the strategic value of managerial flexibility under uncertainty.
Assuming that an investment is irreversible disregards the fact that corporate managers, once they get new information, generally have a number of options.
The Value of Real Options
- Treating a license as a call option can make a project that looks value-destroying under NPV appear valuable.
According to the NPV criteria, the project destroys £3m in value and the company should reject the licensing offer. This would be a serious mistake!
Core Valuation Techniques
- Valuation is not just mathematics; it requires accounting skill and deep understanding of the business model.
Nevertheless, we want to stress that valuation is not a simple use of mathematical formula, it requires the valuator to have good accounting and tax skills.
Calculating Terminal Value and Growth
- Assuming perpetual growth above inflation plus GDP implies the company will eventually dominate the global economy.
For example, if the anticipated long-term inflation rate is 2% and real GDP growth is expected to be 2%, then if you choose a growth rate g that is greater than 4%, you are implying that the company will not only outperform all of its rivals but also will eventually take control of the economy of the entire country or indeed of the entire world (trees do not grow to the sky)!
Valuation Multiples and Their Pitfalls
- EBITDA multiples can overvalue low-margin companies that have little or no EBIT.
But if the cost structure of Group B remains the same in the future, its EBIT will never be positive; if that is the case, why should an investor pay a single cent for such a company?
The Lifecycle Theory of Value
- In decline, cash-flow value falls below net asset value, signaling assets are no longer generating adequate returns.
Precision is the domain of negotiation, the goal of which is to arrive at an agreed price.
Theories of Optimal Capital Structure
- Modigliani–Miller argues that, in perfect markets without taxes or friction, capital structure does not affect firm value.
In a perfect market, they have no reason to pay companies to do something they can handle themselves at no cost.
The Debt Tax Shield
- Interest is tax-deductible and paid from pre-tax income, while dividends are paid from post-tax profits.
Allowing interest expenses to be deducted from companies’ tax base is a kind of subsidy the state grants to companies with debt.
Debt as Management Control
- Debt disciplines managers by forcing cash-flow generation and limiting wasteful use of free cash flow.
The explicit cost of debt is a simple yet highly effective means of controlling a firm’s management team.
Equity as a Call Option
- Equity in a levered firm is a call option on the firm’s assets, with debt as the exercise price.
- Lenders can be viewed as having sold shareholders a put option, bearing the risk of becoming unwilling owners.
In other words, they have “bought” the company in exchange for the outstanding amount of debt.
The Asset Liability Refinancing Gap
- The asset–liability refinancing gap is negligible in stable markets but can become a major liability during liquidity crises.
And the phenomenon can pick up speed if the current lenders try and hedge their risks by selling short the firm’s shares, hoping to gain on this short-selling what they will lose as a result of the decline in the value of their debt.
Investment Priority and Capital Structure
- No clever financing or favorable terms can compensate for a fundamentally poor investment decision.
Good financing can never make up for a bad investment.
The Quest for Financial Flexibility
- Financial flexibility is a real option: it preserves the ability to act on unexpected investments or crises.
The desire to retain flexibility prompts the company to carry less debt than the maximum level it deems bearable, so that it will at all times be in a position to take advantage of unexpected investment opportunities.
Capital Allocation and Risk
- Retaining excess cash that earns only short-term rates can destroy shareholder value.
In this context, it is very likely that shareholders will value it at less than a cent given the low return provided.
The Signaling Power of Dividends
- Dividends are credible signals because they require real cash and are hard for weak companies to imitate.
Paying dividends is one such policy because it requires the company to have cash. A company that is struggling is not able to imitate a company that is prospering.
The Mechanics of Share Buy-backs
- A buy-back can mechanically raise EPS, but it creates value only if shares are repurchased below intrinsic value.
The reader who has absorbed the lessons of Modigliani and Miller and understands that cost of capital is independent from capital structure (remember “the size of a pizza is the same no matter how you slice it”?) may be indulgent.
The Signaling of Share Issues
- Issuing new shares often signals that management believes the current share price is overvalued.
If one believes in asymmetry of information, a share issue ought to be a signal that the share price is overvalued.
Strategic Financial Flexibility
- Financial flexibility through undrawn credit lines and cash reserves is an insurance policy with real costs.
But, like any insurance policy, flexibility has a financial cost.
The Entrepreneurial Financing Landscape
- Venture investors rely on a power-law model in which one major success must offset many total losses.
The entrepreneur does not reason in terms of probability like the financial manager. His aim is not financial. It is, above all, human.
Evolution of Corporate Ownership
- Family-owned firms may outperform because concentrated wealth gives owners strong incentives to monitor management closely.
Having most of your wealth in one single company or group is a strong incentive to properly monitor its managers or to act responsibly as its manager.
The Mechanics of IPO Underpricing
- IPO underpricing protects less-informed retail investors from the winner’s curse and helps maintain market liquidity.
In seeking to retain these investors, who provide valuable and necessary liquidity to the market, IPOs are carried out at a discount.
The Dynamics of M&A Waves
- M&A waves can be driven by mispricing, as overvalued companies use stock to acquire undervalued targets.
It’s usually only in hindsight that we say we made a killing and that the party on the other side of the transaction was totally wrong!
The Mechanics of M&A
- Roughly half of mergers fail because synergies are overestimated while implementation costs and timelines are underestimated.
Approximately one out of two fail because the promised synergies never materialise.
Mechanics of Merger Synergies
- Investors often value merger synergies at a lower multiple because integration risk is high and many mergers fail.
Experience has shown that more than half of all mergers fail on this score; actual synergies are slower in coming; the amount of synergies is lower than originally announced.
The Value Creation of LBOs
- LBO value creation often comes from a carrot-and-stick model: heavy debt pressure plus strong management equity incentives.
Management, motivated by a potentially big payoff and put under pressure by a heavy debt burden, will manage the company in the most efficient manner possible, increasing cash flows and hence the value of the company. It’s the carrot-and-stick approach!
Shareholder and Creditor Conflicts
- Near bankruptcy, shareholders are tempted to pursue high-risk projects because they keep the upside while creditors bear much of the downside.
When the company is in good health, creditors are indifferent to shareholder decisions. But any decision that makes bankruptcy more likely, even if this decision is highly likely to create value overall for the company, will be perceived negatively by the creditors.
Managing Working Capital Dynamics
- Factoring and securitization can create a “Potemkin village” effect, lowering reported working capital without truly improving operations.
But let’s not fool ourselves, working capital has not really been reduced, it has only been partly financed, and this part disappears from view in the same way that poverty is invisible in Potemkin villages.
The Strategy of Risk Management
- Efficient-market theory says hedging diversified risks should not create value, but agency theory says it protects managers and supports long-term planning.
Even if the hedging decision does not create value, a company that is less exposed to the ups and downs of the market is, from a manager’s point of view, in a more comfortable position.
Finance and Corporate Strategy
- Financial policy should play second fiddle to corporate strategy while still enforcing return-on-investment discipline.
So, we have a healthy situation when the company’s financial policy plays second fiddle to its strategy.