The Bell Curve
Sourced from scanned PDF via OCR — view quality check
Overview unavailable.
Intelligence and Class Structure
- The authors argue that cognitive ability has become the primary determinant of success, status, and financial security in modern American life.
- A new class structure is emerging, led by a 'cognitive elite' while those with lower intelligence are increasingly marginalized from the information economy.
- The book posits that low intelligence is a decisive factor in social problems like crime, unemployment, and school dropout rates, independent of socioeconomic background.
- The text addresses the controversial finding that intelligence levels differ among ethnic groups, a topic the authors claim is often suppressed in public policy.
- The authors advocate for a public policy shift that acknowledges innate intellectual differences to more realistically address national social issues.
But despite decades of fashionable denial, the overriding and insistent truth about intellectual ability is that it is endowed unequally, for reasons that government policies can do little to change.
L
,
THE
Intelligence and Class Structure
w 0 m American Life.
RICHARDL J, HERRNSTEIN
CHARiES MURRAY
In ow- time, the ability to use and manipulate
information has become the single most
important dement of success, no matter how
you measure it: financial security, power, or
status. Those who work by manipulating
ideas and abstractions are the leaders and ben-
eficiaries of our society. In such an era, high
intelligence is an increasingly precious raw
material for success. But despite decades of
fishionable denial, the overriding and insis-
tent truth about intellectual ability is that it is
endowed unequally, for reasons that govern-
ment policies can do little to change.
The major purpose of Thp Bell Curve is to
reveal the dramatic transformation that is
currently in process in American society-a
process that has created a new kind of class
structure led by a "cognitive elite:'
itself a
result of concentration and self-selection in
those social pools well endowed with cbgnitive
abilities. This transfbrmation, sadly, has its
opposite: the perpetuation of a class of people
deficient in these endowments and abilities,
and increasingly doomed to labor, if they find
work at all, outside the information economy.
In a book that is ceaain b ignite an explosive
controversy Herrnstein and Murray break new
ground in exploring the ways that low intelli-
gence, independent of social, economic, or ethnic
background lies at the At of many of our social
problems, The authors also demonstrate the
truth of another taboo Gee that intelltgence lev-
els differ among ethnic groups. This &ding is
already well-known and widely discussed among
psychometricians and other scholars. In llhe Bell
Curve, Herrnstein and Murray open this body of
scholarship to the general public.
Our public policy refkses to acknowledge the
pro06 of human merence, or to deal with its
consequences. With relentless and unassailable
thoroughness, Herrnstein and Murray fbr the
£irst time show that fbr a wide range of
intractable social
the decisive correla-
tion is bktween a high incidence ofthe problem
and tlie low intelligence of those who suffer
from it: this holds for school dropouts, unem-
ployment, work-related inlq, out or wedlock
birihs, crime, and many oihe; social problems.
Though we stubbornly deny it, these social
problems correlate to a s i e c a n t degree with
intelligence.
Only by k i n g up to this undeniable news
can we begin to accurately assess the nation's
problems and make realistic plans for address-
ing them. That means in the &st instance
accepting that there are great Merences in
intelligence between groups of people, as well
as among individuals in any
Just as
important, it also means learning that these
group dBerences do not just*
prejudicial
assumptions about any member of a given
C
group whose intelligence and potentd may, in
fkt, be anywhere under the bell cu&e of intel-
ligence fiom the dullest to the most brilliant.
But it does mean we must have the courage to
revise what wecan talk about in public. This
book is the first important step toward that
diflicult but necessary goal.
received his
Ph.D. in psychology at Harvard where he has
taught since I958 and now holds the Edgar
Pierce Chair in Psychology.
- 4 A R L MUIPI, ,,, a graduate of Harvard
who received his PhiD, in Political Science
from m, is the author of Losing Gmund-
Amwiran Social Policy Z95&1980.
He is cur-
rently a Bradley ellow ow at the American
HE FREE
.-
PRESS
Printed in the U.S.A.
1994 Simon & Schuster Inc.
Distributed by Simon & Schuster h c .
jacket ' d 4 n O REM Studio, I ~ E .
THE BELL CURVE
Intelligence and Class Structure
in American Life
RICHARD J. HERRNSTEIN
CHARLES MURRAY
THE FREE PRESS
New York London Toronto Sydney Tokyo Singapore
For
JULIA,
MAX,
JAMES,
NARISARA,
SARAWAN,
ANNA,
AND BENNETT
We wrote with your world in our thoughts
Copyright Q 1994 by Richard J. Hemstein and Charles Murray
All rights reserved. No part of this hook may be reproduced or transmitted in any form or hy any
means, electronic or mechanical, including photocopying, recording, or hy any information stor-
age and retrieval system, without permission in writing from the Publisher.
The Free Press
A Division of Simon & Schuster Inc.
866 Third Avenue, New York, N.Y. 10022
Printed in the United States of America
printing number
8 9 1 0
Library of Congress Cataloging.in9ublication Data
Hemstein, Richard J.
The bell curve : intelligence and class structure in American life
/Richard J. Hemstein, Charles Murray
p, cm.
ISBN 0-02-914673-9
1. Intellect. 2. Nature and nurture, 3. Intelligence levels-
Social aspects. 4. Educational psychology. I. Murray, Charles A.
11, %ele.
BF43I.H398
1994
305.9'0824~20
94-29694
CIP
The Bell Curve Front Matter
- The text establishes the formal publication details of 'The Bell Curve' by Richard J. Herrnstein and Charles Murray, published in 1994.
- An introductory quote by Edmund Burke argues against the suppression of truth for fear of social consequences, setting a provocative tone for the work.
- The table of contents outlines a four-part structure focusing on the emergence of a cognitive elite and the relationship between intelligence and social behavior.
- The book explores controversial themes including ethnic differences in cognitive ability and the impact of IQ on welfare, crime, and parenting.
- The final sections address policy-driven topics such as affirmative action and the future of American social stratification.
- Early illustrations highlight a historical shift where college attendance and professional success became increasingly tied to IQ scores throughout the 20th century.
They argue against a fair Discussion of popular Prejudices, because, say they, tho' they would be found without any reasonable Support, yet the Discovery might be productive of the most dangerous Consequences.
For
JULIA,
MAX,
JAMES,
NARISARA,
SARAWAN,
ANNA,
AND BENNETT
We wrote with your world in our thoughts
Copyright Q 1994 by Richard J. Hemstein and Charles Murray
All rights reserved. No part of this hook may be reproduced or transmitted in any form or hy any
means, electronic or mechanical, including photocopying, recording, or hy any information stor-
age and retrieval system, without permission in writing from the Publisher.
The Free Press
A Division of Simon & Schuster Inc.
866 Third Avenue, New York, N.Y. 10022
Printed in the United States of America
printing number
8 9 1 0
Library of Congress Cataloging.in9ublication Data
Hemstein, Richard J.
The bell curve : intelligence and class structure in American life
/Richard J. Hemstein, Charles Murray
p, cm.
ISBN 0-02-914673-9
1. Intellect. 2. Nature and nurture, 3. Intelligence levels-
Social aspects. 4. Educational psychology. I. Murray, Charles A.
11, %ele.
BF43I.H398
1994
305.9'0824~20
94-29694
CIP
There is a most absurd and audacious Method of reasoning avowed by
some Bigots and Enthusiasts, and through Fear assented to by some wiser
and better Men; it is this. They argue against a fair Discussion of pop-
ular Prejudices, because, say they, tho' they would be found without any
reasonable Support, yet the Discovery might be productive of the most
dangerous Consequences. Absurd and blasphemous Notion! As if all
Happiness was not connected with the Practice of Virtue, which nec-
essarily depends upon the Knowledge of Trurh.
EDMUND BURKE
A Vindication of Natural Society
Contents
List of Illusmation$ xi
List of Tabks
xvii
A Note to the Reader
xix
Prefme
xxi
Acknoculcdgme71ts
sxv
PART I.
THE EMERGENCE OF A COGNITIVE ELITE
1 Cognitive Class and Education, 1900-1 990
2 Cognitive Partitioning hy Occupation
3 The Econo~nic Pressure to Partition
4 Steeper Ladclers, Narrower Gates
PART 11.
COGNITIVE CLASSES AND SOCIAL BEHAVIOR
6 Schooling
1.43
7 Unemployment, Idleness, and Injury
155
viii
Contents
8 Family Matters
9 Welfare Dependency
10 Parenting
11 Crime
12 Civility and Citizenship
PART 111.
THE NATIONAL CONTEXT
13 Ethnic Differences in Cognitive Ability
269
14 Ethnic Inequalities in Relation to IQ
3 17
15 The Demography of Intelligence
34 1
16 Social Behavior and the Prevalence of Low Cognitive Ability 369
PART IV.
LIVING TOGETHER
17 Raising Cognitive Ability
18 The Leveling of American Education
19 Affirmative Action in Higher Education
20 Affirmative Action in the Workplace
21 The Way We Are Headed
22 A Place for Everyone
APPENDIXES
1 statistics for People Who Are Sure
They Can't Learn Statistics
2 Technical Issues Regarding the
National Longitudinal Survey of Youth
3 Technical Issues Regarding the Armed
Forces Qualification Test as a Measure of IQ
4 Regression Analyses from Part I1
Contents
ix
5 Supplemental Material for Chapter 13
625
6 Regression Analyses from Chapter 14
645
7 The Evolution of Affirmative Action
in the Workplace
655
Notes 665
Bibliography 775
Index 833
List of Illustrations
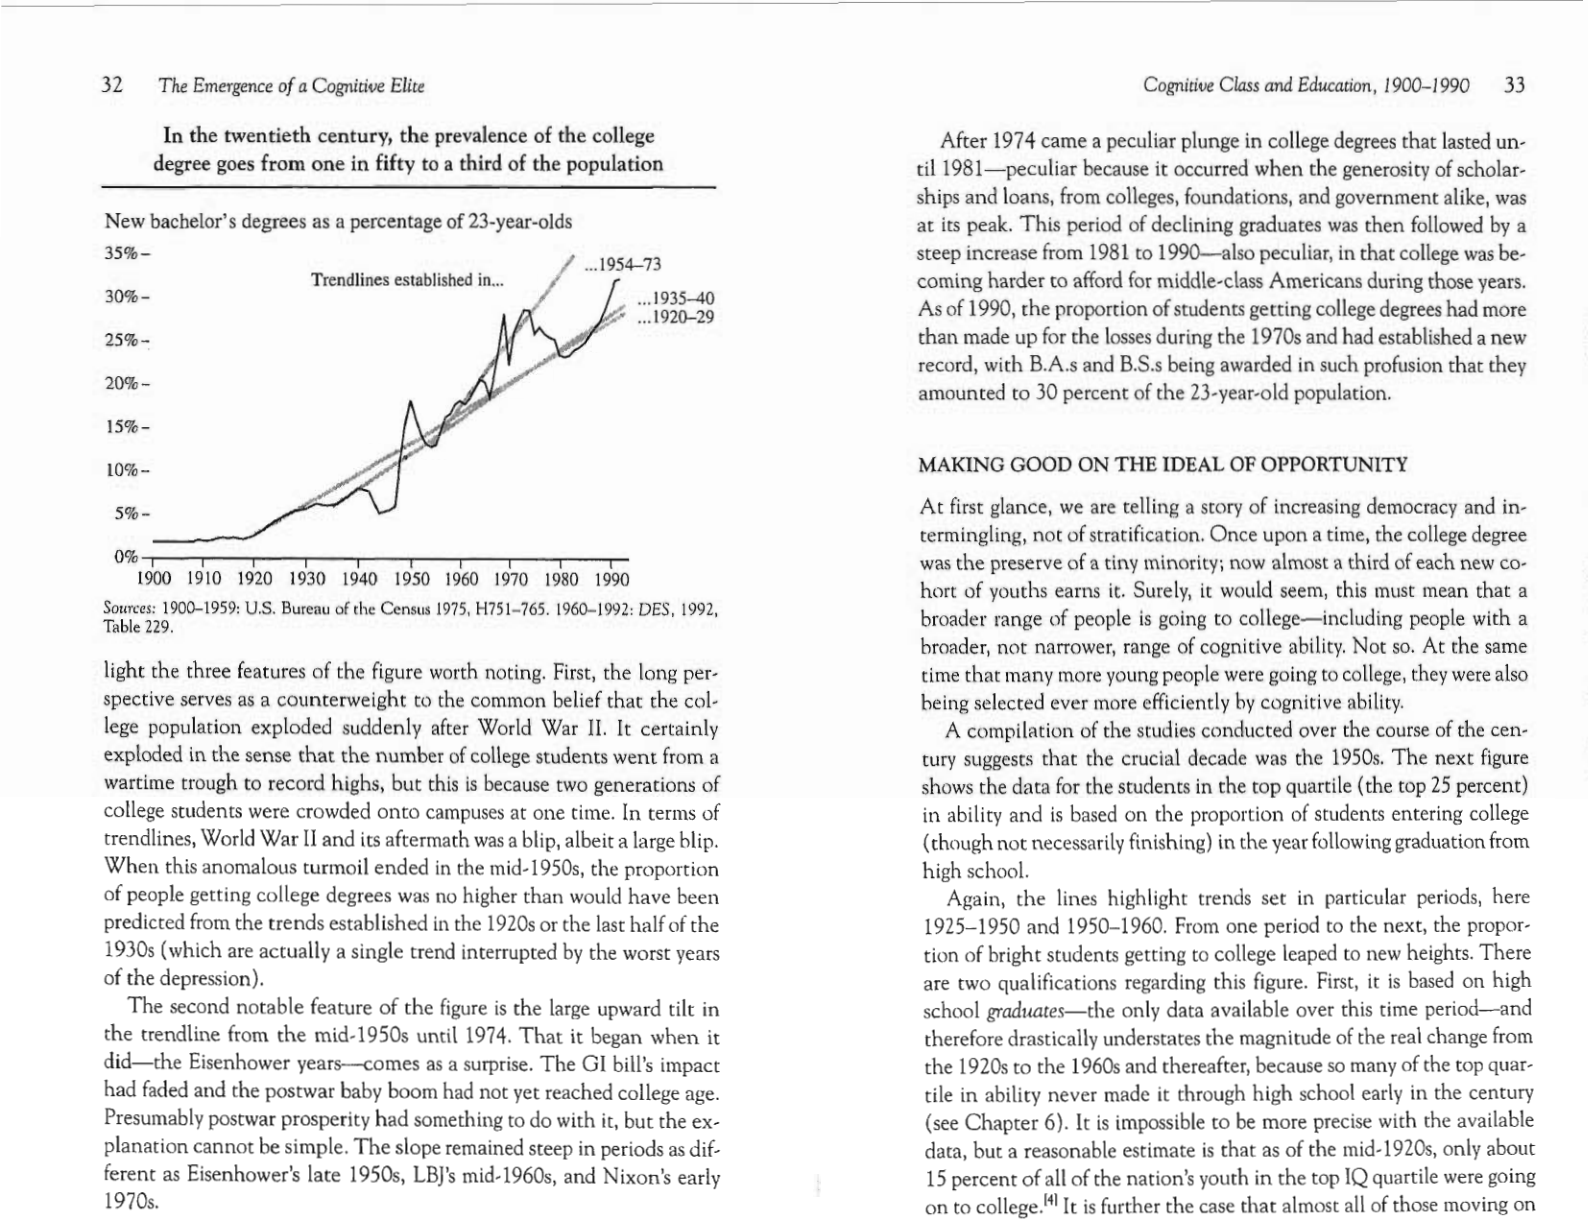
In the twentieth century, the prevalence of the college degree goes from
one in fifty to a third of the population
32
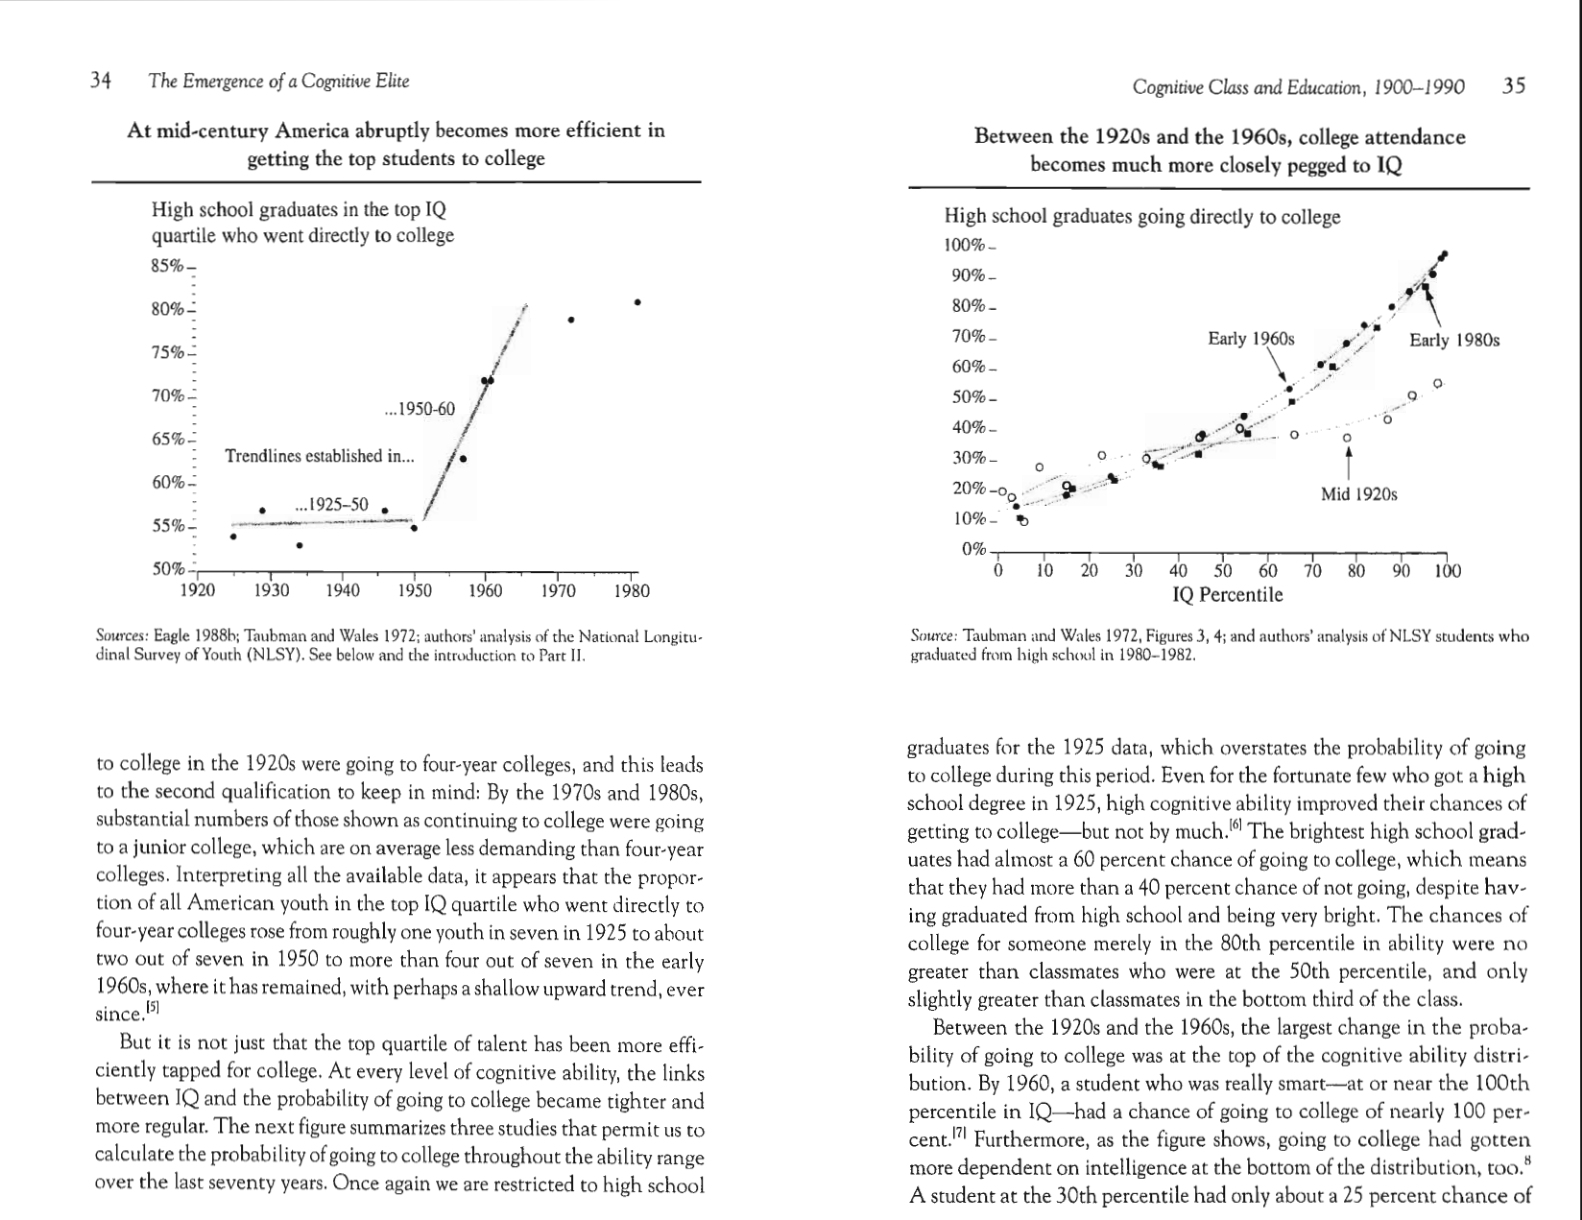
At mid-century, America abruptly becomes more efficient in getting the
top students to college 34
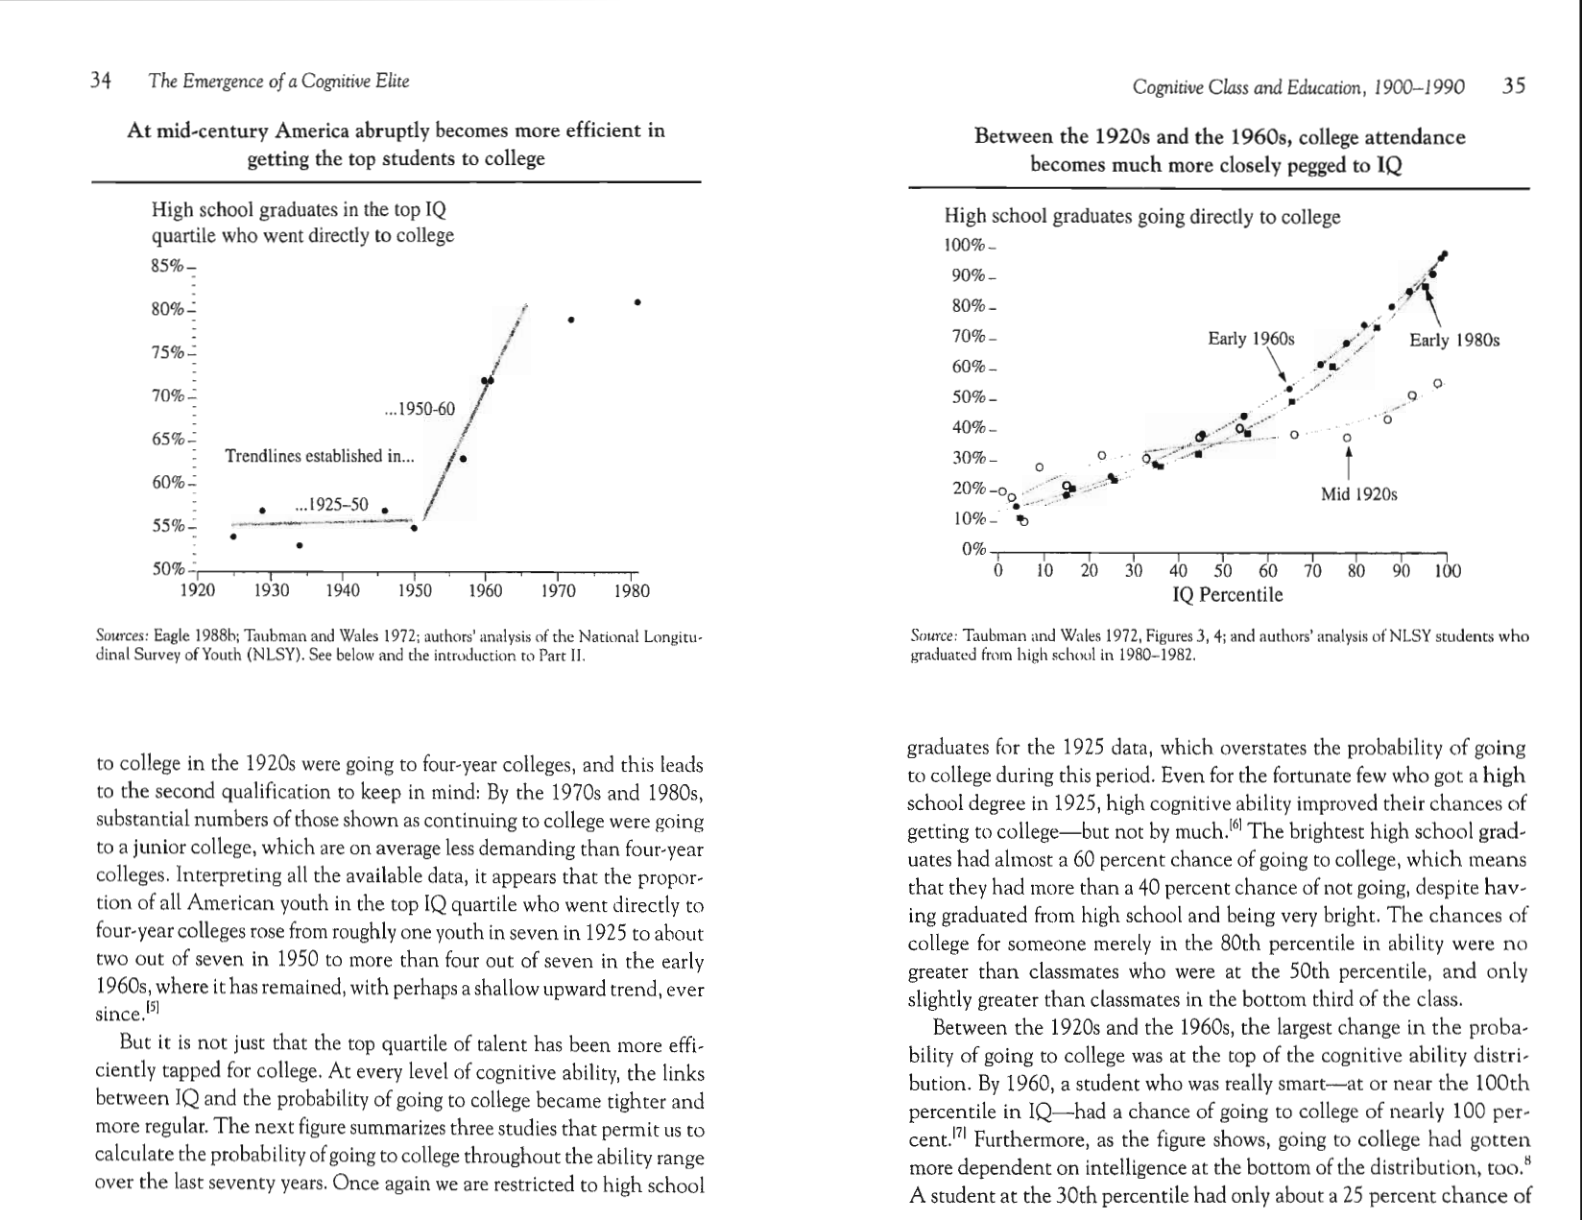
Between the 1920s and the 1960s, college attendance becomes more
closely pegged to IQ 35
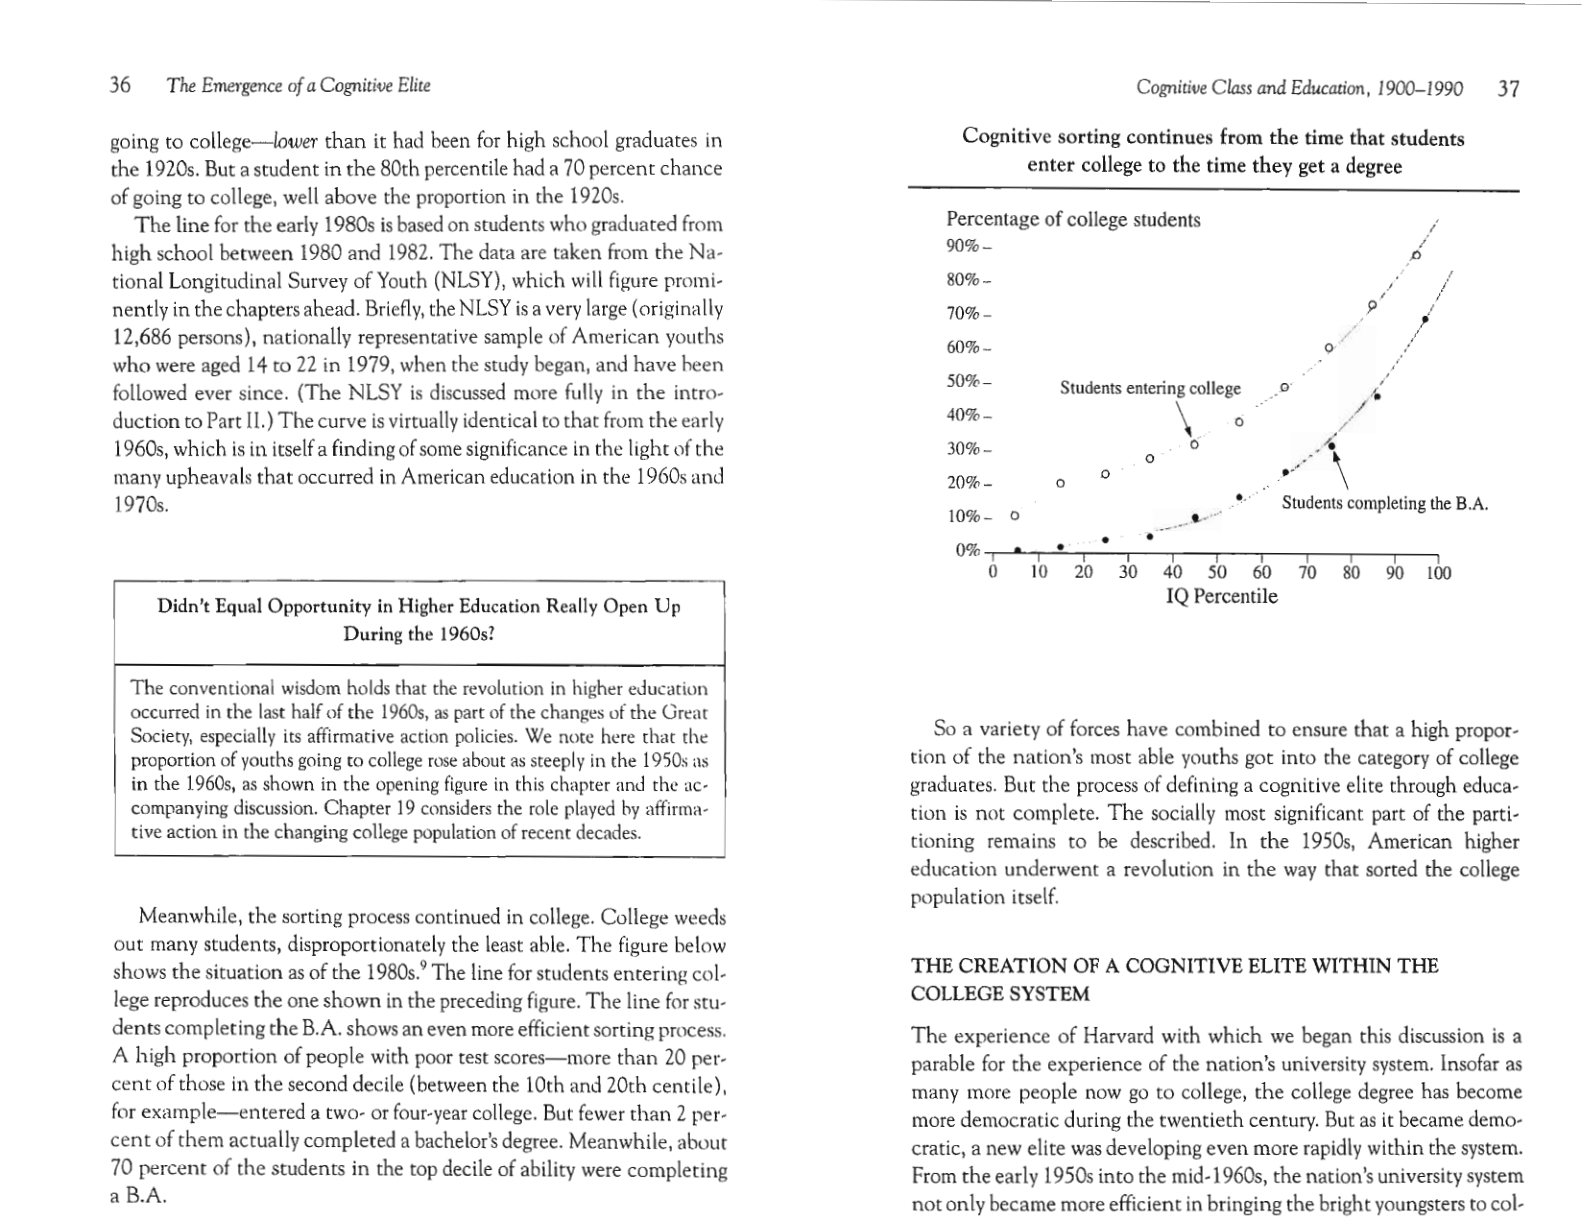
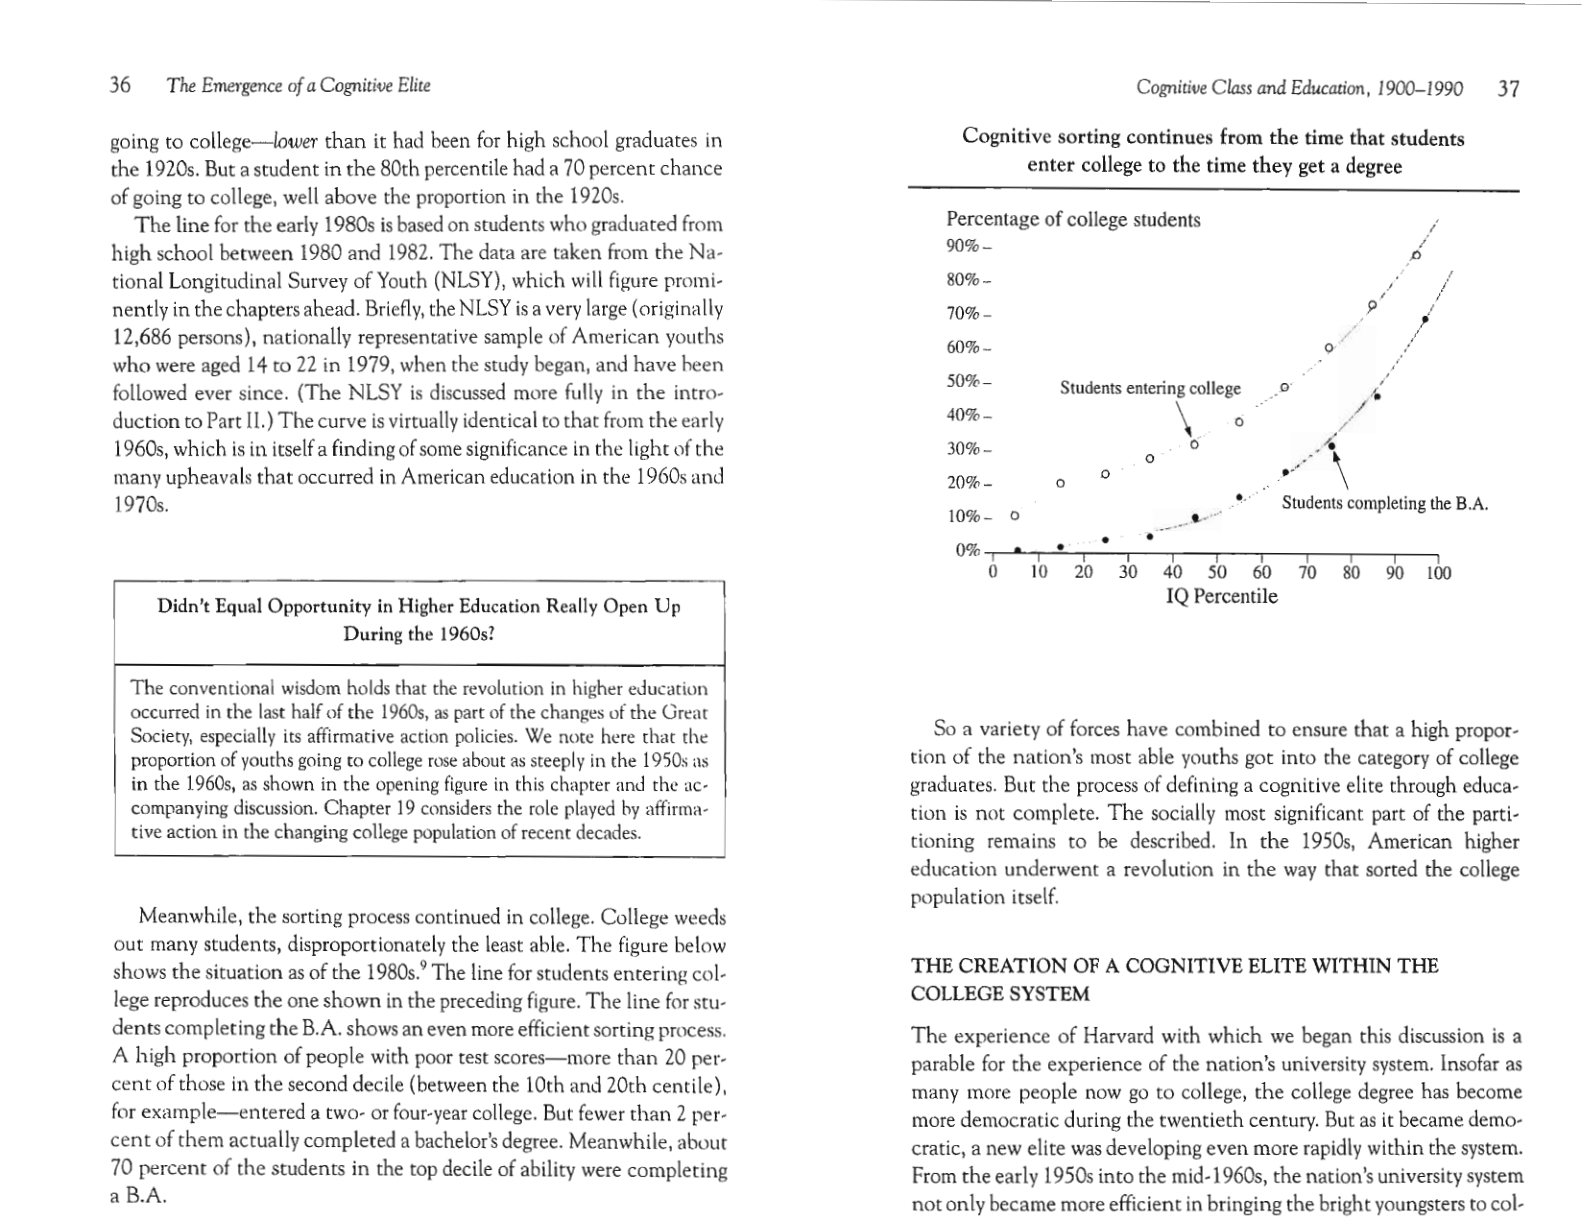
Cognitive sorting continues from the time that students enter college
to the time they get a degree 37
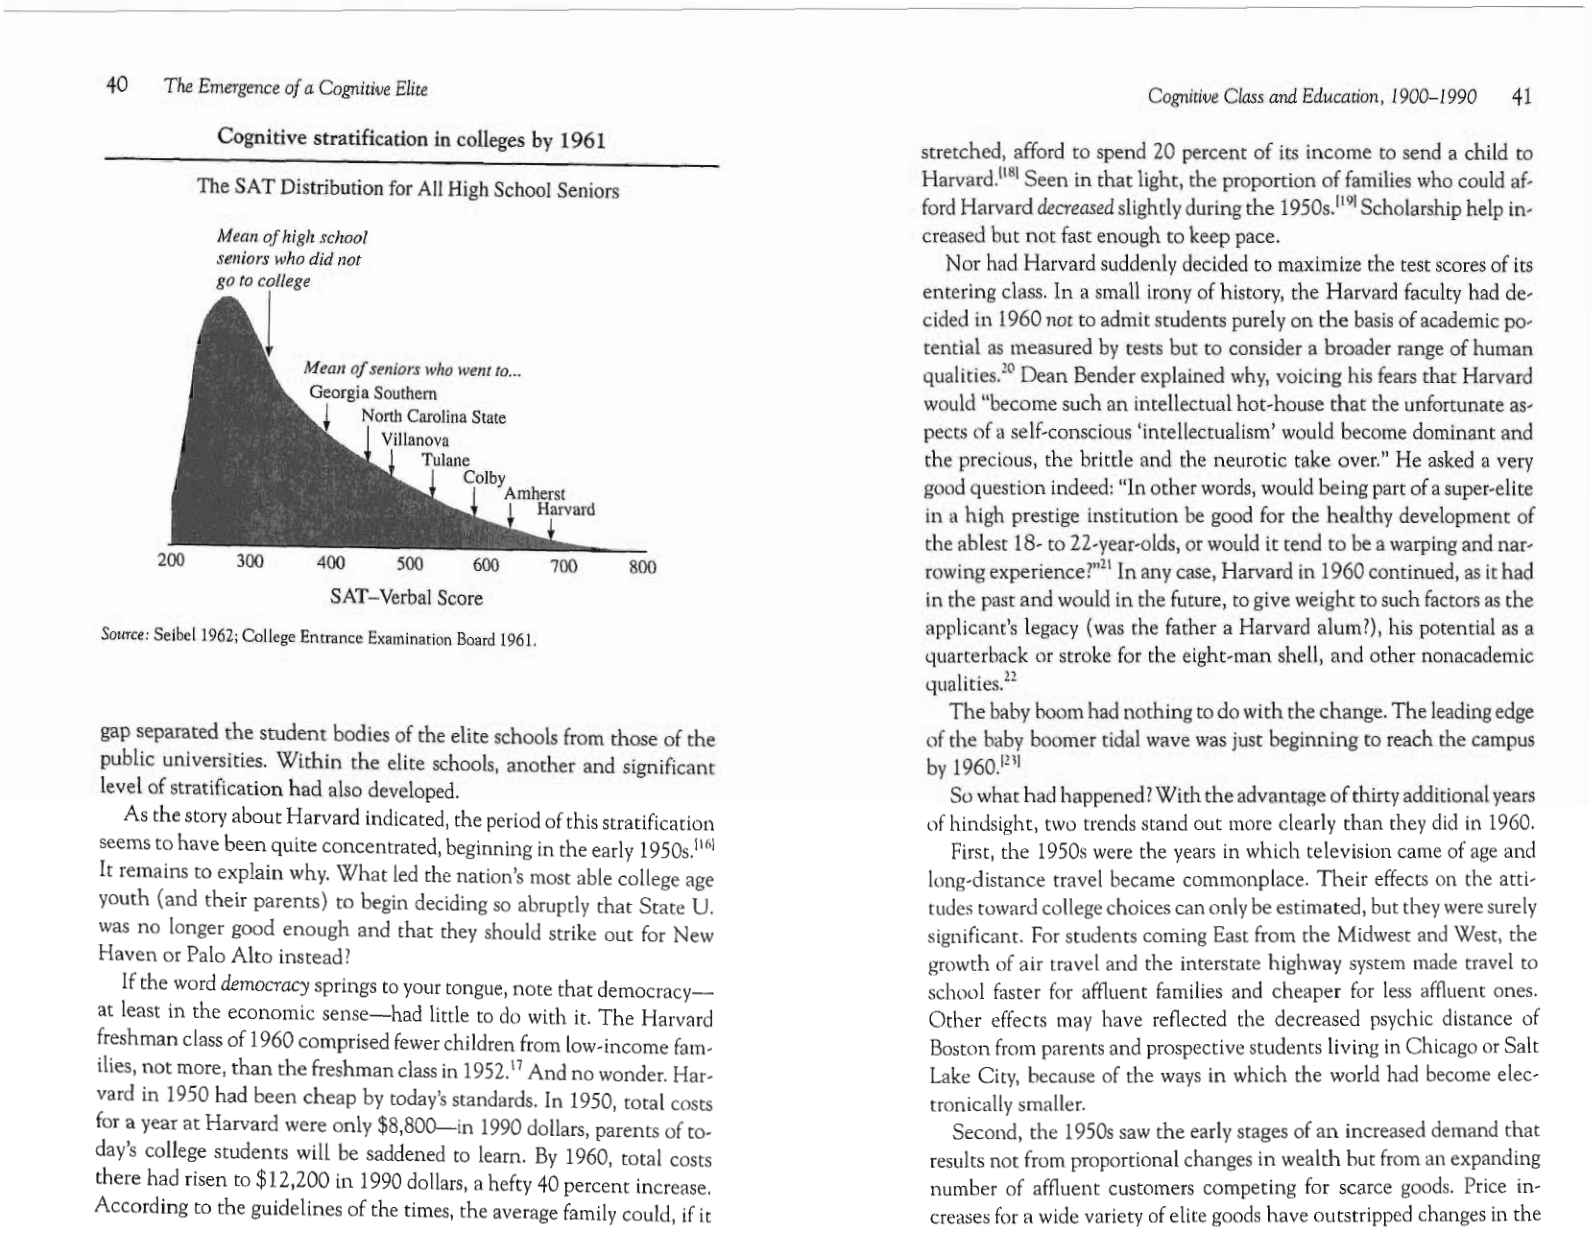
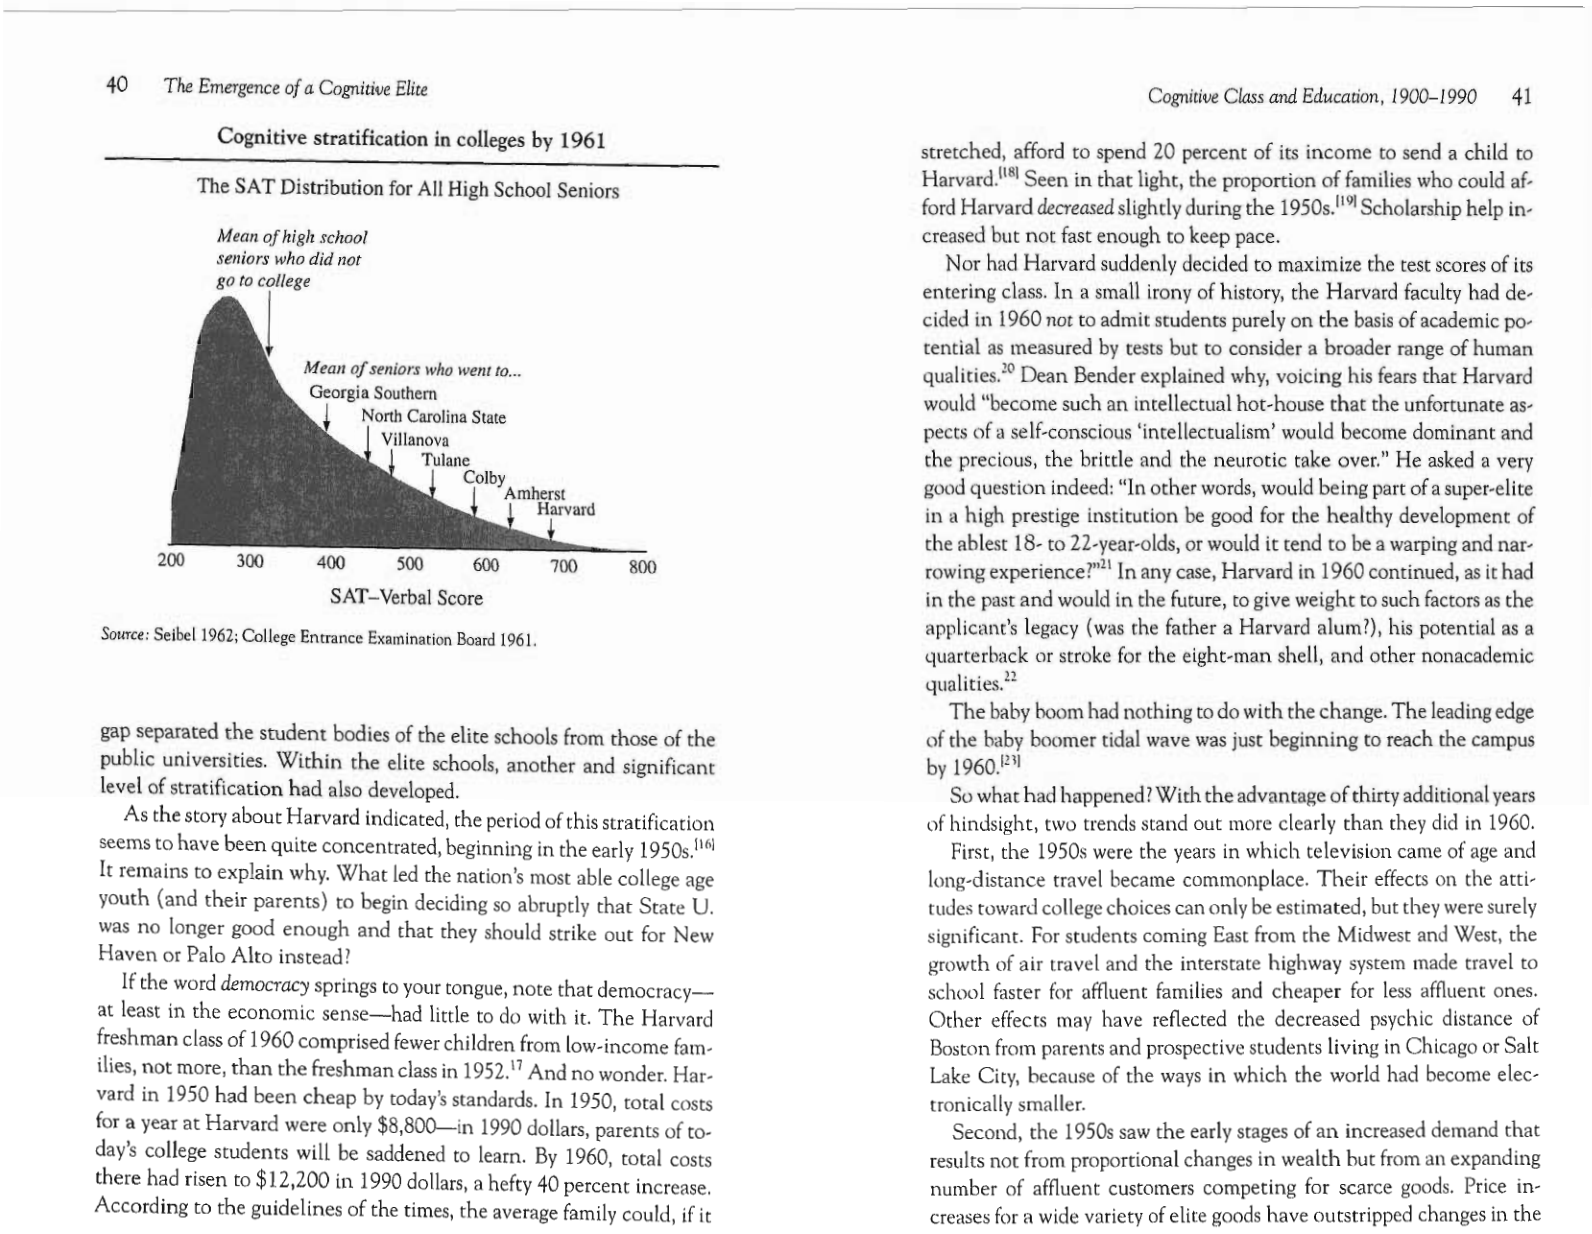
Cognitive stratification in colleges by 1961 40
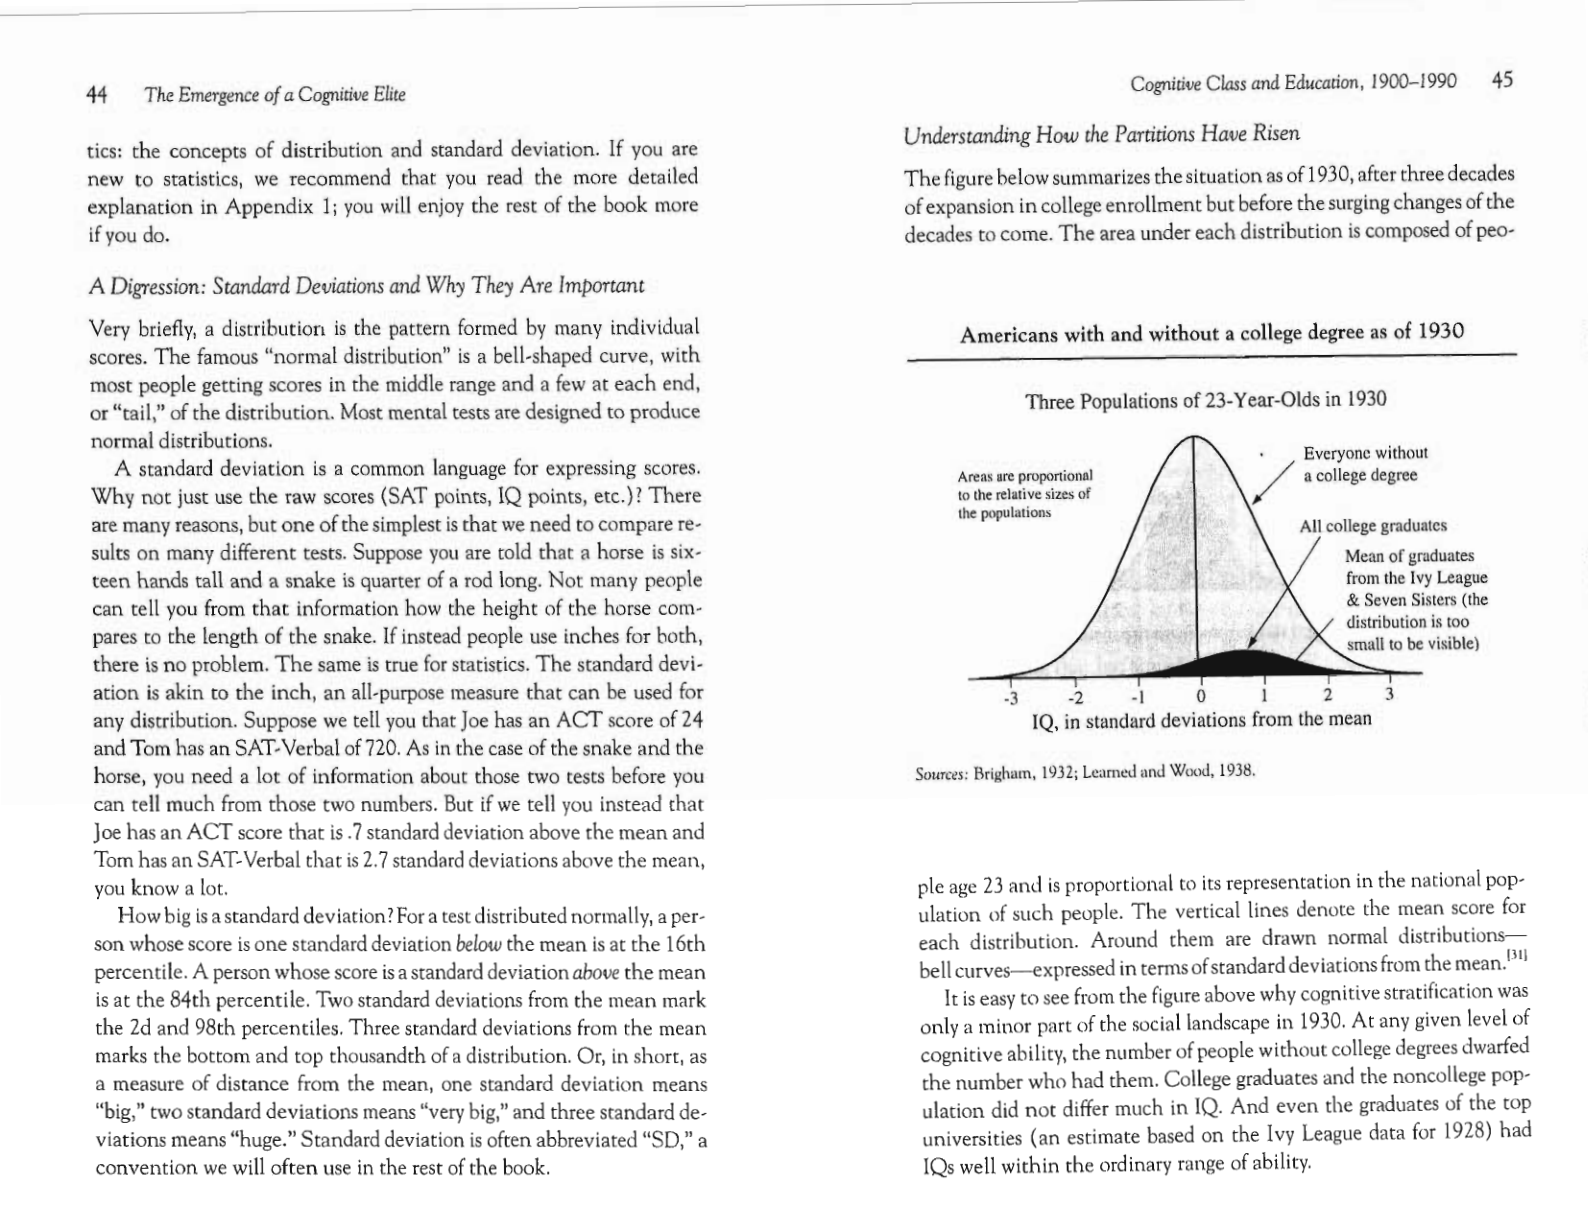
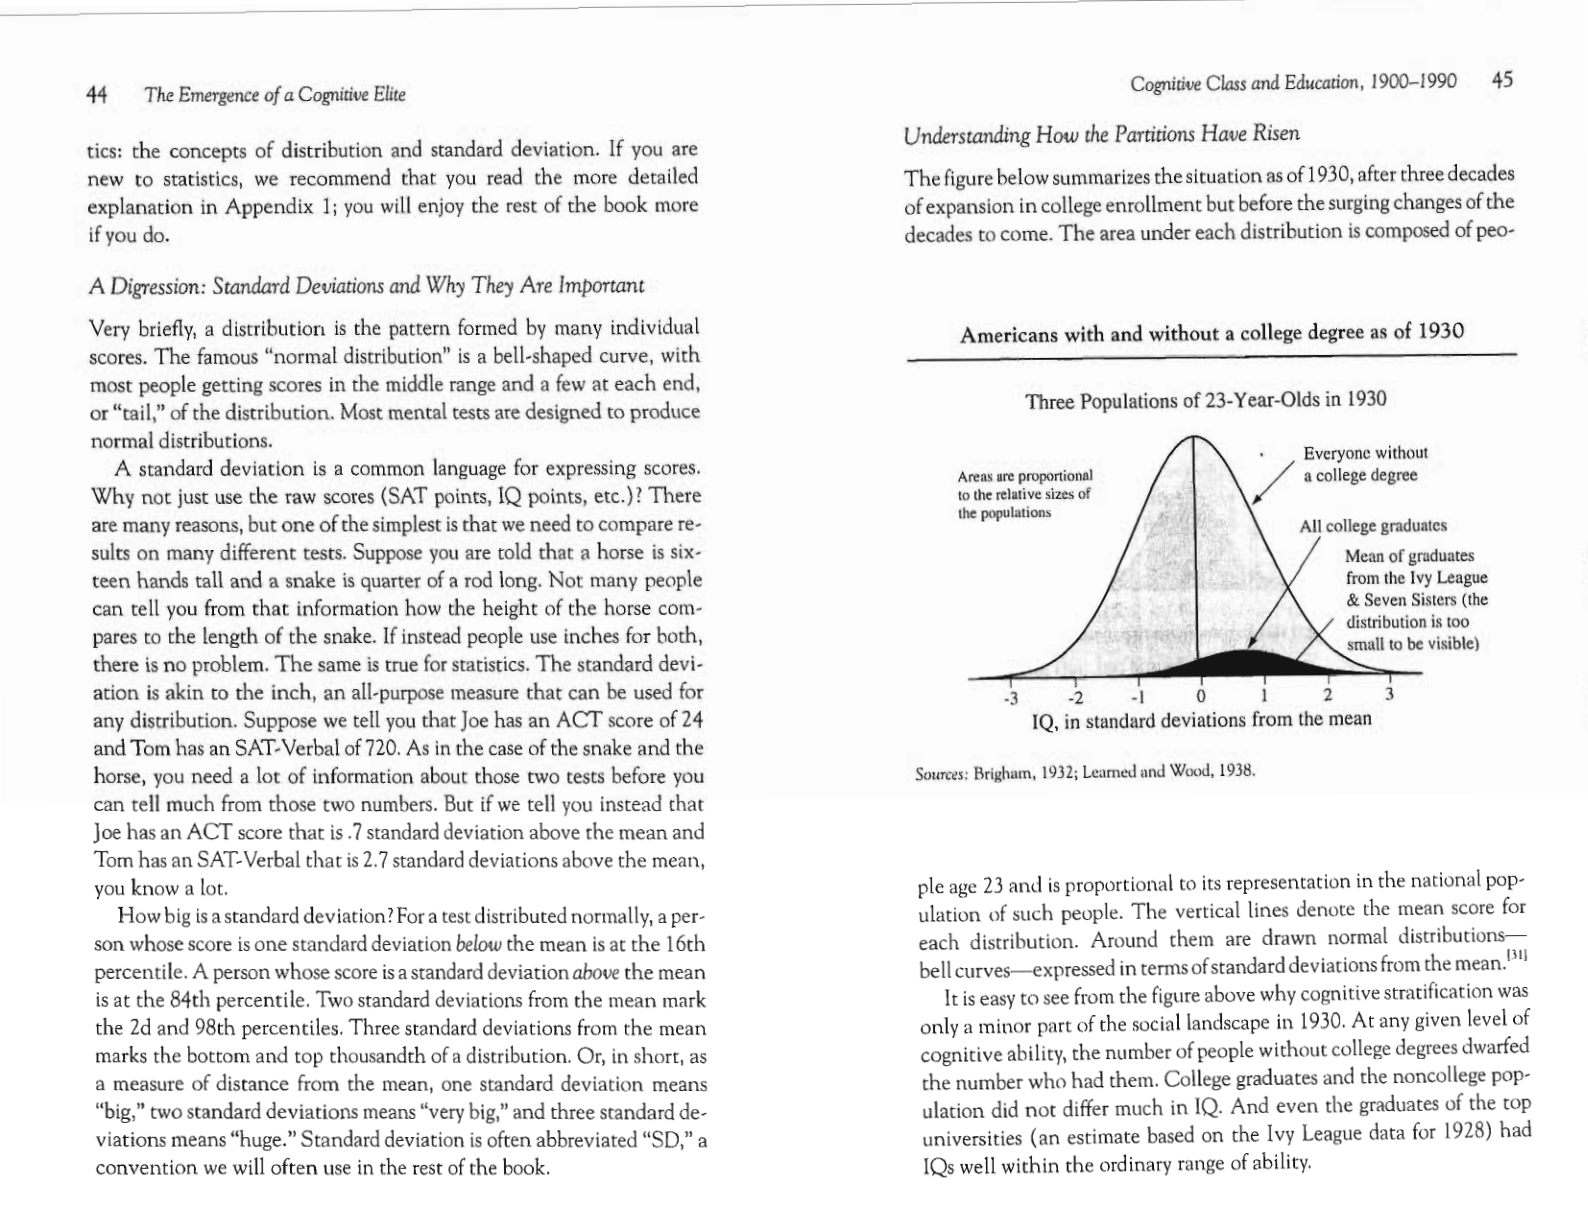
Americans with and without a college education as of 1930 45
Americans with and without a college education as of 1990 46
The top IQ decile becomes rapidly more concentrated in high-IQ pro-
fessions from 1940 onward
56
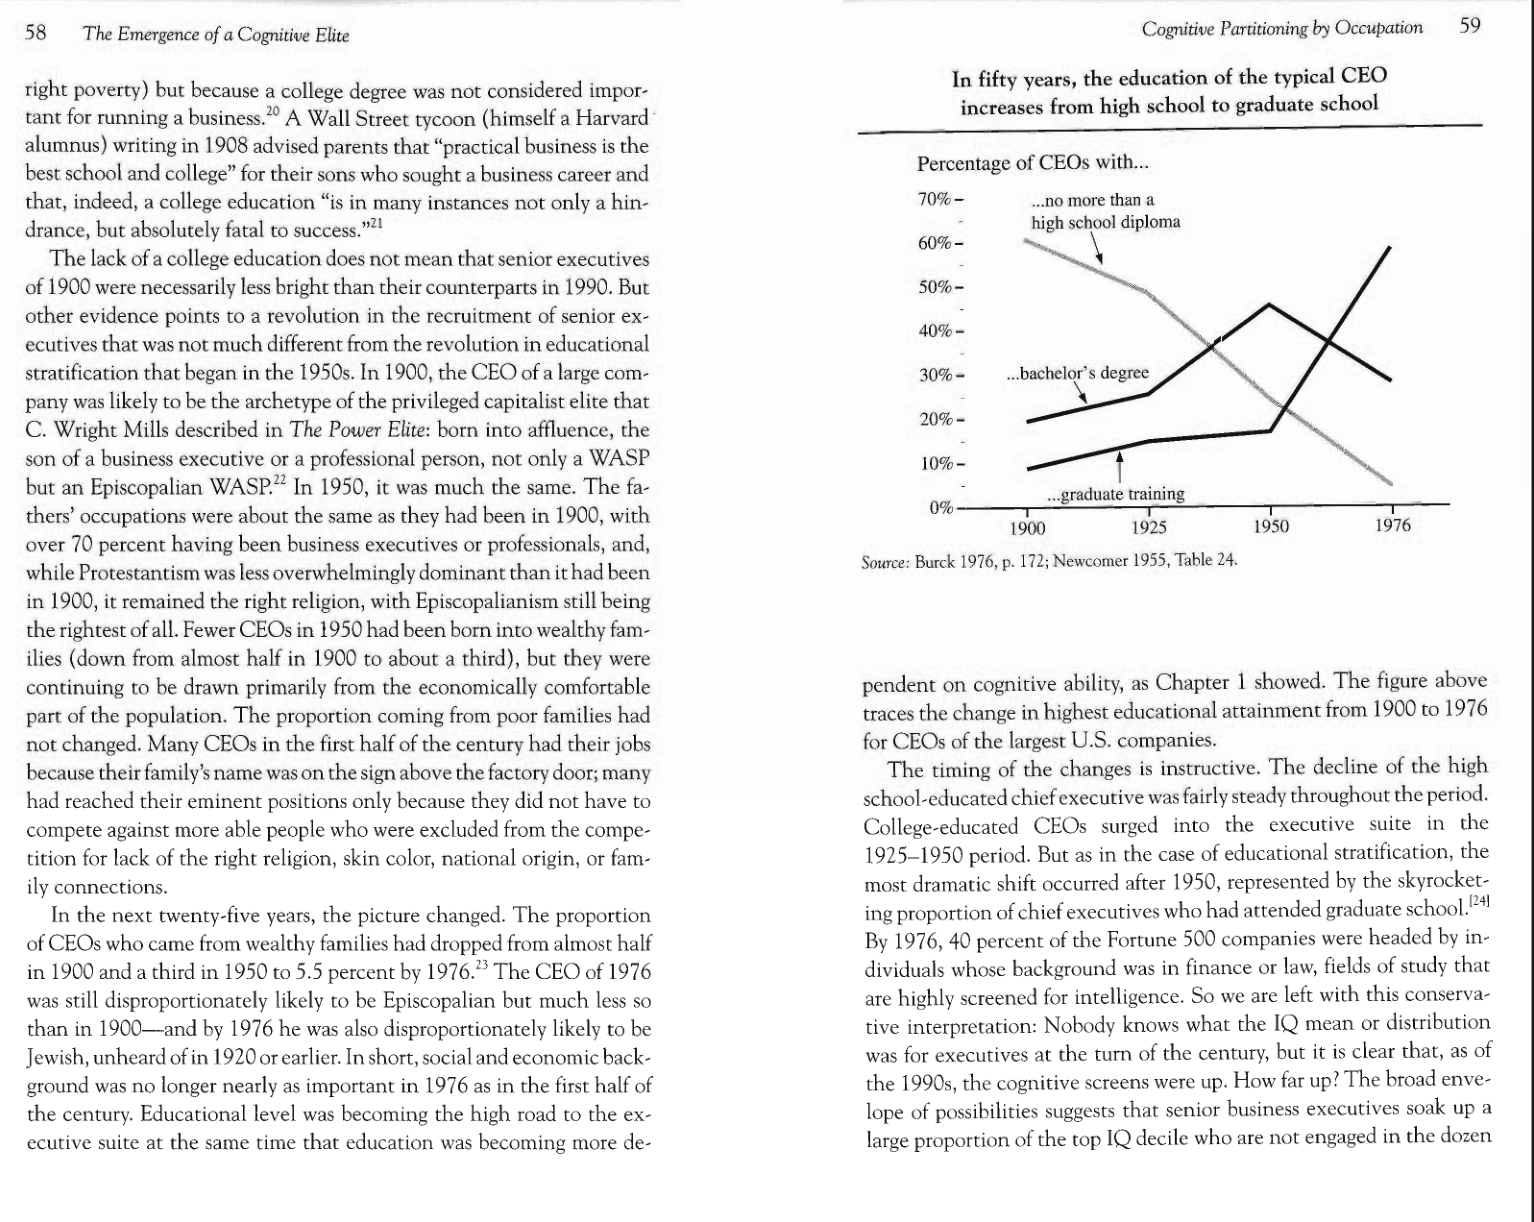
In fifty years, the education of the typical CEO increases from high
school to graduate school 59
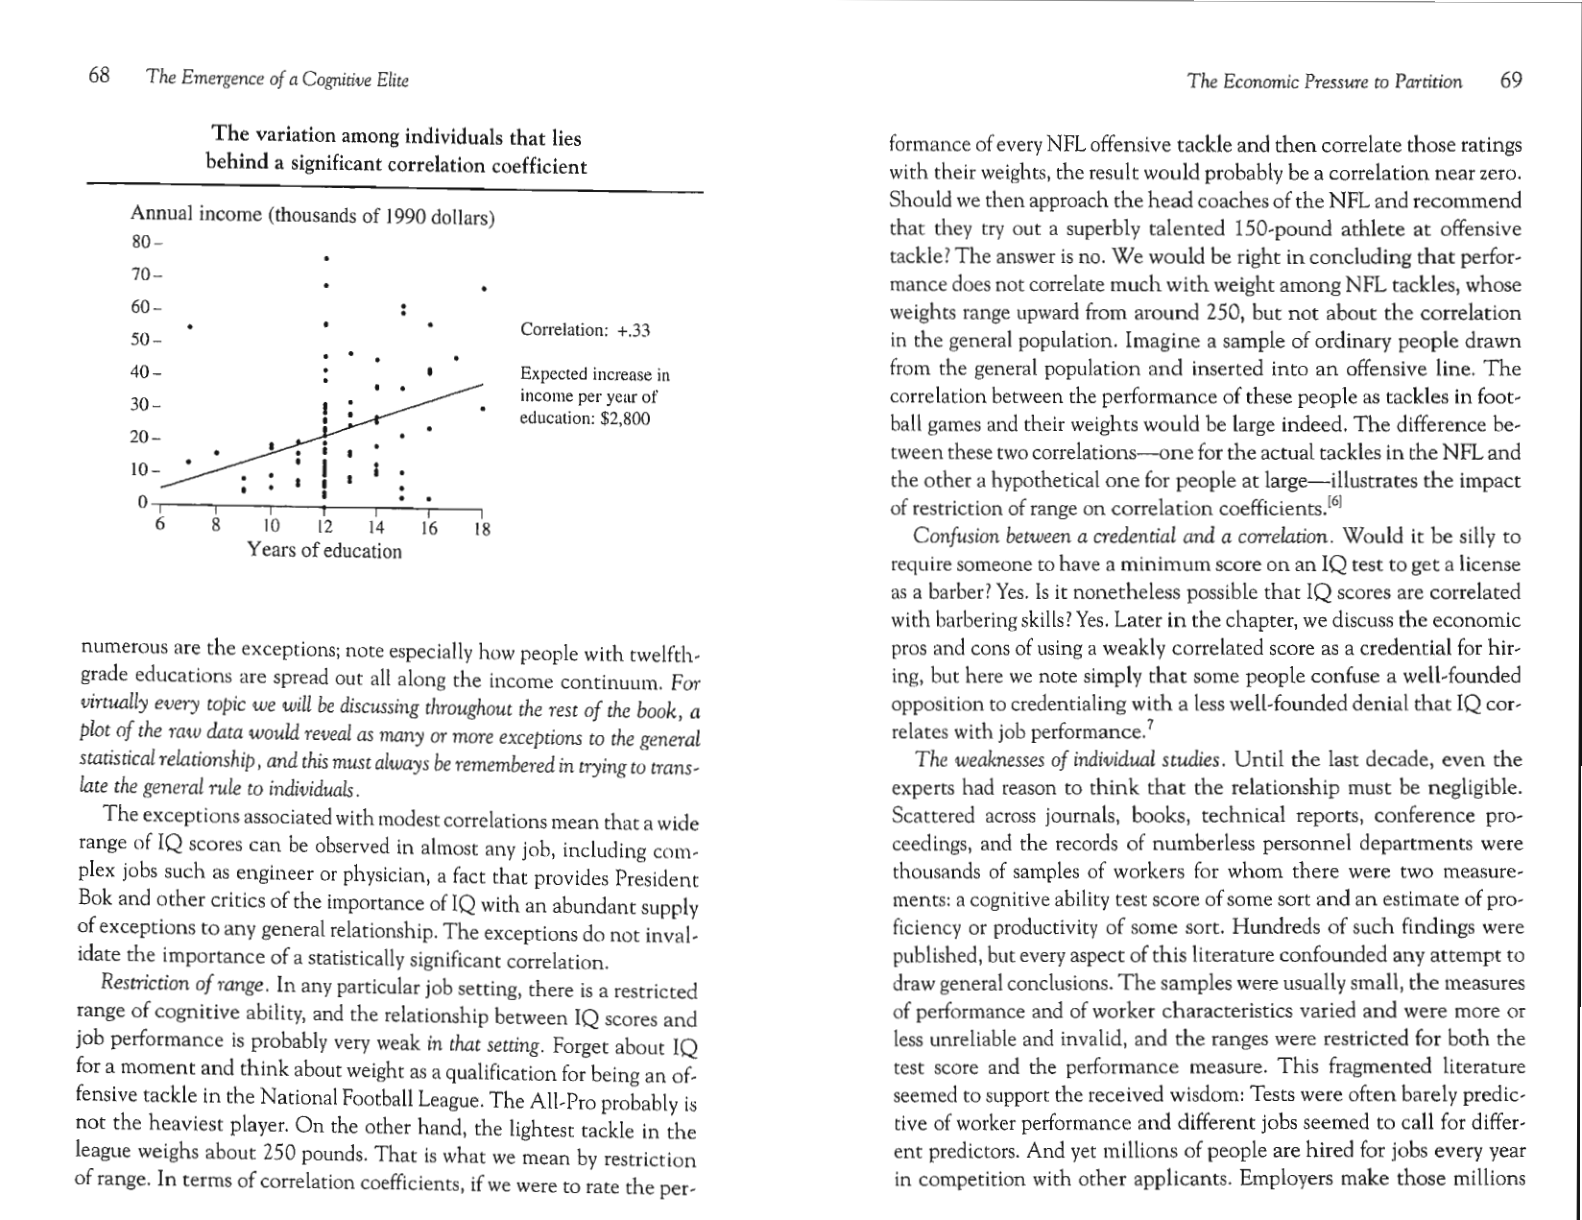
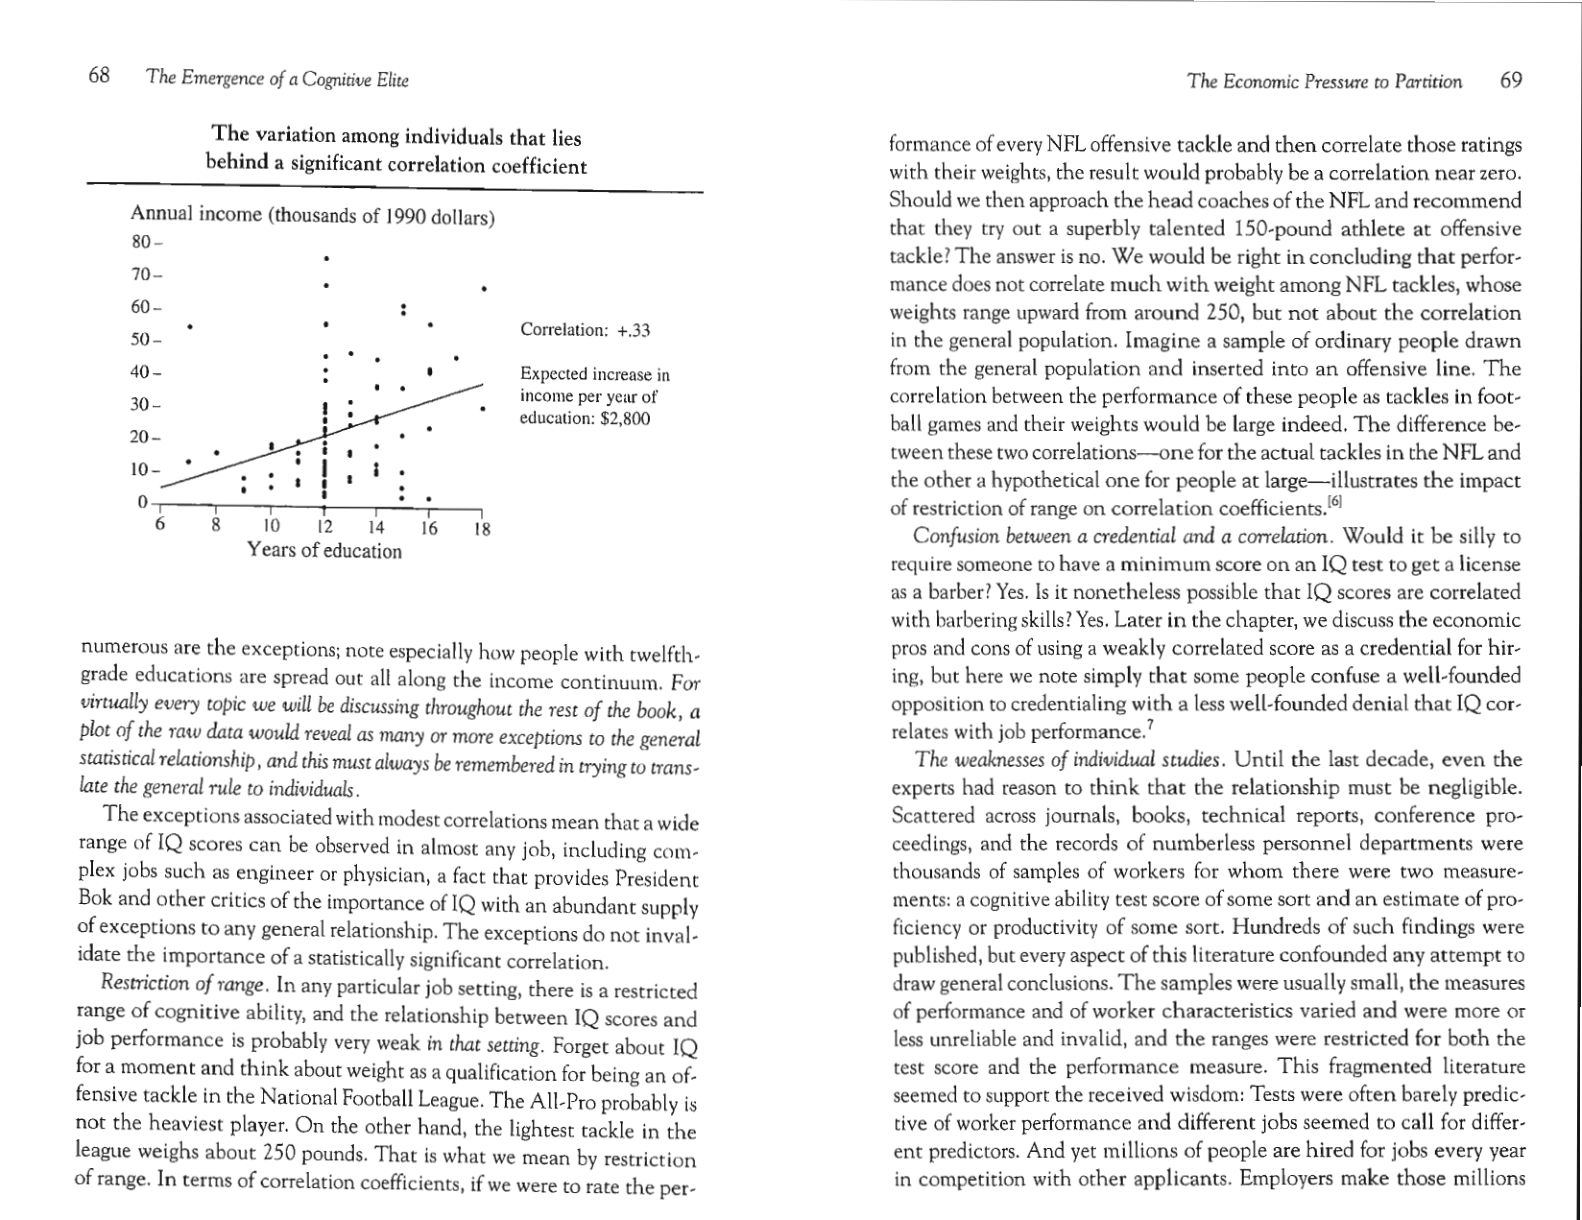
The variation among individuals that lies behind a significant correla-
tion coefficient 68
The advantages of hiring by test score 84
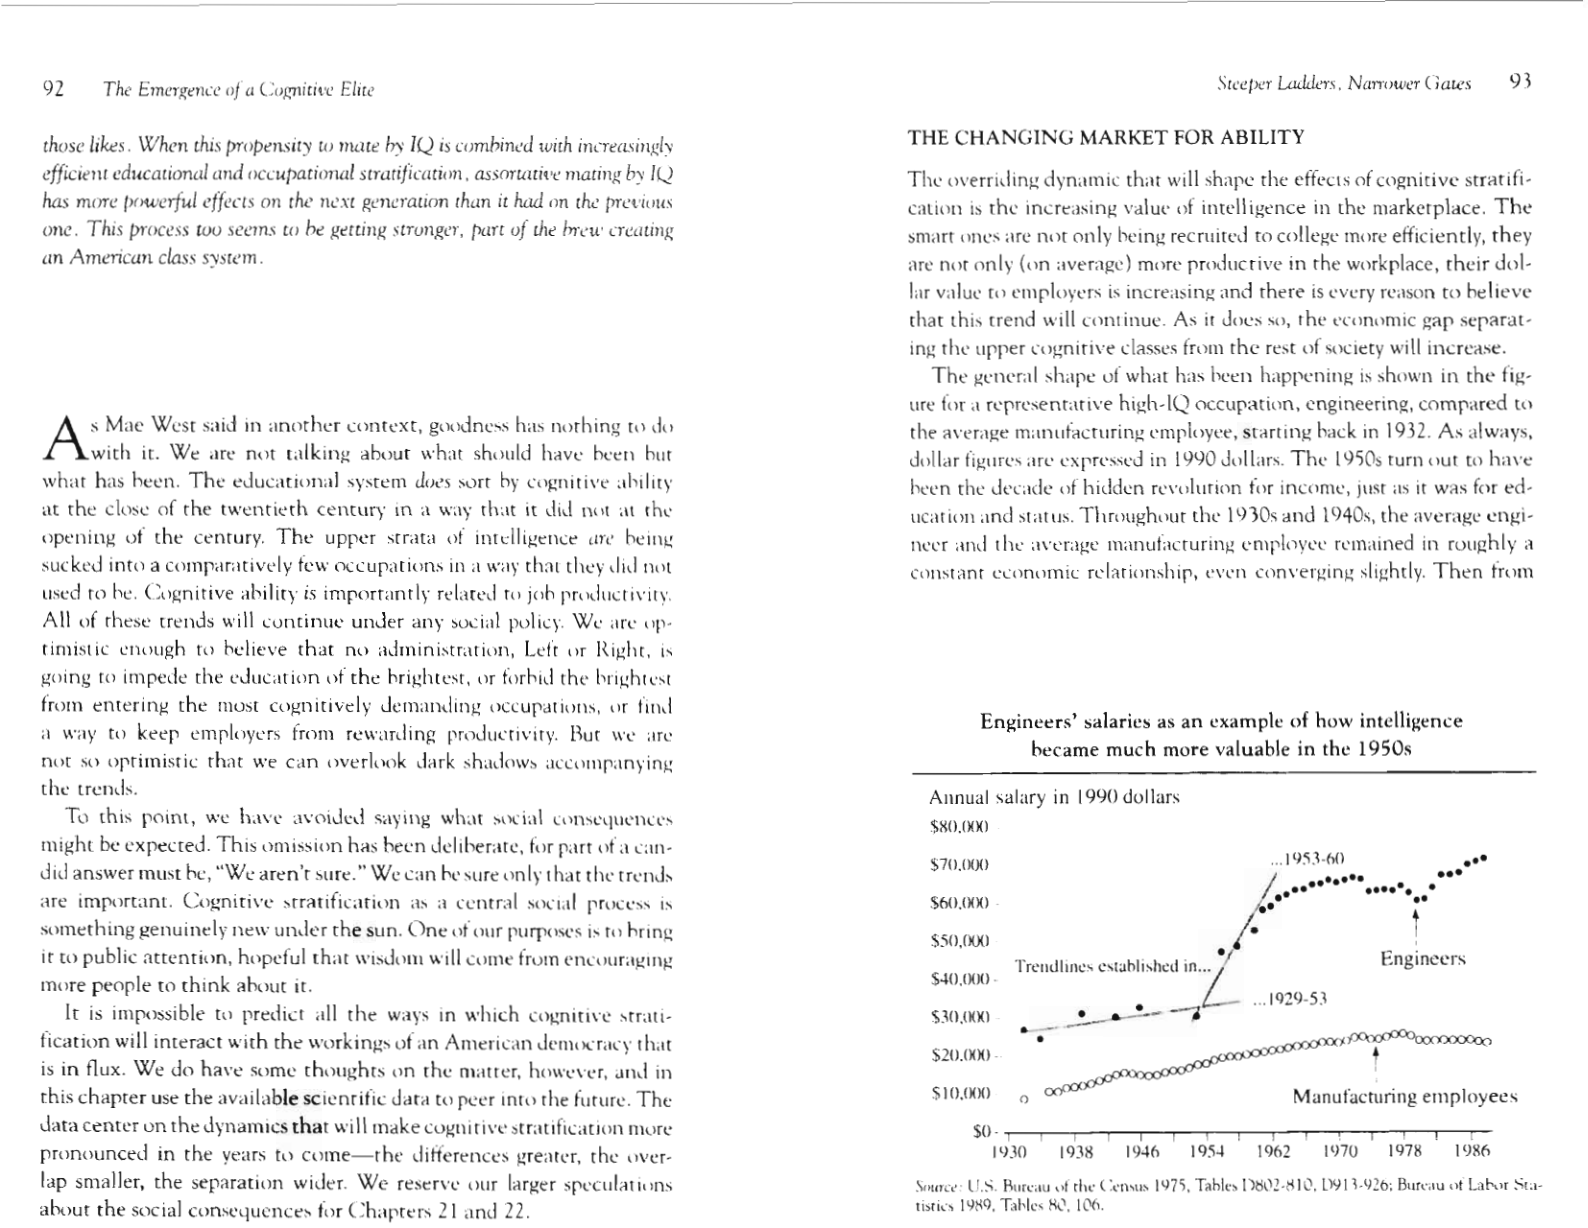
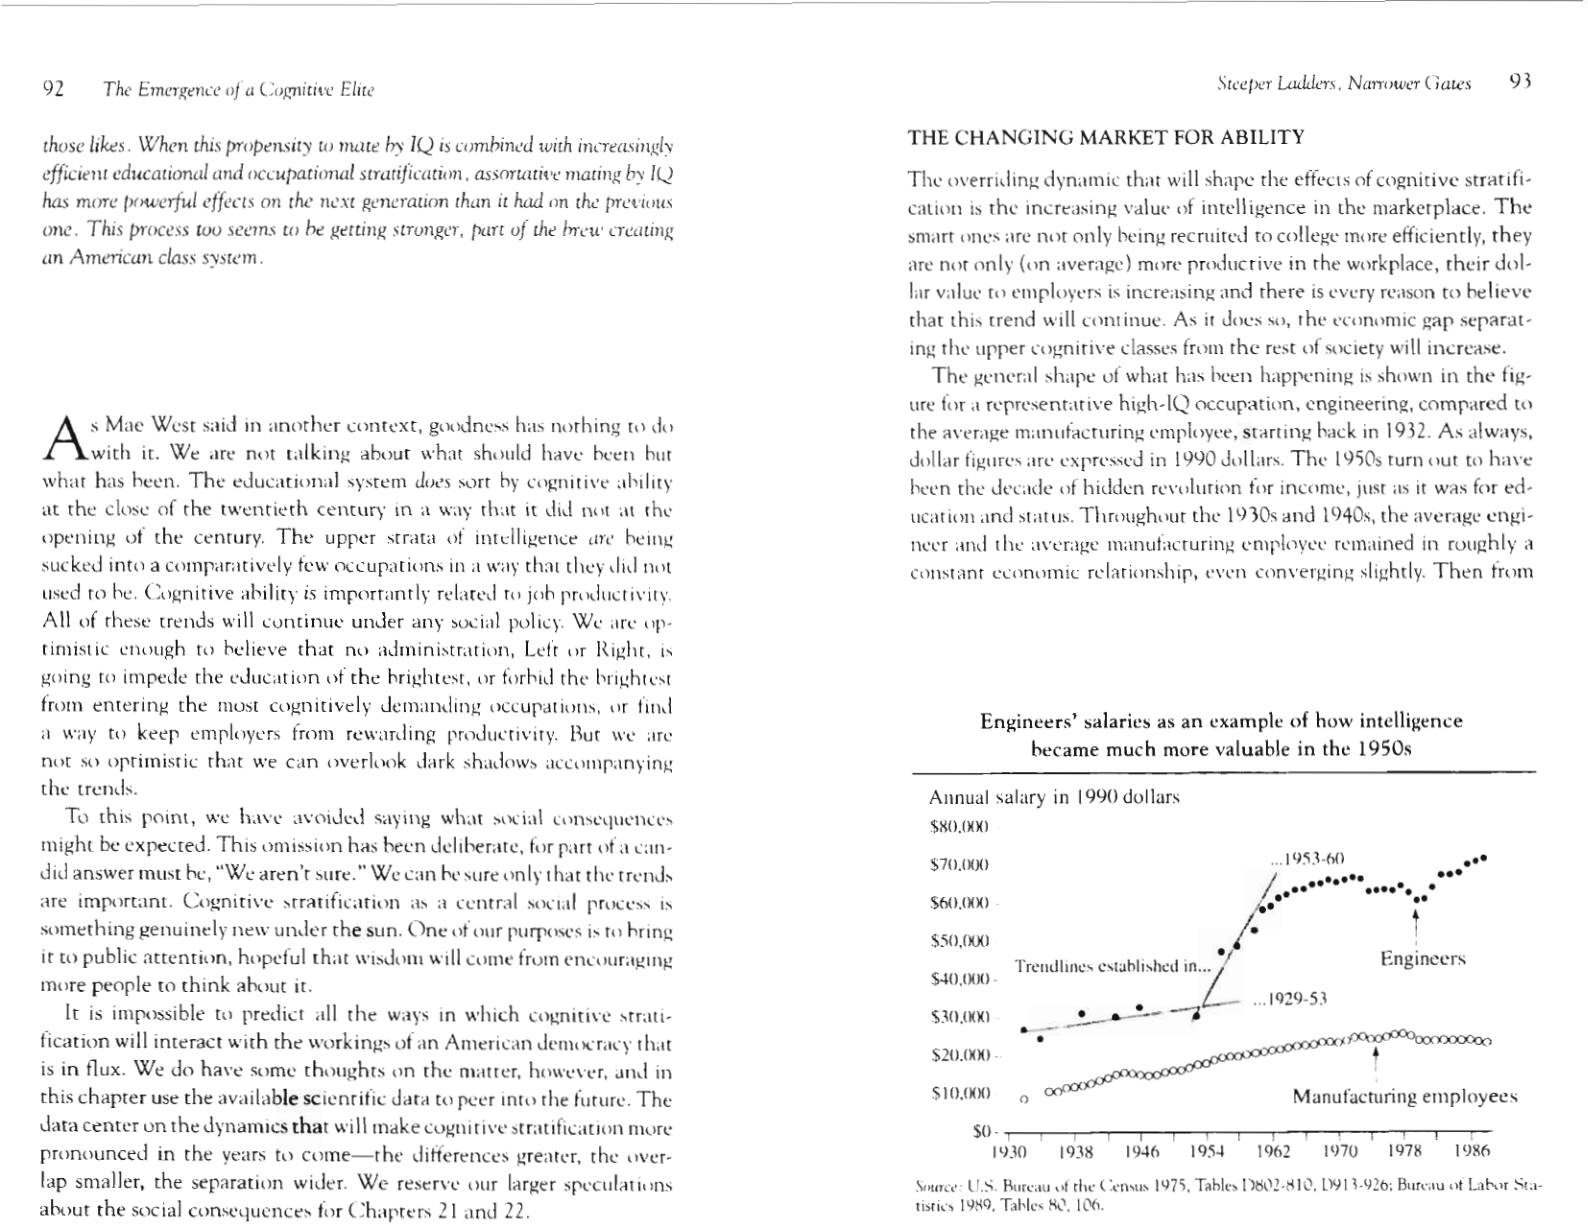
Engineers' salaries as an example of how intelligence became more valu-
able in the 1950s 93
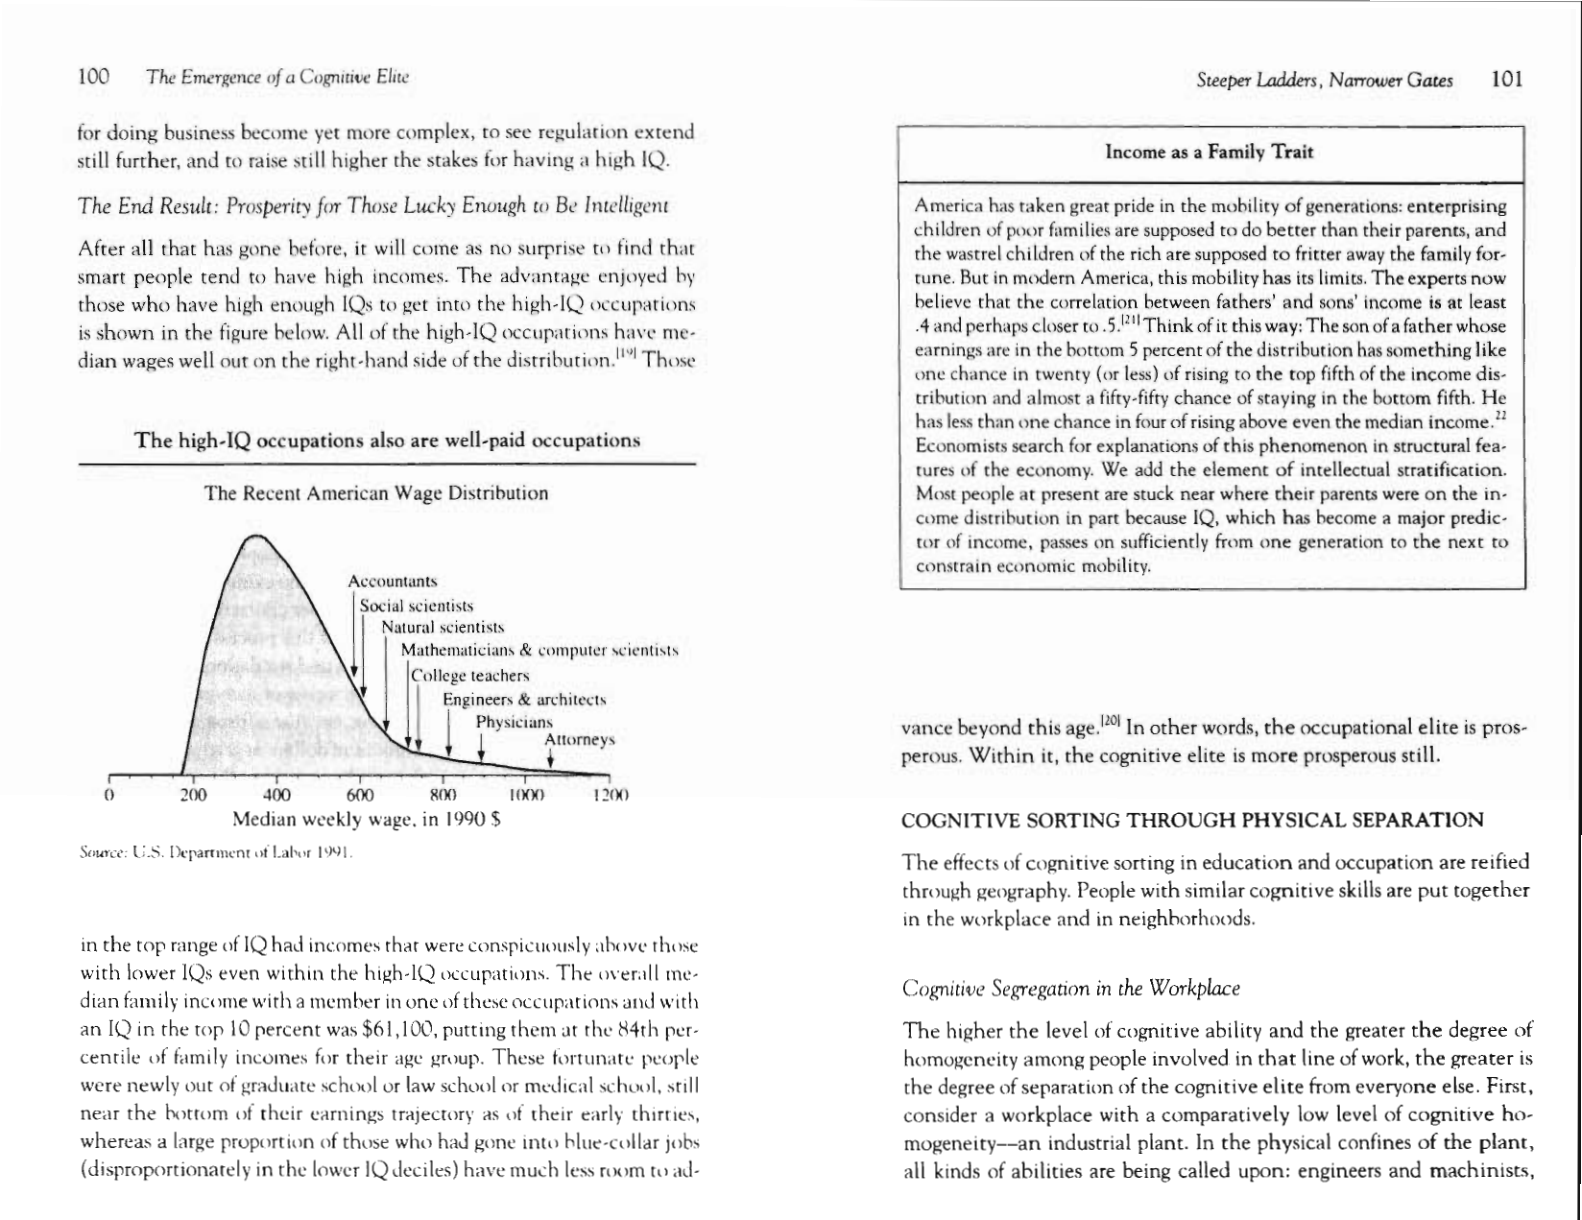
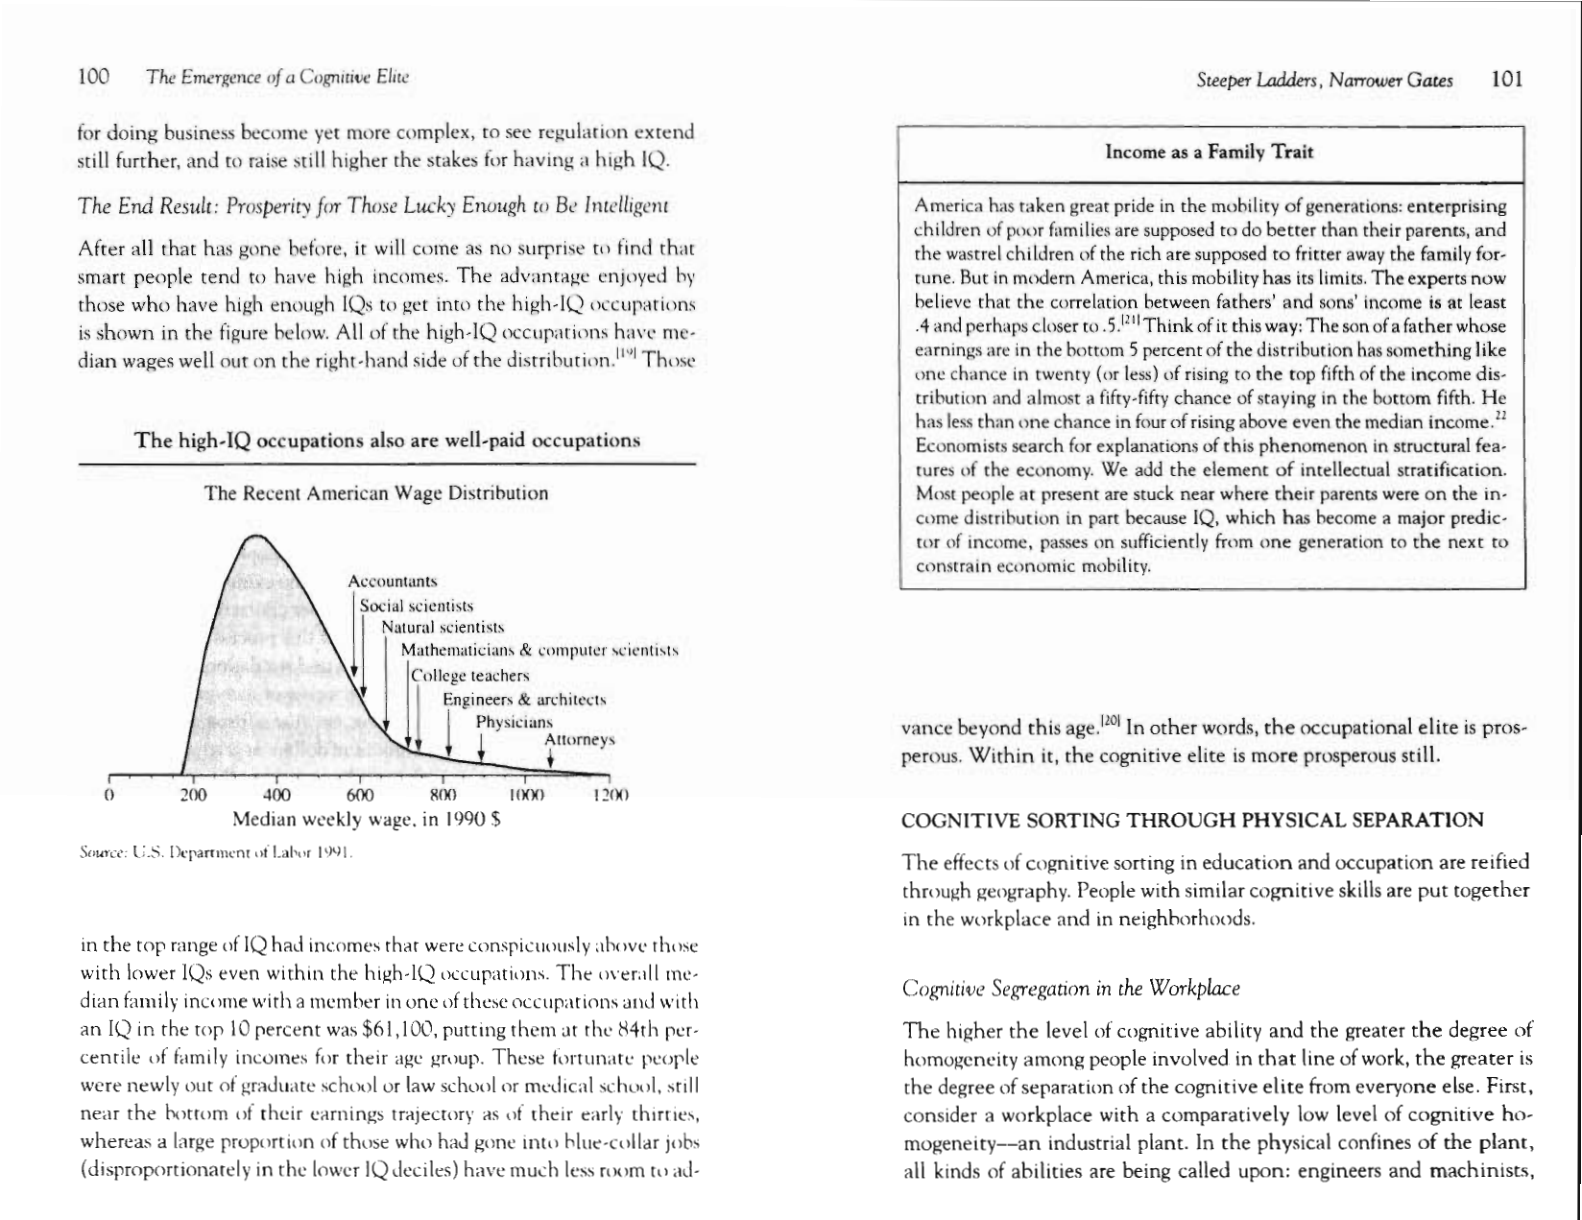
The high-IQ occupations also are well-paid occupations
100
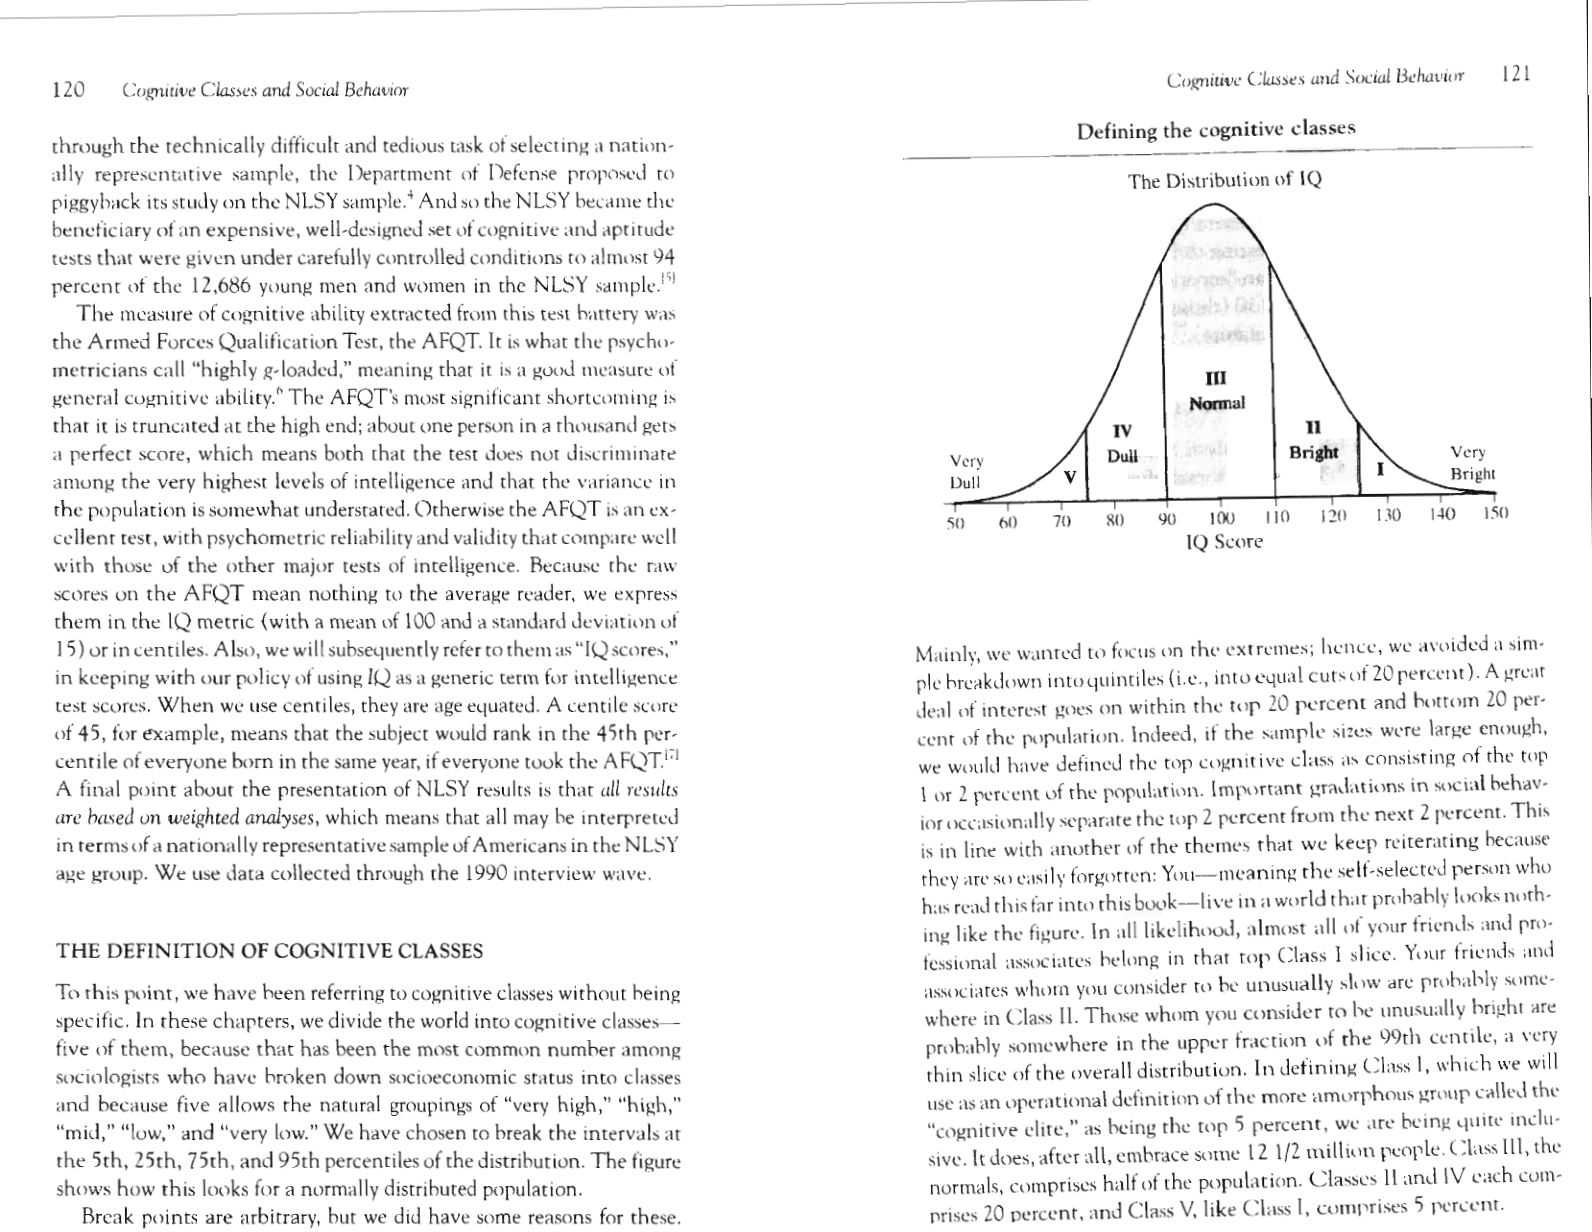
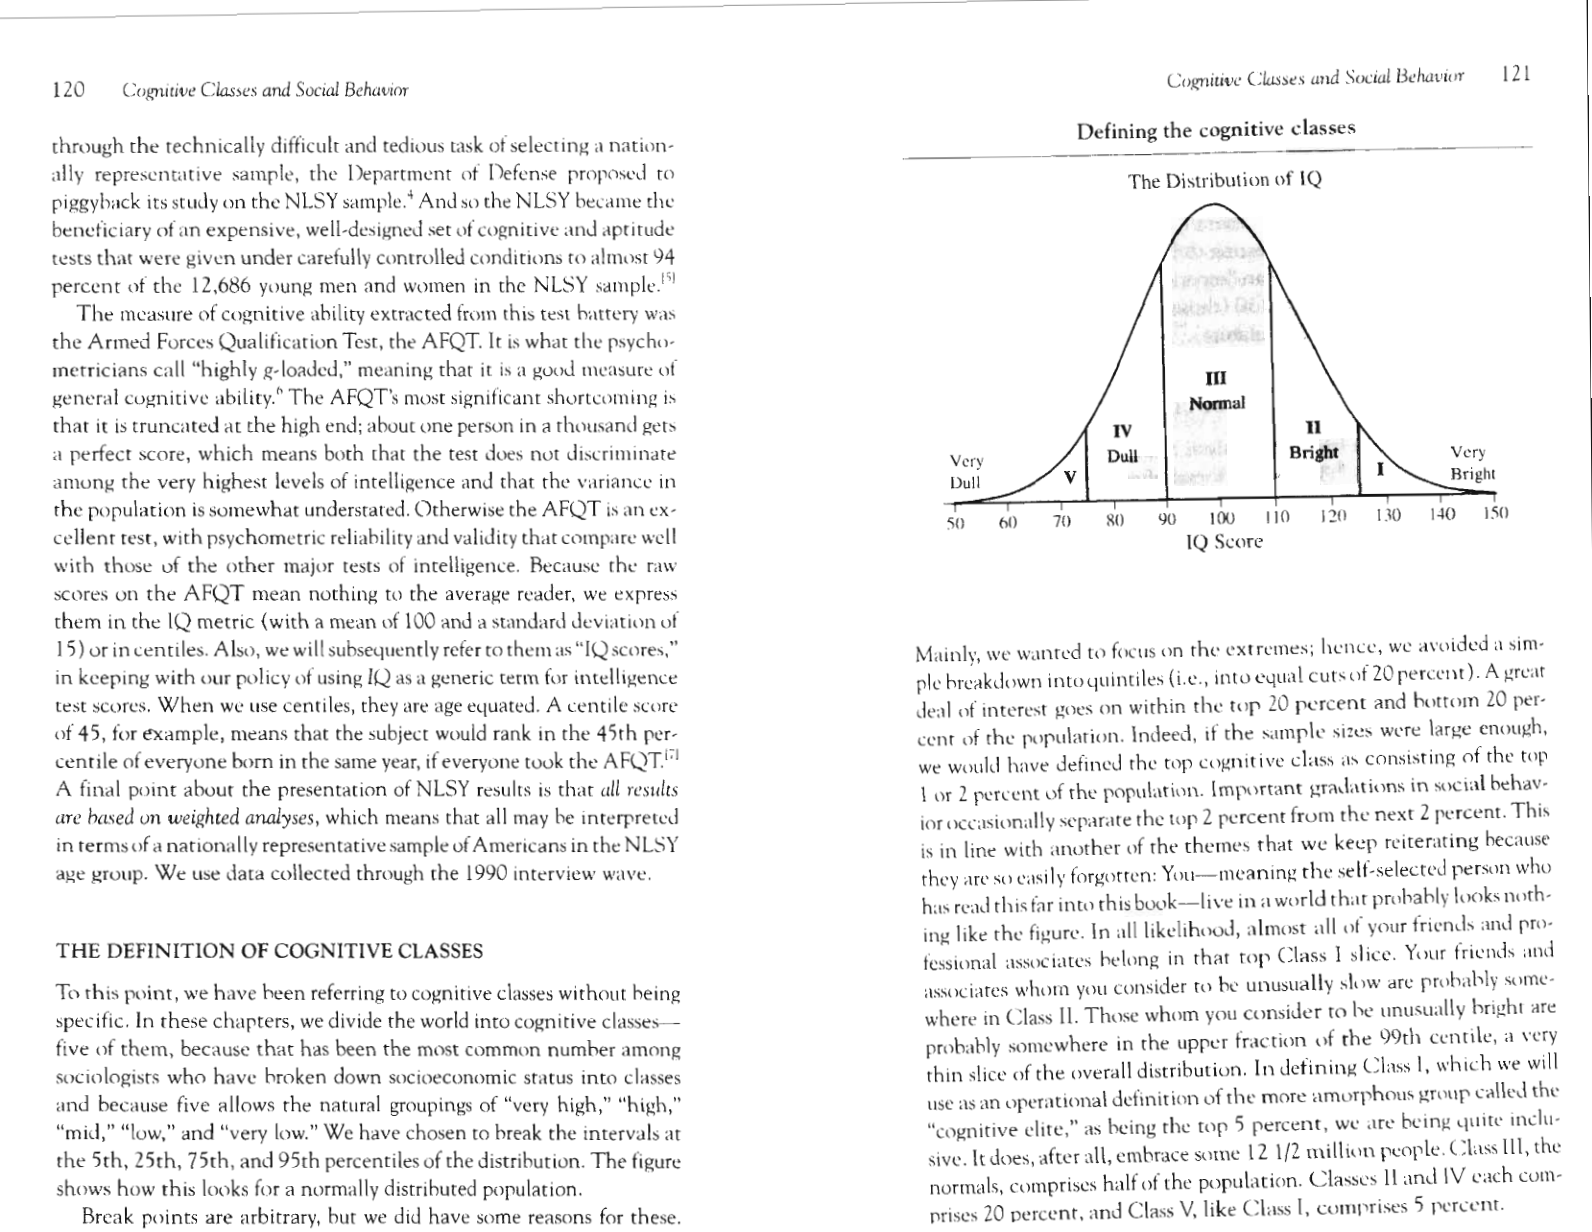
Defining the cognitive classes 12 1
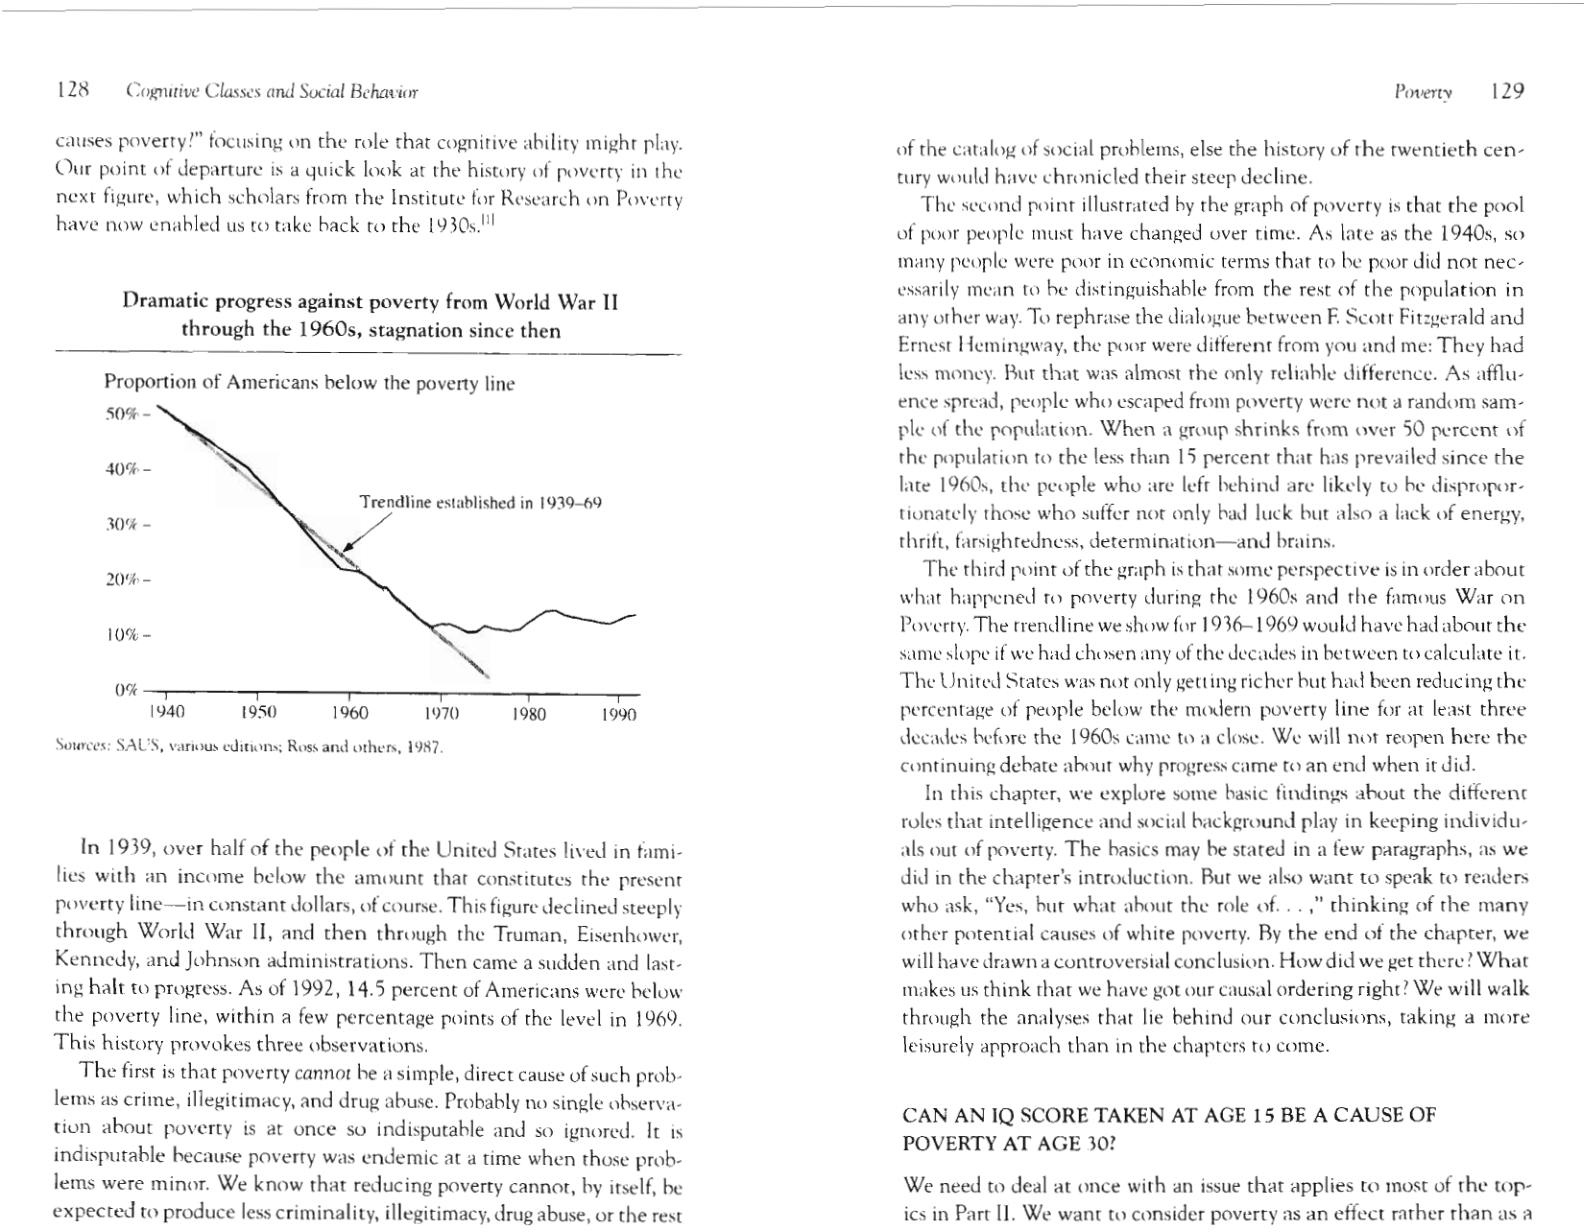
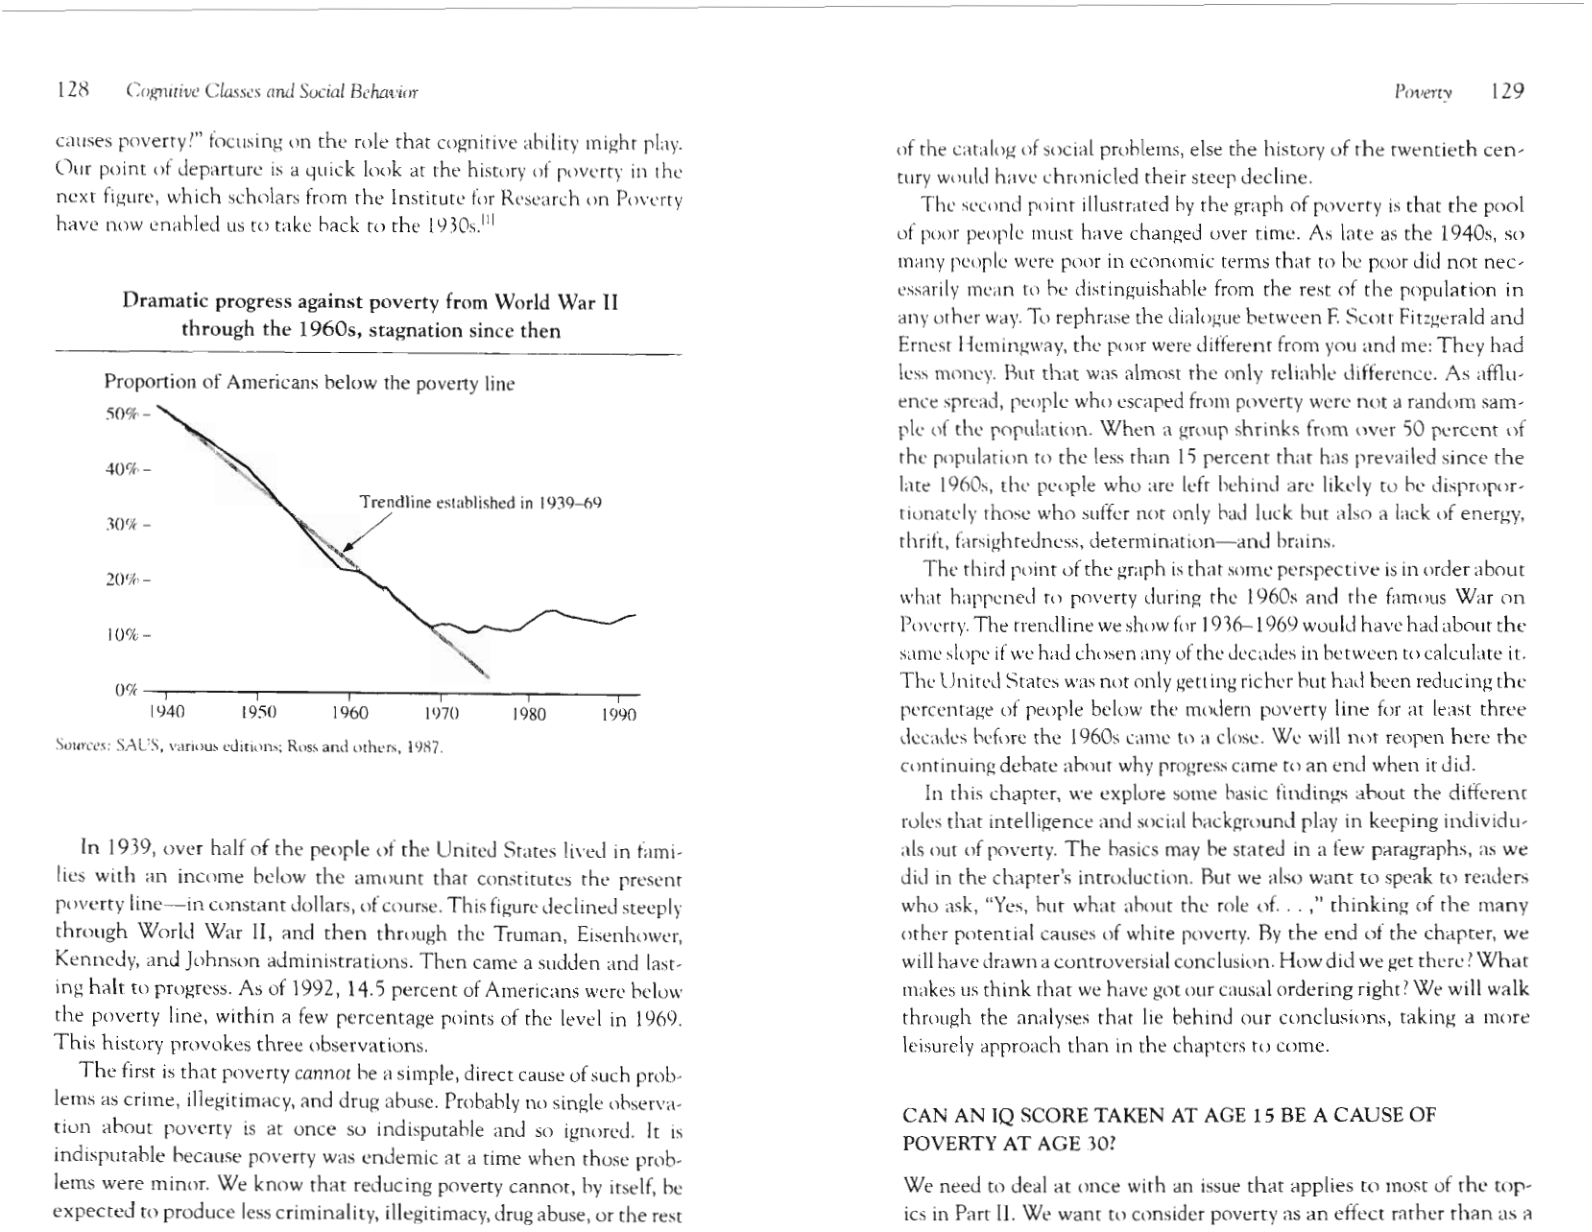
Dramatic progress against poverty from World War I1 through the 1960s,
stagnation since then
128
The comparative roles of IQ and parental SES in determining whether
young white adults are below the poverty line
134
In the white high school sample, high IQ makes a difference in avoid-
ing poverty; in the college sample, hardly anyone was poor
136
The role of the mother's IQ in determining which white children are
poor
138
IQ, Class, and Social Outcomes
- The text outlines the emergence of cognitive classes and the correlation between high-IQ and high-paying occupations.
- Statistical analysis suggests that for white youths, IQ is a more significant predictor of educational attainment and poverty avoidance than parental socioeconomic status.
- Cognitive ability is linked to various social behaviors, including marriage stability, labor force participation, and the likelihood of relying on welfare.
- The data explores the 'illegitimacy revolution' and the 'crime boom,' asserting that IQ often dominates socioeconomic background as a predictive factor for these outcomes.
- The text addresses ethnic disparities, noting that when IQ is controlled for, wage gaps shrink and the probability of blacks and Latinos entering high-IQ occupations increases.
For white youths, being smart is more important than being privileged in getting a college degree.
List of Illustrations
In the twentieth century, the prevalence of the college degree goes from
one in fifty to a third of the population
32
At mid-century, America abruptly becomes more efficient in getting the
top students to college 34
Between the 1920s and the 1960s, college attendance becomes more
closely pegged to IQ 35
Cognitive sorting continues from the time that students enter college
to the time they get a degree 37
Cognitive stratification in colleges by 1961 40
Americans with and without a college education as of 1930 45
Americans with and without a college education as of 1990 46
The top IQ decile becomes rapidly more concentrated in high-IQ pro-
fessions from 1940 onward
56
In fifty years, the education of the typical CEO increases from high
school to graduate school 59
The variation among individuals that lies behind a significant correla-
tion coefficient 68
The advantages of hiring by test score 84
Engineers' salaries as an example of how intelligence became more valu-
able in the 1950s 93
The high-IQ occupations also are well-paid occupations
100
Defining the cognitive classes 12 1
Dramatic progress against poverty from World War I1 through the 1960s,
stagnation since then
128
The comparative roles of IQ and parental SES in determining whether
young white adults are below the poverty line
134
In the white high school sample, high IQ makes a difference in avoid-
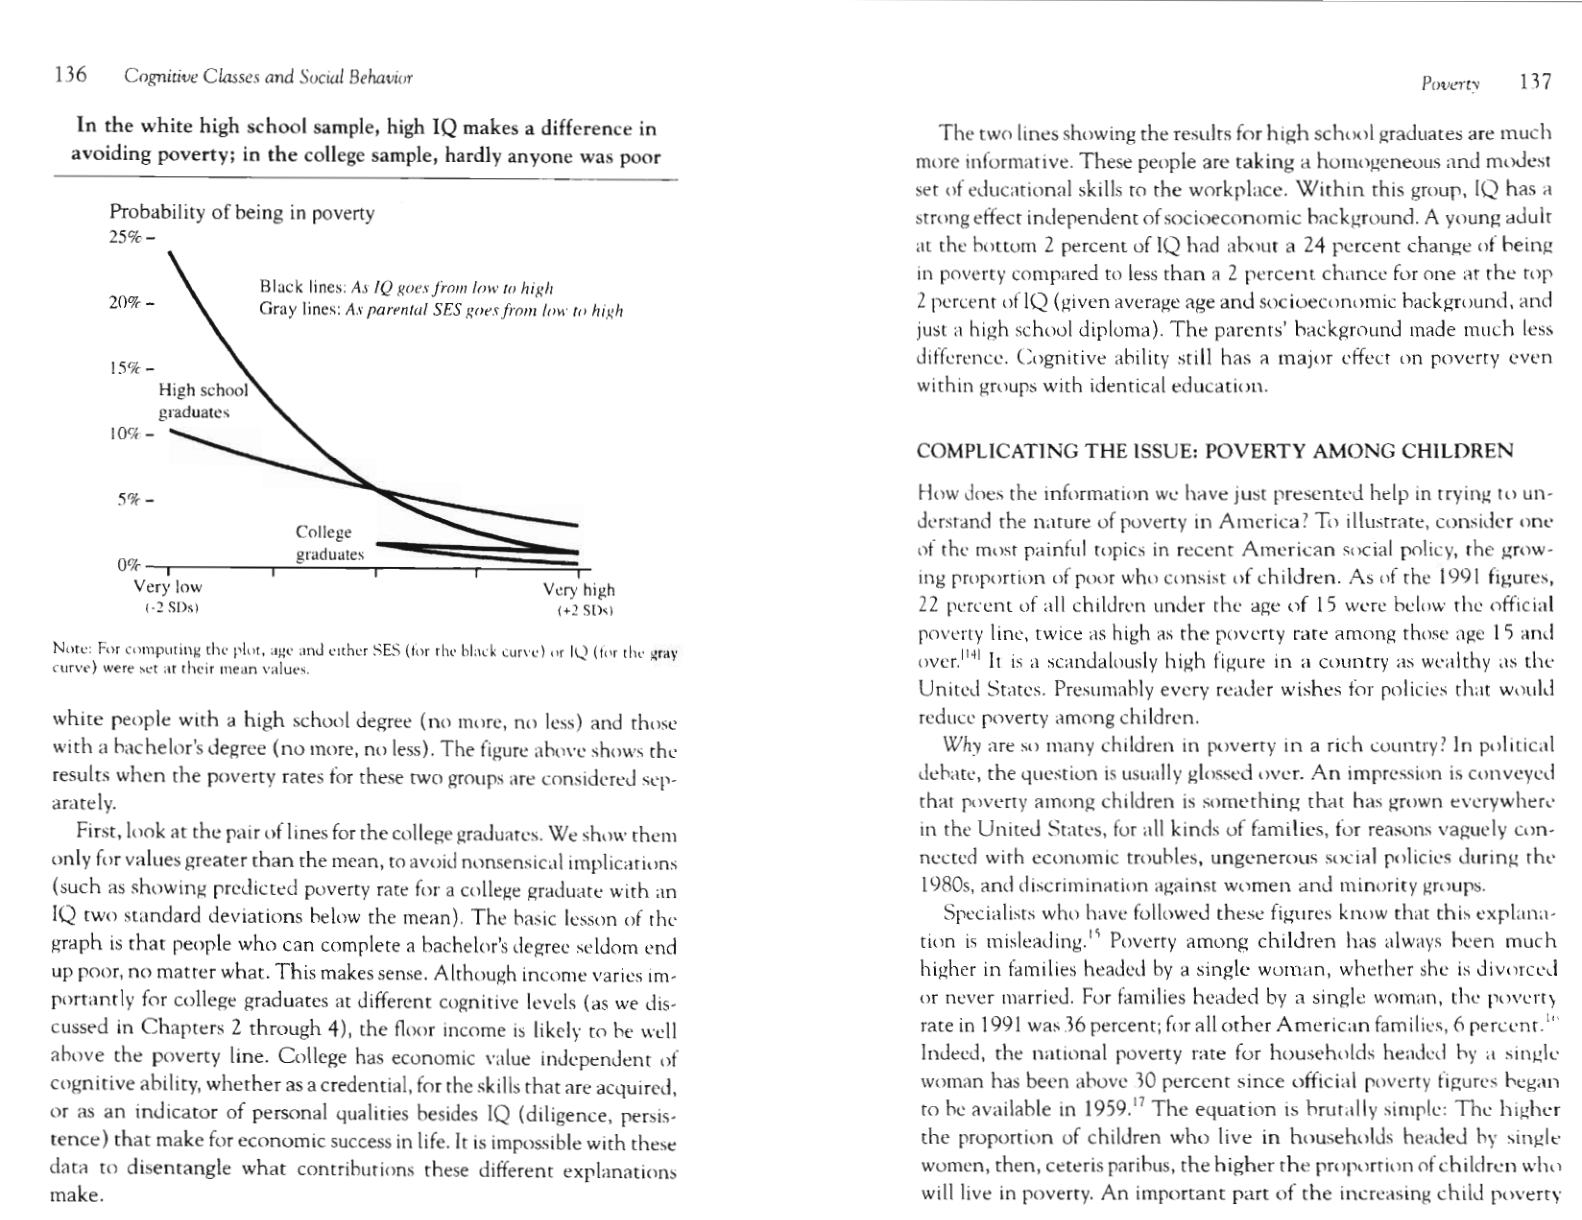
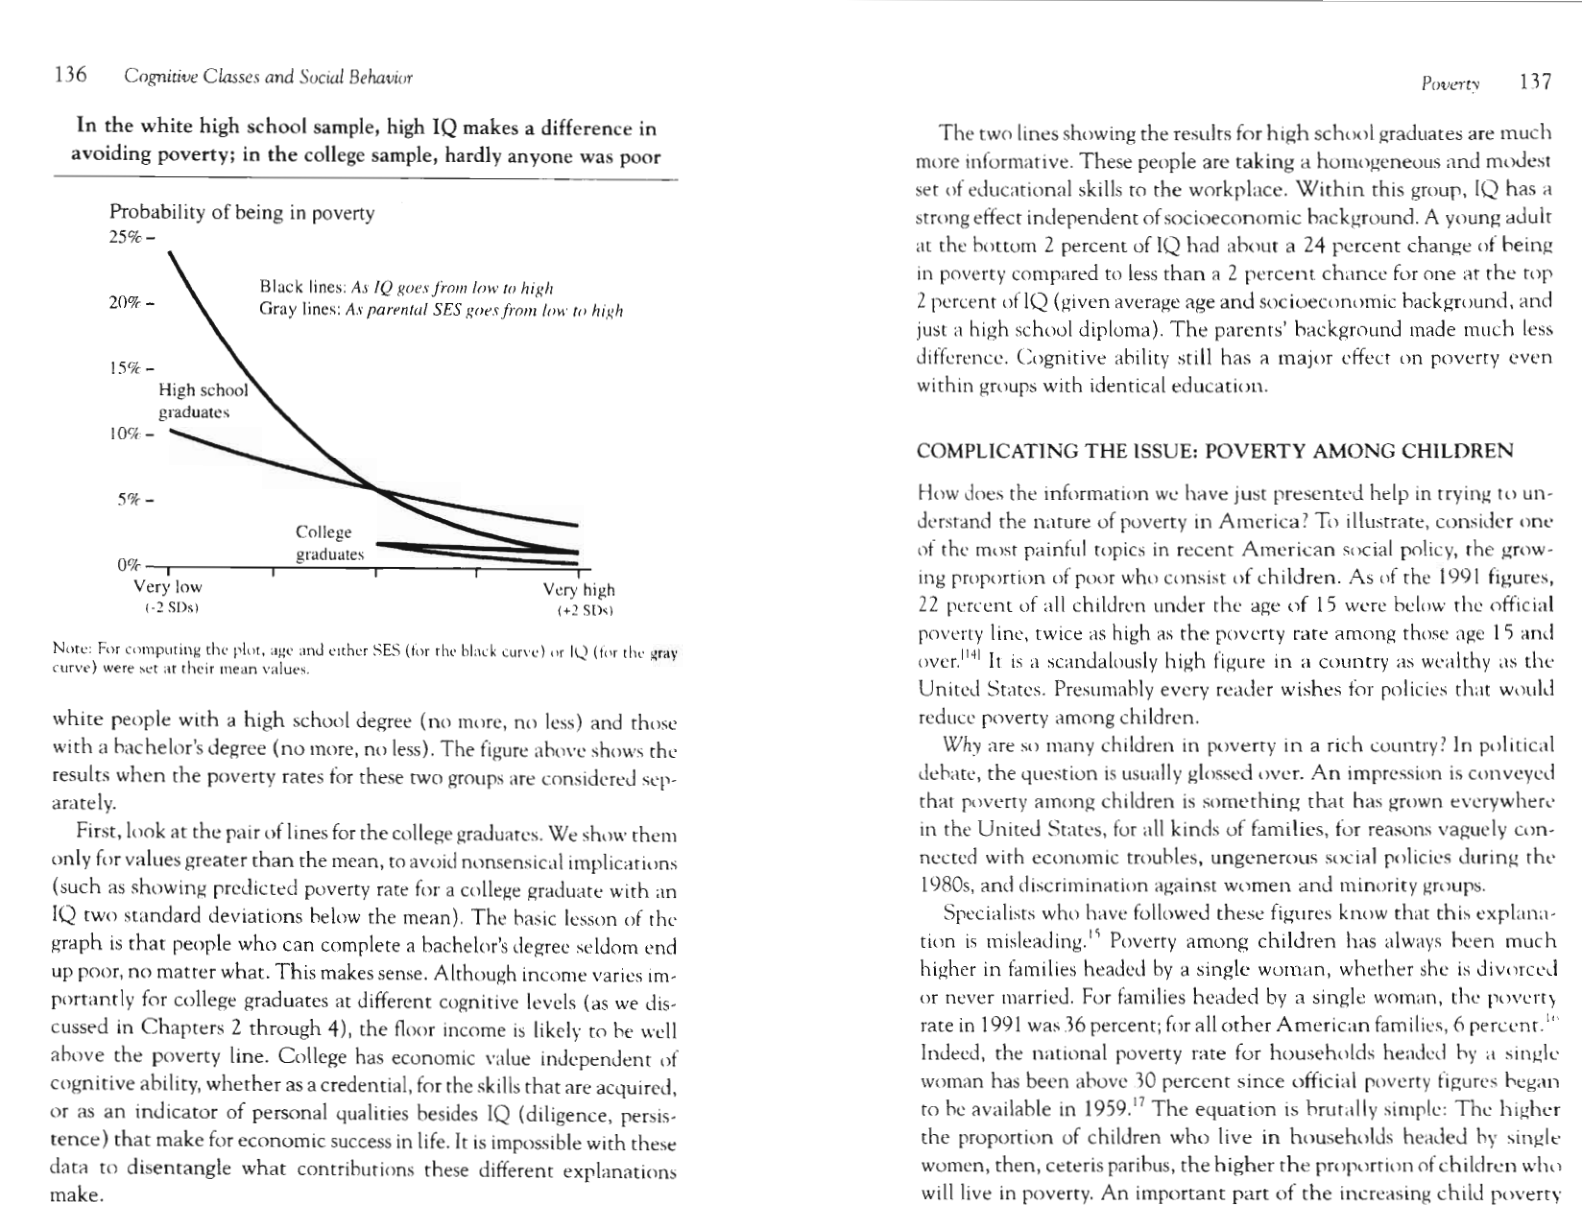
ing poverty; in the college sample, hardly anyone was poor
136
The role of the mother's IQ in determining which white children are
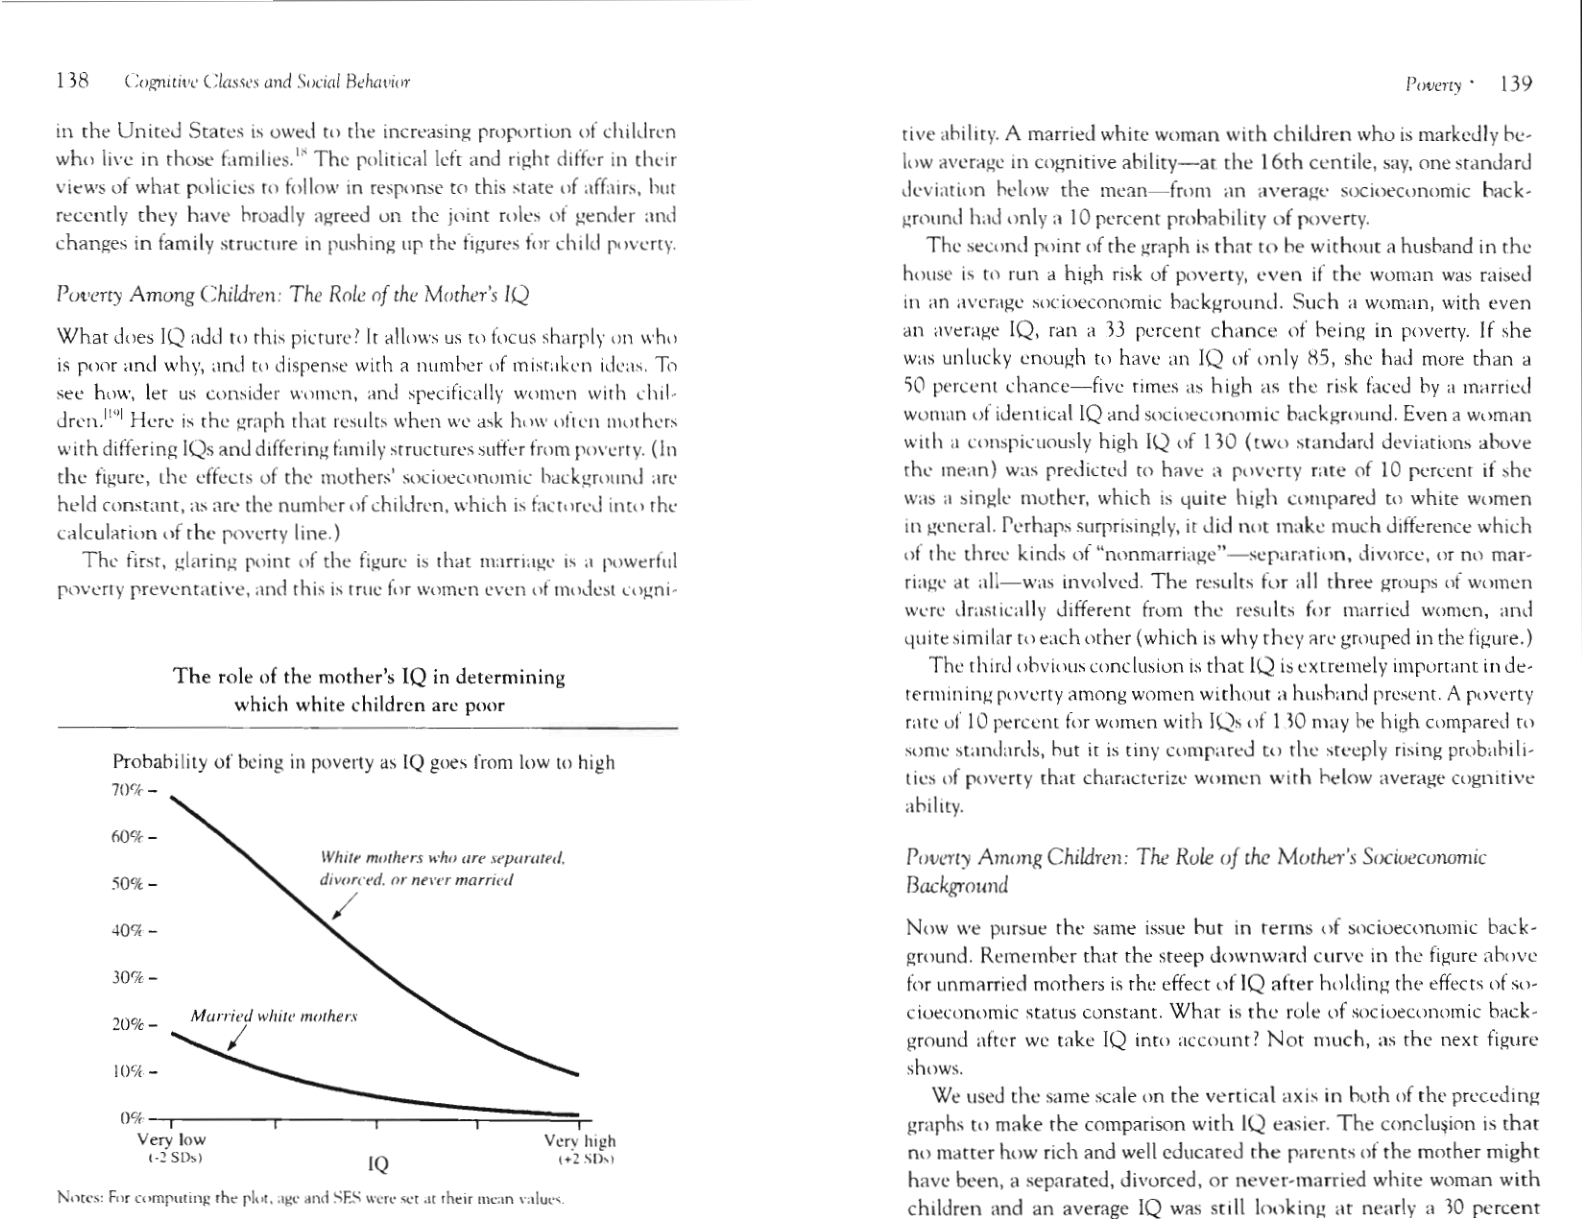
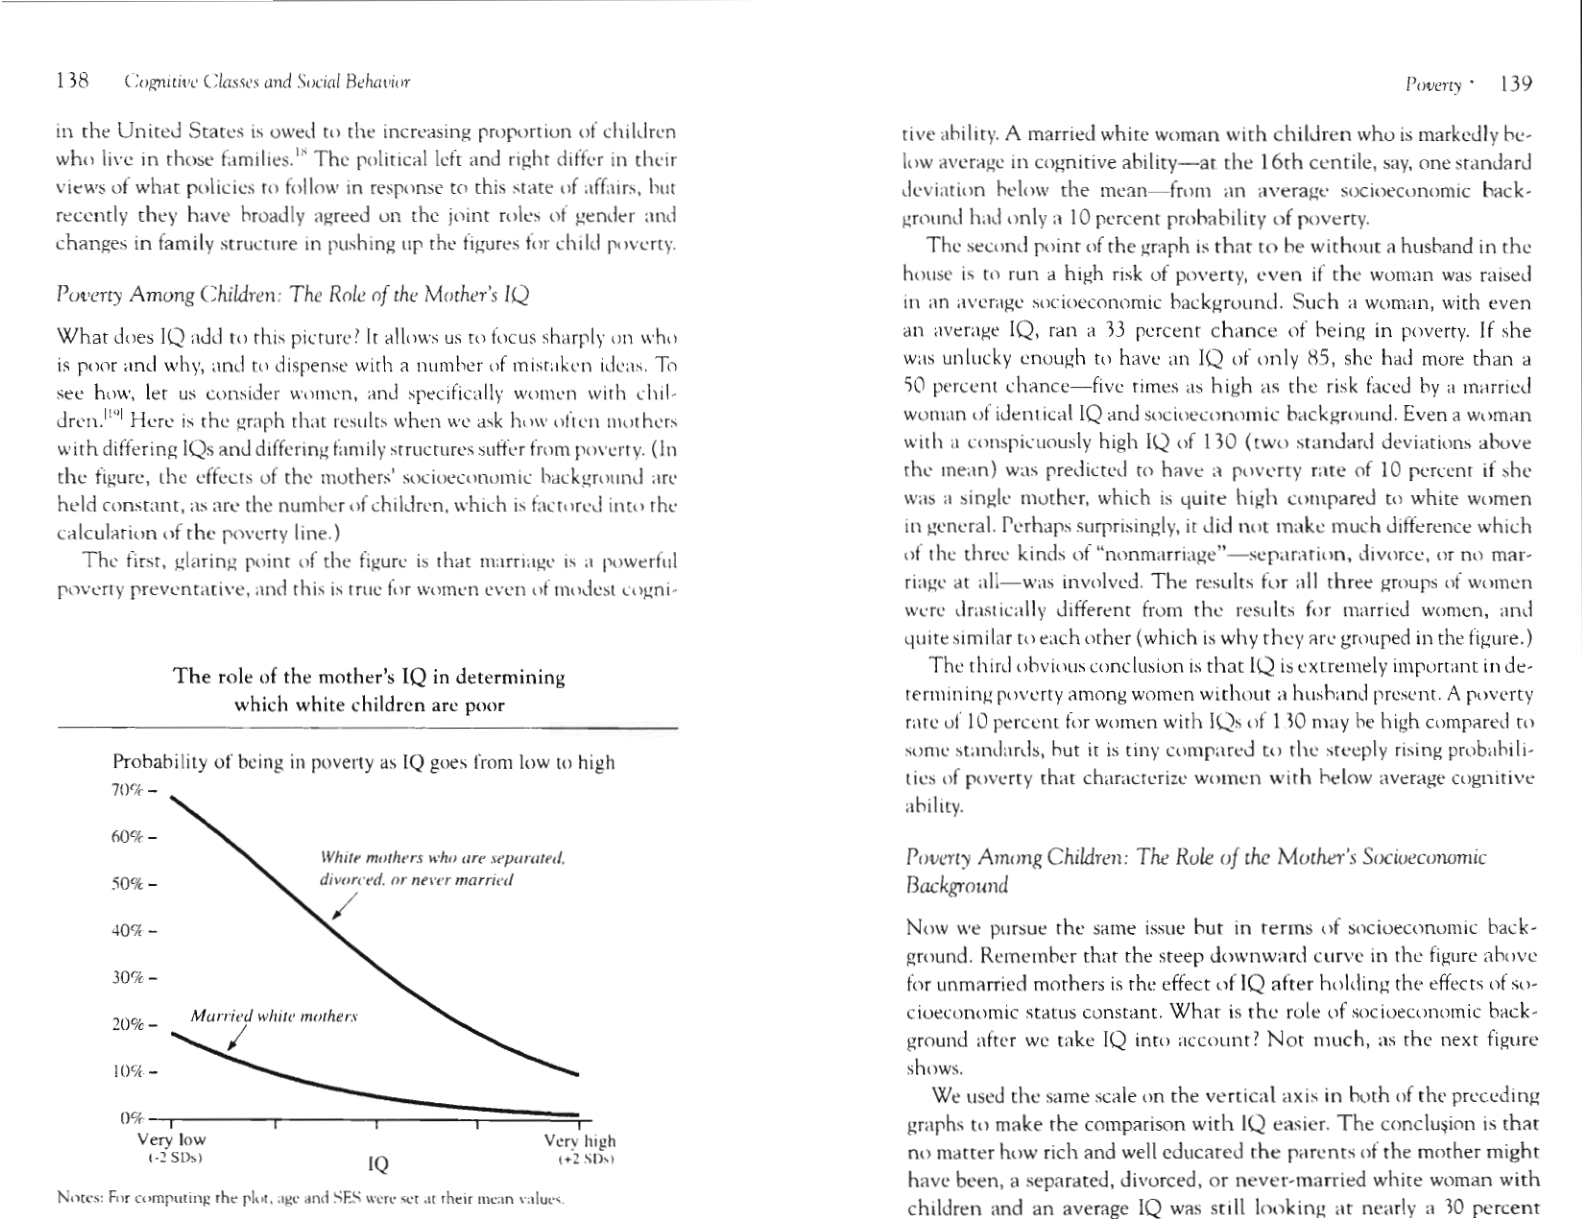
poor
138
xii
List of Illustrations
xiii
The role of the mother's socioeconomic background in determining
which white children are poor
140
In the first half of the century, the high school diploma becomes the
norm 144
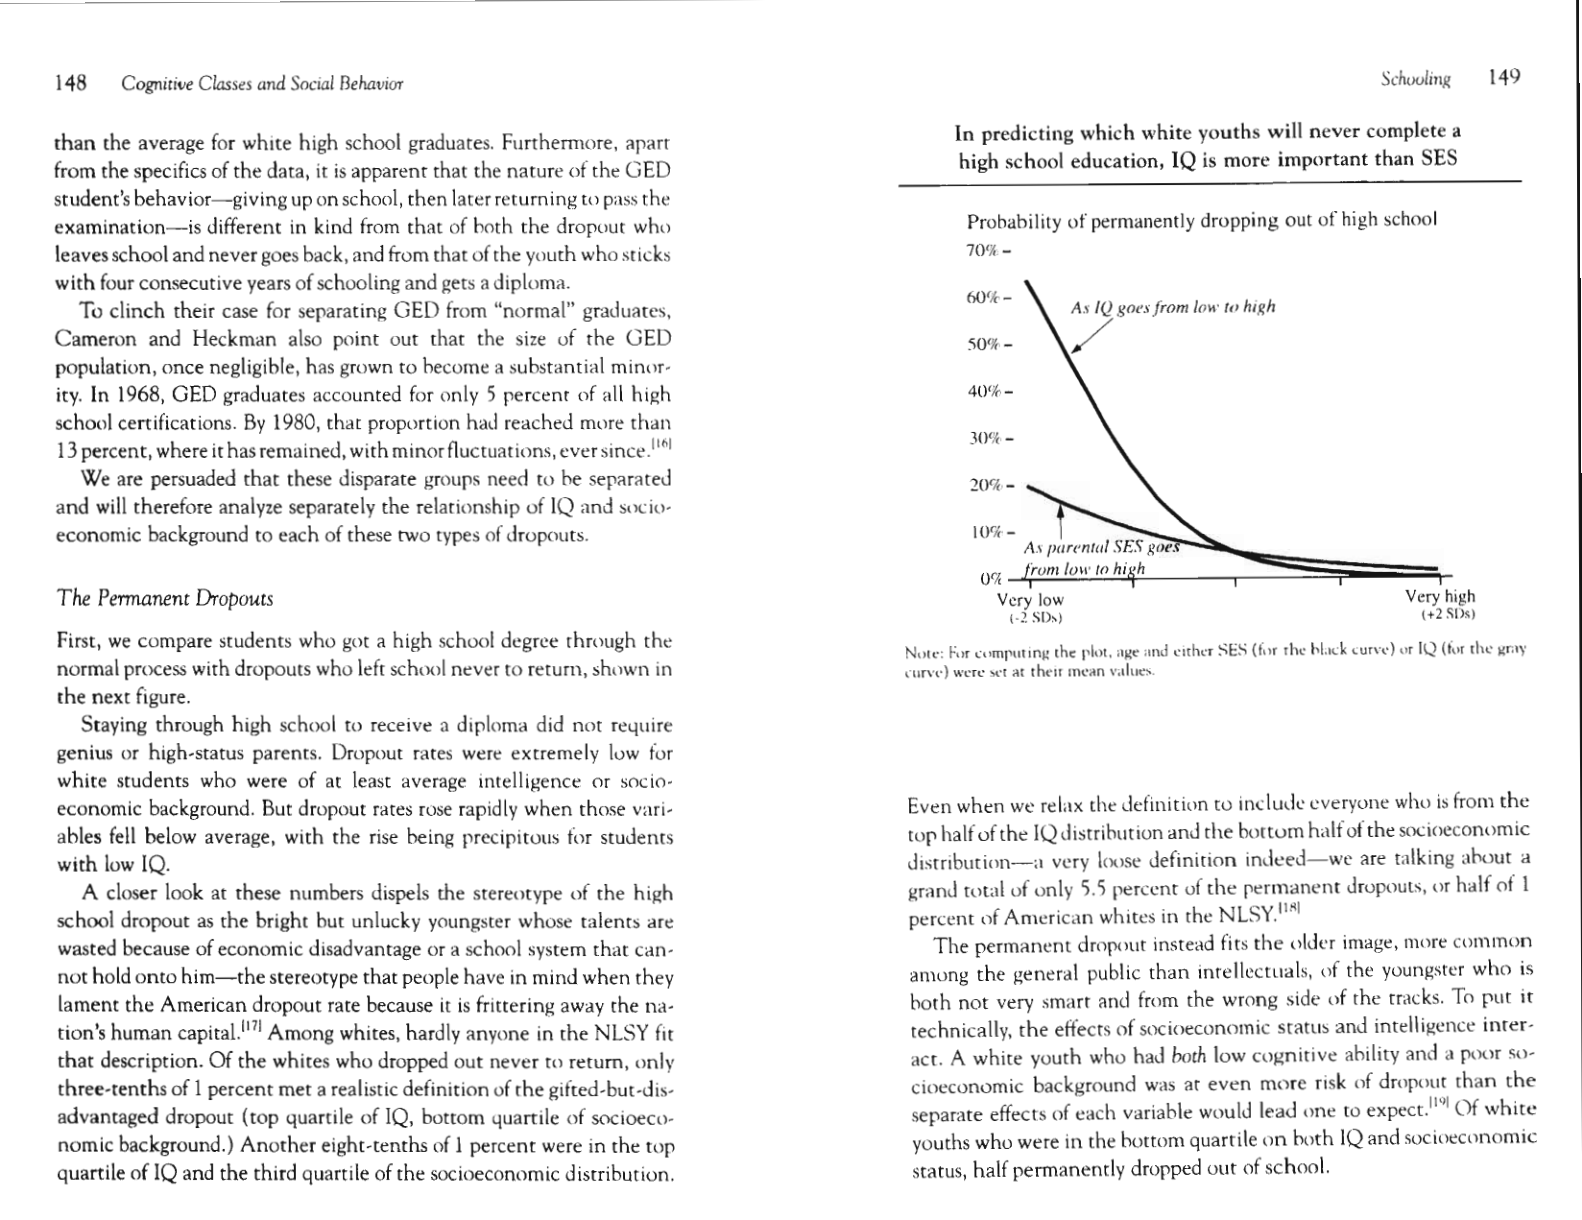
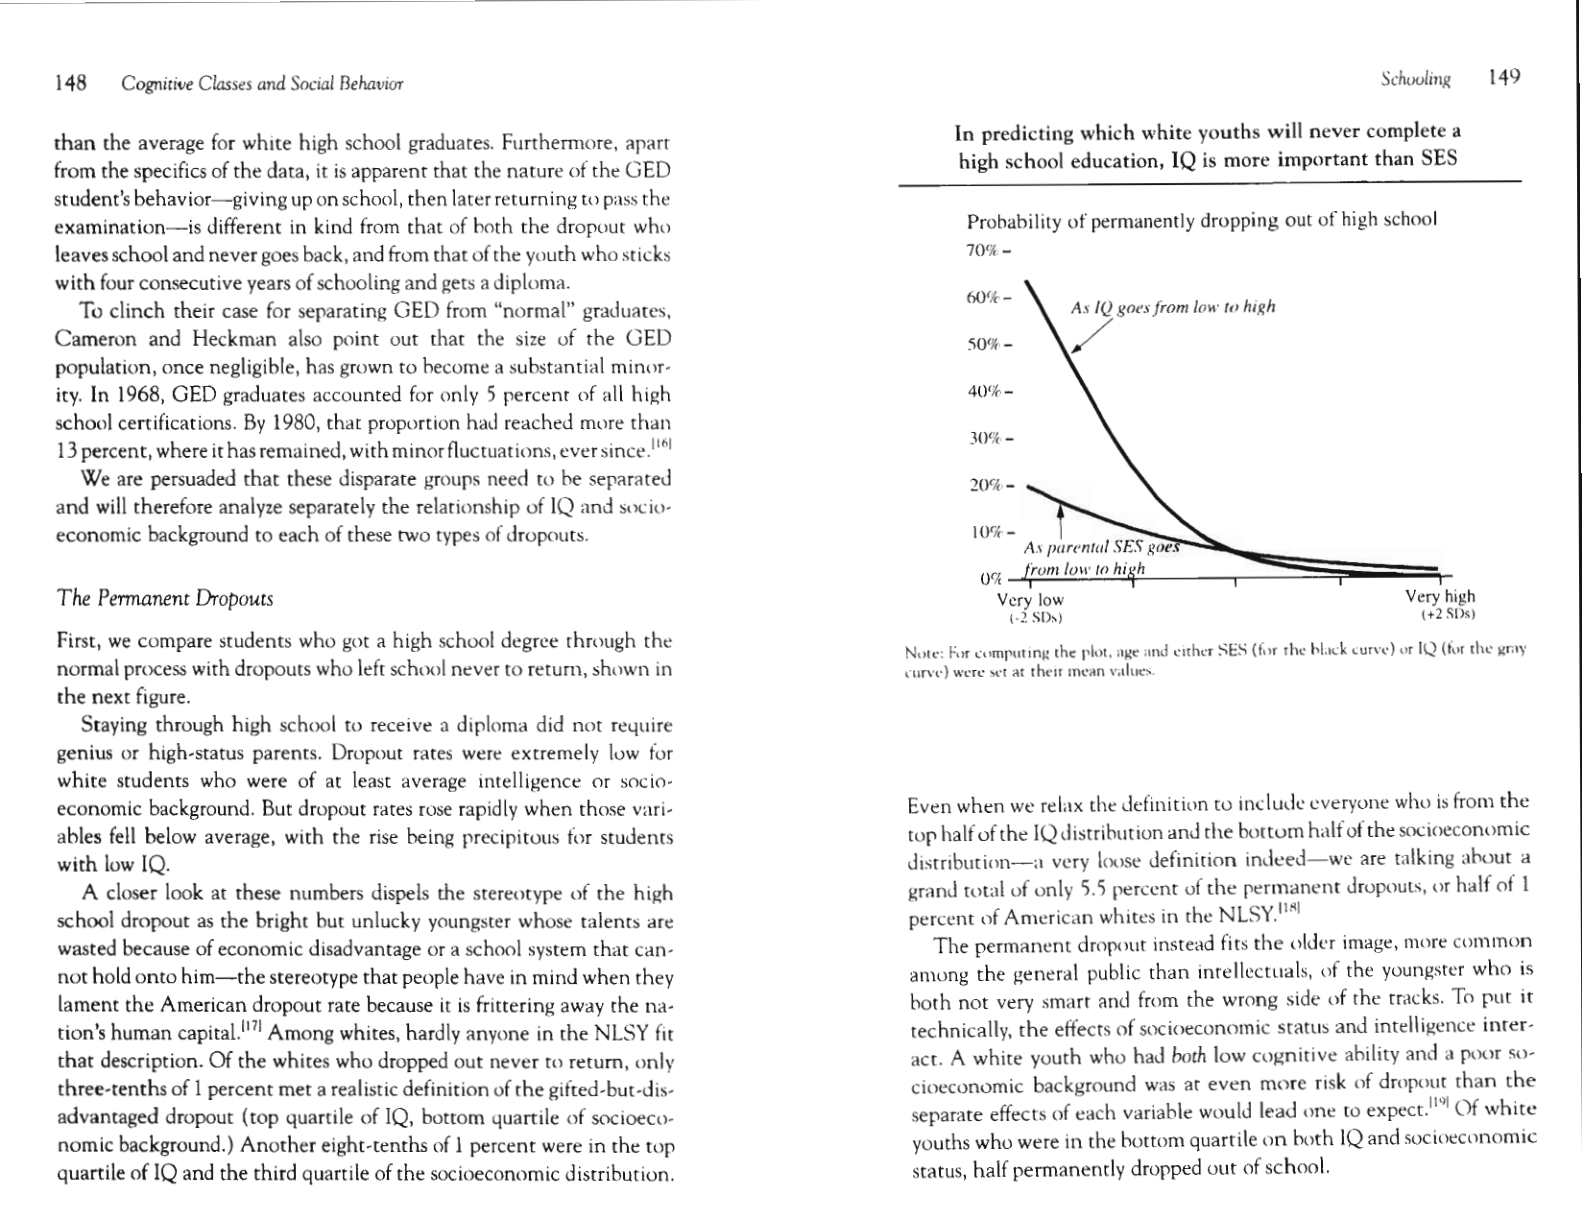
In predicting which white youths will never complete a high school ed-
ucatiok, IQ is more important than SES
149
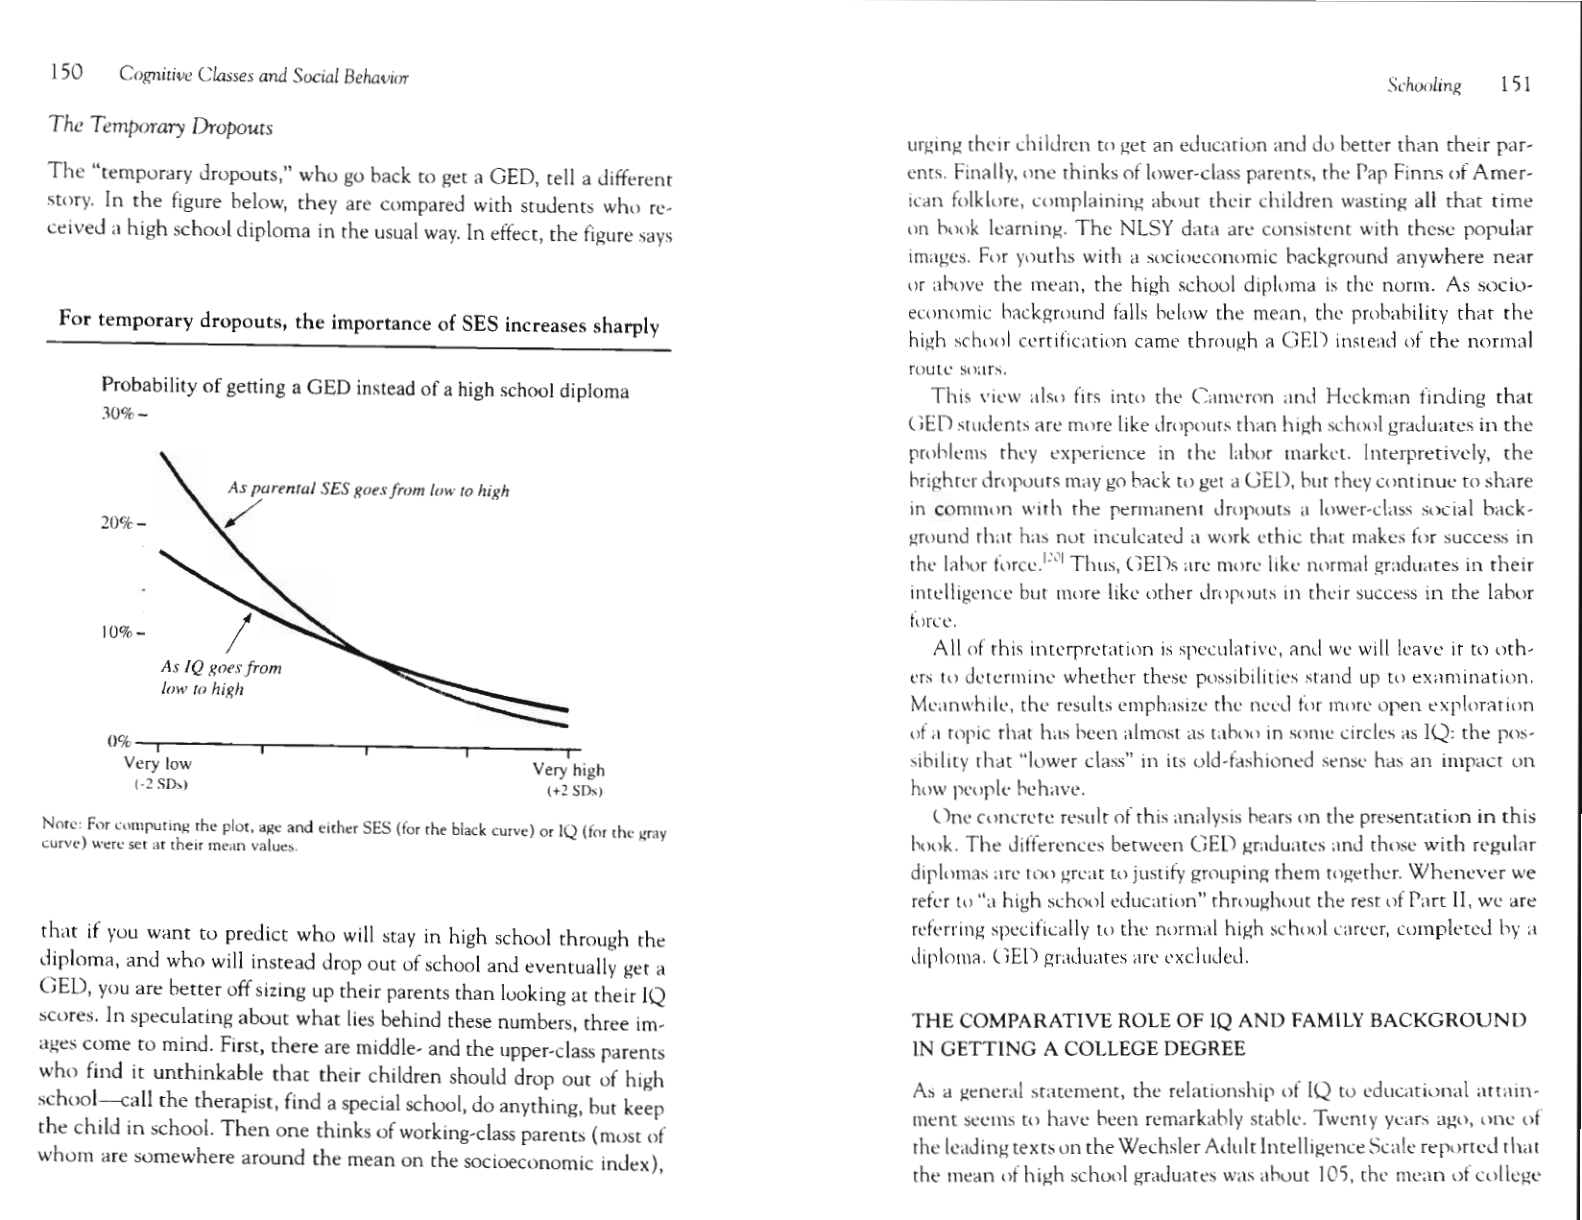
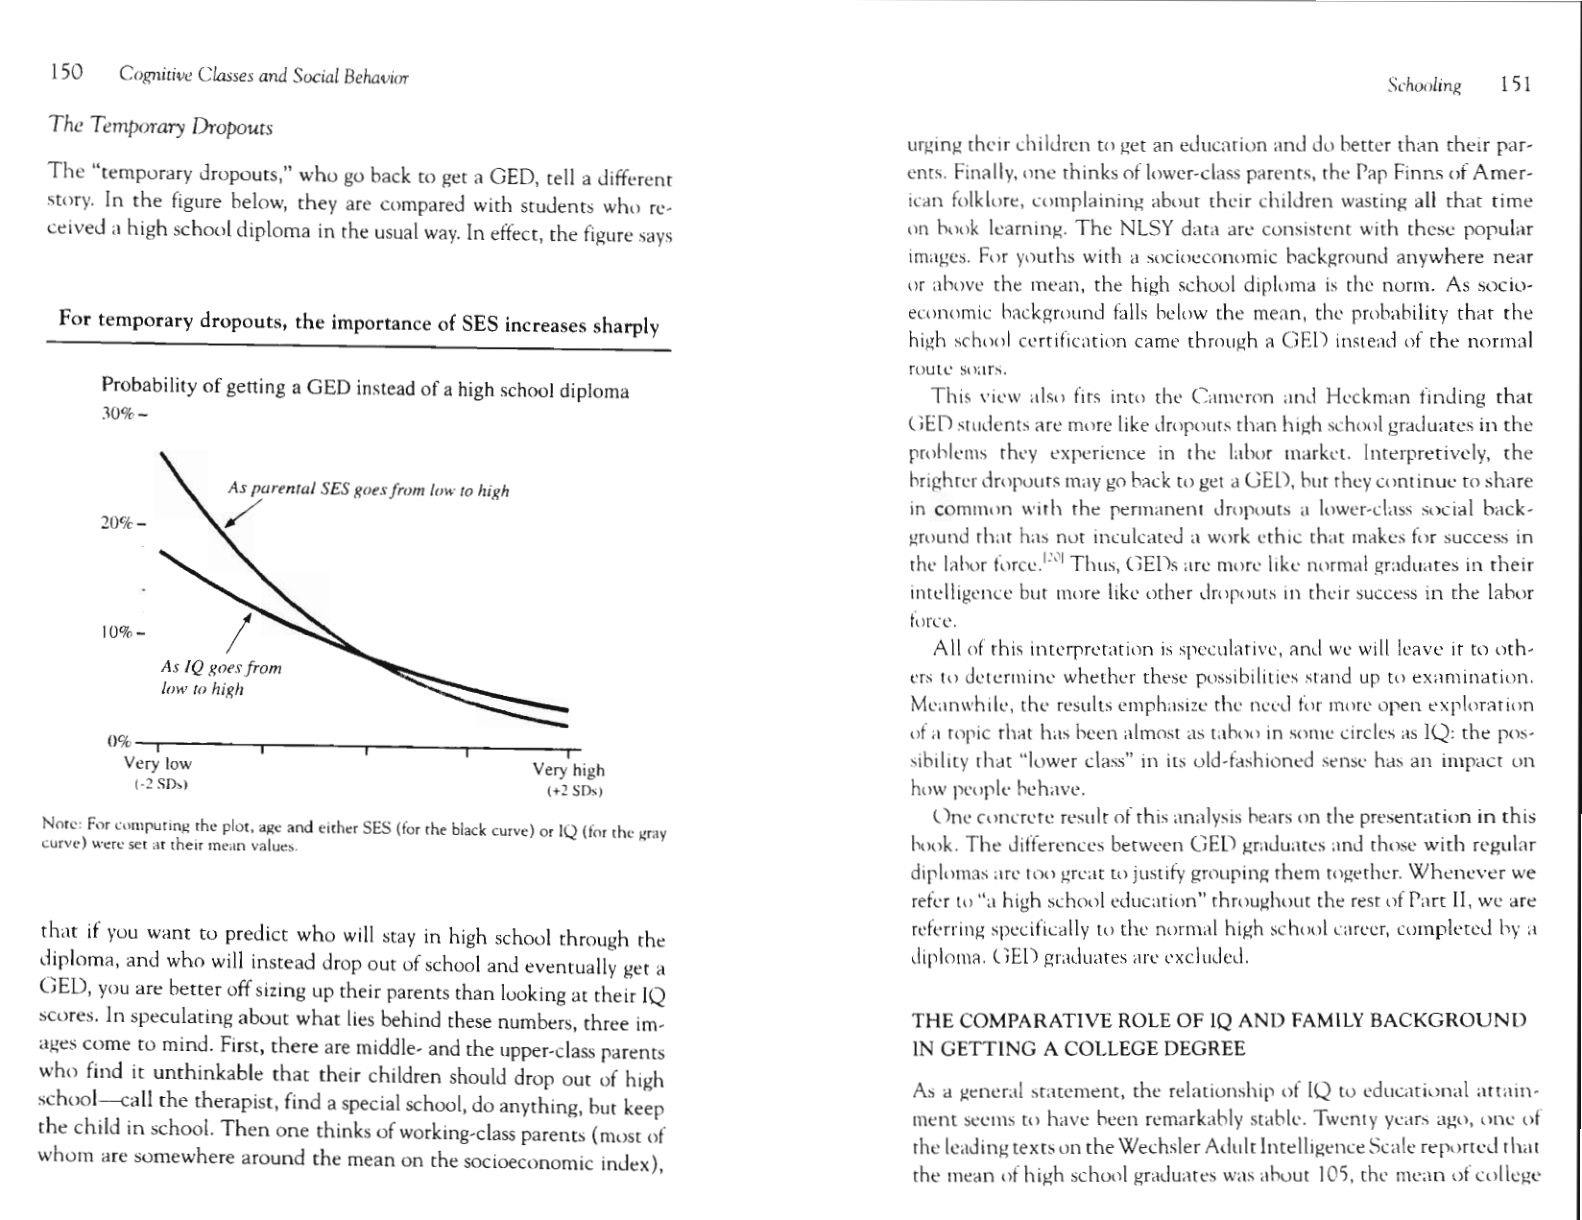
For temporary dropouts, the importance of SES increases sharply
150
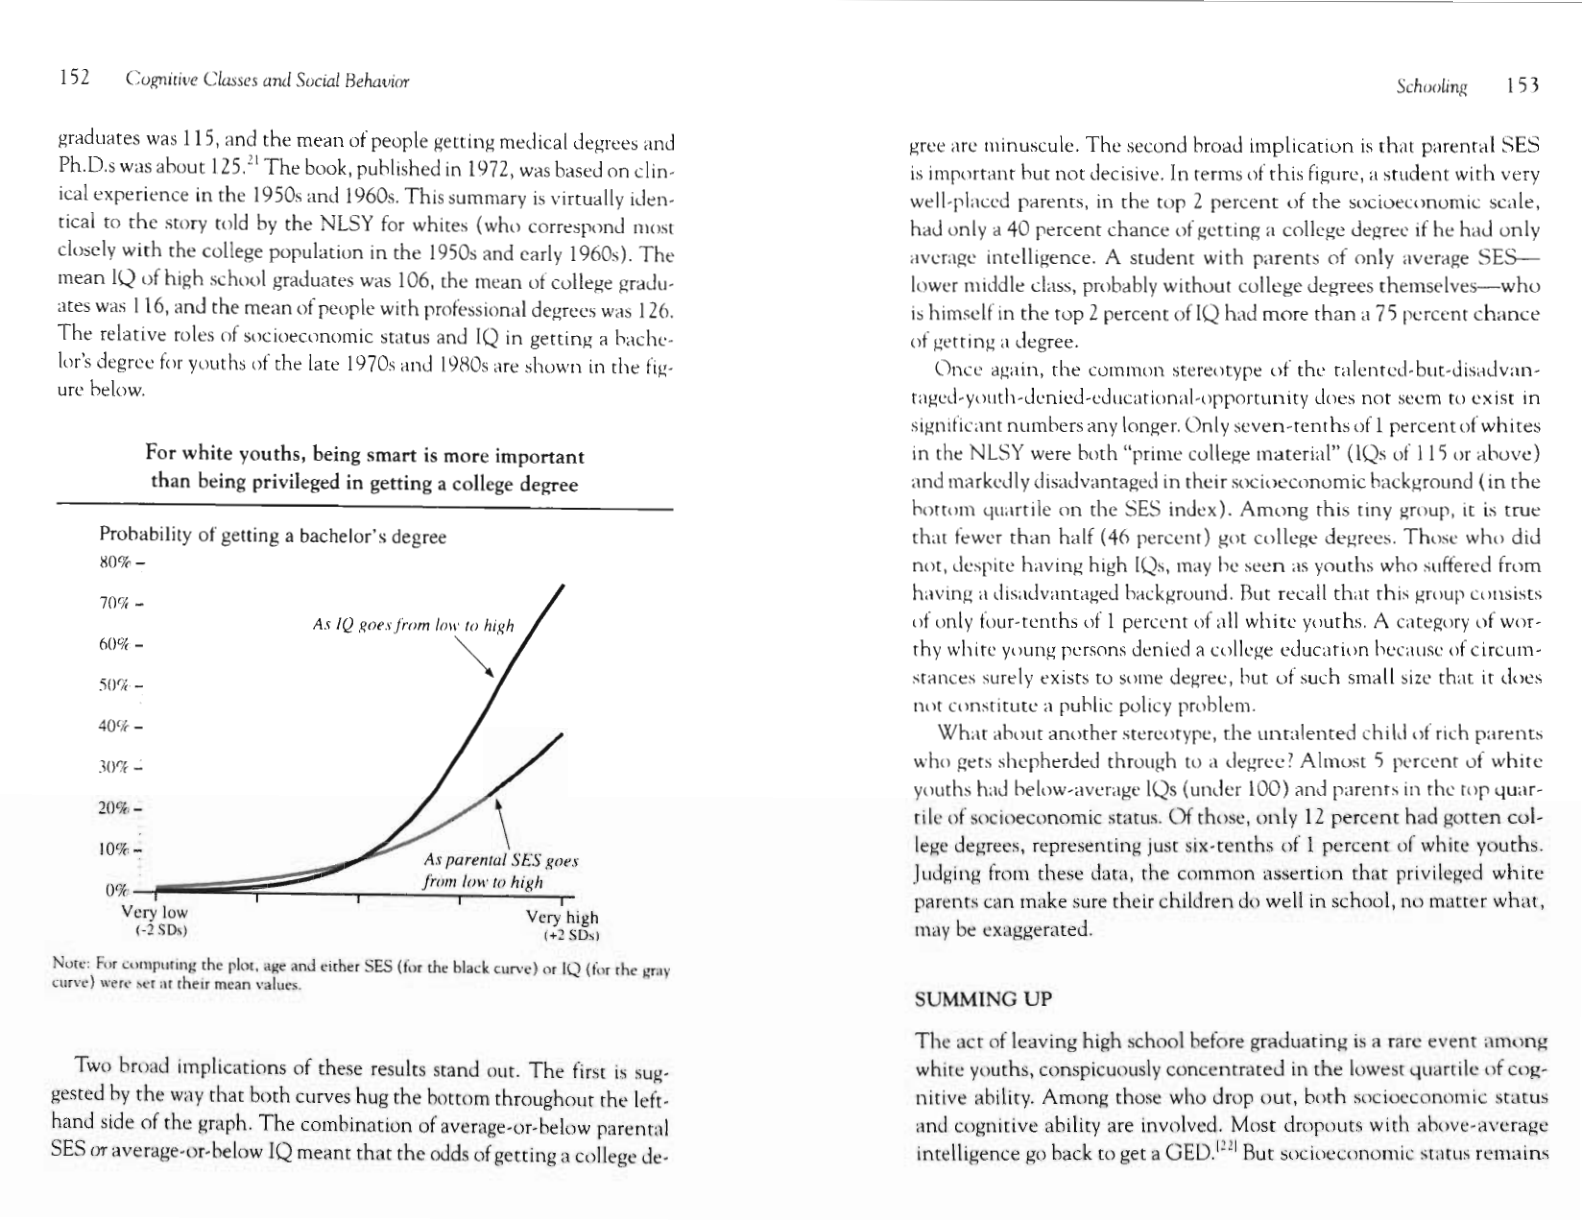
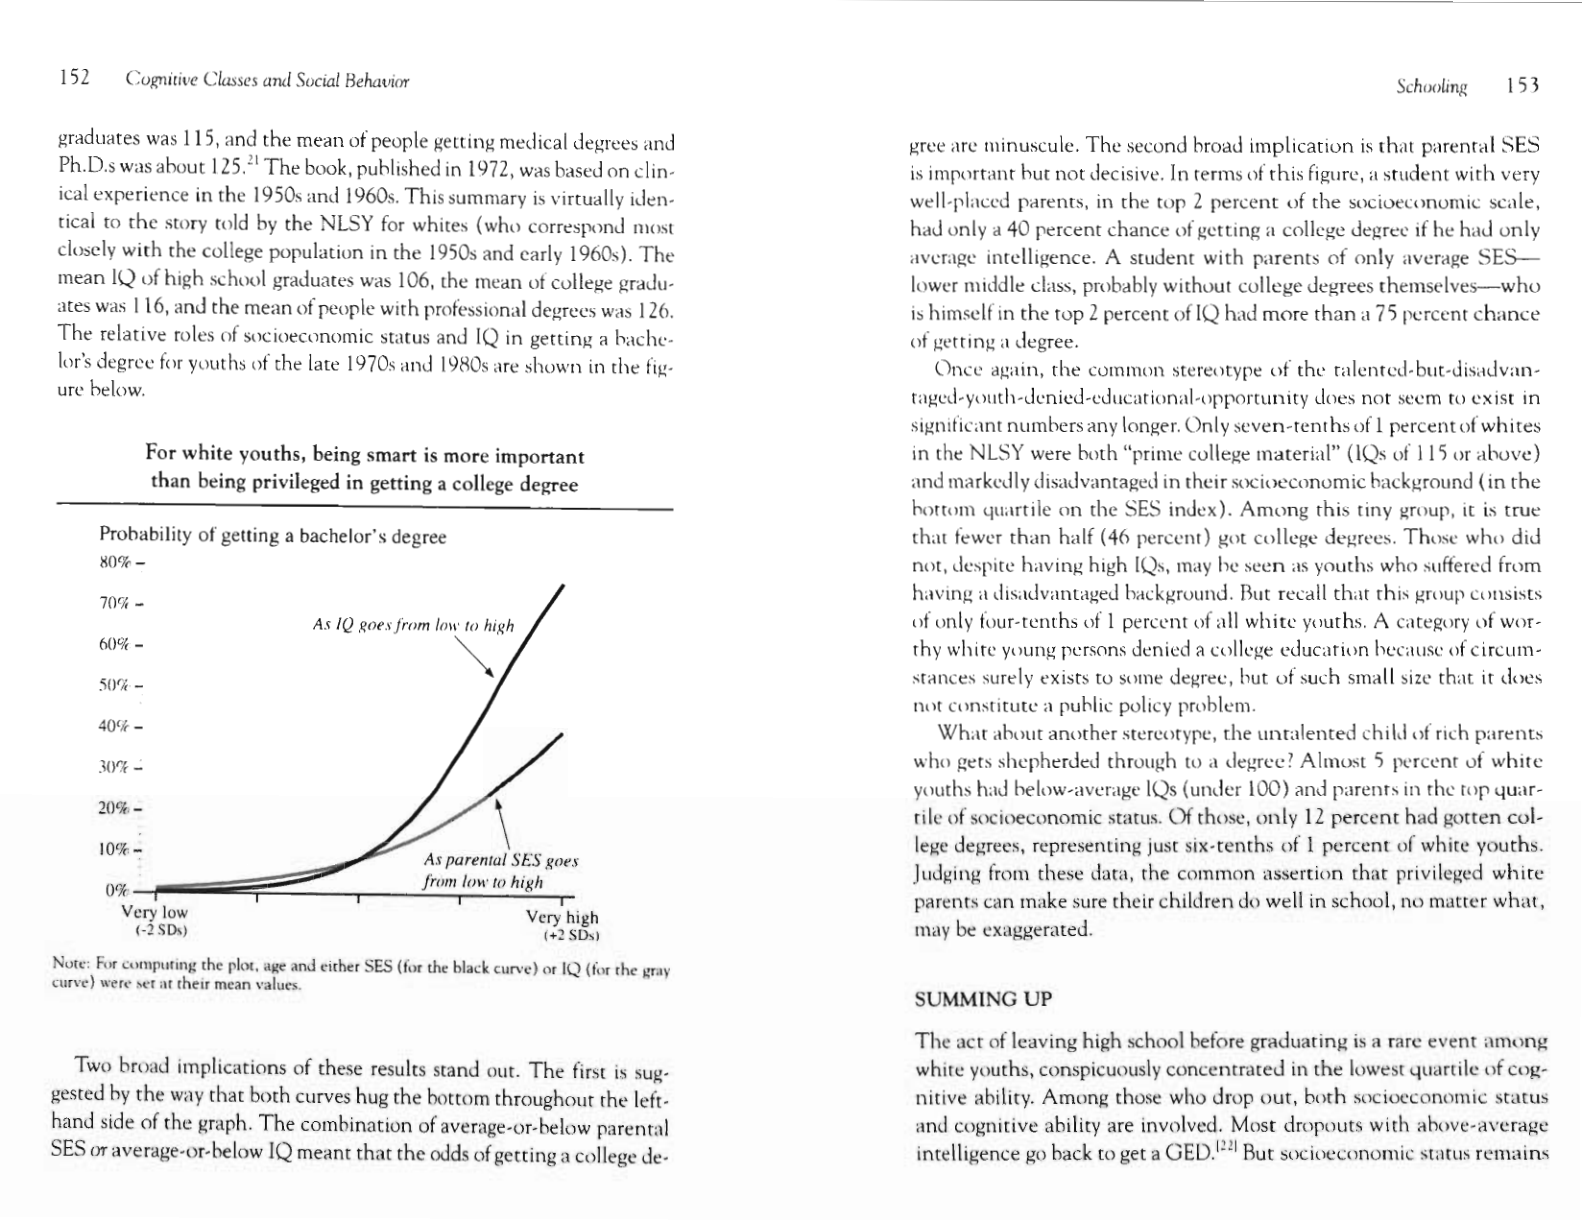
For white youths, being smart is more important than being privileged
in getting a college degree
152
Since mid-century, teenage boys not in school are increasingly not em-
ployed either
156
IQ and socioeconomic background have opposite effects on leaving the
labor force among white men
159
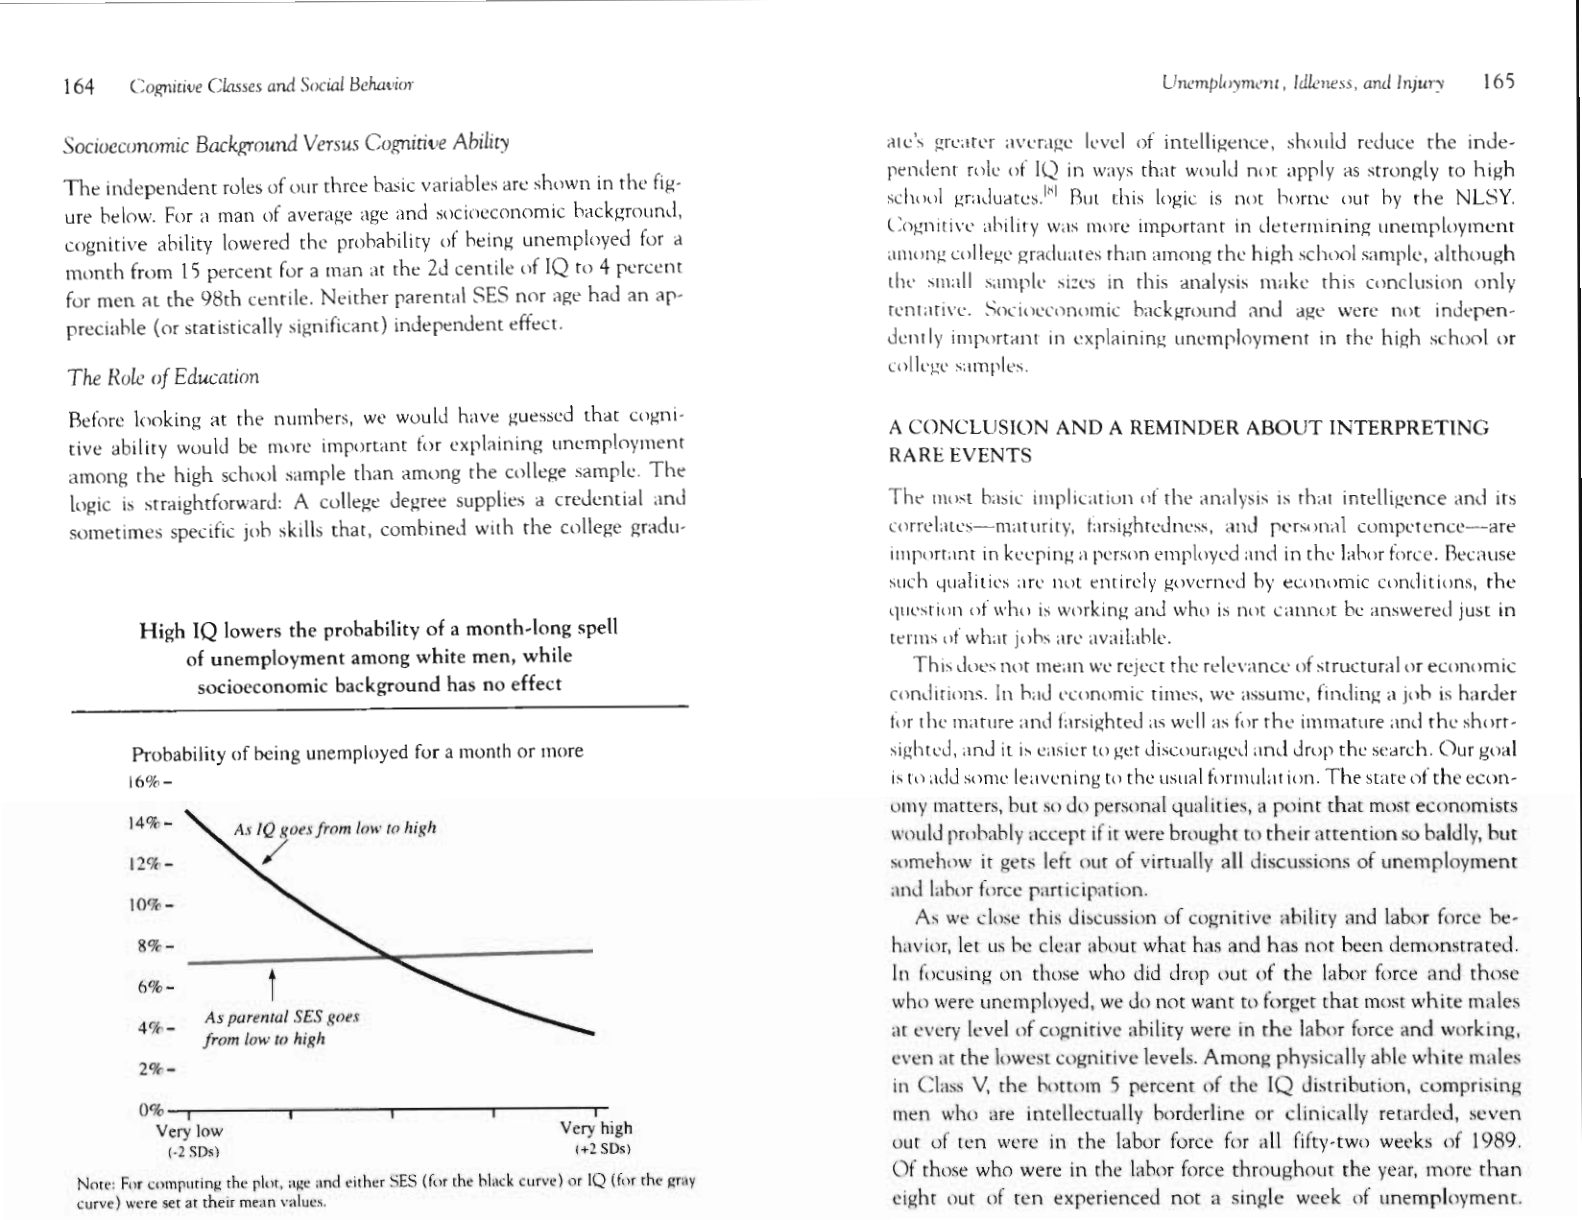
High IQ lowers the probability of a month-long spell of unemployment
among white men, while socioeconomic background has no effect
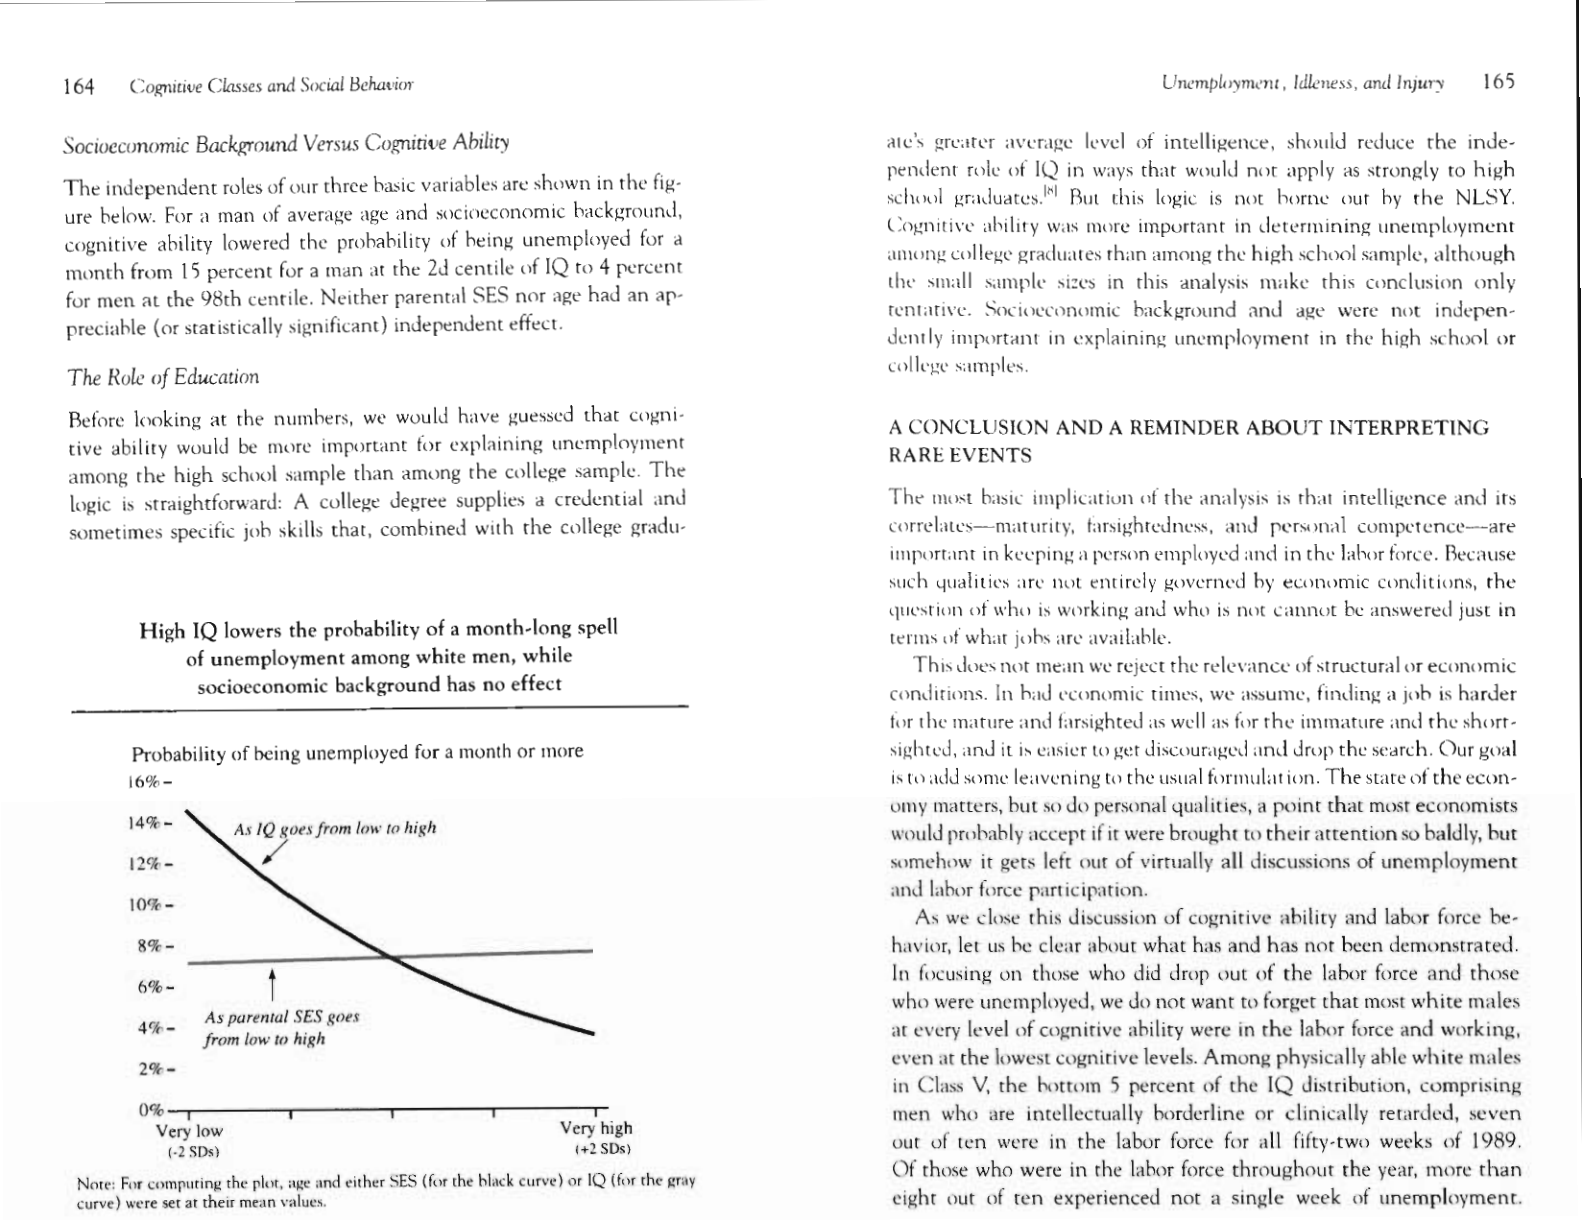
164
In the early 1970s, the marriage race began a prolonged decline for no
immediately apparent reason
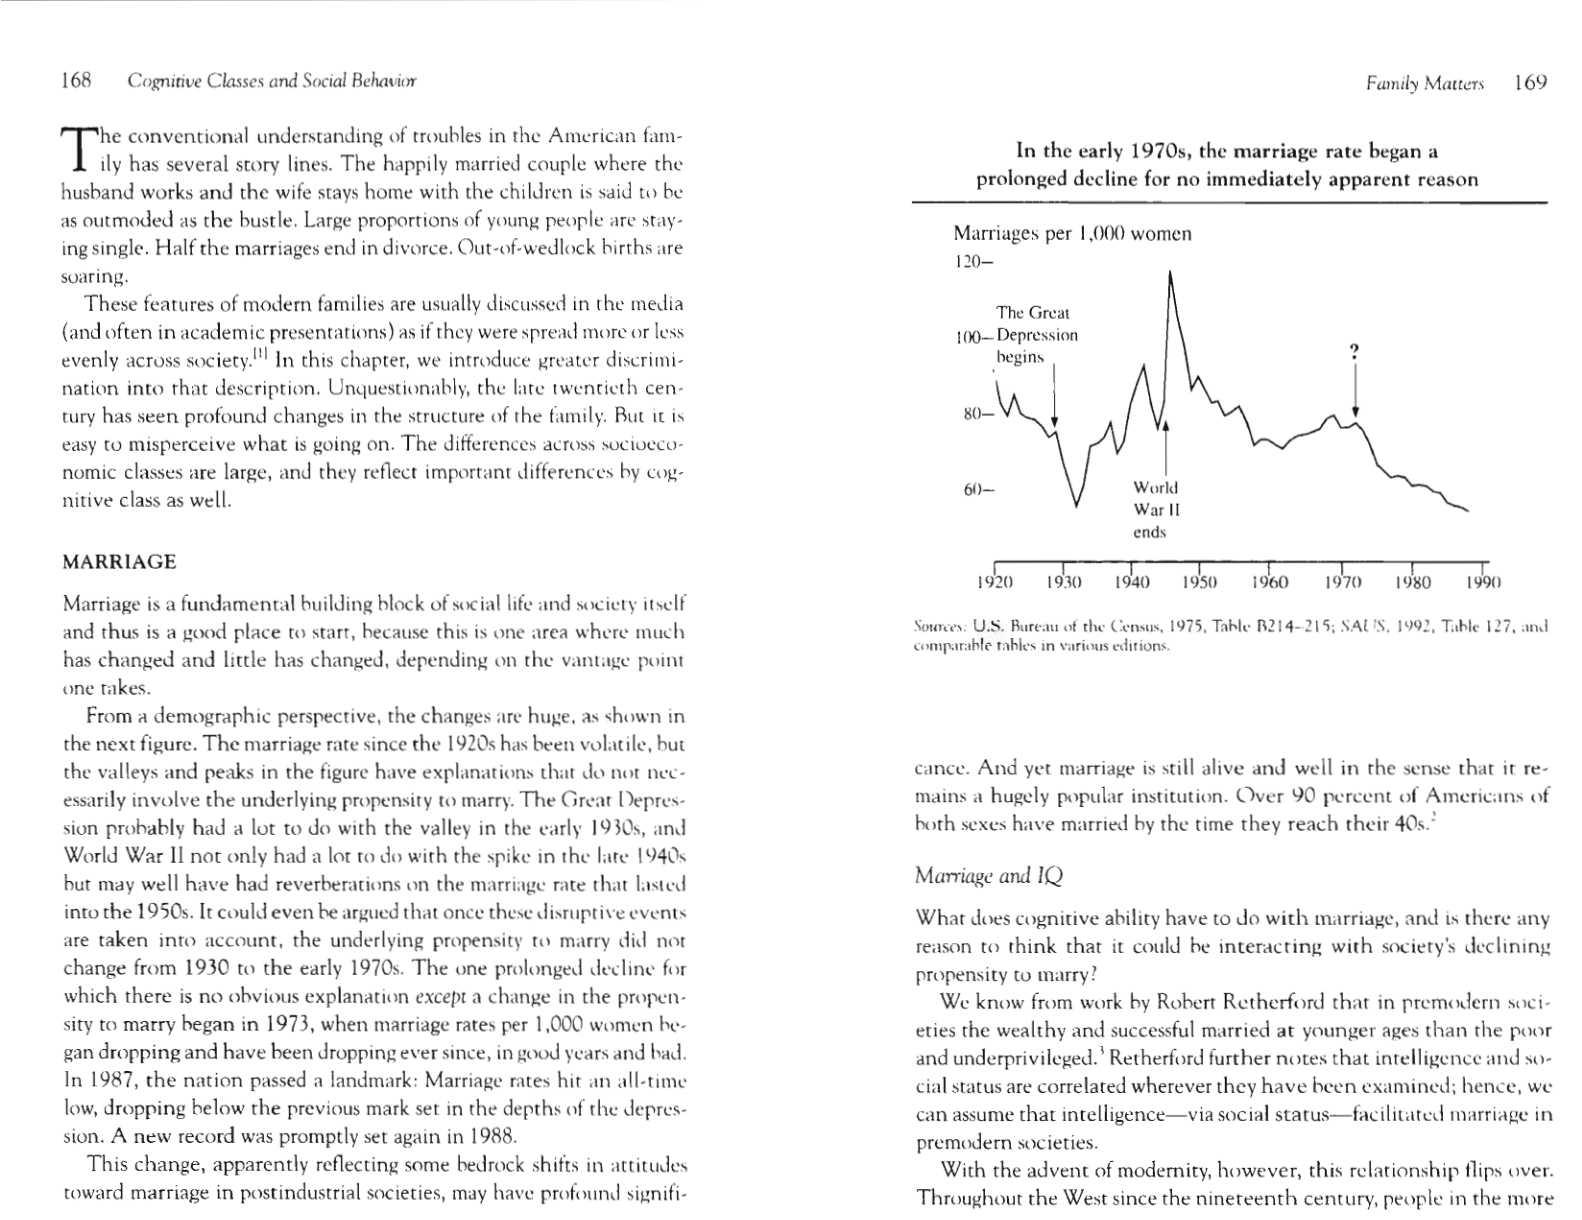
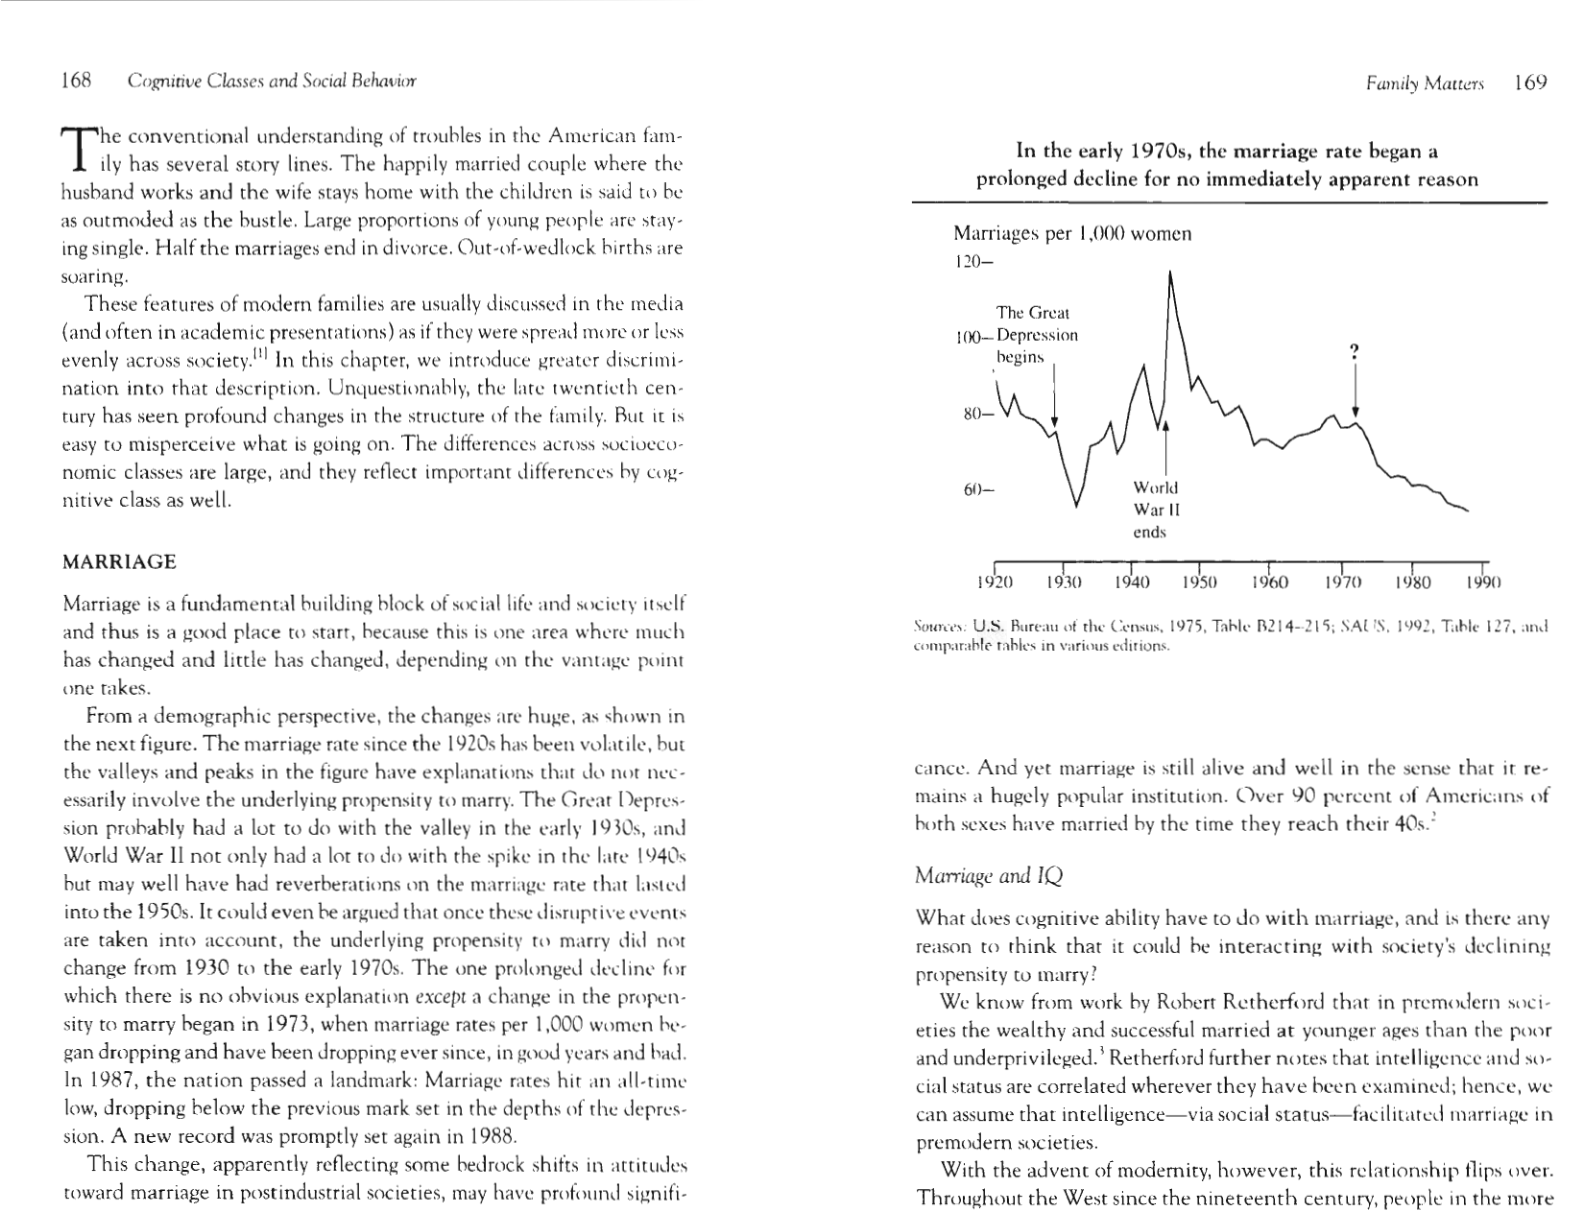
169
High IQ raises the probability of marriage for the white high school sam-
ple, while high socioeconomic background lowers it
172
The divorce revolution
173
IQ and socioeconomic background have opposite effects on the likeli-
hood of an early divorce among young whites
175
The illegitimacy revolution 178
IQ has a large effect on white illegitimate births independent of the
mother's socioeconomic background
182
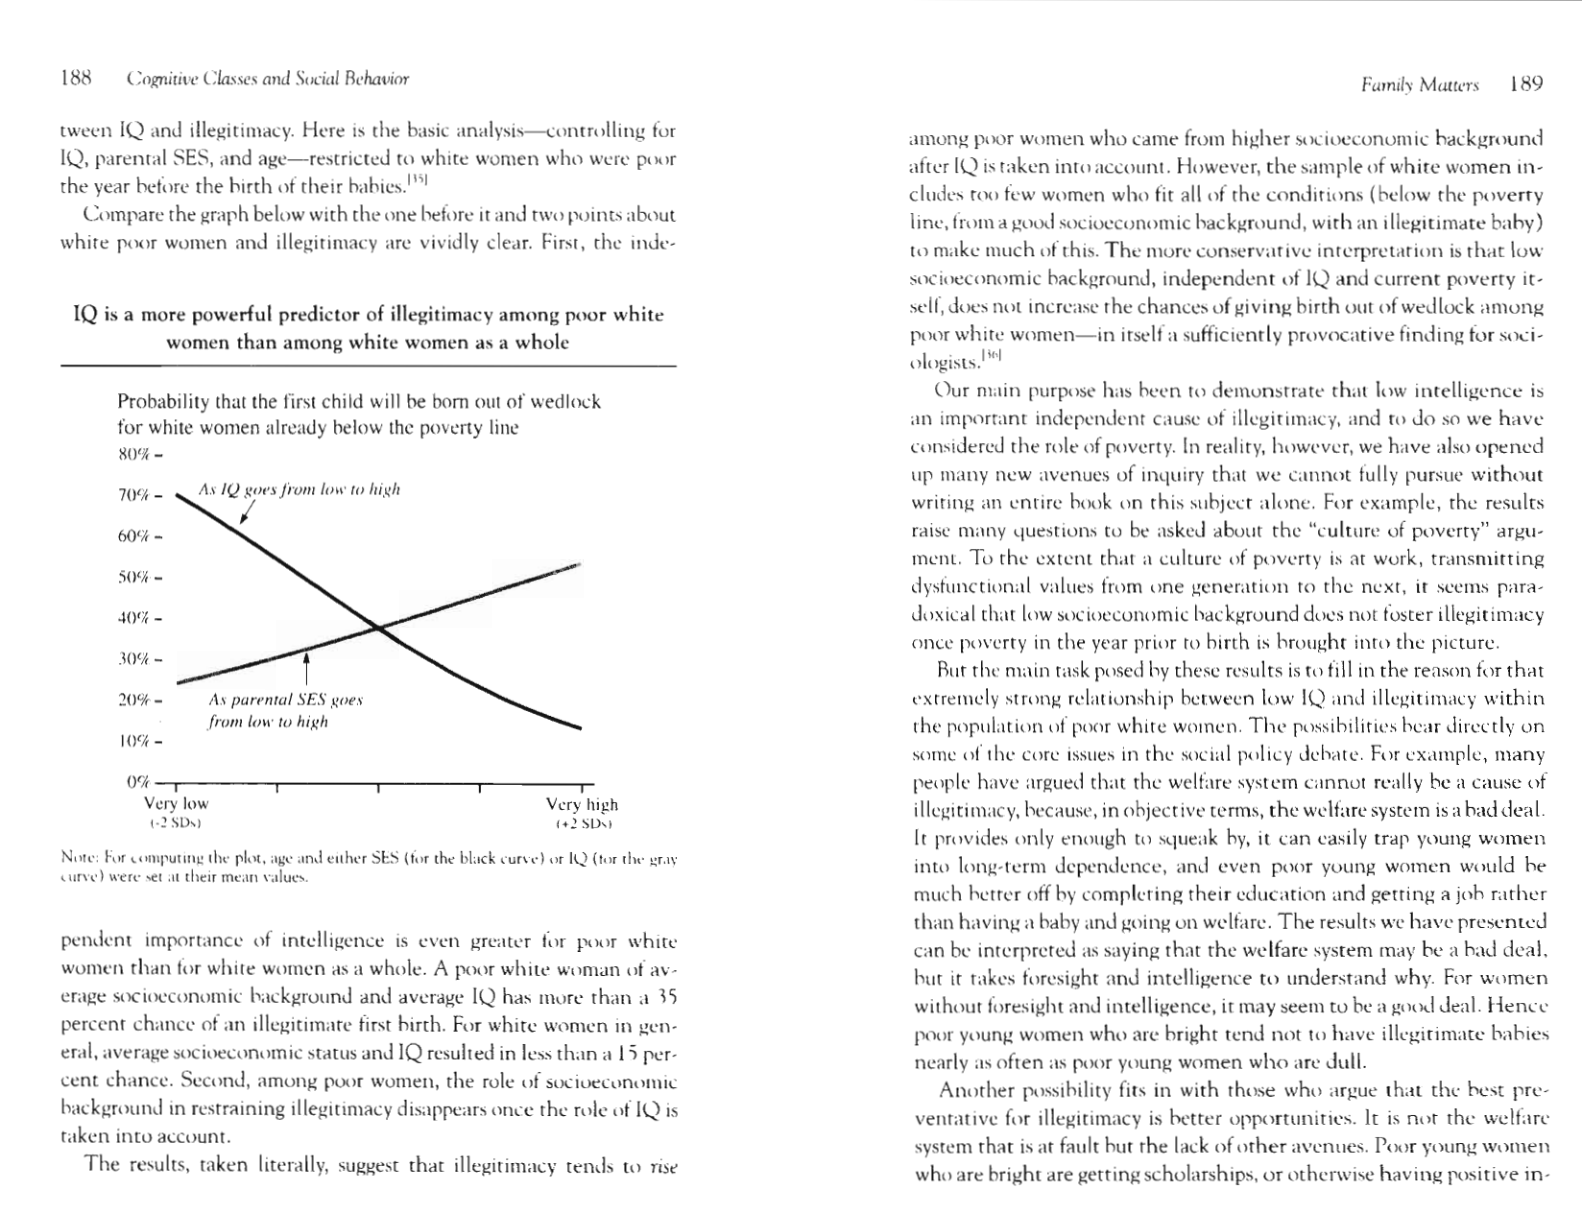
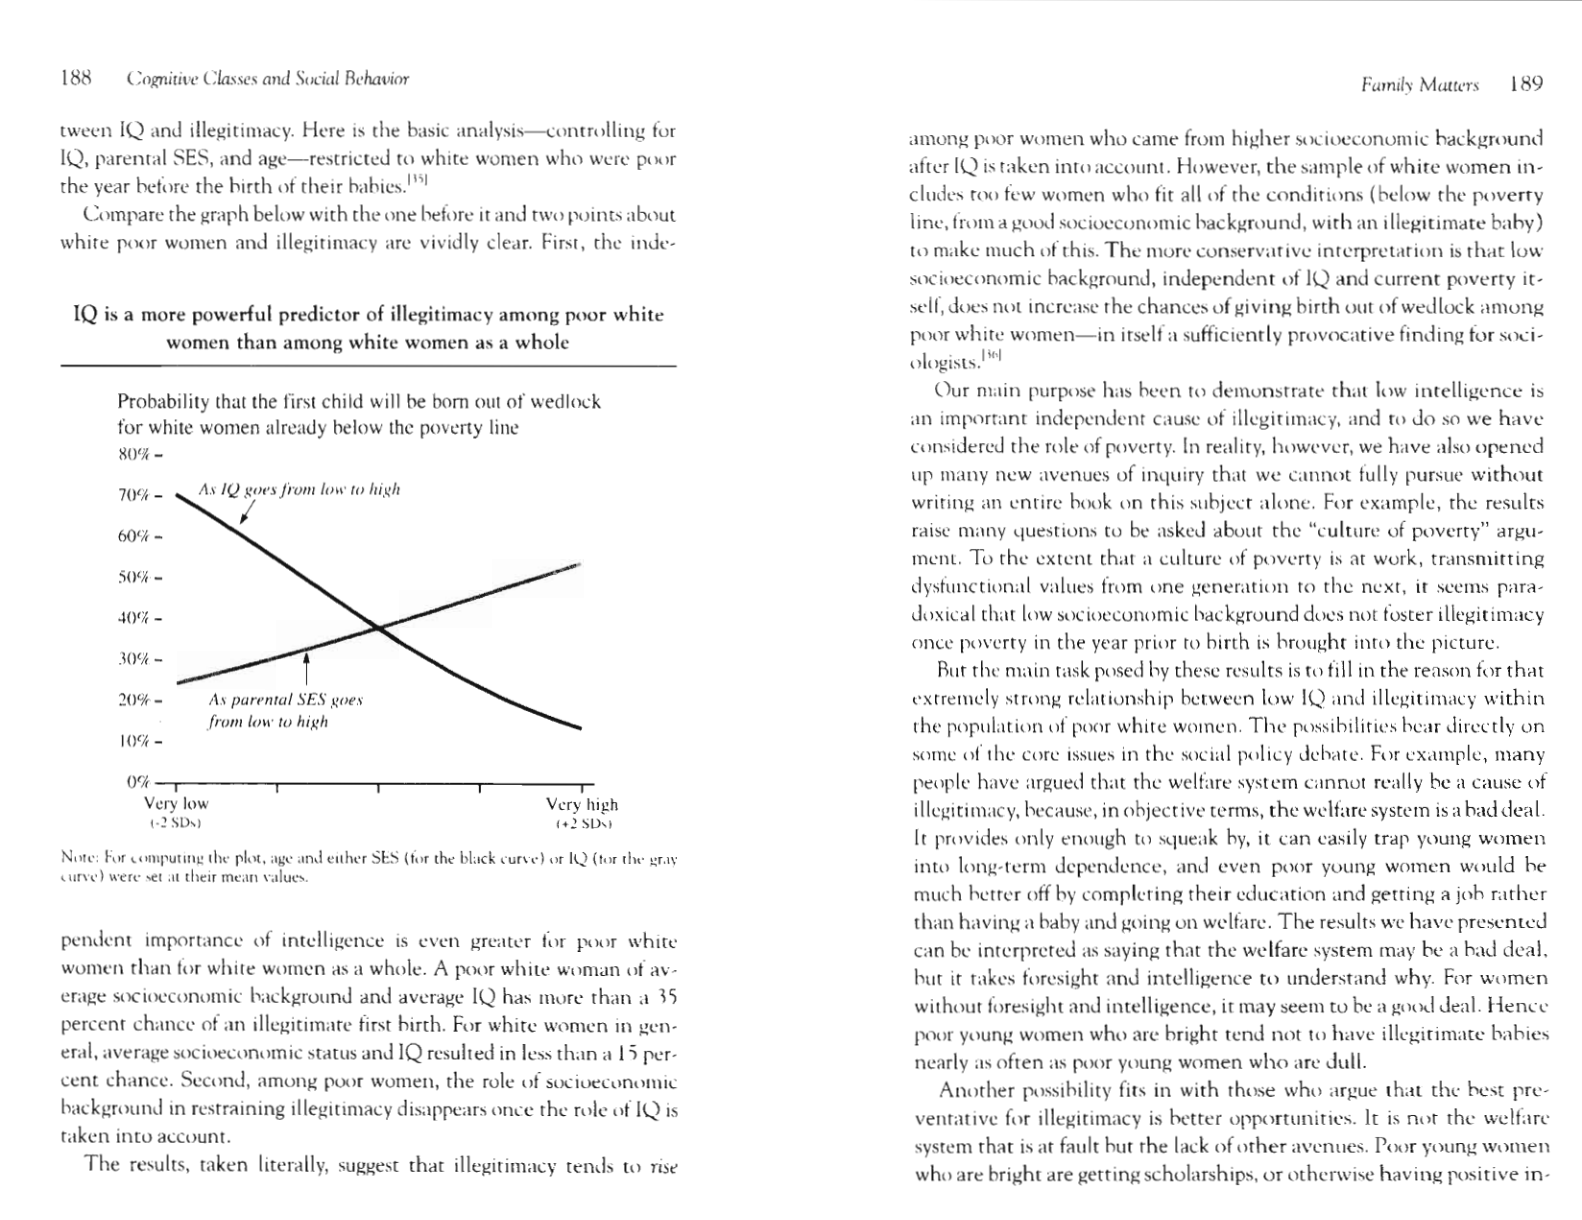
IQ is a more powerful predictor of illegitimacy among poor white women
than among white women as a whole
188
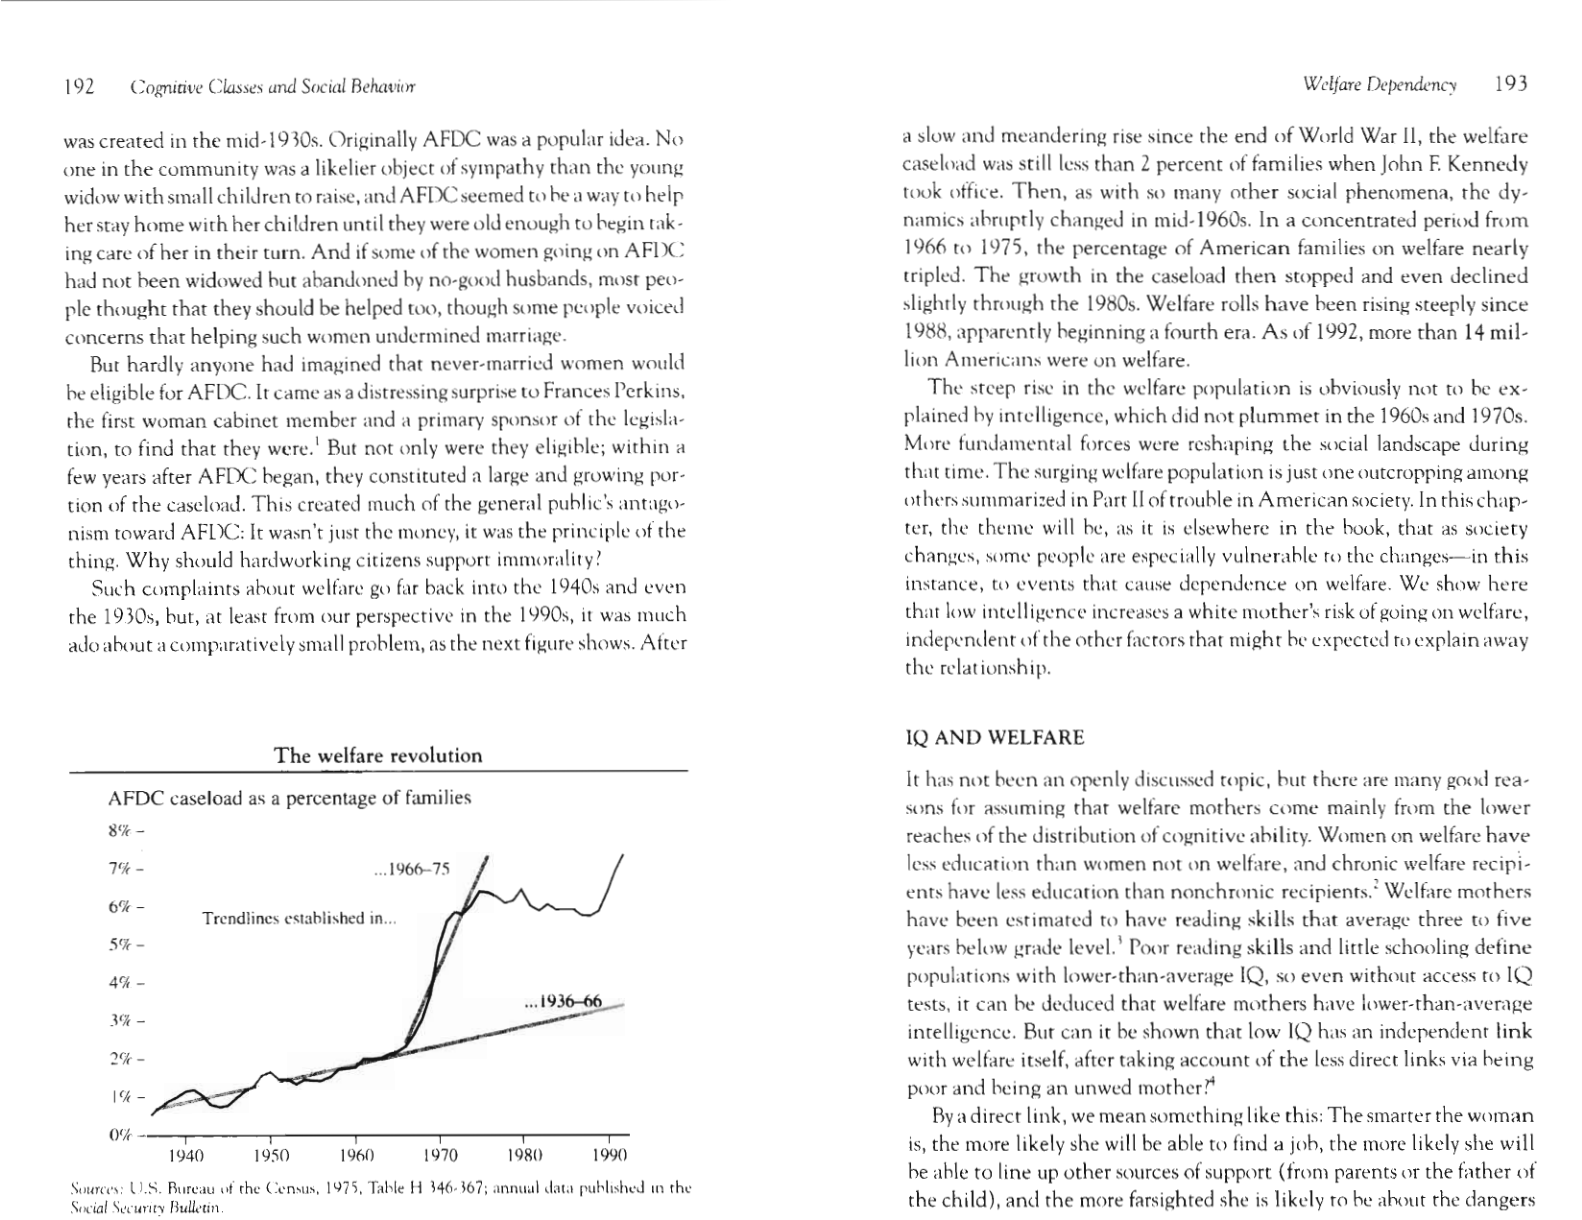
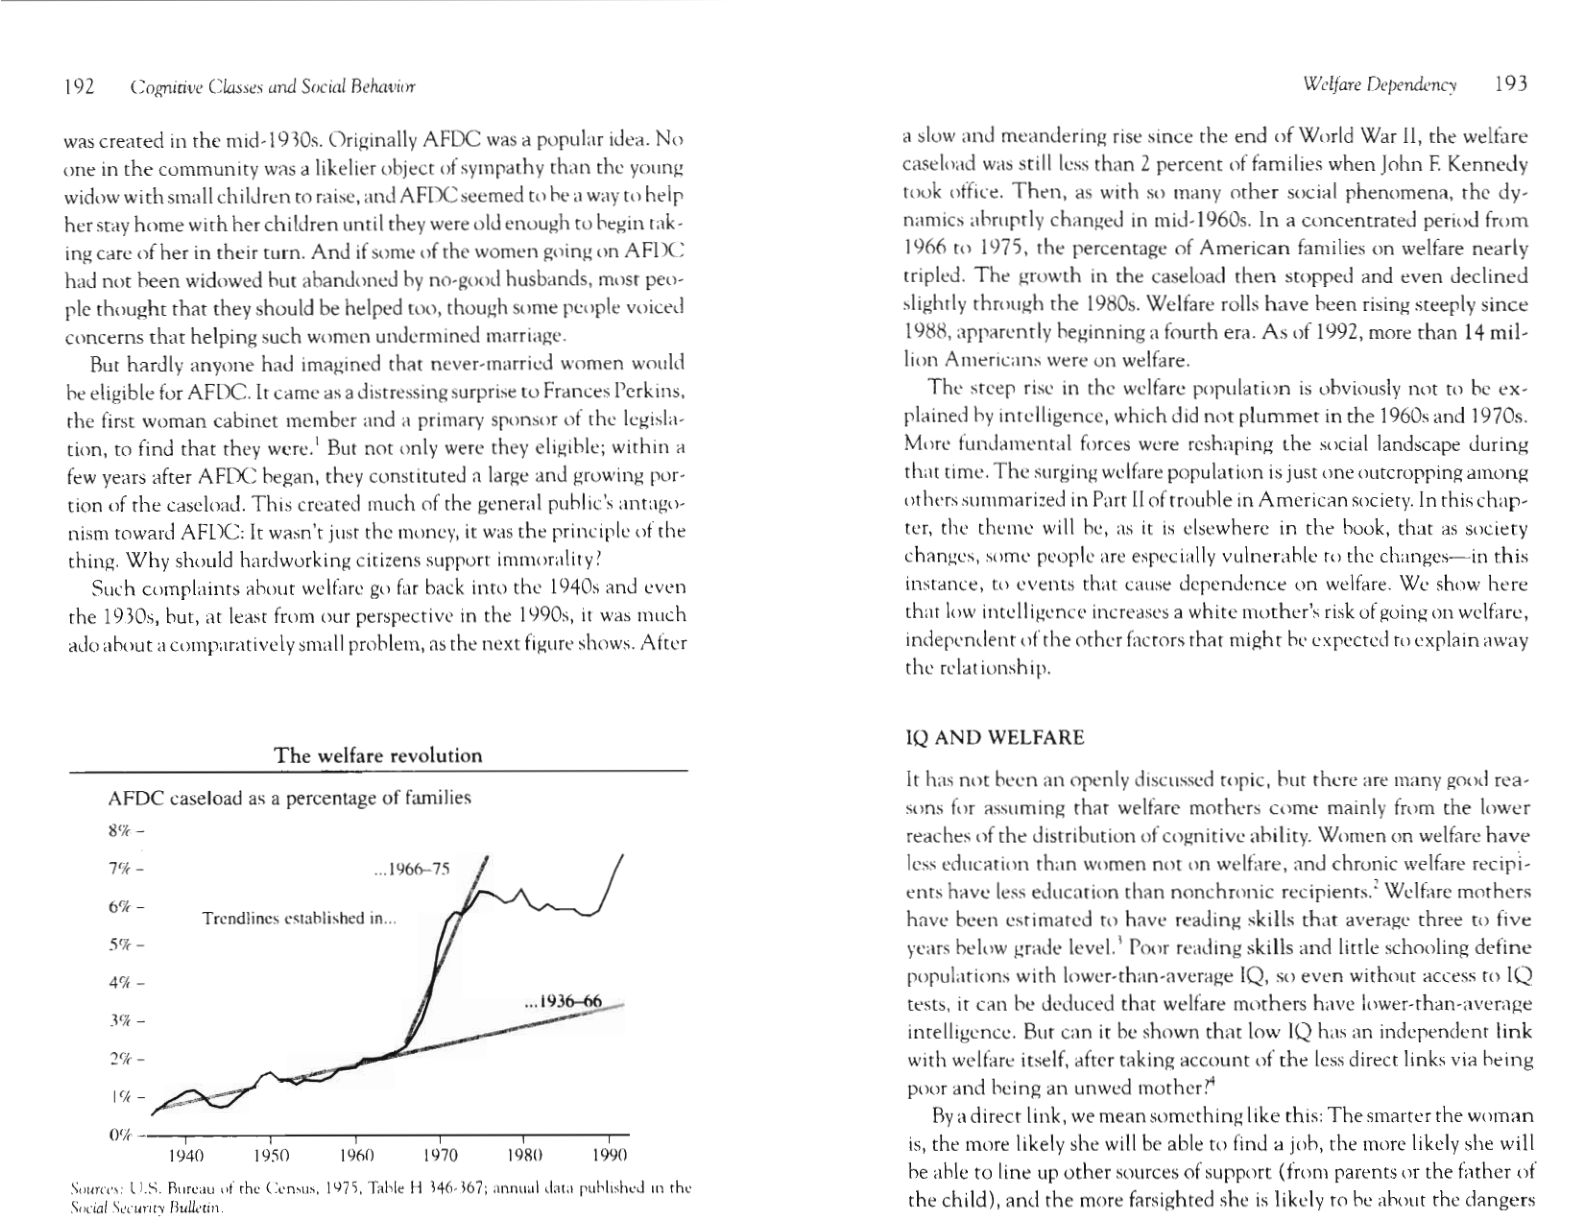
The welfare revolution
192
Even after poverty and marital status are taken into account, IQ played
a substantial role in determining whether white women go on wel-
fare
195
Socioeconomic background and IQ are both important in determining
whether white women become chronic welfare recipients
197
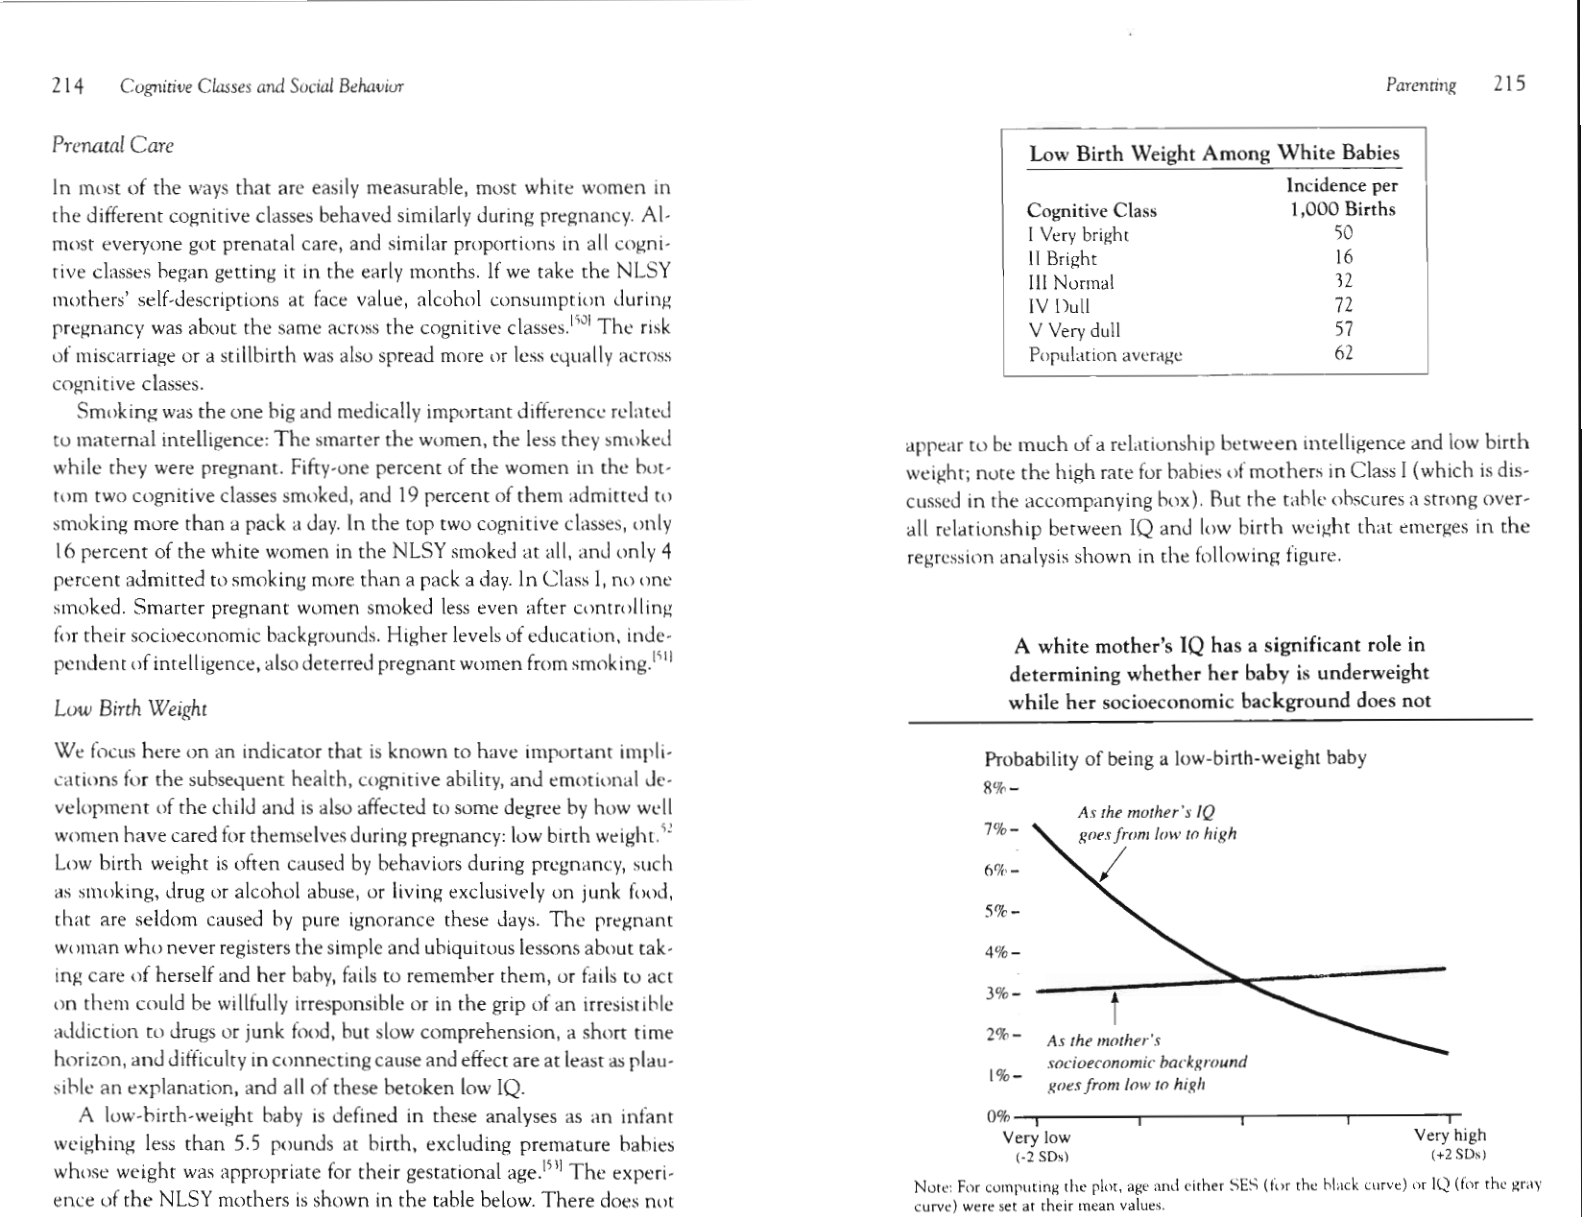
A white mother's IQ has a significant role in determining whether
her baby is underweight while her socioeconomic background does
not 215
A white mother's IQ and socioeconomic background each has a large
independent effect on her child's chances of spending the first three
years of life in poverty
219
A white mother's IQ is more important than her socioeconomic back-
ground in predicting the worst home environments
222
Both a white mother's IQ and socioeconomic background have moder-
ate relationships with developmental problems in the child
228
A white mother's IQ dominates the importance of socioeconomic back-
ground in determining the child's IQ 23 1
The boom in violent crime after the 1950s
236
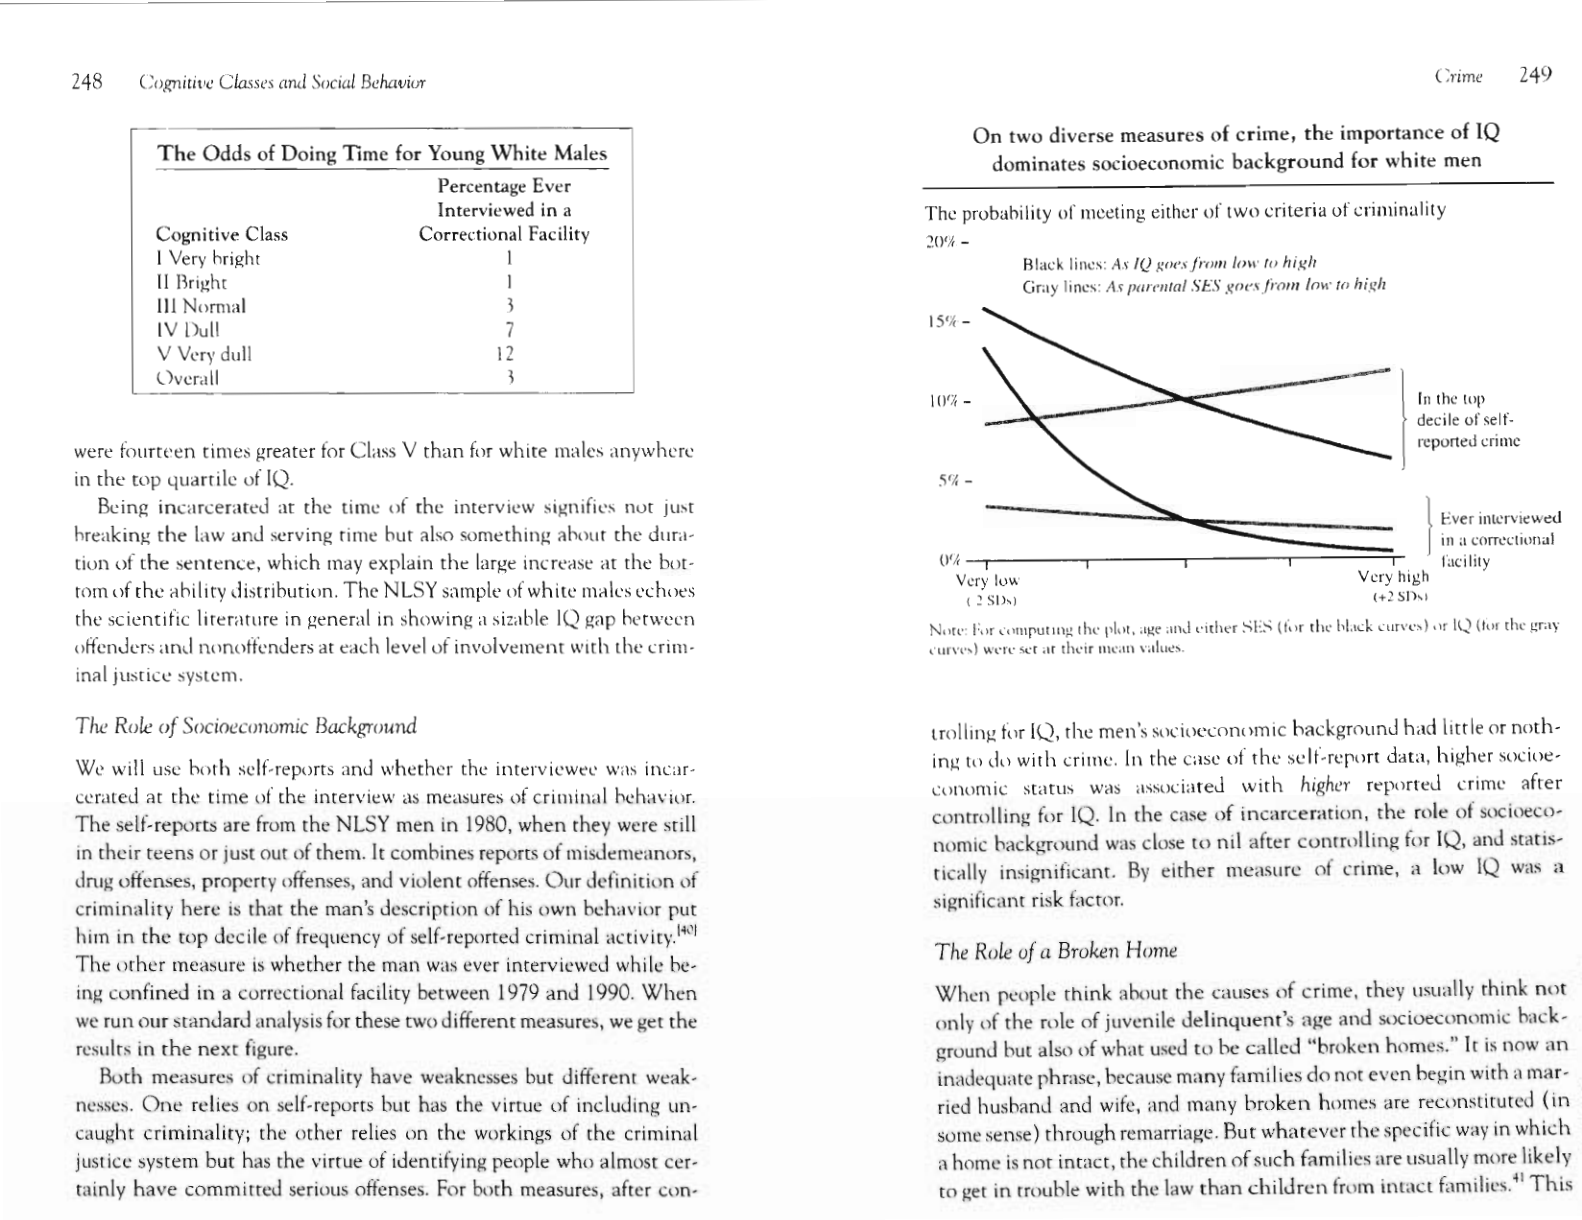
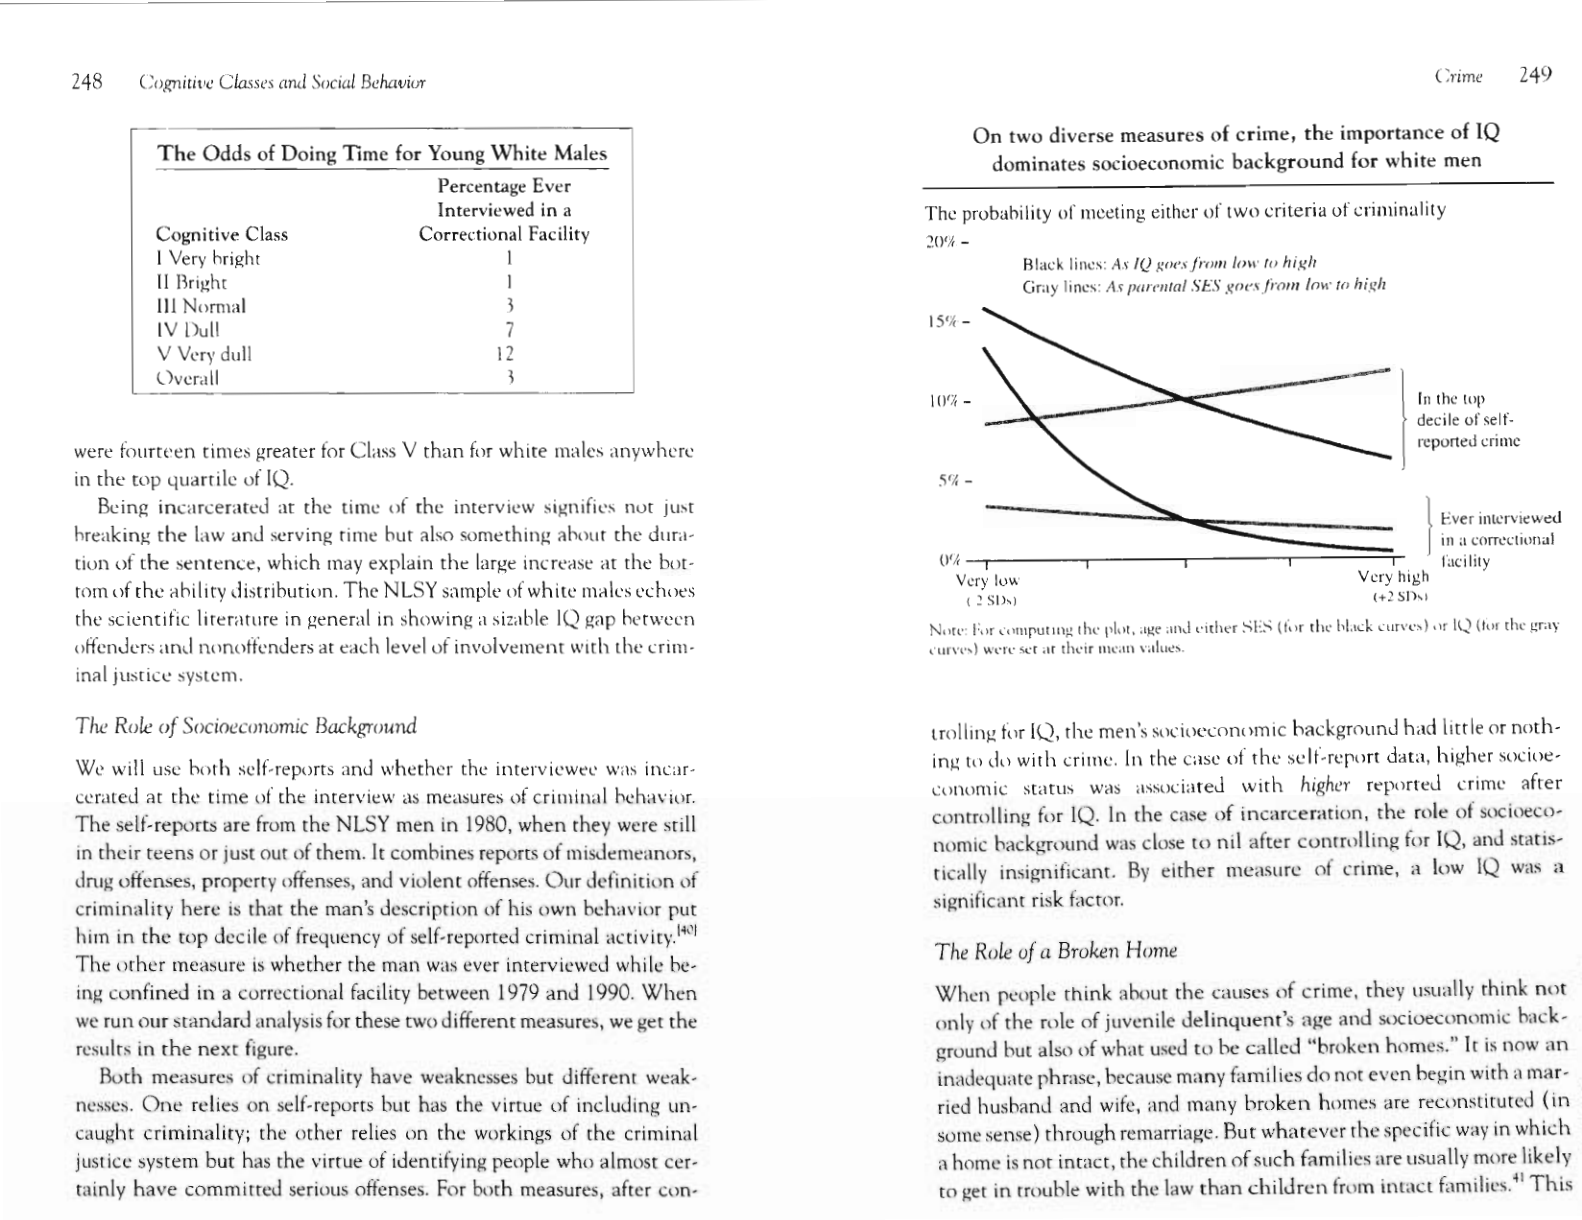
On two diverse measures of crime, the importance of IQ dominates so-
cioeconomic background for white men
249
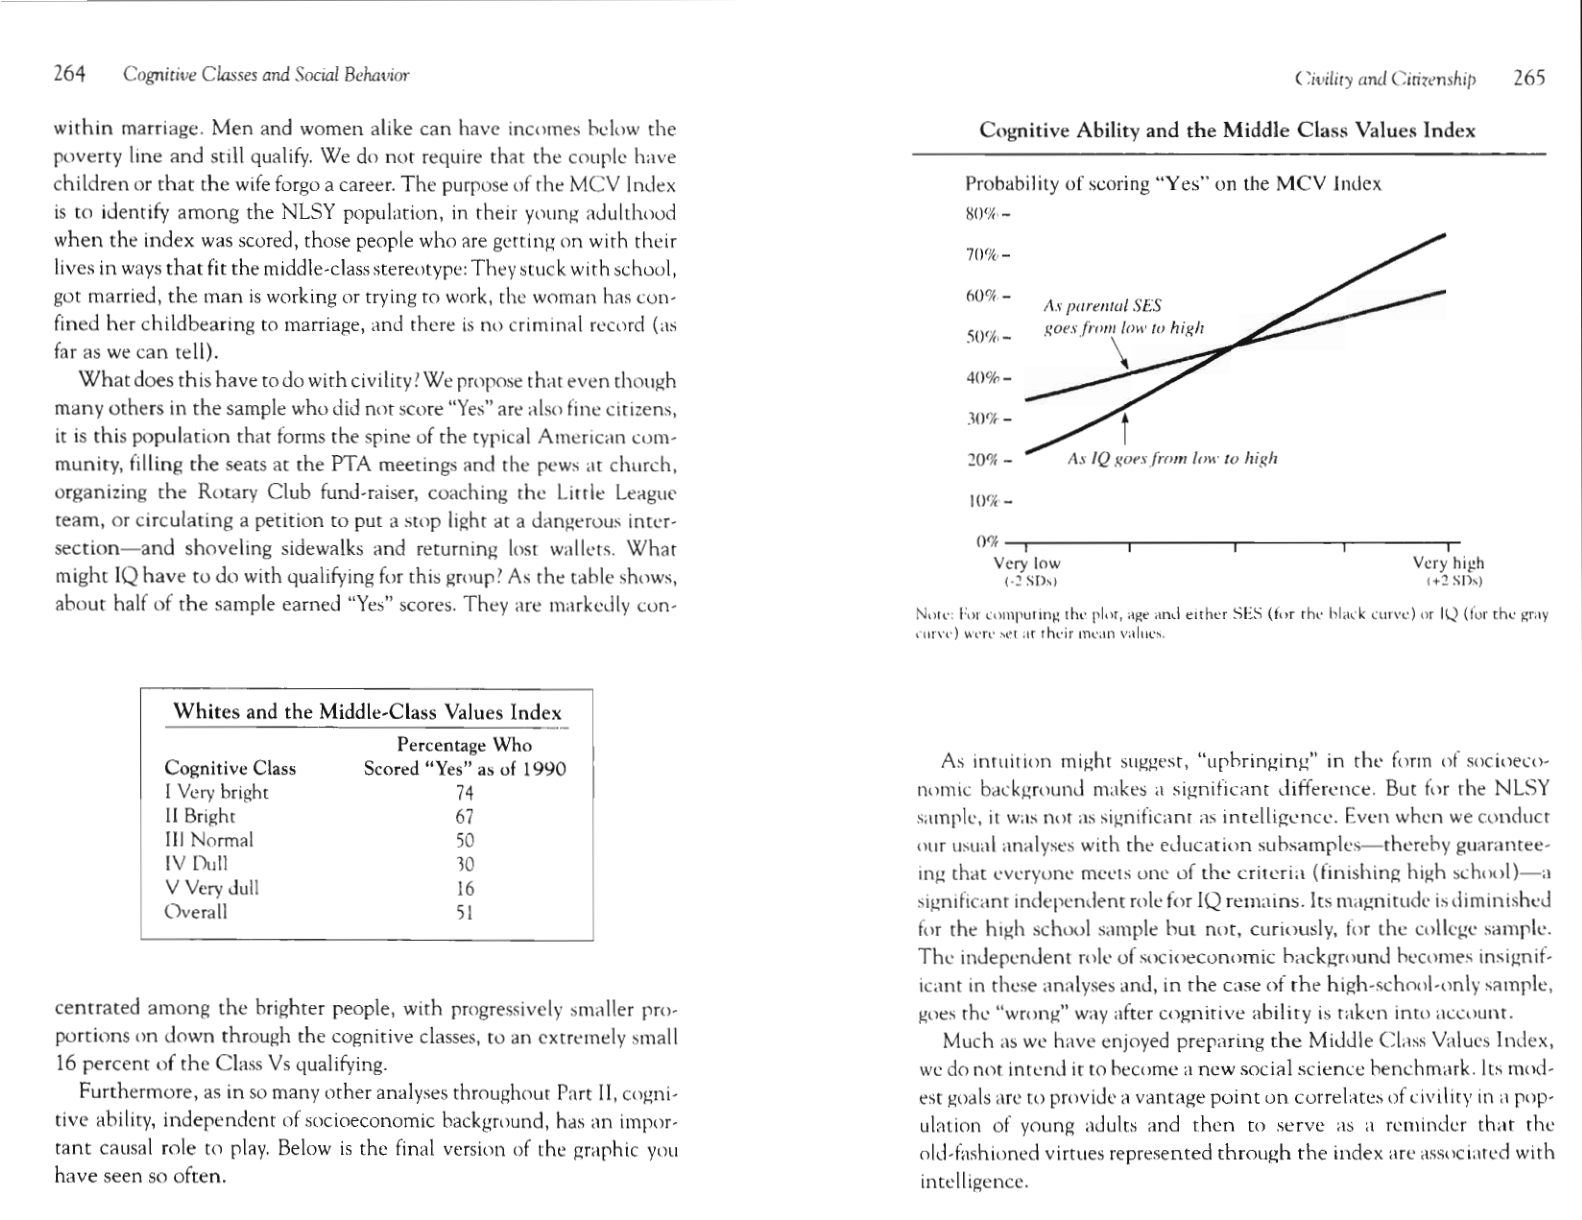
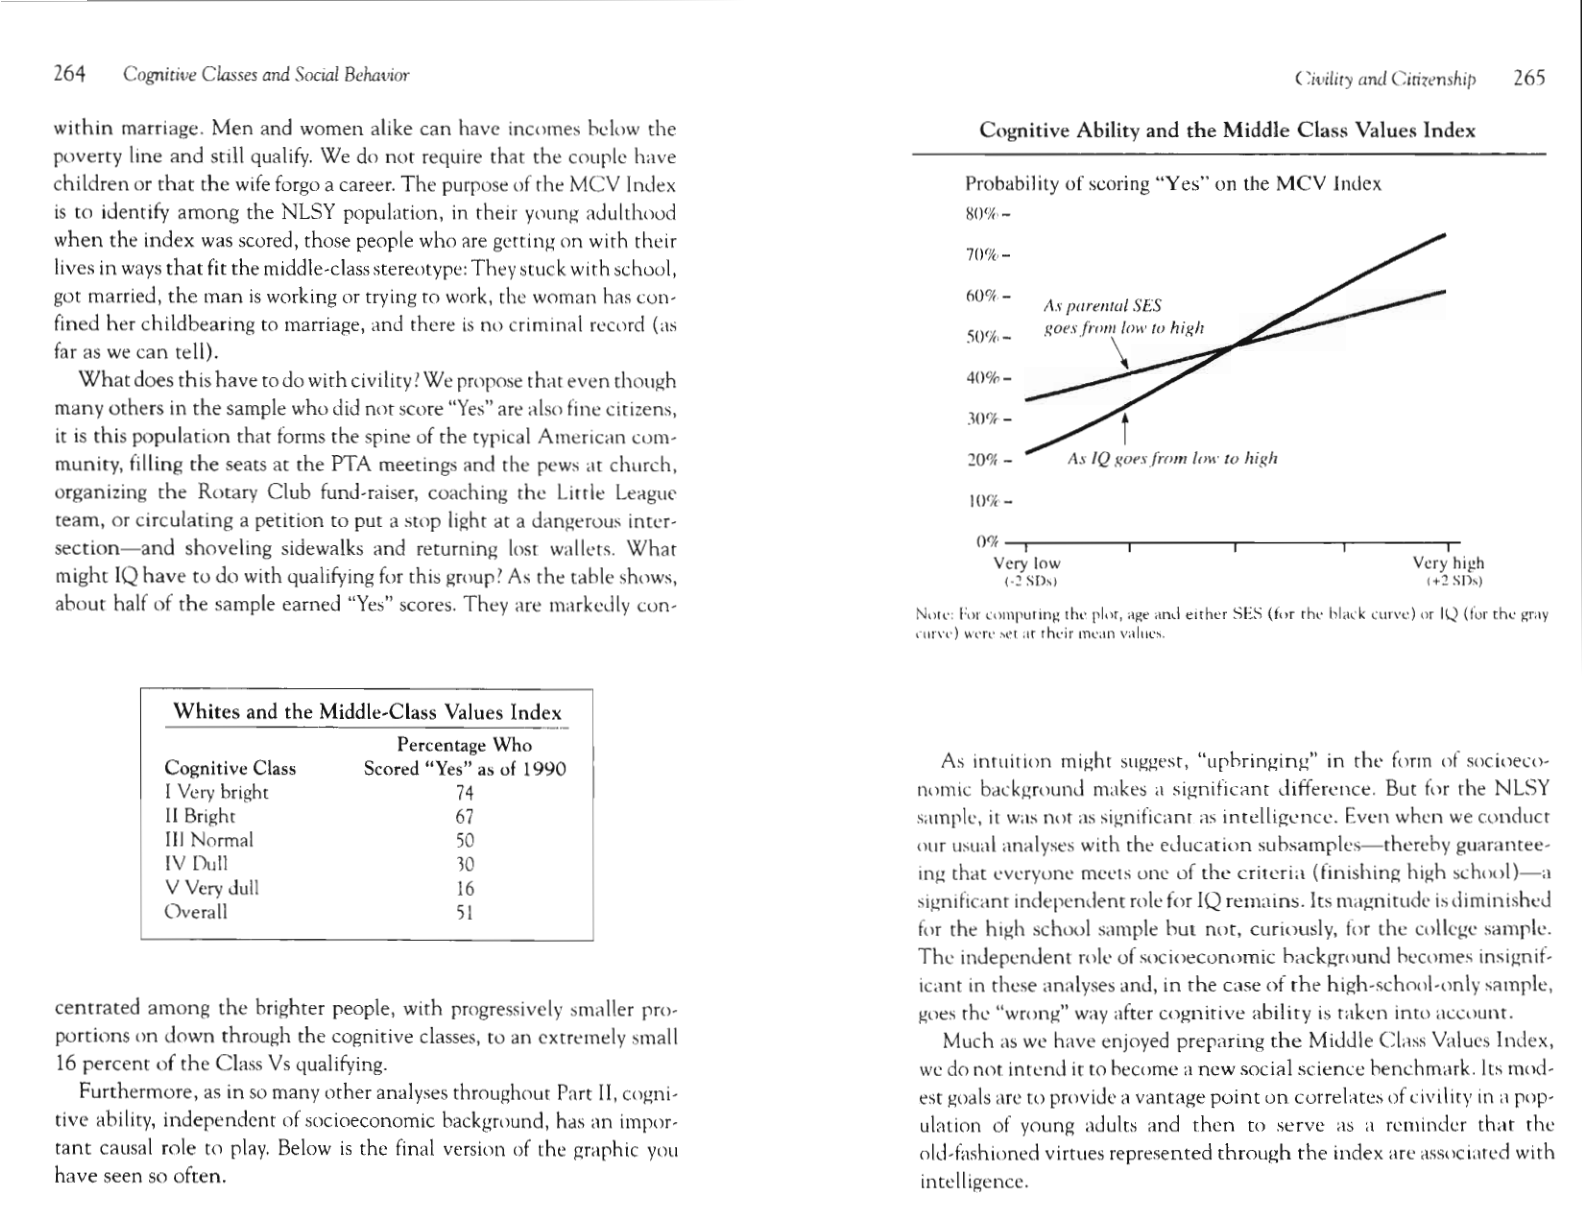
Cognitive ability and the Middle Class Values index
265
Overview of studies of reporting black-white differences in cognitive
test scores, 1918-1990
277
The black and white IQ distributions in the NLSY, Version 1 279
The black and white IQ distributions in the NLSY, Version I1 279
Black IQ scores go up with socioeconomic status, but the black-white
difference does not shrink 288
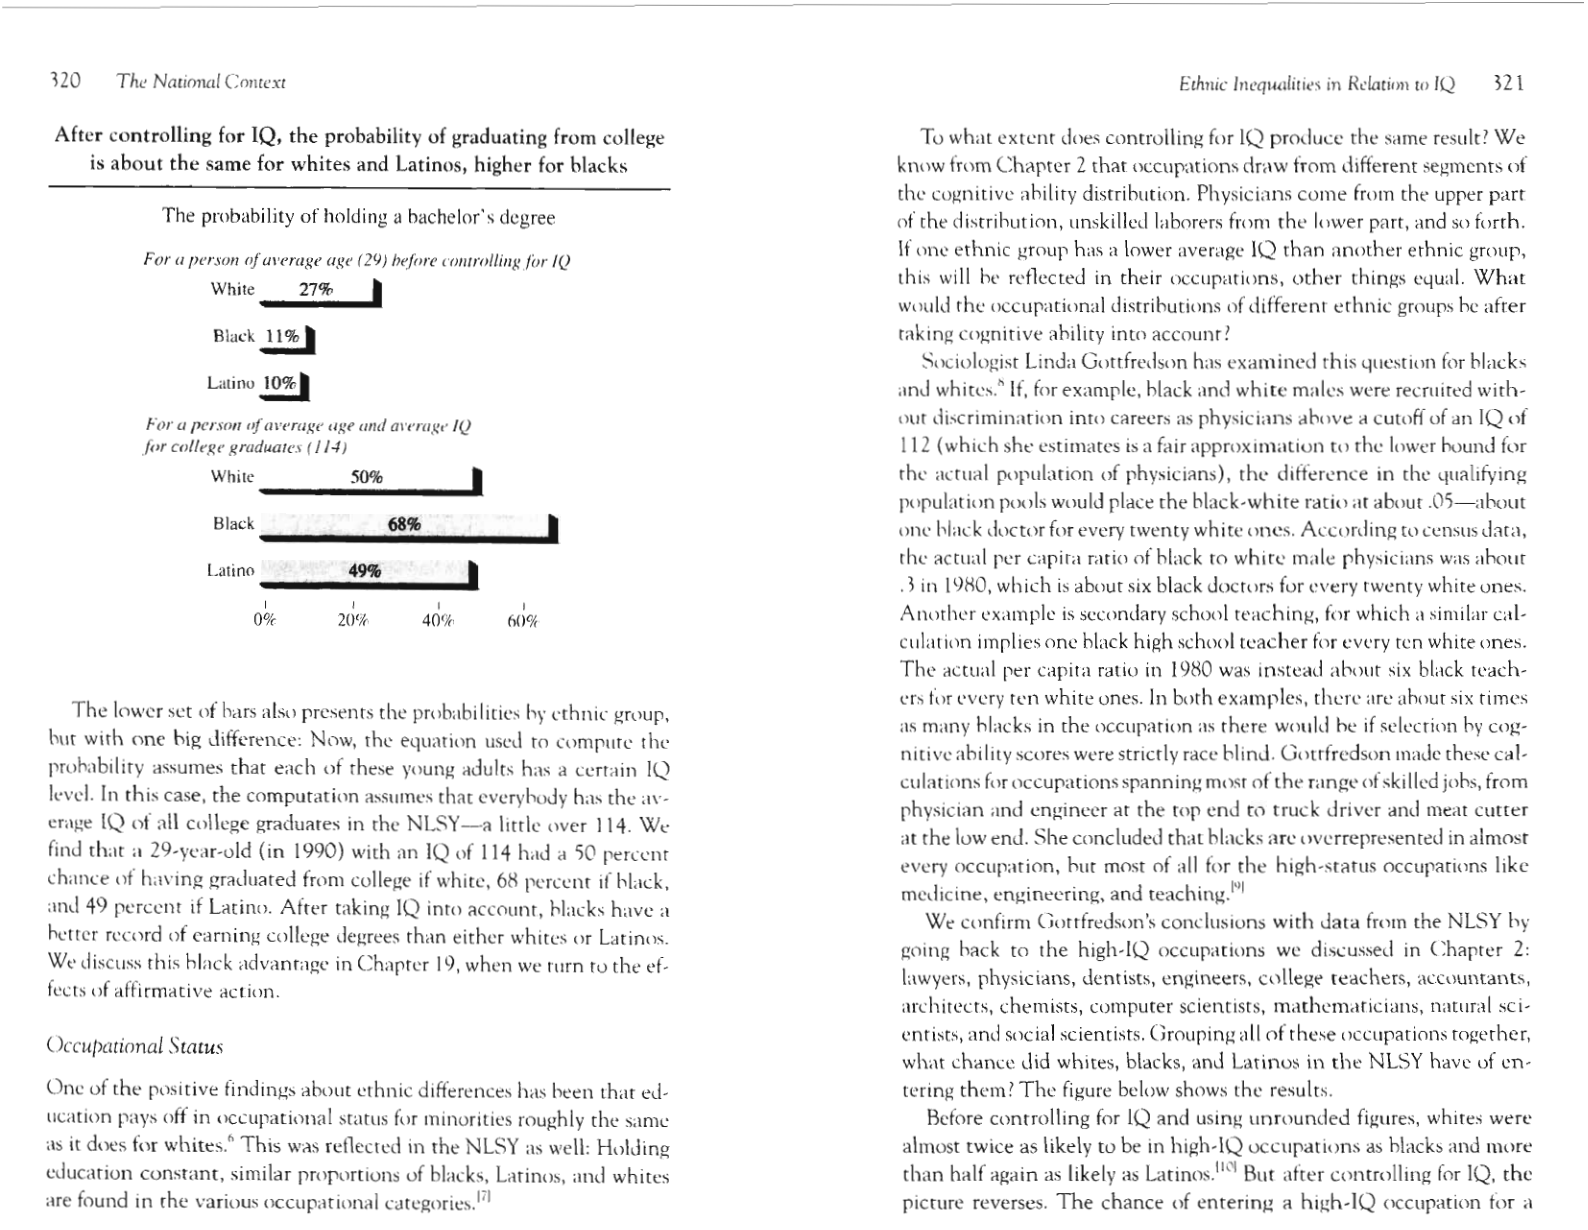
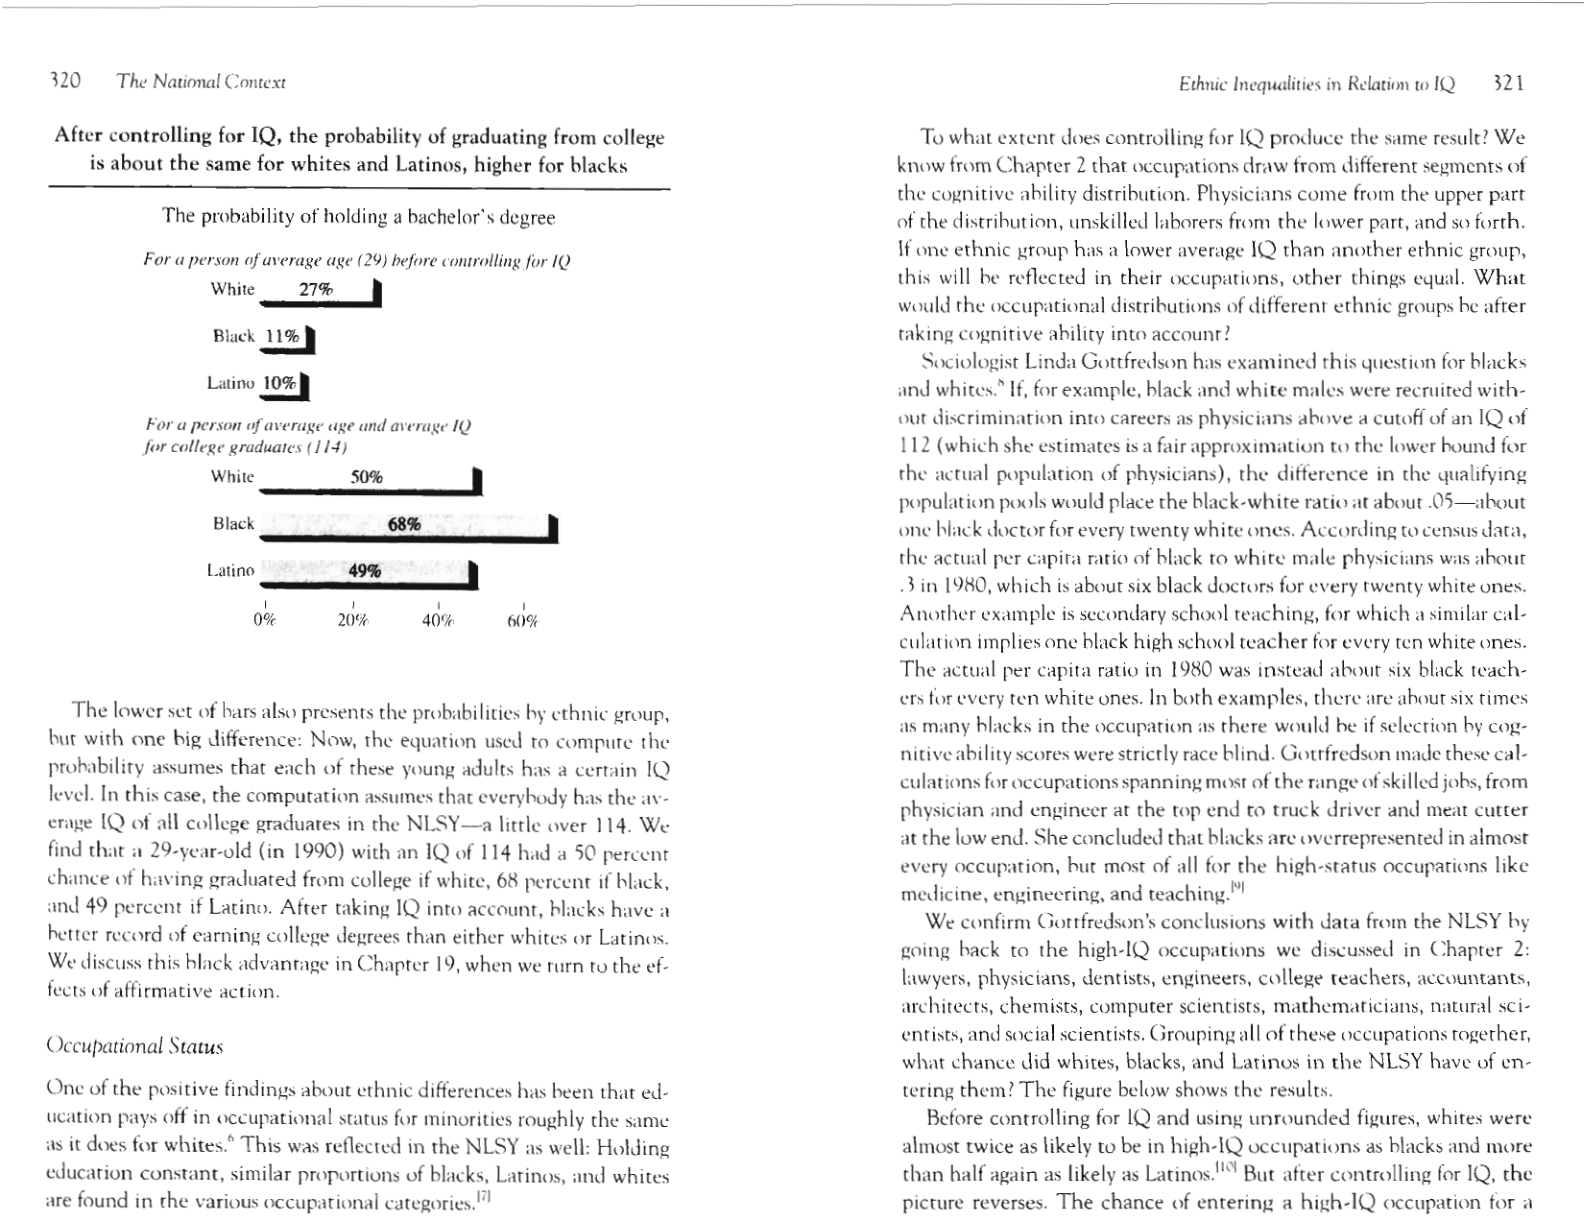
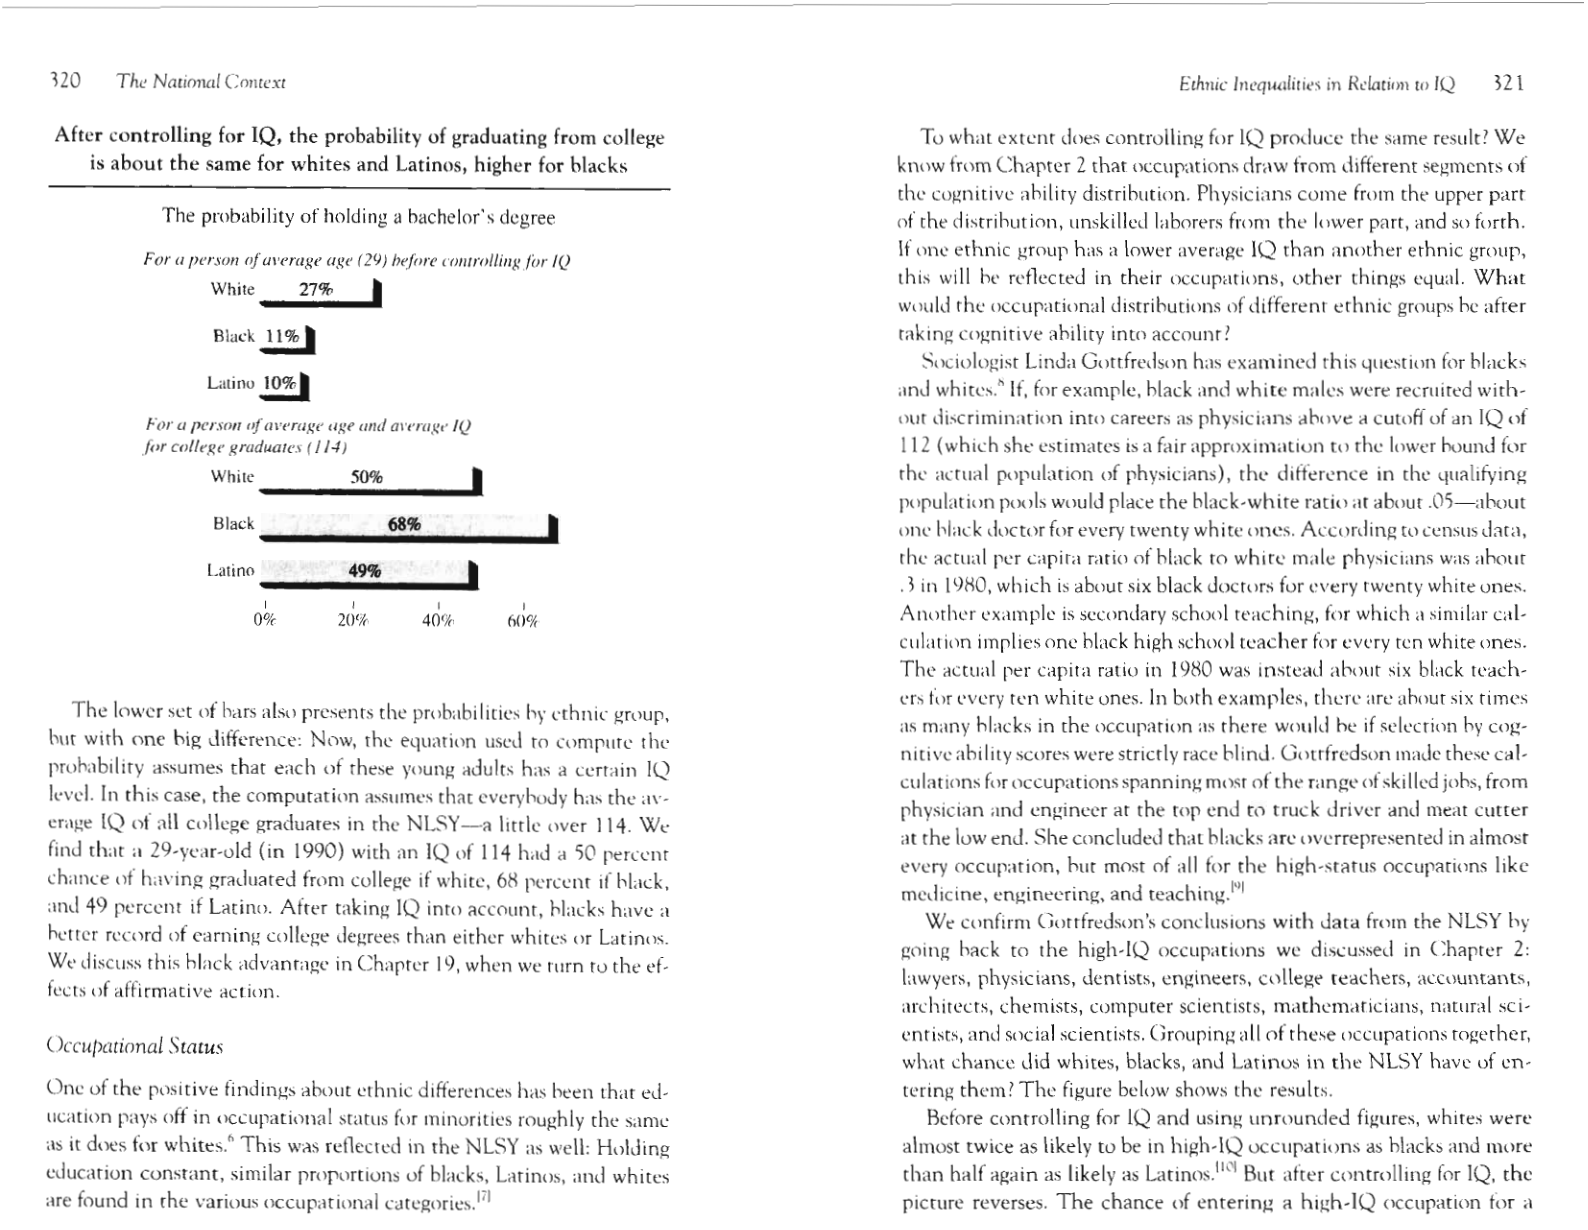
After controlling for IQ, the probability of graduating from college is
about the same for whites and Latinos, higher for blacks
320
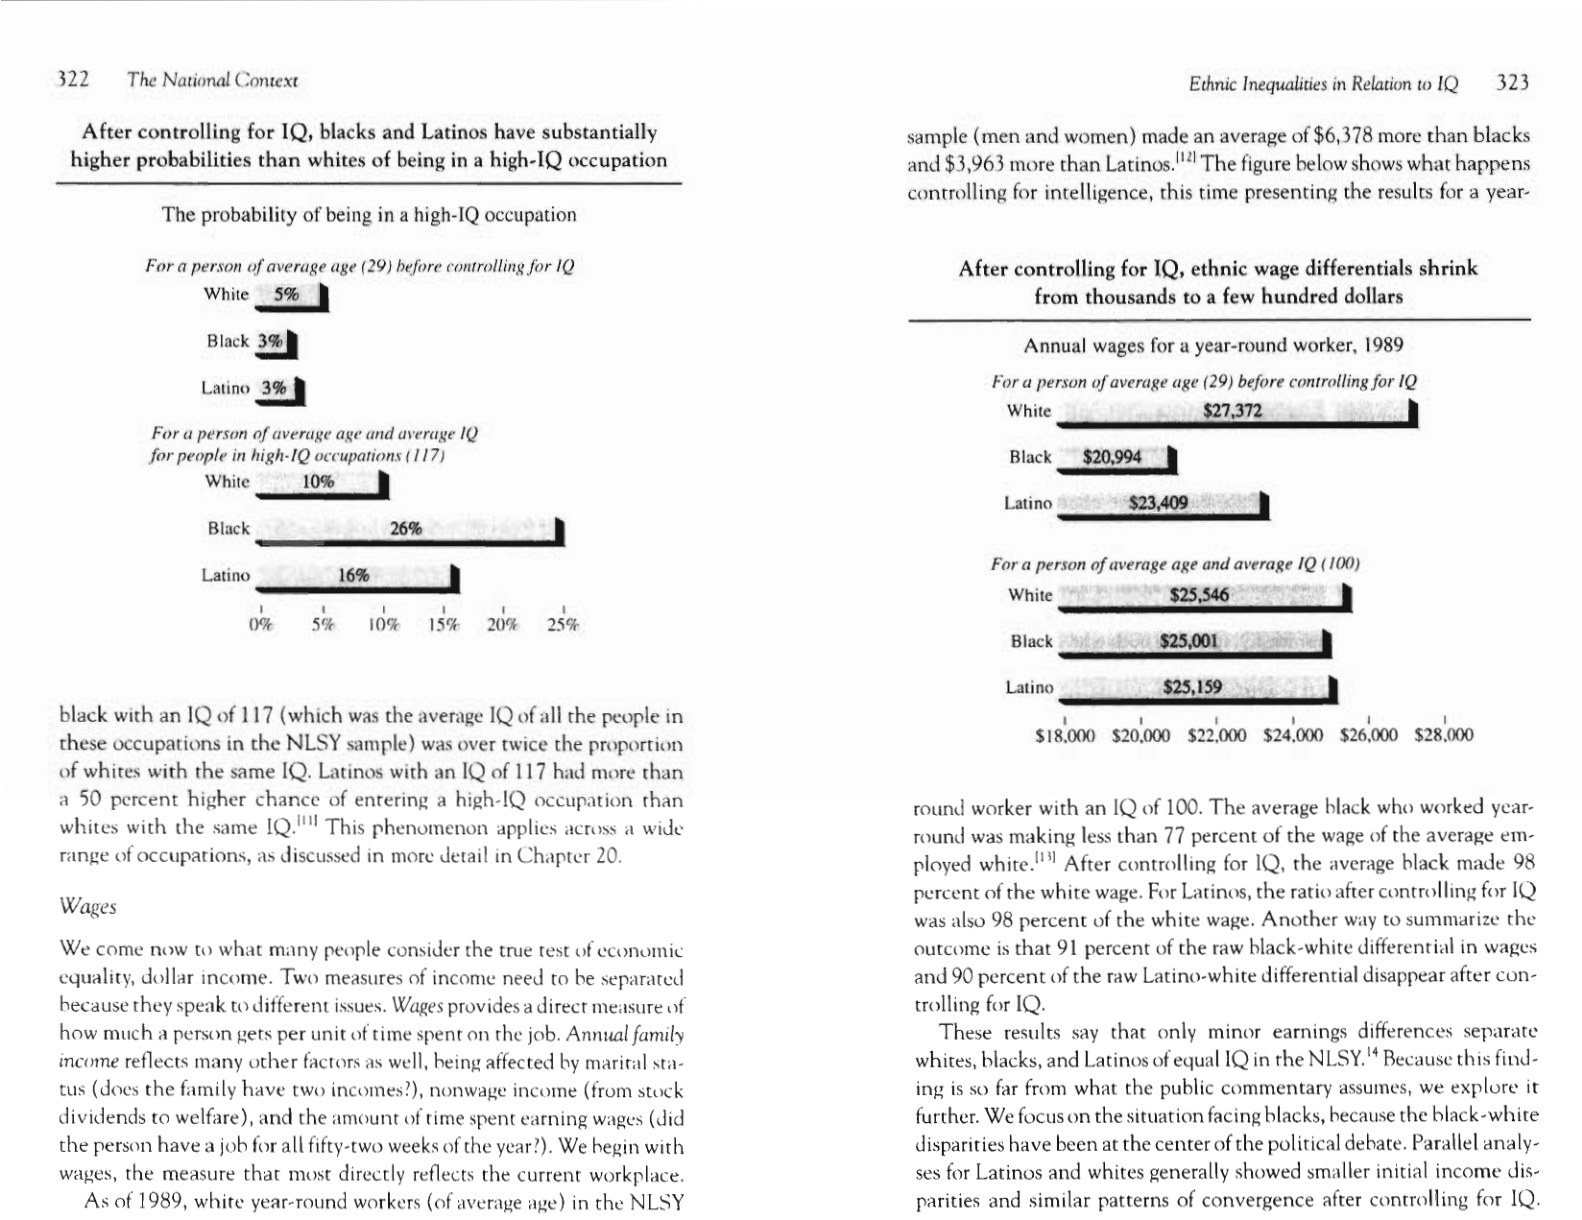
After controlling for IQ, blacks and Latinos have substantially higher
probabilities than whites of being in a high-IQ occupation 322
After controlling for IQ, ethnic wage differentials shrink from thou-
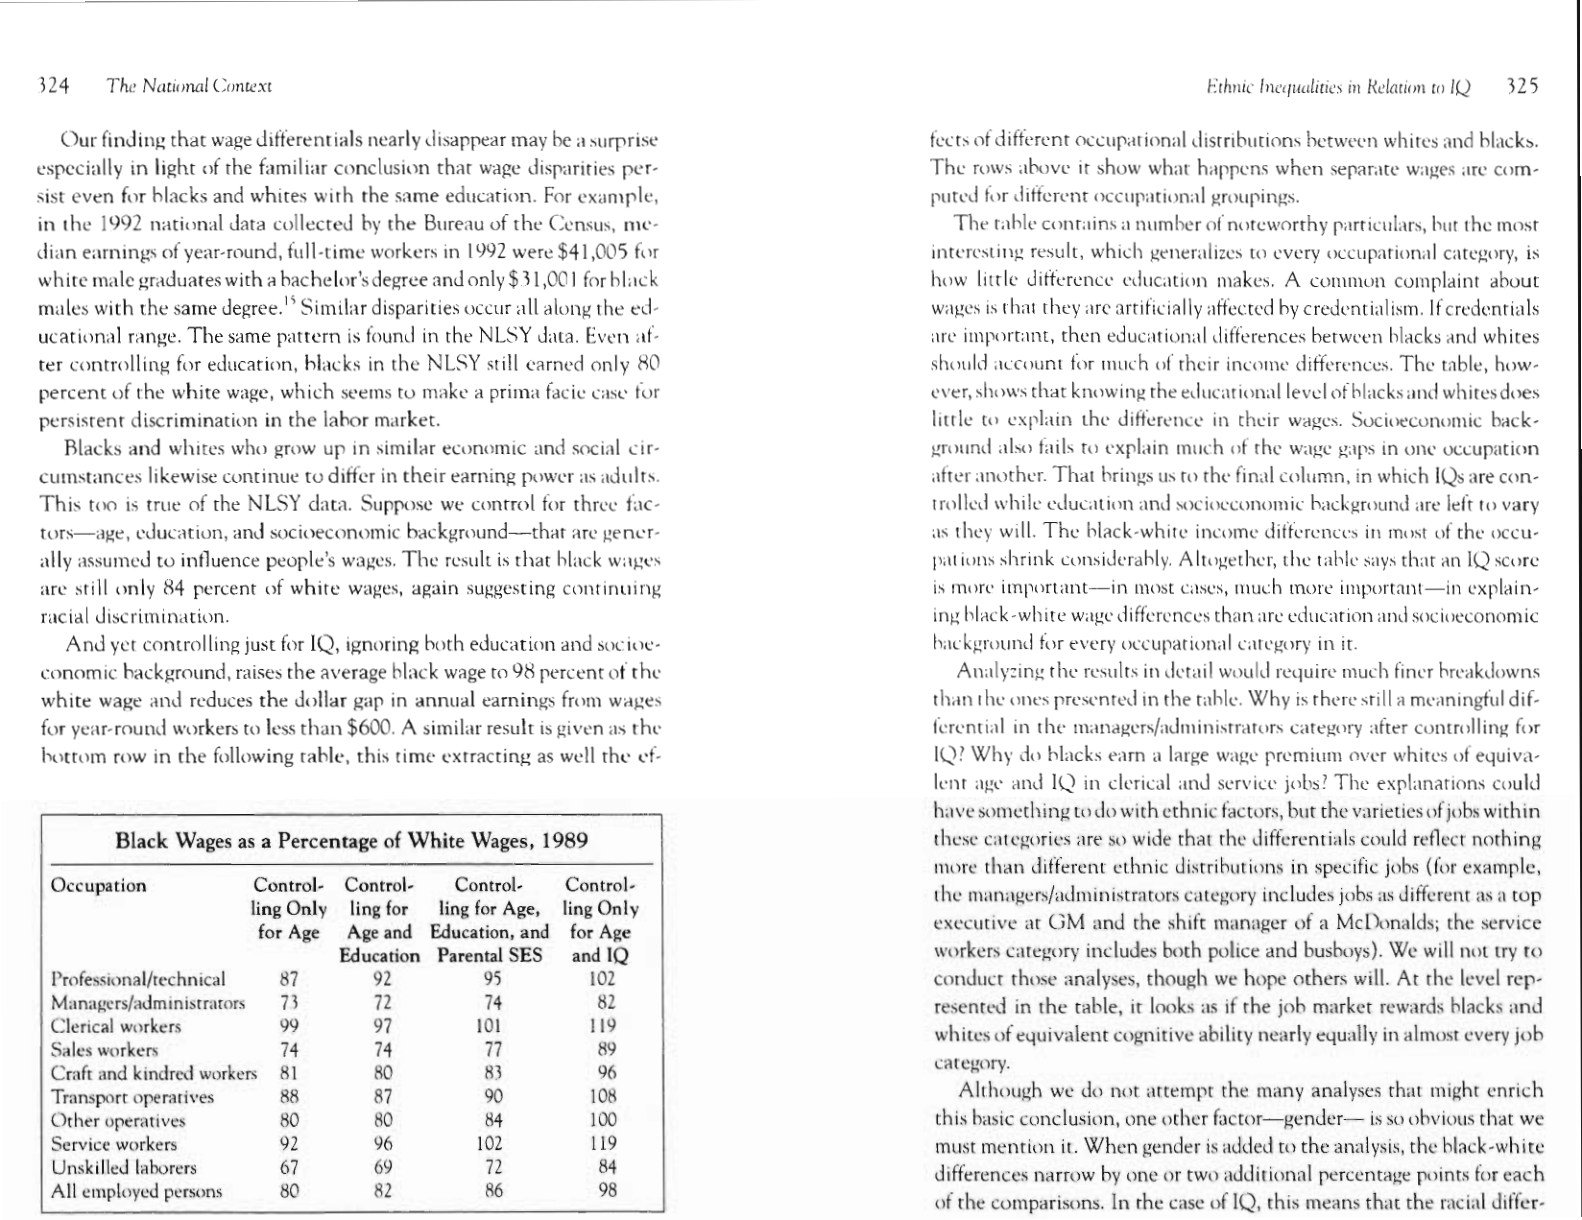
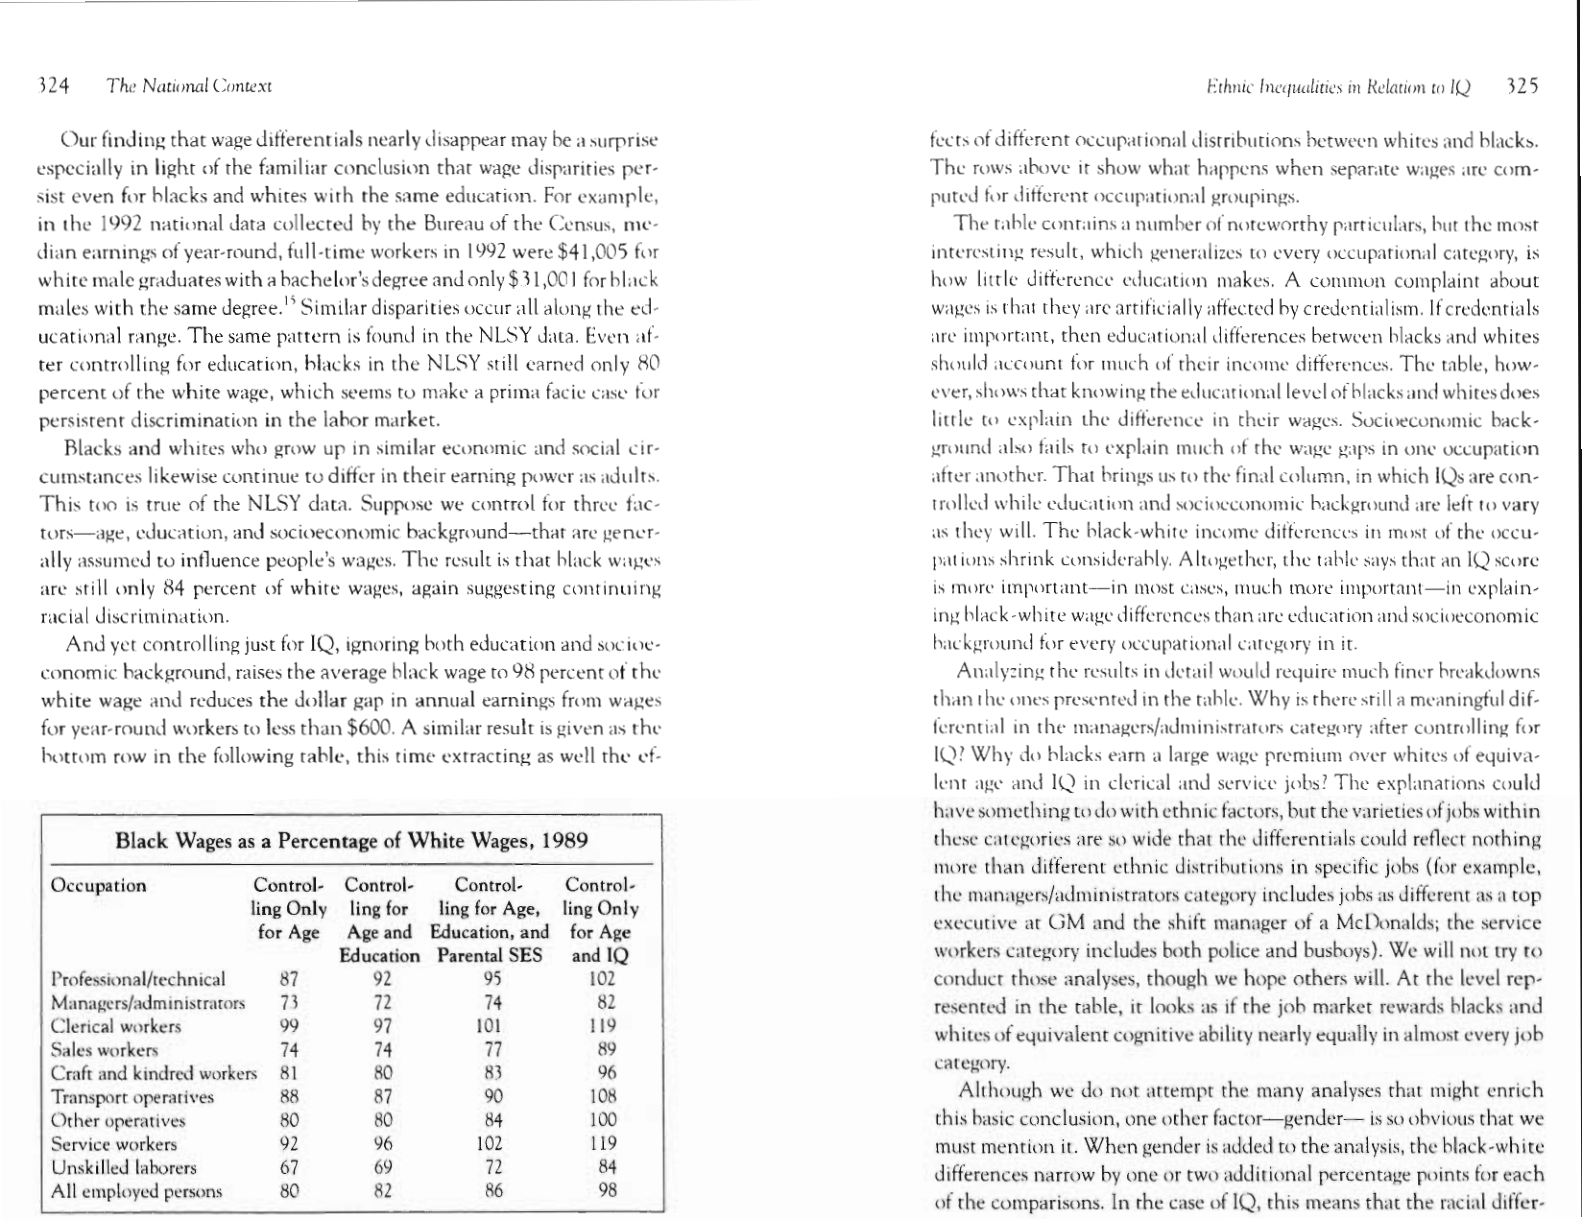
sands to a few hundred dollars 323
Controlling for IQ cuts the poverty differential by 77 percent for blacks
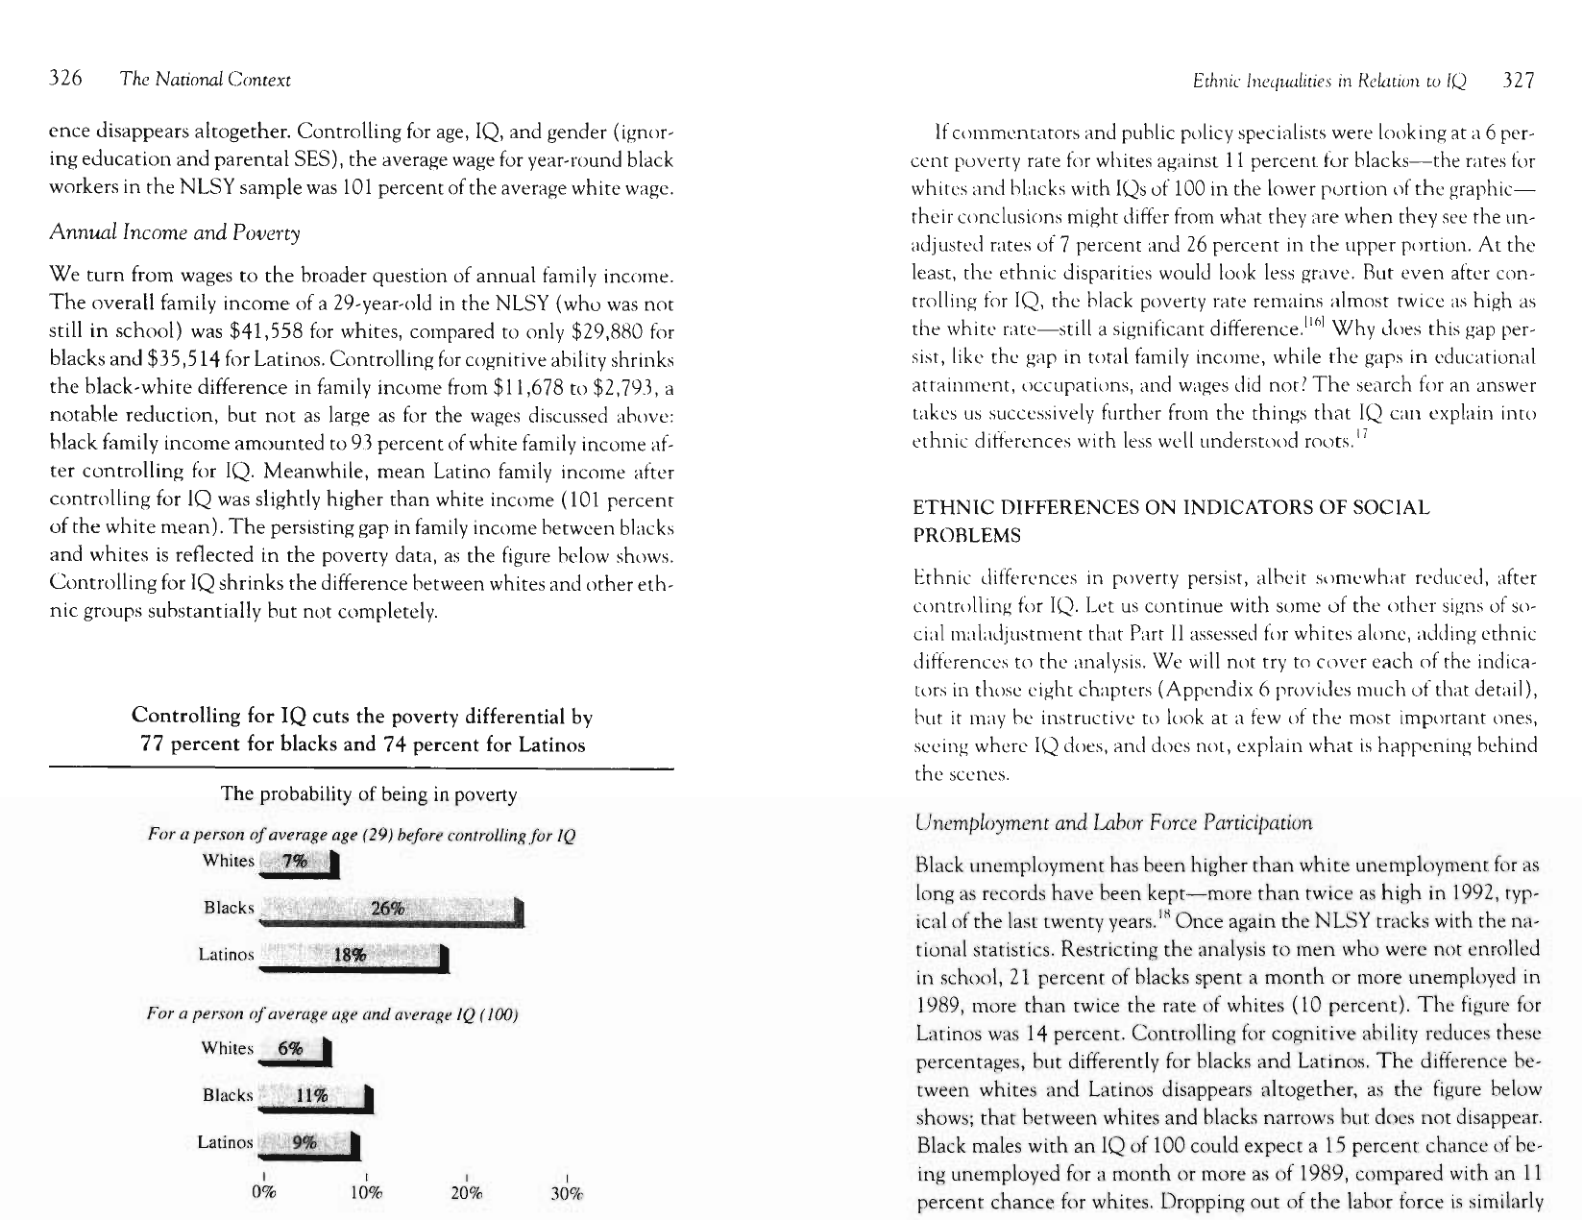
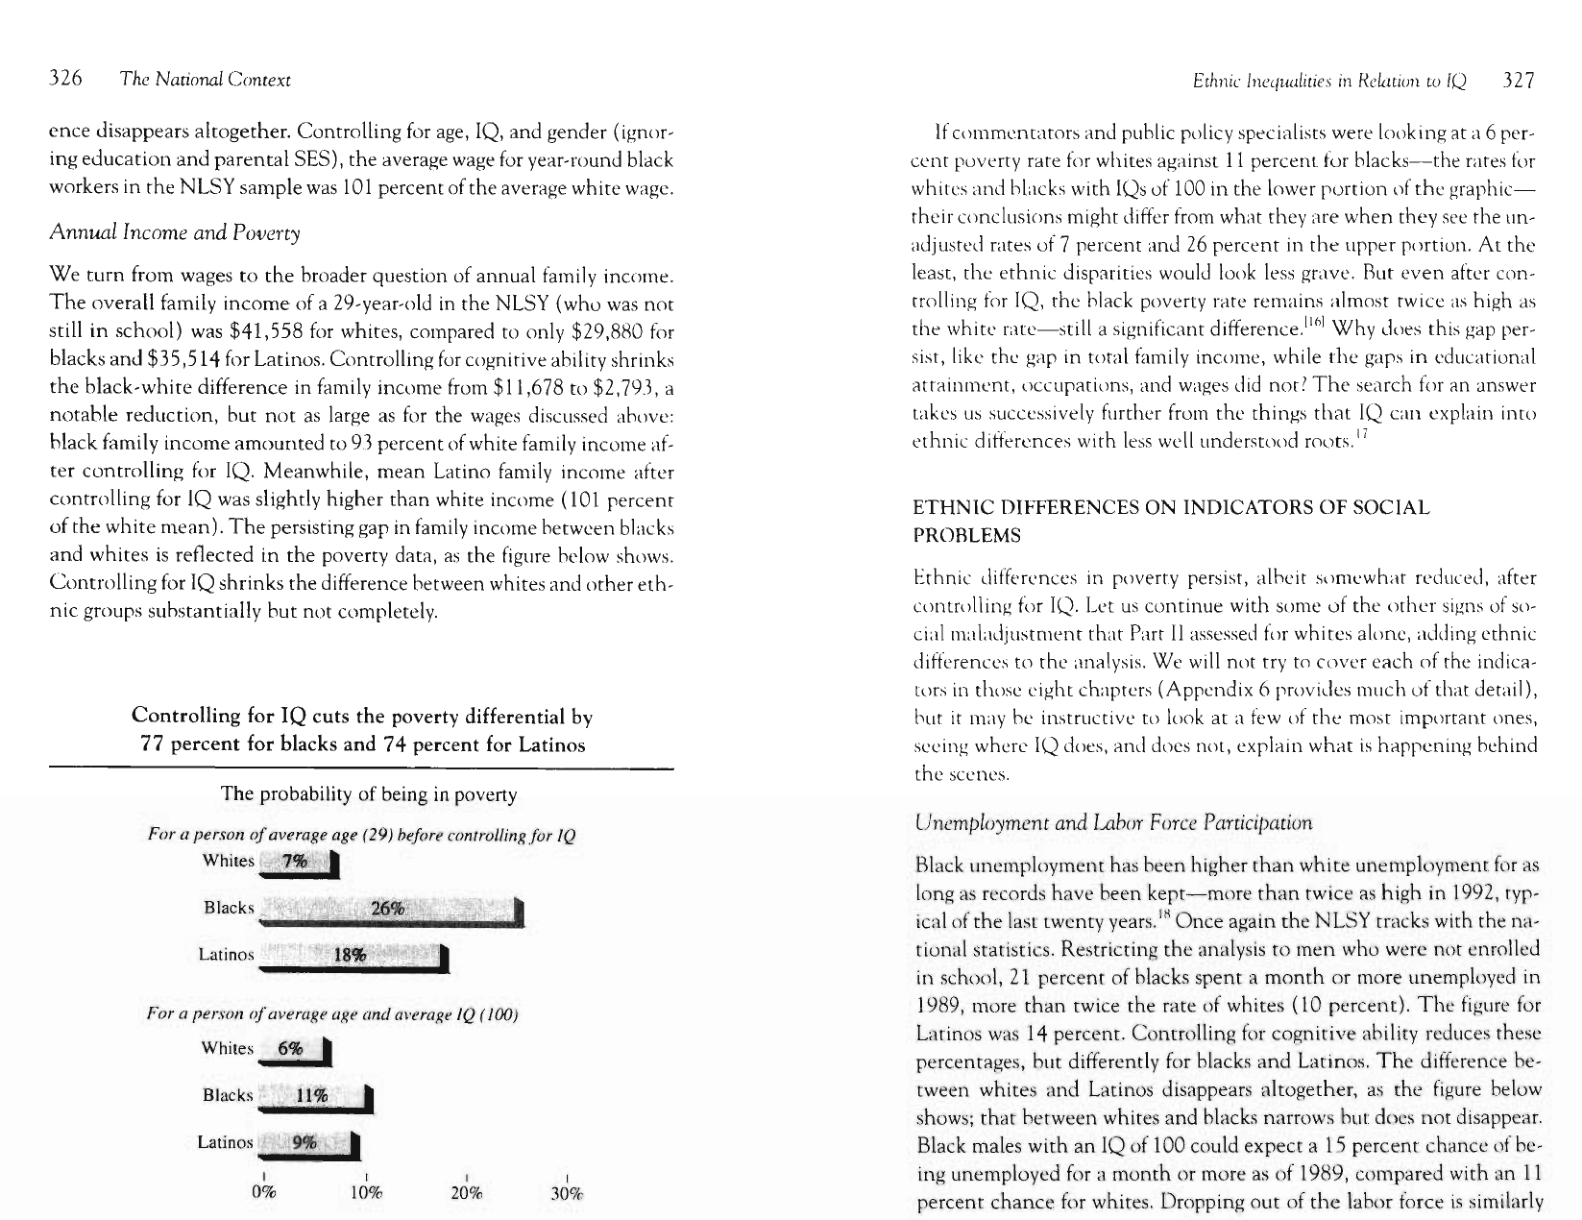
and 74 percent for Latinos
326
After controlling for IQ, the ethnic discrepancy in male unemploy-
ment shrinks by more than half for blacks and disappears for La-
tinos
328
Controlling for IQ explains little of the large black-white difference in
marriage rates
329
Controlling for IQ narrows the Latino-white difference in illegitimacy
but leaves a large gap between blacks and whites
331
Controlling for IQ cuts the gap in black-white welfare rates by half and
the Latino-whi~c gap by 84 percent 332
Even among poor mothers, controlling for IQ does not diminish the
black-white disparity in welfare recipiency 333
Controlling for IQ cuts the black-white disparity in low-birth-weight
babies by half 334
Controlling for IQ reduces the discrepancy between minority and white
children living in poverty by more than 80 percent 335
IQ and Social Disparities
- Statistical analysis suggests that controlling for IQ significantly reduces ethnic disparities in poverty, unemployment, and incarceration rates.
- Despite IQ adjustments, certain social gaps—specifically black-white marriage rates and welfare recipiency—remain largely unexplained.
- Data indicates a strong correlation between the bottom quintile of intelligence and chronic social issues like high school dropout rates and long-term welfare dependency.
- The text highlights a significant concentration of social problems, such as illegitimacy and childhood poverty, among populations in the lowest 20 percent of measured intelligence.
- Educational trends show that fertility rates decrease as education levels rise across all major ethnic groups.
- Admissions data at selective schools reveals a significant disparity in SAT score requirements between different ethnic groups.
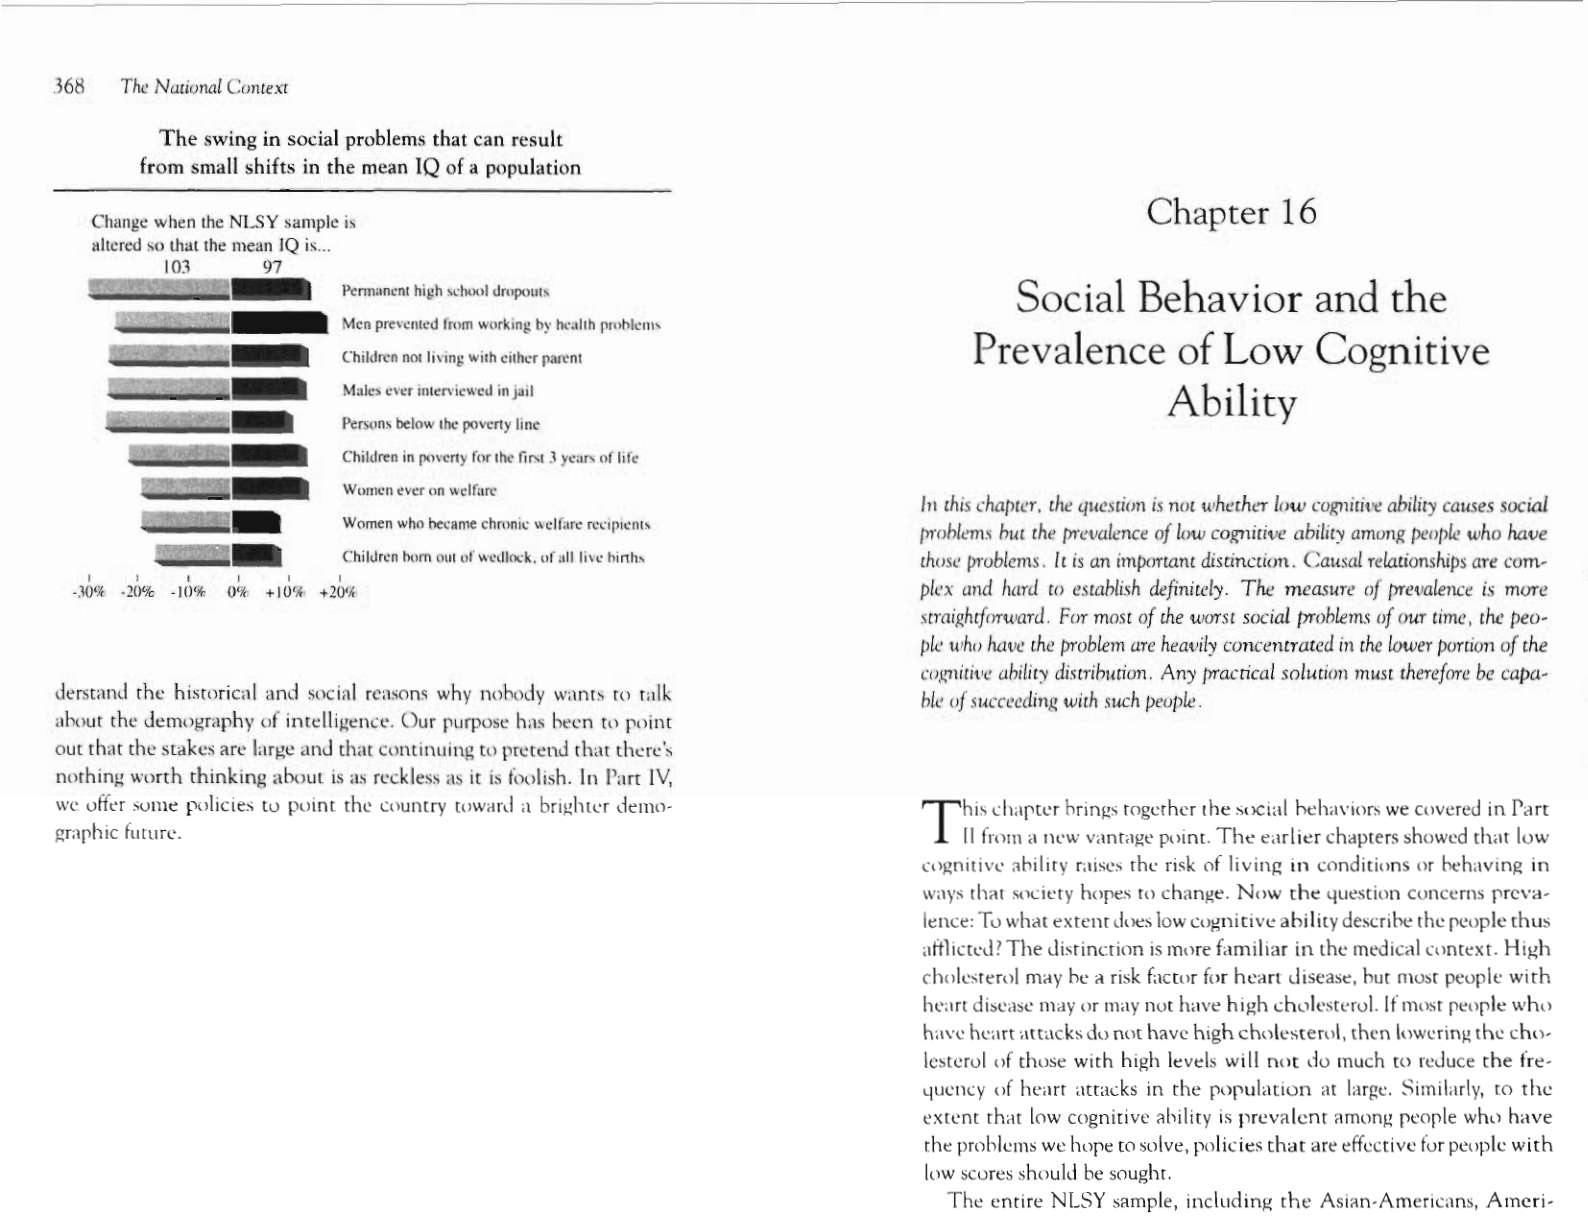
The swing in social problems that can result from small shifts in the mean IQ of a population
xii
List of Illustrations
xiii
The role of the mother's socioeconomic background in determining
which white children are poor
140
In the first half of the century, the high school diploma becomes the
norm 144
In predicting which white youths will never complete a high school ed-
ucatiok, IQ is more important than SES
149
For temporary dropouts, the importance of SES increases sharply
150
For white youths, being smart is more important than being privileged
in getting a college degree
152
Since mid-century, teenage boys not in school are increasingly not em-
ployed either
156
IQ and socioeconomic background have opposite effects on leaving the
labor force among white men
159
High IQ lowers the probability of a month-long spell of unemployment
among white men, while socioeconomic background has no effect
164
In the early 1970s, the marriage race began a prolonged decline for no
immediately apparent reason
169
High IQ raises the probability of marriage for the white high school sam-
ple, while high socioeconomic background lowers it
172
The divorce revolution
173
IQ and socioeconomic background have opposite effects on the likeli-
hood of an early divorce among young whites
175
The illegitimacy revolution 178
IQ has a large effect on white illegitimate births independent of the
mother's socioeconomic background
182
IQ is a more powerful predictor of illegitimacy among poor white women
than among white women as a whole
188
The welfare revolution
192
Even after poverty and marital status are taken into account, IQ played
a substantial role in determining whether white women go on wel-
fare
195
Socioeconomic background and IQ are both important in determining
whether white women become chronic welfare recipients
197
A white mother's IQ has a significant role in determining whether
her baby is underweight while her socioeconomic background does
not 215
A white mother's IQ and socioeconomic background each has a large
independent effect on her child's chances of spending the first three
years of life in poverty
219
A white mother's IQ is more important than her socioeconomic back-
ground in predicting the worst home environments
222
Both a white mother's IQ and socioeconomic background have moder-
ate relationships with developmental problems in the child
228
A white mother's IQ dominates the importance of socioeconomic back-
ground in determining the child's IQ 23 1
The boom in violent crime after the 1950s
236
On two diverse measures of crime, the importance of IQ dominates so-
cioeconomic background for white men
249
Cognitive ability and the Middle Class Values index
265
Overview of studies of reporting black-white differences in cognitive
test scores, 1918-1990
277
The black and white IQ distributions in the NLSY, Version 1 279
The black and white IQ distributions in the NLSY, Version I1 279
Black IQ scores go up with socioeconomic status, but the black-white
difference does not shrink 288
After controlling for IQ, the probability of graduating from college is
about the same for whites and Latinos, higher for blacks
320
After controlling for IQ, blacks and Latinos have substantially higher
probabilities than whites of being in a high-IQ occupation 322
After controlling for IQ, ethnic wage differentials shrink from thou-
sands to a few hundred dollars 323
Controlling for IQ cuts the poverty differential by 77 percent for blacks
and 74 percent for Latinos
326
After controlling for IQ, the ethnic discrepancy in male unemploy-
ment shrinks by more than half for blacks and disappears for La-
tinos
328
Controlling for IQ explains little of the large black-white difference in
marriage rates
329
Controlling for IQ narrows the Latino-white difference in illegitimacy
but leaves a large gap between blacks and whites
331
Controlling for IQ cuts the gap in black-white welfare rates by half and
the Latino-whi~c gap by 84 percent 332
Even among poor mothers, controlling for IQ does not diminish the
black-white disparity in welfare recipiency 333
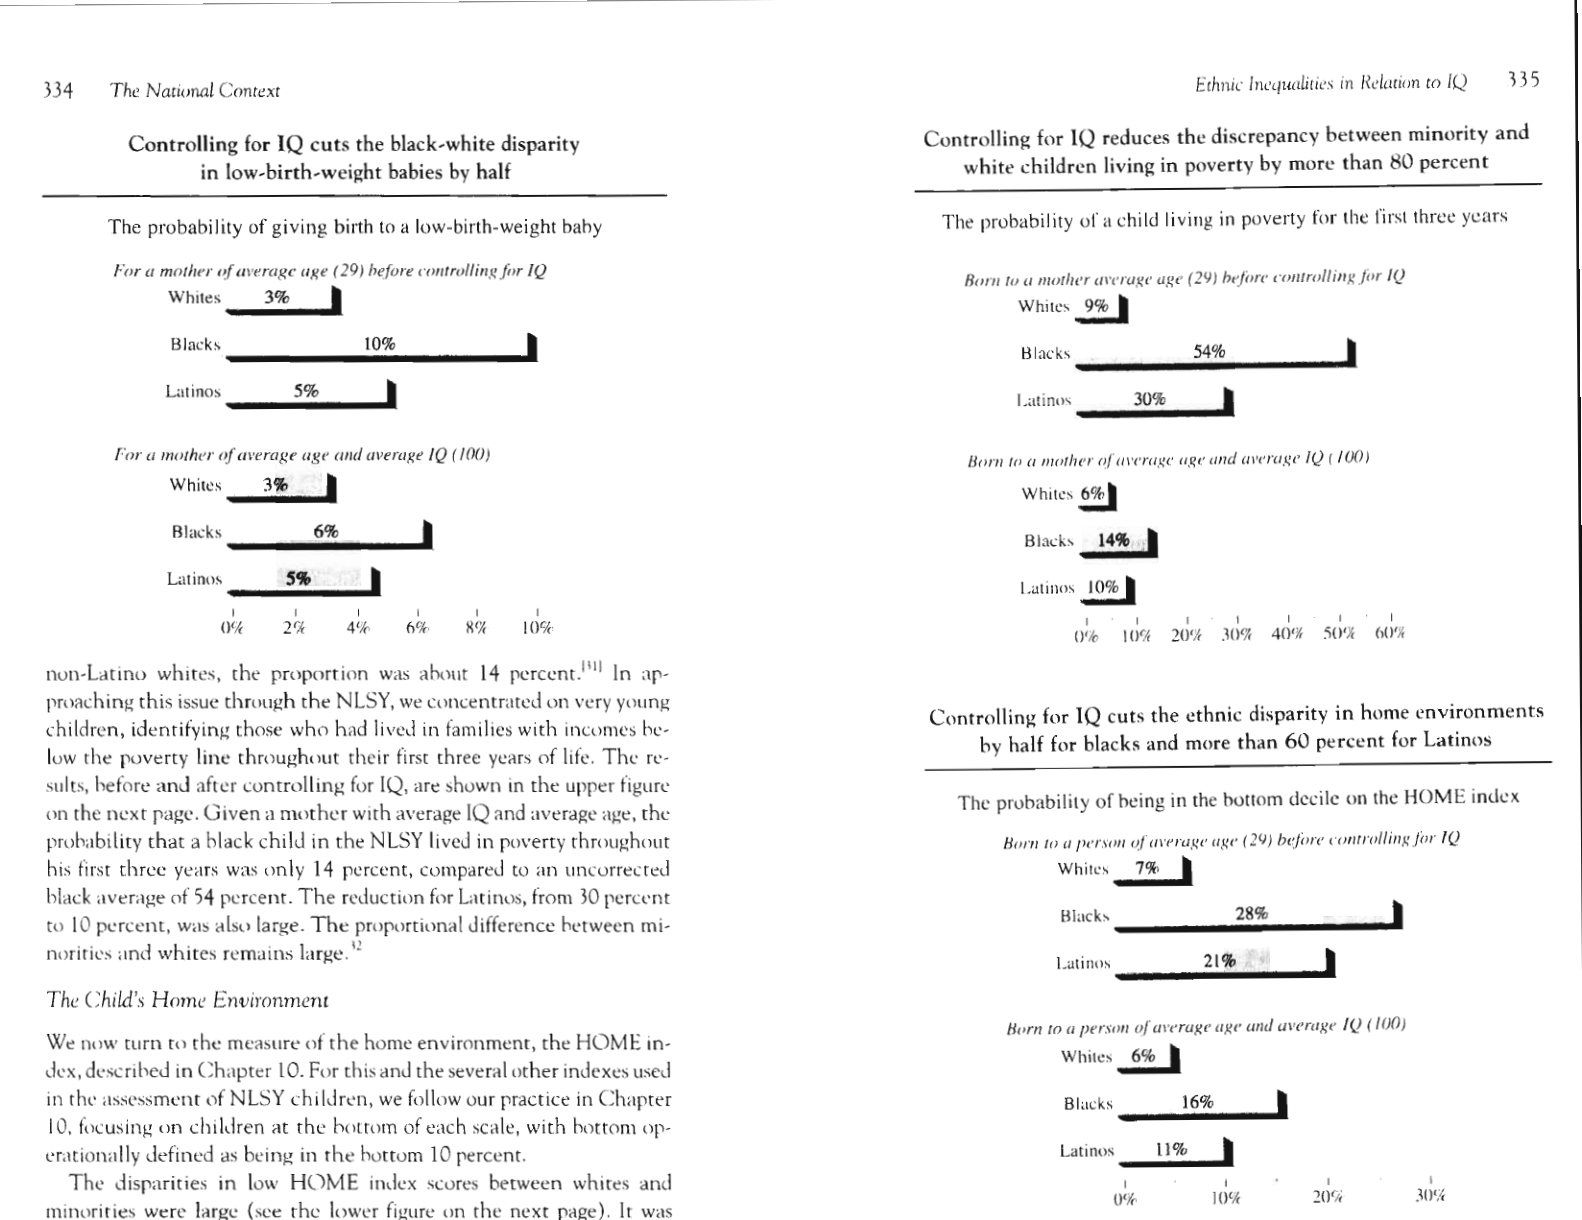
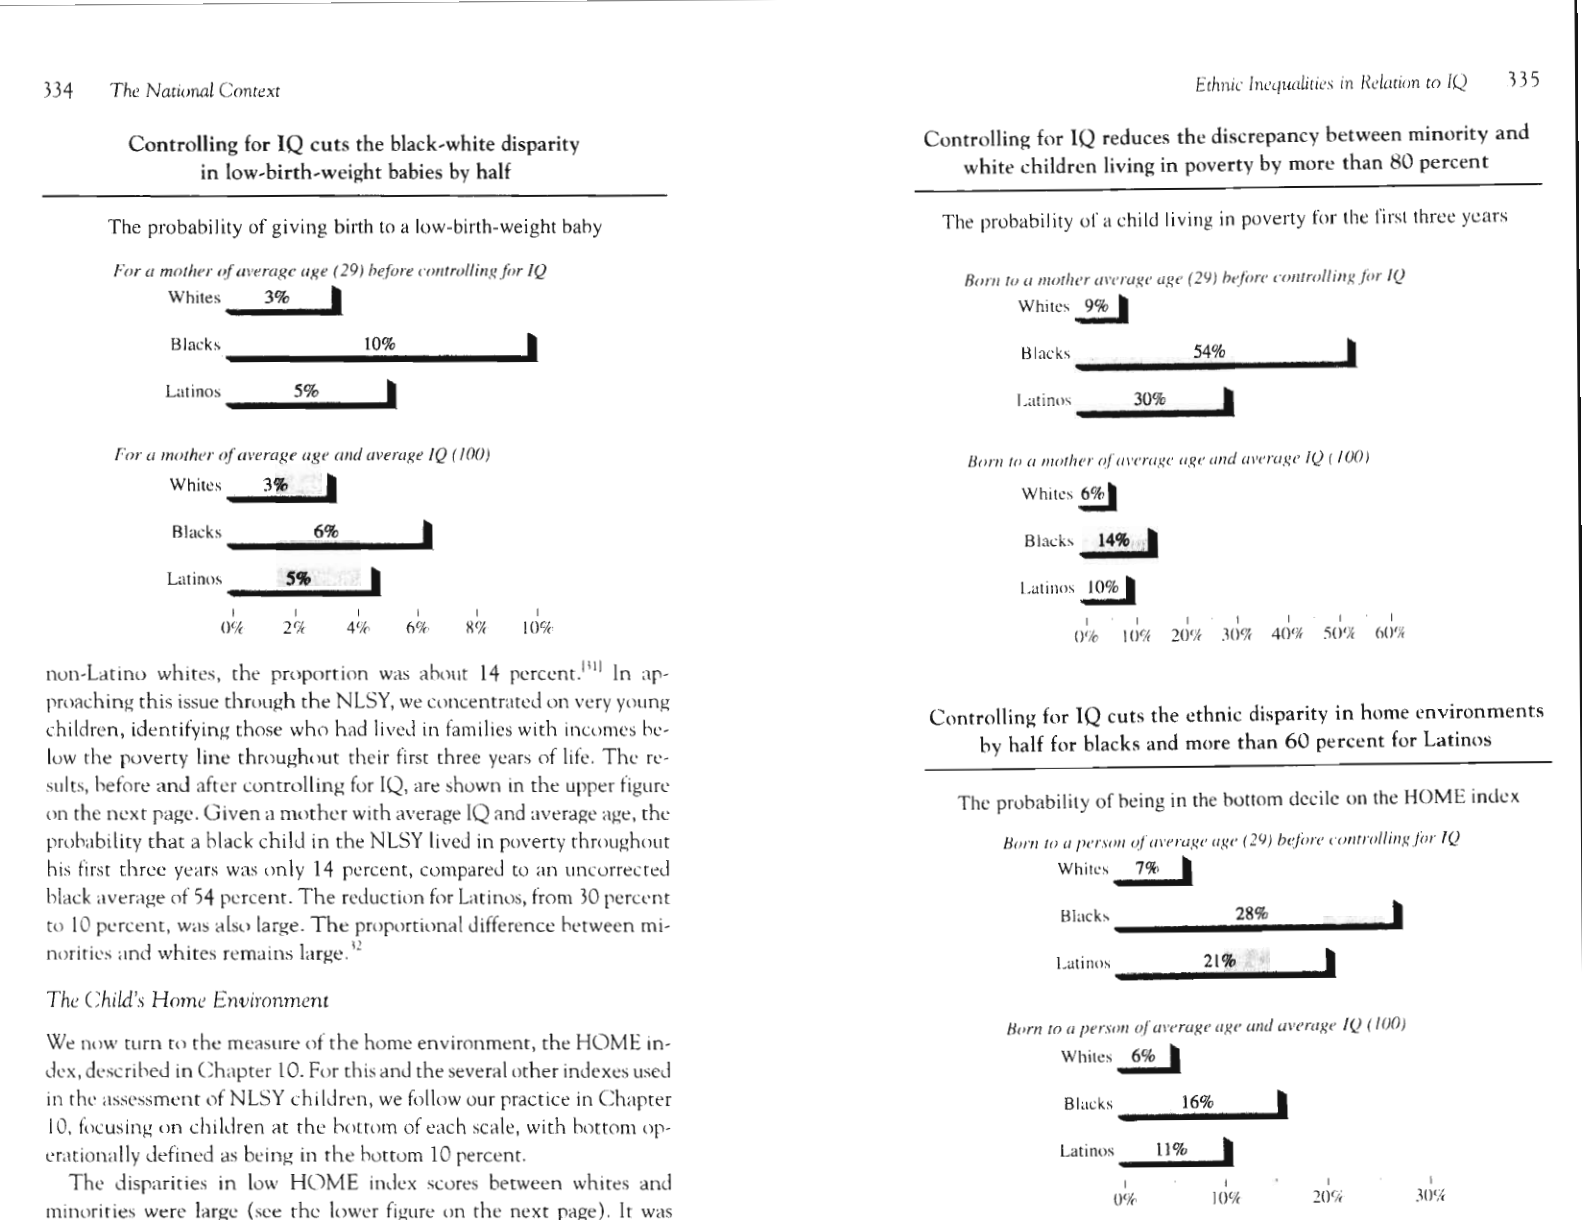
Controlling for IQ cuts the black-white disparity in low-birth-weight
babies by half 334
Controlling for IQ reduces the discrepancy between minority and white
children living in poverty by more than 80 percent 335
xiv
List of Illustrations
Controlling for IQ cuts the ethnic disparity in home environments by
half for blacks and more than 60 percent for Latinos
335
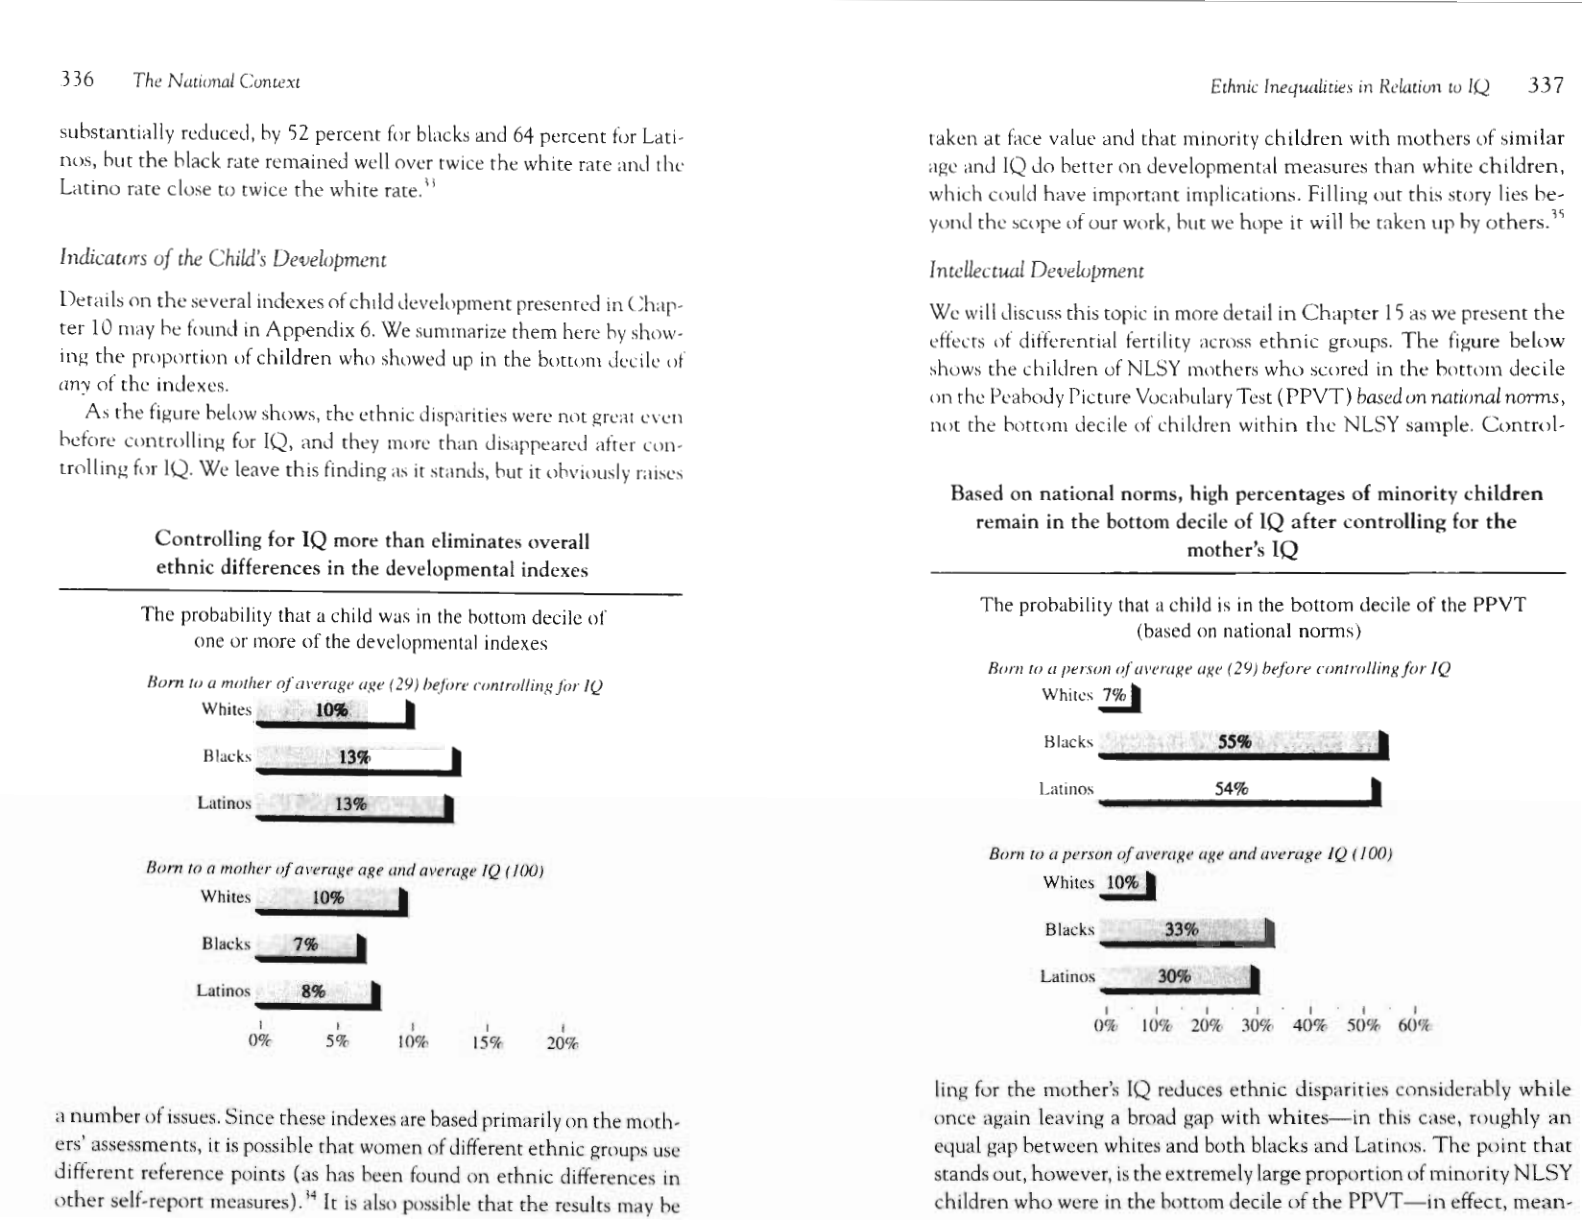
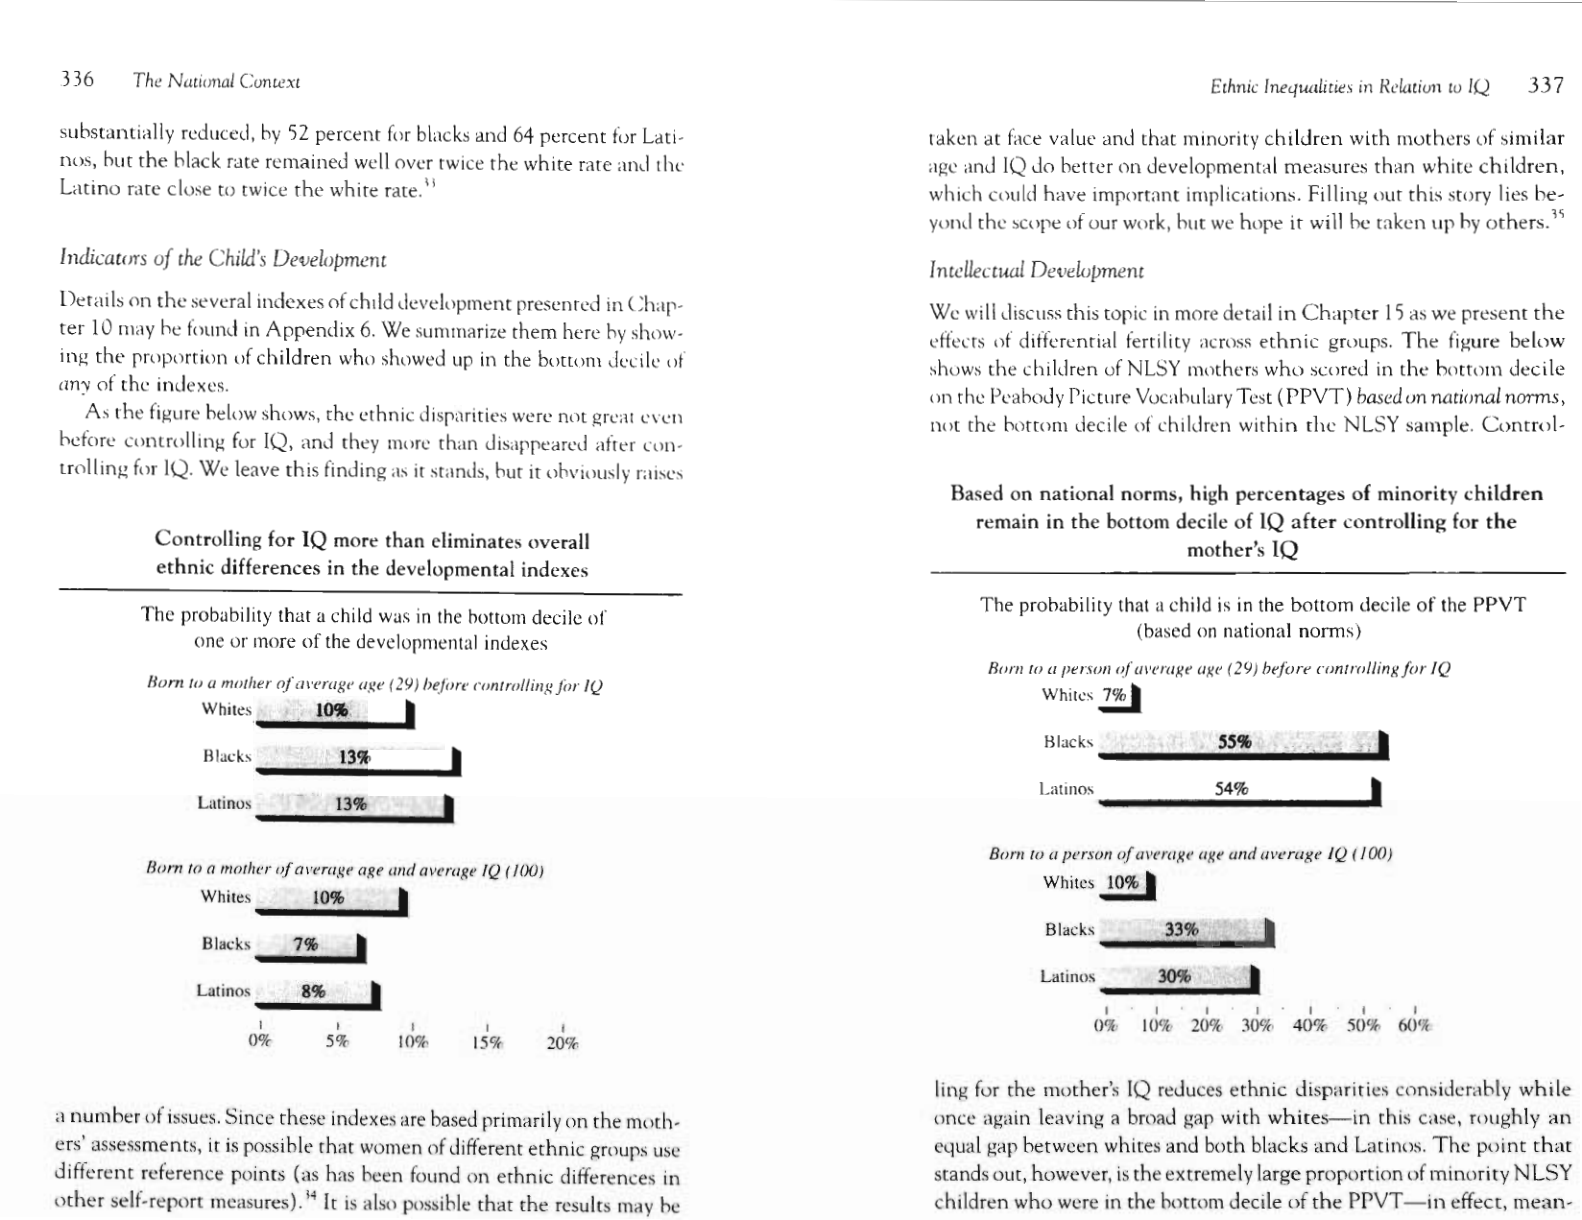
Controlling for IQ more than eliminates overall ethnic differences in
the developmental indexes 336
Based on national norms, high percentages of minority children remain
in the bottom decile of IQ after controlling for the mother's IQ
337
Controlling for IQ cuts the black-white difference in incarceration by
almost three-quarters 338
The MCV Index, before and after controlling for IQ
339
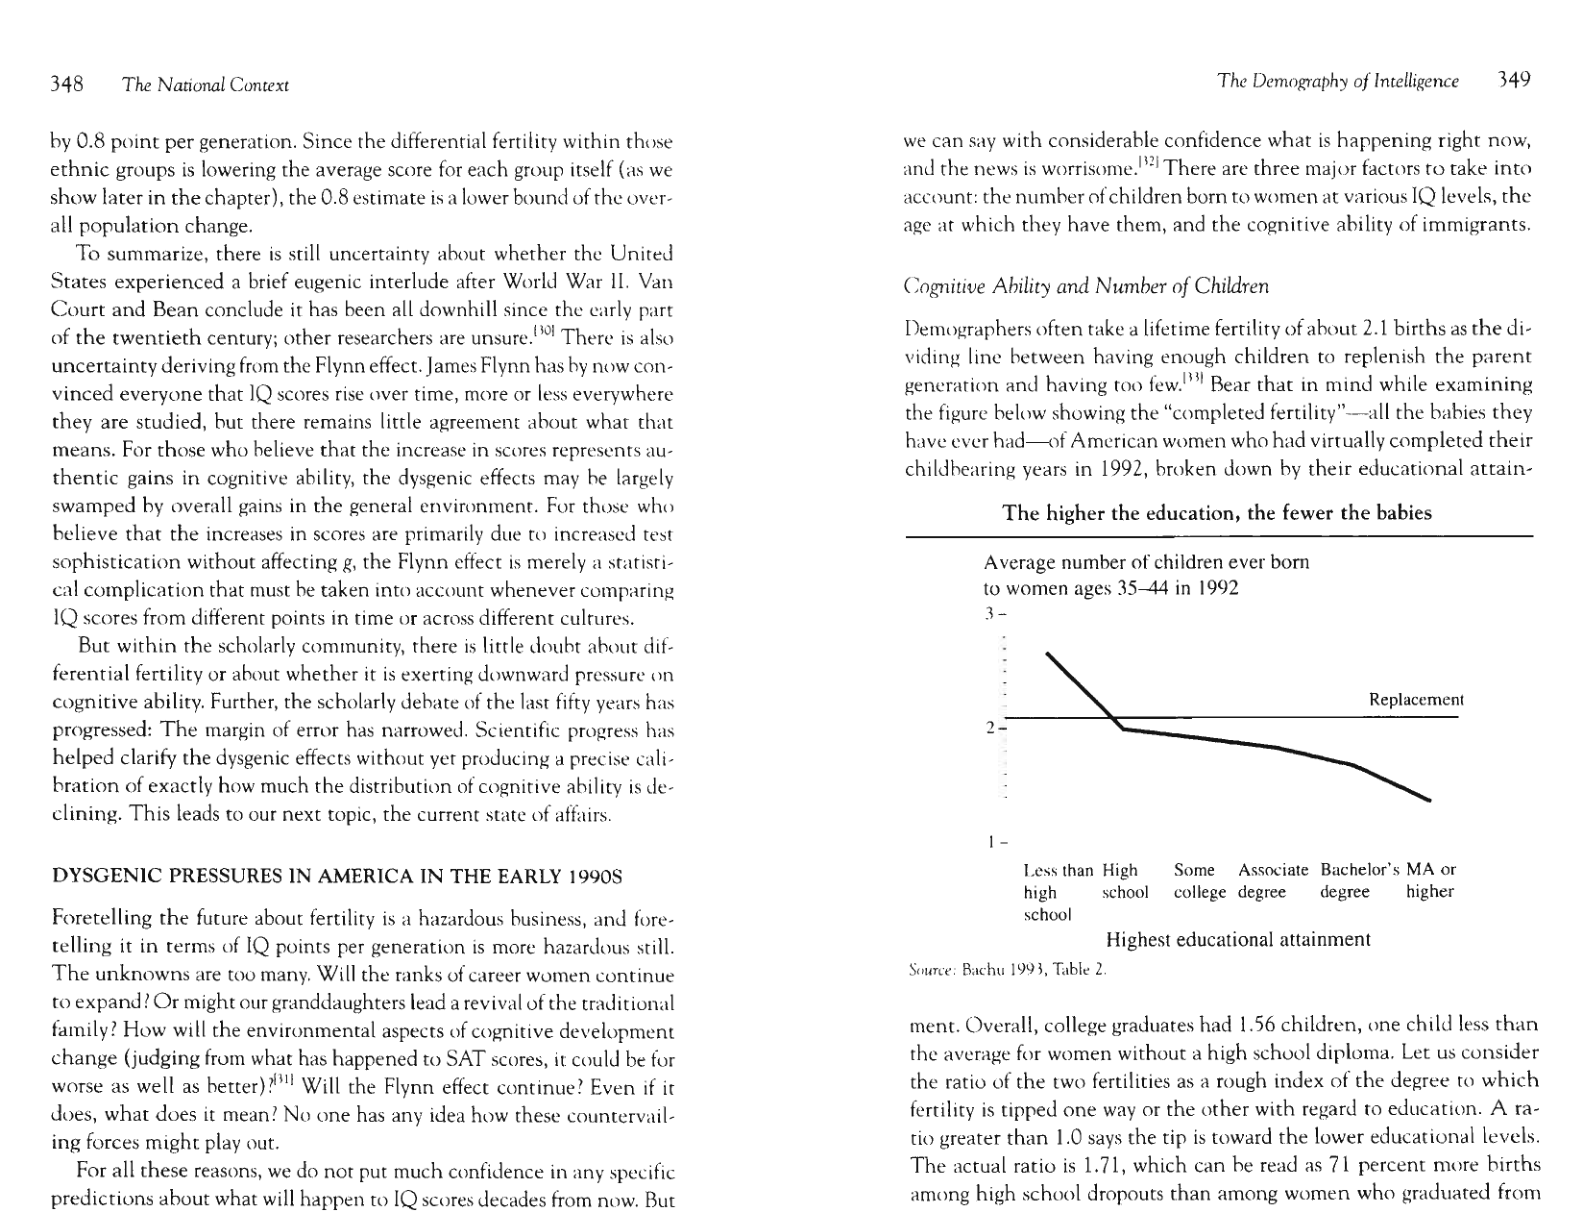
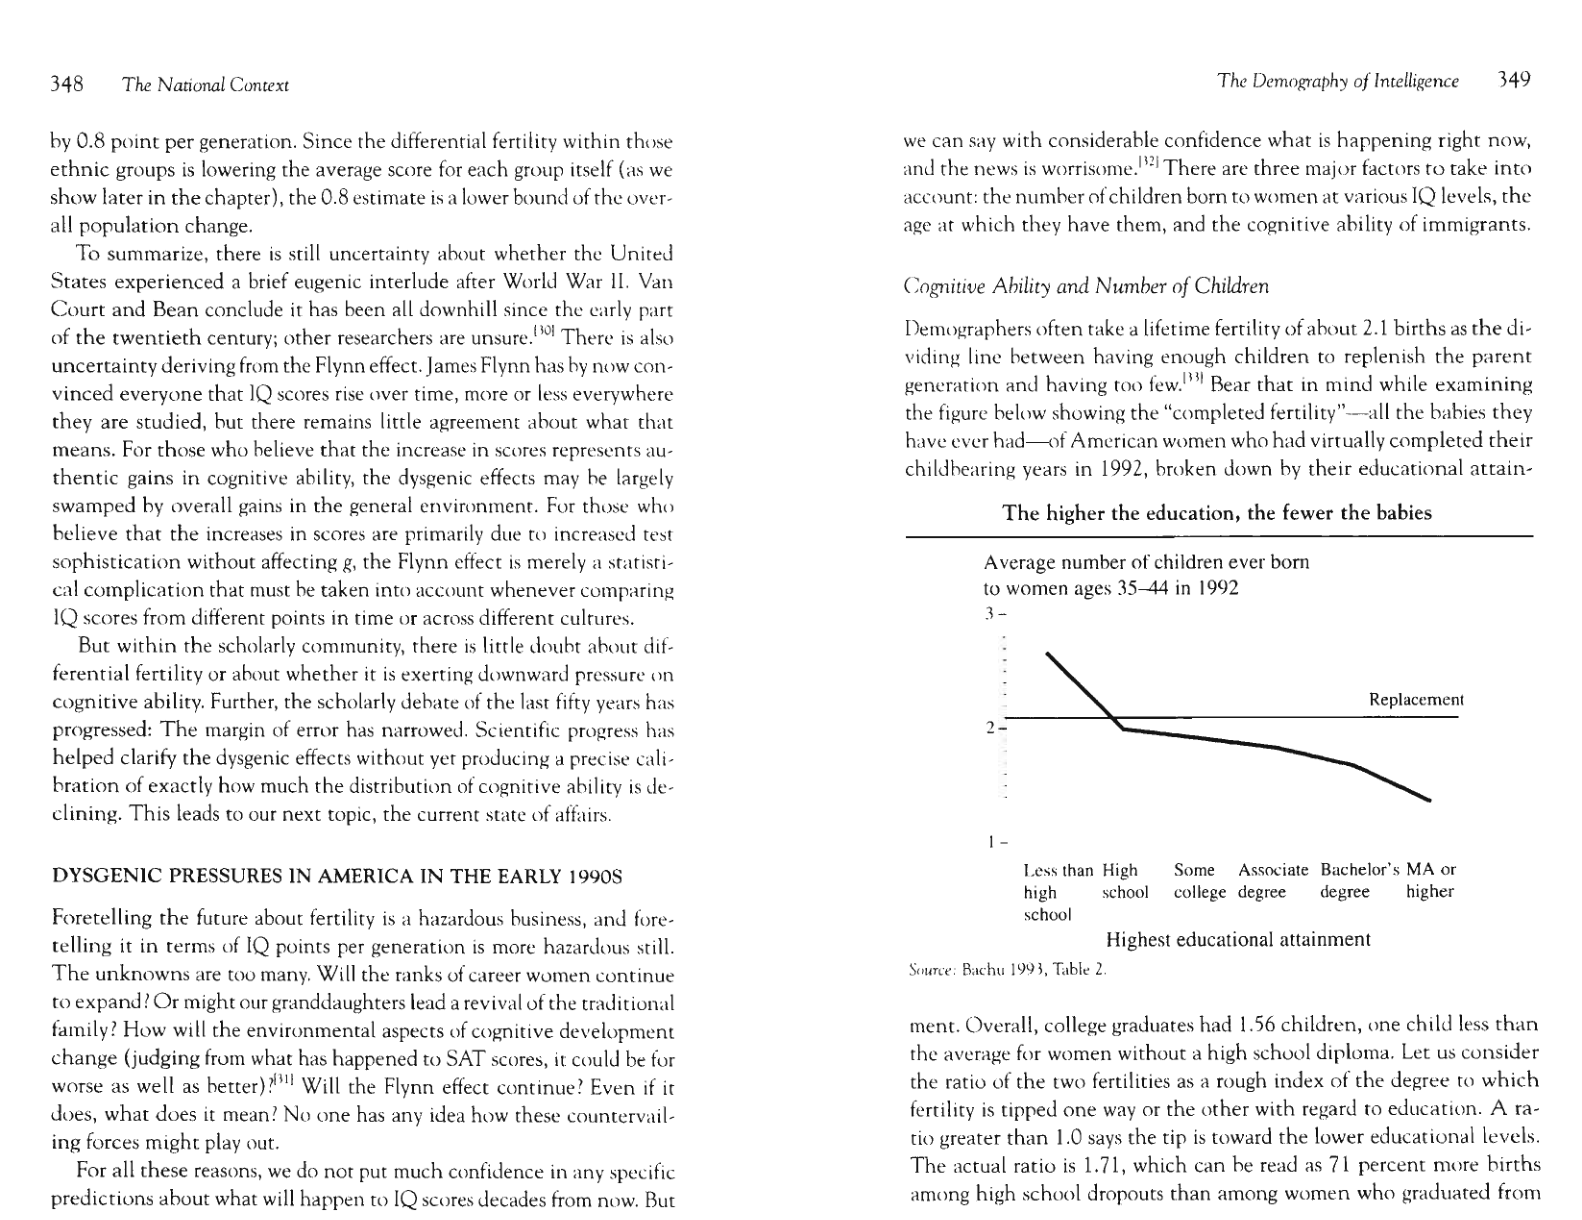
The higher the education, the fewer the babies 349
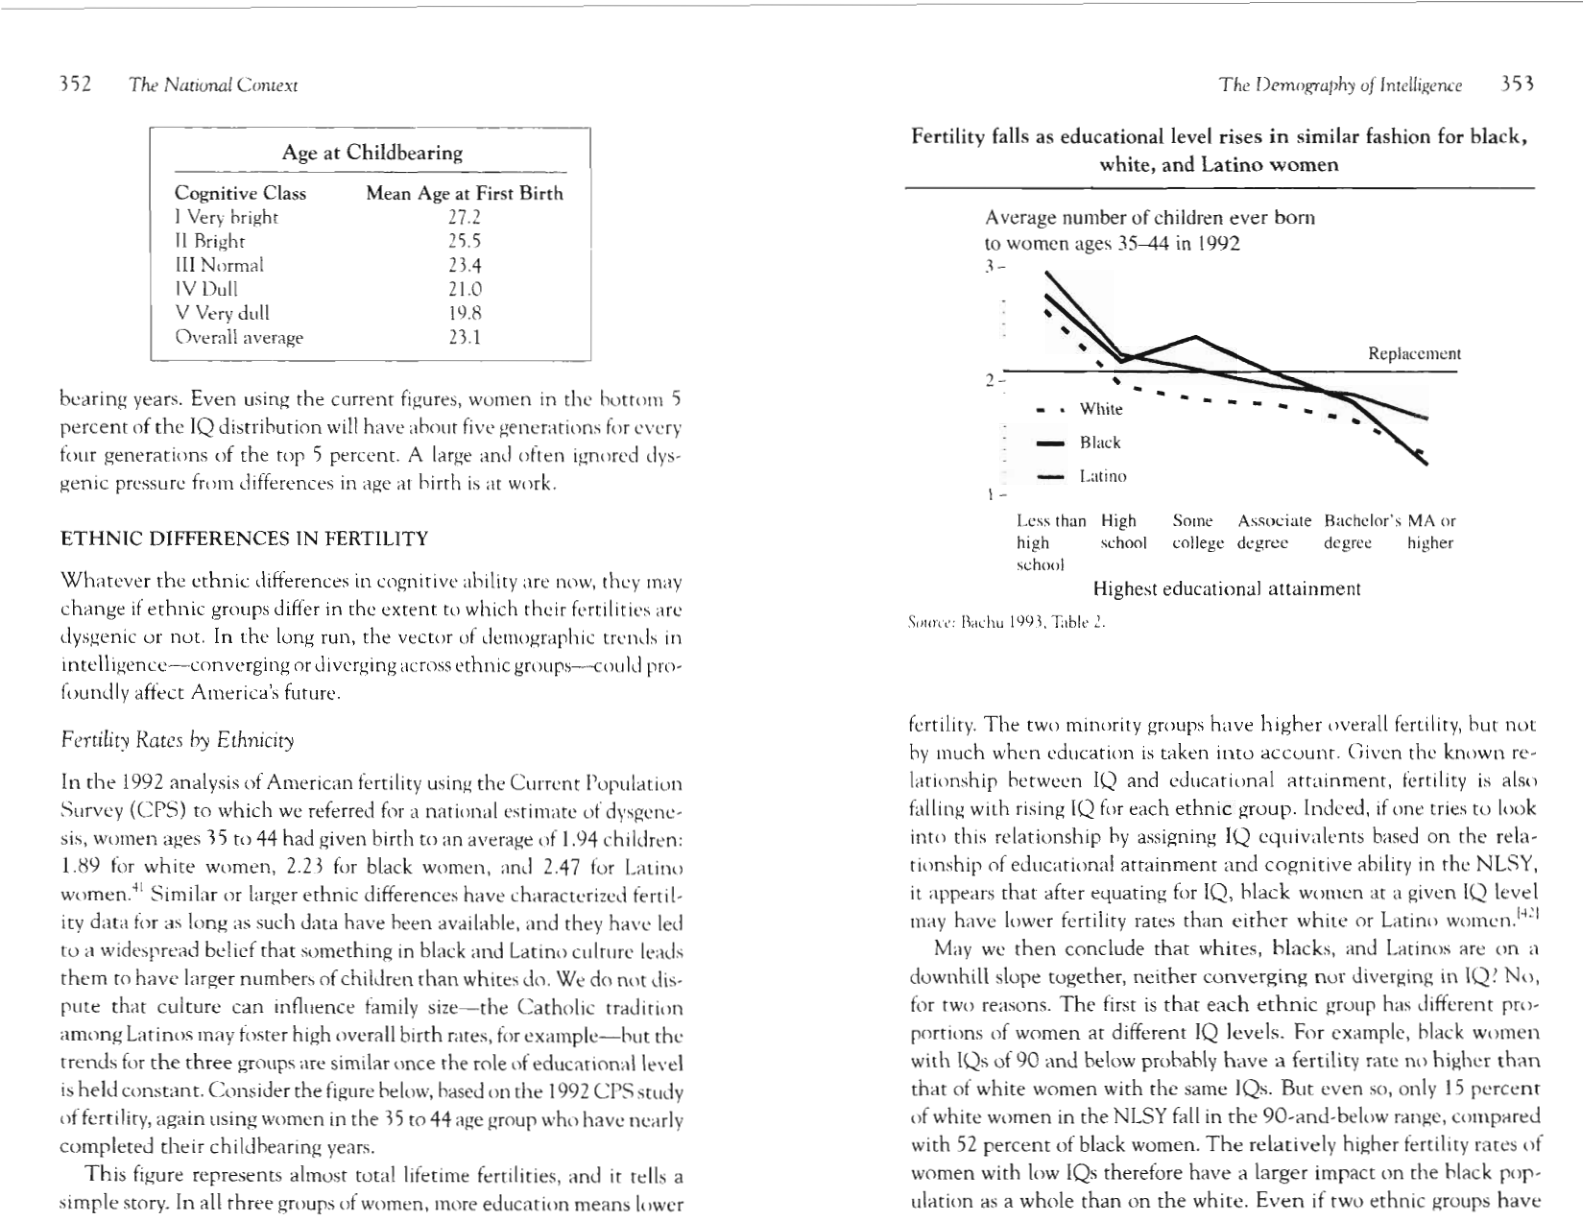
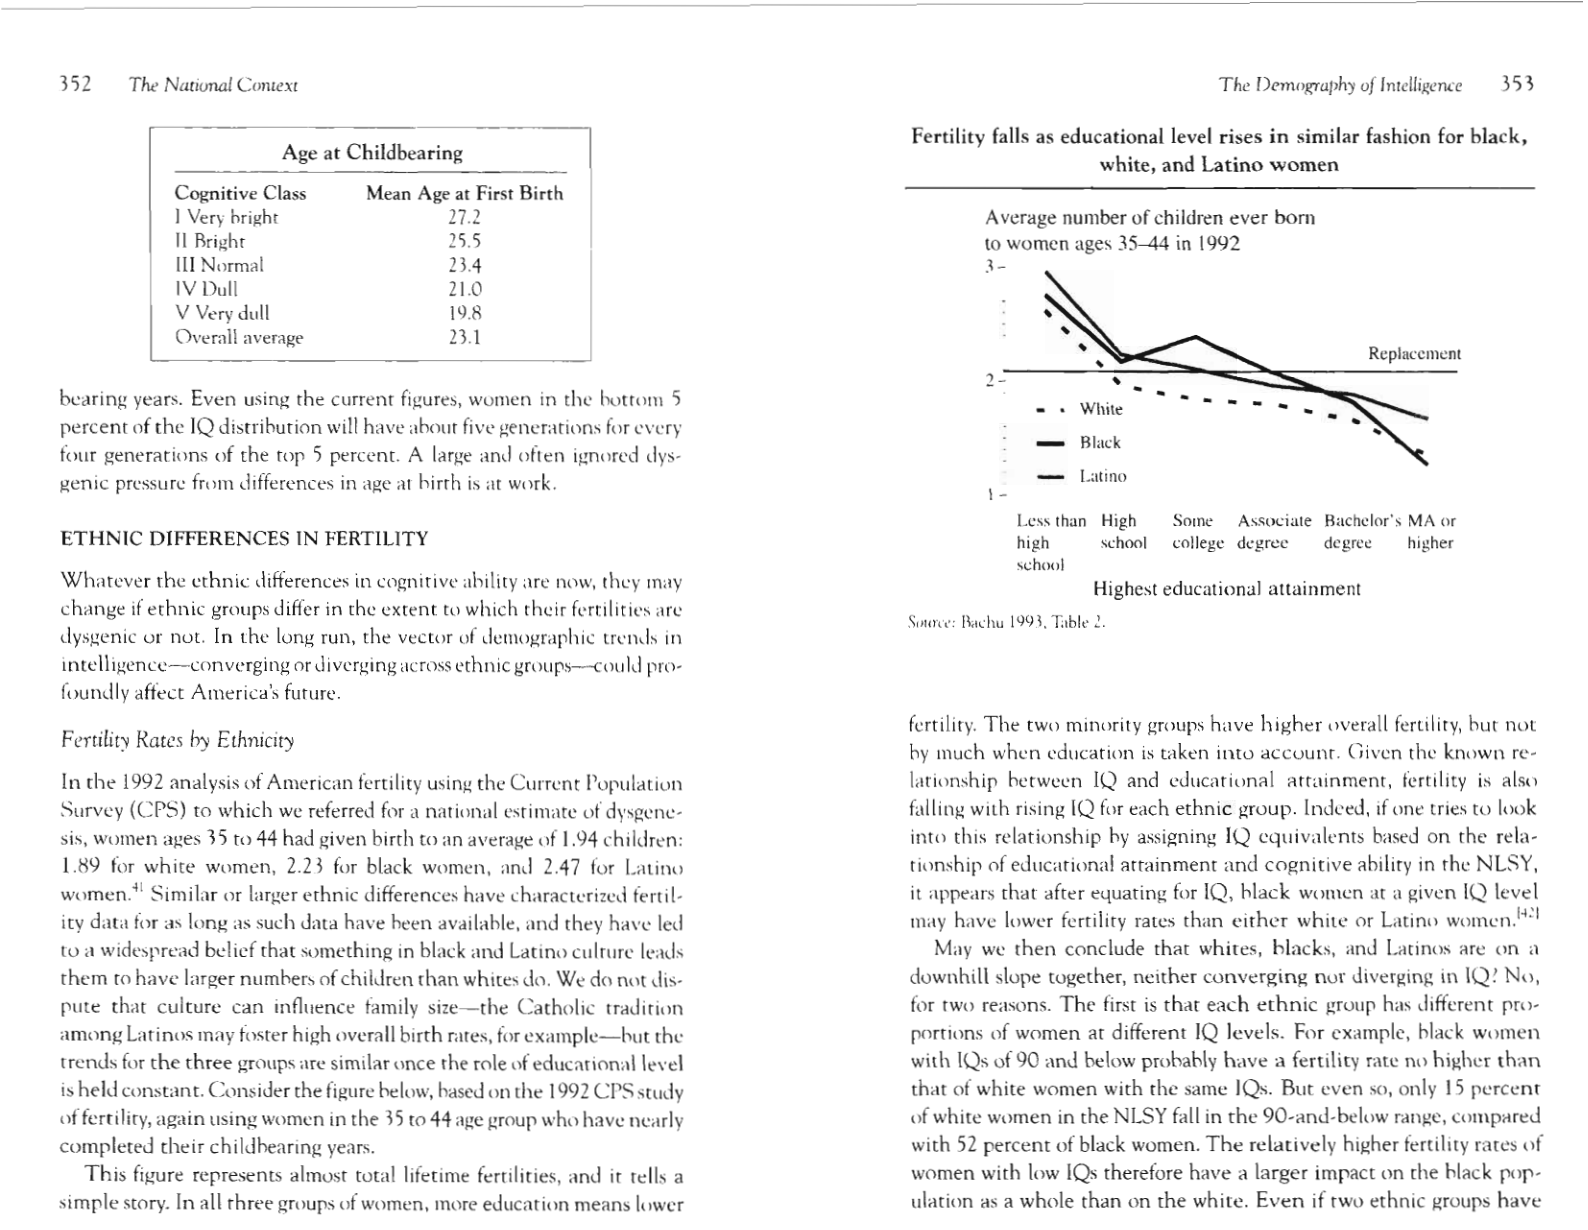
Fertility falls as educational level rises in similar fashion for black, white,
and Latino women 353
The swing in social problems that can result from small shifts in the
mean IQ of a population 368
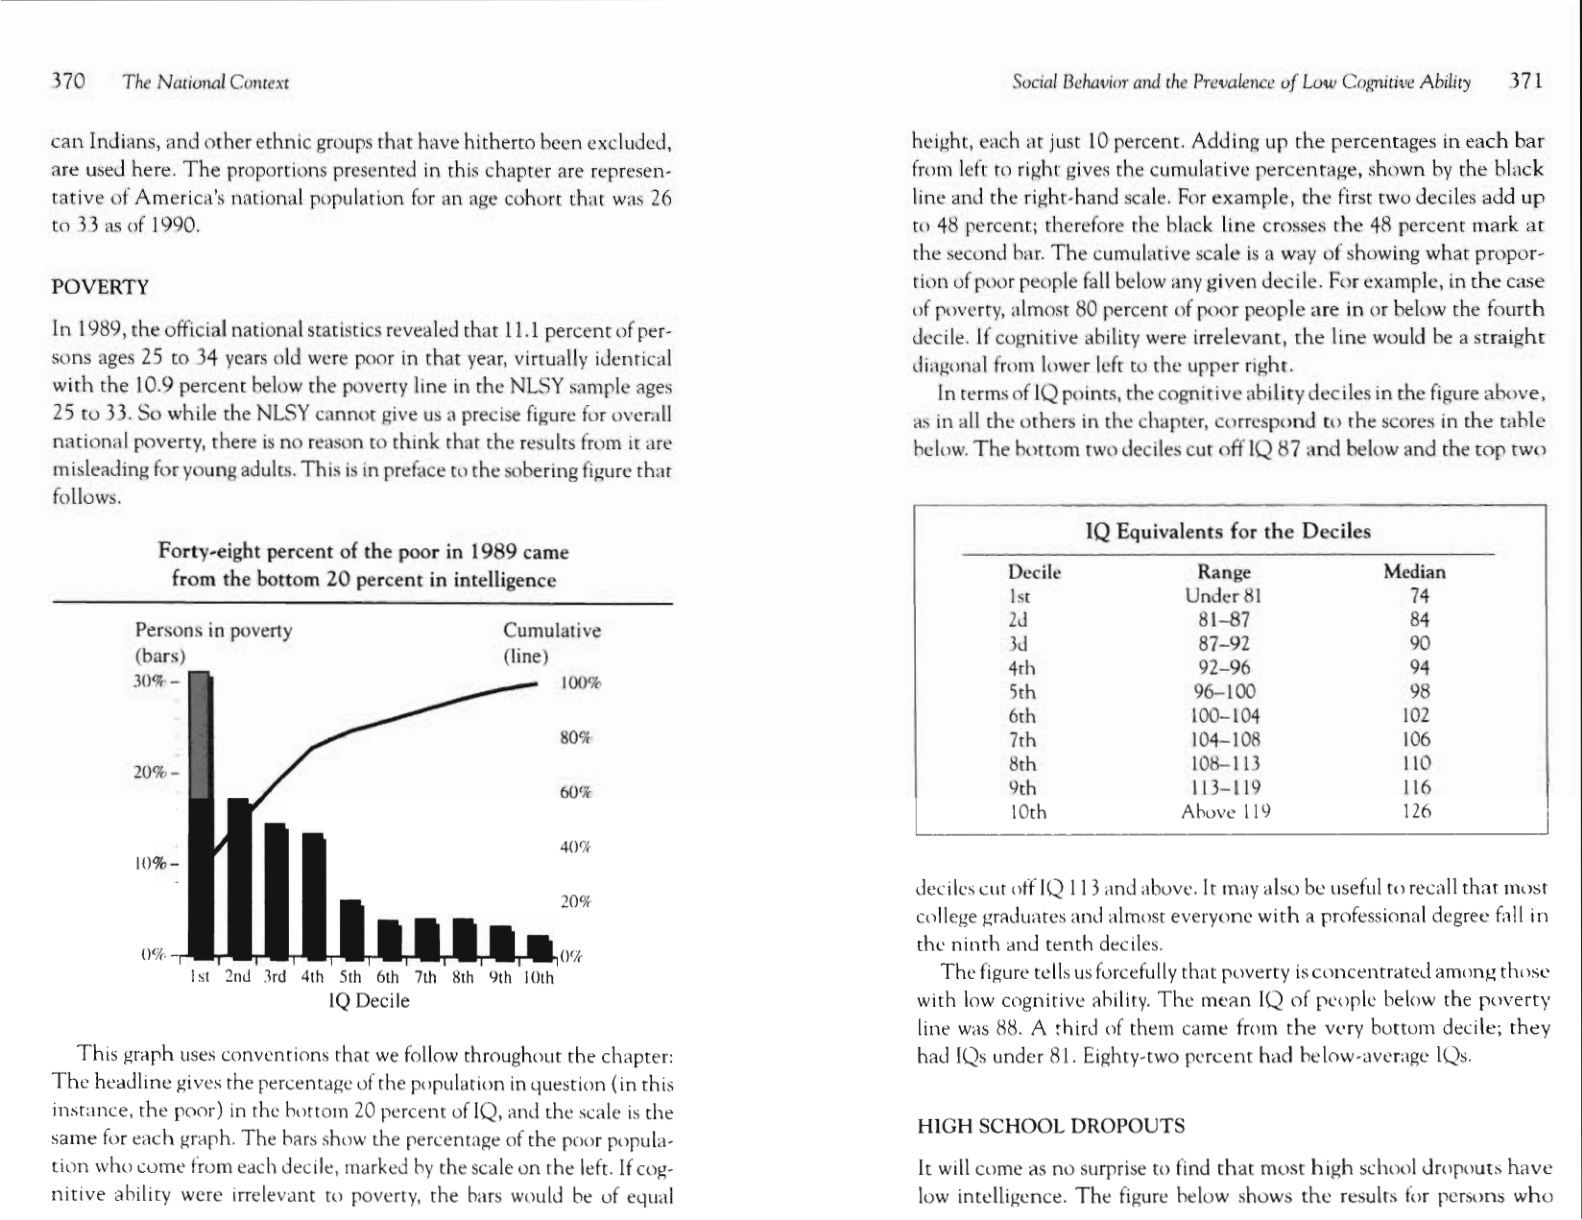
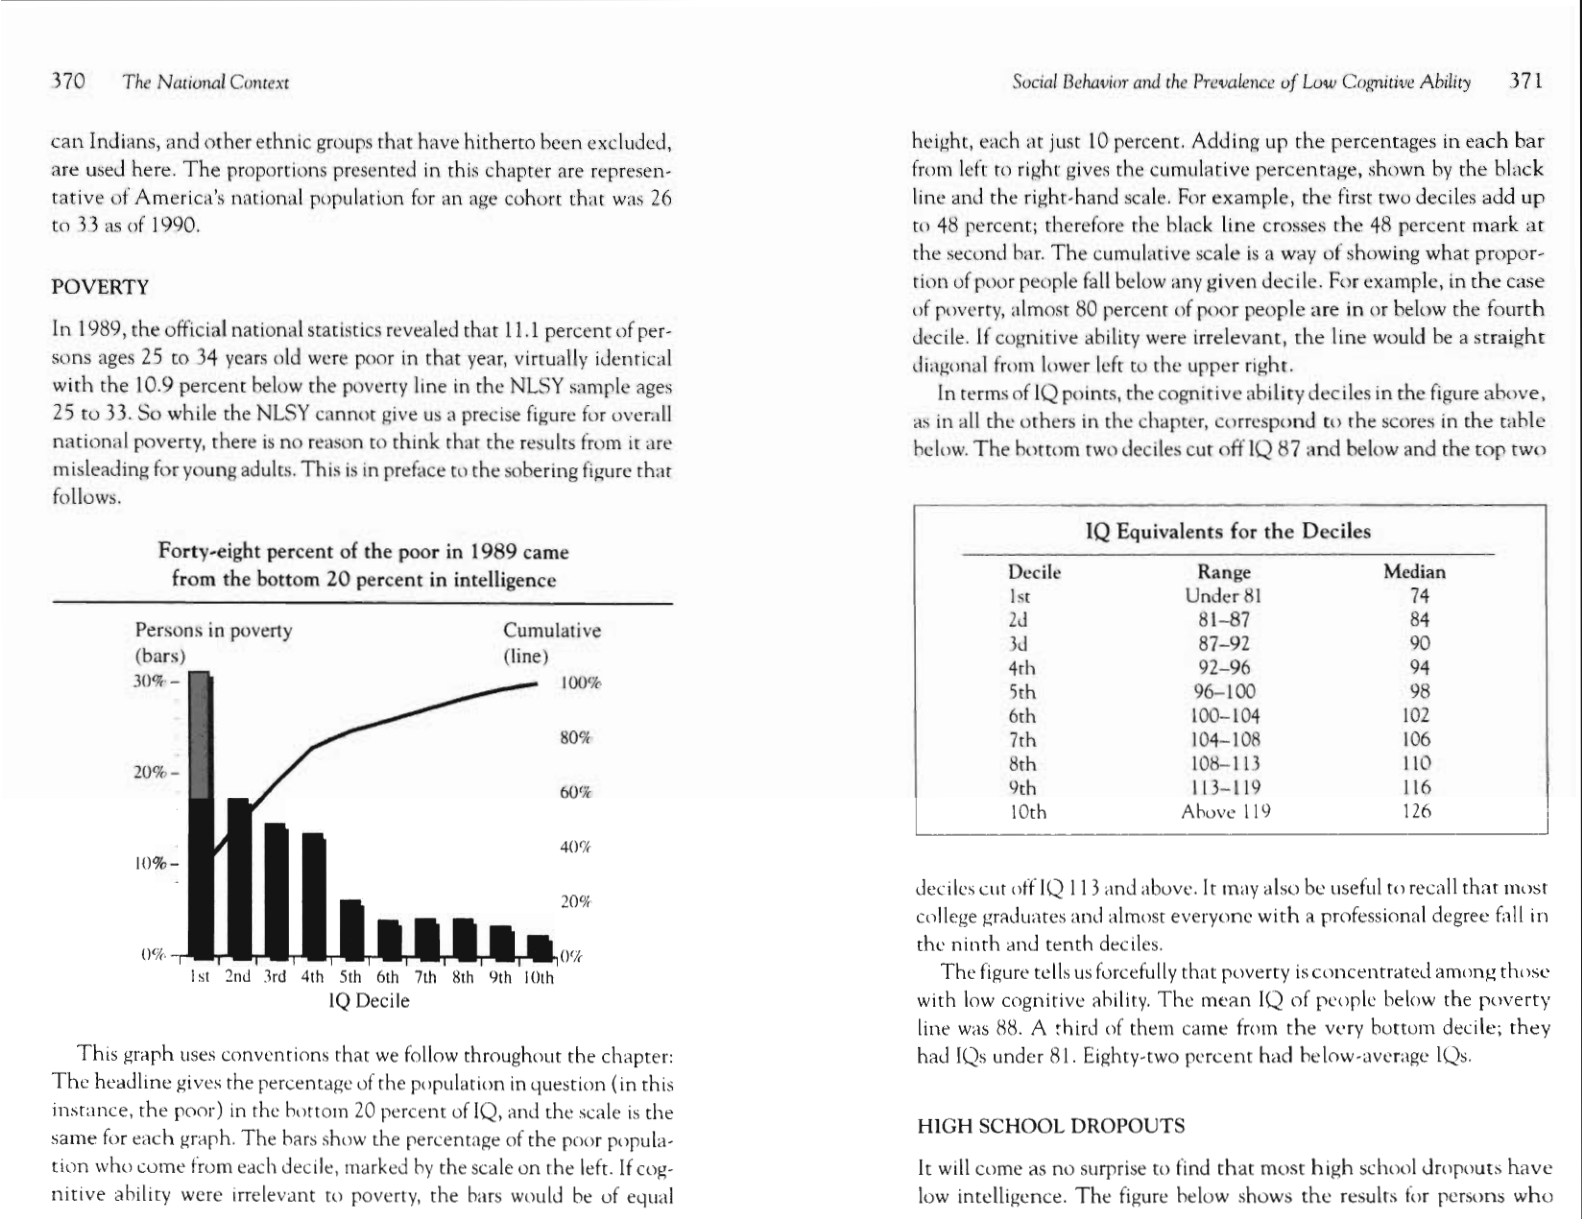
Fortyeight percent of the poor in 1989 came from the bottom 20 per-
cent in intelligence 370
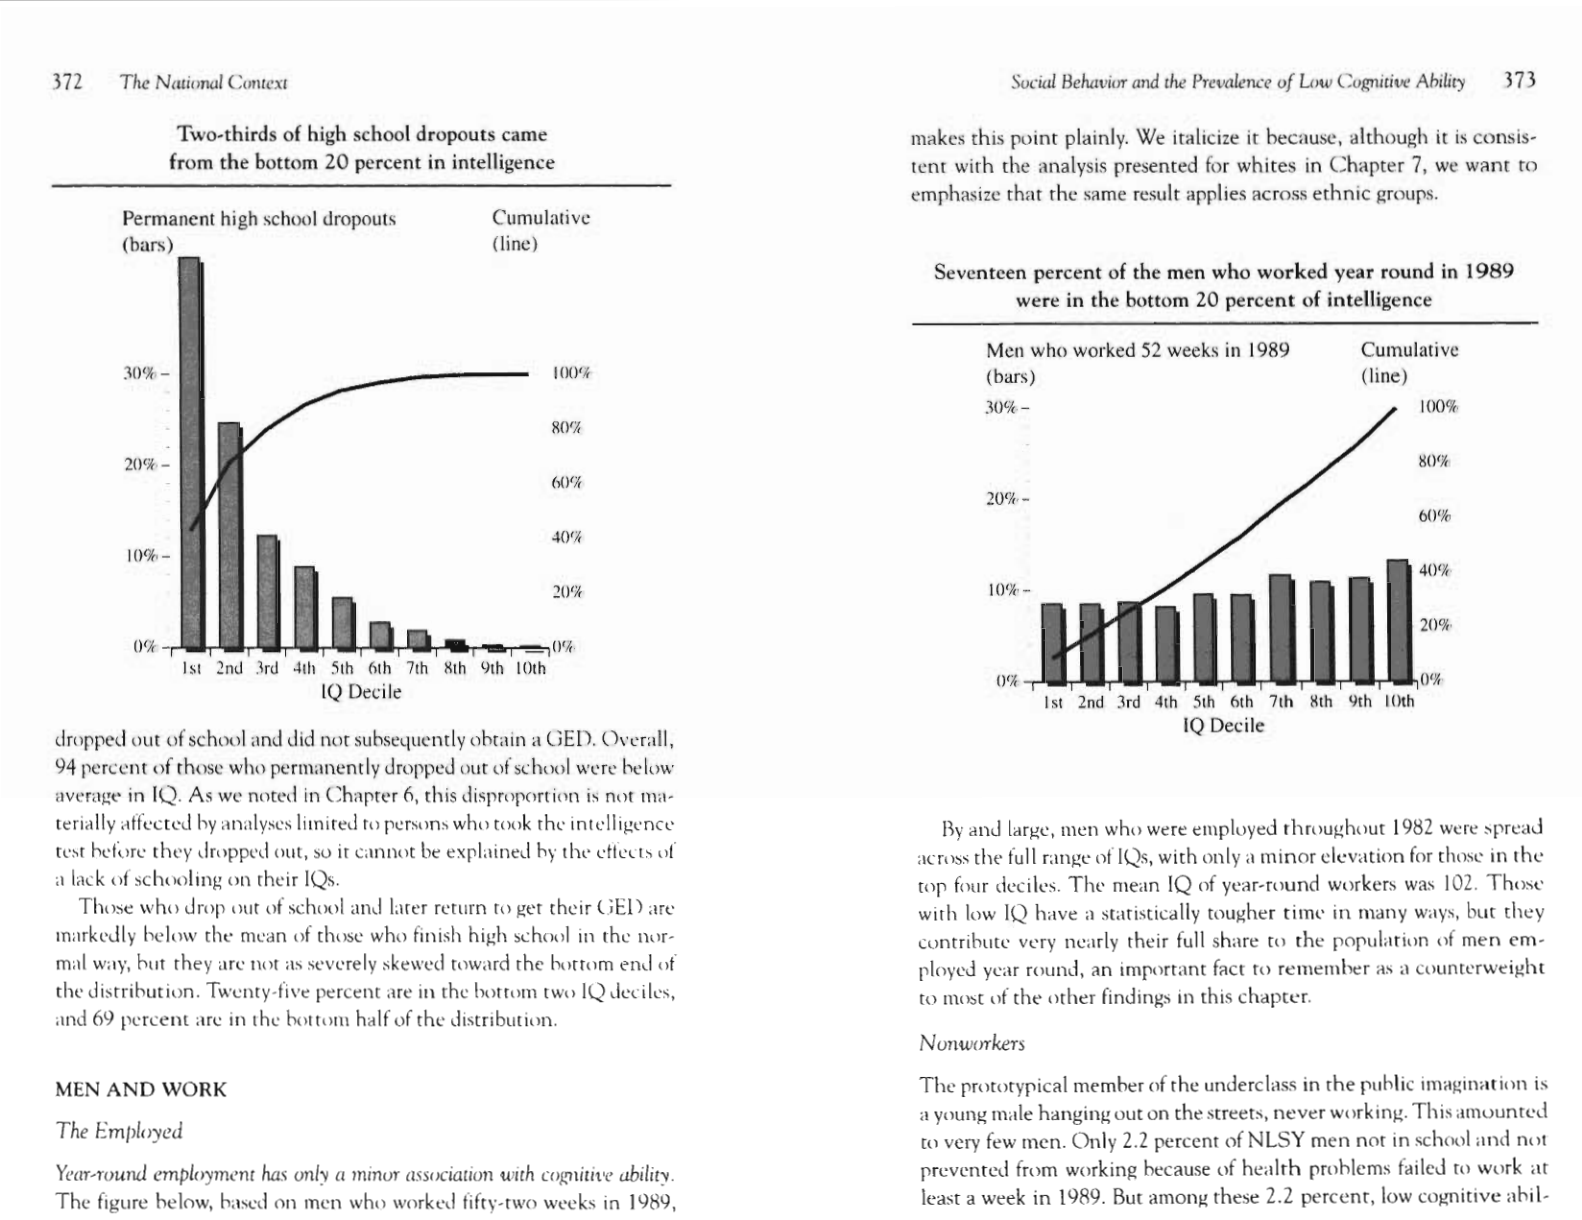
Two-thirds of high school dropouts came from the hottom 20 percent
in intelligence
372
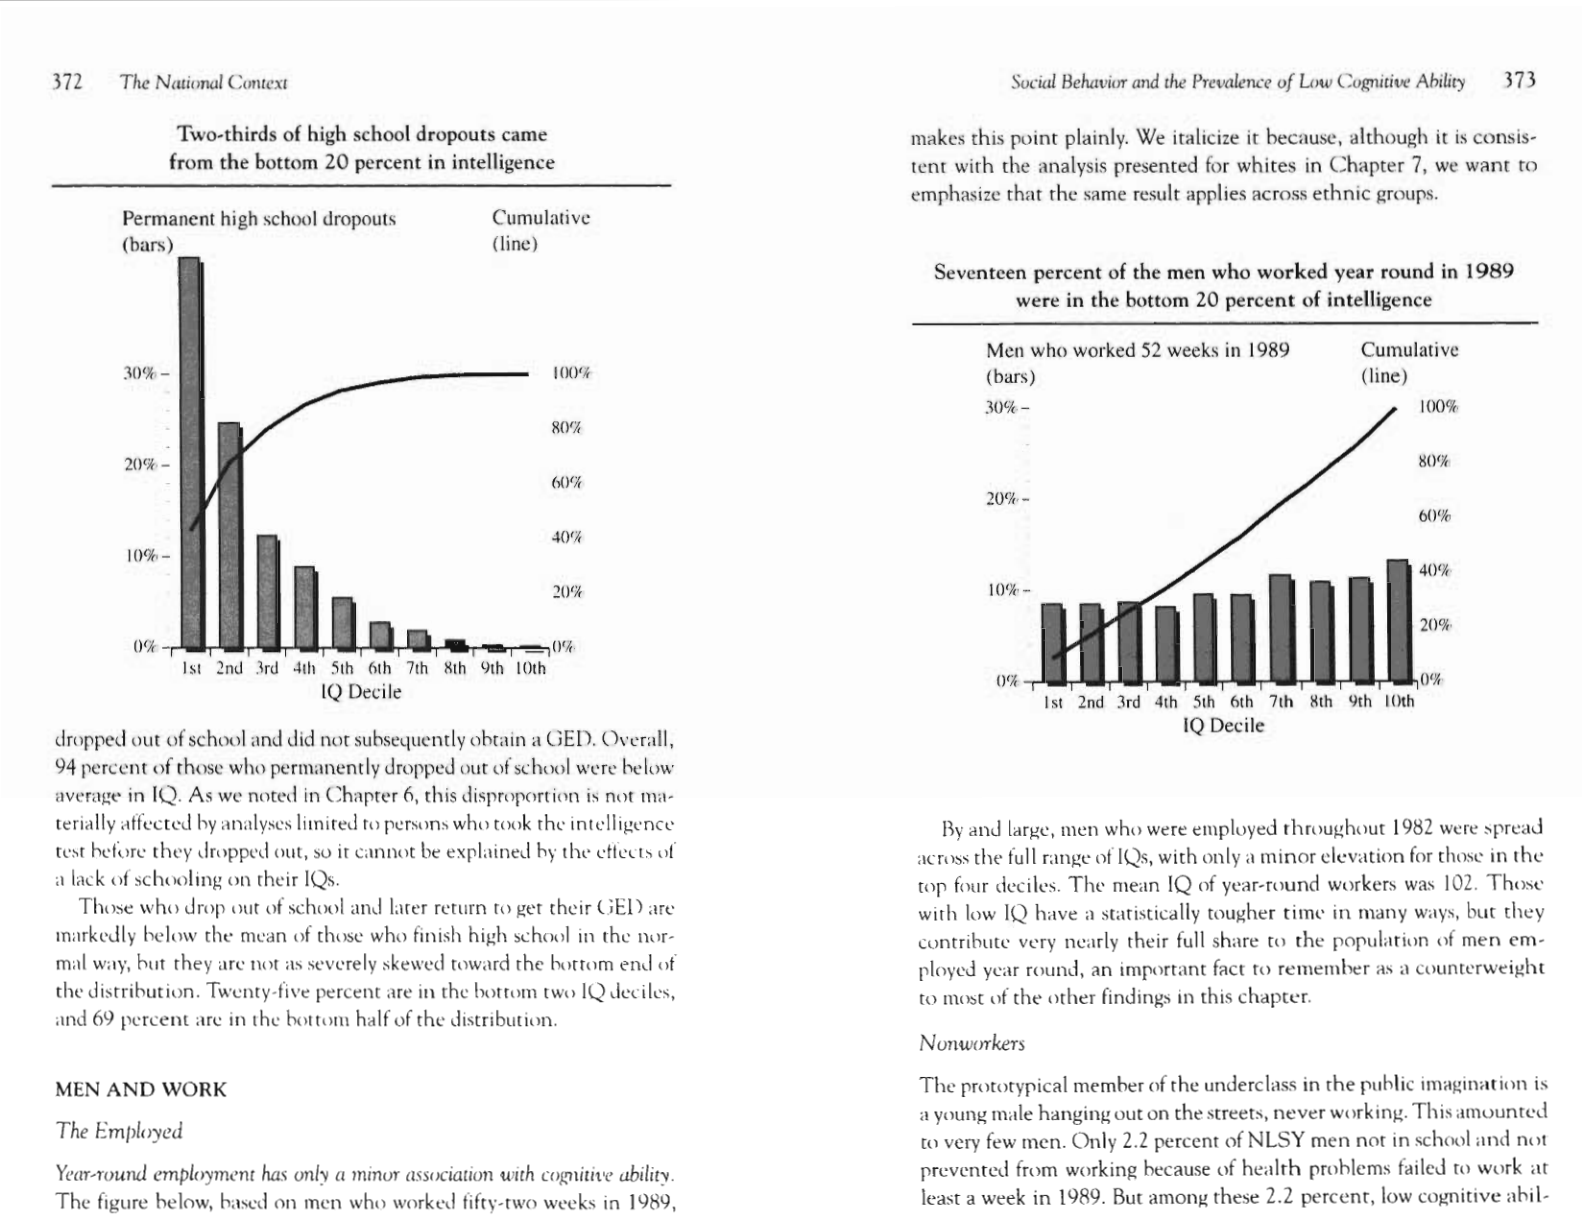
Seventeen percent of the men who worked year-round in 1989 were in
the bottom 20 percent of intelligence 373
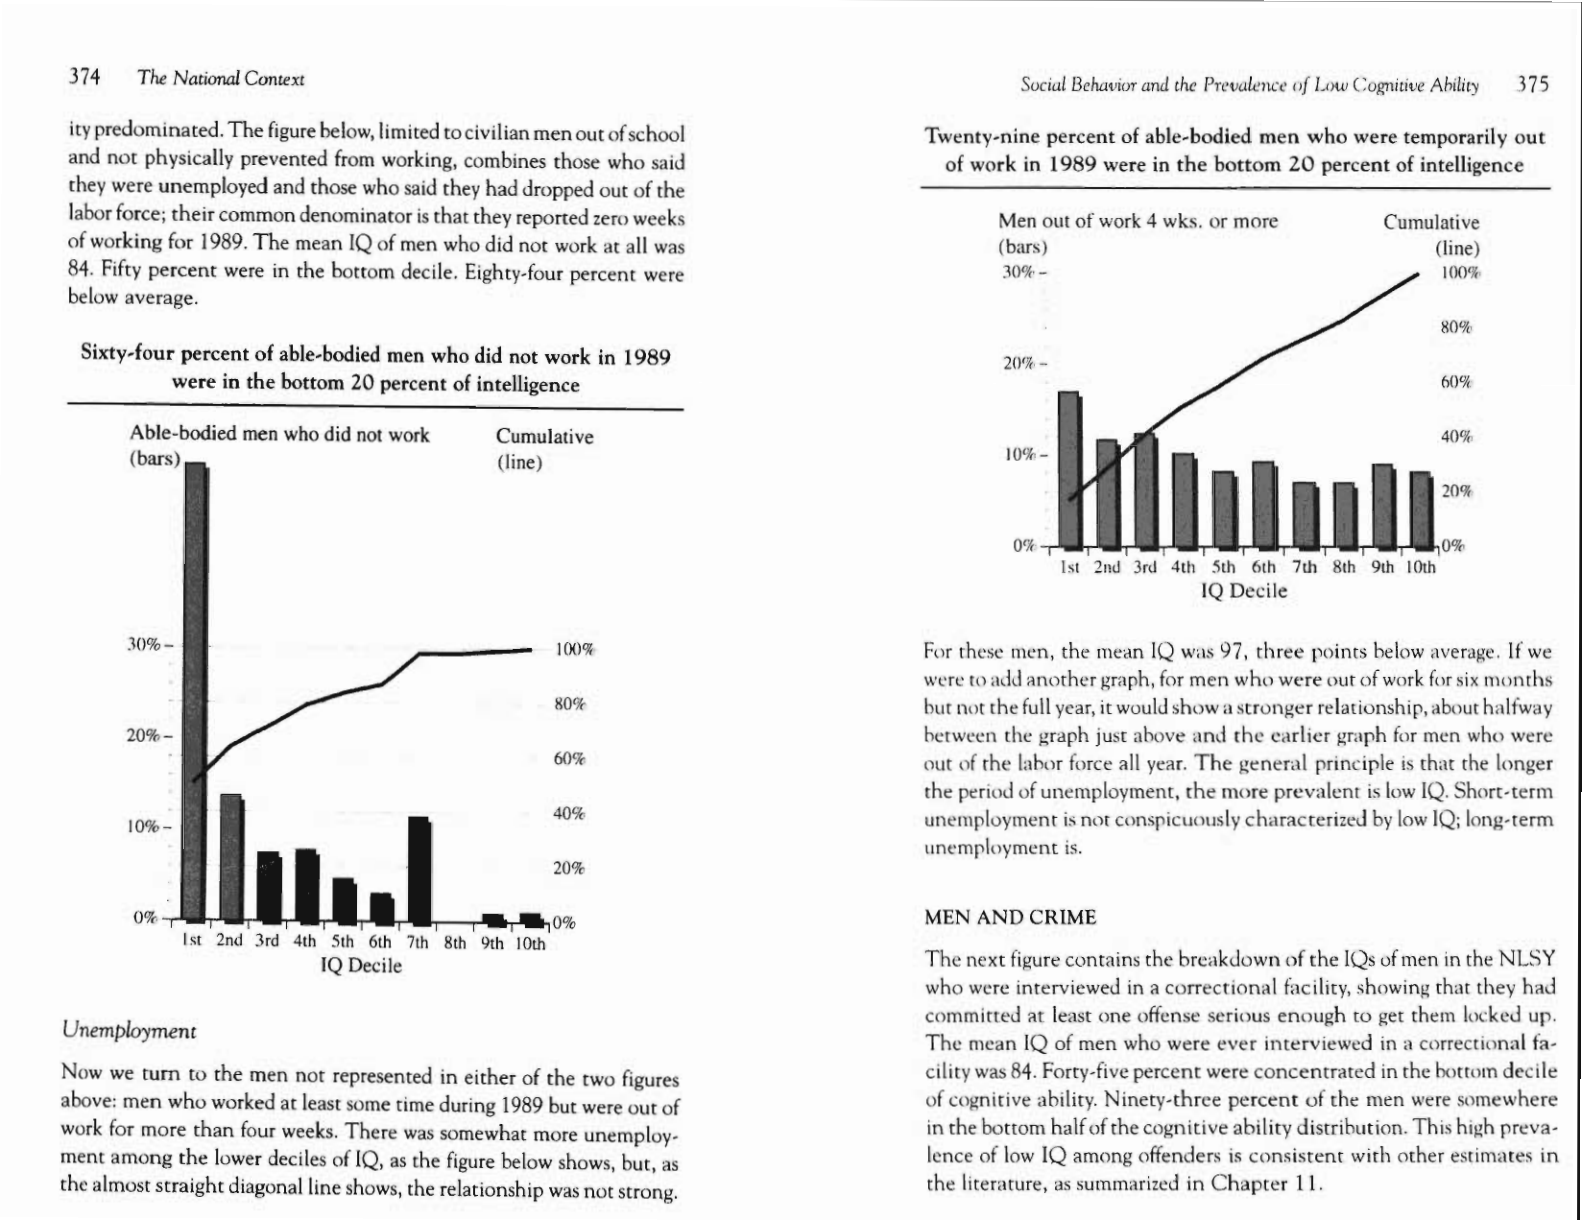
Sixty-four percent of able-bodied lnen who did not work in 1989 were
in the bottom 20 percent of intelligence 374
Twentymine percent of able-bodied men who were temporarily out of
work in 1989 were in the bottom 20 percent of intelligence
375
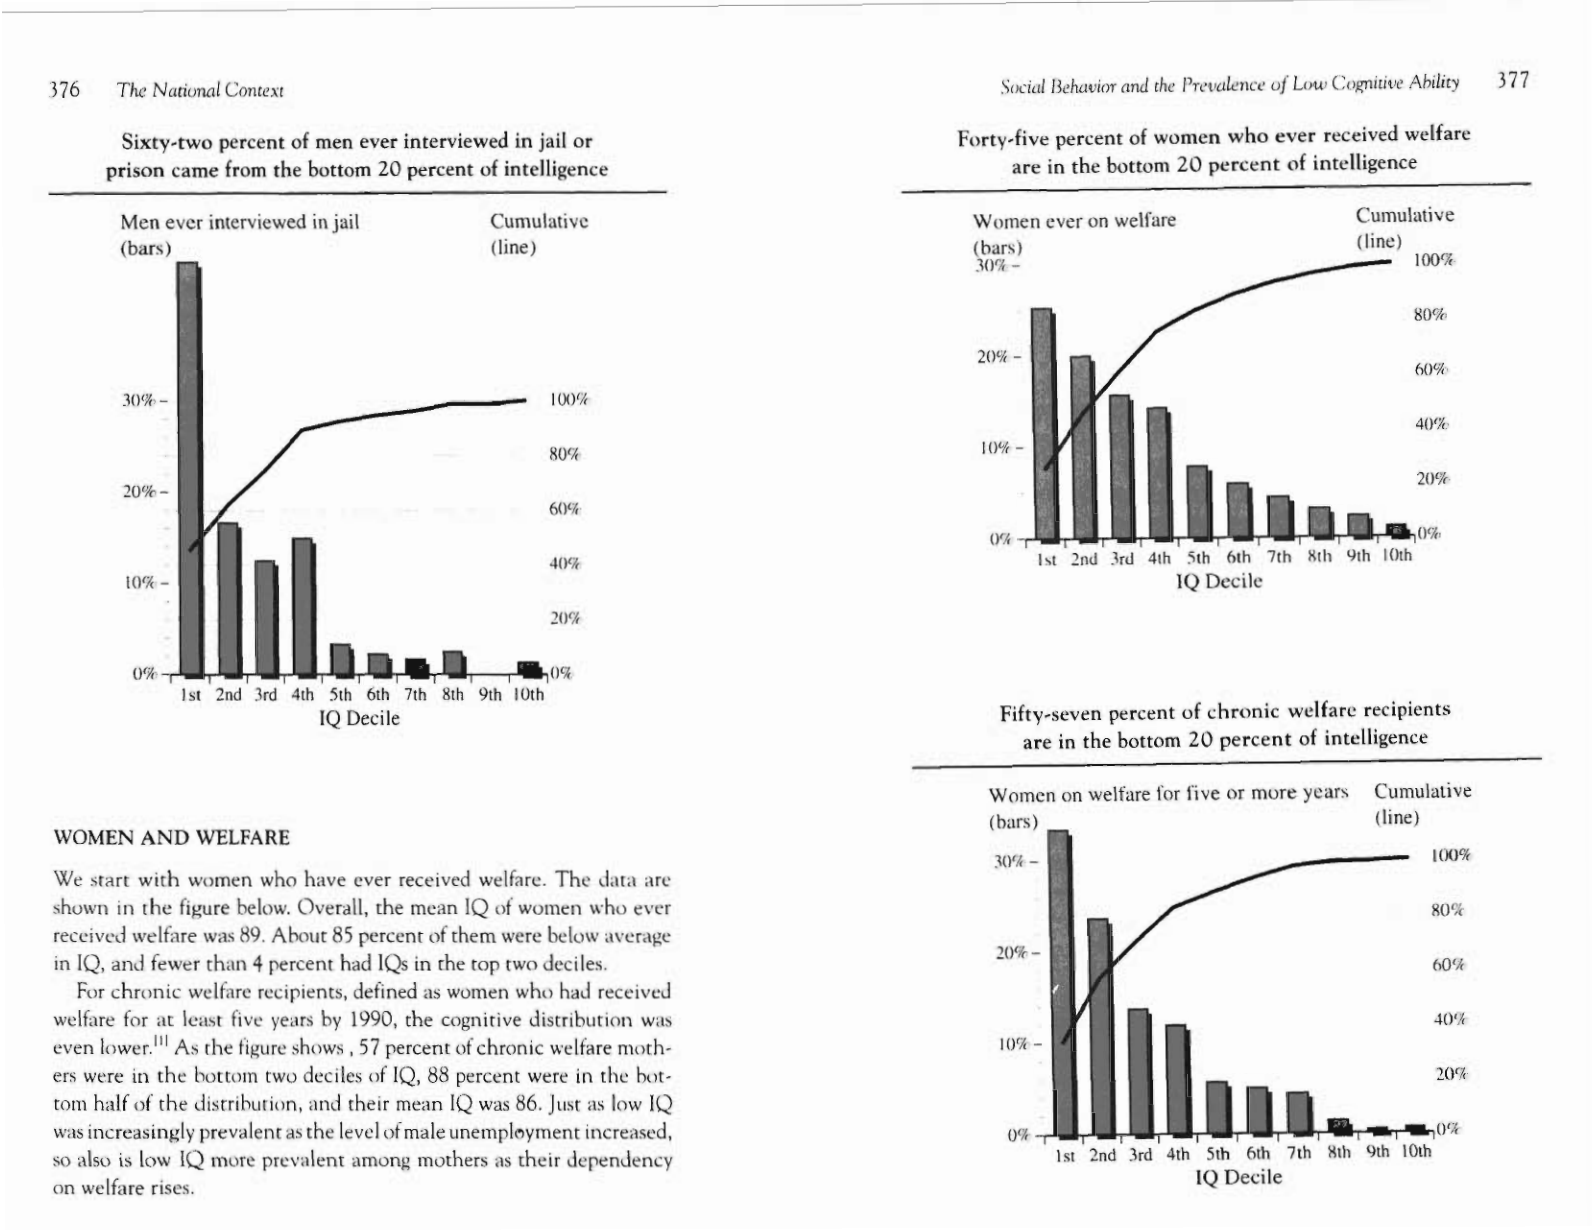
Sixty-two percent of men ever interviewed in jail or prison came from
the bottom 20 percent of intelligence 376
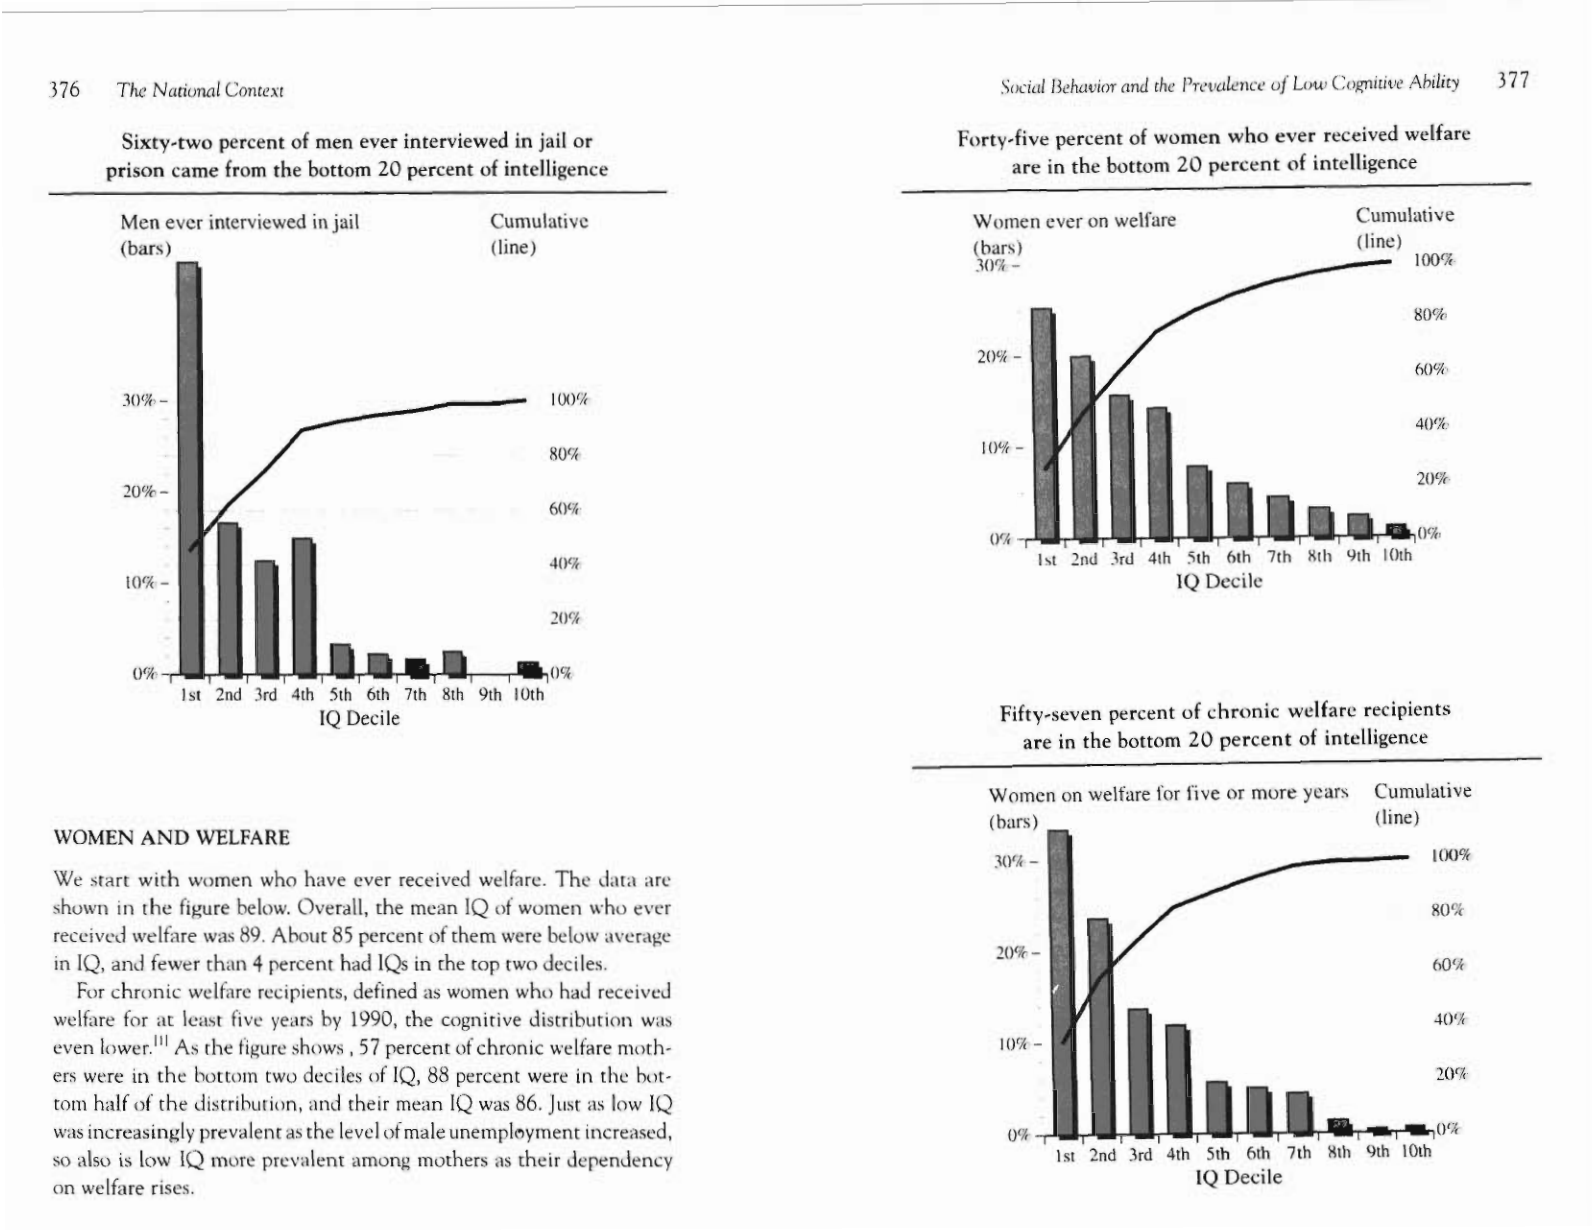
Forty-five percent of women who ever received welfare were in the hot-
tom 20 percent of intelligence 377
Fifty-seven percent of chronic welfare recipients were in the bottom 20
percent of intelligence 377
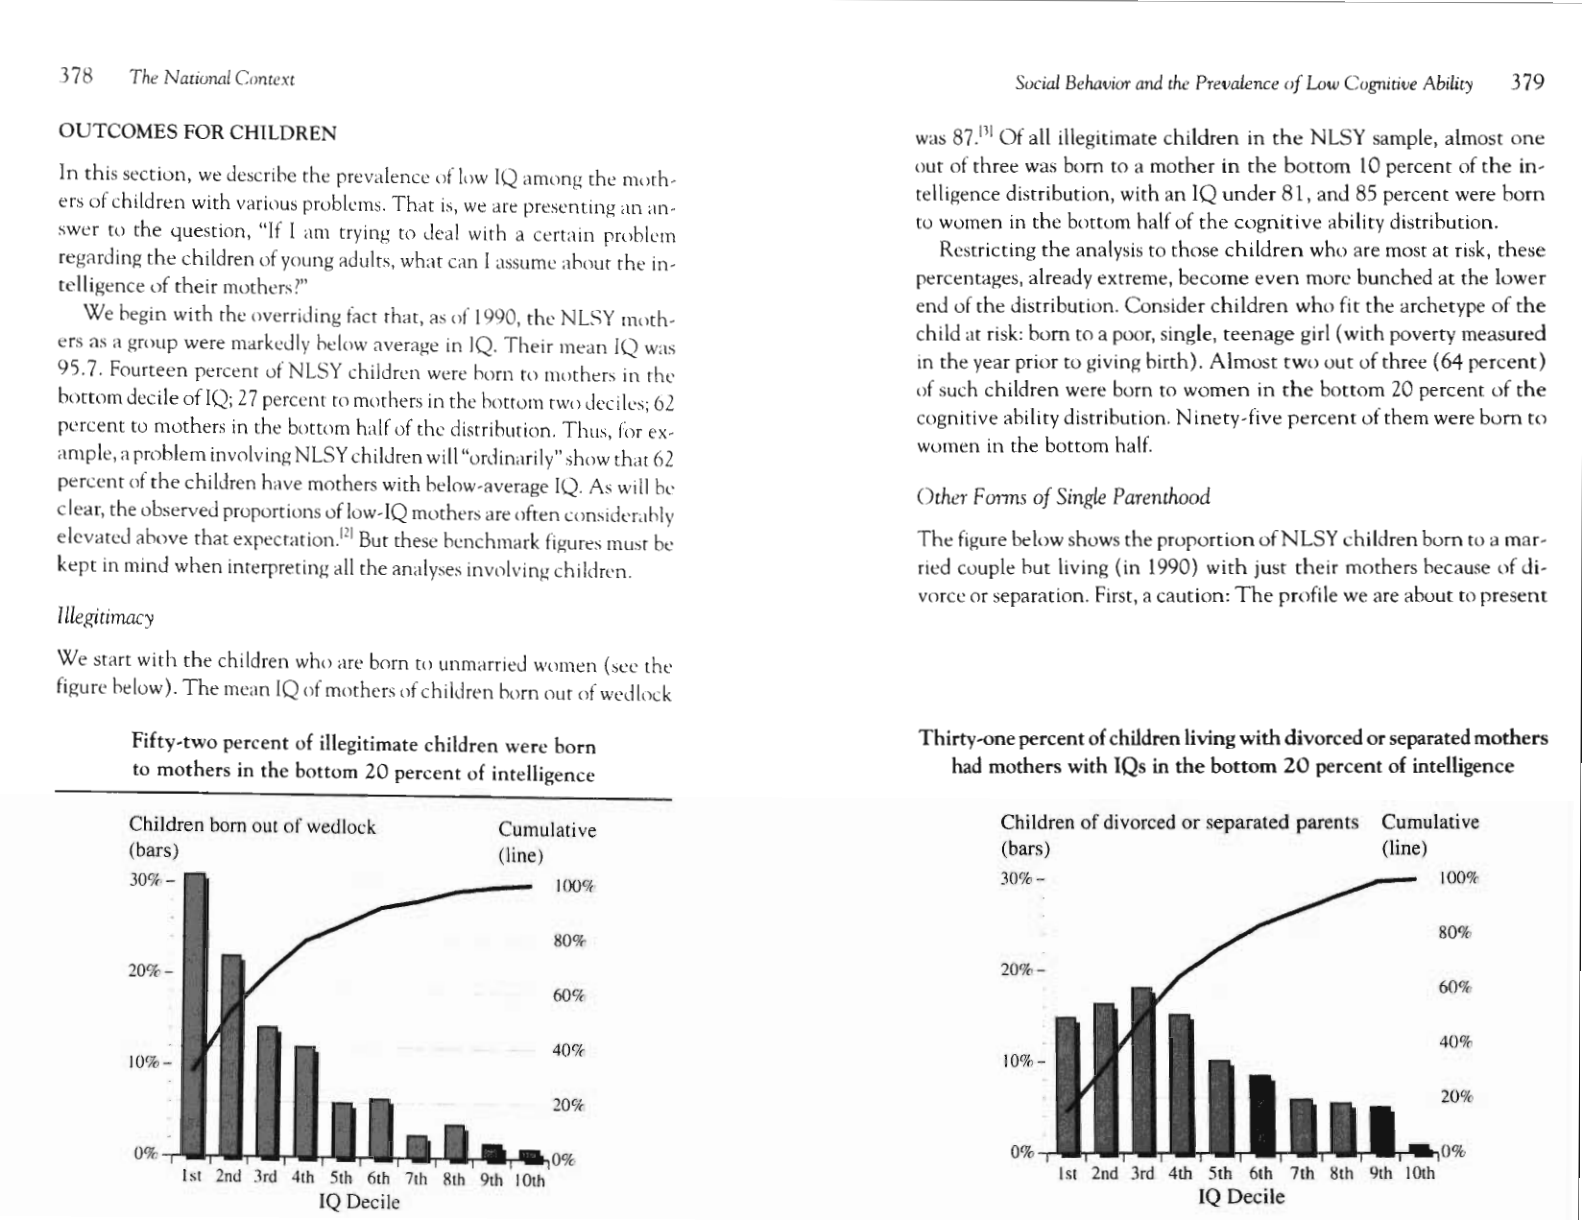
Fifty-two percent of illegitimate children were born to mothers in the
bottom 20 percent of intelligence 378
Thirty-one percent of children living with divorced or separatecl moth-
ers had mothers with IQs in the bottom 20 percent of intelligence 379
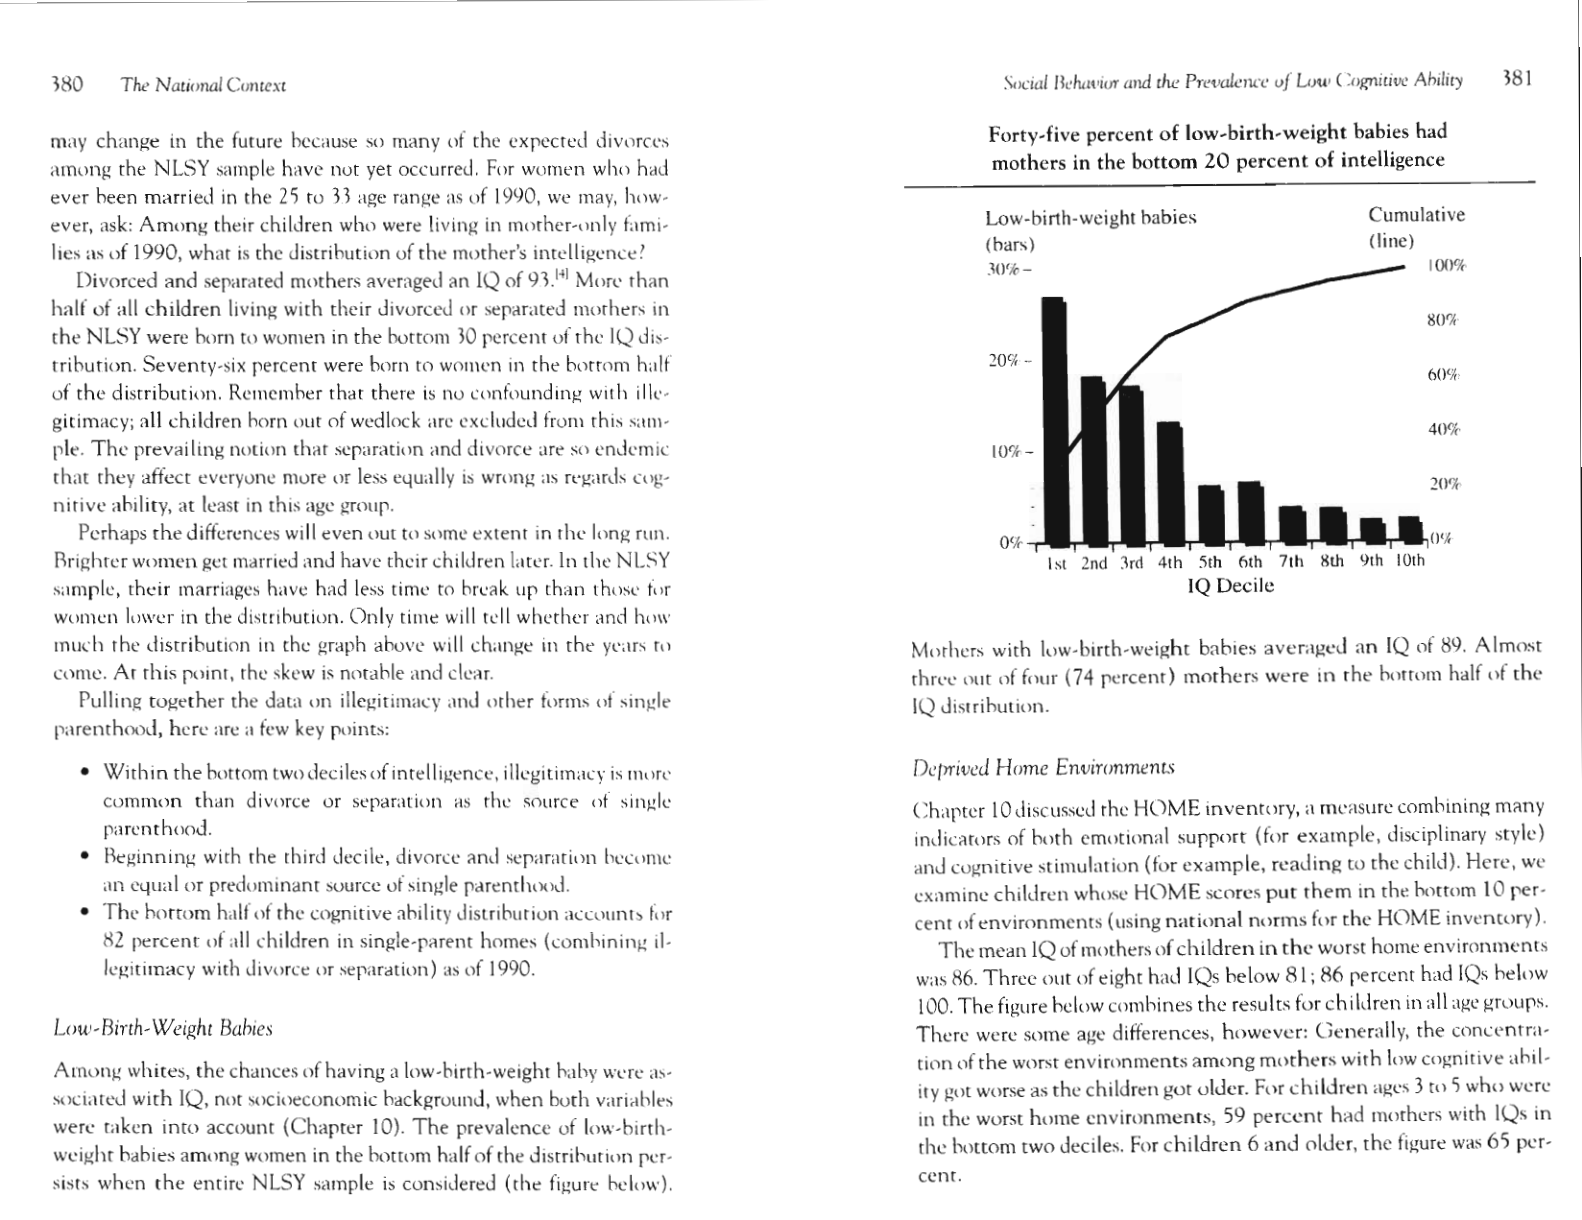
Forty-five percent of low-birth-weight babies had mothers in the bot-
tom 20 percent of intelligence 381
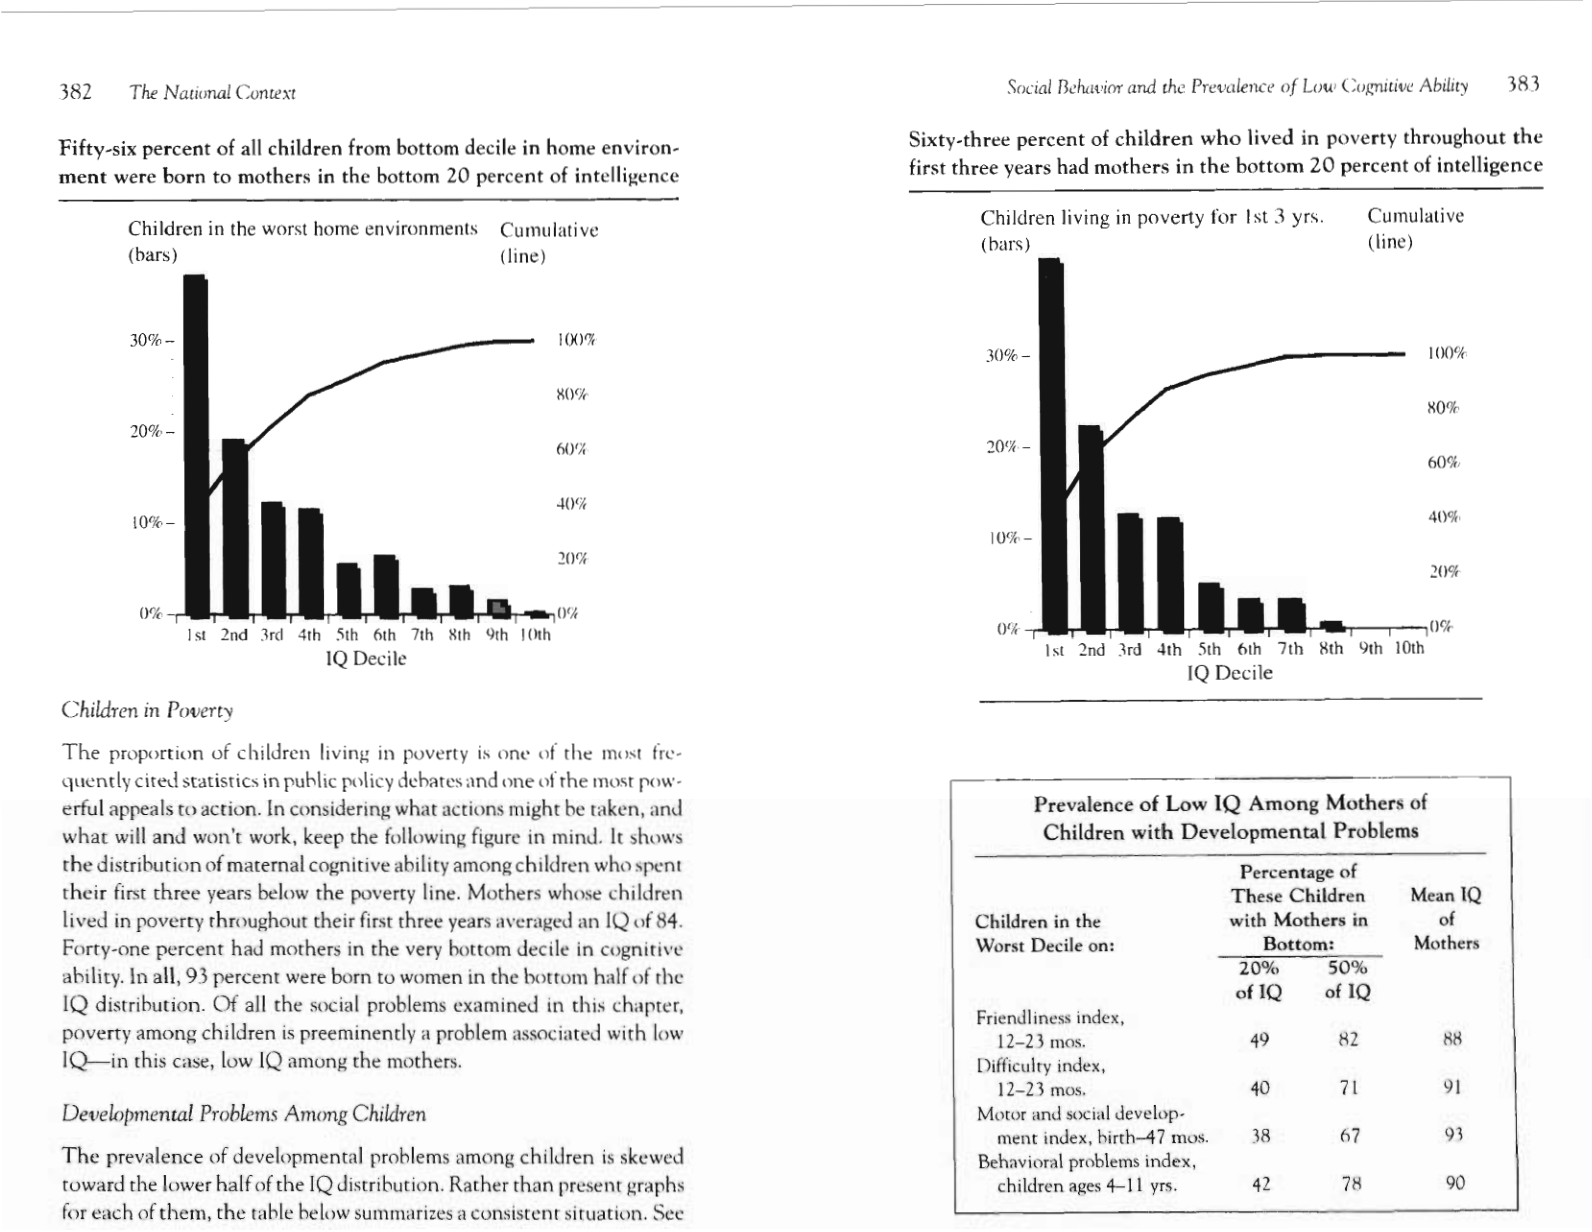
Fifty-six percent of all children from the bottom decile in home
environment were born to mothers in the bottom 20 percent of in-
telligence 382
List of Illusmations
xv
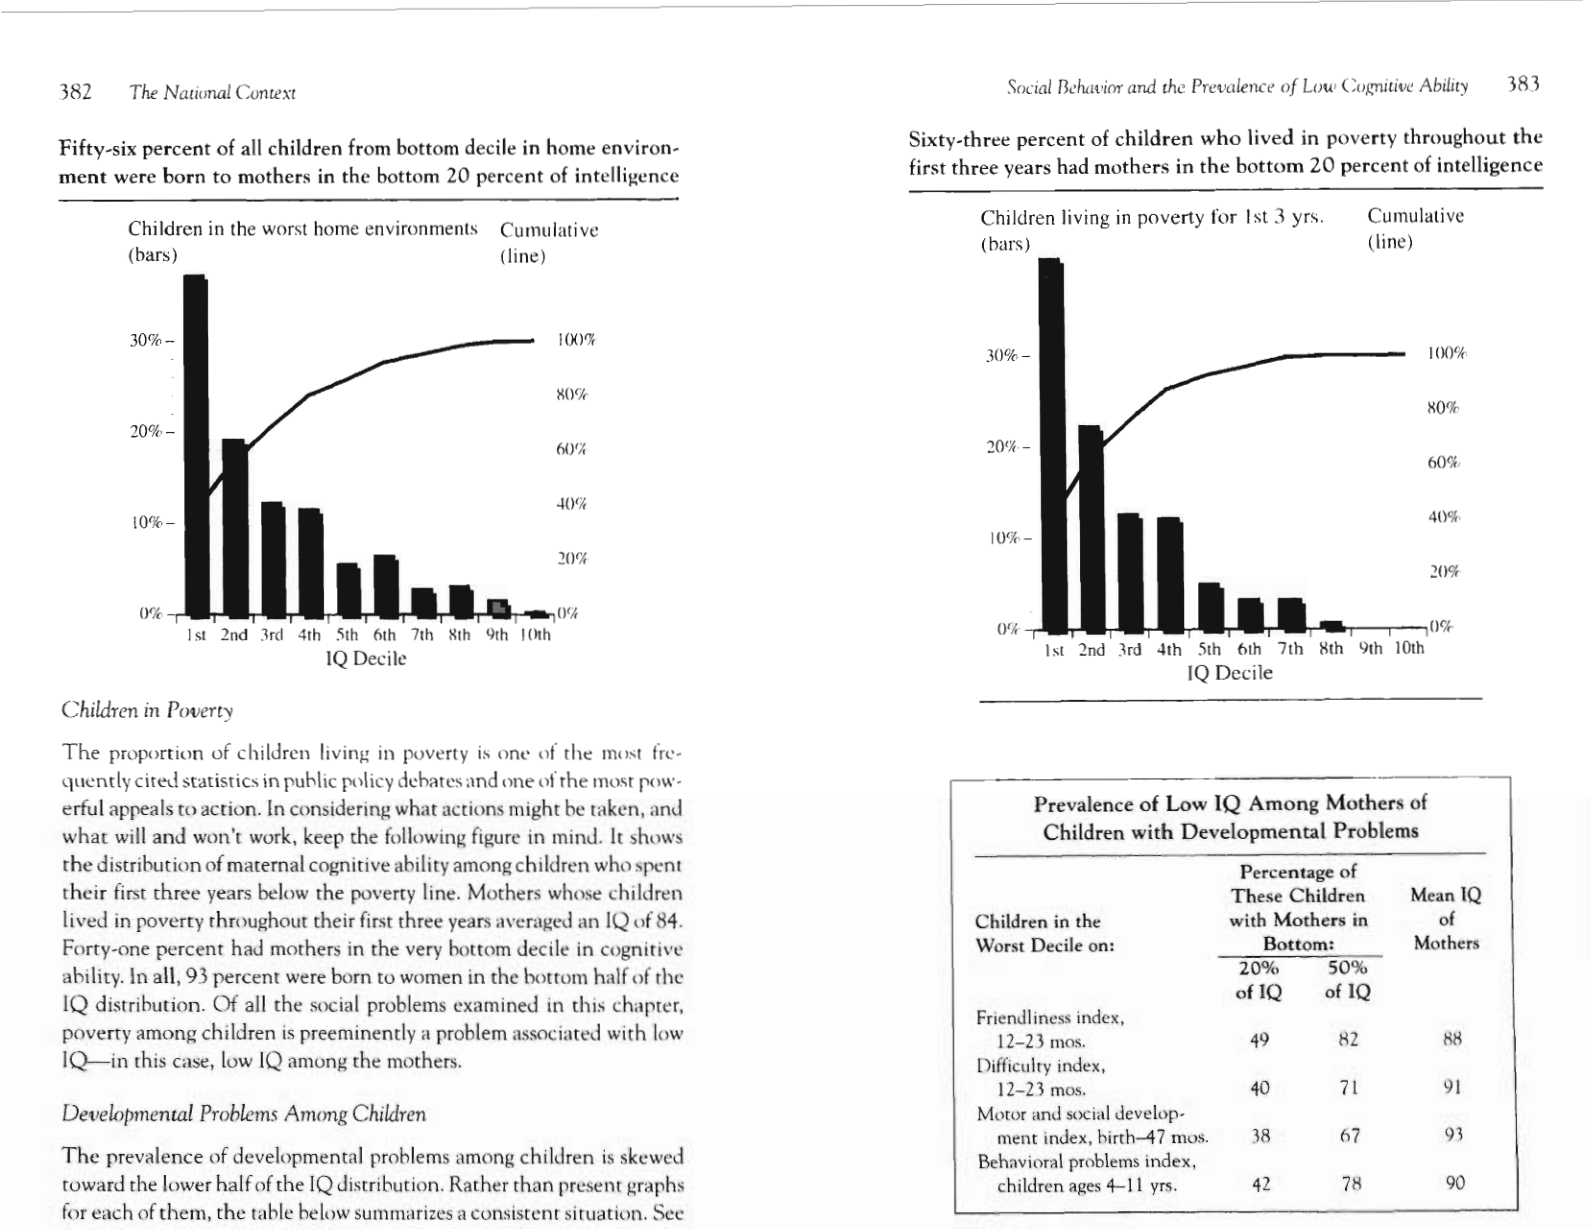
Sixty-three percent of children who lived in poverty throughout
the first three years had mothers in the bottom 20 percent of in-
telligence
383
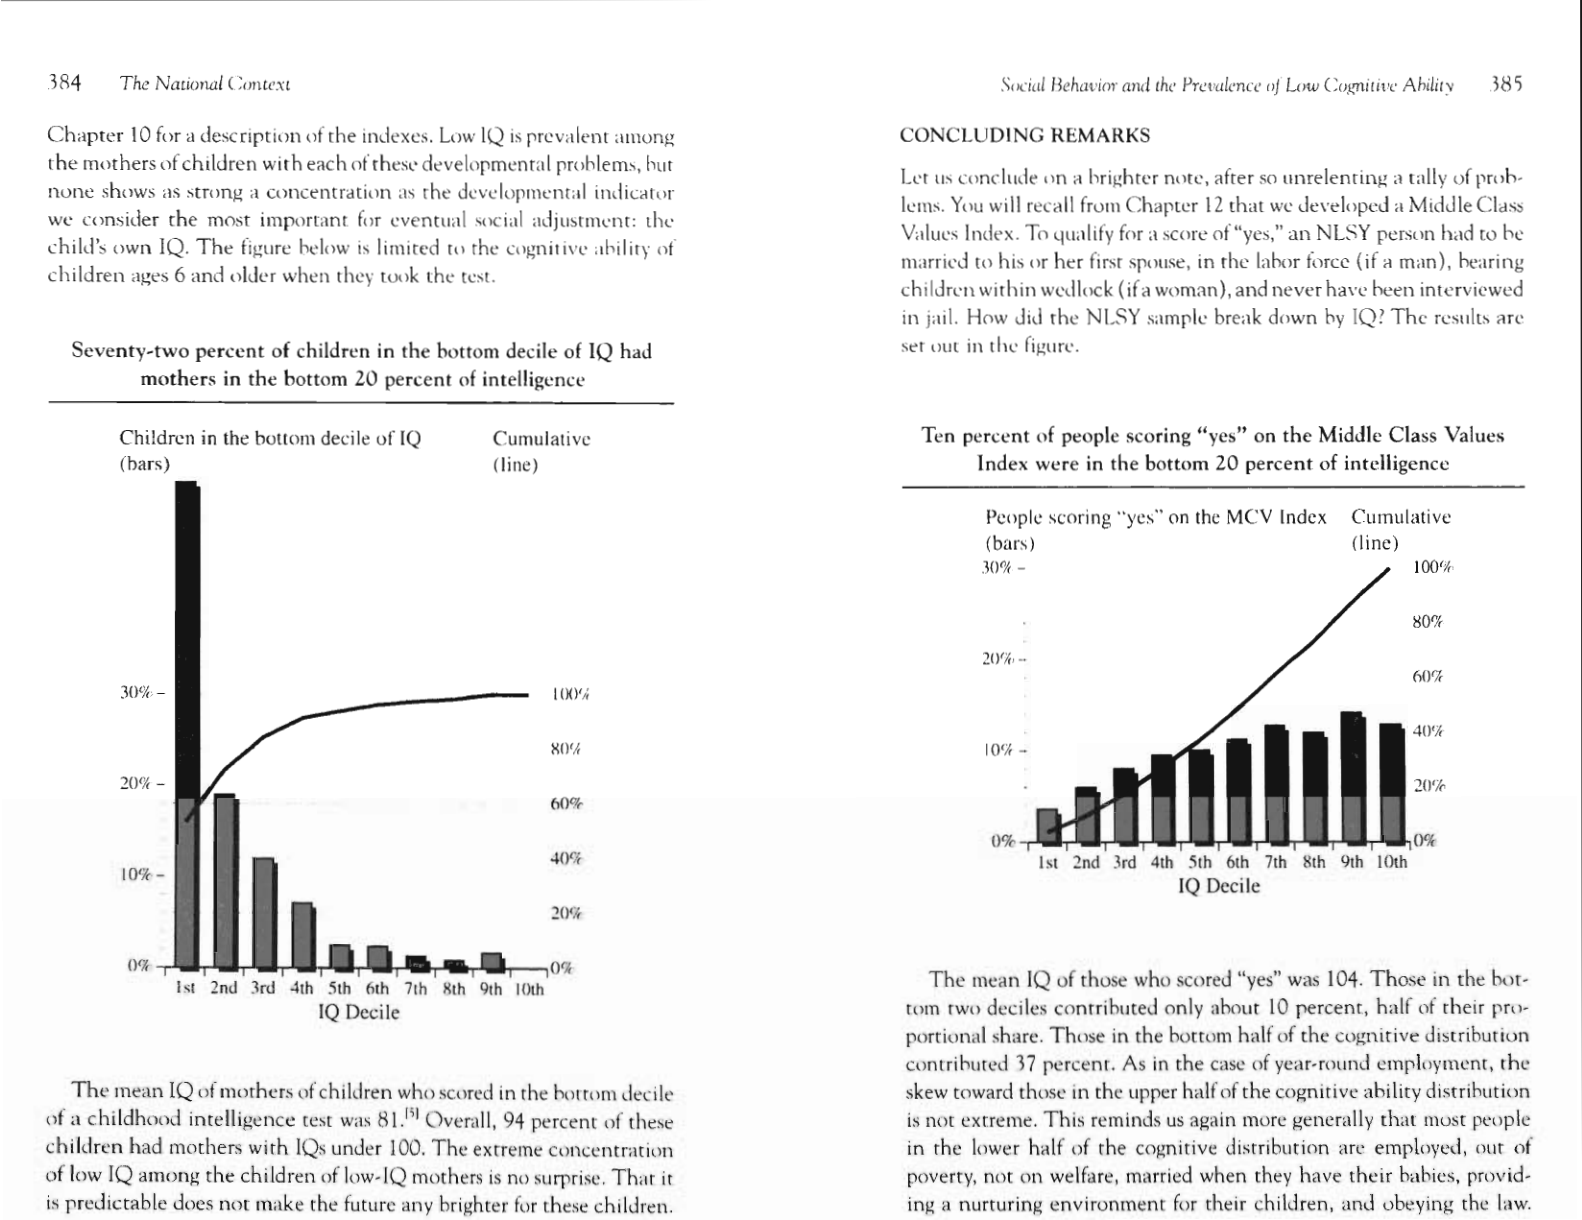
Seventy-two percent of children in the bottom decile of IQ had moth-
ers in the bottom 20 percent of intelligence 384
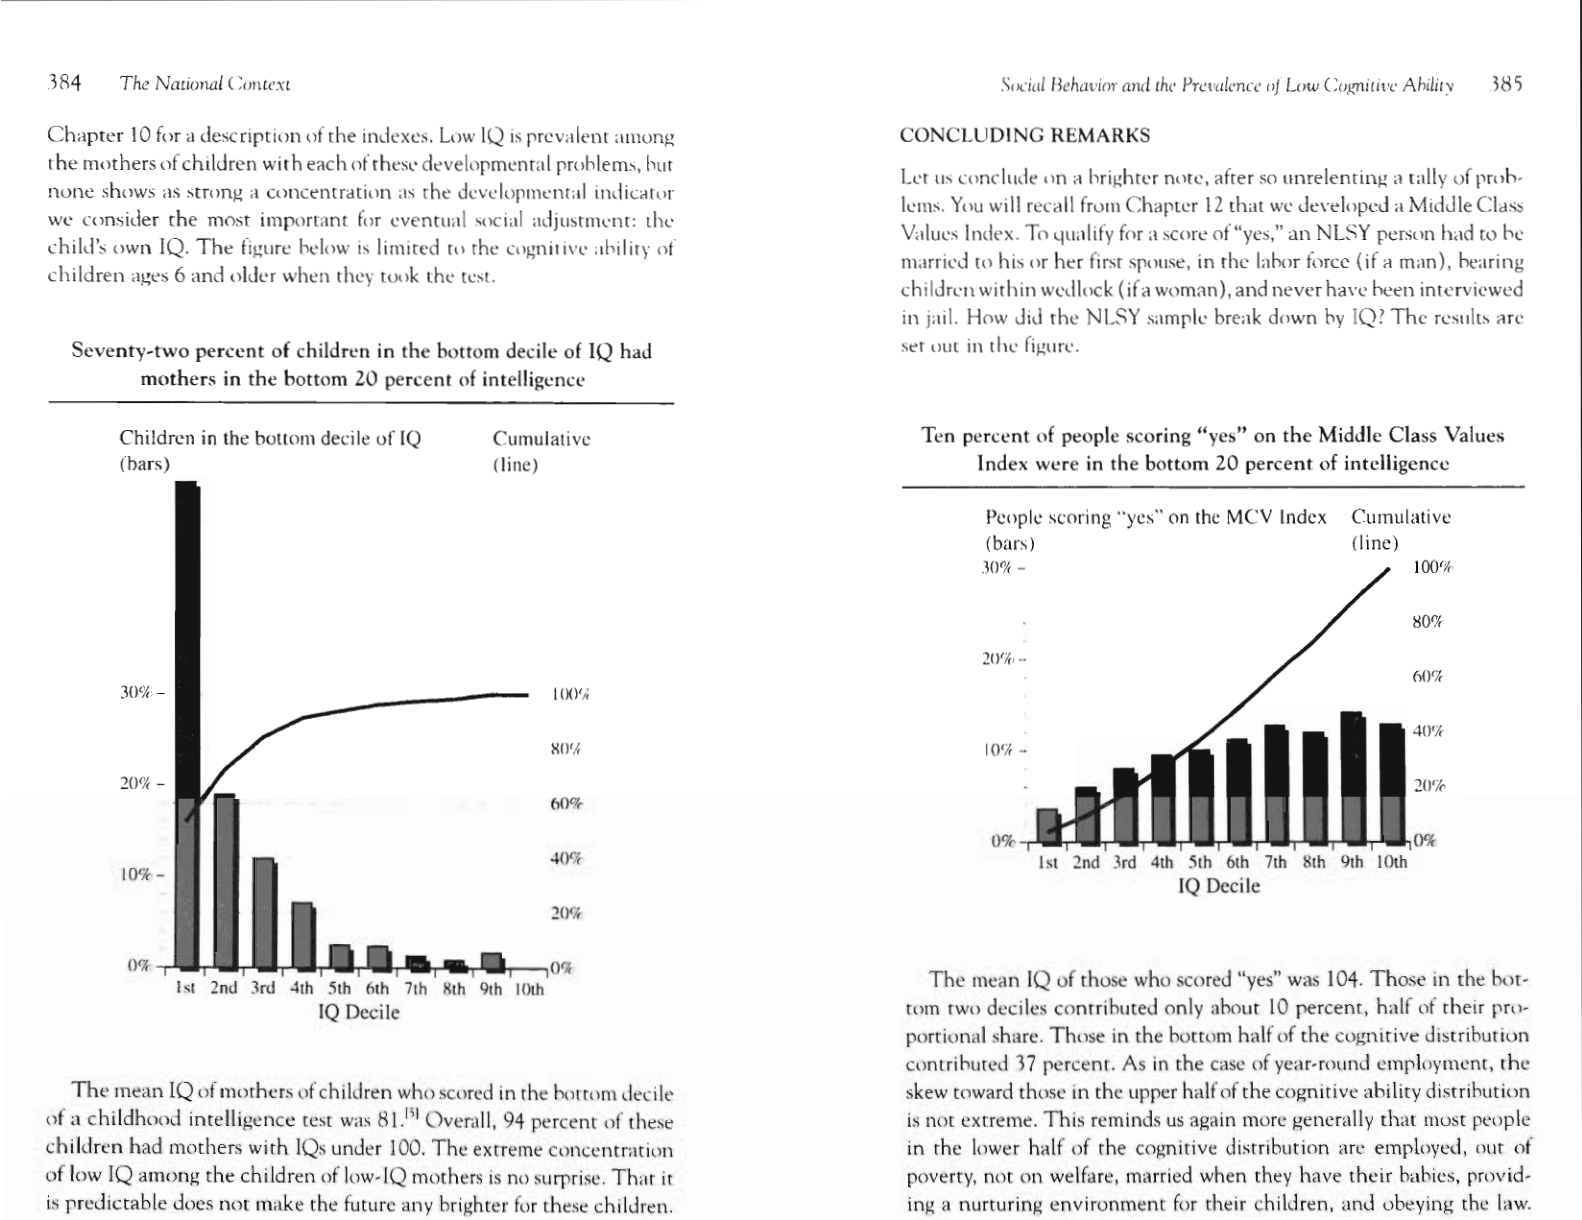
Ten percent of people scoring "yes" on the Middle Class Values index
were in the bottom 20 percent of intelligence 385
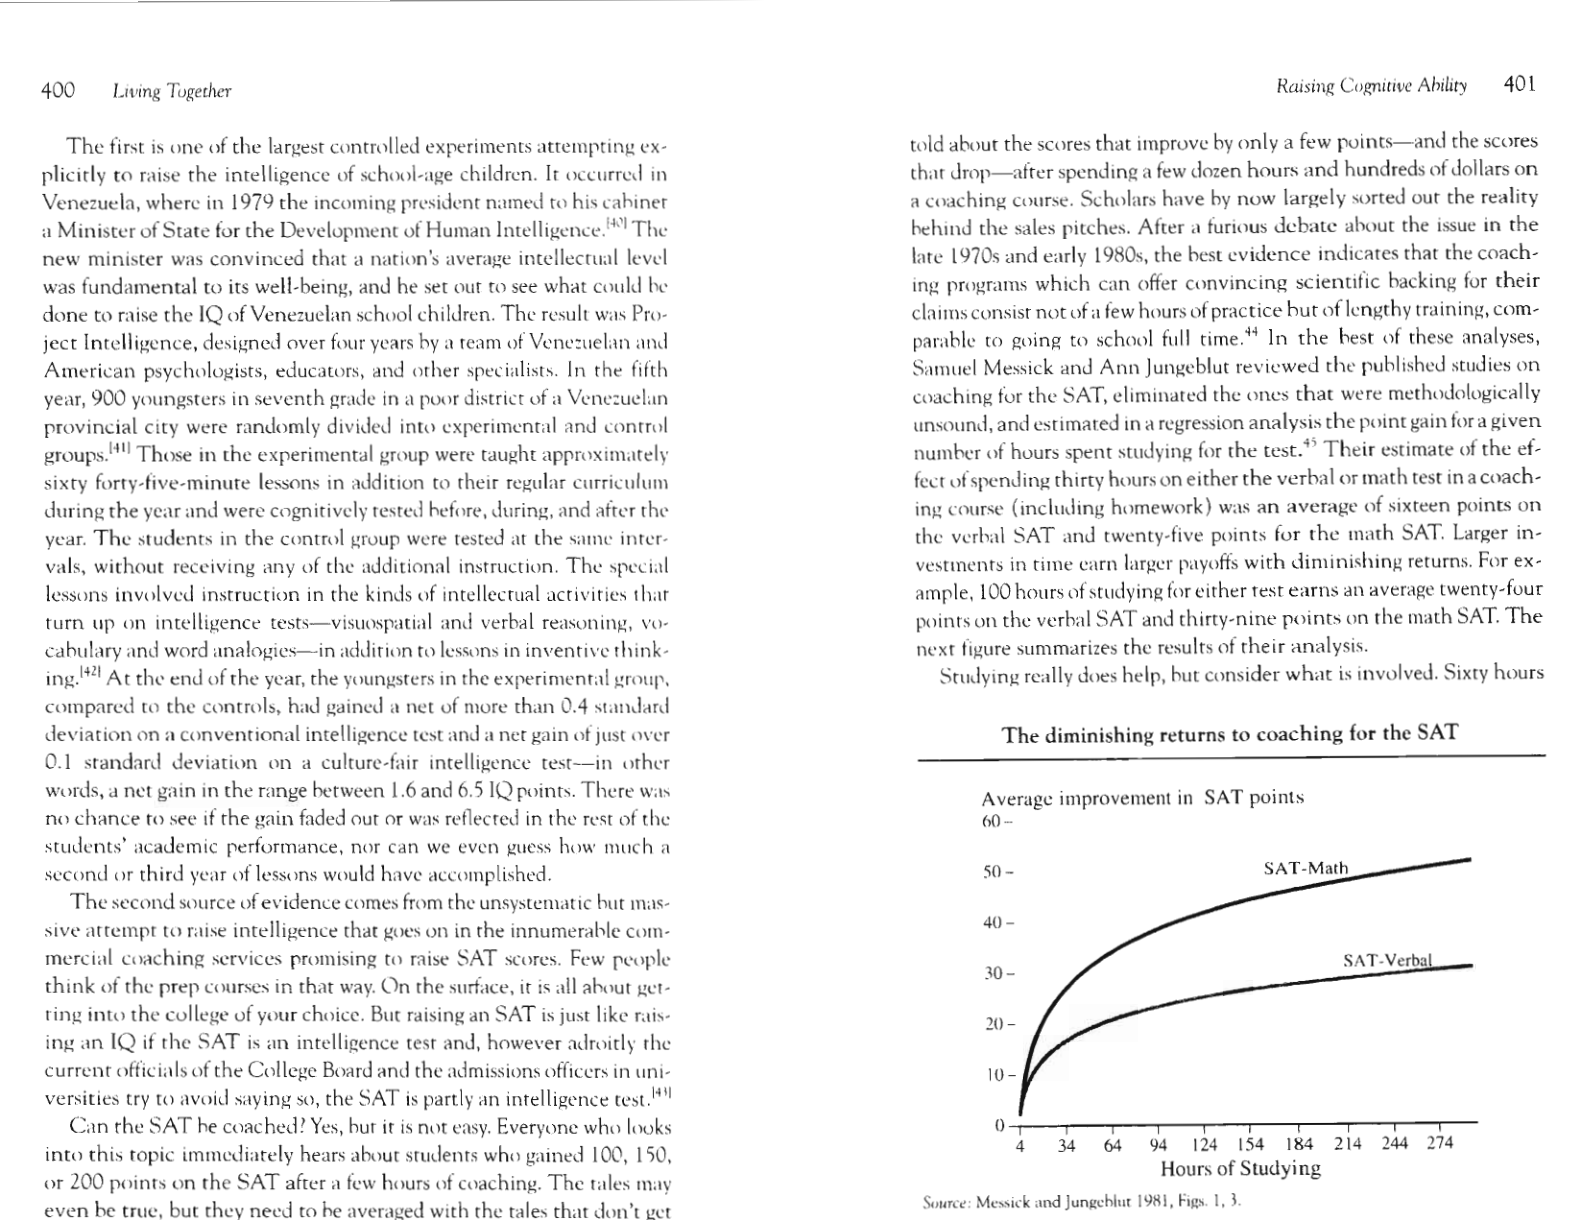
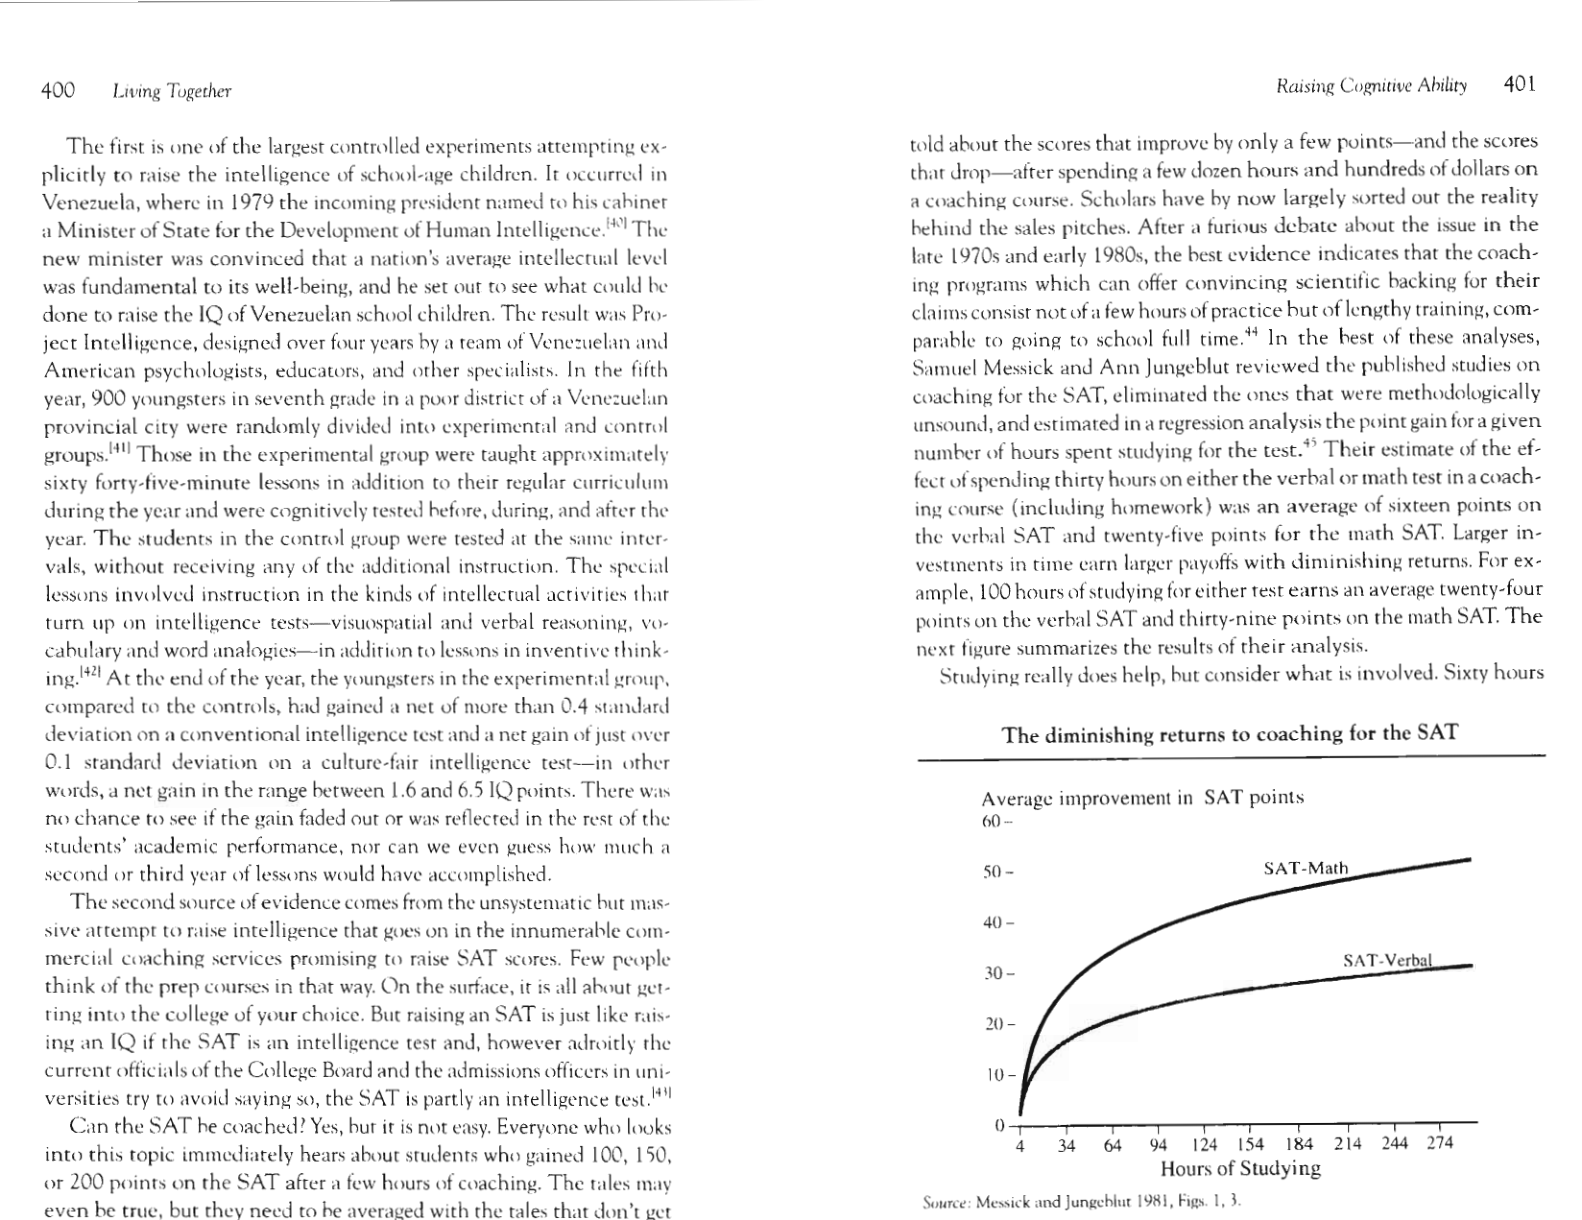
The diminishing returns to coaching for the SAT 401
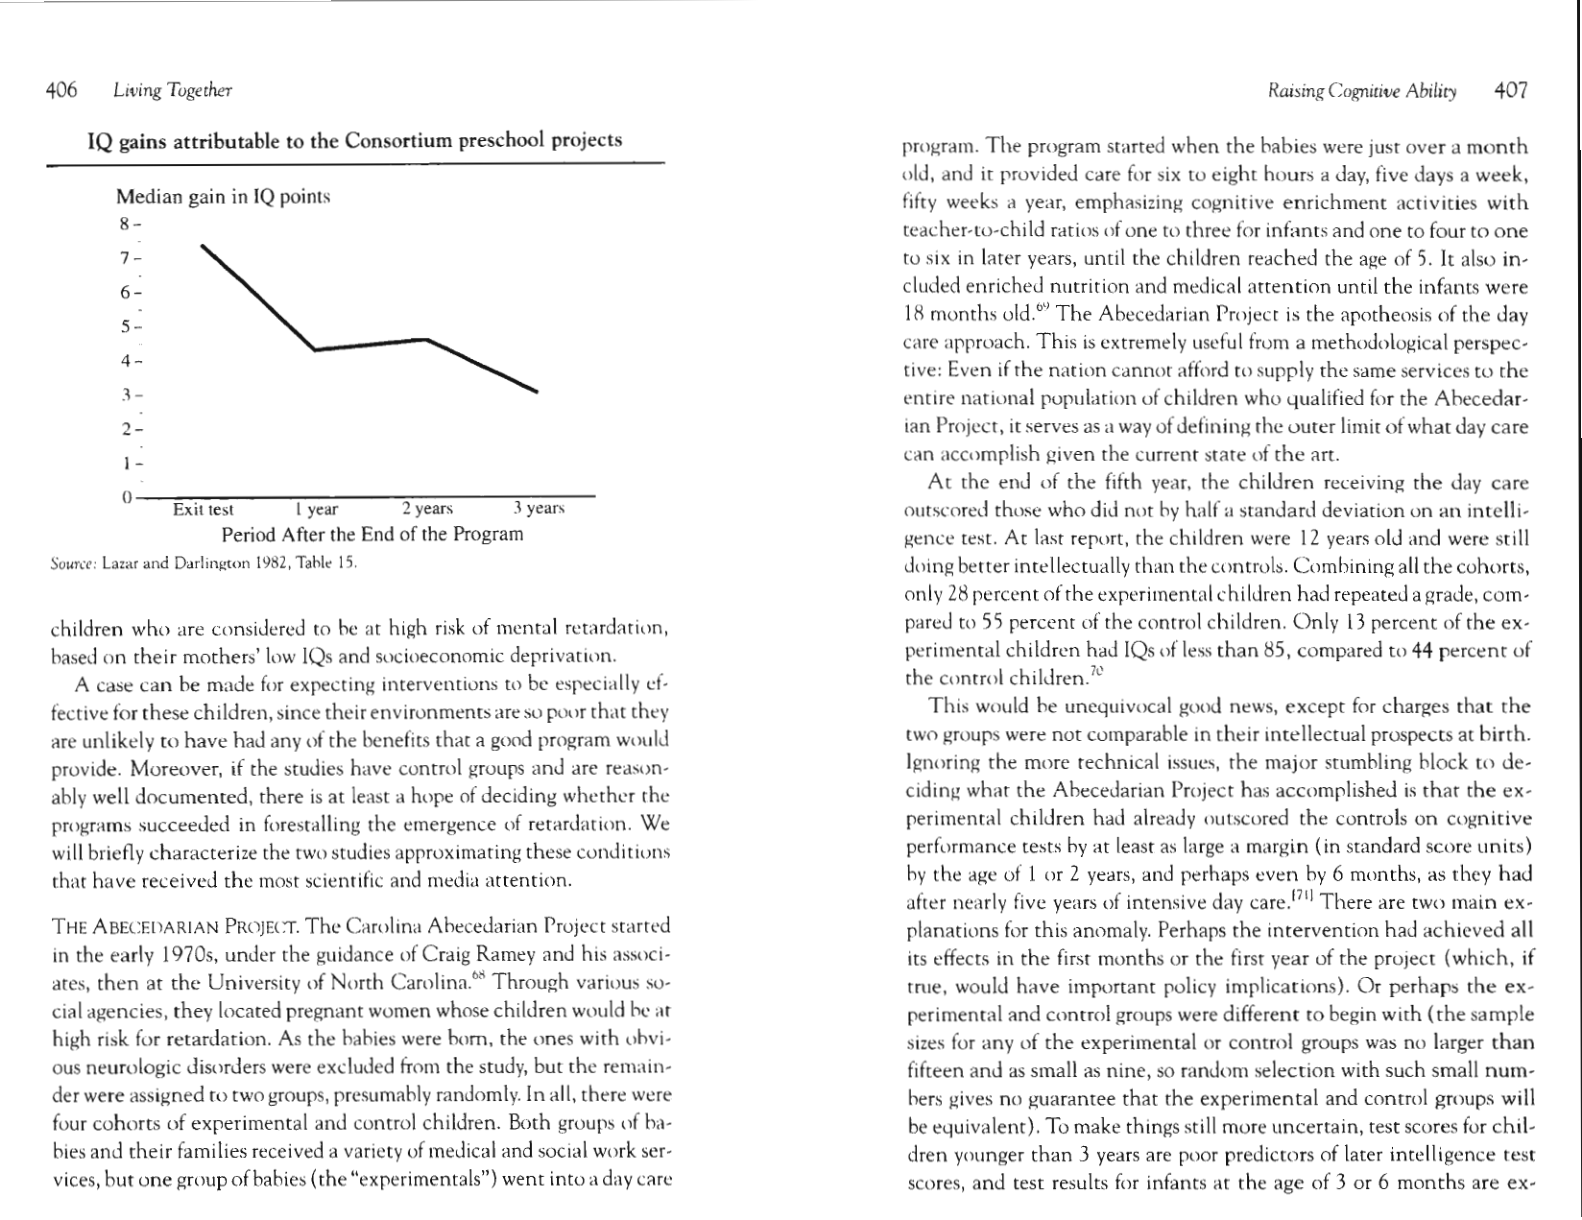
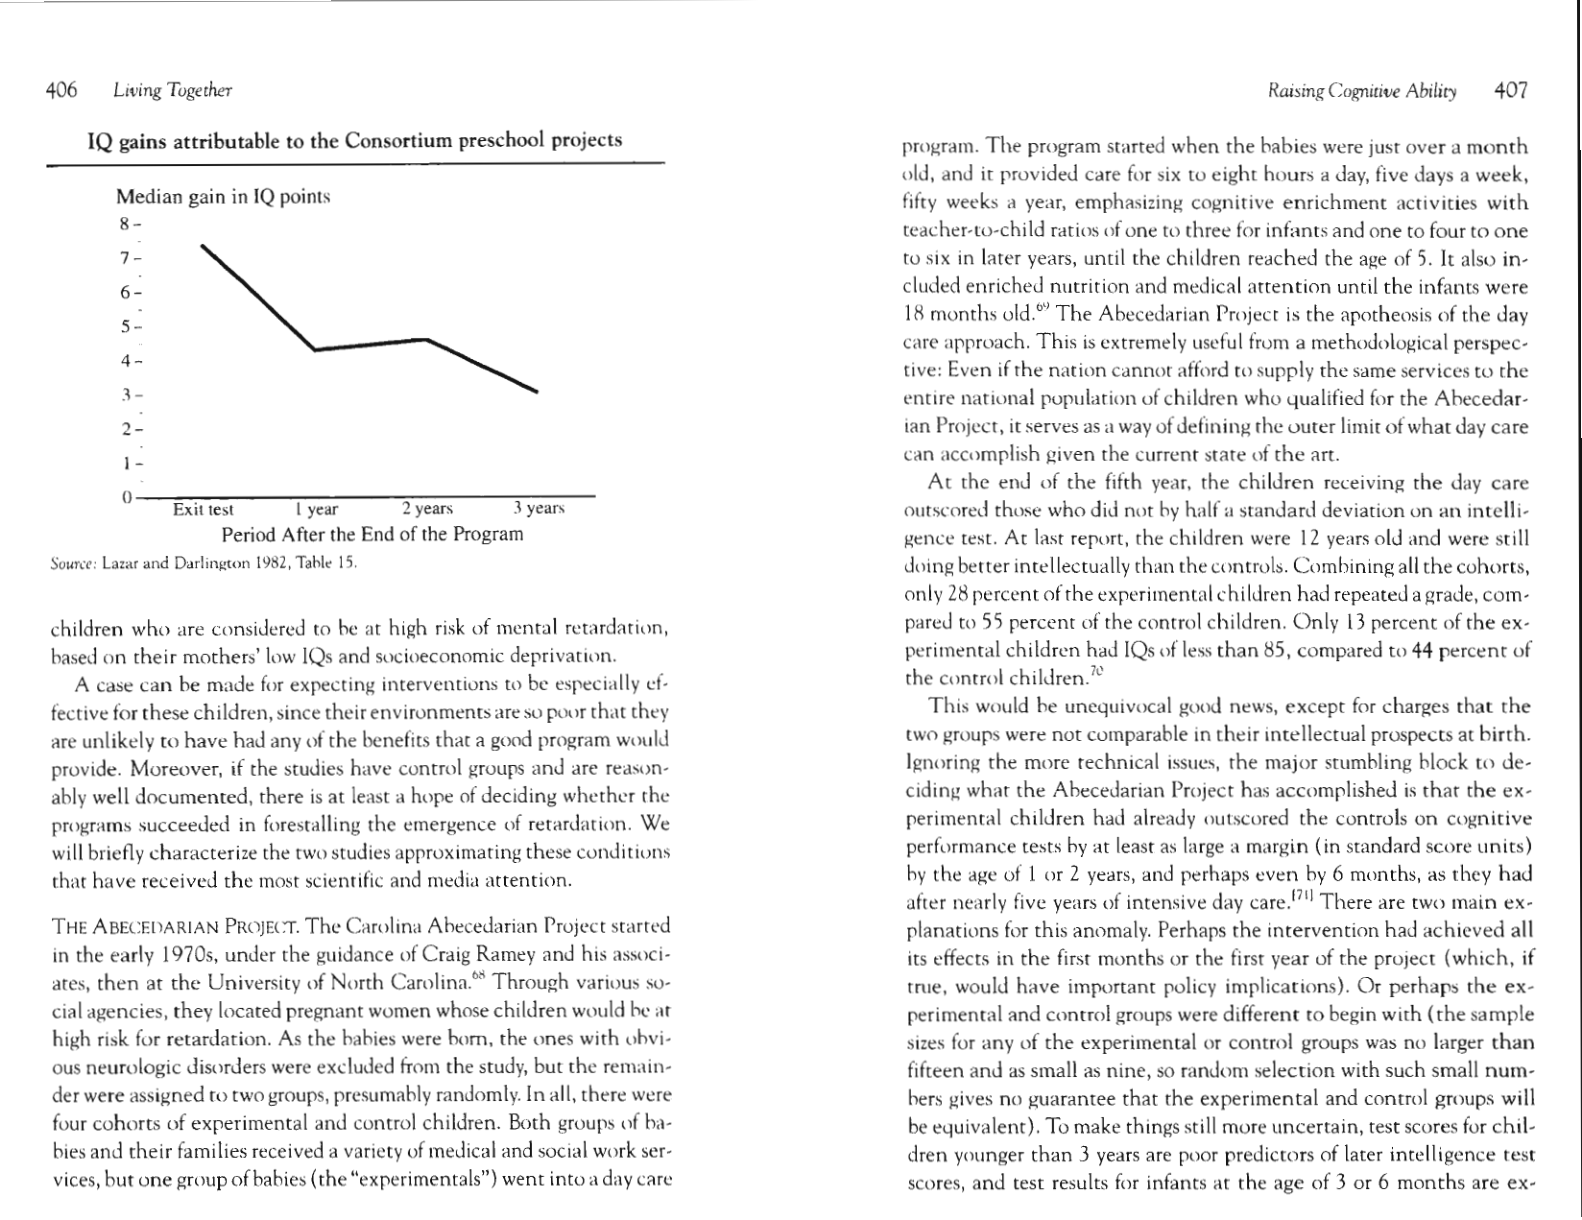
IQ gains attributable to the Consortium preschool projects 406
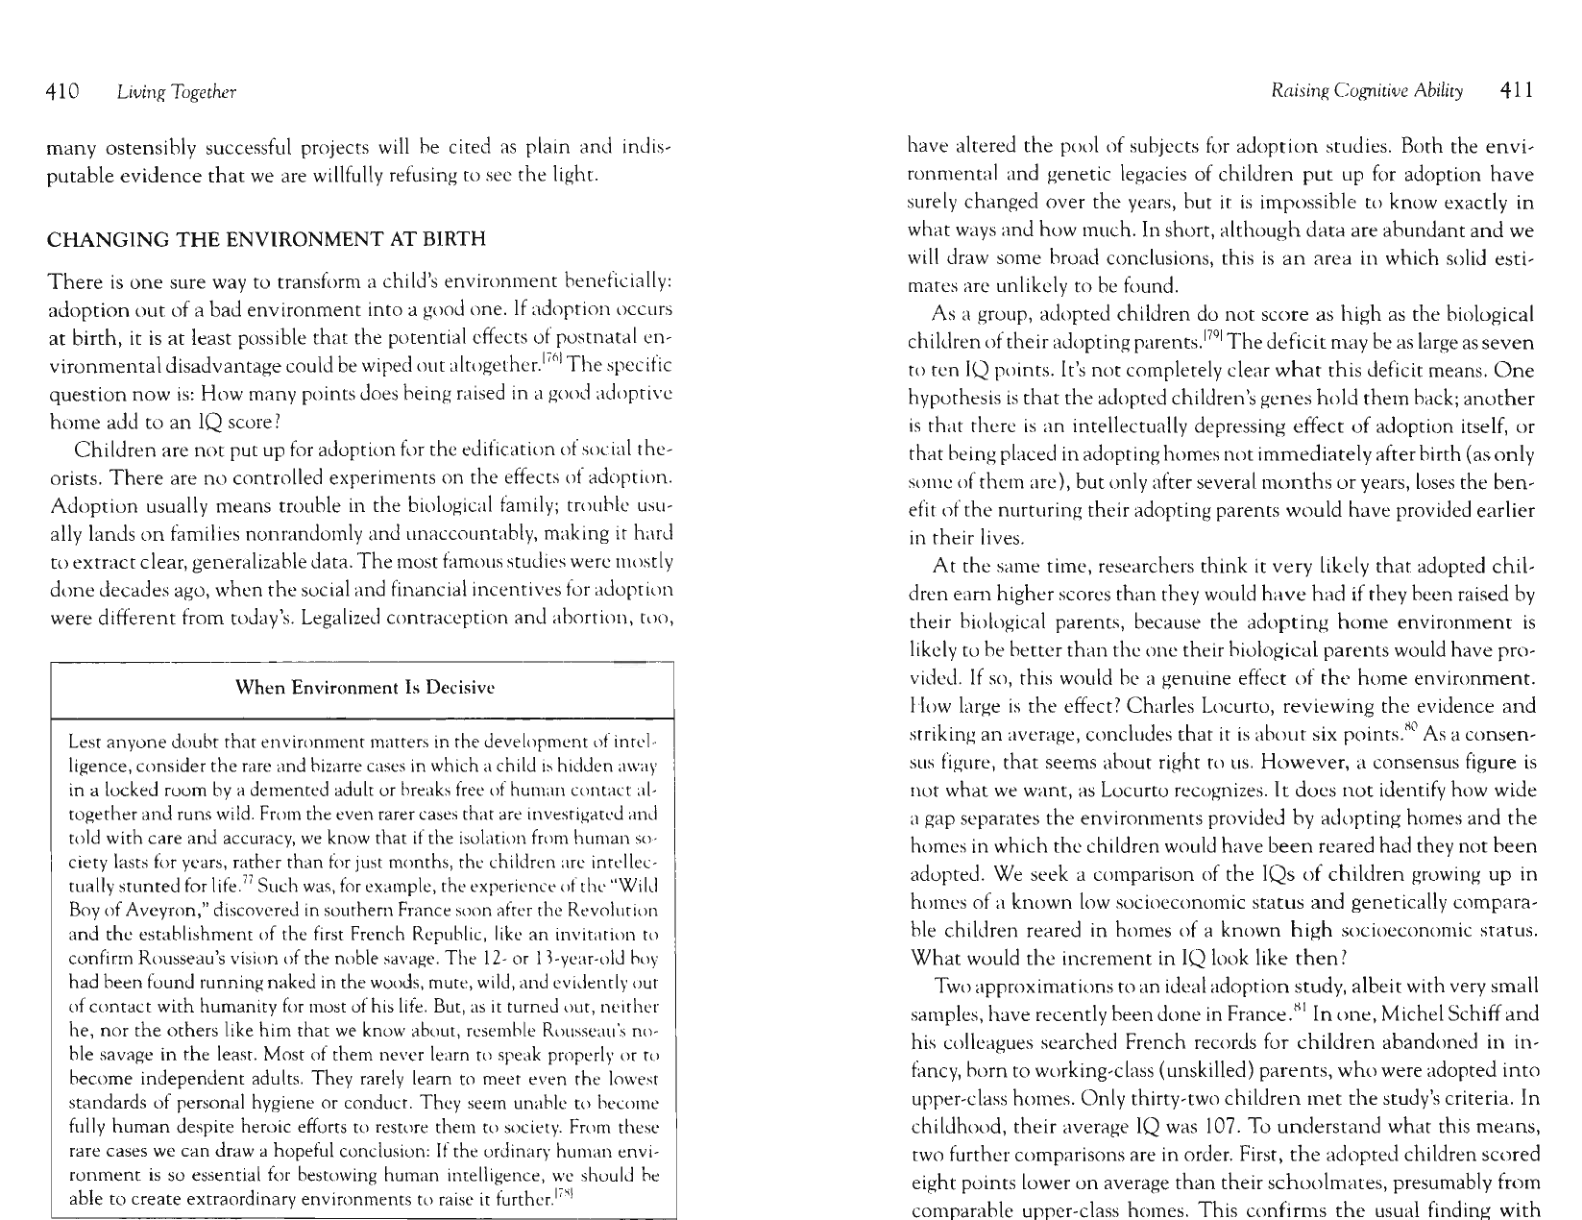
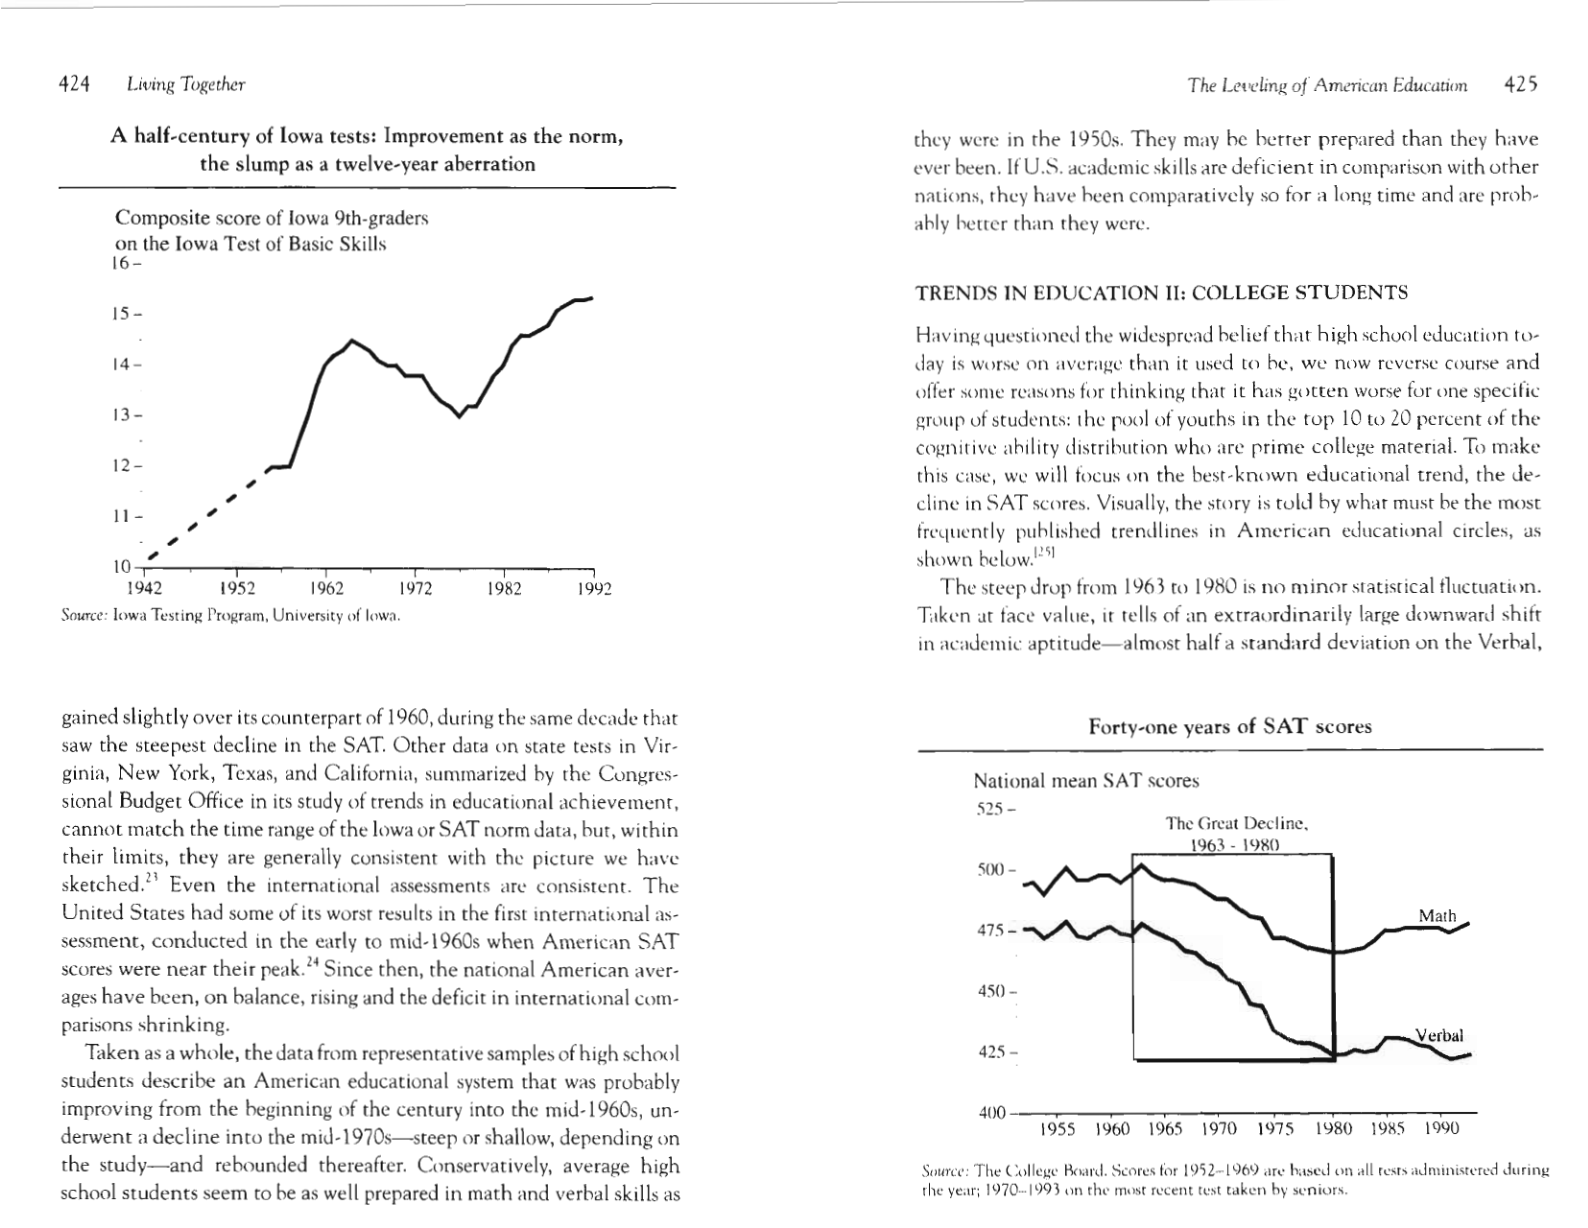
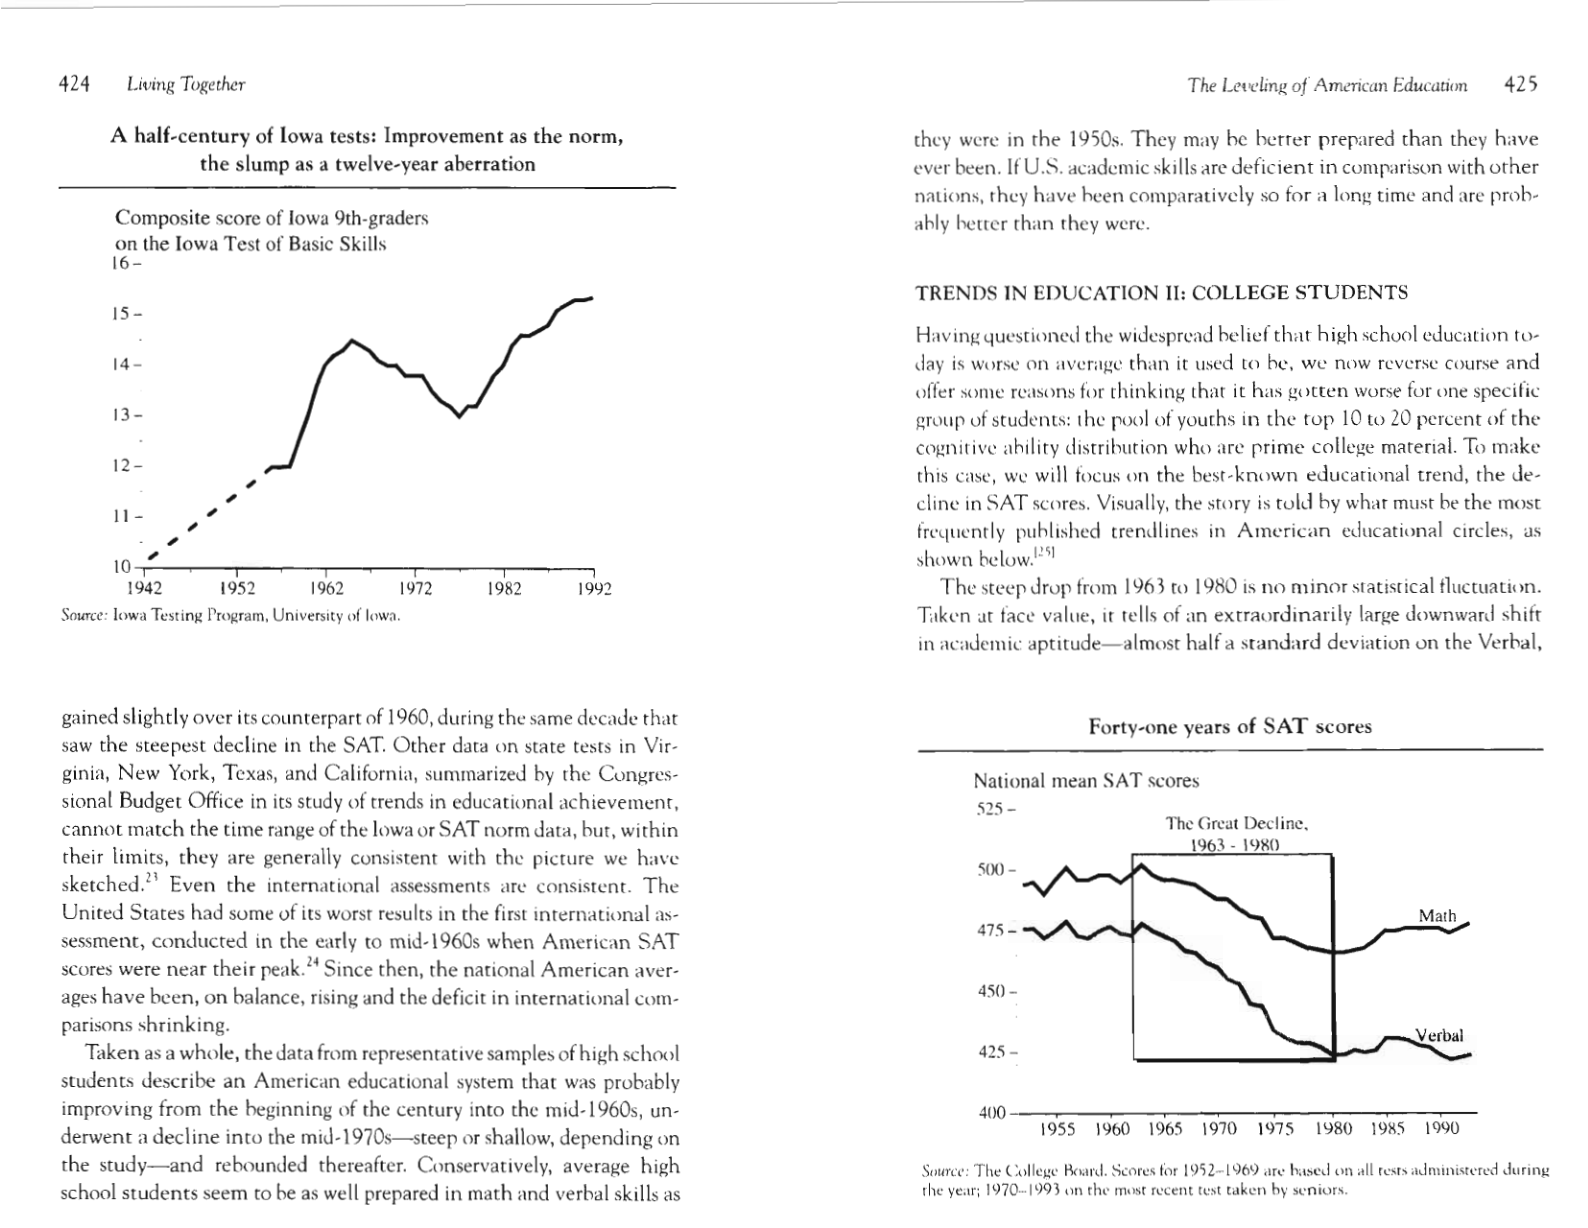
A half-century of Iowa tests: Improvement as the norm, the slump as a
twelve-year aberration 424
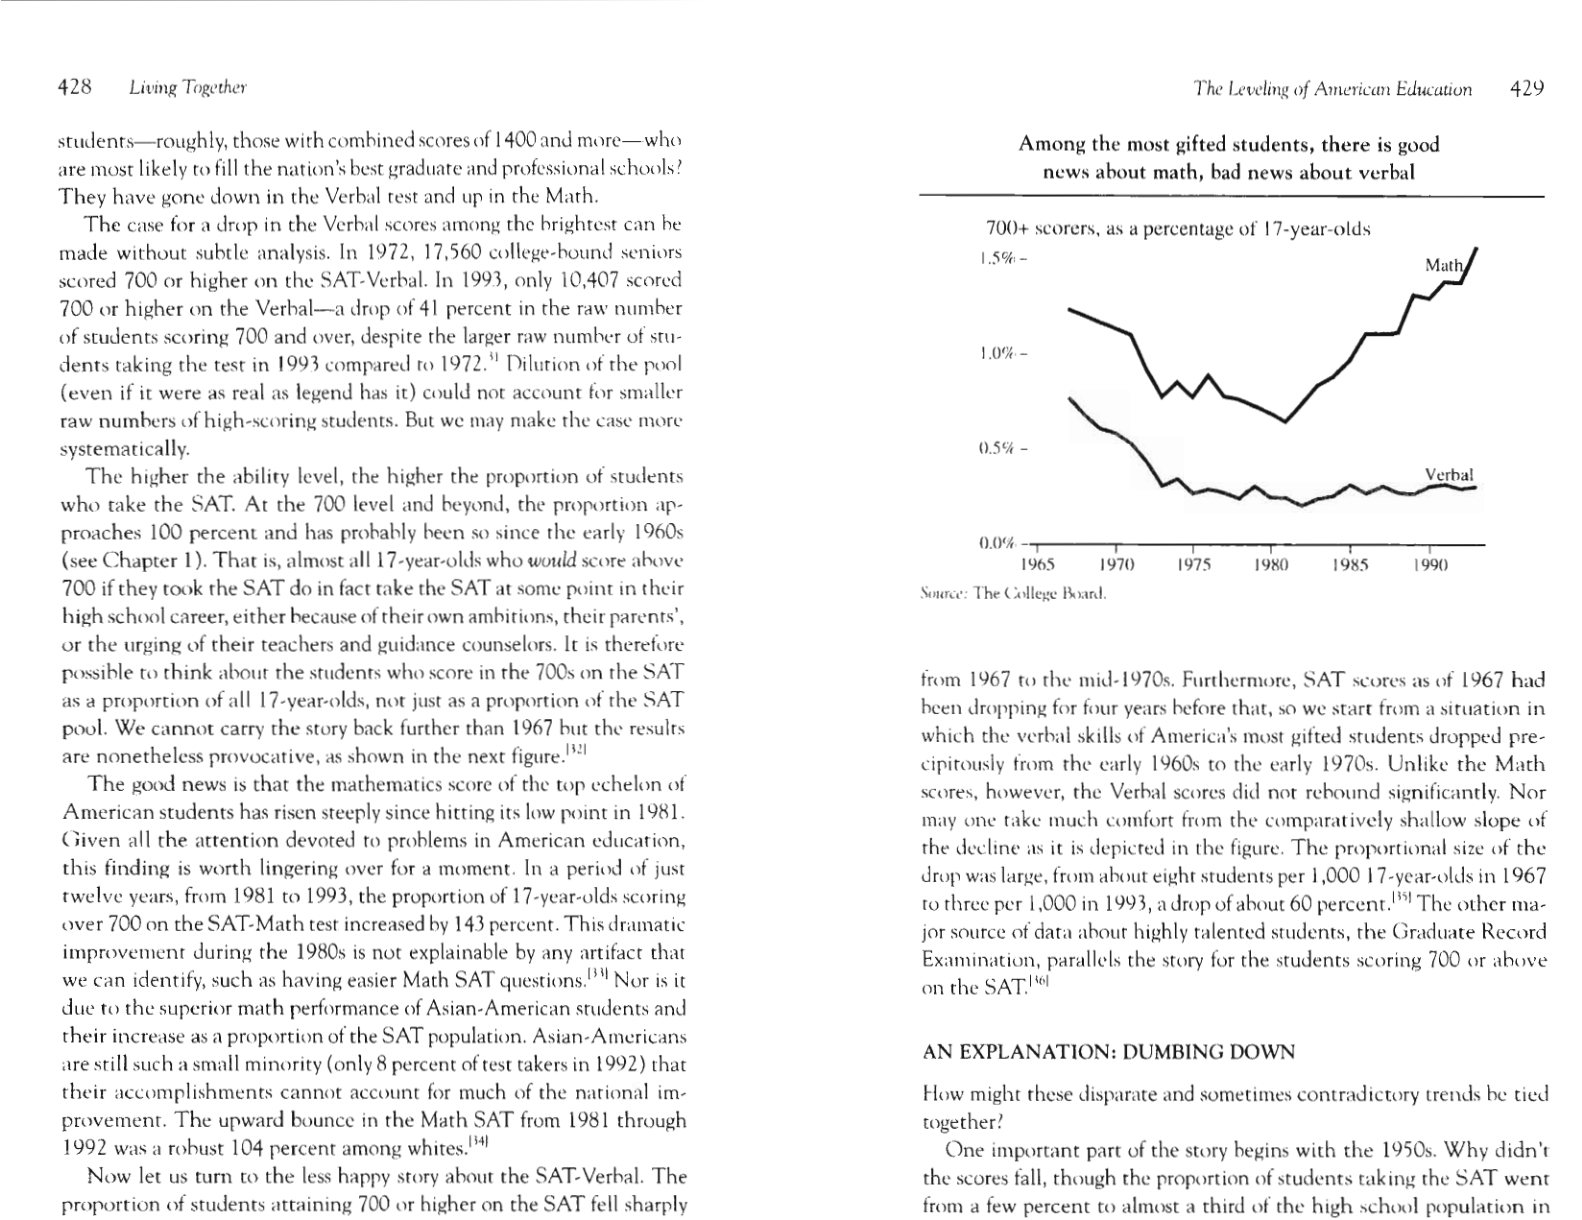
Forty-one years of SAT scores 425
,
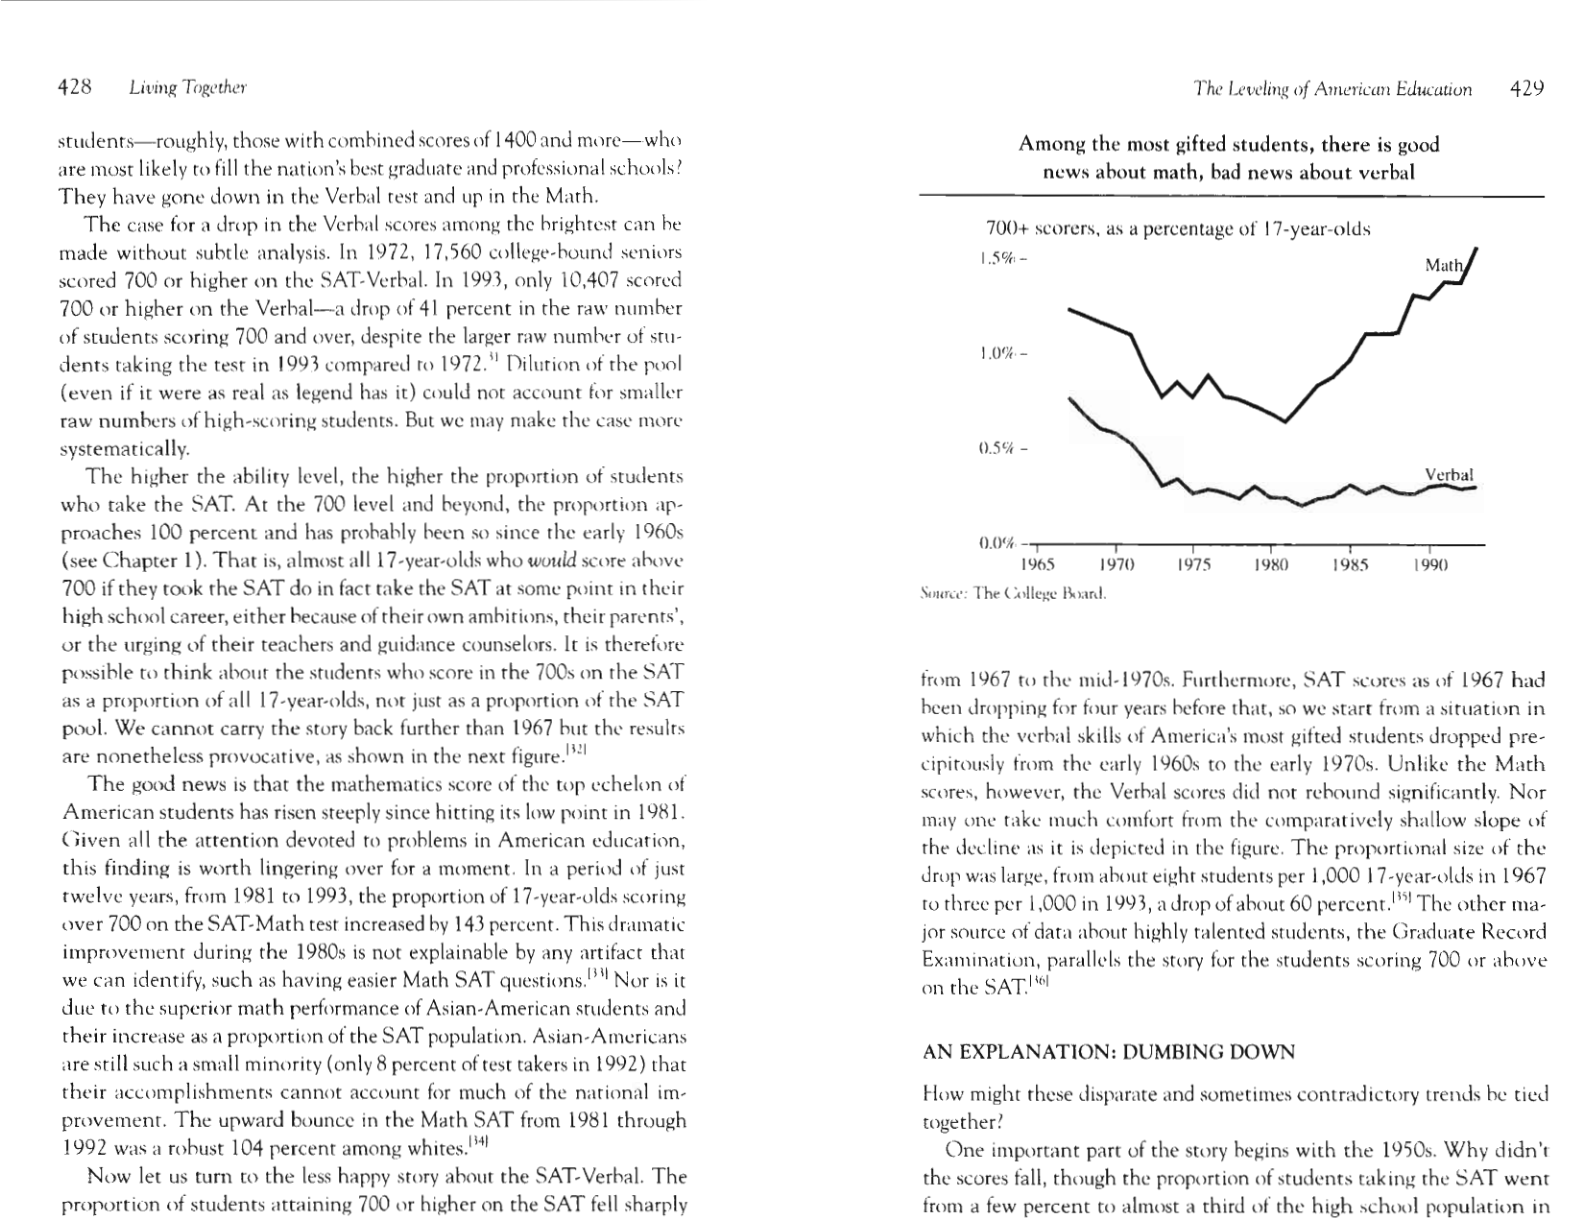
Atnong the most gifted students, there is good news about math, bad
news about verbal 429
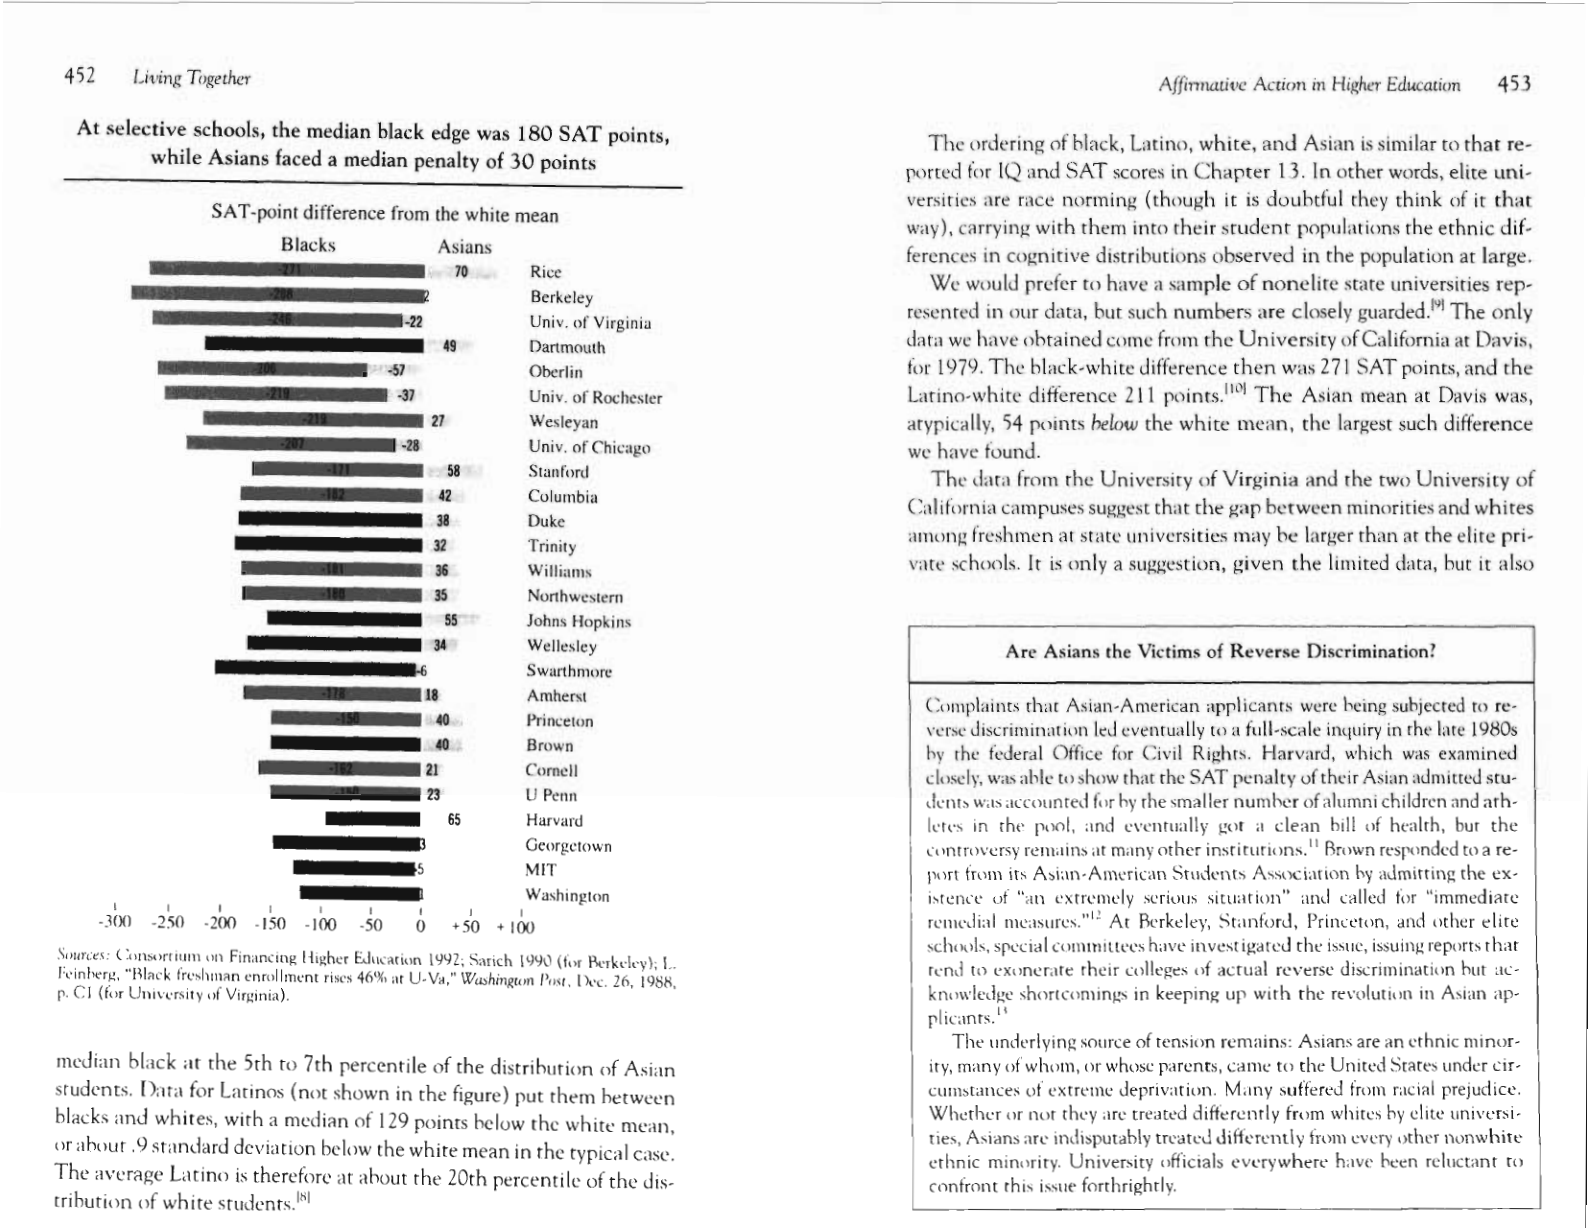
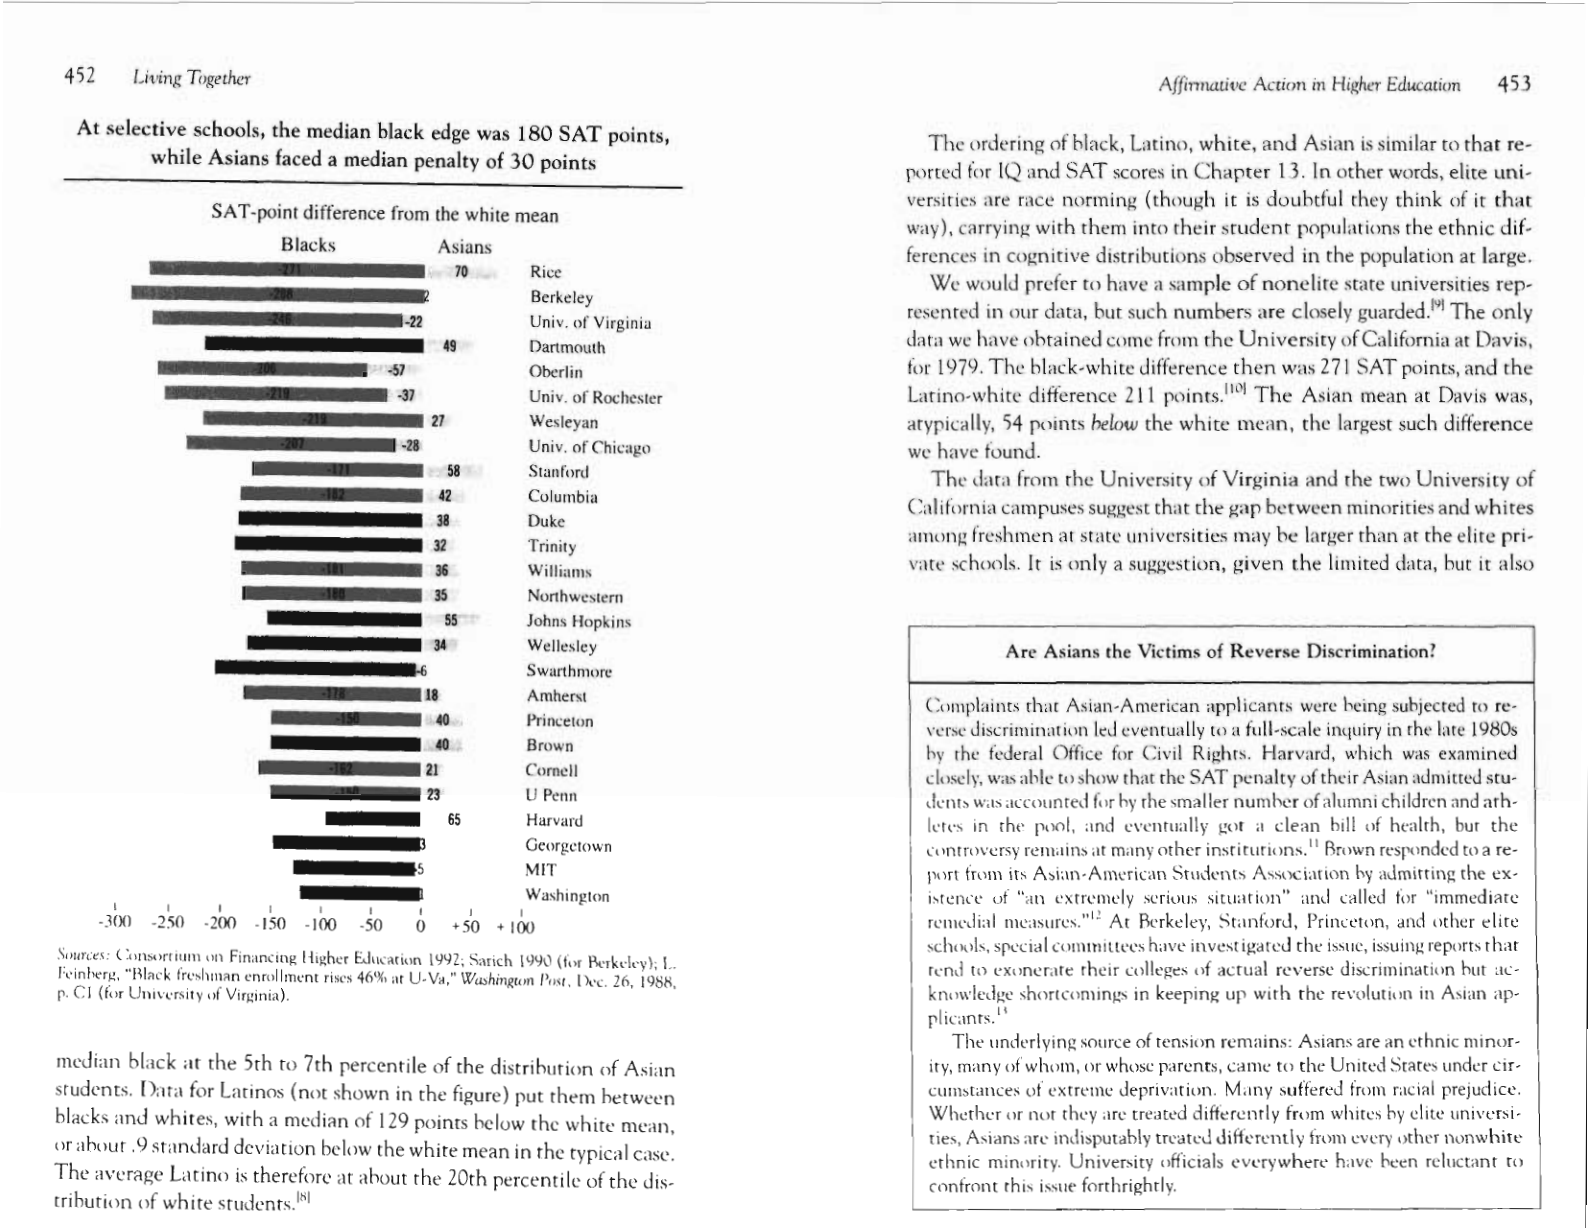
At selective schools, the median black edge was 180 SAT points, while
Asians faced a median penalty of 30 points 452
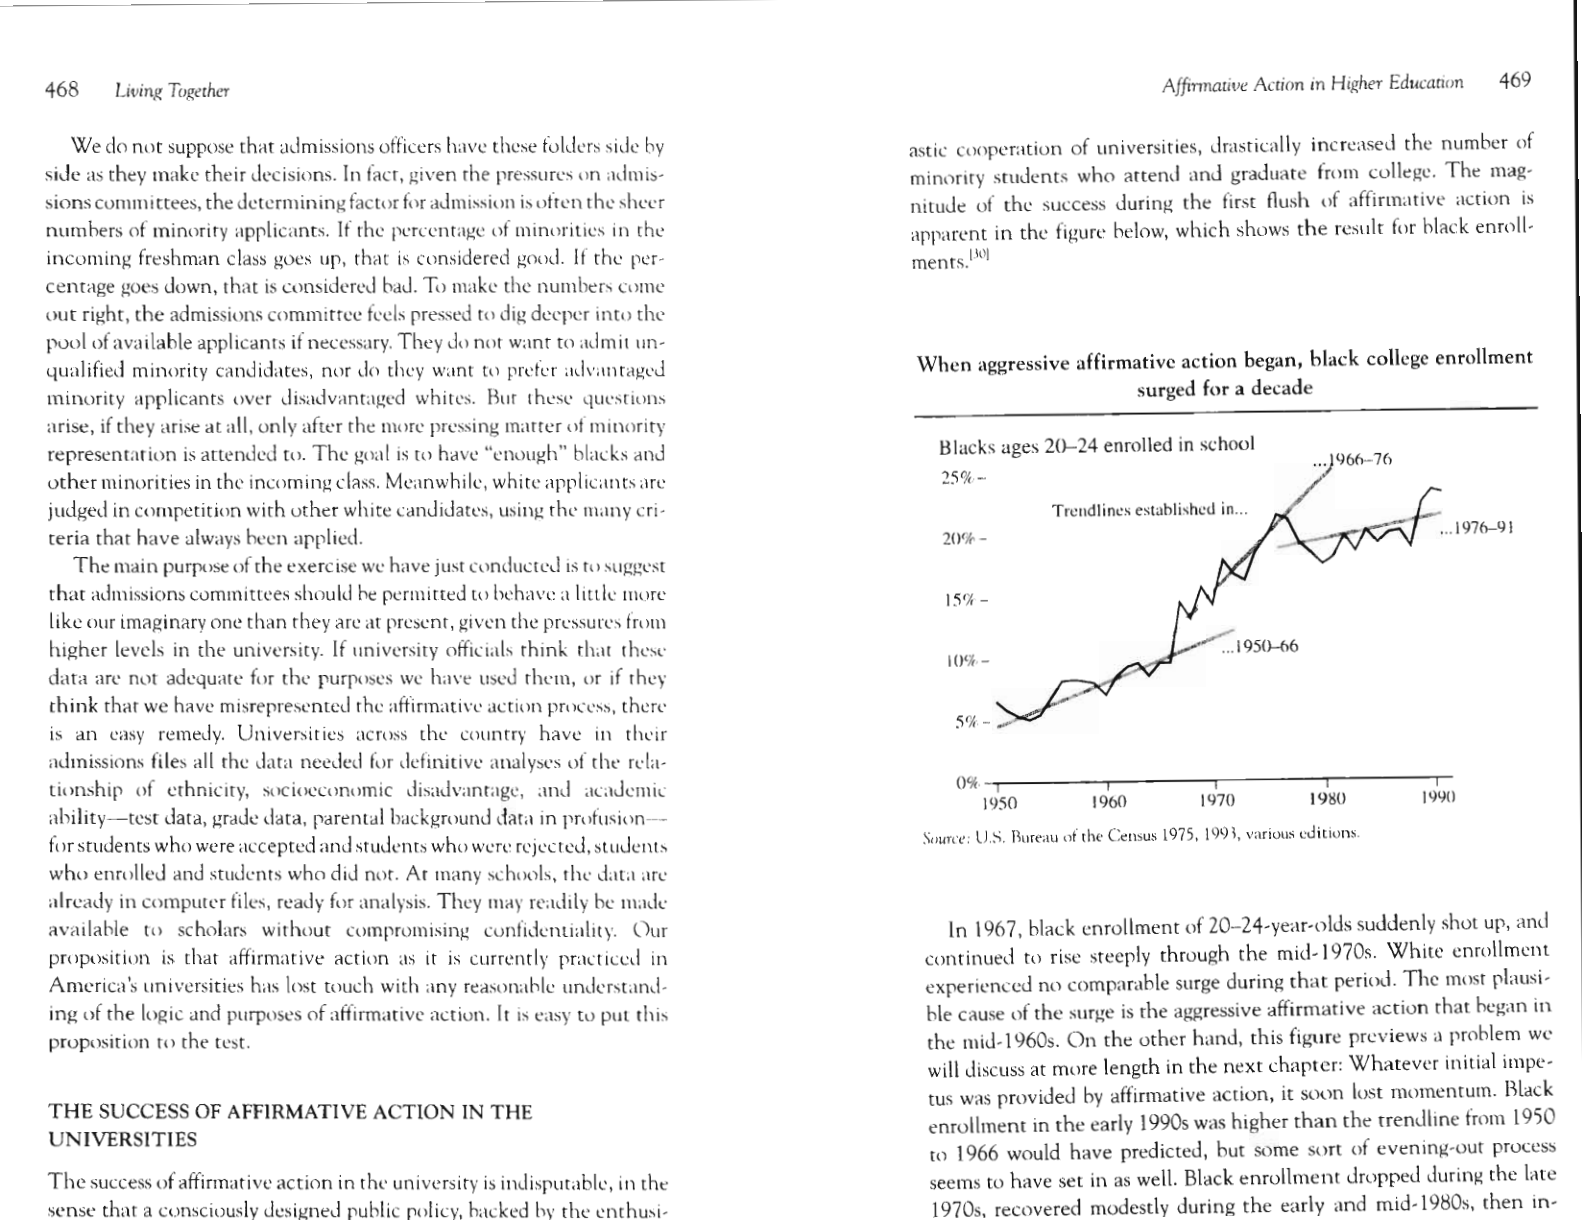
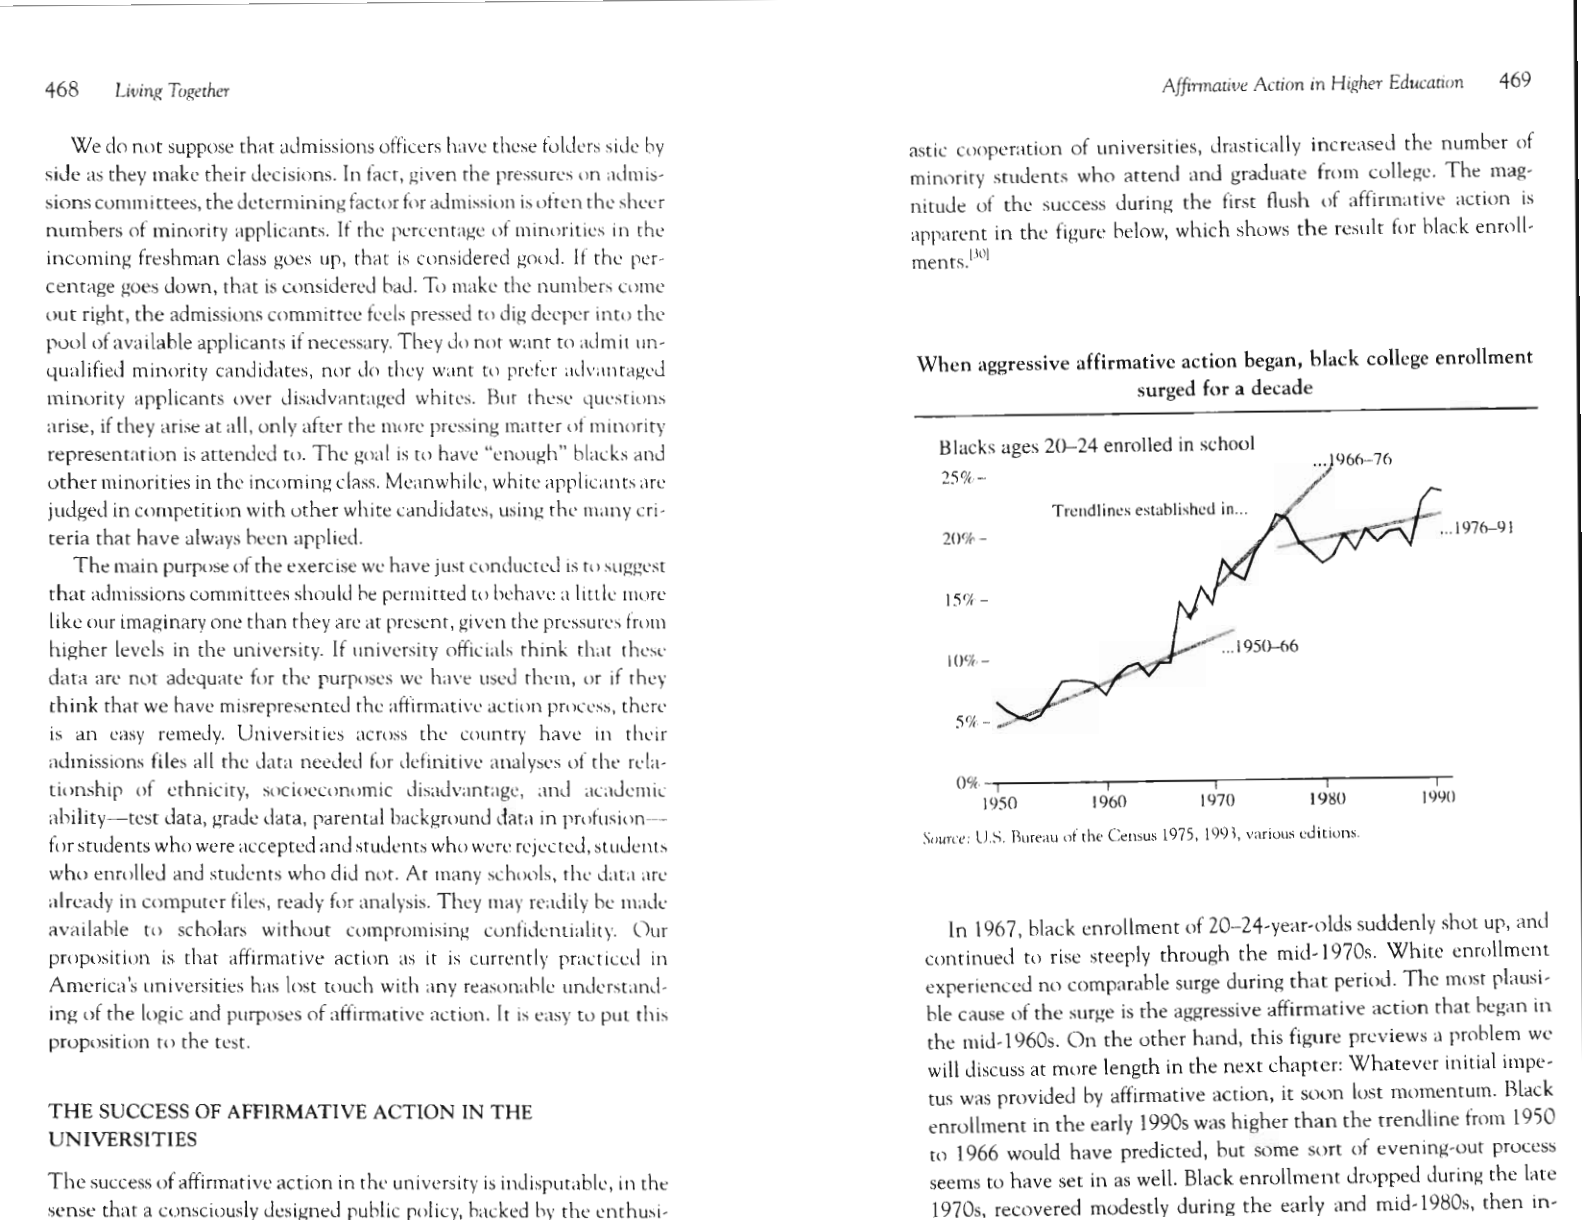
When aggressive affirmative action began, black college enrollment
surged for a decade 469
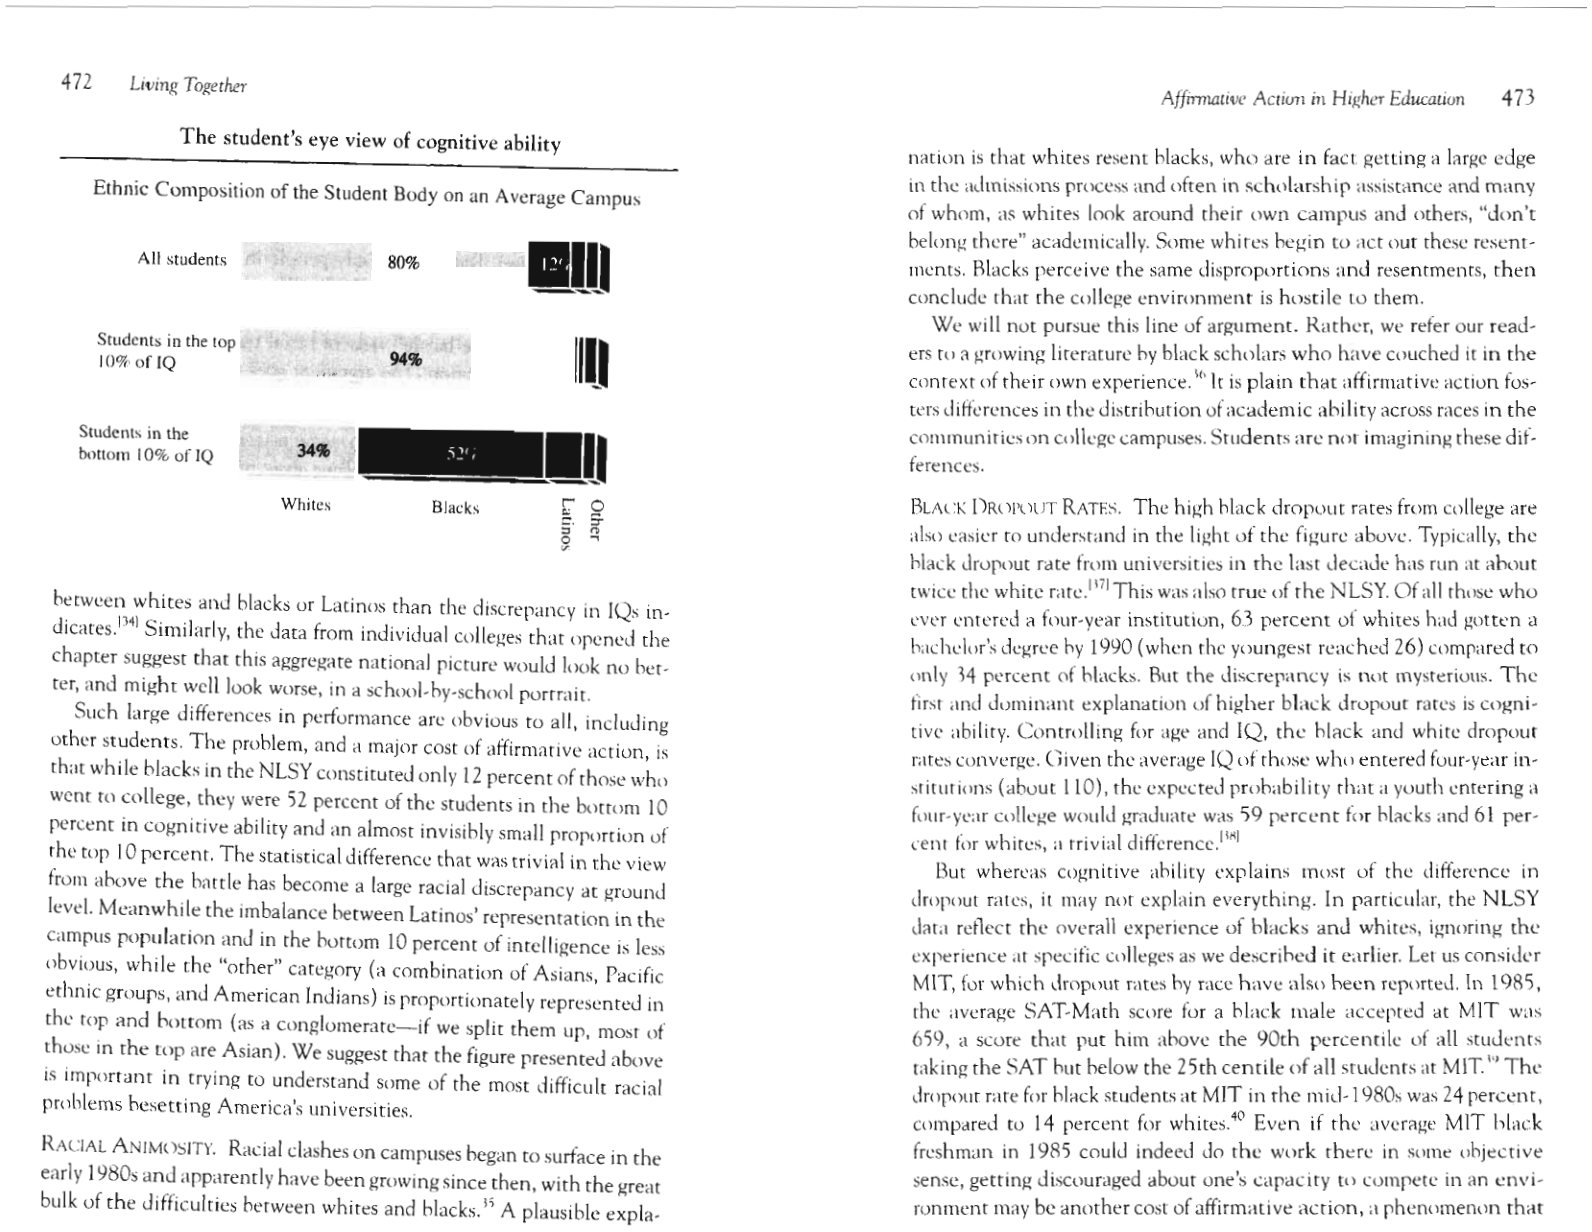
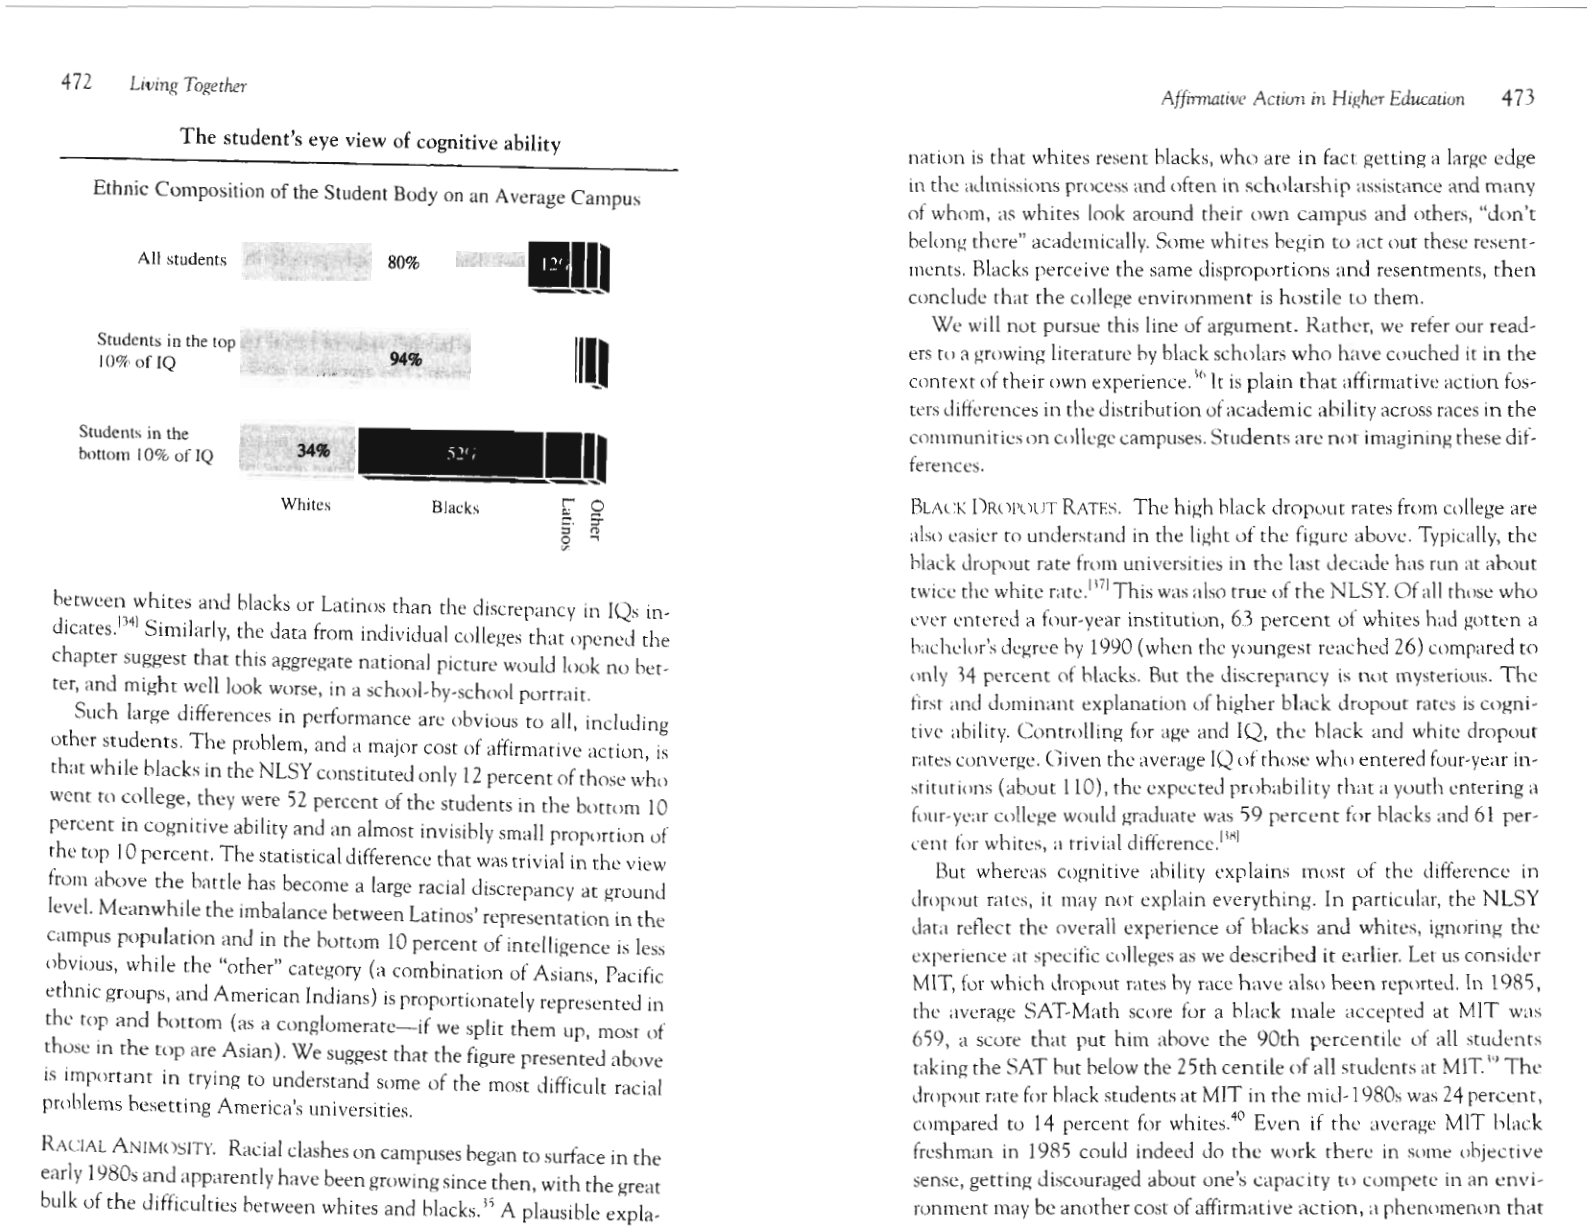
The student's-eye-view of cognitive ability 472
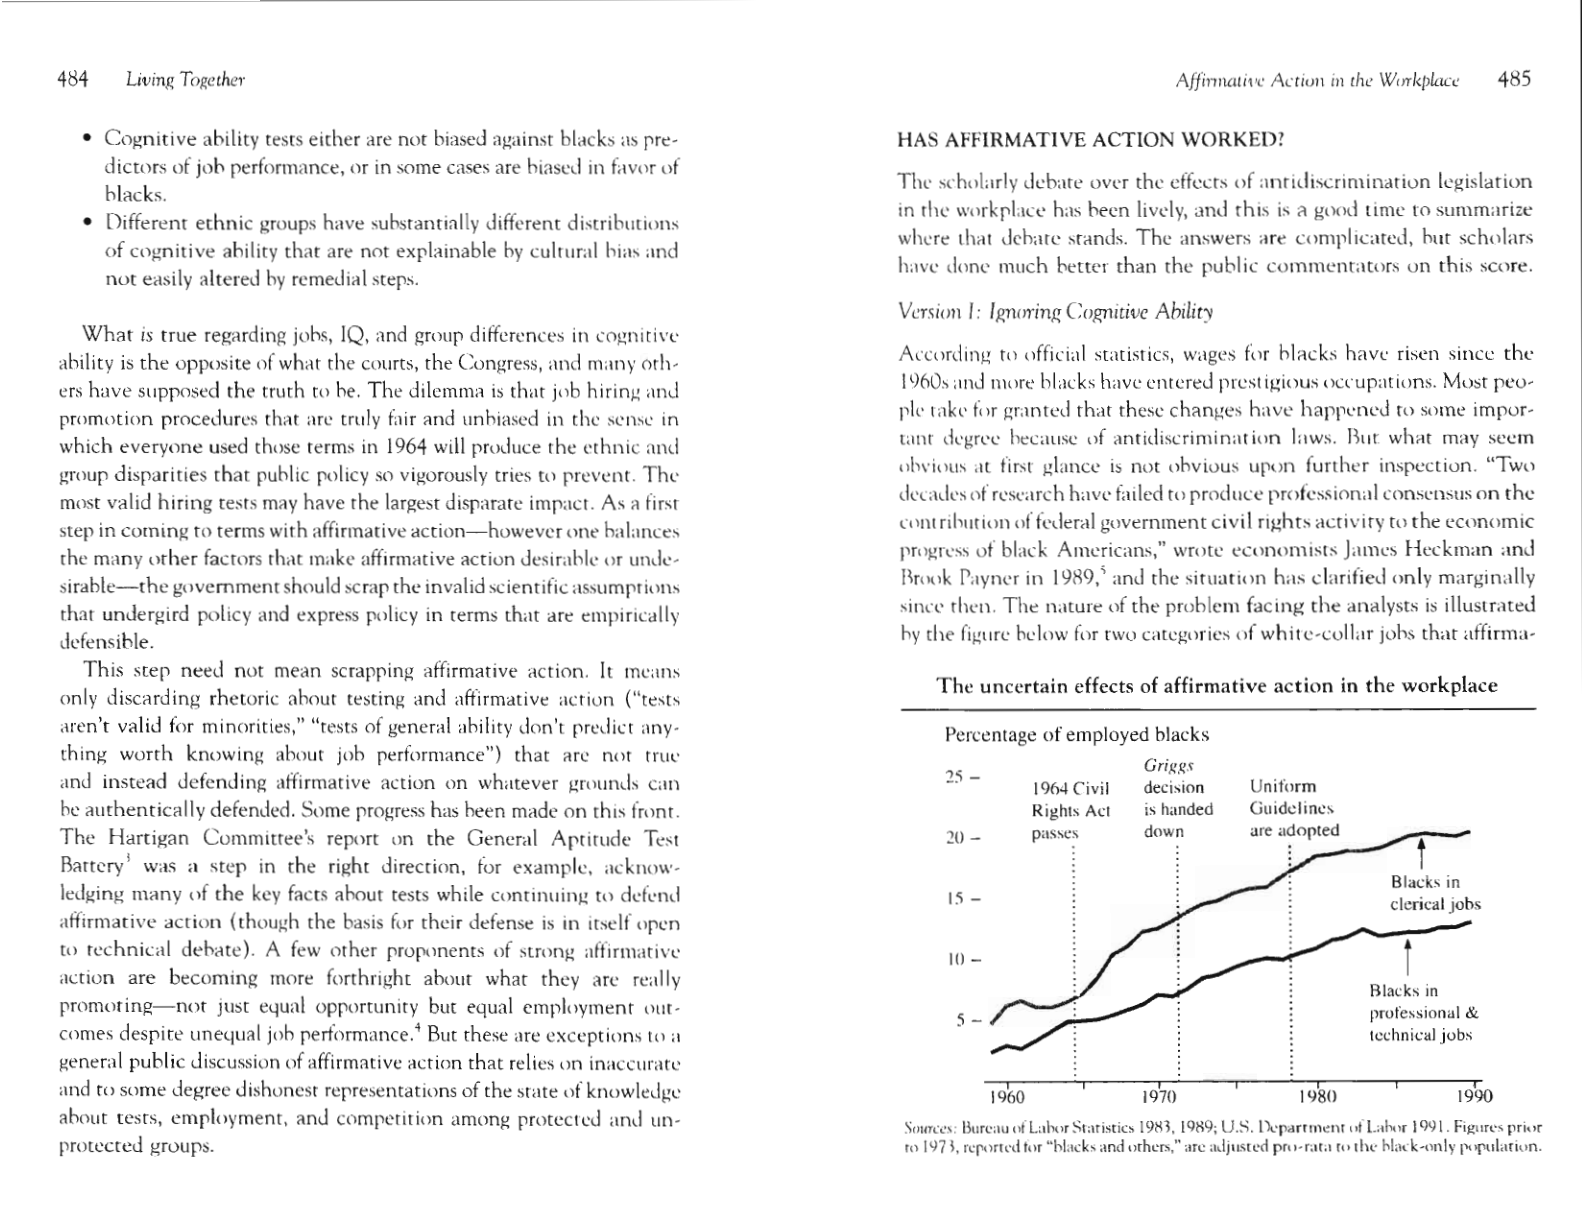
The uncertain effects of affirmative action in the workplace 485
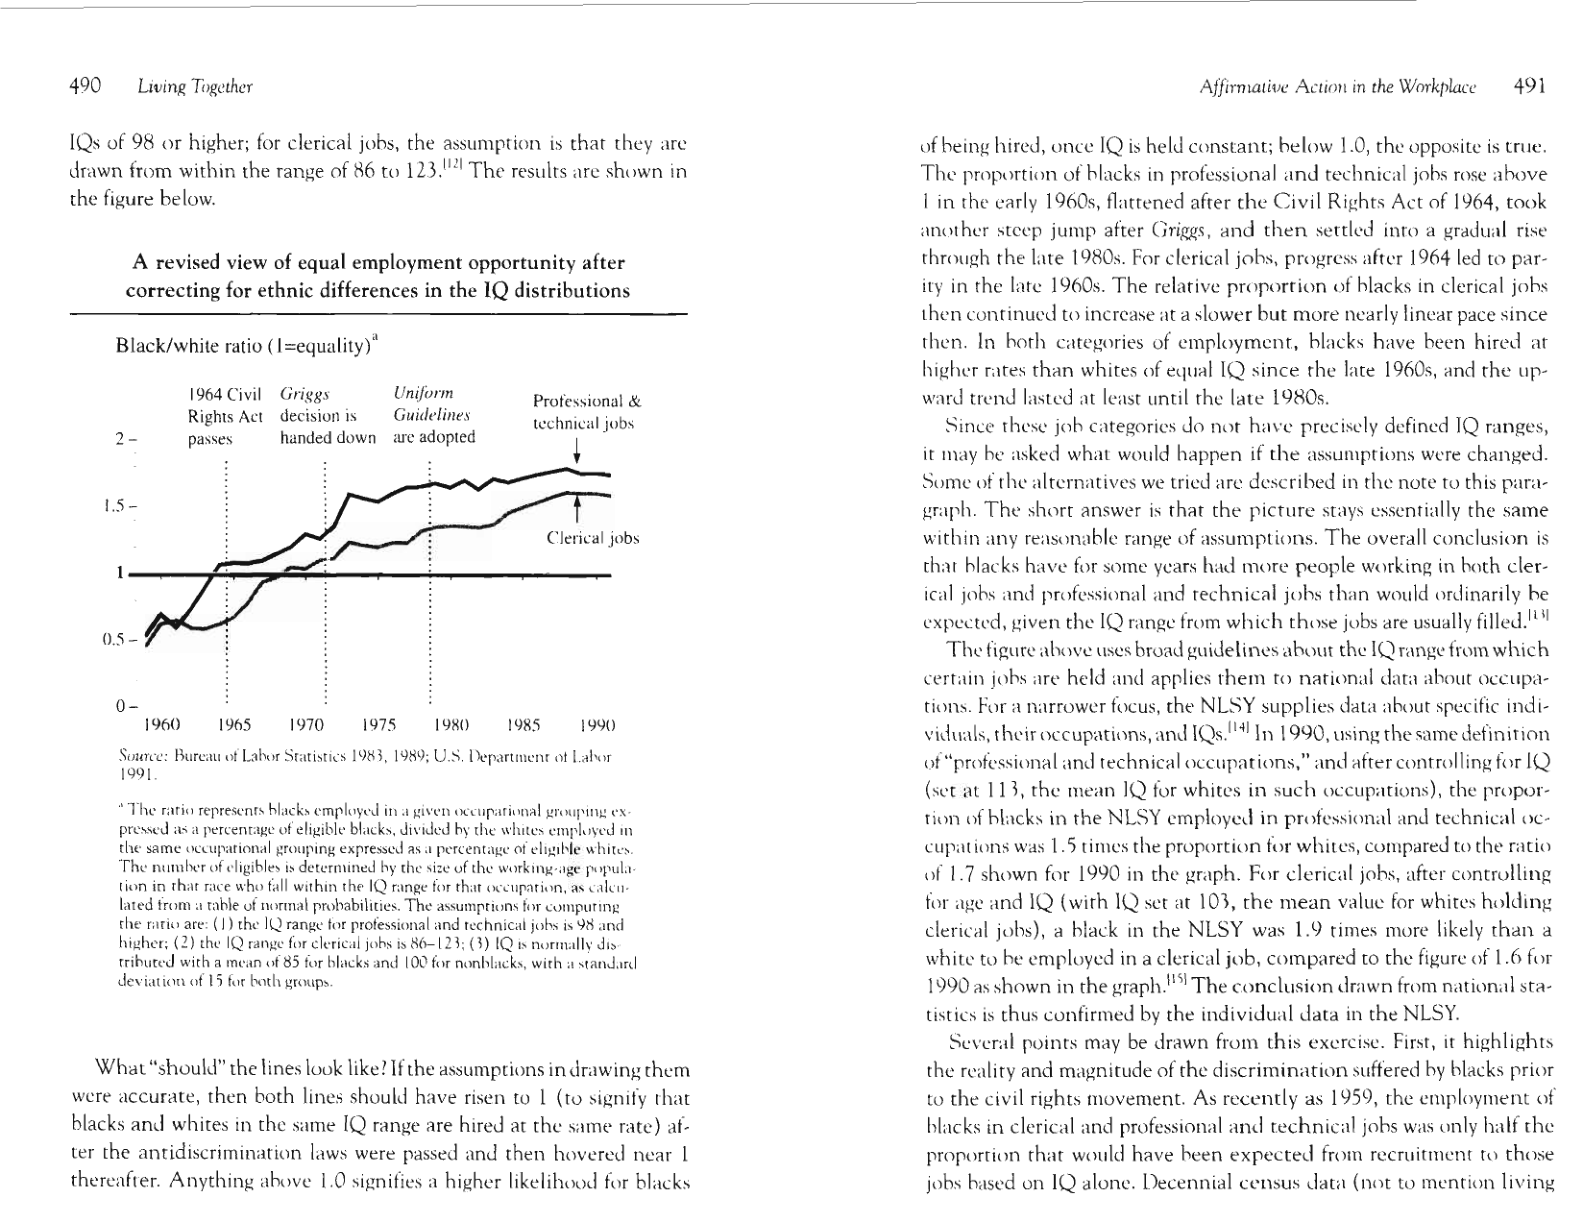
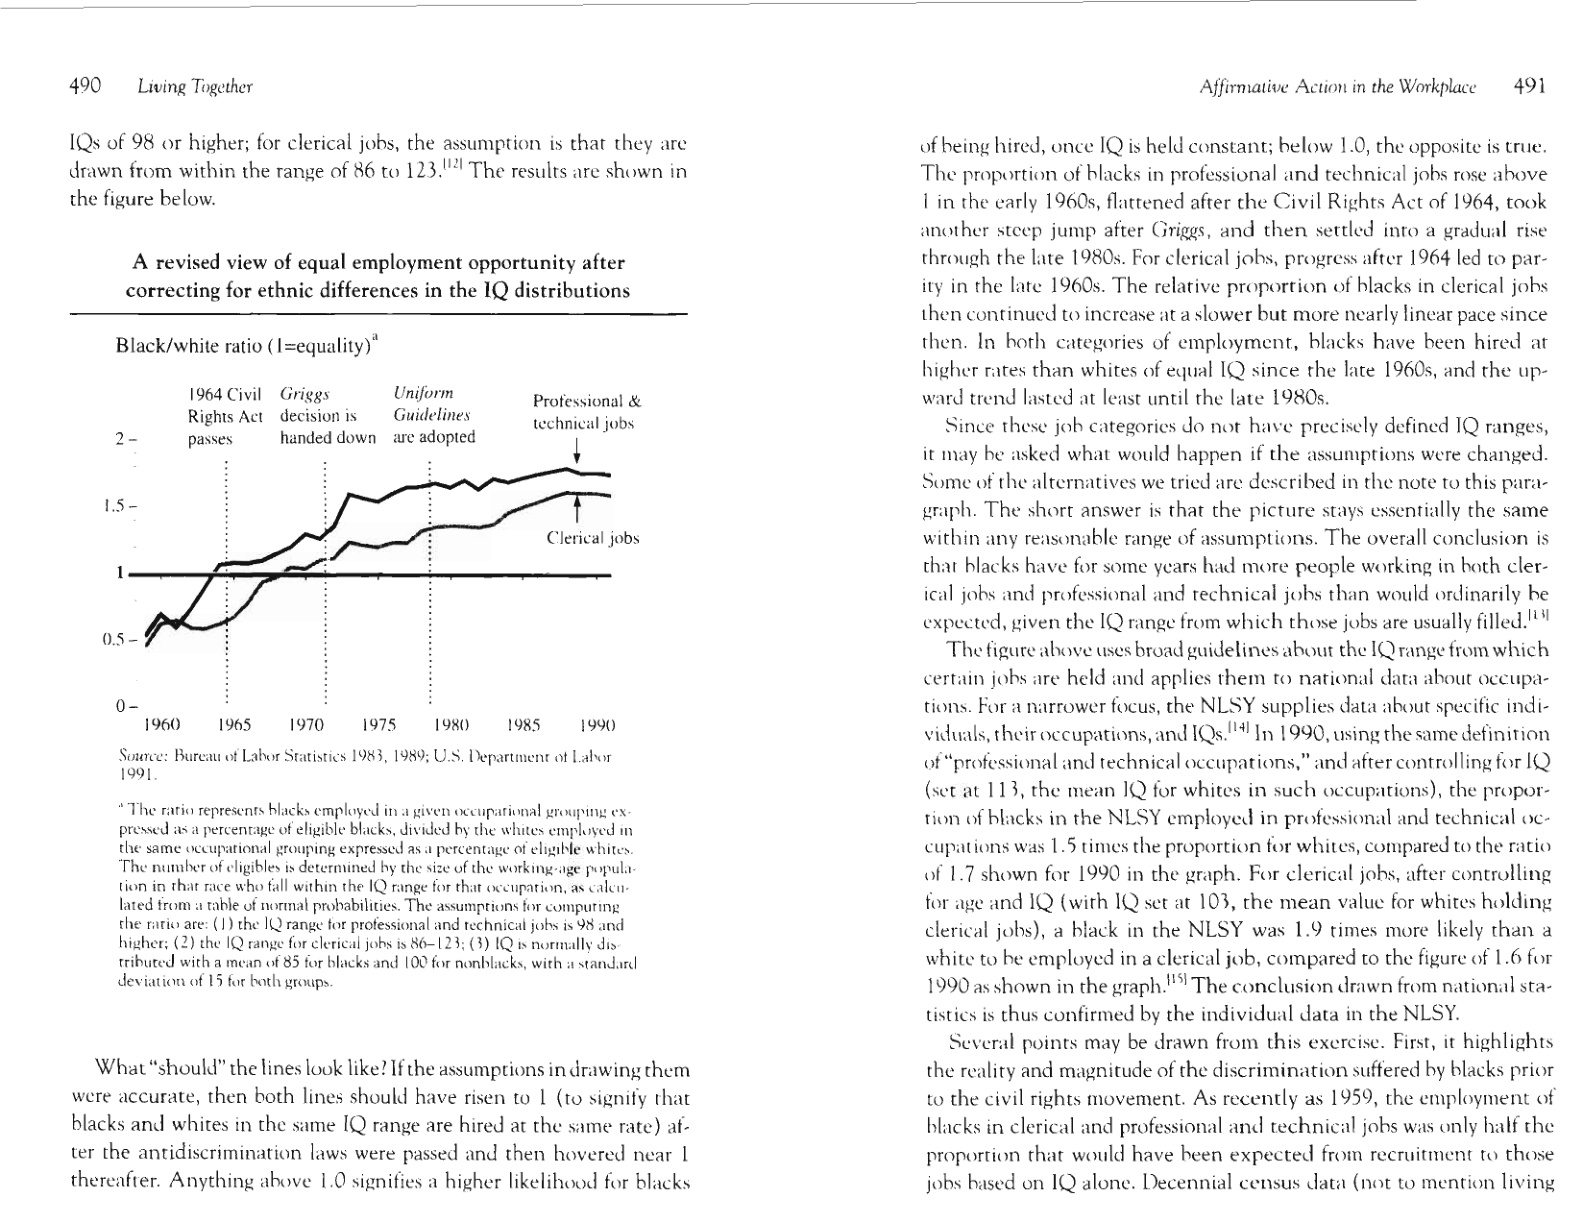
A revised view of equal employment opportunity after correcting for
ethnic differences in the IQ distributions 490
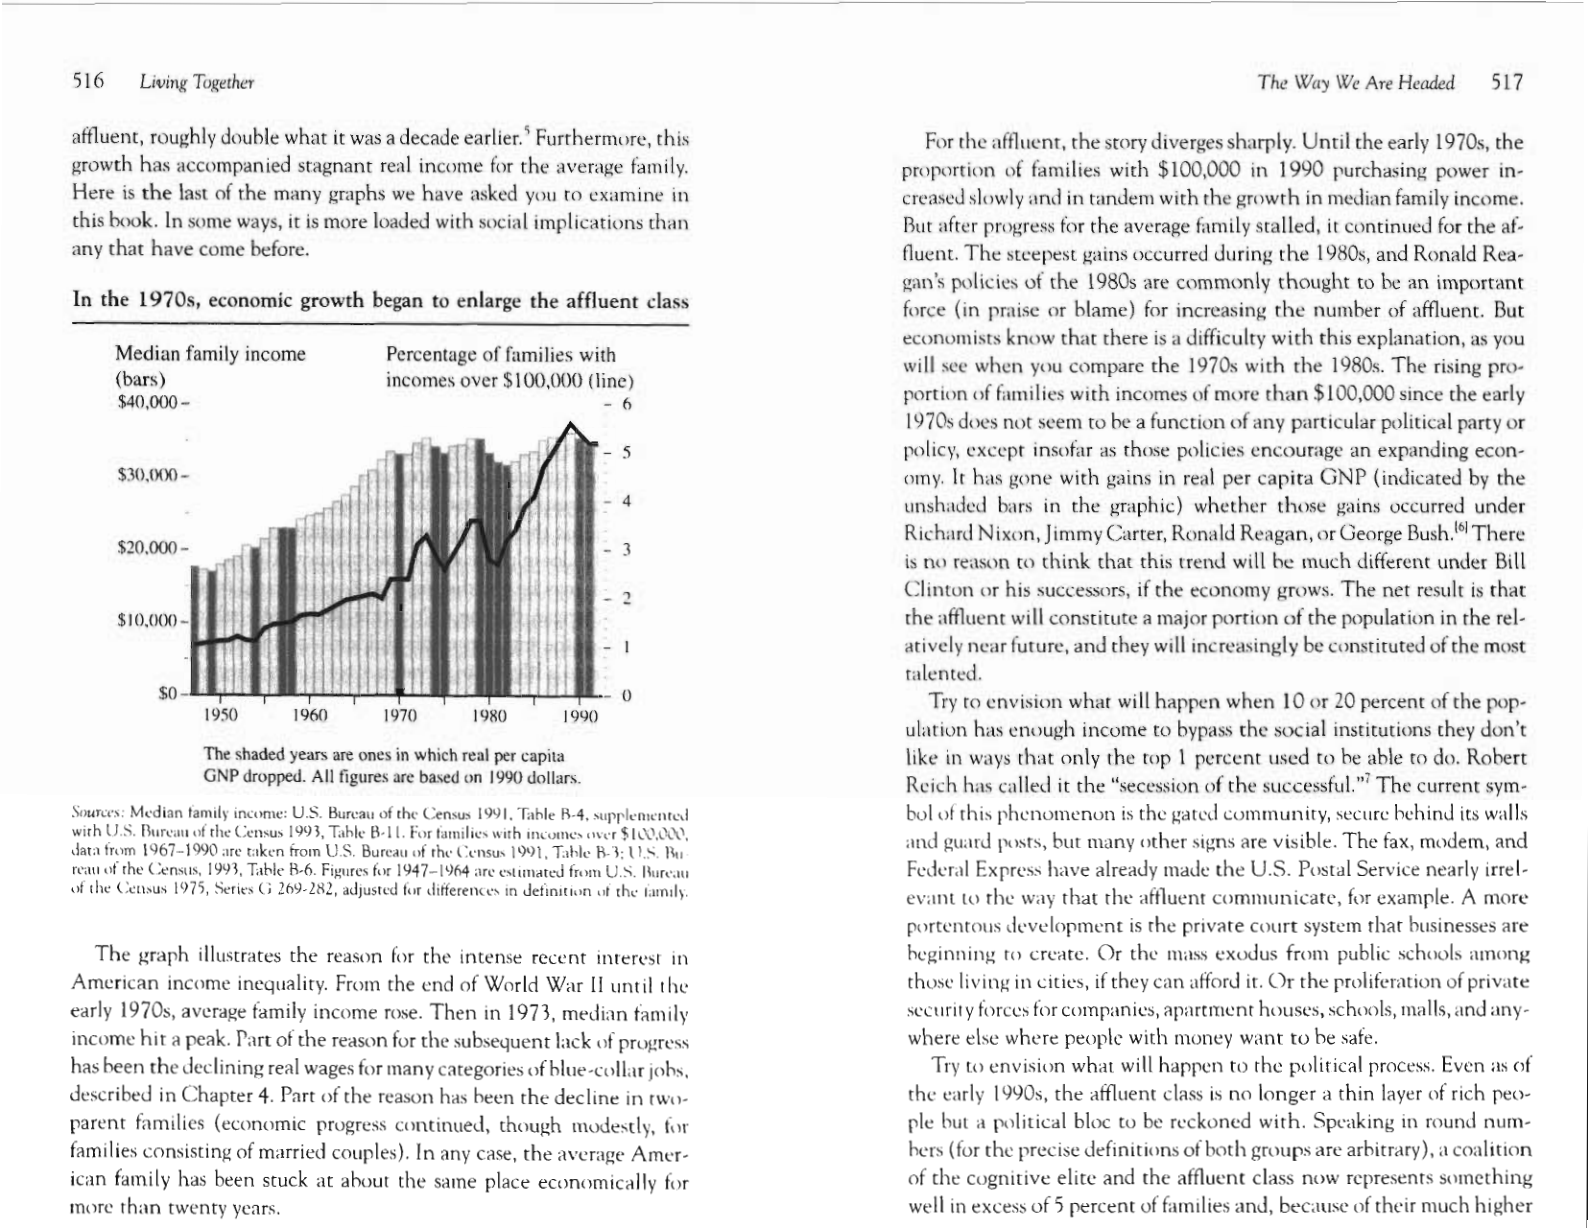
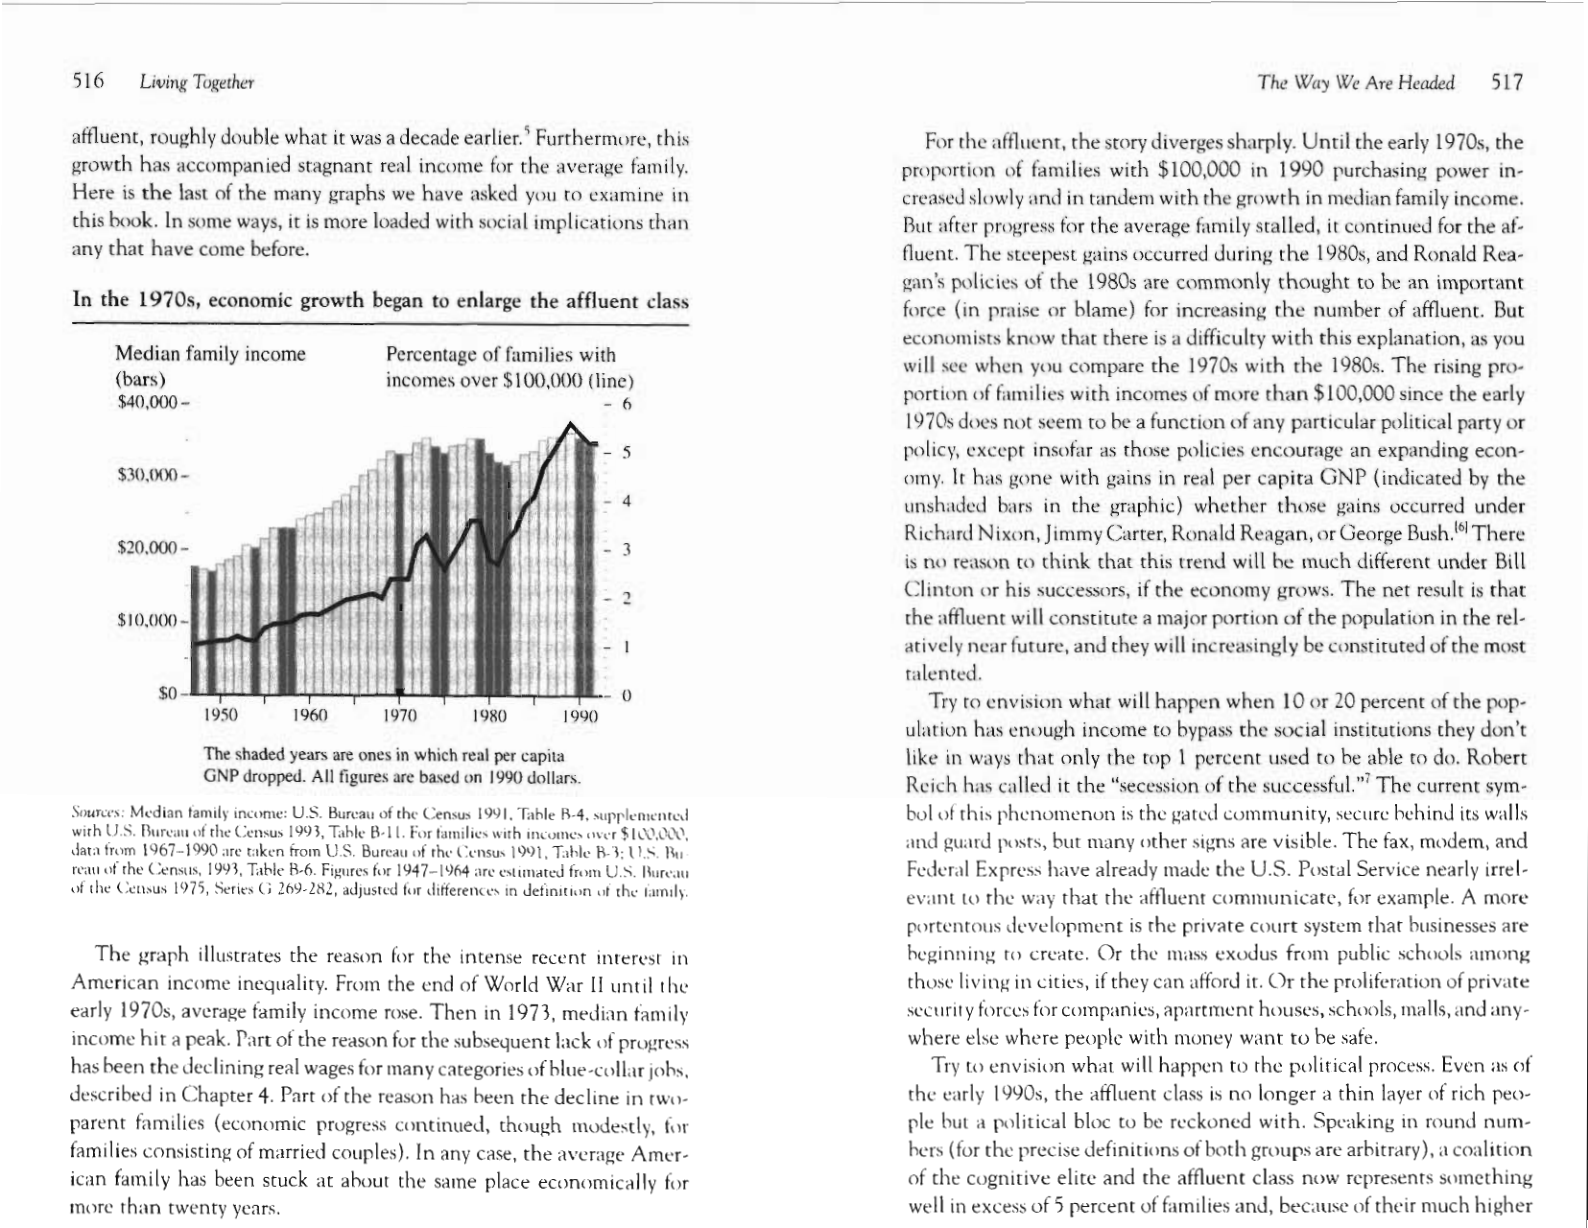
In the 1970s, economic growth began to enlarge the affluent class 5 16
Structure and Scope of The Bell Curve
- The text outlines a detailed table of contents focusing on the intersection of cognitive ability, socioeconomic status, and ethnic differences.
- It provides a comprehensive list of tables analyzing white poverty, criminality, and family structure through the lens of 'cognitive class.'
- The document addresses the historical impact of affirmative action on college enrollment and workplace dynamics during the 1970s and 1980s.
- A significant portion of the data compares IQ distributions and test scores across different generations and ethnic groups.
- The authors explain that the book is designed for multiple reading levels, ranging from a thirty-page summary of findings to a highly technical main text.
- The methodology relies heavily on data from the National Longitudinal Survey of Youth (NLSY) to correlate IQ with social outcomes like welfare and job performance.
At the simplest level, it is only about thirty pages long.
xiv
List of Illustrations
Controlling for IQ cuts the ethnic disparity in home environments by
half for blacks and more than 60 percent for Latinos
335
Controlling for IQ more than eliminates overall ethnic differences in
the developmental indexes 336
Based on national norms, high percentages of minority children remain
in the bottom decile of IQ after controlling for the mother's IQ
337
Controlling for IQ cuts the black-white difference in incarceration by
almost three-quarters 338
The MCV Index, before and after controlling for IQ
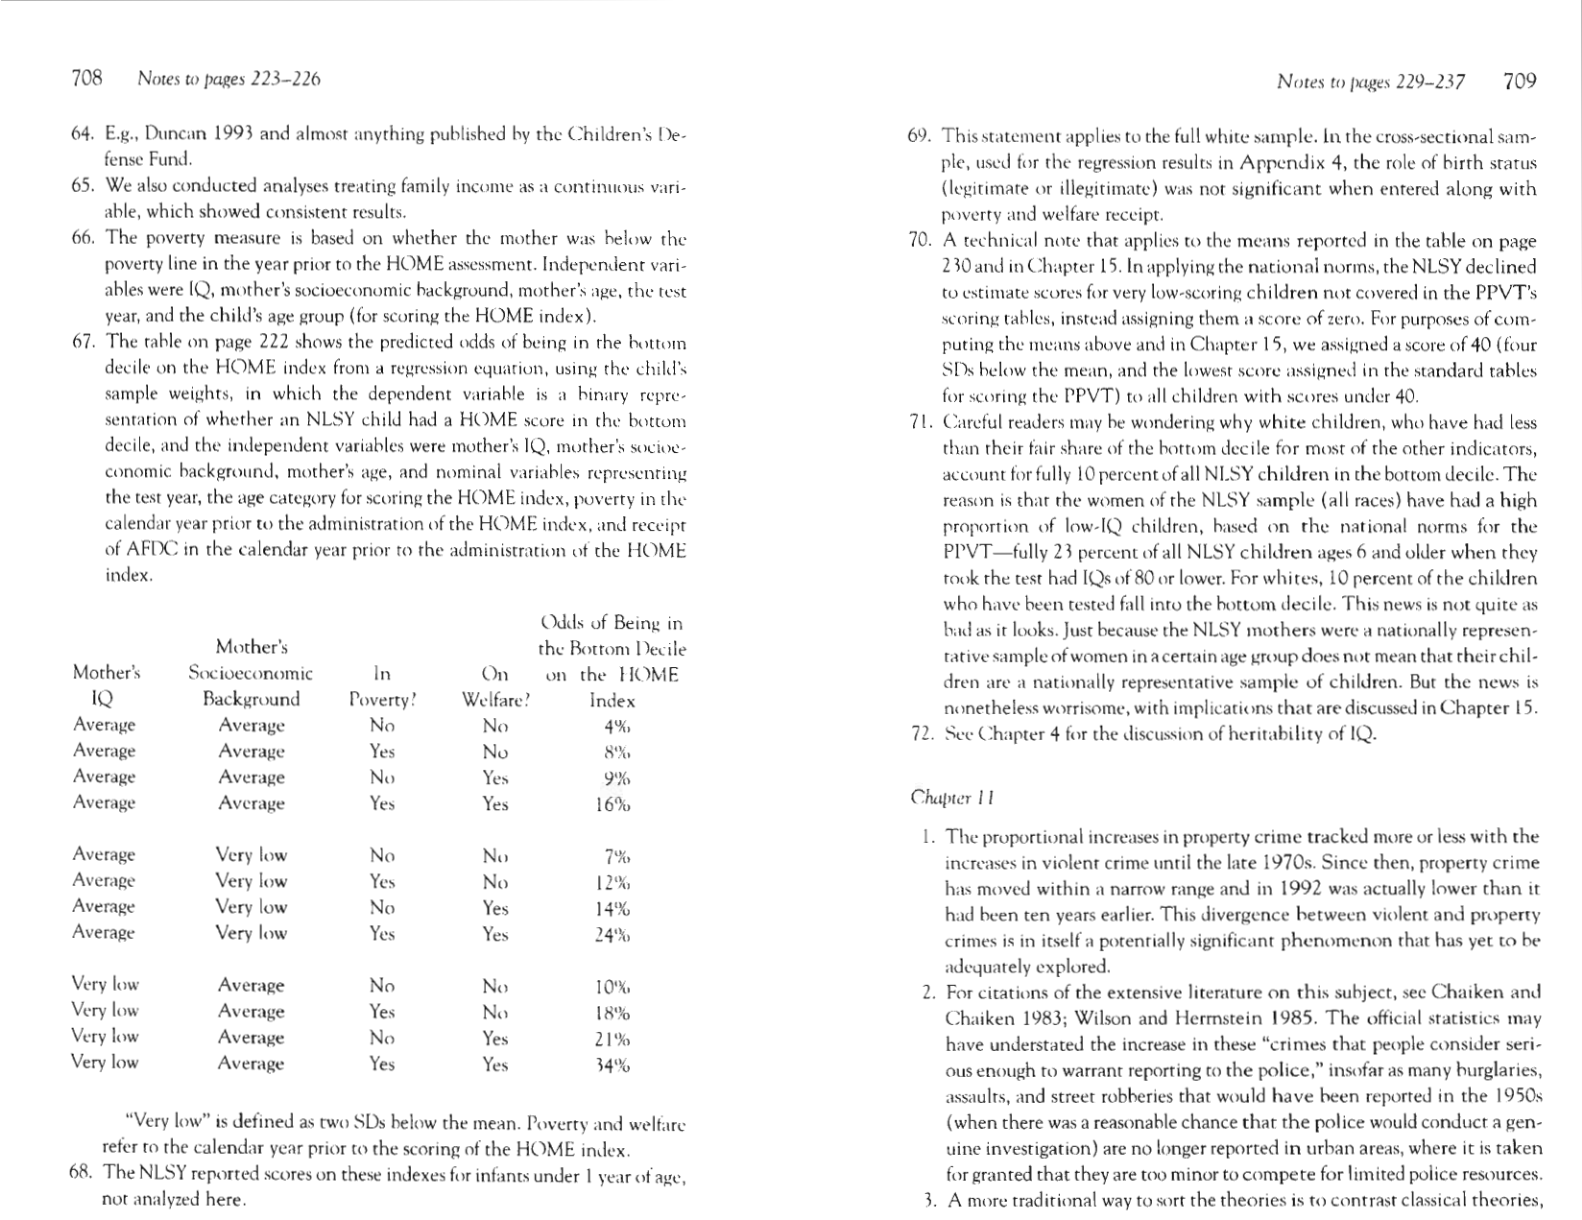
339
The higher the education, the fewer the babies 349
Fertility falls as educational level rises in similar fashion for black, white,
and Latino women 353
The swing in social problems that can result from small shifts in the
mean IQ of a population 368
Fortyeight percent of the poor in 1989 came from the bottom 20 per-
cent in intelligence 370
Two-thirds of high school dropouts came from the hottom 20 percent
in intelligence
372
Seventeen percent of the men who worked year-round in 1989 were in
the bottom 20 percent of intelligence 373
Sixty-four percent of able-bodied lnen who did not work in 1989 were
in the bottom 20 percent of intelligence 374
Twentymine percent of able-bodied men who were temporarily out of
work in 1989 were in the bottom 20 percent of intelligence
375
Sixty-two percent of men ever interviewed in jail or prison came from
the bottom 20 percent of intelligence 376
Forty-five percent of women who ever received welfare were in the hot-
tom 20 percent of intelligence 377
Fifty-seven percent of chronic welfare recipients were in the bottom 20
percent of intelligence 377
Fifty-two percent of illegitimate children were born to mothers in the
bottom 20 percent of intelligence 378
Thirty-one percent of children living with divorced or separatecl moth-
ers had mothers with IQs in the bottom 20 percent of intelligence 379
Forty-five percent of low-birth-weight babies had mothers in the bot-
tom 20 percent of intelligence 381
Fifty-six percent of all children from the bottom decile in home
environment were born to mothers in the bottom 20 percent of in-
telligence 382
List of Illusmations
xv
Sixty-three percent of children who lived in poverty throughout
the first three years had mothers in the bottom 20 percent of in-
telligence
383
Seventy-two percent of children in the bottom decile of IQ had moth-
ers in the bottom 20 percent of intelligence 384
Ten percent of people scoring "yes" on the Middle Class Values index
were in the bottom 20 percent of intelligence 385
The diminishing returns to coaching for the SAT 401
IQ gains attributable to the Consortium preschool projects 406
A half-century of Iowa tests: Improvement as the norm, the slump as a
twelve-year aberration 424
Forty-one years of SAT scores 425
,
Atnong the most gifted students, there is good news about math, bad
news about verbal 429
At selective schools, the median black edge was 180 SAT points, while
Asians faced a median penalty of 30 points 452
When aggressive affirmative action began, black college enrollment
surged for a decade 469
The student's-eye-view of cognitive ability 472
The uncertain effects of affirmative action in the workplace 485
A revised view of equal employment opportunity after correcting for
ethnic differences in the IQ distributions 490
In the 1970s, economic growth began to enlarge the affluent class 5 16
List of Tables
Overlap Across the Educational Partitions 49
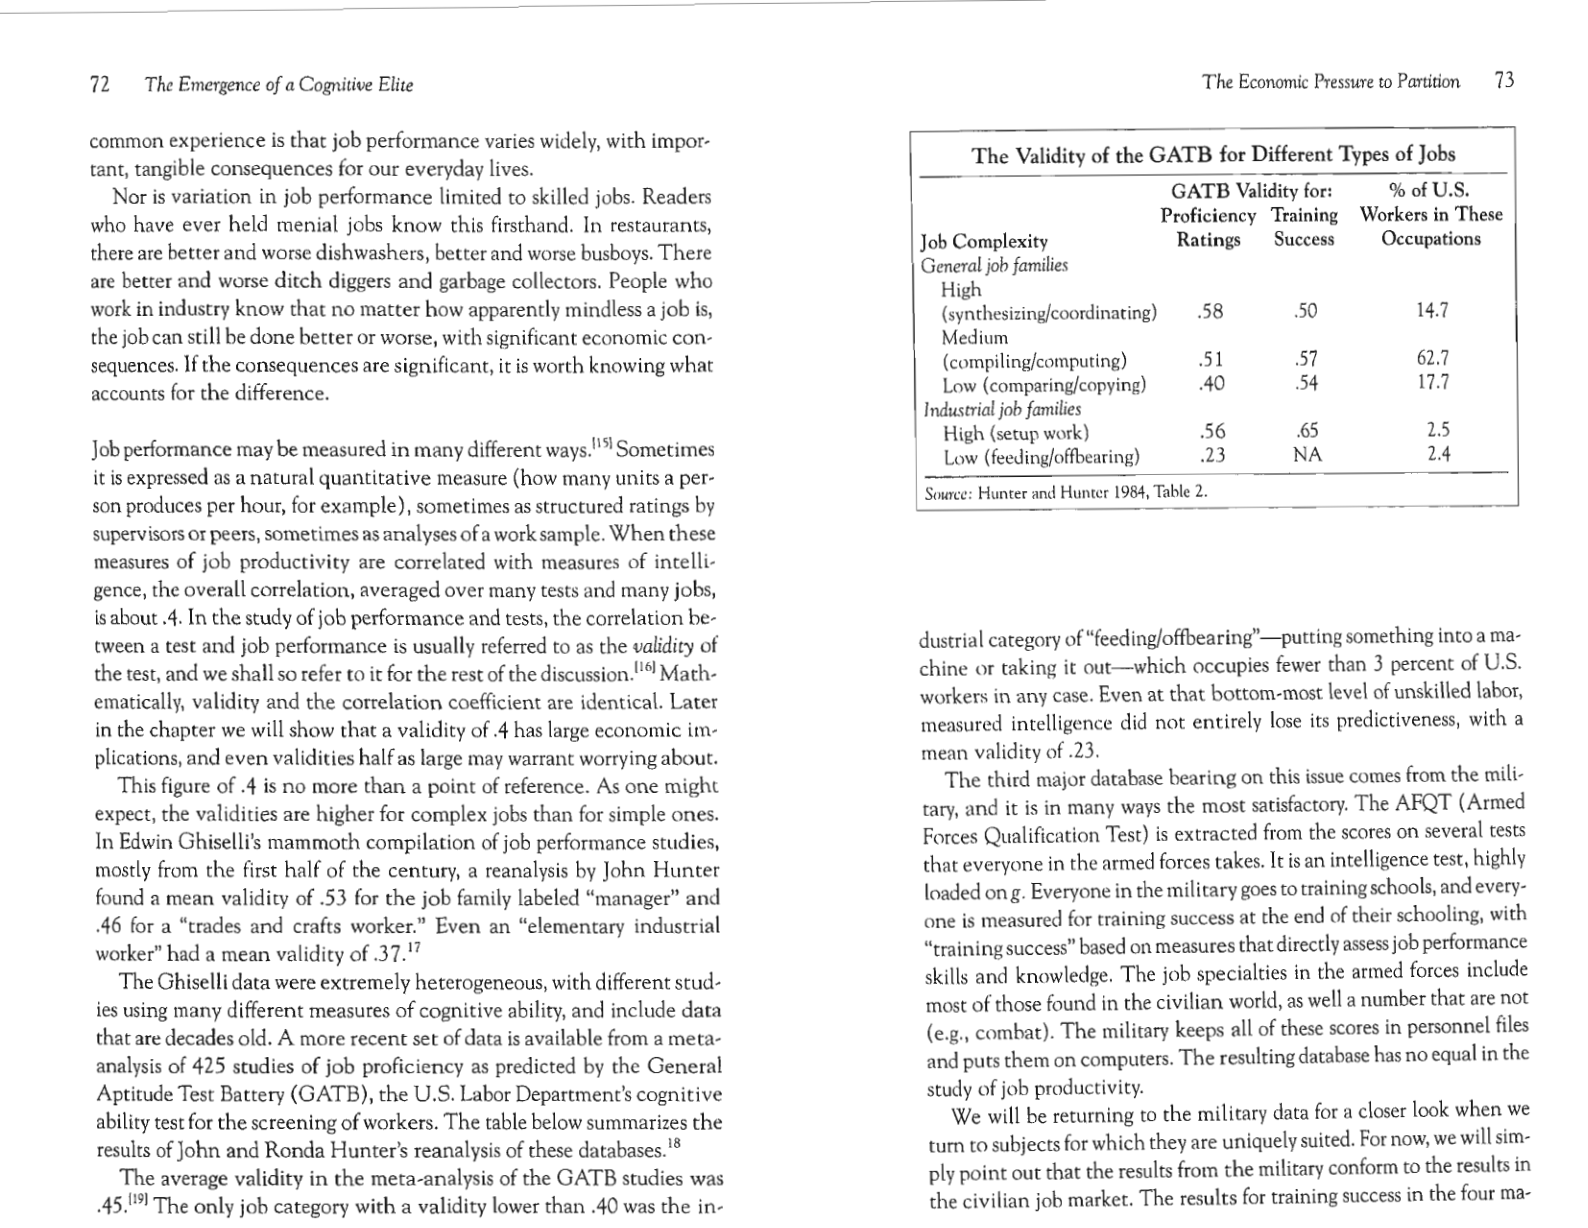
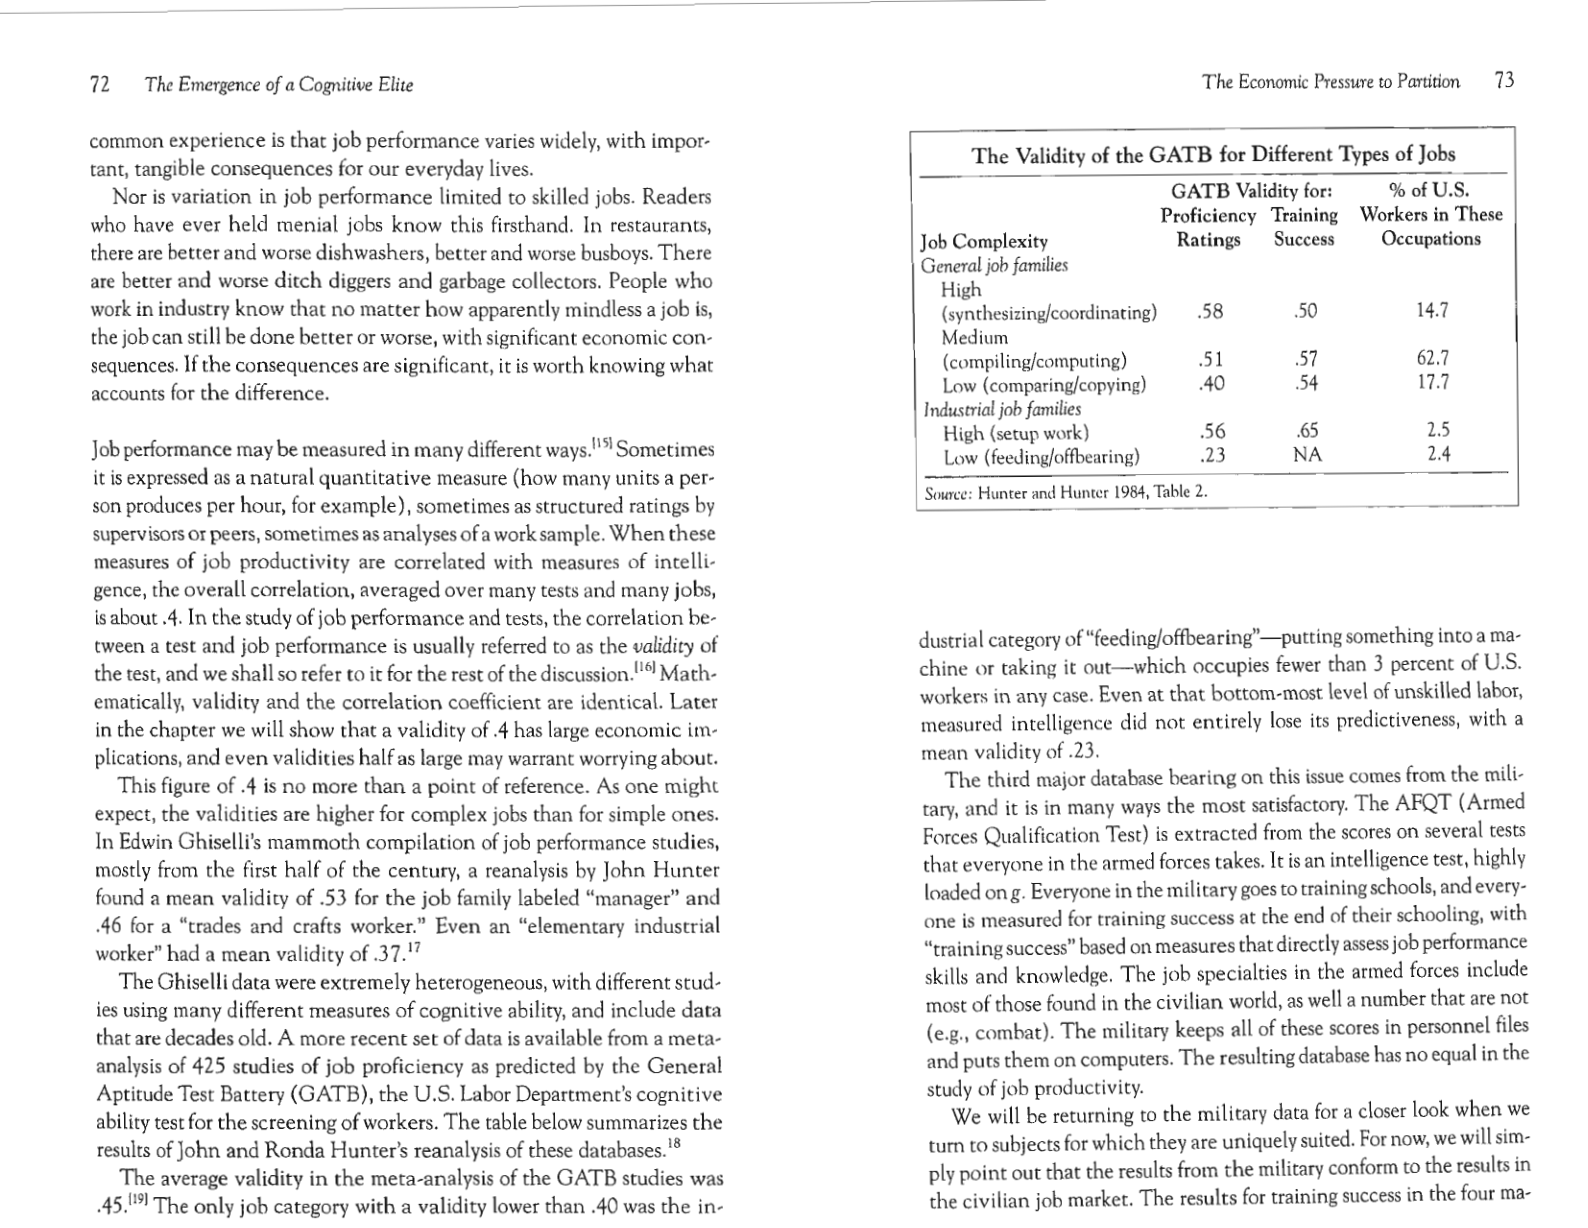
The Validity of the GATB for Different Types of Jobs 73
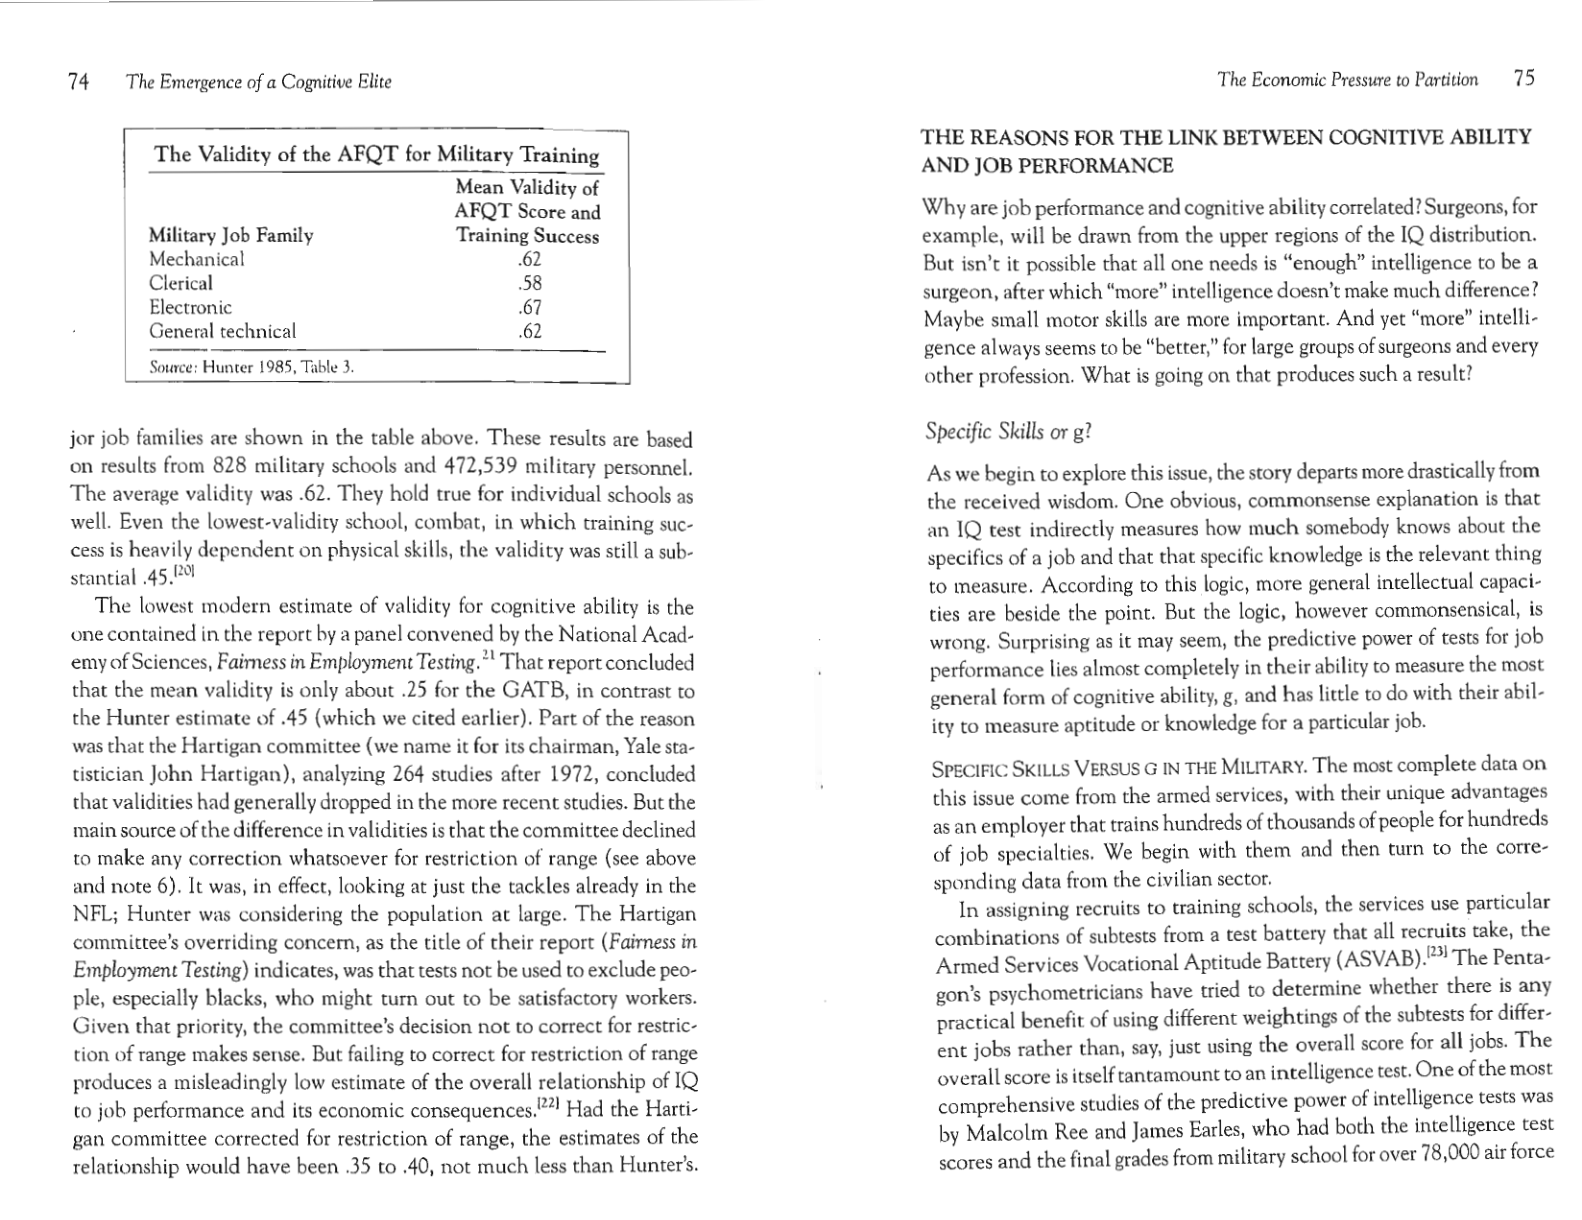
The Validity of the AFQT for Military Training 74
The Role of g in Explaining Training Success for Various Military Spe-
cialties 77
The Validity of Some Different Predictors of Job Performance 81
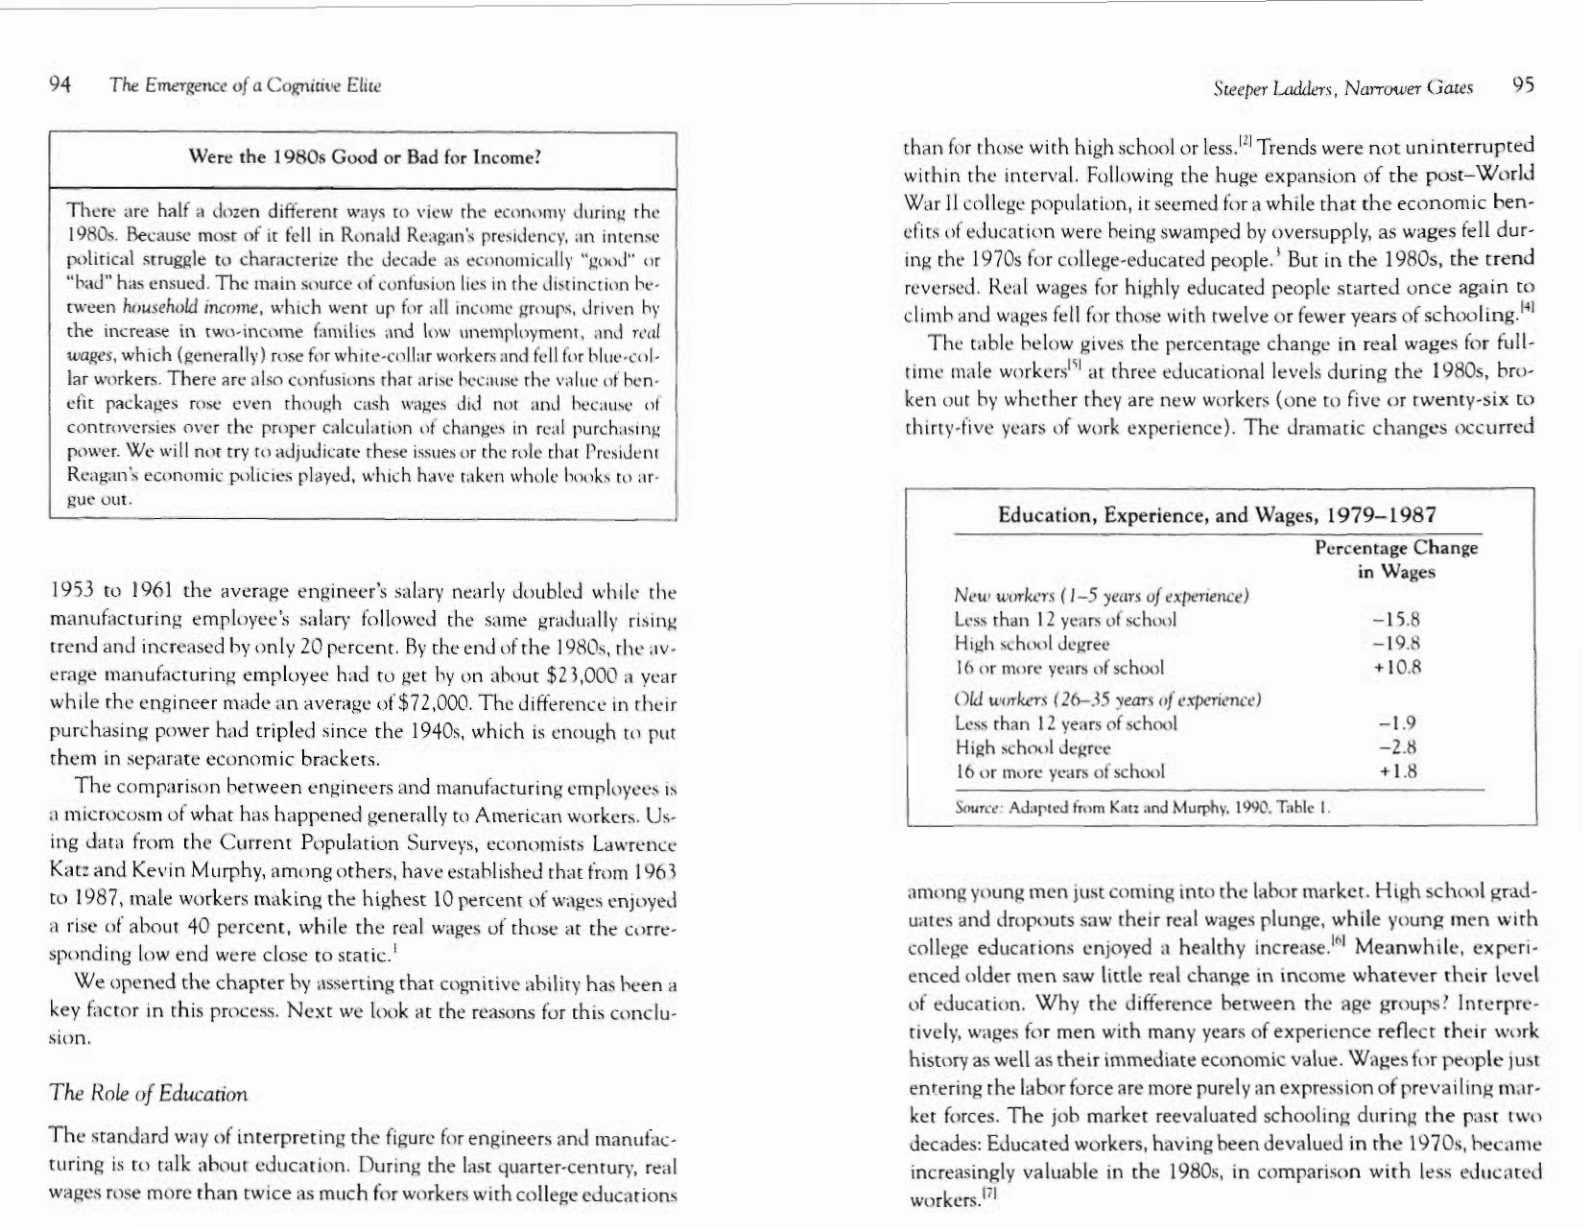
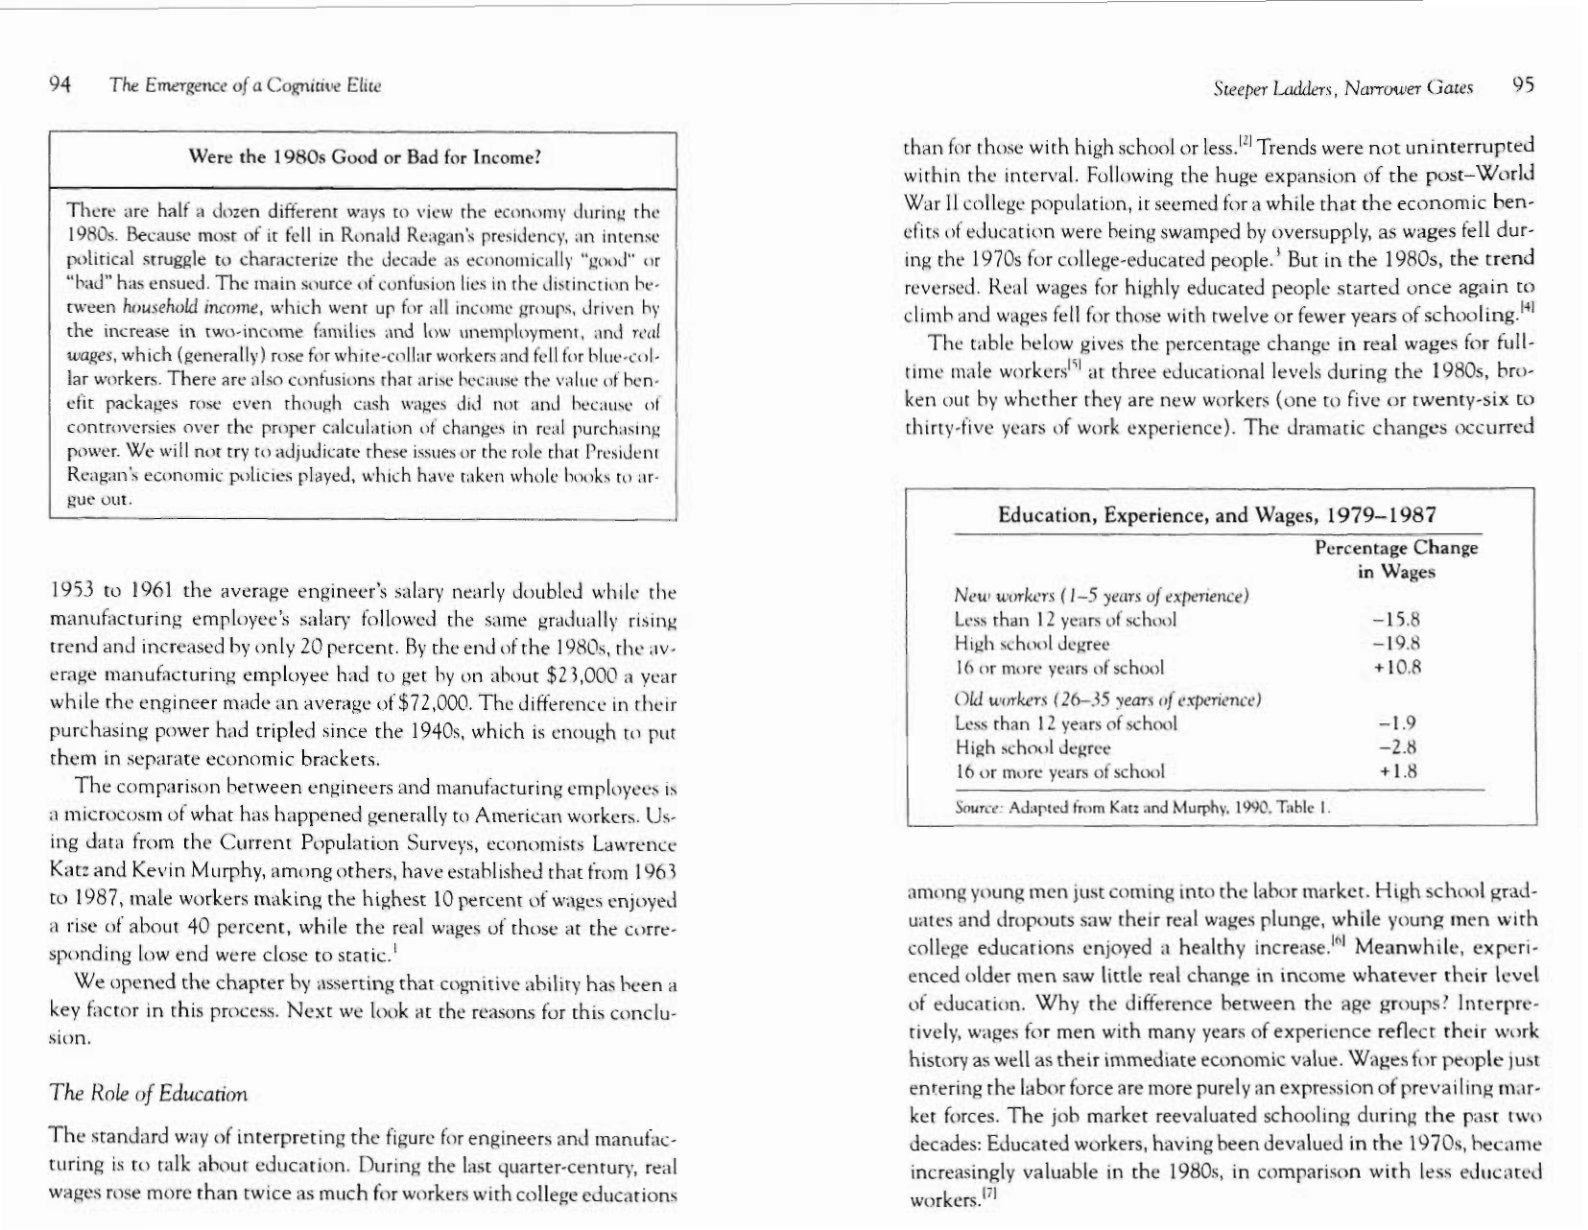
Education, Experience, and Wages, 1979-1987
95
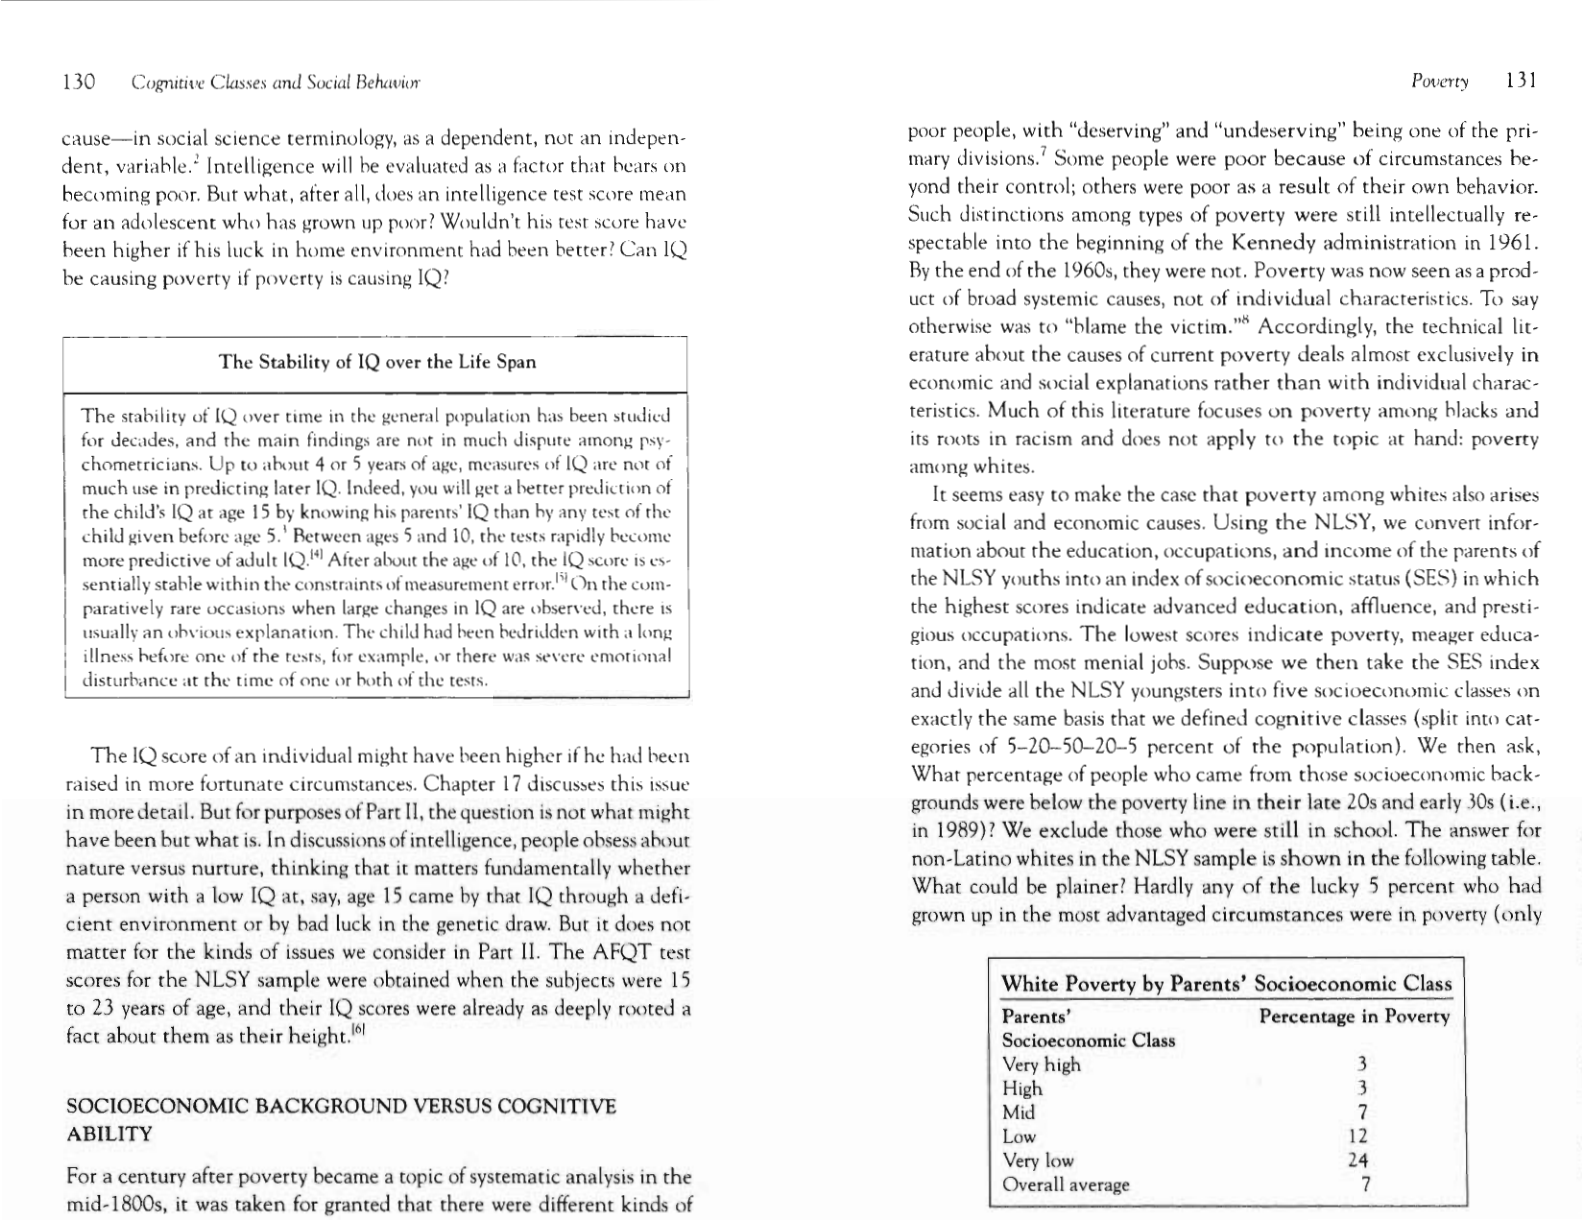
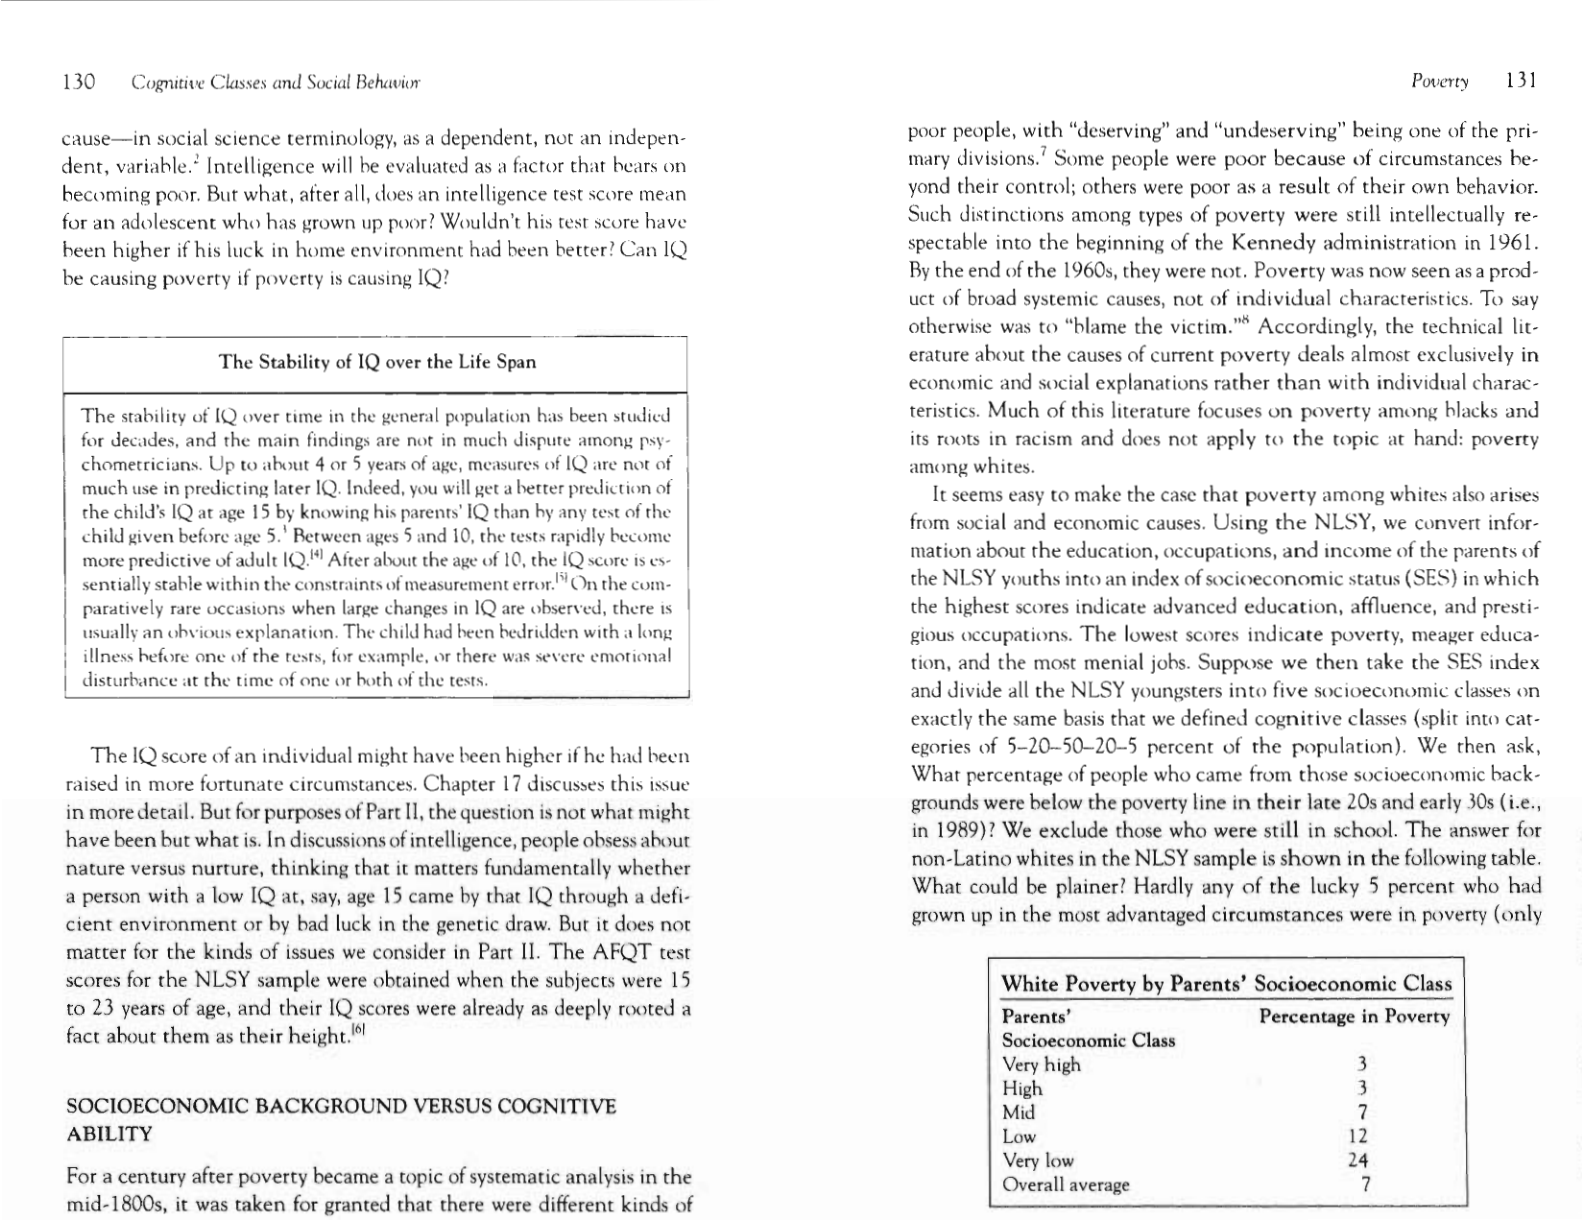
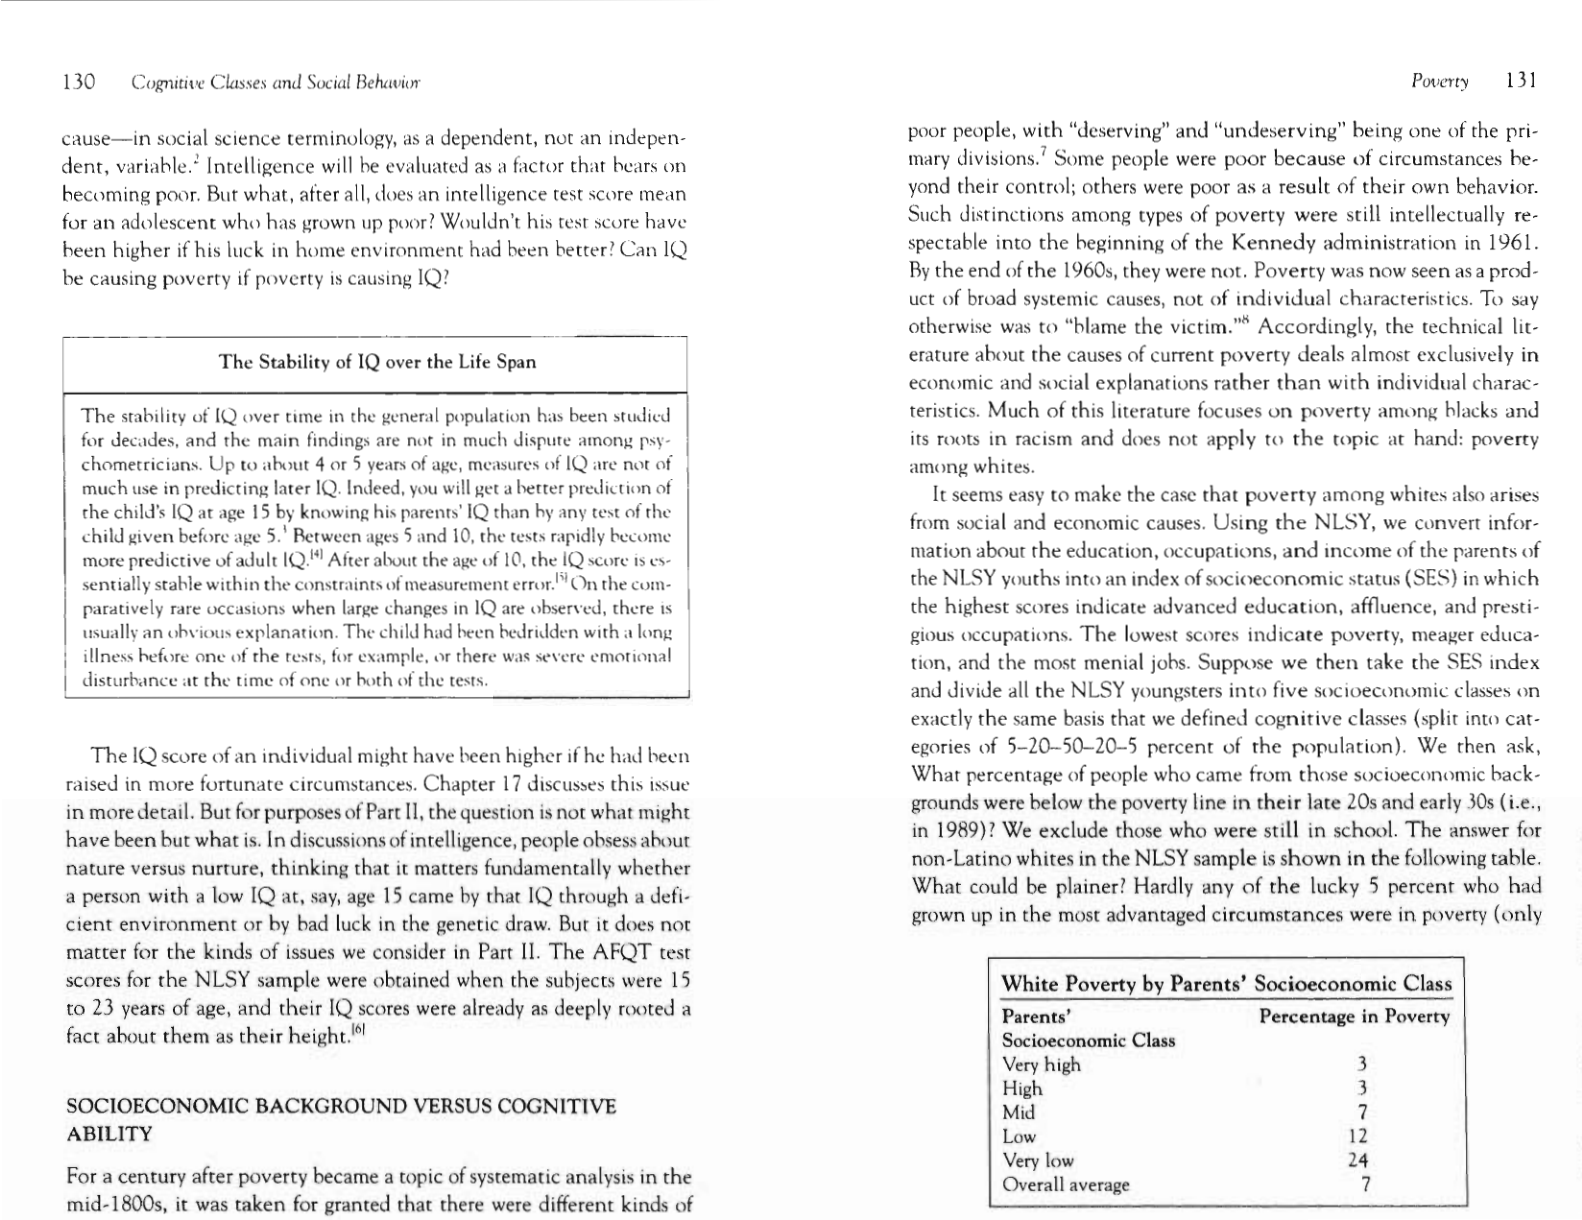
White Poverty by Parents' Socioeconomic Class
131
White Poverty by Cognitive Class 132
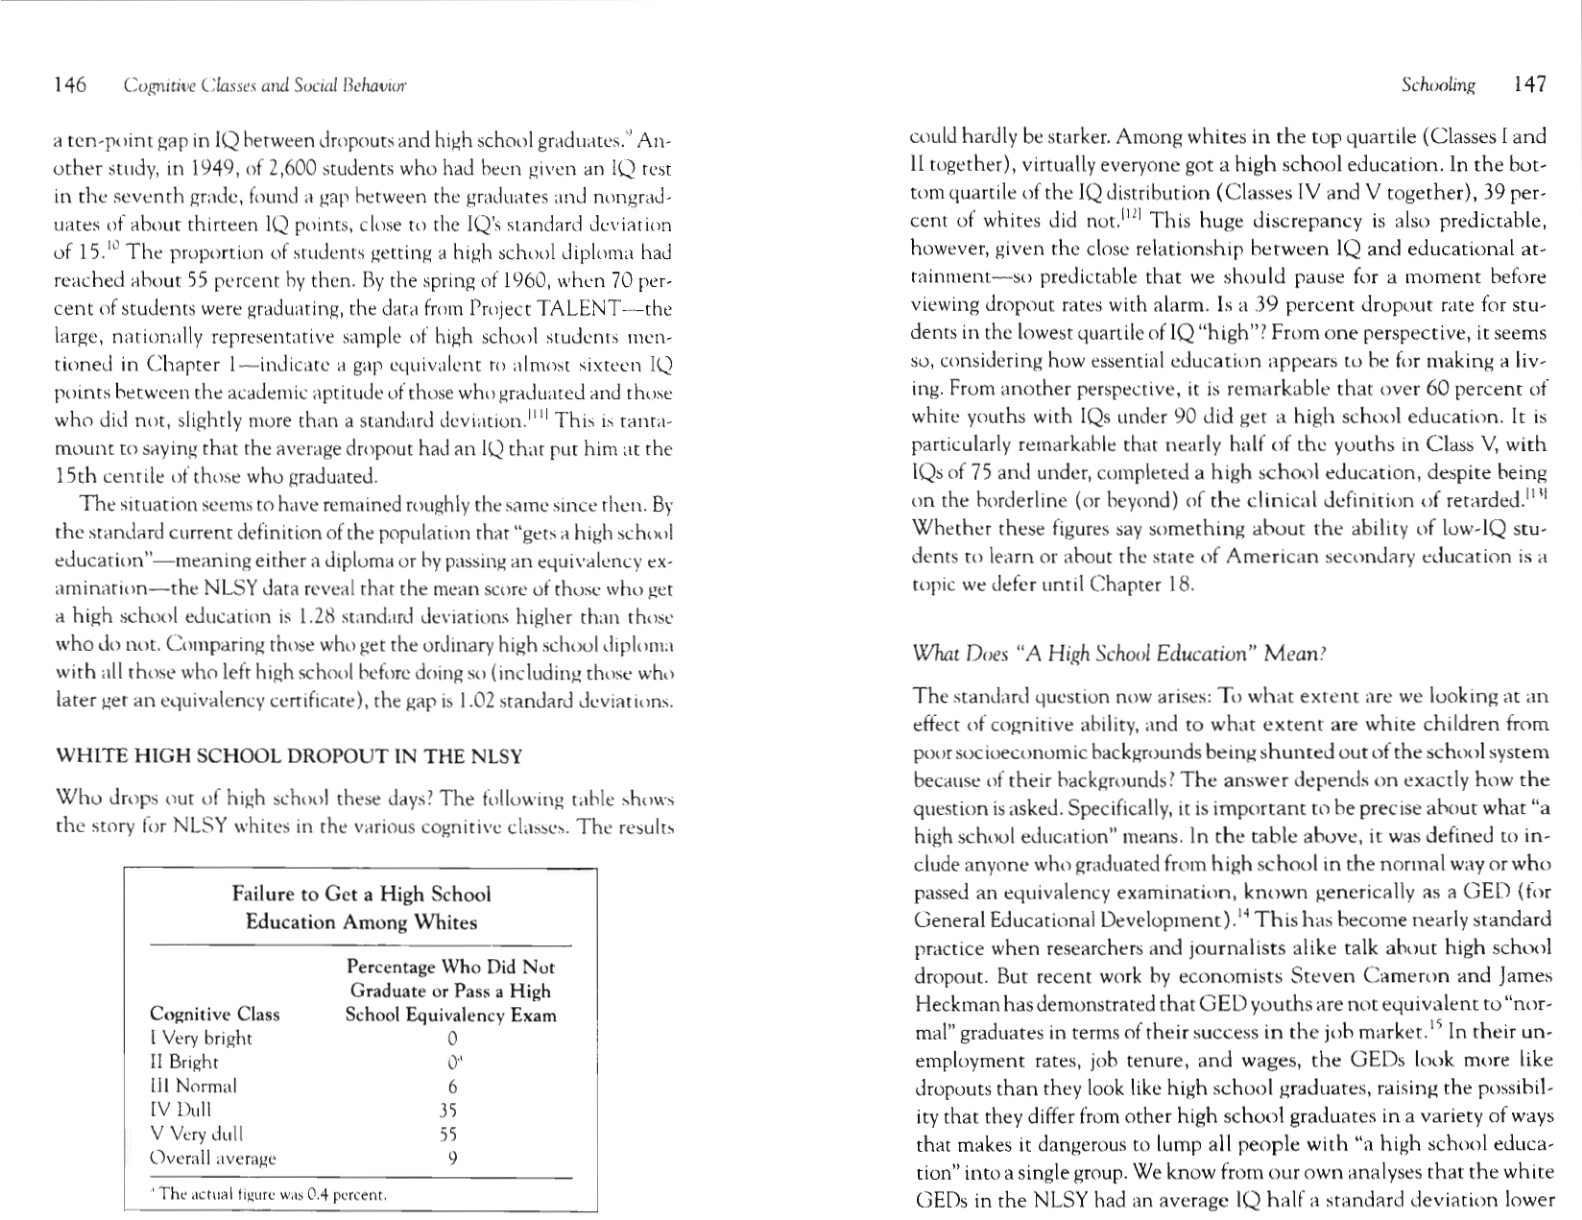
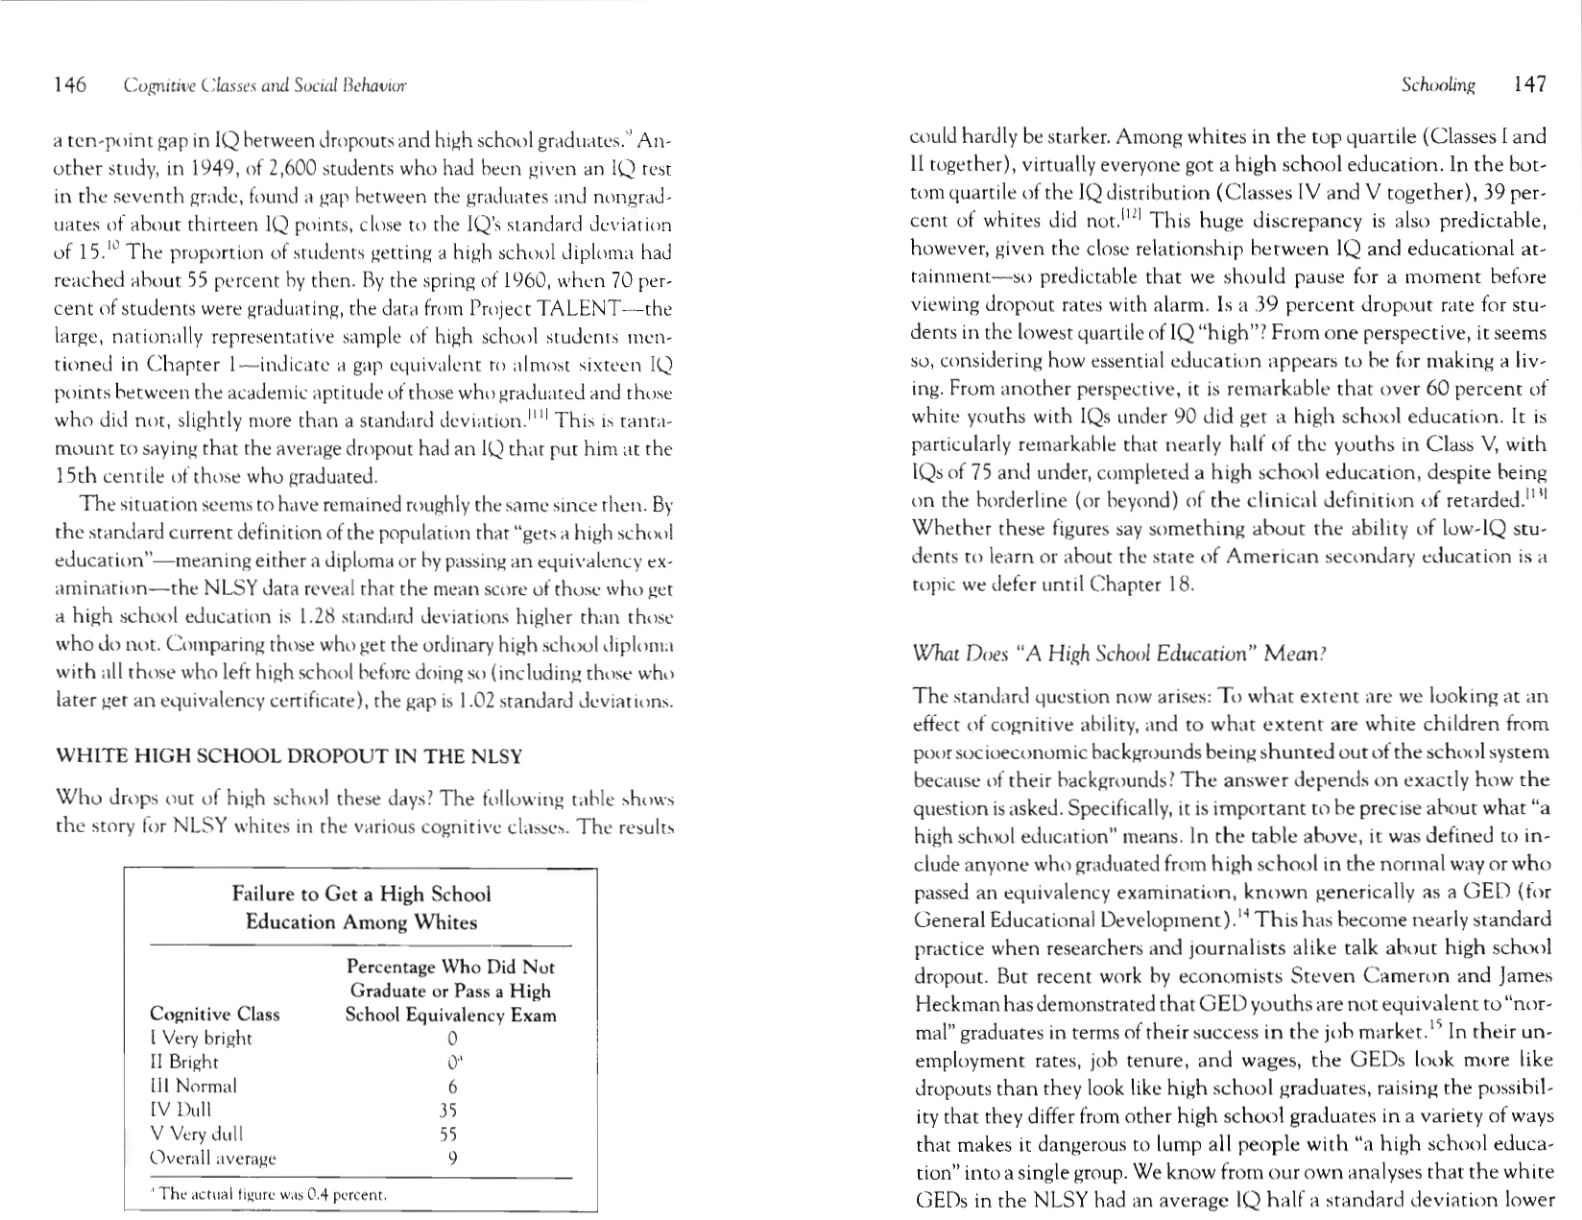
Failure To Get a High School Education Among Whites 146
Which White Young Men Spent a Month or More Out of the Labor
Force in 19897 158
Job Disability Among Young White Males 161
Which White Young Men Spent a Month or More Unemployed in
19891 163
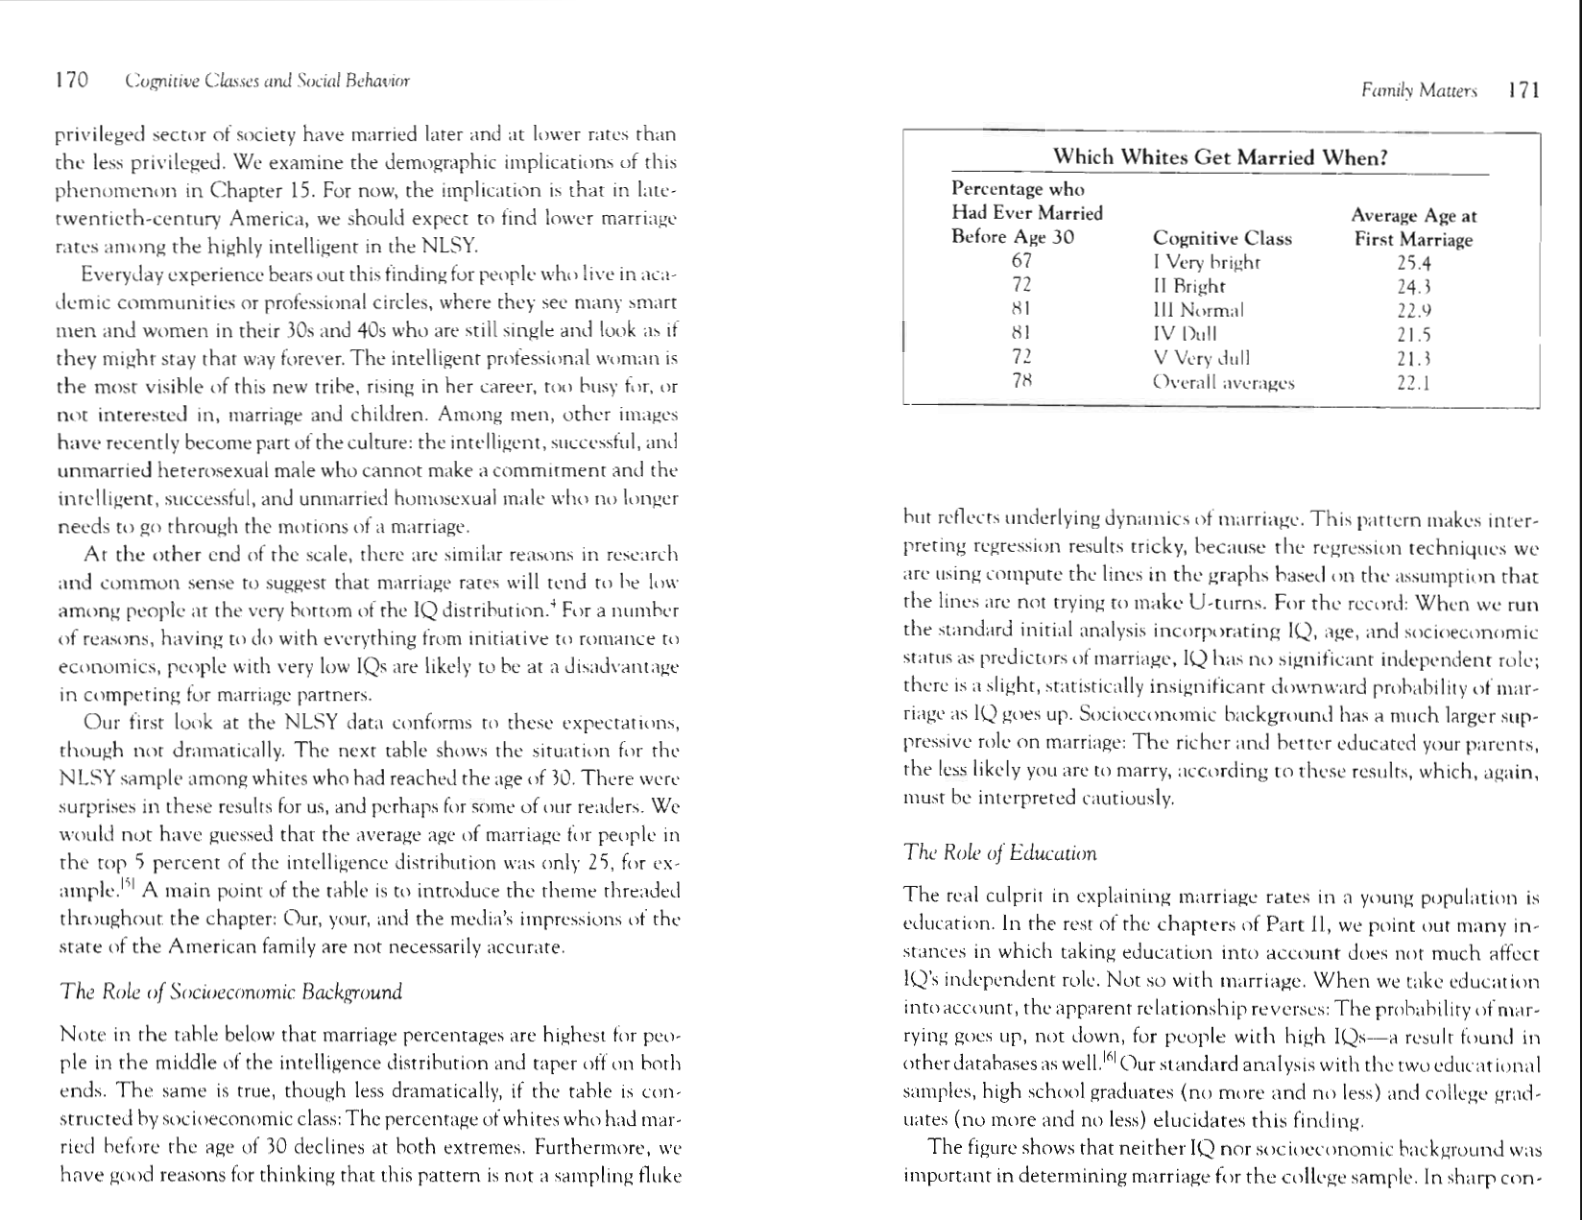
Which Whites Get Married When? 171
Which Whites Get Divorced When?
174
The Incidence of Illegitimacy Among Young White Women
180
The Proportion of First Births That Are Illegitimate 181
Circumstances of the First Birth Among Whites 181
Which White Women Go on Welfare After the Birth of the First
Child? 194
Educational Attainment of White Chronic Welfare Recipients
199
Low Birth Weight Among White Babies 215
Which White Children Grow Up in the Worst Homes? 221
Which White Toddlers Have the Worst Temperaments? 226
Which White Children Are Behind in Motor and Social Develop-
ment? 227
Which White Children Have the Worst Behaviordl Problems? 227
IQ in the Mother and the Child for Whites in the NLSY
230
xviii
List of Tables
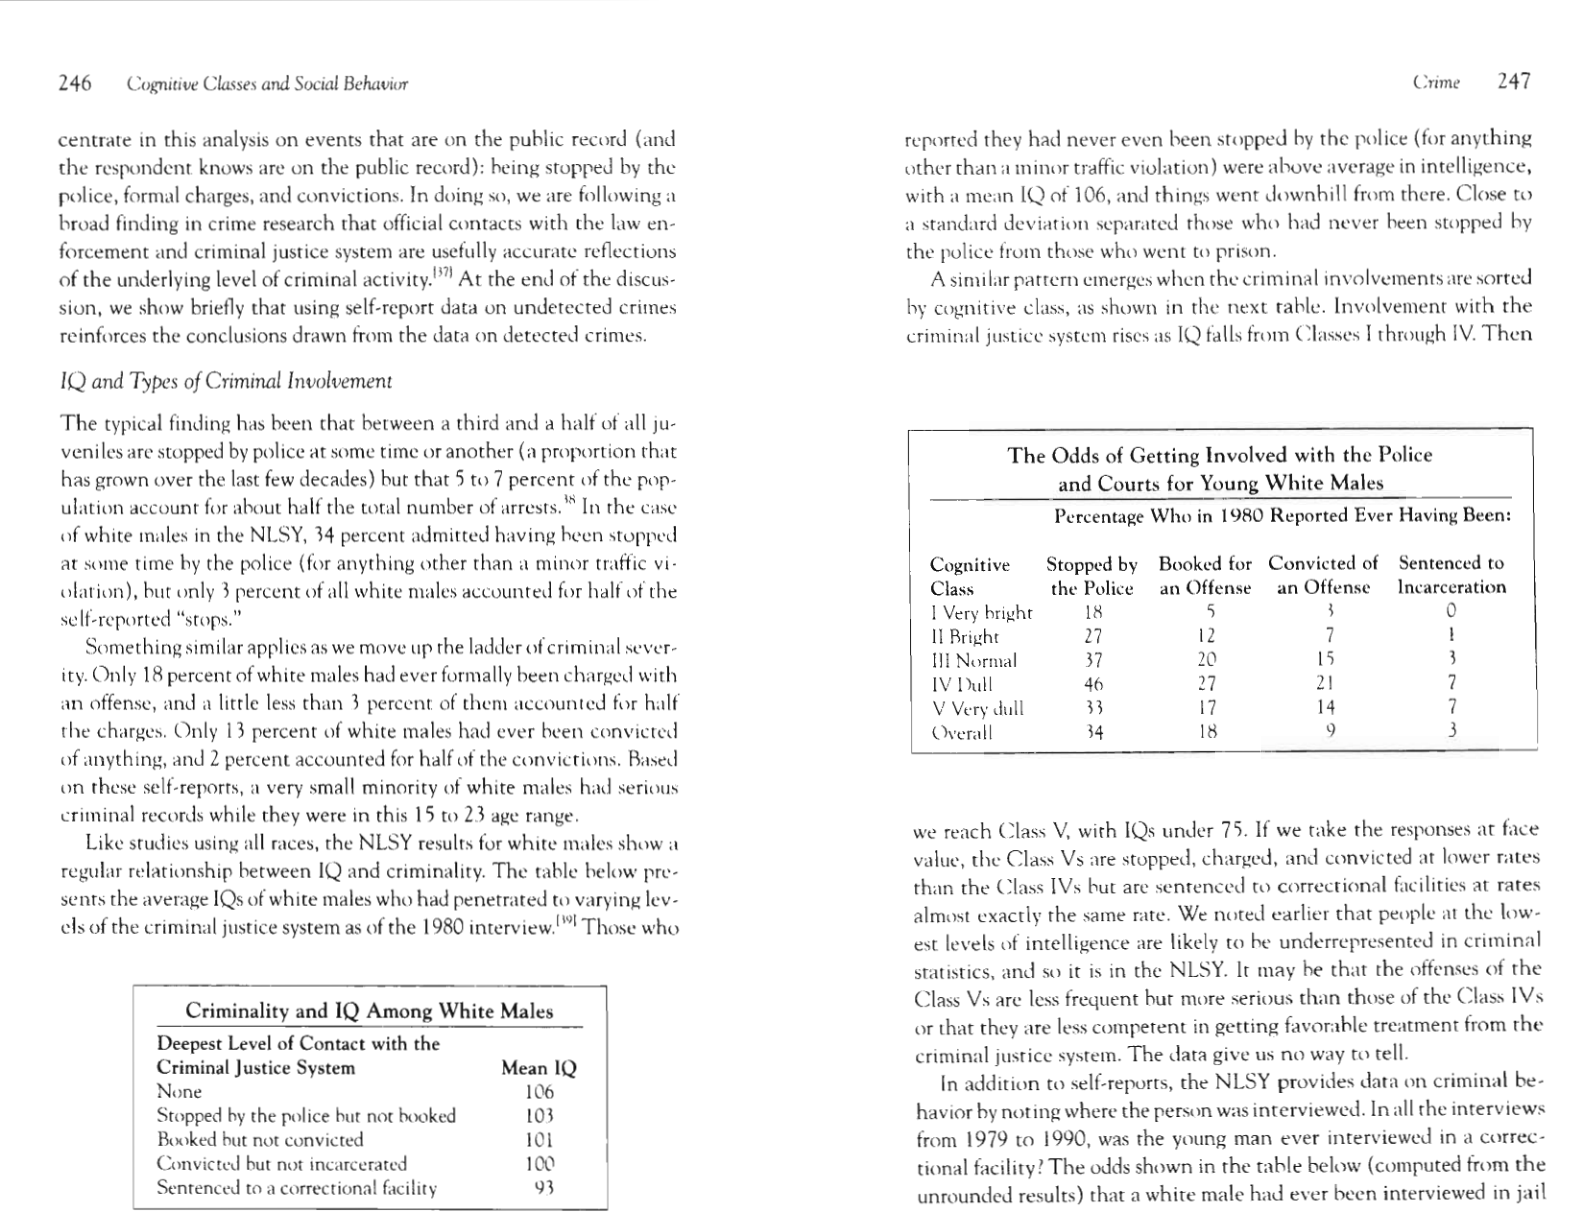
Criminality and IQ Among White Males 246
The Odds of Getting Involved with the Police and Courts for Young
White Males
247
The Odds of Doing Ttme for Young White Males 248
Whites and the Middle-Class Values Index 264
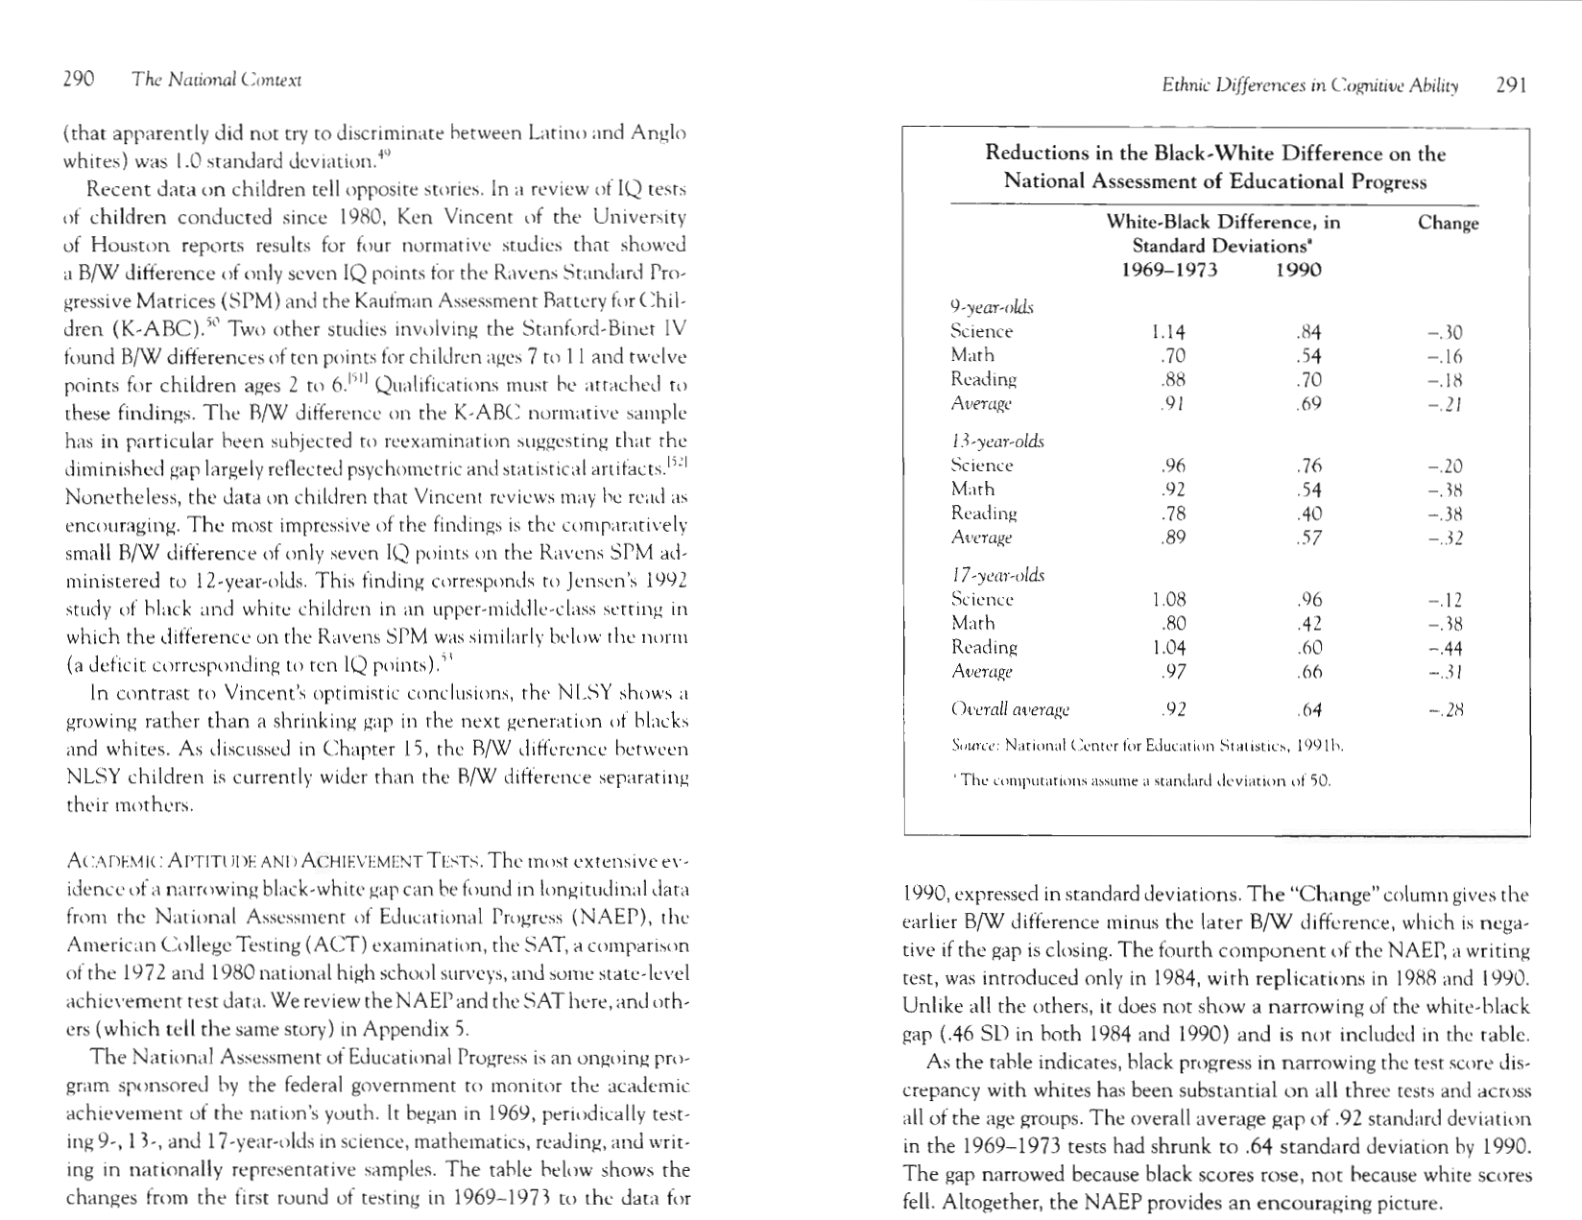
Reductions in the Black-White Difference on the National Assessment
of Educational Progress 29 1
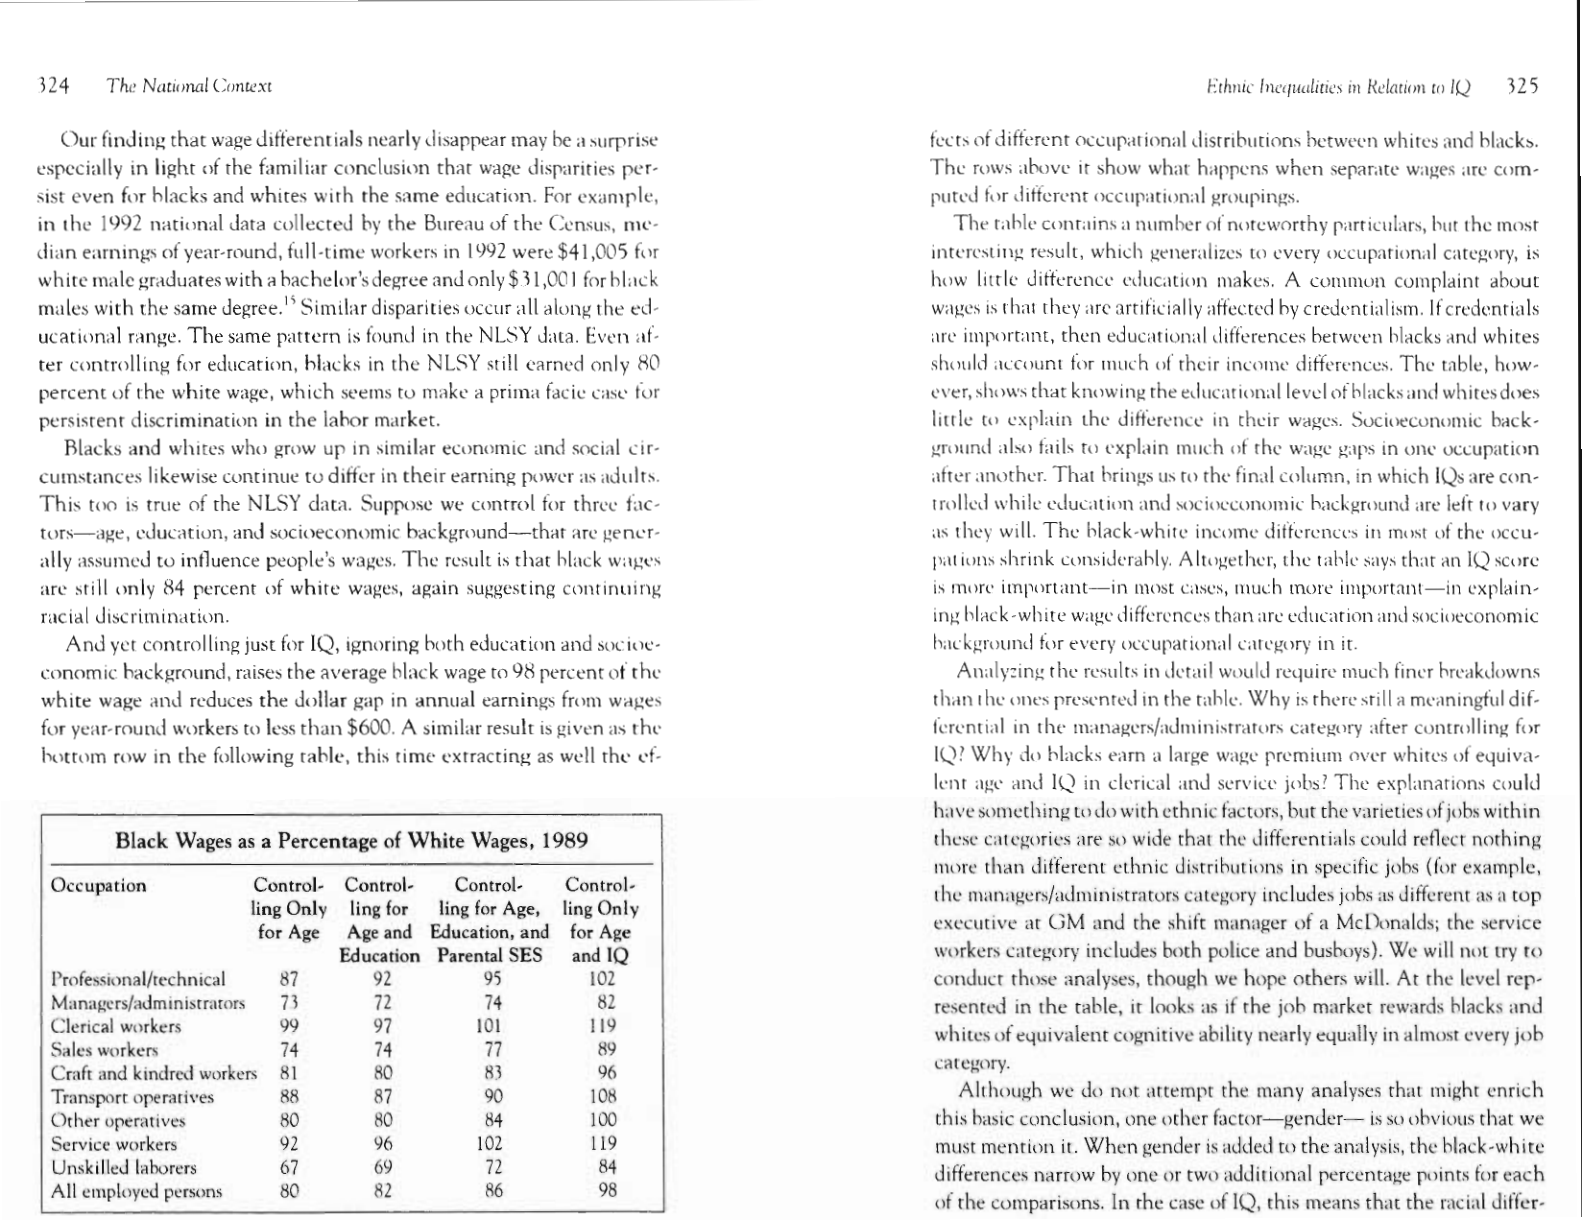
Black Wages As a Percentage of White Wages, 1989 324
Age at Childbearing 352
The Next Generation So Far, for Three Ethnic Groups in the
NLSY
354
Ethnic Differences in Test Scores in Two Generations 356
Regression to the Mean and Ethnic Differences in Test Scores in Two
Generations 357
IQ Equivalents for the Deciles 37 1
Prevalence of Low IQ Among Mothers of Children with Developmen-
tal Problems 383
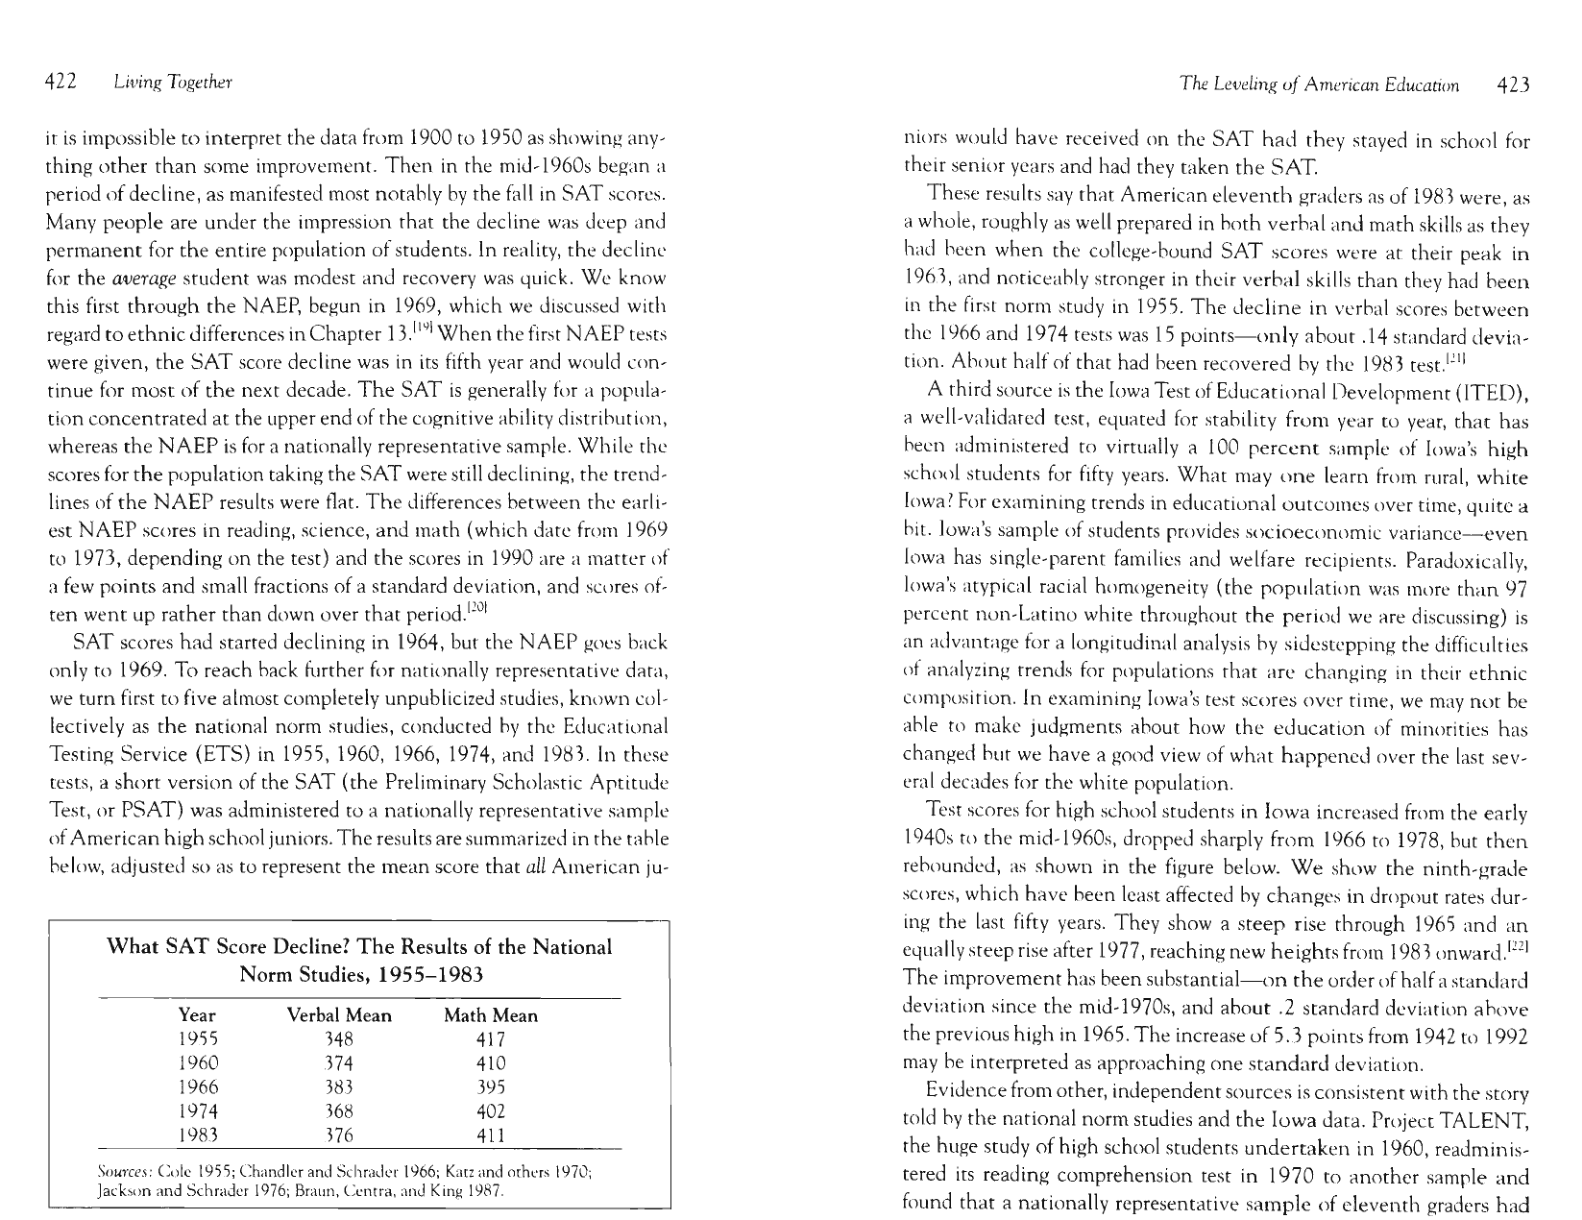
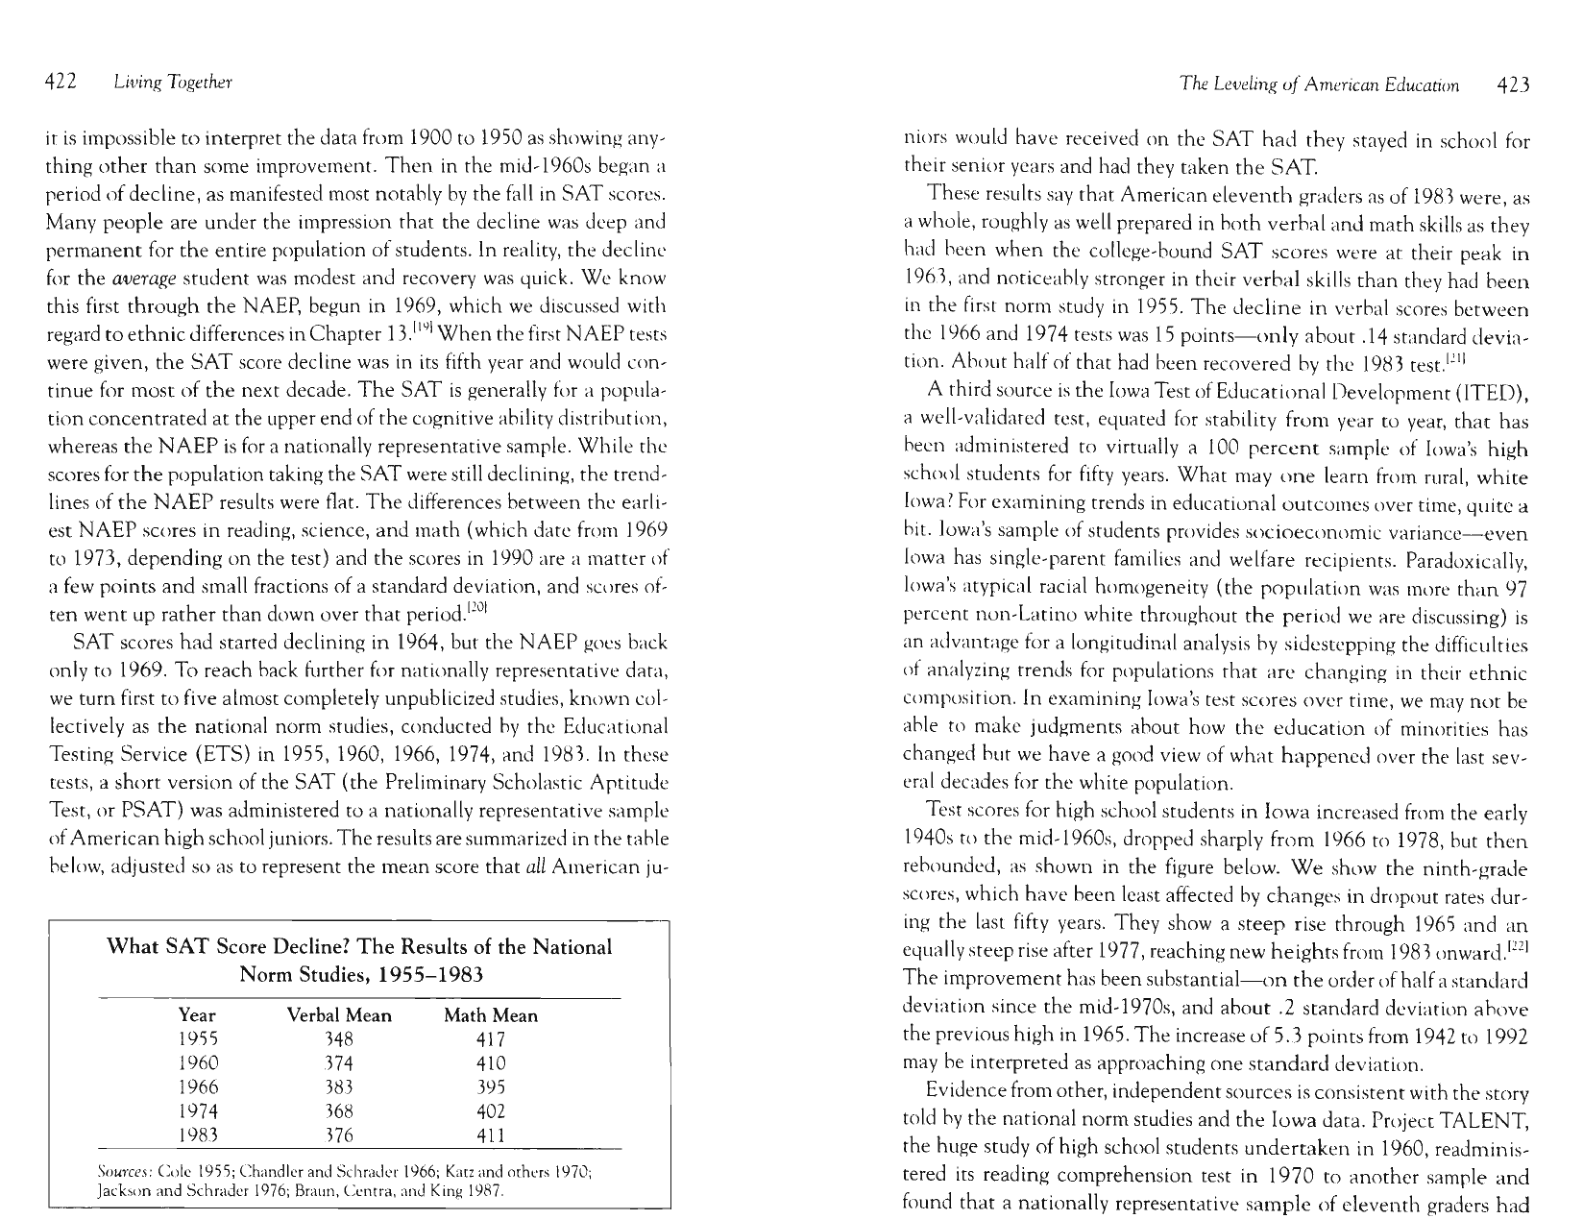
What SAT Score Decline? The Results of the National Norm Stuclies,
1955-1983
422
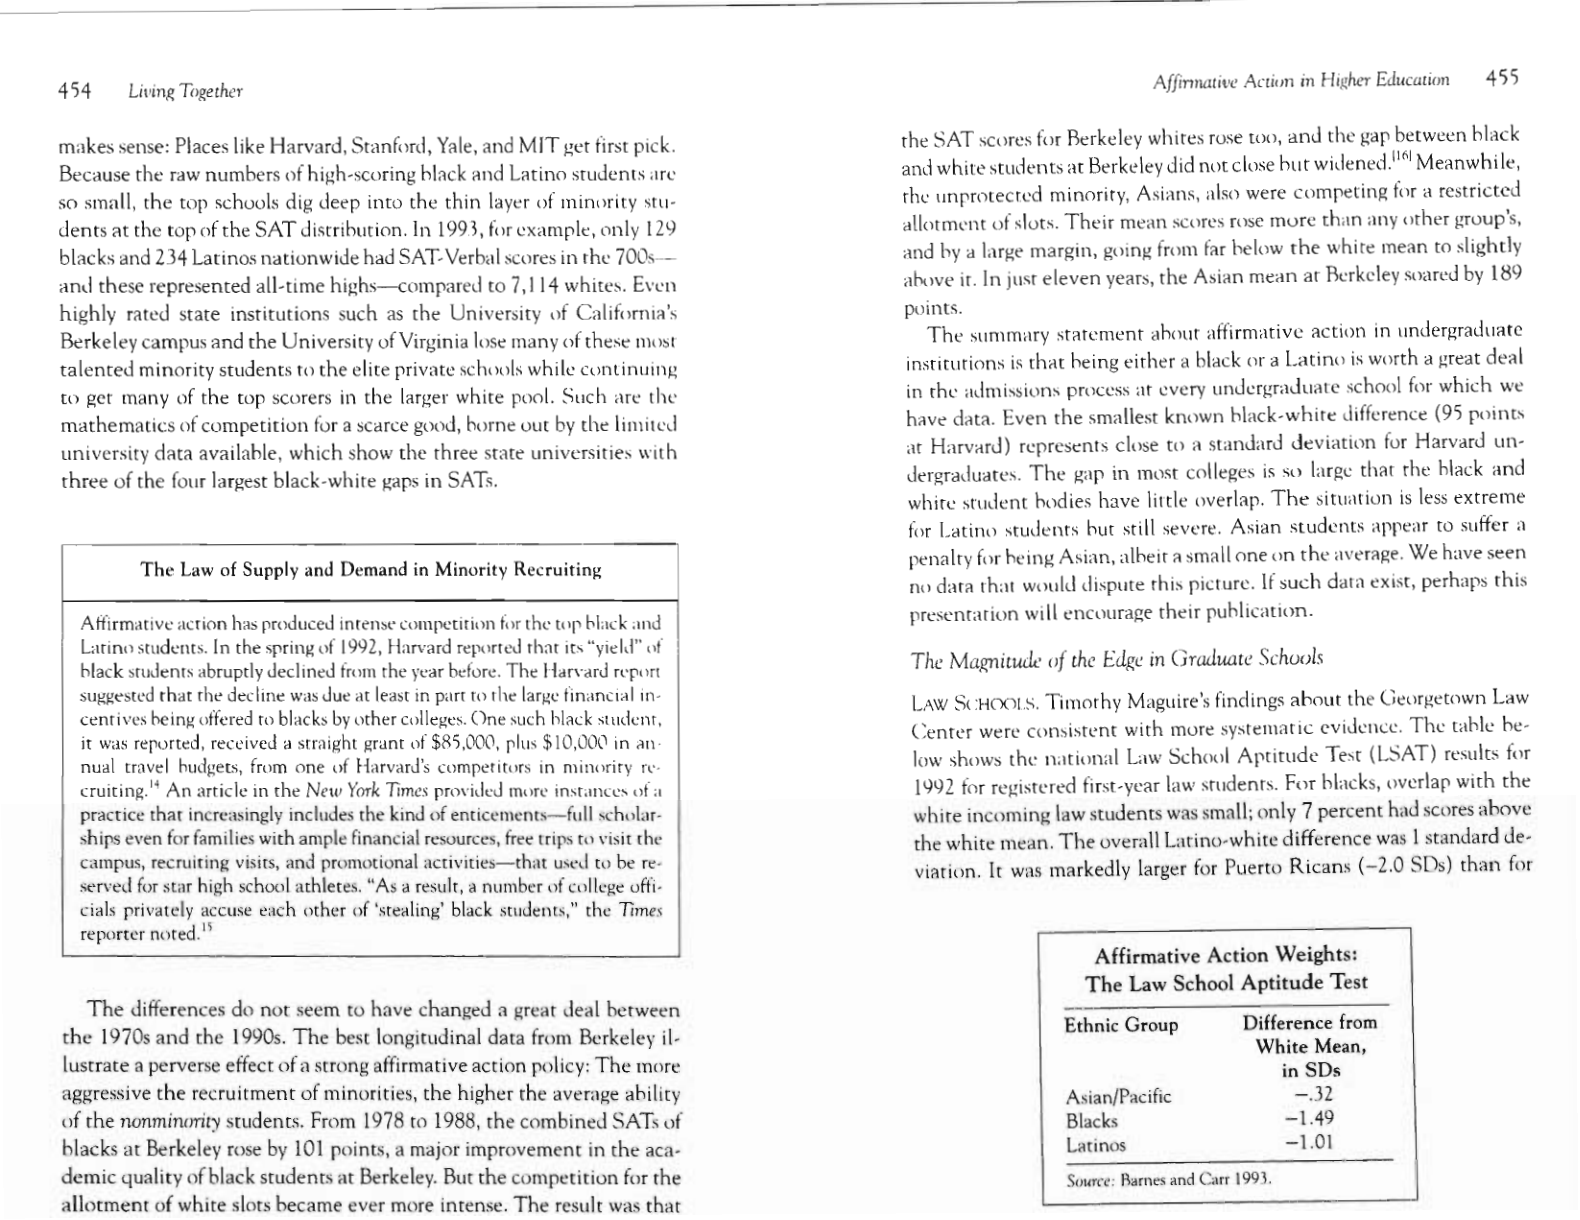
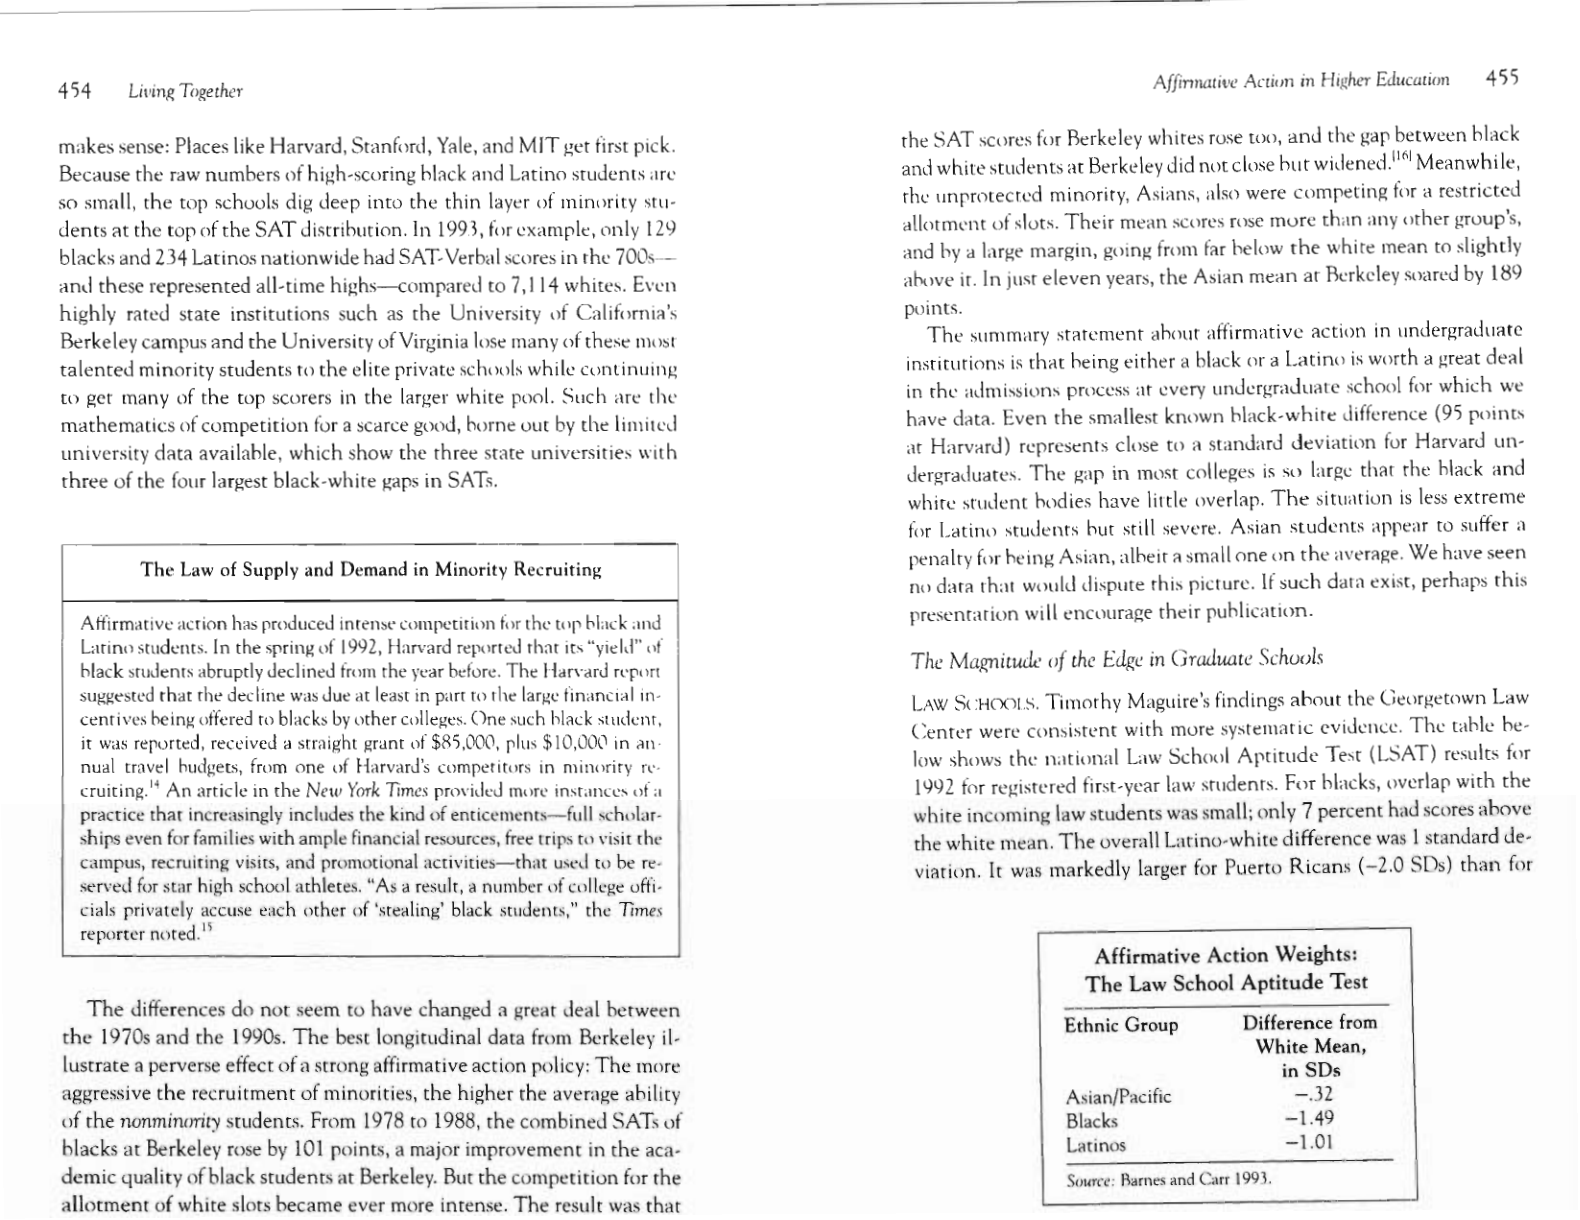
Affirmative Action Weights: The Law School Aptitude Test
455
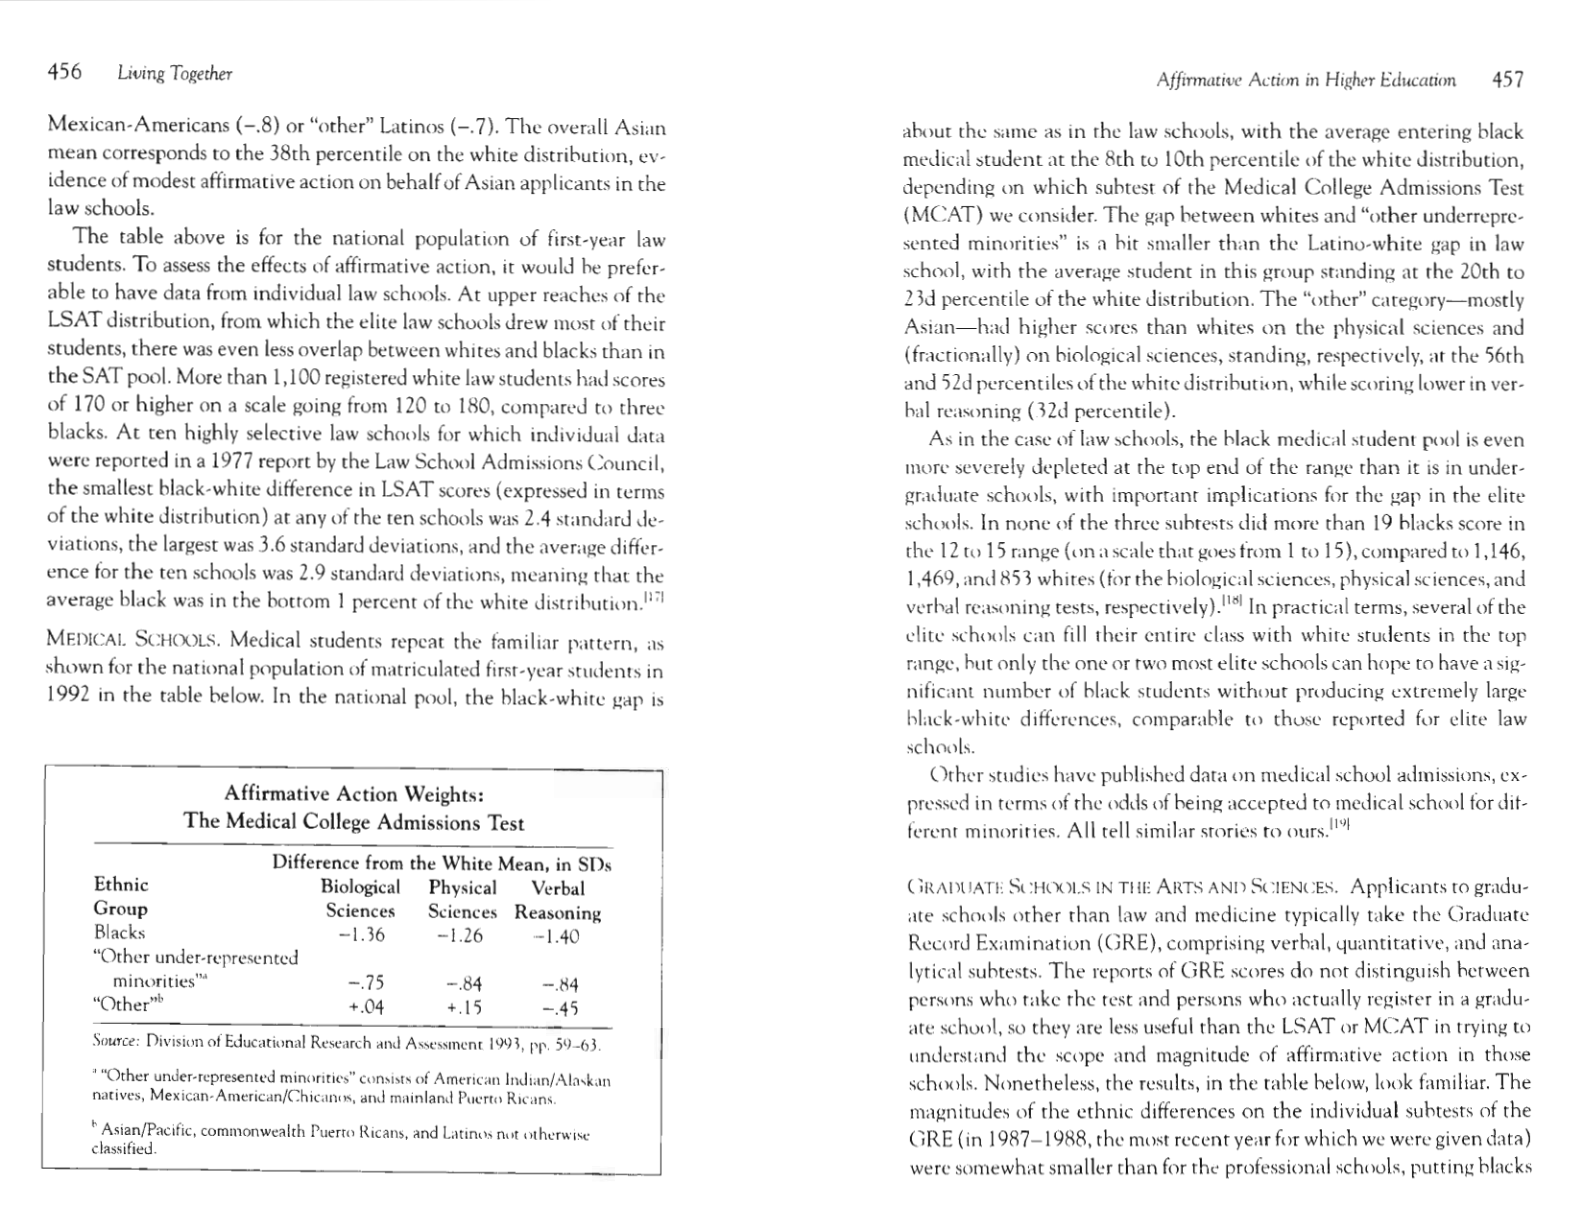
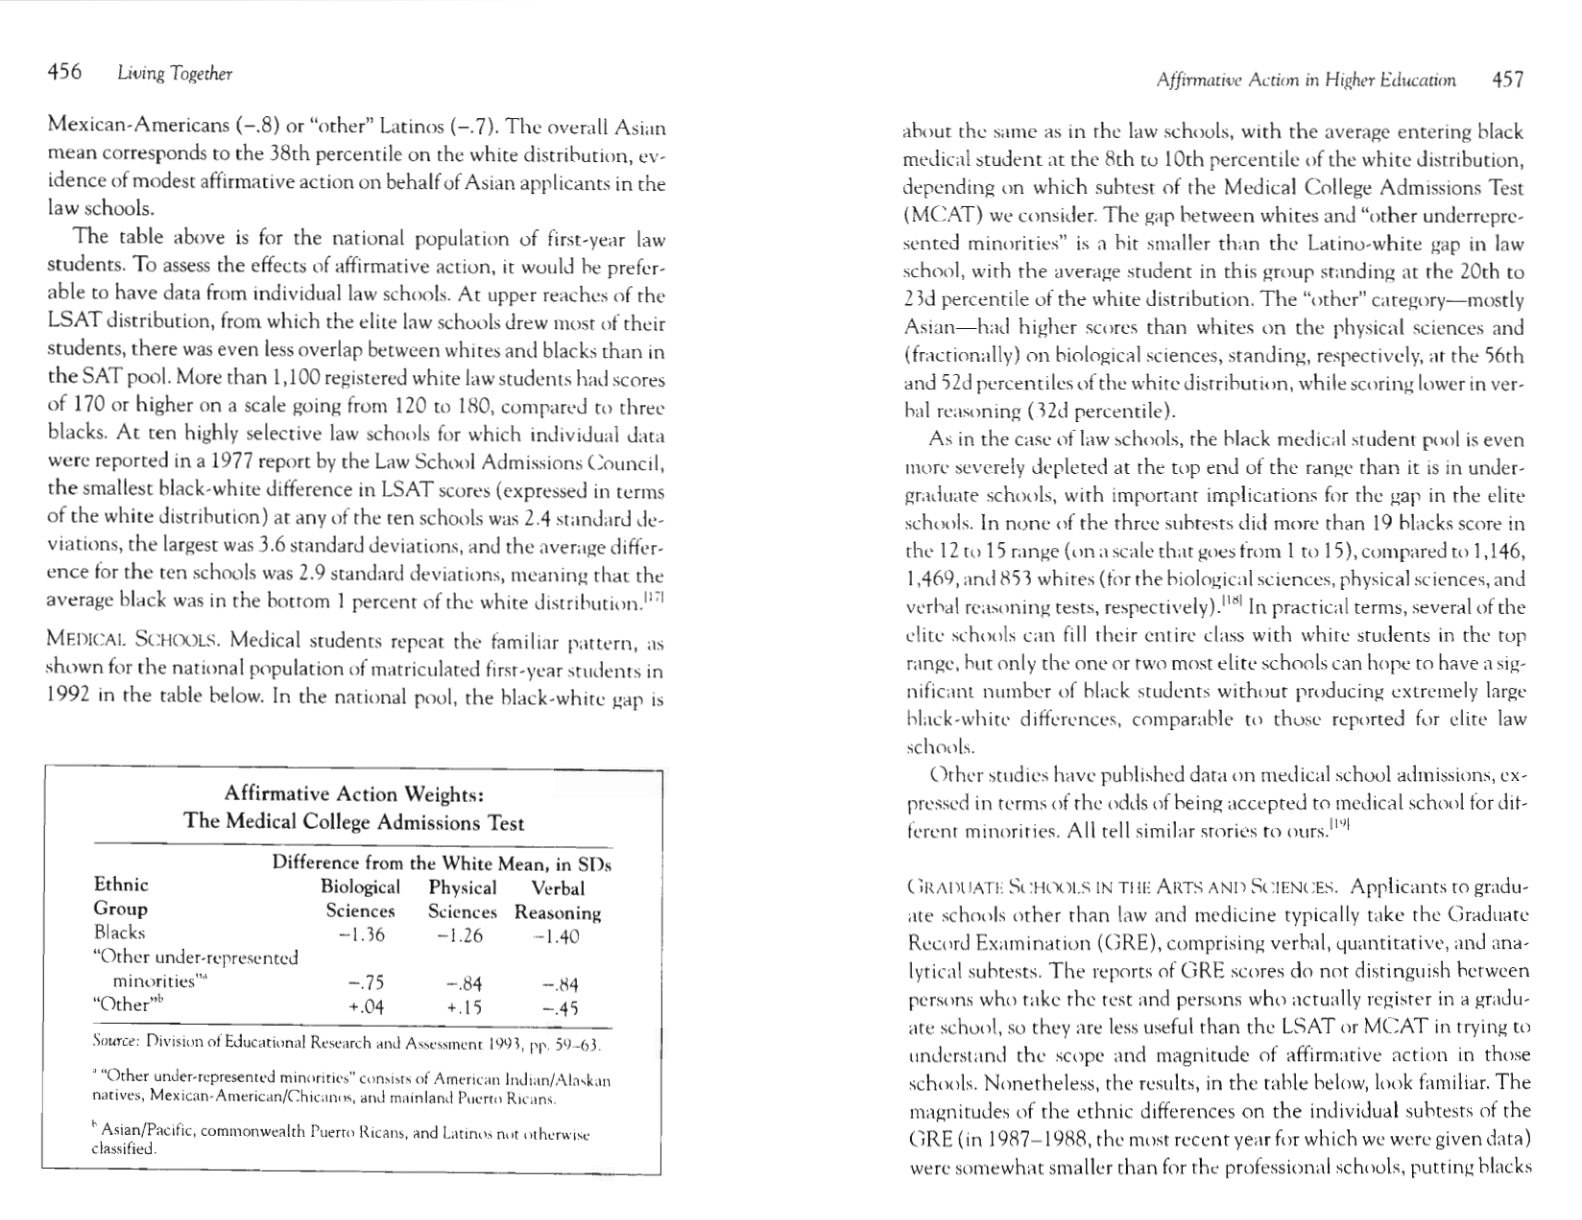
Affirtnative Action Weights: The Medical College Admissions
Test
456
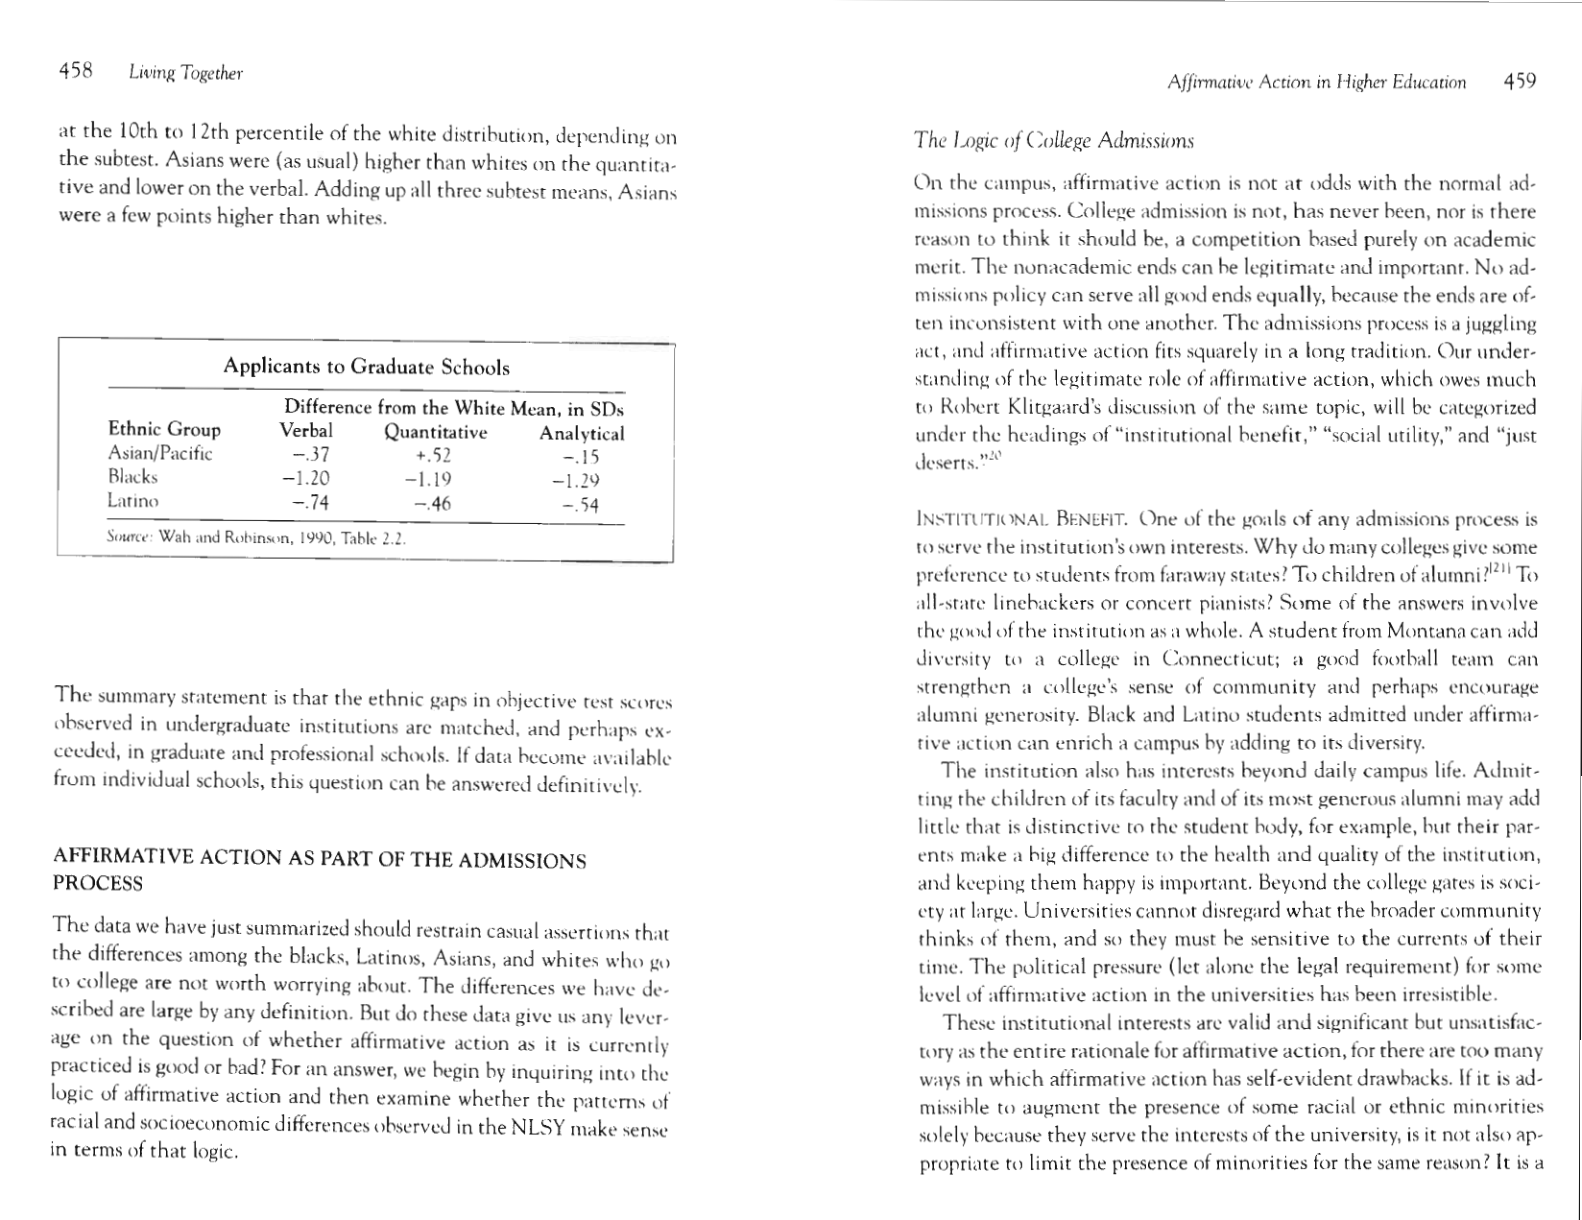
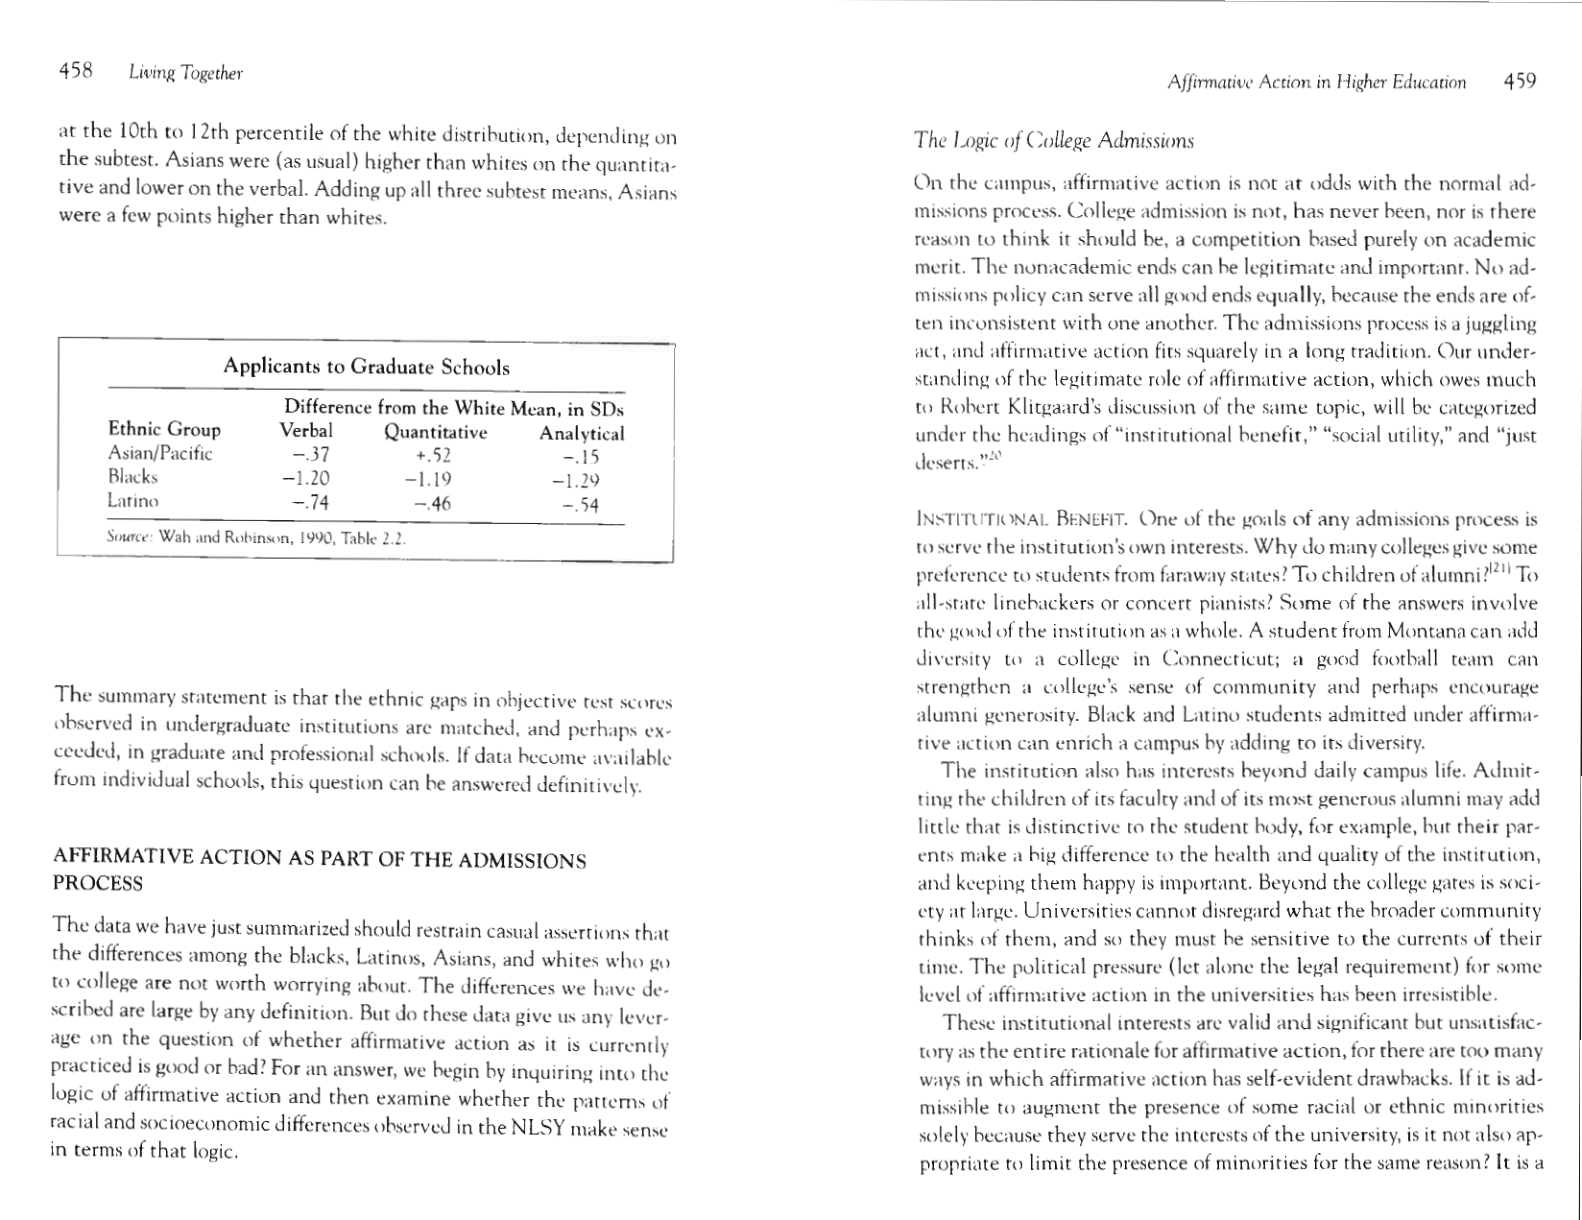
Applicants to Graduate Schools 458
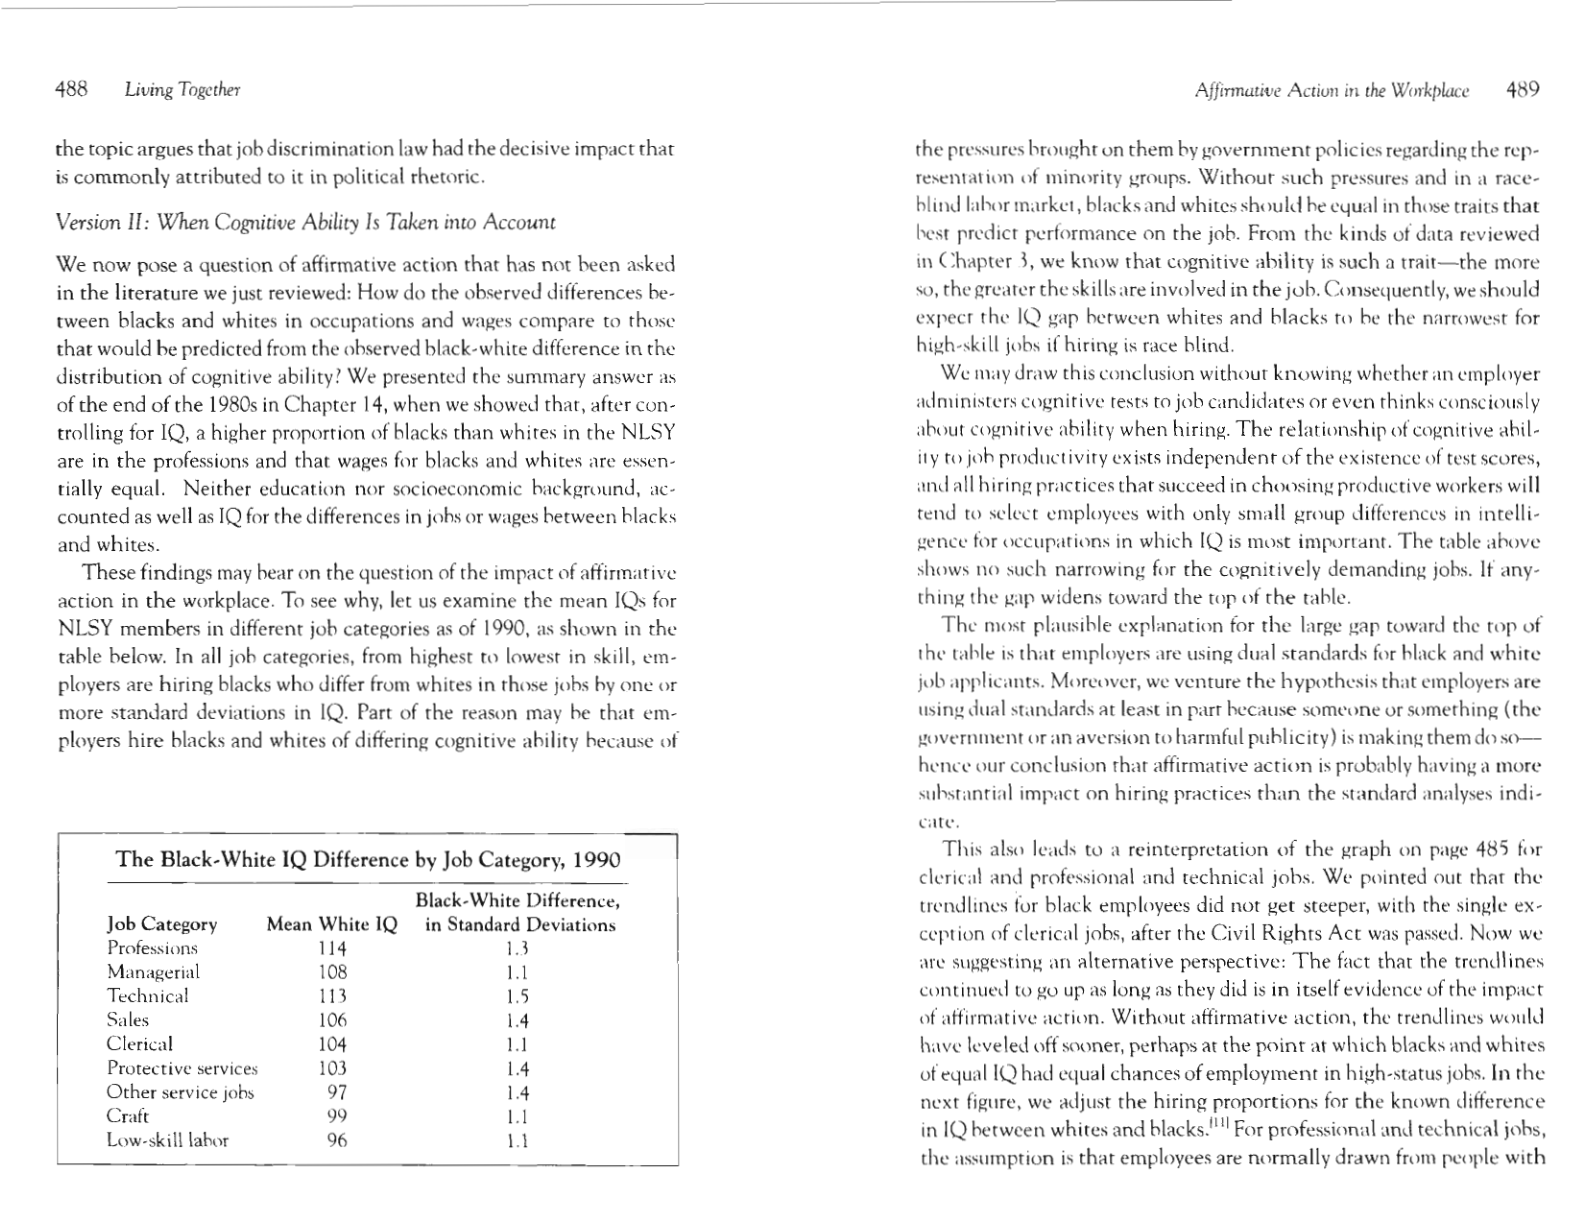
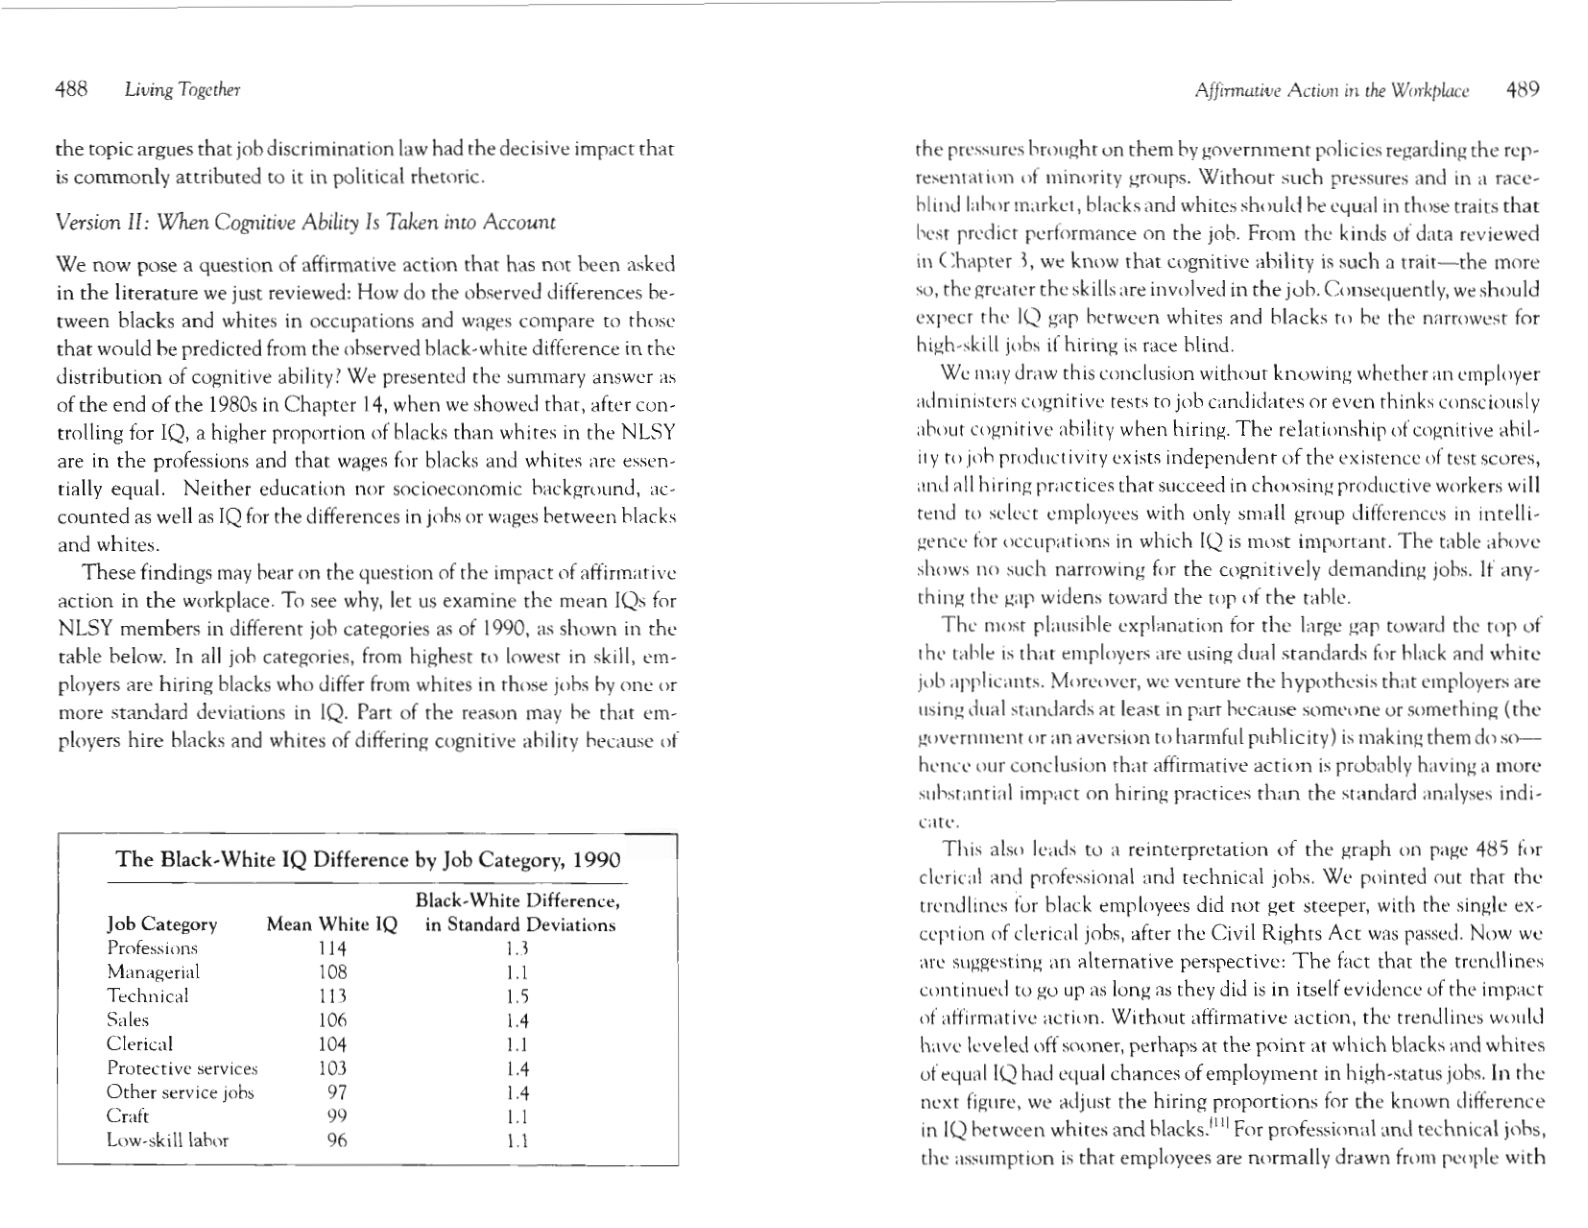
The Black-White IQ Difference by Job Category, 1990 488
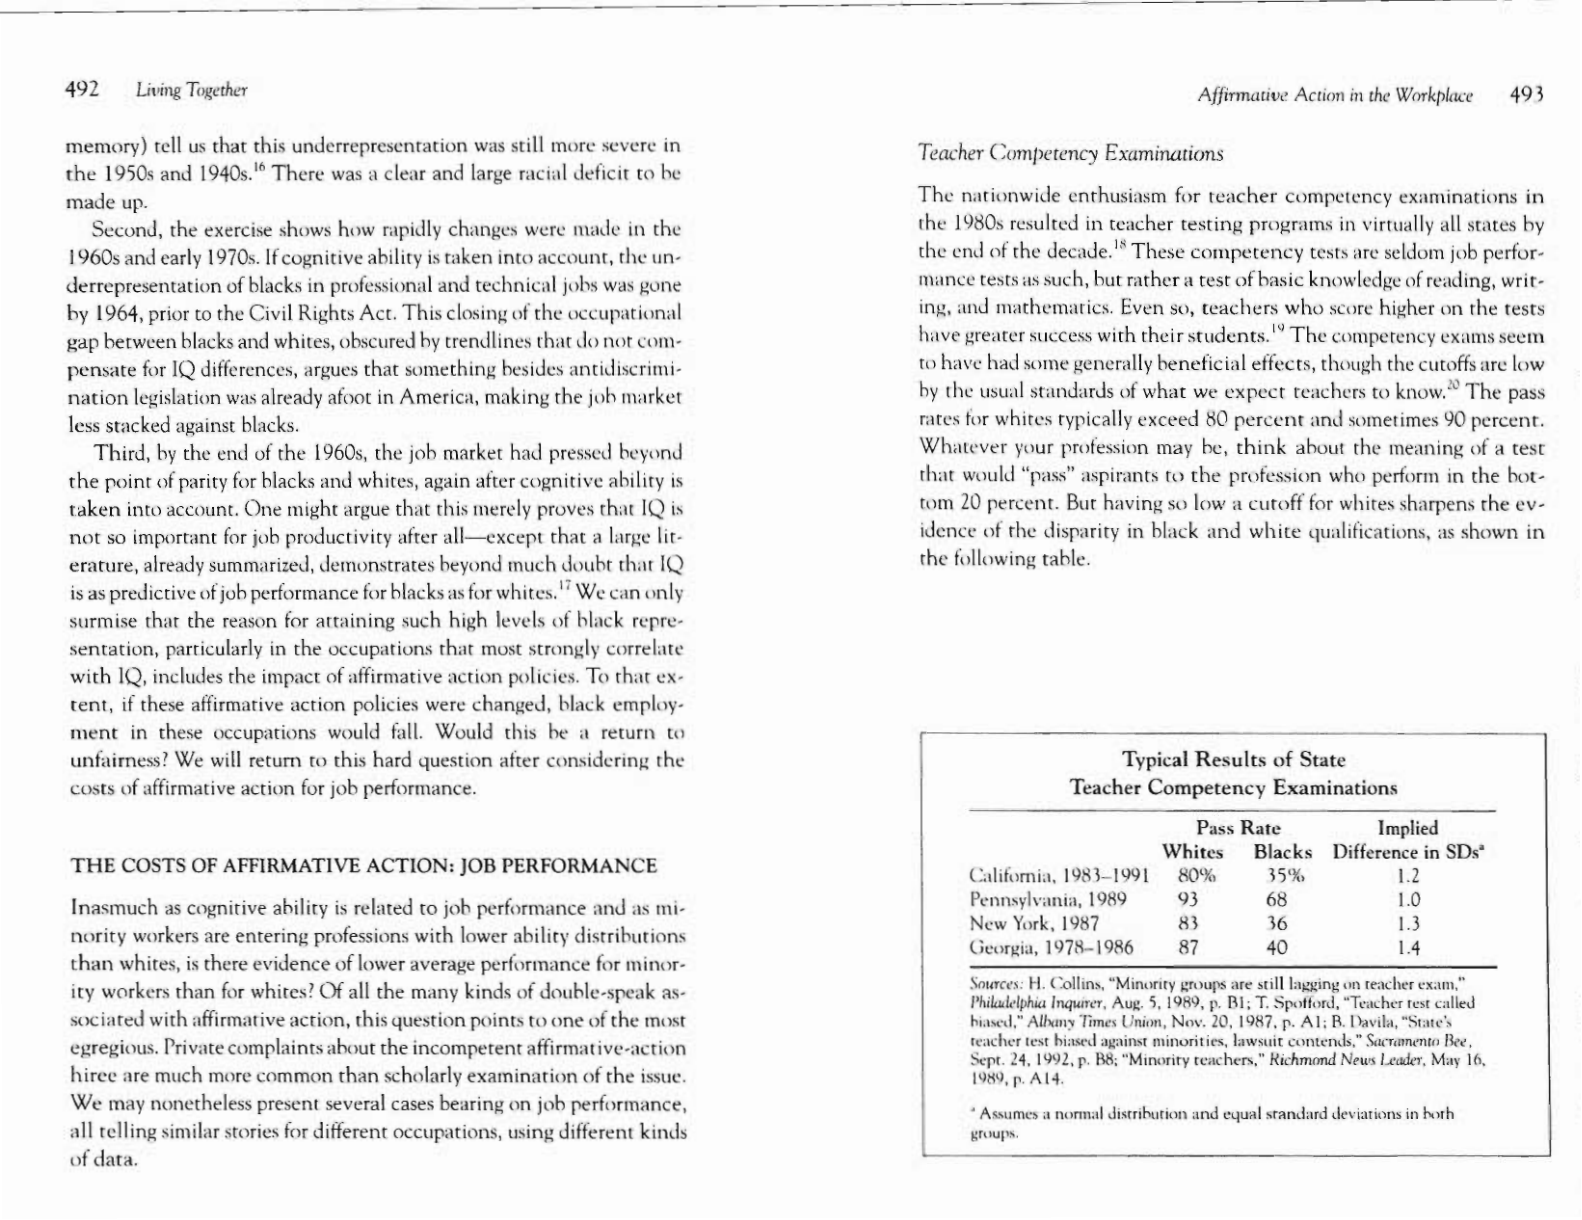
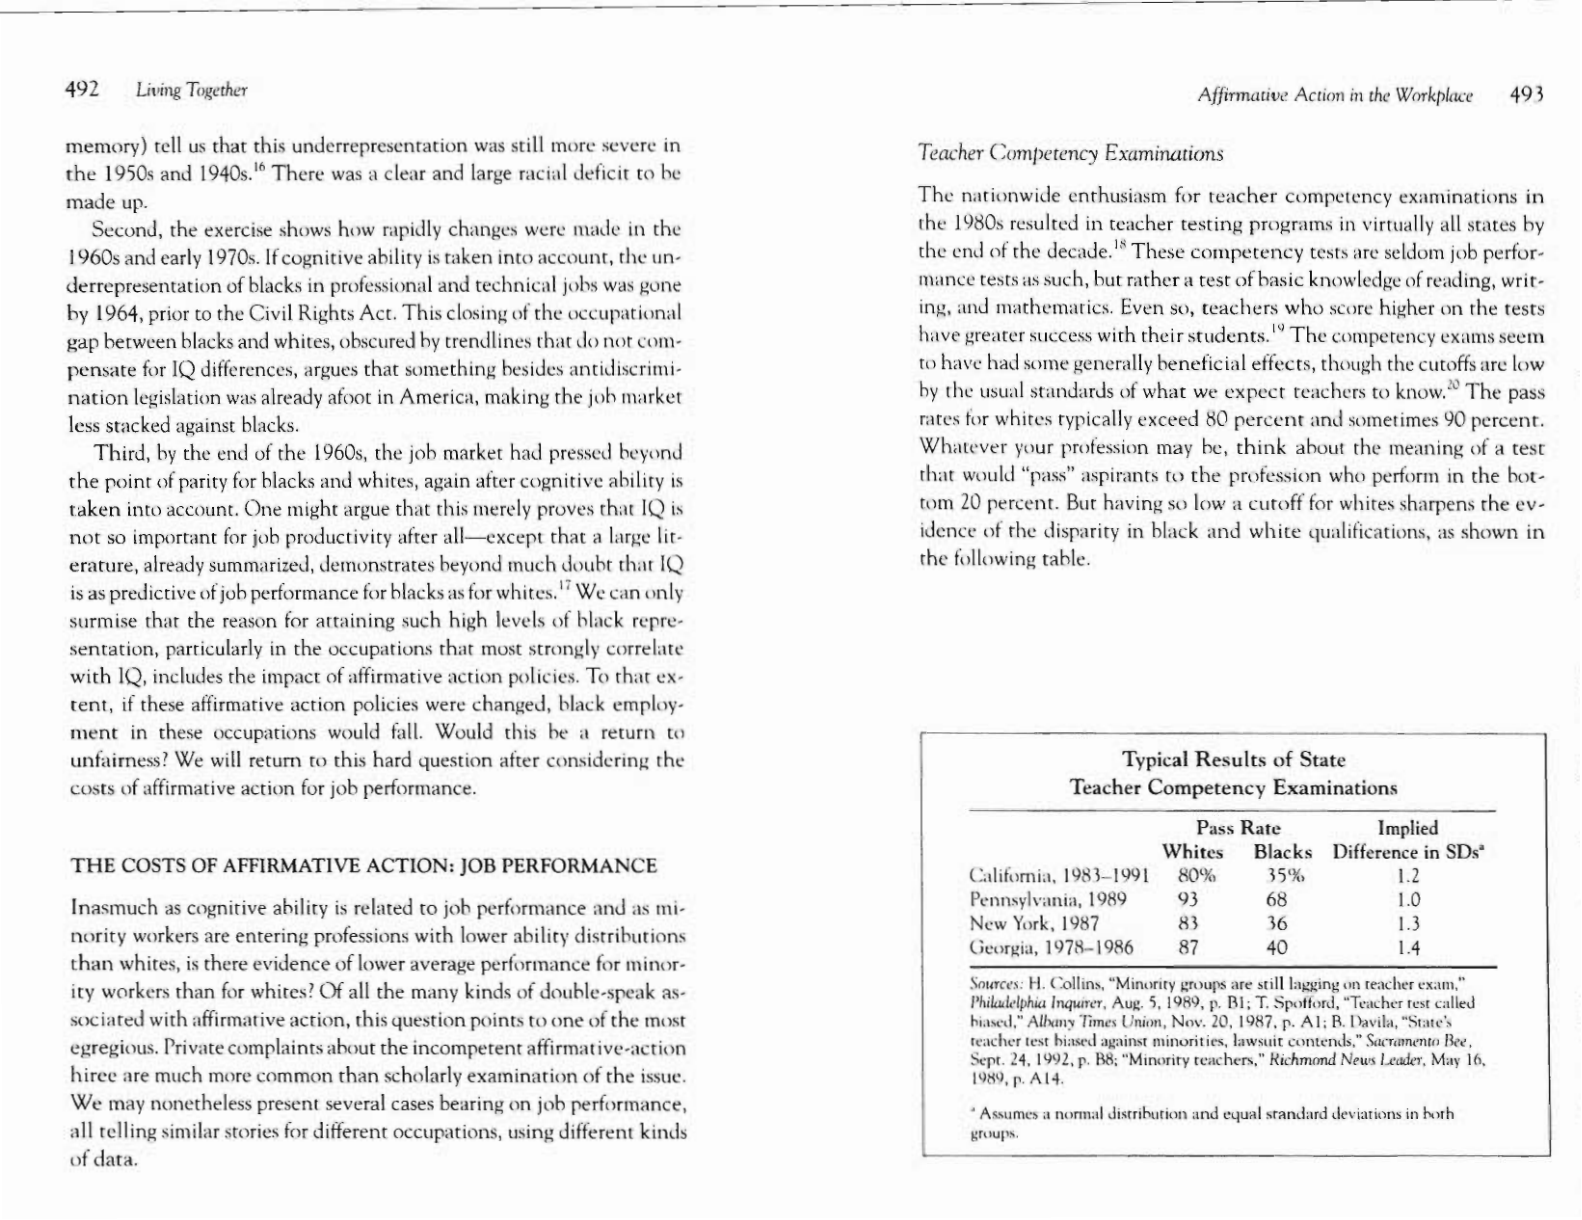
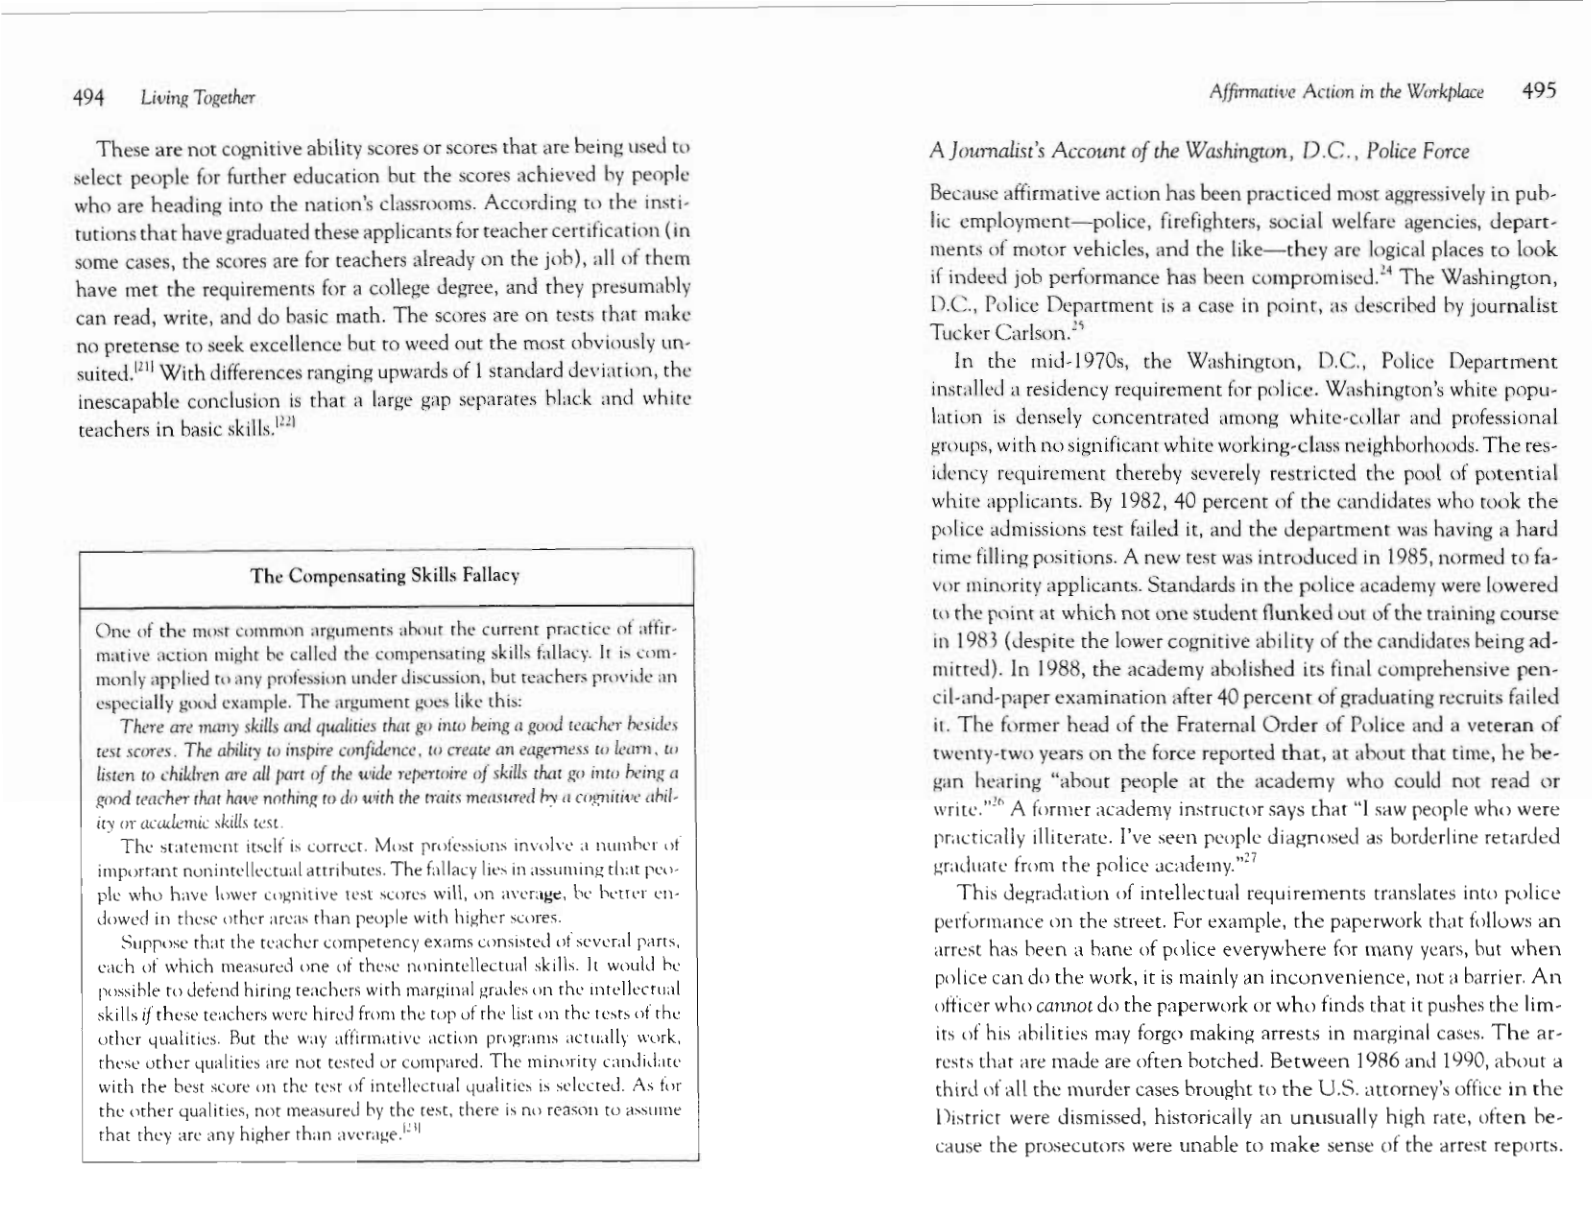
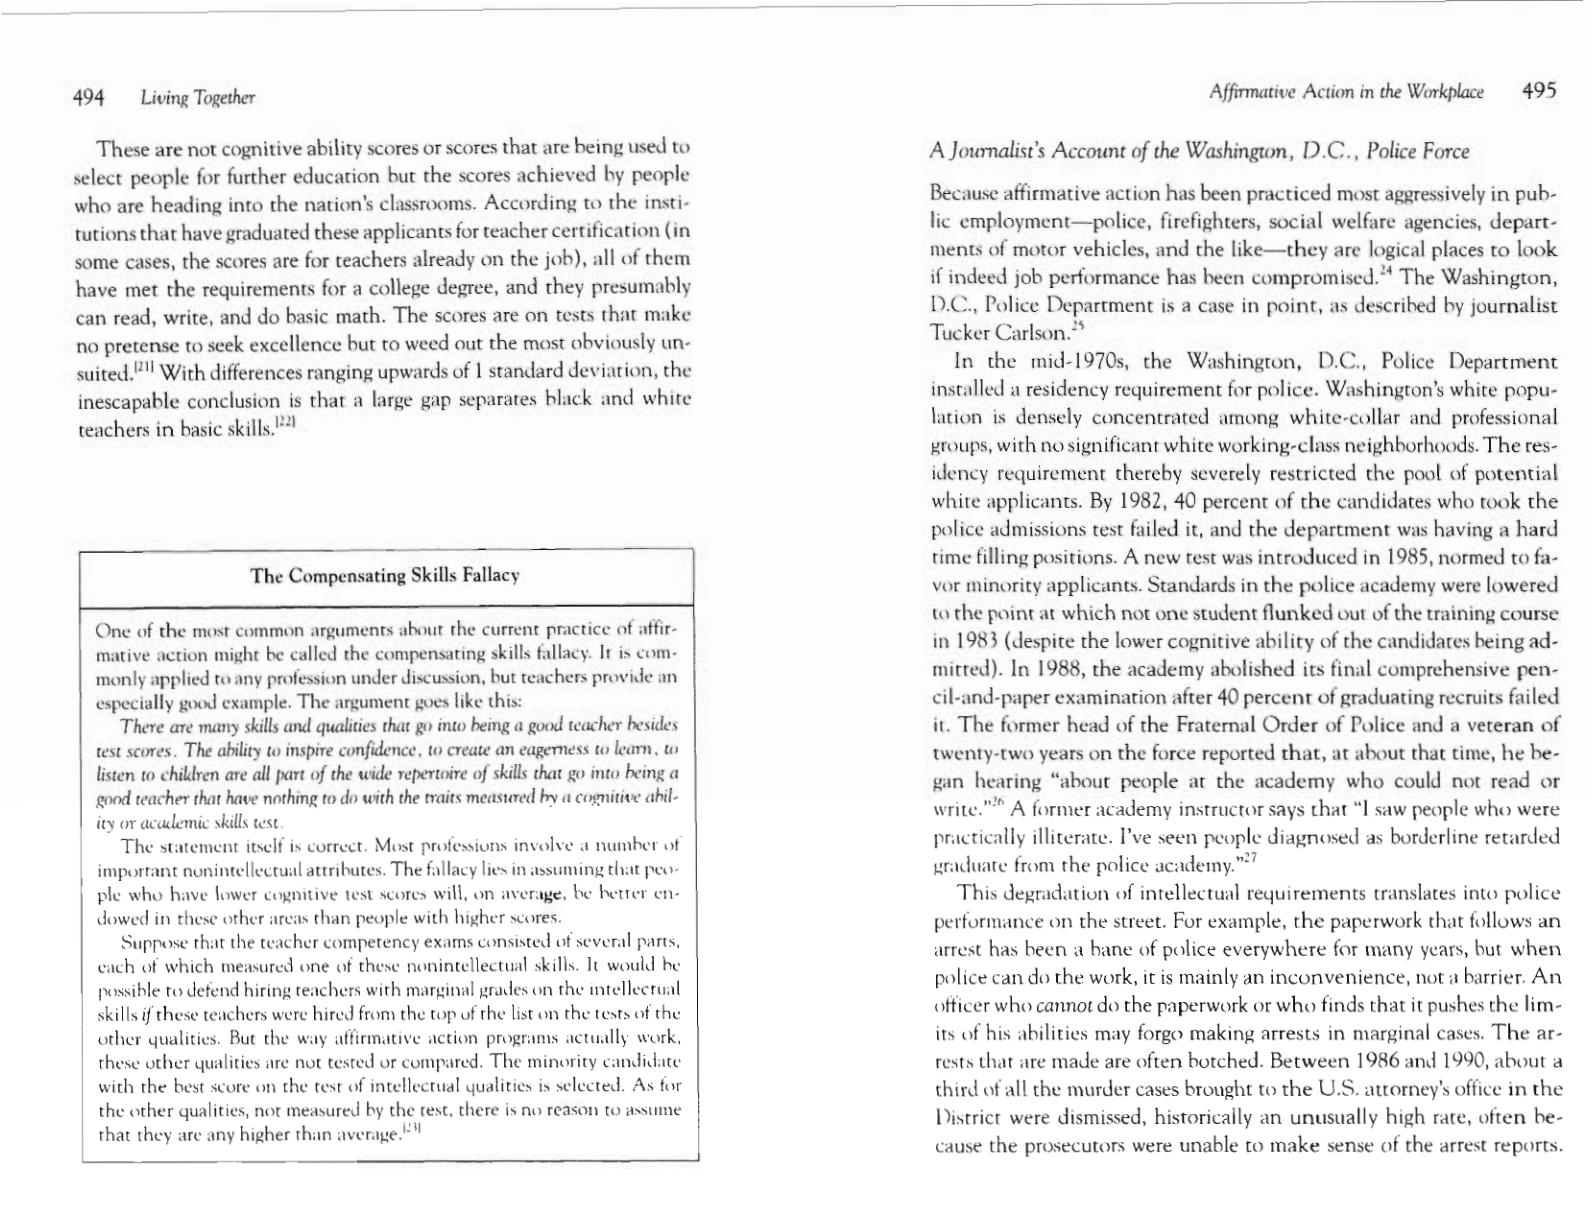
Typical Results of State Teacher Competency Examinations 493
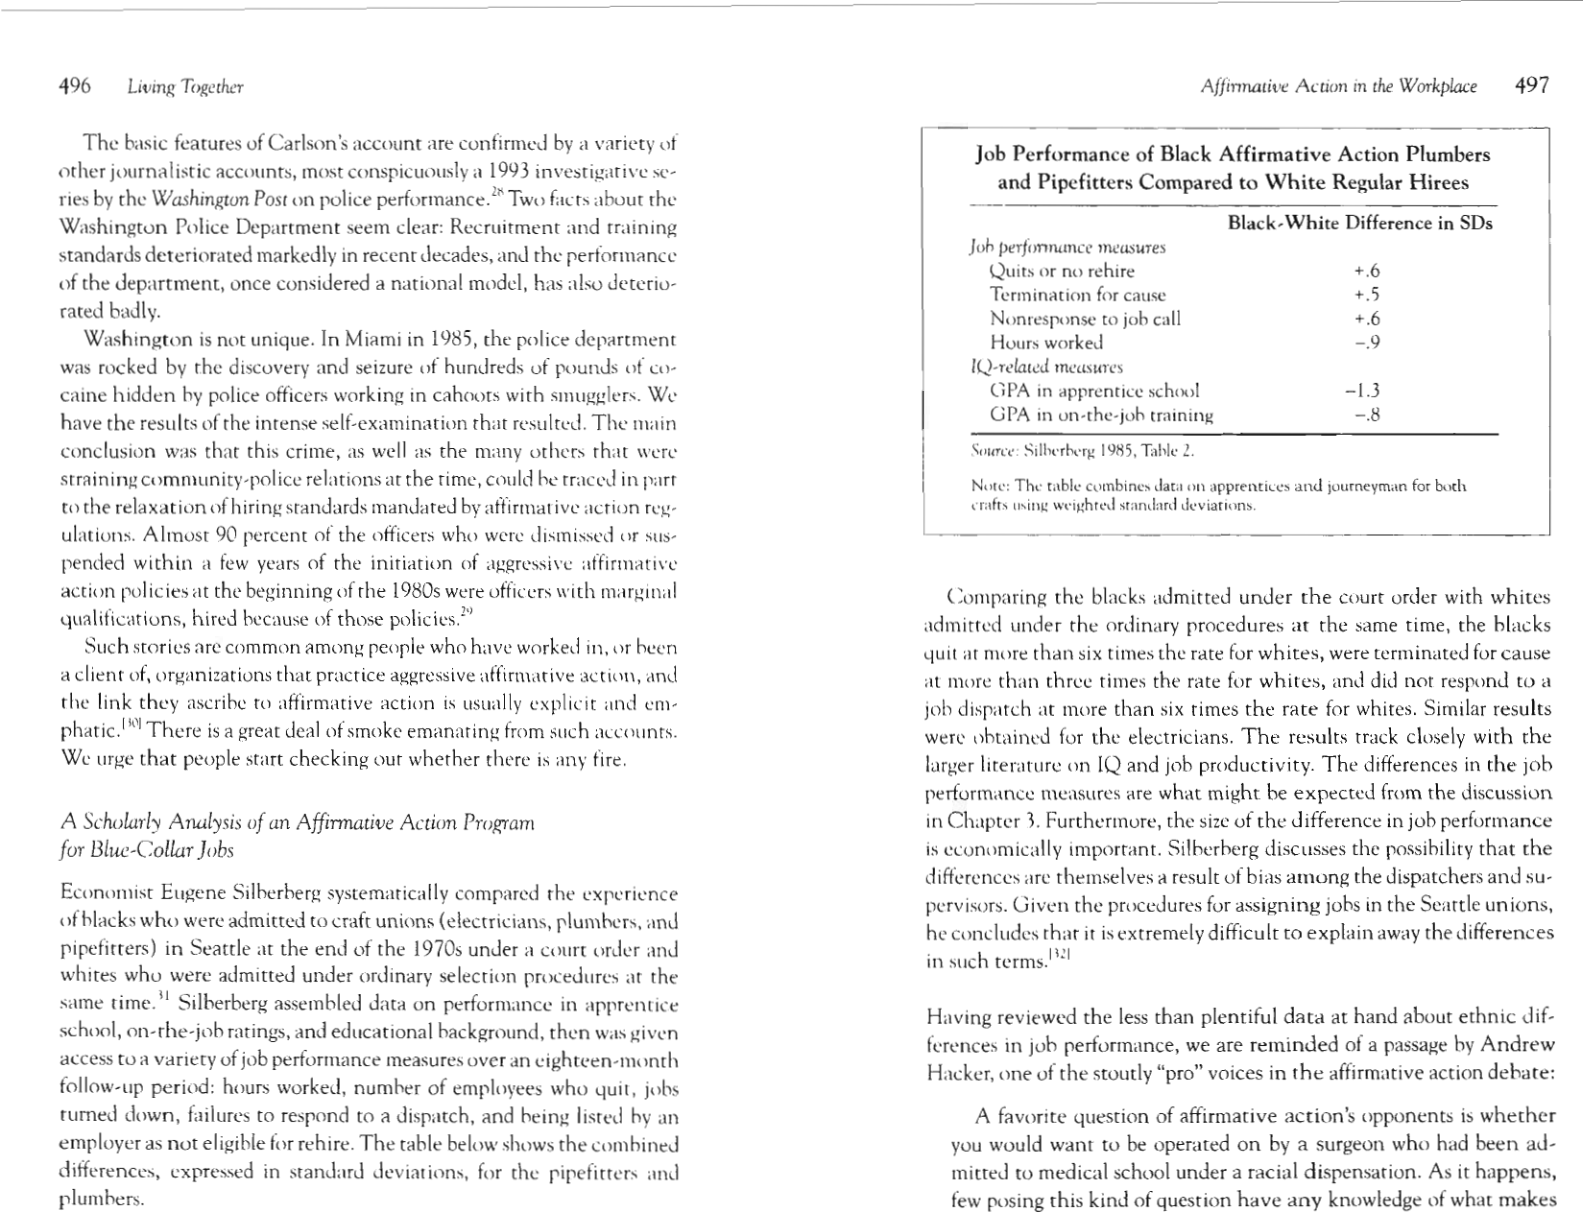
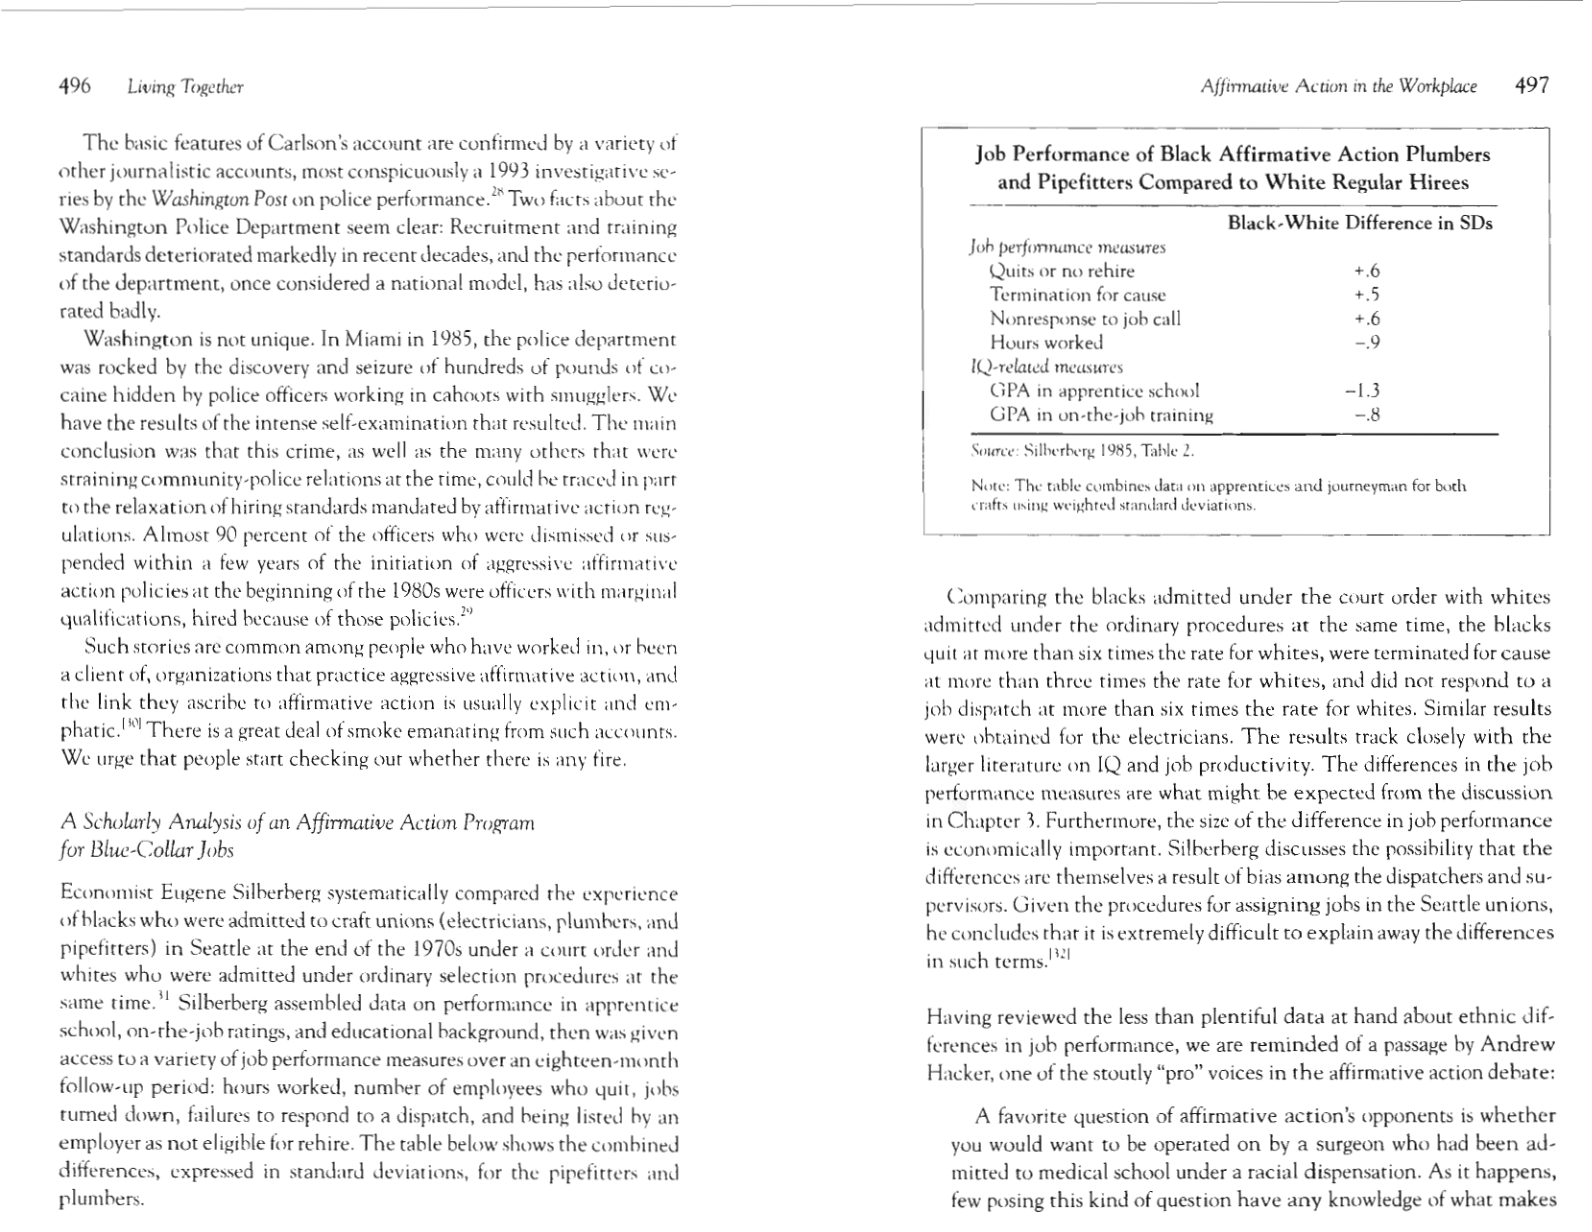
Job Performance of Black Affirmative Action Plumbers and Pipe Fitters
Compared to White Regular Hires 497
A Note to the Reader
We have designed The Bell Curve to be read at several levels.
At the simplest level, it is only about thirty pages long. Each chap-
ter except the Introduction and the final two chapters opens with a
precis of the main findings and conclusions minus any evidence for
them, written in an informal style free of technical terms. You can get
a good idea of what we have to say by reading just those introductory
essays.
The next level is the main text. It is accessible to anyone who en+
joys reading, for example, the science section of the news magazines.
No special knowledge is assumed; everything you need to know to fol-
low all of the discussion is contained within the book. The main text
does include considerable technical material, however. The documen-
tation becomes especially extensive when we come to a topic so con-
troversial that many readers will have a "This can't possibly be true"
reaction.
Sprinkled throughout the book are boxes that add more detail,
discuss alternative ways of thinking about the data, or relate tidbits
that don't quite fit in the text. You may skip any of these without
interrupting the flow of the narrative, but we think they add some-
thing (or they wouldn't be there), and we encourage you to dip into
them.
The endnotes provide the usual scholarly references. Some of them,
indicated in text by endnote numbers enclosed in brackets, add short
discussions that will be of interest mostly to specialists.
Finally, the appendixes elaborate on key issues. For example, readers
who come to the book unfamiliar with statistics will find that Appen-
dix 1 supplies the basics; if you want to know more about the debate
over cultural bias in intelligence tests, Appendix 5 guides you through
the literature on that issue; and so on. Other appendixes lay out the sta.
tistical detail that could not be fit into the main text and was too bulky
for a note.
Intelligence and Public Policy
- The book explores the sensitive and controversial relationship between intellectual capacity and the future of American society.
- The authors acknowledge that the topic is often avoided due to fears of promoting racism or recalling historical totalitarian eugenic schemes.
- The text utilizes a variety of supplemental materials, including detailed boxes, scholarly endnotes, and technical appendixes to support its claims.
- A central premise is that despite the triumph of equal rights, a cognitive elite is emerging and flourishing while others stagnate.
- The authors adopt a specific stylistic convention for gendered pronouns, opting to use the first author's gender throughout the text.
- The narrative aims to bridge the gap between academic data found in university journals and the public's reluctance to discuss cognitive differences.
The relationships we will be discussing are among the most sensitive in contemporary America—so sensitive that hardly anyone writes or talks about them in public.
xviii
List of Tables
Criminality and IQ Among White Males 246
The Odds of Getting Involved with the Police and Courts for Young
White Males
247
The Odds of Doing Ttme for Young White Males 248
Whites and the Middle-Class Values Index 264
Reductions in the Black-White Difference on the National Assessment
of Educational Progress 29 1
Black Wages As a Percentage of White Wages, 1989 324
Age at Childbearing 352
The Next Generation So Far, for Three Ethnic Groups in the
NLSY
354
Ethnic Differences in Test Scores in Two Generations 356
Regression to the Mean and Ethnic Differences in Test Scores in Two
Generations 357
IQ Equivalents for the Deciles 37 1
Prevalence of Low IQ Among Mothers of Children with Developmen-
tal Problems 383
What SAT Score Decline? The Results of the National Norm Stuclies,
1955-1983
422
Affirmative Action Weights: The Law School Aptitude Test
455
Affirtnative Action Weights: The Medical College Admissions
Test
456
Applicants to Graduate Schools 458
The Black-White IQ Difference by Job Category, 1990 488
Typical Results of State Teacher Competency Examinations 493
Job Performance of Black Affirmative Action Plumbers and Pipe Fitters
Compared to White Regular Hires 497
A Note to the Reader
We have designed The Bell Curve to be read at several levels.
At the simplest level, it is only about thirty pages long. Each chap-
ter except the Introduction and the final two chapters opens with a
precis of the main findings and conclusions minus any evidence for
them, written in an informal style free of technical terms. You can get
a good idea of what we have to say by reading just those introductory
essays.
The next level is the main text. It is accessible to anyone who en+
joys reading, for example, the science section of the news magazines.
No special knowledge is assumed; everything you need to know to fol-
low all of the discussion is contained within the book. The main text
does include considerable technical material, however. The documen-
tation becomes especially extensive when we come to a topic so con-
troversial that many readers will have a "This can't possibly be true"
reaction.
Sprinkled throughout the book are boxes that add more detail,
discuss alternative ways of thinking about the data, or relate tidbits
that don't quite fit in the text. You may skip any of these without
interrupting the flow of the narrative, but we think they add some-
thing (or they wouldn't be there), and we encourage you to dip into
them.
The endnotes provide the usual scholarly references. Some of them,
indicated in text by endnote numbers enclosed in brackets, add short
discussions that will be of interest mostly to specialists.
Finally, the appendixes elaborate on key issues. For example, readers
who come to the book unfamiliar with statistics will find that Appen-
dix 1 supplies the basics; if you want to know more about the debate
over cultural bias in intelligence tests, Appendix 5 guides you through
the literature on that issue; and so on. Other appendixes lay out the sta.
tistical detail that could not be fit into the main text and was too bulky
for a note.
xx
Note to Reader
Regarding those pesky impersonal third-person singular pro-
nouns and other occasions when the authors must assign a gender to a
fictitious person used to illustrate a point, it seems to us there is a sim-
ple, fair solution, which we hereby endorse: Unless there are obvious
reasons not to, use the gender of the first author. We use he throughout.
Preface
This book is about differences in intellectual capacity among people and
groups and what those differences mean for America's future. The rela-
tionships we will be discussir~g are among the most sensitive in con-
temporary America-so
sensitive that hardly anyone writes or talks
about them in public. It is not for lack of information, as you will see.
On the contrary, knowledge about the connections between intelli-
gence and American life has been accumulating for years, available in
the journals held by any good university library and on the computer
tapes and disks of public use databases.
People have shied from the topic for many reasons. Some think that
the concept of intelligence has been proved a fraud. Others recall to-
talitarian eugenic schemes based on IQ scores or worry about such
schemes arising once the subject breaks into the open. Many fear that
discussing intelligence will promote racism.
The friends and colleagues whose concerns we take most seriously say
something like this: "Yes, we acknowledge that intelligence is impor-
tant and that people differ. But the United States is founded o n the prin-
ciple that people should be equal under the law. So what
relevance can individual differences in intelligence have to puhlic pol-
icy? What good can come of writing this book?" In answer, we ask these
friends and you, the reader, to share for a moment our view of the situ-
ation, perhaps suppressing some doubts and assuming as true things that
we will subsequently try to prove are true. Here is our story:
A great nation, founded on principles of individual liberty and self-
government that constitute the crowning achievement of statecraft,
approaches the end of the twentieth century. Equality of rights-
another central principle-has
been implanted more deeply and more
successfully than in any other society in history. Yet even as the princi-
ple of equal rights triumphs, strange things begin to happen to two srnall
segments of the population.
In one segment, life gets better in many ways. The people in this group
are welcomed at the best colleges, then at the best graduate and profes-
xxii
Preface
sional schools, regardless of their parents' wealth. After they complete
their education, they enter fulfilling and prestigious careers. Their in-
comes continue to rise even when income growth stagnates for every-
one else. By their maturity, these fortunate ones commonly have
six-figure incomes. Technology works in their behalf, expanding their
options and their freedom, putting unprecedented resources at their
command, enhancing their ability to do what they enjoy doing. And as
these good things happen to them, they gravitate to one another, in-
creasingly enabled by their affluence and by technology to work to-
gether and live in one another's company-and
in isolation from
everybody else.
In the other group, life gets worse, and its members collect at the hot-
tom of society. Poverty is severe, drugs and crime are rampant, ancl the
traditional family all but disappears. Economic growth passes them by.
Technology is not a partner in their lives but an electronic opiate. Thcy
live together in urban centers or scattered in rural backwaters, hilt their
presence hovers over the other parts of town and countryside as well,
creating fear and resentment in the rest of society that is seldom openly
expressed hut festers nonetheless.
Pressures from these contrasting movements at the opposite ends of
society put terrific stress on the entire structure. The mass of the nation
belongs to neither group, but their lives are increasingly shaped hy the
power of the fortunate few and the plight of the despairing few. The cul-
ture's sense of what is right and wrong, virtuous and mean, attainable
and unattainable-most
important, its sense of how people are ta live
together-is
altered in myriad ways. The fragile web of civility, mutual
regard, and mutual obligations at the heart of any happy society begins
to tear.
In trying to think through what is happening and why and in trying
to understand thereby what ought: to be done, the nation's social scien-
tists and journalists and politicians seek explanations. They examine
changes in the economy, changes in demographics, changes in the cul-
ture. They propose solutions founded on better education, on more and
better jobs, on specific social interventions. But they ignore an under-
lying element that has shaped the changes: human intelligence-the
way it varies within the American population and its crucially chang-
ing role in our destinies during the last half of the twentieth century. To
try to come to grips with the nation's problems without understanding
the role of intelligence is to see through a glass darkly indeed, to grope
Preface
xxiii
with symptoms instead of causes, to stumble into supposed remedies that
have no chance of working.
We are not indifferent to the ways in which this book, wrongly con-
strued, might do harm. We have worried about them from the day we
set to work. But there can be no real progress in solving America's so-
cial problems when they are as misperceived as they are today. What
good can come of understanding the relationship of intelligence to so-
cial structure and public policy? Little good can come without it.
Intelligence and Social Stratification
- The affluent elite are increasingly using technology and resources to isolate themselves from the rest of society.
- A growing underclass faces severe poverty and social decay, viewing technology as an 'electronic opiate' rather than a tool.
- The divergence between these two extremes creates societal stress that tears at the 'fragile web of civility' and mutual obligation.
- Social scientists and politicians often fail to address the underlying role of human intelligence in these shifting social dynamics.
- The authors argue that ignoring the variance of intelligence leads to superficial solutions that cannot solve deep-seated social problems.
- The book aims to confront the relationship between intelligence and social structure despite the potential for controversy.
The fragile web of civility, mutual regard, and mutual obligations at the heart of any happy society begins to tear.
xxii
Preface
sional schools, regardless of their parents' wealth. After they complete
their education, they enter fulfilling and prestigious careers. Their in-
comes continue to rise even when income growth stagnates for every-
one else. By their maturity, these fortunate ones commonly have
six-figure incomes. Technology works in their behalf, expanding their
options and their freedom, putting unprecedented resources at their
command, enhancing their ability to do what they enjoy doing. And as
these good things happen to them, they gravitate to one another, in-
creasingly enabled by their affluence and by technology to work to-
gether and live in one another's company-and
in isolation from
everybody else.
In the other group, life gets worse, and its members collect at the hot-
tom of society. Poverty is severe, drugs and crime are rampant, ancl the
traditional family all but disappears. Economic growth passes them by.
Technology is not a partner in their lives but an electronic opiate. Thcy
live together in urban centers or scattered in rural backwaters, hilt their
presence hovers over the other parts of town and countryside as well,
creating fear and resentment in the rest of society that is seldom openly
expressed hut festers nonetheless.
Pressures from these contrasting movements at the opposite ends of
society put terrific stress on the entire structure. The mass of the nation
belongs to neither group, but their lives are increasingly shaped hy the
power of the fortunate few and the plight of the despairing few. The cul-
ture's sense of what is right and wrong, virtuous and mean, attainable
and unattainable-most
important, its sense of how people are ta live
together-is
altered in myriad ways. The fragile web of civility, mutual
regard, and mutual obligations at the heart of any happy society begins
to tear.
In trying to think through what is happening and why and in trying
to understand thereby what ought: to be done, the nation's social scien-
tists and journalists and politicians seek explanations. They examine
changes in the economy, changes in demographics, changes in the cul-
ture. They propose solutions founded on better education, on more and
better jobs, on specific social interventions. But they ignore an under-
lying element that has shaped the changes: human intelligence-the
way it varies within the American population and its crucially chang-
ing role in our destinies during the last half of the twentieth century. To
try to come to grips with the nation's problems without understanding
the role of intelligence is to see through a glass darkly indeed, to grope
Preface
xxiii
with symptoms instead of causes, to stumble into supposed remedies that
have no chance of working.
We are not indifferent to the ways in which this book, wrongly con-
strued, might do harm. We have worried about them from the day we
set to work. But there can be no real progress in solving America's so-
cial problems when they are as misperceived as they are today. What
good can come of understanding the relationship of intelligence to so-
cial structure and public policy? Little good can come without it.
Acknowledgments
The first thing that made this book possible was our good fortune in be-
ing where we are-Harvard
University and the American Enterprise In-
stitute. Different as they are in many ways, these two splendid
institutions gave us a gift that is too often taken for granted: freedom
and support to pursue our inquiries wherever they took us.
For learned and often creative advice for dealing with methodologi-
cal issues, our thanks go to James Heckman, Derek Neal, Robert Rosen-
thal, Donald Rubin, Christopher Winship, and the Harvard Psychology
Department's Seminar on the Analysis of Psychological Data. The staff
of the Center for Human Resource Research-Paula
Baker must be sin+
gled out-were
unfailingly ready to answer our questions about the in-
tricacies of the National Longitudinal Survey of Youth. In the world of
psychometrics and testing, we benefited especially from the advice of
Robert Forsyth, Arthur Jensen, Richard Lynn, Len Ramist, Malcolm
Ree, and Frank Schmidt. Others who have read chapters or listened to
us try to explain what we're up to and then have offered advice, or at
least raised their eyebrows usefully, are Douglas Besharov, Eileen
Blumenthal, John Bunzel, John DiIulio, Christopher DeMuth, David
Ellwood, Richard Epstein, Ronald Haskins, James Herrnstein, Karl
Hess, Michael Horowitz, Fred Jewett, Michael Joyce, Cheryl Keller,
Robert Klitgaard, Irving Kristol, Richard Larry, Marlyn Lewis, Glenn
Loury, Harvey Mansfield, Frank Miele, Michael Novak, Warren Reed,
Daniel Seligman, Irwin Stelzer, Joan Kennedy Taylor, Abigail Them.
strcrm, Daniel Vining, Dean Whitla, James Wilson, and Douwe Yntema.
Along with some of those already mentioned, John Bishop, Philip Cook,
George Borjas, Robert Frank, Sandra Scarr, and Richard Weinberg pro-
vided us with drafts of their ongoing work that filled in missing pieces
of the puzzle.
We took unblushing advantage of the energy and good nature of re-
search assistants, with Kris Kirby and Ira Carnahan taking on some huge
tasks early in the work, followed by the invaluable help of Kristin
The Genesis of The Bell Curve
- The authors acknowledge a vast network of scholars, editors, and research assistants who contributed to the development of the book's controversial thesis.
- One research assistant requested anonymity specifically to protect their 'viable political future,' highlighting the perceived risk of the project.
- The book was a deeply symbiotic collaboration between Herrnstein and Murray, spanning nearly five years of full-time work.
- The authors' wives provided critical support and editorial judgment despite their initial apprehension regarding the project's controversial nature.
- The text asserts that while intelligence is an ancient, universal concept, it has become an intellectual 'pariah' over the last three decades.
- The authors explicitly challenge the modern consensus that intelligence testing is a product of racism or statistical fraud.
Gossip about who in the tribe is cleverest has probably been a topic of conversation around the fire since fires, and conversation, were invented.
Acknowledgments
The first thing that made this book possible was our good fortune in be-
ing where we are-Harvard
University and the American Enterprise In-
stitute. Different as they are in many ways, these two splendid
institutions gave us a gift that is too often taken for granted: freedom
and support to pursue our inquiries wherever they took us.
For learned and often creative advice for dealing with methodologi-
cal issues, our thanks go to James Heckman, Derek Neal, Robert Rosen-
thal, Donald Rubin, Christopher Winship, and the Harvard Psychology
Department's Seminar on the Analysis of Psychological Data. The staff
of the Center for Human Resource Research-Paula
Baker must be sin+
gled out-were
unfailingly ready to answer our questions about the in-
tricacies of the National Longitudinal Survey of Youth. In the world of
psychometrics and testing, we benefited especially from the advice of
Robert Forsyth, Arthur Jensen, Richard Lynn, Len Ramist, Malcolm
Ree, and Frank Schmidt. Others who have read chapters or listened to
us try to explain what we're up to and then have offered advice, or at
least raised their eyebrows usefully, are Douglas Besharov, Eileen
Blumenthal, John Bunzel, John DiIulio, Christopher DeMuth, David
Ellwood, Richard Epstein, Ronald Haskins, James Herrnstein, Karl
Hess, Michael Horowitz, Fred Jewett, Michael Joyce, Cheryl Keller,
Robert Klitgaard, Irving Kristol, Richard Larry, Marlyn Lewis, Glenn
Loury, Harvey Mansfield, Frank Miele, Michael Novak, Warren Reed,
Daniel Seligman, Irwin Stelzer, Joan Kennedy Taylor, Abigail Them.
strcrm, Daniel Vining, Dean Whitla, James Wilson, and Douwe Yntema.
Along with some of those already mentioned, John Bishop, Philip Cook,
George Borjas, Robert Frank, Sandra Scarr, and Richard Weinberg pro-
vided us with drafts of their ongoing work that filled in missing pieces
of the puzzle.
We took unblushing advantage of the energy and good nature of re-
search assistants, with Kris Kirby and Ira Carnahan taking on some huge
tasks early in the work, followed by the invaluable help of Kristin
xxvi
Acknowledgments
Caplice, Joseph Fazioli, and one other who asked to remain anonymous
out of his wish to preserve, as he put it, a viable political future.
All of these people, and others whom we have surely forgotten over
the years, deserve our thanks for their help, but not the risk of being
held accountable for what we've done with it.
We were lucky to have Erwin Glikes as our editor and Amanda Ur-
ban as our agent-the
best in the business, and utterly undaunted by
the hazards of this enterprise. The Bell Curve is Erwin's title, and its man-
uscript was the last he completed editing before his death.
In a list of acknowledgments, we would be remiss not to mention each
other. We decided to write this hook in November of 1989, and since
the spring of 1990 have been working at it nearly full time, for long
stretches much more than full time, in continual collaboration. Our
partnership has led to a more compelling intellectual adventure and a
deeper friendship than we could have imagined. Authorship is illpha-
betical; the work was symbiotic.
At last, how shall we express our thanks to Susan Herrnstein and
Catherine Cox? They could not be, and were not, overjoyed to see their
husbands embark on aproject as controversial as this one. But they have
endured our preoccupation with the book and its intrusion into our fam-
ilies' lives with love and humor. Beyond that, each of them read the en-
tire manuscript, persuasively but affectionately pressing on us the
benefit of their fine judgment, their good sense, and their honesty. In
more ways than one, this book could not have been written without
their help.
Richard J. Herrnstein
Charles Murray
3 June 1994
Introduction
That the word intelligence describes something real and that it varies
from person to person is as universal and ancient as any understanding
about the state of being human. Literate cultures everywhere and
throughout history have had words for saying that some people are
smarter than others. Given the survival value of intelligence, the con-
cept must be still older than that. Gossip about who in the tribe is clever-
est has probably been a topic of conversation around the fire since fires,
and conversation, were invented.
Yet for the last thirty years, the concept of intelligence has hern a
pariah in the world of ideas. The attempt to measure it wit11 tests has
been variously dismissed as an artifact of racism, political reaction, sta-
tistical hungling, and scholarly fraud. Many of you have reached this
page assuming that these accusations are proved. In such a context
comes this book, blithely proceeding on the assumption that intelli-
gence is a reastlnahly well-understood construct, measured with accu-
racy and fairness by any number of standardized mental tests. The rest
of this hook can he hetter followed if you first understand why we can
hold such apparently heterodox views, and for this it is necessary tcl
know sotnething about the story of measured intelligence.
INTELLIGENCE ASCENDANT
Variation in intelligence became the subject of productive scientific
study in the last half of the nineteenth century, stimulated, like so tnany
other intellectual developments of that era, by Charles Darwin's thec~ry
of evolution. Darwin had asserted that the transtnissiot~ of inherited in-
telligence was a key step in human evolution, driving our simian an-
cestors apart from the other apes. Sir Francis Galton, Darwin's young
cousin and already a celebrated geographer in his own right, seized on
this idea and set out to demonstrate its continuing relevance hy using
the great families of Britain as a primary source of data. He presented
evidence that intellectual capacity of various sorts ran in fatnilies in
The Rise of Intelligence Testing
- The scientific study of intelligence was catalyzed by Darwin's theory of evolution and Sir Francis Galton's pursuit of hereditary genius.
- Galton pioneered the concept that intellectual capacity is a measurable, quantitative trait that varies uniquely among individuals.
- Early attempts to measure intelligence through sensory acuity failed, leading Alfred Binet to focus on reasoning and pattern recognition.
- By the late 19th century, standardized mental testing had spread globally across the United States, Europe, and Japan.
- The development of the correlation coefficient allowed scientists to precisely quantify the relationship between different mental variables.
- Charles Spearman's statistical breakthroughs in 1904 laid the foundation for modern psychometric methodology and its subsequent controversies.
So began a long and deeply controversial association between intelligence and heredity that remains with us today.
xxvi
Acknowledgments
Caplice, Joseph Fazioli, and one other who asked to remain anonymous
out of his wish to preserve, as he put it, a viable political future.
All of these people, and others whom we have surely forgotten over
the years, deserve our thanks for their help, but not the risk of being
held accountable for what we've done with it.
We were lucky to have Erwin Glikes as our editor and Amanda Ur-
ban as our agent-the
best in the business, and utterly undaunted by
the hazards of this enterprise. The Bell Curve is Erwin's title, and its man-
uscript was the last he completed editing before his death.
In a list of acknowledgments, we would be remiss not to mention each
other. We decided to write this hook in November of 1989, and since
the spring of 1990 have been working at it nearly full time, for long
stretches much more than full time, in continual collaboration. Our
partnership has led to a more compelling intellectual adventure and a
deeper friendship than we could have imagined. Authorship is illpha-
betical; the work was symbiotic.
At last, how shall we express our thanks to Susan Herrnstein and
Catherine Cox? They could not be, and were not, overjoyed to see their
husbands embark on aproject as controversial as this one. But they have
endured our preoccupation with the book and its intrusion into our fam-
ilies' lives with love and humor. Beyond that, each of them read the en-
tire manuscript, persuasively but affectionately pressing on us the
benefit of their fine judgment, their good sense, and their honesty. In
more ways than one, this book could not have been written without
their help.
Richard J. Herrnstein
Charles Murray
3 June 1994
Introduction
That the word intelligence describes something real and that it varies
from person to person is as universal and ancient as any understanding
about the state of being human. Literate cultures everywhere and
throughout history have had words for saying that some people are
smarter than others. Given the survival value of intelligence, the con-
cept must be still older than that. Gossip about who in the tribe is clever-
est has probably been a topic of conversation around the fire since fires,
and conversation, were invented.
Yet for the last thirty years, the concept of intelligence has hern a
pariah in the world of ideas. The attempt to measure it wit11 tests has
been variously dismissed as an artifact of racism, political reaction, sta-
tistical hungling, and scholarly fraud. Many of you have reached this
page assuming that these accusations are proved. In such a context
comes this book, blithely proceeding on the assumption that intelli-
gence is a reastlnahly well-understood construct, measured with accu-
racy and fairness by any number of standardized mental tests. The rest
of this hook can he hetter followed if you first understand why we can
hold such apparently heterodox views, and for this it is necessary tcl
know sotnething about the story of measured intelligence.
INTELLIGENCE ASCENDANT
Variation in intelligence became the subject of productive scientific
study in the last half of the nineteenth century, stimulated, like so tnany
other intellectual developments of that era, by Charles Darwin's thec~ry
of evolution. Darwin had asserted that the transtnissiot~ of inherited in-
telligence was a key step in human evolution, driving our simian an-
cestors apart from the other apes. Sir Francis Galton, Darwin's young
cousin and already a celebrated geographer in his own right, seized on
this idea and set out to demonstrate its continuing relevance hy using
the great families of Britain as a primary source of data. He presented
evidence that intellectual capacity of various sorts ran in fatnilies in
2
Introduction
Introduction
3
Hereditary Genius, published just a decade after the appearance of Ori-
gin of Species in 1859. So began a long and deeply controversial associ-
ation between intelligence and heredity that remains with us today.'
Galton realized that he needed a precise, quantitative measure of the
mental qualities he was trying to analyze, and thus he was led to put in
formal terms what most people had always taken for granted: People
vary in their intellectual abilities and the differences matter, to them
personally and to society.' Not only are some people smarter than oth-
ers, said Galton, but each person's pattern of intellectual abilities is
unique. People differ in their talents, their intellectual strengths and
weaknesses, their preferred forms of imagery, their mental vigor.
Working from these observations, Galton tried to devise an intelli-
gence test as we understand the term today: a set of items probing in*
tellectual capacities that could be graded objectively. Galton had the
idea that intelligence would surface in the form of sensitivity of per-
ceptions, so he constructed tests that relied on measures of acuity of
sight and hearing, sensitivity to slight pressures on the skin, and speed
of reaction to simple stimuli. His tests failed, but others followed where
Galton had led. His most influential immediate successor, a French psy-
chologist, Alfred Binet, soon developed questions that attempted to
measure intelligence by measuring a person's ability to reason, draw
analogies, and identify pattems."T'hese tests, crude as they were by mod-
em standards, met the key criterion that Galton's tests could not: Their
results generally accorded with common understandings of high and low
intelligence.
By the end of the nineteenth century, mental tests in a form that
we would recognize today were already in use throughout the British
Commonwealth, the United States, much of continental Europe, and
Japan.M Then, in 1904, a former British Army officer named Charles
Spearman made a conceptual and statistical breakthrough that has
shaped both the development and much of the methodological contro-
versy about mental tests ever sincea5
By that time, considerable progress had been made in statistics. Un.
like Galton in his early years, investigators in the early twentieth cene
tury had available to them an invaluable number, the correhtion
coefficient first devised by Galton himself in 1888 and elaborated by his
disciple, Karl Pears~n.~
Before the correlation coefficient was available,
scientists could observe that two variables, such as height and weight,
seemed to vary together (the taller the heavier, by and large), but they
had no way of saying exactly how much they were related. With Pear-
son's r, as the coefficient was labeled, they now could specify "how much"
of a relationship existed, on a scale ranging from a minimum of -1 (for
perfectly inverse relationships) to + 1 (for perfectly direct relationships).
Spearman noted that as the data from many different mental tests
were accumulating, a curious result kept turning up: If the same group
of people took two different mental tests, anyone who did well (or
poorly) on one test tended to do similarly well (or poorly) on the other.
In statistical terms, the scores on the two tests were positively corre-
lated. This outcome did not seem to depend on the specific content of
the tests. As long as the tests involved cognitive skills of one sort or an-
other, the positive correlations appeared. Furthermore, individual items
within tests showed positive correlations as well. If there was any cor-
relation at all between a pair of items, a person who got one of them
right tended to get the other one right, and vice versa for those who got
it wrong. In fact, the pattern was stronger than that. It turned out to be
nearly impossible to devise items that plausibly measured some cogni-
tive skill and were not positively correlated with other items that plau.
sibly measured some cognitive skill, however disparate the pair of skills
might appear to be.
The size of the positive correlations among the pairs of items in a test
did vary a lot, however, and it was this combination-positive
correla-
tions throughout the correlation matrix, but of varying magnitudes-
that inspired Spearman's insight.17] Why are almost all the correlations
positive? Spearman asked. Because, he answered, they are tapping into
the same general trait. Why are the magnitudes different? Because some
items are more closely related to this general trait than others.'81
Spearman's statistical method, an early example of what has since be-
come known as factor analysis, is complex, and we will explore some of
those complexities. But, for now, the basis for factor analysis can be read-
ily understood. Insofar as two items tap into the same trait, they share
something in common. Spearman developed a method for estimating
how much sharing was going on in a given set of data. From almost any
such collection of mental or academic test scores, Spearman's method
of analysis uncovered evidence for a unitary mental factor, which he
named g, for "general intelligence." The evidence for a general factor in
intelligence was pervasive but circumstantial, based on statistical analy-
sis rather than direct observation. Its reality therefore was, and remains,
arguable.
The Discovery of g
- Charles Spearman observed that performance across disparate cognitive tests is almost always positively correlated.
- Spearman proposed the existence of 'g', a general intelligence factor that serves as a unitary mental trait underlying all cognitive tasks.
- The varying strength of correlations between test items suggests that some tasks tap into this general trait more directly than others.
- Spearman defined 'g' specifically as the capacity for complex mental work and the ability to infer and apply relationships from experience.
- This statistical approach, known as factor analysis, shifted the focus from specific learning abilities to a broader measure of intellectual capacity.
- The development of the intelligence quotient (IQ) followed shortly after, leading to large-scale applications such as U.S. Army recruit classification.
It turned out to be nearly impossible to devise items that plausibly measured some cognitive skill and were not positively correlated with other items that plausibly measured some cognitive skill, however disparate the pair of skills might appear to be.
2
Introduction
Introduction
3
Hereditary Genius, published just a decade after the appearance of Ori-
gin of Species in 1859. So began a long and deeply controversial associ-
ation between intelligence and heredity that remains with us today.'
Galton realized that he needed a precise, quantitative measure of the
mental qualities he was trying to analyze, and thus he was led to put in
formal terms what most people had always taken for granted: People
vary in their intellectual abilities and the differences matter, to them
personally and to society.' Not only are some people smarter than oth-
ers, said Galton, but each person's pattern of intellectual abilities is
unique. People differ in their talents, their intellectual strengths and
weaknesses, their preferred forms of imagery, their mental vigor.
Working from these observations, Galton tried to devise an intelli-
gence test as we understand the term today: a set of items probing in*
tellectual capacities that could be graded objectively. Galton had the
idea that intelligence would surface in the form of sensitivity of per-
ceptions, so he constructed tests that relied on measures of acuity of
sight and hearing, sensitivity to slight pressures on the skin, and speed
of reaction to simple stimuli. His tests failed, but others followed where
Galton had led. His most influential immediate successor, a French psy-
chologist, Alfred Binet, soon developed questions that attempted to
measure intelligence by measuring a person's ability to reason, draw
analogies, and identify pattems."T'hese tests, crude as they were by mod-
em standards, met the key criterion that Galton's tests could not: Their
results generally accorded with common understandings of high and low
intelligence.
By the end of the nineteenth century, mental tests in a form that
we would recognize today were already in use throughout the British
Commonwealth, the United States, much of continental Europe, and
Japan.M Then, in 1904, a former British Army officer named Charles
Spearman made a conceptual and statistical breakthrough that has
shaped both the development and much of the methodological contro-
versy about mental tests ever sincea5
By that time, considerable progress had been made in statistics. Un.
like Galton in his early years, investigators in the early twentieth cene
tury had available to them an invaluable number, the correhtion
coefficient first devised by Galton himself in 1888 and elaborated by his
disciple, Karl Pears~n.~
Before the correlation coefficient was available,
scientists could observe that two variables, such as height and weight,
seemed to vary together (the taller the heavier, by and large), but they
had no way of saying exactly how much they were related. With Pear-
son's r, as the coefficient was labeled, they now could specify "how much"
of a relationship existed, on a scale ranging from a minimum of -1 (for
perfectly inverse relationships) to + 1 (for perfectly direct relationships).
Spearman noted that as the data from many different mental tests
were accumulating, a curious result kept turning up: If the same group
of people took two different mental tests, anyone who did well (or
poorly) on one test tended to do similarly well (or poorly) on the other.
In statistical terms, the scores on the two tests were positively corre-
lated. This outcome did not seem to depend on the specific content of
the tests. As long as the tests involved cognitive skills of one sort or an-
other, the positive correlations appeared. Furthermore, individual items
within tests showed positive correlations as well. If there was any cor-
relation at all between a pair of items, a person who got one of them
right tended to get the other one right, and vice versa for those who got
it wrong. In fact, the pattern was stronger than that. It turned out to be
nearly impossible to devise items that plausibly measured some cogni-
tive skill and were not positively correlated with other items that plau.
sibly measured some cognitive skill, however disparate the pair of skills
might appear to be.
The size of the positive correlations among the pairs of items in a test
did vary a lot, however, and it was this combination-positive
correla-
tions throughout the correlation matrix, but of varying magnitudes-
that inspired Spearman's insight.17] Why are almost all the correlations
positive? Spearman asked. Because, he answered, they are tapping into
the same general trait. Why are the magnitudes different? Because some
items are more closely related to this general trait than others.'81
Spearman's statistical method, an early example of what has since be-
come known as factor analysis, is complex, and we will explore some of
those complexities. But, for now, the basis for factor analysis can be read-
ily understood. Insofar as two items tap into the same trait, they share
something in common. Spearman developed a method for estimating
how much sharing was going on in a given set of data. From almost any
such collection of mental or academic test scores, Spearman's method
of analysis uncovered evidence for a unitary mental factor, which he
named g, for "general intelligence." The evidence for a general factor in
intelligence was pervasive but circumstantial, based on statistical analy-
sis rather than direct observation. Its reality therefore was, and remains,
arguable.
4
Introduction
Introduction
5
Spearman then made another major contribution to the study of in-
telligence by defining what this mysterious g represented. He hypothe-
sized that g is a general capacity for inferring and applying relationships
drawn from experience. Being able to grasp, for example, the relation-
ship between a pair of words like harvest and yield, or to recite a list of
digits in reverse order, or to see what a geometrical pattern would look
like upside down, are examples of tasks (and of test items) that draw on
g as Spearman conceived of it. This definition of intelligence differed
subtly from the more prevalent idea that intelligence is the ability to
learn and to generalize what is learned. The course of learning is affected
by intelligence, in Spearman's view, but it was not the thing in itself.
Spearmanian intelligence was a measure of a person's capacity for com-
plex mental work.
Meanwhile, other testers in Europe and America continued to refine
mental measurement. By 1908, the concept of mental level (later called
mental age) had been developed, followed in a few years by a slightly
more sophisticated concept, the intelligence quotient. IQ at first was
just a way of expressing a person's (usually a child's) mental level rela-
tive to his or her contemporaries. Later, as the uses of testing spread, IQ
became a more general way to express a person's intellectual perfor-
mance relative to a given population. Already by 1917, soon after the
concept of IQ was first defined, the U.S.
Army was administering in-
telligence tests to classify and assign recruits for World War I, Within a
few years, the letters "IQ had entered the American vernacular, where
they remain today as a universally understood synonym for intelligence.
To this point, the study of cognitive abilities was a success story, rep-
resenting one of the rare instances in which the new soft sciences were
able to do their work with a rigor not too far short of the standards csf
the traditional sciences. A new specialty within psychology was created,
psychometrics. Although the debates among the psychometricians were
often fierce and protracted, they produced an expanded understanding
of what was involved in mental capacity. The concept ofg survived, em-
bedded in an increasingly complex theory of the structure of cognitive
abilities.
Because intelligence tests purported to test rigorously an important
and valued trait about people (including ourselves and our loved ones),
IQ also became one of the most visible and controversial products of so-
cial science. The first wave of public controversy occurred during the
first decades of the century, when a few testing enthusiasts proposed us-
ing the results of mental tests to support outrageous racial policies. Ster-
ilization laws were passed in sixteen American states between 1907 and
1917, with the elimination of mental retardation being one of the prime
targets of the public policy. "Three generations of imbeciles are enough,"
Justice Oliver Wendell Holmes declared in an opinion upholding the
constitutionality of such a law."t
was a statement made possible, per-
haps encouraged, by the new enthusiasm for mental testing.
In the early 1920s, the chairman of the House Committee on Immi-
gration and Naturalization appointed an "Expert Eugenical Agent" for
his committee's work, a biologist who was especially concerned about
keeping up the American level of intelligence by suitable immigration
A n assistant professor of psychology at Princeton, Carl C.
Brigham, wrote a book entitled A Study of American Intelligence using
the results of the U.S. Army's World War I mental testing program to
conclude that an influx of immigrants from southern and eastern Eu-
rope would lower native American intelligence, and that immigration
therefore should be restricted to Nordic stock (see the box about tests
and immigration) .I1
Fact and Fiction About Immigration and Intelligence Testing
Two stories about early IQ testing have entered the folklore so thoroughly
that people who know almost nothing else about that history bring them
up at the beginning of almost any discussion d IQ. The first story is that
Jews and other immigrant groups were thought to be below average in in-
telligence, even feebleminded, which goes to show how untrustworthy
such tests (and the testers) are. The other story is that IQ tests were used
as the basis for the racist immigration policies of the 1920s, which shows
how dangerous such tests (and the testers) are."
The first is hased on the work done at Ellis Island by H. H. Goddard,
who explicitly preselected his salnple for evidence of low intelligence (his
purpose was to test his test's usefulness in screening for feeblemindedness),
and did not try to draw any conclusions about the general distribution of
intelligence in immigrant groups.13
The second has a stronger circumstan-
tial case: Brigham published his book just a year before Congress passed
the Immigration Restriction Act of 1924, which did indeed tip the flow of
immigrants toward the western and northern Europeans. The difficulty
with nlaking the causal case is that a close reading of the hearings for the
hill shows no evidence that Brigham's buok in particular or IQ tests in gen-
eral played any role.I4
The Rise of Psychometrics
- The term IQ entered the American vernacular as a synonym for intelligence, marking the birth of psychometrics as a rigorous psychological specialty.
- The concept of 'g' or general intelligence persisted despite fierce academic debates and increasingly complex theories of cognitive structure.
- Early enthusiasm for mental testing was co-opted to support radical social policies, including state-mandated sterilization laws in the United States.
- Prominent figures and politicians used the veneer of intelligence testing to argue for immigration restrictions based on ethnic and national origins.
- Historical folklore often conflates specific screening experiments at Ellis Island with a broader, more complex reality of how testing influenced policy.
- The perceived power of intelligence testers sparked immediate public backlash from influential critics like Walter Lippmann.
'Three generations of imbeciles are enough,' Justice Oliver Wendell Holmes declared in an opinion upholding the constitutionality of such a law.
4
Introduction
Introduction
5
Spearman then made another major contribution to the study of in-
telligence by defining what this mysterious g represented. He hypothe-
sized that g is a general capacity for inferring and applying relationships
drawn from experience. Being able to grasp, for example, the relation-
ship between a pair of words like harvest and yield, or to recite a list of
digits in reverse order, or to see what a geometrical pattern would look
like upside down, are examples of tasks (and of test items) that draw on
g as Spearman conceived of it. This definition of intelligence differed
subtly from the more prevalent idea that intelligence is the ability to
learn and to generalize what is learned. The course of learning is affected
by intelligence, in Spearman's view, but it was not the thing in itself.
Spearmanian intelligence was a measure of a person's capacity for com-
plex mental work.
Meanwhile, other testers in Europe and America continued to refine
mental measurement. By 1908, the concept of mental level (later called
mental age) had been developed, followed in a few years by a slightly
more sophisticated concept, the intelligence quotient. IQ at first was
just a way of expressing a person's (usually a child's) mental level rela-
tive to his or her contemporaries. Later, as the uses of testing spread, IQ
became a more general way to express a person's intellectual perfor-
mance relative to a given population. Already by 1917, soon after the
concept of IQ was first defined, the U.S.
Army was administering in-
telligence tests to classify and assign recruits for World War I, Within a
few years, the letters "IQ had entered the American vernacular, where
they remain today as a universally understood synonym for intelligence.
To this point, the study of cognitive abilities was a success story, rep-
resenting one of the rare instances in which the new soft sciences were
able to do their work with a rigor not too far short of the standards csf
the traditional sciences. A new specialty within psychology was created,
psychometrics. Although the debates among the psychometricians were
often fierce and protracted, they produced an expanded understanding
of what was involved in mental capacity. The concept ofg survived, em-
bedded in an increasingly complex theory of the structure of cognitive
abilities.
Because intelligence tests purported to test rigorously an important
and valued trait about people (including ourselves and our loved ones),
IQ also became one of the most visible and controversial products of so-
cial science. The first wave of public controversy occurred during the
first decades of the century, when a few testing enthusiasts proposed us-
ing the results of mental tests to support outrageous racial policies. Ster-
ilization laws were passed in sixteen American states between 1907 and
1917, with the elimination of mental retardation being one of the prime
targets of the public policy. "Three generations of imbeciles are enough,"
Justice Oliver Wendell Holmes declared in an opinion upholding the
constitutionality of such a law."t
was a statement made possible, per-
haps encouraged, by the new enthusiasm for mental testing.
In the early 1920s, the chairman of the House Committee on Immi-
gration and Naturalization appointed an "Expert Eugenical Agent" for
his committee's work, a biologist who was especially concerned about
keeping up the American level of intelligence by suitable immigration
A n assistant professor of psychology at Princeton, Carl C.
Brigham, wrote a book entitled A Study of American Intelligence using
the results of the U.S. Army's World War I mental testing program to
conclude that an influx of immigrants from southern and eastern Eu-
rope would lower native American intelligence, and that immigration
therefore should be restricted to Nordic stock (see the box about tests
and immigration) .I1
Fact and Fiction About Immigration and Intelligence Testing
Two stories about early IQ testing have entered the folklore so thoroughly
that people who know almost nothing else about that history bring them
up at the beginning of almost any discussion d IQ. The first story is that
Jews and other immigrant groups were thought to be below average in in-
telligence, even feebleminded, which goes to show how untrustworthy
such tests (and the testers) are. The other story is that IQ tests were used
as the basis for the racist immigration policies of the 1920s, which shows
how dangerous such tests (and the testers) are."
The first is hased on the work done at Ellis Island by H. H. Goddard,
who explicitly preselected his salnple for evidence of low intelligence (his
purpose was to test his test's usefulness in screening for feeblemindedness),
and did not try to draw any conclusions about the general distribution of
intelligence in immigrant groups.13
The second has a stronger circumstan-
tial case: Brigham published his book just a year before Congress passed
the Immigration Restriction Act of 1924, which did indeed tip the flow of
immigrants toward the western and northern Europeans. The difficulty
with nlaking the causal case is that a close reading of the hearings for the
hill shows no evidence that Brigham's buok in particular or IQ tests in gen-
eral played any role.I4
6
Introduction
Introduction
7
Critics responded vocally. Young Walter Lippmann, already an in-
fluential columnist, was one of the most prominent, fearing power-hun-
gry intelligence testers who yearned to "occupy a position of power
which no intellectual has held since the collapse of theocracy."15 In a
lengthy exchange in the New Republic in 1922 and 1923 with Lewis Ter-
man, ~remier
American tester of the time and the developer of the Stan-
ford-Binet IQ test, Lippmann wrote, "I hate the impudence of a claim
that in fifty minutes you can judge and classify a human being's predes-
tined fitness in life. I hate the pretentiousness of that claim. I hate the
abuse of scientific method which it involves. I hate the sense of superi-
ority which it creates, and the sense of inferiority which it imposes."16
Lippmann's characterization of the tests and the testers was some-
times unfair and often factually wrong, as Terman energetically pointed
out.17 But while Terman may have won the technical arguments, Lipp-
mann was right to worry that many people were eager to find connec-
tions between the results of testing and the more chilling implications
of social Darwinism. Even if the psychometricians generally made mod-
est claims for how much the tests predicted, it remained true that "IQ"
-that
single number with the memorable label-was
seductive. As
Lippmann feared, people did tend to give more credence to an individ-
ual's specific IQ score and make broader generalizations from it than was
appropriate, And not least, there was plenty to criticize in the psycho-
metricians' results. The methods for collecting and analyzing quantita-
tive psychological data were still new, and some basic inferential
mistakes were made.
If the tests had been fatally flawed or merely uninformative, they
would have vanished. Why this did not happen is one of the stories we
will be telling, but we may anticipate by observing that the use of tests
endured and grew because society's largest institutions-schools,
mili-
tary forces, industries, governments--depend significantly on measur-
able individual differences. Much as some observers wished it were not
true, there is often a need to assess differences between people as ob+
jectively, fairly, and efficiently as possible, and even the early mental
tests often did a better job of it than any of the alternatives.
During the 1930s, mental tests evolved and improved as their use
continued to spread throughout the world. David Wechsler worked on
the initial version of the tests that would eventually become the Wechs-
ler Adult Intelligence Scale and the Wechsler Intelligence Scale for
Children, the famous WAIS and WISC. Terman and his associates pub-
lished an improved version of the Stanford-Binet. But these tests were
individually administered and had to be scored by trained personnel,
and they were therefore too expensive to administer to large groups of
people. Psychometricians and test publishers raced to develop group*
administered tests that could be graded by machine, In the search for
practical, economical measurements of intelligence, testing grew from
a cottage industry to big business.
World War I1 stimulated another major advance in the state of the
art, as psychologists developed paper-and-pencil tests that could accu-
rately identify specific military aptitudes, even ones that included a sig-
nificant element of physical aptitude (such as an aptitude for flying
airplanes). Shortly after the war, psychologists at the University of Min-
nesota developed the Minnesota Multiphasic Personality Inventory, the
first machine+gradable standardized test with demonstrated validity as
a pedictor of various personality disorders. Later came the California
Psychological Inventory, which measured personality characteristics
within the normal range-"social
presence" and "self-control," for ex-
ample. The testing industry was flourishing, and the annualMenta1 Mea-
surements Yearbook that cataloged the tests grew to hundreds of pages.
Hundreds of millions of people throughout the world were being psy-
chologically tested every year.
Attacks on testing faded into the background during this period.
Though some psychometricians musr have known that the tests were
capturing human differences that had unsettling political and social im-
plications, no one of any stature was trying to use the results to promote
discriminatory, let alone eugenic, laws. And though many intellectuals
outside the testing profession knew of these results, the political agen-
das of the 1940s and 1950s, whether of New Deal Democrats or Ei.
senhower Republicans, were more pragmatic than ideological. Yes,
intelligence varied, but this was a fact of life that seemed to have little
bearing on the way public policy was conducted.
INTELLIGENCE BESIEGED
Then came the 1 9 6 0 ~ ~
and a new controversy about intelligence tests
that continues to this day. It arose not from new findings but from a new
outlook on public policy. Beginning with the rise of powerful social dem-
ocratic and socialist movements after World War I and accelerating
across the decades until the 1960s, a fundamental shift was taking place
The Rise of Intelligence Testing
- Walter Lippmann fiercely criticized early IQ testing, arguing that a fifty-minute exam could not justly determine a human being's lifelong potential.
- Despite technical inaccuracies in Lippmann's arguments, he correctly identified the public's dangerous tendency to link IQ scores with social Darwinism.
- Early psychometric methods were often flawed, yet the tests persisted because large institutions required objective ways to measure individual differences.
- The 1930s saw the development of iconic assessments like the WAIS and WISC, alongside a shift toward machine-gradable group tests for economic efficiency.
- World War II accelerated the industry, leading to specialized aptitude tests and the creation of standardized personality inventories like the MMPI.
- Testing evolved from a small-scale academic pursuit into a massive global industry used by schools, militaries, and governments to classify millions.
I hate the impudence of a claim that in fifty minutes you can judge and classify a human being's predestined fitness in life.
6
Introduction
Introduction
7
Critics responded vocally. Young Walter Lippmann, already an in-
fluential columnist, was one of the most prominent, fearing power-hun-
gry intelligence testers who yearned to "occupy a position of power
which no intellectual has held since the collapse of theocracy."15 In a
lengthy exchange in the New Republic in 1922 and 1923 with Lewis Ter-
man, ~remier
American tester of the time and the developer of the Stan-
ford-Binet IQ test, Lippmann wrote, "I hate the impudence of a claim
that in fifty minutes you can judge and classify a human being's predes-
tined fitness in life. I hate the pretentiousness of that claim. I hate the
abuse of scientific method which it involves. I hate the sense of superi-
ority which it creates, and the sense of inferiority which it imposes."16
Lippmann's characterization of the tests and the testers was some-
times unfair and often factually wrong, as Terman energetically pointed
out.17 But while Terman may have won the technical arguments, Lipp-
mann was right to worry that many people were eager to find connec-
tions between the results of testing and the more chilling implications
of social Darwinism. Even if the psychometricians generally made mod-
est claims for how much the tests predicted, it remained true that "IQ"
-that
single number with the memorable label-was
seductive. As
Lippmann feared, people did tend to give more credence to an individ-
ual's specific IQ score and make broader generalizations from it than was
appropriate, And not least, there was plenty to criticize in the psycho-
metricians' results. The methods for collecting and analyzing quantita-
tive psychological data were still new, and some basic inferential
mistakes were made.
If the tests had been fatally flawed or merely uninformative, they
would have vanished. Why this did not happen is one of the stories we
will be telling, but we may anticipate by observing that the use of tests
endured and grew because society's largest institutions-schools,
mili-
tary forces, industries, governments--depend significantly on measur-
able individual differences. Much as some observers wished it were not
true, there is often a need to assess differences between people as ob+
jectively, fairly, and efficiently as possible, and even the early mental
tests often did a better job of it than any of the alternatives.
During the 1930s, mental tests evolved and improved as their use
continued to spread throughout the world. David Wechsler worked on
the initial version of the tests that would eventually become the Wechs-
ler Adult Intelligence Scale and the Wechsler Intelligence Scale for
Children, the famous WAIS and WISC. Terman and his associates pub-
lished an improved version of the Stanford-Binet. But these tests were
individually administered and had to be scored by trained personnel,
and they were therefore too expensive to administer to large groups of
people. Psychometricians and test publishers raced to develop group*
administered tests that could be graded by machine, In the search for
practical, economical measurements of intelligence, testing grew from
a cottage industry to big business.
World War I1 stimulated another major advance in the state of the
art, as psychologists developed paper-and-pencil tests that could accu-
rately identify specific military aptitudes, even ones that included a sig-
nificant element of physical aptitude (such as an aptitude for flying
airplanes). Shortly after the war, psychologists at the University of Min-
nesota developed the Minnesota Multiphasic Personality Inventory, the
first machine+gradable standardized test with demonstrated validity as
a pedictor of various personality disorders. Later came the California
Psychological Inventory, which measured personality characteristics
within the normal range-"social
presence" and "self-control," for ex-
ample. The testing industry was flourishing, and the annualMenta1 Mea-
surements Yearbook that cataloged the tests grew to hundreds of pages.
Hundreds of millions of people throughout the world were being psy-
chologically tested every year.
Attacks on testing faded into the background during this period.
Though some psychometricians musr have known that the tests were
capturing human differences that had unsettling political and social im-
plications, no one of any stature was trying to use the results to promote
discriminatory, let alone eugenic, laws. And though many intellectuals
outside the testing profession knew of these results, the political agen-
das of the 1940s and 1950s, whether of New Deal Democrats or Ei.
senhower Republicans, were more pragmatic than ideological. Yes,
intelligence varied, but this was a fact of life that seemed to have little
bearing on the way public policy was conducted.
INTELLIGENCE BESIEGED
Then came the 1 9 6 0 ~ ~
and a new controversy about intelligence tests
that continues to this day. It arose not from new findings but from a new
outlook on public policy. Beginning with the rise of powerful social dem-
ocratic and socialist movements after World War I and accelerating
across the decades until the 1960s, a fundamental shift was taking place
The Shift Toward Environmentalism
- During the 1940s and 1950s, intelligence testing was widely accepted as a pragmatic tool with little ideological controversy.
- The 1960s ushered in a fundamental shift in public policy and psychology, prioritizing social equality and the 'War on Poverty.'
- A new consensus emerged that human potential was almost perfectly malleable and shaped primarily by the environment rather than genetics.
- Behaviorists like B.F. Skinner popularized the idea that social deficiencies were caused by external flaws in society rather than individual traits.
- Paradoxically, the public and academic denial of genetic influence on intelligence grew even as scientific evidence for those factors strengthened.
It had somehow become controversial to claim, especially in public, that genes had any effect at all on intelligence.
6
Introduction
Introduction
7
Critics responded vocally. Young Walter Lippmann, already an in-
fluential columnist, was one of the most prominent, fearing power-hun-
gry intelligence testers who yearned to "occupy a position of power
which no intellectual has held since the collapse of theocracy."15 In a
lengthy exchange in the New Republic in 1922 and 1923 with Lewis Ter-
man, ~remier
American tester of the time and the developer of the Stan-
ford-Binet IQ test, Lippmann wrote, "I hate the impudence of a claim
that in fifty minutes you can judge and classify a human being's predes-
tined fitness in life. I hate the pretentiousness of that claim. I hate the
abuse of scientific method which it involves. I hate the sense of superi-
ority which it creates, and the sense of inferiority which it imposes."16
Lippmann's characterization of the tests and the testers was some-
times unfair and often factually wrong, as Terman energetically pointed
out.17 But while Terman may have won the technical arguments, Lipp-
mann was right to worry that many people were eager to find connec-
tions between the results of testing and the more chilling implications
of social Darwinism. Even if the psychometricians generally made mod-
est claims for how much the tests predicted, it remained true that "IQ"
-that
single number with the memorable label-was
seductive. As
Lippmann feared, people did tend to give more credence to an individ-
ual's specific IQ score and make broader generalizations from it than was
appropriate, And not least, there was plenty to criticize in the psycho-
metricians' results. The methods for collecting and analyzing quantita-
tive psychological data were still new, and some basic inferential
mistakes were made.
If the tests had been fatally flawed or merely uninformative, they
would have vanished. Why this did not happen is one of the stories we
will be telling, but we may anticipate by observing that the use of tests
endured and grew because society's largest institutions-schools,
mili-
tary forces, industries, governments--depend significantly on measur-
able individual differences. Much as some observers wished it were not
true, there is often a need to assess differences between people as ob+
jectively, fairly, and efficiently as possible, and even the early mental
tests often did a better job of it than any of the alternatives.
During the 1930s, mental tests evolved and improved as their use
continued to spread throughout the world. David Wechsler worked on
the initial version of the tests that would eventually become the Wechs-
ler Adult Intelligence Scale and the Wechsler Intelligence Scale for
Children, the famous WAIS and WISC. Terman and his associates pub-
lished an improved version of the Stanford-Binet. But these tests were
individually administered and had to be scored by trained personnel,
and they were therefore too expensive to administer to large groups of
people. Psychometricians and test publishers raced to develop group*
administered tests that could be graded by machine, In the search for
practical, economical measurements of intelligence, testing grew from
a cottage industry to big business.
World War I1 stimulated another major advance in the state of the
art, as psychologists developed paper-and-pencil tests that could accu-
rately identify specific military aptitudes, even ones that included a sig-
nificant element of physical aptitude (such as an aptitude for flying
airplanes). Shortly after the war, psychologists at the University of Min-
nesota developed the Minnesota Multiphasic Personality Inventory, the
first machine+gradable standardized test with demonstrated validity as
a pedictor of various personality disorders. Later came the California
Psychological Inventory, which measured personality characteristics
within the normal range-"social
presence" and "self-control," for ex-
ample. The testing industry was flourishing, and the annualMenta1 Mea-
surements Yearbook that cataloged the tests grew to hundreds of pages.
Hundreds of millions of people throughout the world were being psy-
chologically tested every year.
Attacks on testing faded into the background during this period.
Though some psychometricians musr have known that the tests were
capturing human differences that had unsettling political and social im-
plications, no one of any stature was trying to use the results to promote
discriminatory, let alone eugenic, laws. And though many intellectuals
outside the testing profession knew of these results, the political agen-
das of the 1940s and 1950s, whether of New Deal Democrats or Ei.
senhower Republicans, were more pragmatic than ideological. Yes,
intelligence varied, but this was a fact of life that seemed to have little
bearing on the way public policy was conducted.
INTELLIGENCE BESIEGED
Then came the 1 9 6 0 ~ ~
and a new controversy about intelligence tests
that continues to this day. It arose not from new findings but from a new
outlook on public policy. Beginning with the rise of powerful social dem-
ocratic and socialist movements after World War I and accelerating
across the decades until the 1960s, a fundamental shift was taking place
8
Introduction
Introduction
9
in the received wisdom regarding equality. This was most evident in the
~olitical arena, where the civil rights movement and then the War on
Poverty raised Americans' consciousness about the nature of the in-
equalities in American society. But the changes in outlook ran deeper
and broader than politics. Assumptions about the very origins of social
problems changed profoundly. Nowhere was the shift more pervasive
than in the field of psychology.
Psychometricians of the 1930s had debated whether intelligence is
almost entirely produced by genes or whether the environment also
plays a role. By the 1960s and 1970s the point of contention had shifted
dramatically. It had somehow become controversial to claim, especially
in public, that genes had any effect at all on intelligence. Ironically, the
evidence for genetic factors in intelligence had greatly strengthened
during the very period when the terms of the debate were moving in the
other direction.
In the psychological laboratory, there was a similar shift. Psycholog-
ical experimenters early in the century were, if anything, more likely to
concentrate on the inborn patterns of human and animal behavior than
on how the leaming process could change behavior." But from the
1930s to the 1960s, the leading behaviorists, as they were called, and
their students and disciples were almost all specialists in learning the-
ory. They filled the technical journals with the results of learning ex-
periments on rats and pigeons, the tacit implication being that genetic
endowment mattered so little that we could ignore the differences
among species, let alone among human individuals, and still discover
enough about the learning process to make it useful and relevant to
human concern^.'^ There are, indeed, aspects of the learning process
that cross the lines between species, but there are also enormous differ-
ences, and these differences were sometimes ignored or minimized when
psychologists explained their findings to the lay public. B. E Skinner, at
Harvard University, more than any other of the leading behaviorists,
broke out of the academic world into public attention with books that
applied the findings of laboratory research on animals to human soci-
ety at large.20
To those who held the behaviorist view, human potential was almost
perfectly malleable, shaped by the environment. The causes of human
deficiencies in intelligence--or parenting, or social behavior, or work
behavior-lay
outside the individual. They were caused by flaws in so-
ciety. Sometimes capitalism was blamed, sometimes an uncaring or in-
competent government. Further, the causes of these deficiencies could be
fixed by the right public policies-redistribution of wealth, better educa-
tion, better housing and medical care. Once these environmental causes
were removed, the deficiencies should vanish as well, it was argued.
The contrary notion-that
individual differences could not easily be
diminished by government intervention-collided
head-on with the
enthusiasm for egalitarianism, which itself collided head-on with a half-
century of IQ data indicating that differences in intelligence are in-
tractable and significantly heritable and that the average IQ of various
socioeconomic and ethnic groups differs.
In 1969, Arthur Jensen, an educational psychologist and expert on
testing from the University of California at Berkeley, put a match to this
volatile mix of science and ideology with an article in the Harvard Ed-
ucational ~euiew.~'
Asked by the Review's editors to consider why corn.
pensatory and remedial education programs begun with such high hopes
during the War on Poverty had yielded such disappointing results,
Jensen concluded that the programs were bound to have little success
because they were aimed at populations of youngsters with relatively
low IQs, and success in school depended to a considerable degree on IQ.
IQ had a large heritable component, Jensen also noted. The article fur.
ther disclosed that the youngsters in the targeted populations were dis-
proportionately black and that historically blacks as a population had
exhibited average IQs substantially below those of whites.
The reaction to Jensen's article was immediate and violent. From
1969 through the mid-1970s) dozens of books and hundreds of articles
appeared denouncing the use of IQ tests and arguing that mental abil.
ities are determined by environment, with the genes playing a minor
role and race none at all. Jensen's name became synonymous with a con-
stellation of hateful ways of thinking. "It perhaps is impossible to exag-
gerate the importance of the Jensen disgrace," wrote Jerry Hirsch, a
psychologist specializing in the genetics of animal behavior who was
among Jensen's more vehement critics. "It has permeated both science
and the universities and hoodwinked large segments of government and
society. Like Vietnam and Watergate, it is a contemporary symptom of
serious affli~tion."'~
The title of Hirsch's article was "The Bankruptcy
of 'Science' Without Scholarship." During the first few years after the
Harvard Educational Review article was published, Jensen could appear
in no public forum in the United States without triggering something
perilously close to a riot.
The Jensen Controversy
- The 1960s egalitarian ideal that government intervention could erase cognitive deficiencies clashed with decades of IQ data suggesting intelligence is largely heritable.
- Arthur Jensen's 1969 article argued that compensatory education programs failed because they targeted populations with lower average IQs, which he claimed had a genetic basis.
- The public and academic reaction to Jensen was explosive, leading to riots and comparisons of his work to national disasters like Vietnam and Watergate.
- William Shockley further inflamed the debate by proposing eugenicist schemes, such as paying individuals with low IQs to undergo sterilization.
- Richard Herrnstein introduced a controversial syllogism linking heritable intelligence to economic success and, ultimately, to an inherited social hierarchy.
- The era's scientific discourse became a volatile mix of ideology and data, where discussing the heritability of traits was viewed as a 'disgrace' or 'forbidden territory'.
During the first few years after the Harvard Educational Review article was published, Jensen could appear in no public forum in the United States without triggering something perilously close to a riot.
8
Introduction
Introduction
9
in the received wisdom regarding equality. This was most evident in the
~olitical arena, where the civil rights movement and then the War on
Poverty raised Americans' consciousness about the nature of the in-
equalities in American society. But the changes in outlook ran deeper
and broader than politics. Assumptions about the very origins of social
problems changed profoundly. Nowhere was the shift more pervasive
than in the field of psychology.
Psychometricians of the 1930s had debated whether intelligence is
almost entirely produced by genes or whether the environment also
plays a role. By the 1960s and 1970s the point of contention had shifted
dramatically. It had somehow become controversial to claim, especially
in public, that genes had any effect at all on intelligence. Ironically, the
evidence for genetic factors in intelligence had greatly strengthened
during the very period when the terms of the debate were moving in the
other direction.
In the psychological laboratory, there was a similar shift. Psycholog-
ical experimenters early in the century were, if anything, more likely to
concentrate on the inborn patterns of human and animal behavior than
on how the leaming process could change behavior." But from the
1930s to the 1960s, the leading behaviorists, as they were called, and
their students and disciples were almost all specialists in learning the-
ory. They filled the technical journals with the results of learning ex-
periments on rats and pigeons, the tacit implication being that genetic
endowment mattered so little that we could ignore the differences
among species, let alone among human individuals, and still discover
enough about the learning process to make it useful and relevant to
human concern^.'^ There are, indeed, aspects of the learning process
that cross the lines between species, but there are also enormous differ-
ences, and these differences were sometimes ignored or minimized when
psychologists explained their findings to the lay public. B. E Skinner, at
Harvard University, more than any other of the leading behaviorists,
broke out of the academic world into public attention with books that
applied the findings of laboratory research on animals to human soci-
ety at large.20
To those who held the behaviorist view, human potential was almost
perfectly malleable, shaped by the environment. The causes of human
deficiencies in intelligence--or parenting, or social behavior, or work
behavior-lay
outside the individual. They were caused by flaws in so-
ciety. Sometimes capitalism was blamed, sometimes an uncaring or in-
competent government. Further, the causes of these deficiencies could be
fixed by the right public policies-redistribution of wealth, better educa-
tion, better housing and medical care. Once these environmental causes
were removed, the deficiencies should vanish as well, it was argued.
The contrary notion-that
individual differences could not easily be
diminished by government intervention-collided
head-on with the
enthusiasm for egalitarianism, which itself collided head-on with a half-
century of IQ data indicating that differences in intelligence are in-
tractable and significantly heritable and that the average IQ of various
socioeconomic and ethnic groups differs.
In 1969, Arthur Jensen, an educational psychologist and expert on
testing from the University of California at Berkeley, put a match to this
volatile mix of science and ideology with an article in the Harvard Ed-
ucational ~euiew.~'
Asked by the Review's editors to consider why corn.
pensatory and remedial education programs begun with such high hopes
during the War on Poverty had yielded such disappointing results,
Jensen concluded that the programs were bound to have little success
because they were aimed at populations of youngsters with relatively
low IQs, and success in school depended to a considerable degree on IQ.
IQ had a large heritable component, Jensen also noted. The article fur.
ther disclosed that the youngsters in the targeted populations were dis-
proportionately black and that historically blacks as a population had
exhibited average IQs substantially below those of whites.
The reaction to Jensen's article was immediate and violent. From
1969 through the mid-1970s) dozens of books and hundreds of articles
appeared denouncing the use of IQ tests and arguing that mental abil.
ities are determined by environment, with the genes playing a minor
role and race none at all. Jensen's name became synonymous with a con-
stellation of hateful ways of thinking. "It perhaps is impossible to exag-
gerate the importance of the Jensen disgrace," wrote Jerry Hirsch, a
psychologist specializing in the genetics of animal behavior who was
among Jensen's more vehement critics. "It has permeated both science
and the universities and hoodwinked large segments of government and
society. Like Vietnam and Watergate, it is a contemporary symptom of
serious affli~tion."'~
The title of Hirsch's article was "The Bankruptcy
of 'Science' Without Scholarship." During the first few years after the
Harvard Educational Review article was published, Jensen could appear
in no public forum in the United States without triggering something
perilously close to a riot.
10
Introduction
Introduction
1 1
The uproar was exacerbated by William Shockley, who had won the
Nobel Prize in physics for his contributions to the invention of the tran-
sistor but had turned his attention to human variation toward the end
of his career, As eccentric as he was brilliant, he often recalled the eu-
genicists of the early decades of the century. He proposed, as a "thought
exercise," a scheme for paying people with low IQs to be sterili~ed.~'
He
supported (and contributed to) a sperm bank for geniuses. He seemed
to relish expressing sensitive scientific findings in a way that would out-
rage or disturb as many people as possible. Jensen and Shockley, utterly
unlike as they were in most respects, soon came to be classed together
as a pair of racist intellectual cranks.
Then one of us, Richard Hermstein, an experimental psychologist at
Harvard, strayed into forbidden territory with an article in the Sep-
tember 1971 Atlantic ~onthly
.24 Herrnstein barely mentioned race, but
he did talk about heritability of IQ. His proposition, put in the form of
a syllogism, was that because IQ is substantially heritable, because eco-
nomic success in life depends in part on the talents measured by IQ tests,
and because social standing depends in part on economic success, it fol-
lows that social standing is hound to be based to some extent on inher-
ited differences. By 197 1, this had become a controversial thing to say.
In media accounts of intelligence, the names Jensen, Shockley, and
Hermstein became roughly interchangeable.
That same year, 1971, the U.S. Supreme Court outlawed the use of
standardized ability tests by employers unless they had a "manifest rela-
tionship" to the specific job in question because, the Supreme Court
held, standardized tests acted as "built-in headwindsl'for minority groups,
even in the absence of discriminatory intent.25 A year later, the National
Education Association called upon the nation's schools to impose a
moratorium on all standardized intelligence testing, hypothesizing that
"a third or more of American citizens are intellectually folded, mutilated
or spindled before they have a chance to get through elementary school
because of linguistically or culturally biased standardized tests."26 A
movement that had begun in the 1960s gained momentum in the early
1970s, as major school systems throughout the country, including those
of Chicago, New York, and Los Angeles, limited or banned the use of
group+administered standardized tests in public schools. A number of col-
leges announced that they would no longer require the Scholastic Apti-
tude Test as part of the admissions process. The legal movement against
tests reached its apogee in 1978 in the case of Lawy P. Judge Robert Peck-
ham of the U.S. District Court in San Francisco ruled that it was un-
constitutional to use IQ tests for placement of children in classes for the
educably mentally retarded if the use of those tests resulted in placement
of "grossly disproportionate" numbers of black children.27
Meanwhile, the intellectual debate had taken a new and personalized
turn. Those who claimed that intelligence was substantially inherited
were not just wrong, the critics now discovered, they were charlatans as
well. Leon Kamin, a psychologist then at Princeton, opened this phase
of the debate with a 1974 book, The Science and Politics of IQ. "Patrio-
tism, we have been told, is the last refuge of scoundrels," Kamin wrote
in the opening pages. "Psychologists and biologists might consider the
possibility that heritability is the first."28 Kamin went on to charge that
mental testing and belief in the heritability of IQ in particular had been
fostered by people with right-wing political views and racist social views.
They had engaged in pseudoscience, he wrote, suppressing the data they
did not like and exaggerating the data that agreed with their precon-
ceptions. Examined carefully, the case for the heritability of IQ was nil,
concluded Kamin.
In 1976, a British journalist, Oliver Gillie, published an article in the
London Sunday Xmes that seemed to confirm Kamin's thesis with a sen-
sational revelation: The recently deceased Cyril Burt, Britain's most em-
inent psychometrician, author of the largest and most famous study of
the intelligence of identical twins who grew up apart, was charged with
frauda2' He had made up data, fudged his results, and invented coau-
thors, the Sunday 3mes declared, The subsequent scandal was as big as
the Piltdown Man hoax. Cyril Burt had not been just another researcher
but one of the giants of twentieth-century psychology. Nor could his
colleagues find a ready defense (the defense came later, as described in
the box). They protested that the revelations did not compromise the
great bulk of the work that bore on the issue of heritability, but their de-
fenses sounded feeble in the light of the suspicions that had preceded
Burt's exposure.
For the public observing the uproar in the academy from the side-
lines, the capstone of the assault on the integrity of the discipline oc-
curred in 1981 when Harvard paleobiologist Stephen Jay Could, author
of several popular books on biology, published The Mismemure of an."
Gould examined the history of intelligence testing, found that it was
The Backlash Against Testing
- In the early 1970s, the U.S. Supreme Court and major school districts began restricting standardized tests, viewing them as 'built-in headwinds' for minority groups.
- The National Education Association called for a moratorium on testing, arguing that biased exams were 'mutilating' the intellectual potential of American students.
- Legal challenges culminated in the 1978 Larry P. case, which ruled the use of IQ tests unconstitutional if they led to disproportionate placement of Black children in special education.
- The intellectual debate shifted from scientific disagreement to personal attacks, with critics like Leon Kamin accusing proponents of heritability of being 'scoundrels' and 'charlatans.'
- The credibility of psychometrics suffered a massive blow with the exposure of Cyril Burt, a leading researcher accused of fabricating data on identical twins.
- Stephen Jay Gould's 1981 book 'The Mismeasure of Man' served as a public capstone to the era's assault on the integrity of intelligence research.
Psychologists and biologists might consider the possibility that heritability is the first.
10
Introduction
Introduction
1 1
The uproar was exacerbated by William Shockley, who had won the
Nobel Prize in physics for his contributions to the invention of the tran-
sistor but had turned his attention to human variation toward the end
of his career, As eccentric as he was brilliant, he often recalled the eu-
genicists of the early decades of the century. He proposed, as a "thought
exercise," a scheme for paying people with low IQs to be sterili~ed.~'
He
supported (and contributed to) a sperm bank for geniuses. He seemed
to relish expressing sensitive scientific findings in a way that would out-
rage or disturb as many people as possible. Jensen and Shockley, utterly
unlike as they were in most respects, soon came to be classed together
as a pair of racist intellectual cranks.
Then one of us, Richard Hermstein, an experimental psychologist at
Harvard, strayed into forbidden territory with an article in the Sep-
tember 1971 Atlantic ~onthly
.24 Herrnstein barely mentioned race, but
he did talk about heritability of IQ. His proposition, put in the form of
a syllogism, was that because IQ is substantially heritable, because eco-
nomic success in life depends in part on the talents measured by IQ tests,
and because social standing depends in part on economic success, it fol-
lows that social standing is hound to be based to some extent on inher-
ited differences. By 197 1, this had become a controversial thing to say.
In media accounts of intelligence, the names Jensen, Shockley, and
Hermstein became roughly interchangeable.
That same year, 1971, the U.S. Supreme Court outlawed the use of
standardized ability tests by employers unless they had a "manifest rela-
tionship" to the specific job in question because, the Supreme Court
held, standardized tests acted as "built-in headwindsl'for minority groups,
even in the absence of discriminatory intent.25 A year later, the National
Education Association called upon the nation's schools to impose a
moratorium on all standardized intelligence testing, hypothesizing that
"a third or more of American citizens are intellectually folded, mutilated
or spindled before they have a chance to get through elementary school
because of linguistically or culturally biased standardized tests."26 A
movement that had begun in the 1960s gained momentum in the early
1970s, as major school systems throughout the country, including those
of Chicago, New York, and Los Angeles, limited or banned the use of
group+administered standardized tests in public schools. A number of col-
leges announced that they would no longer require the Scholastic Apti-
tude Test as part of the admissions process. The legal movement against
tests reached its apogee in 1978 in the case of Lawy P. Judge Robert Peck-
ham of the U.S. District Court in San Francisco ruled that it was un-
constitutional to use IQ tests for placement of children in classes for the
educably mentally retarded if the use of those tests resulted in placement
of "grossly disproportionate" numbers of black children.27
Meanwhile, the intellectual debate had taken a new and personalized
turn. Those who claimed that intelligence was substantially inherited
were not just wrong, the critics now discovered, they were charlatans as
well. Leon Kamin, a psychologist then at Princeton, opened this phase
of the debate with a 1974 book, The Science and Politics of IQ. "Patrio-
tism, we have been told, is the last refuge of scoundrels," Kamin wrote
in the opening pages. "Psychologists and biologists might consider the
possibility that heritability is the first."28 Kamin went on to charge that
mental testing and belief in the heritability of IQ in particular had been
fostered by people with right-wing political views and racist social views.
They had engaged in pseudoscience, he wrote, suppressing the data they
did not like and exaggerating the data that agreed with their precon-
ceptions. Examined carefully, the case for the heritability of IQ was nil,
concluded Kamin.
In 1976, a British journalist, Oliver Gillie, published an article in the
London Sunday Xmes that seemed to confirm Kamin's thesis with a sen-
sational revelation: The recently deceased Cyril Burt, Britain's most em-
inent psychometrician, author of the largest and most famous study of
the intelligence of identical twins who grew up apart, was charged with
frauda2' He had made up data, fudged his results, and invented coau-
thors, the Sunday 3mes declared, The subsequent scandal was as big as
the Piltdown Man hoax. Cyril Burt had not been just another researcher
but one of the giants of twentieth-century psychology. Nor could his
colleagues find a ready defense (the defense came later, as described in
the box). They protested that the revelations did not compromise the
great bulk of the work that bore on the issue of heritability, but their de-
fenses sounded feeble in the light of the suspicions that had preceded
Burt's exposure.
For the public observing the uproar in the academy from the side-
lines, the capstone of the assault on the integrity of the discipline oc-
curred in 1981 when Harvard paleobiologist Stephen Jay Could, author
of several popular books on biology, published The Mismemure of an."
Gould examined the history of intelligence testing, found that it was
The Intelligence Debate Schism
- Reexaminations of the Cyril Burt affair in the late 1980s suggested that allegations of data fraud were motivated by professional and ideological antagonism rather than evidence.
- The Minnesota twin study eventually produced an IQ correlation of +.78 for identical twins reared apart, nearly identical to Burt's widely derided and allegedly fraudulent figure of +.77.
- Stephen Jay Gould's 'The Mismeasure of Man' successfully popularized the view that intelligence is a bankrupt, culturally biased concept used primarily to justify social prejudice.
- By the early 1980s, a public 'received wisdom' emerged that IQ tests are useless tools that fail to predict real-world success like earnings or productivity.
- A profound gap developed between the public perception of intelligence research and the actual state of knowledge within the technical field of psychometrics.
- While scholars like Arthur Jensen remained respected and prolific in technical journals, they were largely discredited or ignored in the broader public discourse.
The dialogue about testing has been conducted at two levels during the last two decades—the visible one played out in the press and the subterranean one played out in the technical journals and books.
12
Introduction
The Burt Affair
It would be more than a decade before the Burt affair was subjected to de.
tailed reexamination. In 1989 and 1991, two accounts of the Burt allega-
tions, by psychologist Robert Joynson and sociologist Ronald Fletcher,
written independently, concluded that the attacks against Burt had been
motivated by a mixture of professional and ideological antagonism and that
no credible case of data falsification or fictitious research or researchers had
ever been presented.'" Both authors also concluded that some of Burt's
leading critics were aware that their accusations were inaccurate even at
the time they made them. An ironic afterword centers on Burt's claim that
the correlation between the IQs of identical twins reared apart is +.77. A
correlation this large almost irrefutably supports a large genetic influence
on IQ. Since the attacks on Burt began, it had been savagely derided us
fraudulent, the product of Burt's fiddling with the data to make his case.
In 1990, the Minnesota twin study, accepted by most scholars as a model
of its kind, produced its most detailed estimates of the correlation of 1Q
between identical twins reared apart. The procedure that most closely par-
alleled Burt's yielded a correlation of +.78.3'
peopled by charlatans, racists, and self-deluded fools, and concluded
that "determinist arguments for ranking people according to a single
scale of intelligence, no matter how numerically sophisticated, have
recorded little more than social prejudice."33 The Mismeasure of Man
became a best-seller and won the National Book Critics Circle
Award.
Gould and his allies had won the visible battle. By the early 1980s, a
new received wisdom about intelligence had been formed that went
roughly as follows:
Intelligence is a bankrupt concept. Whatever it might mean--and nobody
really knows even how to define it-intelligence
is so ephemeral that no one
can measure it accurately. IQ tests are, of course, culturally biased, and
SO are all the other "aptitude" tests, such as the SAT. To the extent that
tests such as IQ and SAT measure anything, it certainly is not an innate
"intelligence." IQ scores are not constant; they often change significantly
over an individual's life span. The scores of entire populations can be ex-
pected to change over time-look
at the Jews, who early in the twentieth
century scored below average on IQ scores and now score well above the
average. Furthermore, the tests are nearly useless m tools, as confirmed
by the well-documented fact that such tests do not predict anything except
success in school. Earnings, occupation, productivity--all the important
measures of success--are unrelated to the test scores. All that tests really
accomplish is to label youngsters, stigmatizing the ones who do not do well
and creatinga self-fulfillingpophecy that injures the socioeconomically dis-
advantaged in general and blacks in particular.
INTELLIGENCE REDUX
As far as public discussion is concerned, this collection of beliefs, with
some variations, remains the state of wisdom about cognitive abilities
and IQ tests. It bears almost no relation to the current state of knowl-
edge among scholars in the field, however, and therein lies a tale. The
dialogue about testing has been conducted at two levels during the last
two decades-the
visible one played out in the press and the subtere
ranean one played out in the technical journals and books.
The case of Arthur Jensen is illustrative. To the public, he surfaced
hriefly, published an article that was discredited, and fell back into ob-
scurity. Within the world of psychometrics, however, he continued to
be one of the profession's most prolific schc~lars, respected for his metic.
ulous research by colleagues of every theoretical stripe. Jensen had not
recanted. H e continued to build on the same empirical findings that had
gotten him into such trouble in the 1960s, but primarily in technical
publications, where no one outside the profession had to notice. The
same thing was happening throughout psychometrics. In the 1970s,
scholars ohserved that colleagues who tried to say publicly that IQ tests
had merit, or that intelligence was substantially inherited, or even that
intelligence existed as a definable and measurable human quality, paid
too high a price. Their careers, family lives, relationships with col-
leagues, and even physical safety could be jeopardized by speaking out.
Why speak out when there was no compelling reason to do so? Research
on cognitive abilities continued to flourish, hut only in the sanctuary of
the ivory tower.
In this cloistered environment, the continuing debate about intelli.
gence was conducted much as debates are conducted within any other
academic discipline. The public controversy had surfaced some genuine
issues, and the competing parties set about trying to resolve them. Con-
The Cloistered Study of Intelligence
- In the 1970s, scholars faced severe social and professional penalties for publicly discussing the merits or heritability of IQ.
- Research on cognitive abilities retreated into the 'ivory tower,' where it continued to flourish away from public scrutiny.
- While the public still debates whether IQ tests are biased or useless, a scholarly consensus has been reached on many of these foundational issues.
- By the 1990s, the professional community was divided into three main factions: classicists, revisionists, and radicals.
- The classicist faction views 'g' (general intelligence) as a core, scientifically demonstrated human mental ability that sits at the center of cognitive structure.
- Early psychometricians often resisted the idea of a single 'g' factor, seeking instead a set of primary and independent mental abilities.
Their careers, family lives, relationships with colleagues, and even physical safety could be jeopardized by speaking out.
12
Introduction
The Burt Affair
It would be more than a decade before the Burt affair was subjected to de.
tailed reexamination. In 1989 and 1991, two accounts of the Burt allega-
tions, by psychologist Robert Joynson and sociologist Ronald Fletcher,
written independently, concluded that the attacks against Burt had been
motivated by a mixture of professional and ideological antagonism and that
no credible case of data falsification or fictitious research or researchers had
ever been presented.'" Both authors also concluded that some of Burt's
leading critics were aware that their accusations were inaccurate even at
the time they made them. An ironic afterword centers on Burt's claim that
the correlation between the IQs of identical twins reared apart is +.77. A
correlation this large almost irrefutably supports a large genetic influence
on IQ. Since the attacks on Burt began, it had been savagely derided us
fraudulent, the product of Burt's fiddling with the data to make his case.
In 1990, the Minnesota twin study, accepted by most scholars as a model
of its kind, produced its most detailed estimates of the correlation of 1Q
between identical twins reared apart. The procedure that most closely par-
alleled Burt's yielded a correlation of +.78.3'
peopled by charlatans, racists, and self-deluded fools, and concluded
that "determinist arguments for ranking people according to a single
scale of intelligence, no matter how numerically sophisticated, have
recorded little more than social prejudice."33 The Mismeasure of Man
became a best-seller and won the National Book Critics Circle
Award.
Gould and his allies had won the visible battle. By the early 1980s, a
new received wisdom about intelligence had been formed that went
roughly as follows:
Intelligence is a bankrupt concept. Whatever it might mean--and nobody
really knows even how to define it-intelligence
is so ephemeral that no one
can measure it accurately. IQ tests are, of course, culturally biased, and
SO are all the other "aptitude" tests, such as the SAT. To the extent that
tests such as IQ and SAT measure anything, it certainly is not an innate
"intelligence." IQ scores are not constant; they often change significantly
over an individual's life span. The scores of entire populations can be ex-
pected to change over time-look
at the Jews, who early in the twentieth
century scored below average on IQ scores and now score well above the
average. Furthermore, the tests are nearly useless m tools, as confirmed
by the well-documented fact that such tests do not predict anything except
success in school. Earnings, occupation, productivity--all the important
measures of success--are unrelated to the test scores. All that tests really
accomplish is to label youngsters, stigmatizing the ones who do not do well
and creatinga self-fulfillingpophecy that injures the socioeconomically dis-
advantaged in general and blacks in particular.
INTELLIGENCE REDUX
As far as public discussion is concerned, this collection of beliefs, with
some variations, remains the state of wisdom about cognitive abilities
and IQ tests. It bears almost no relation to the current state of knowl-
edge among scholars in the field, however, and therein lies a tale. The
dialogue about testing has been conducted at two levels during the last
two decades-the
visible one played out in the press and the subtere
ranean one played out in the technical journals and books.
The case of Arthur Jensen is illustrative. To the public, he surfaced
hriefly, published an article that was discredited, and fell back into ob-
scurity. Within the world of psychometrics, however, he continued to
be one of the profession's most prolific schc~lars, respected for his metic.
ulous research by colleagues of every theoretical stripe. Jensen had not
recanted. H e continued to build on the same empirical findings that had
gotten him into such trouble in the 1960s, but primarily in technical
publications, where no one outside the profession had to notice. The
same thing was happening throughout psychometrics. In the 1970s,
scholars ohserved that colleagues who tried to say publicly that IQ tests
had merit, or that intelligence was substantially inherited, or even that
intelligence existed as a definable and measurable human quality, paid
too high a price. Their careers, family lives, relationships with col-
leagues, and even physical safety could be jeopardized by speaking out.
Why speak out when there was no compelling reason to do so? Research
on cognitive abilities continued to flourish, hut only in the sanctuary of
the ivory tower.
In this cloistered environment, the continuing debate about intelli.
gence was conducted much as debates are conducted within any other
academic discipline. The public controversy had surfaced some genuine
issues, and the competing parties set about trying to resolve them. Con-
14
Introduction
Introduction
15
troversial hypotheses were put to the test. Sometimes they were con-
firmed, sometimes rejected. Often they led to new questions, which were
then explored. Substantial progress was made, Many of the issues that
created such a public furor in the 1970s were resolved, and the study of
cognitive abilities went on to explore new areas.
This is not to say that controversy has ended, only that the contro-
versy within the professional intelligence testing community is much
different from that outside it. The issues that seem most salient in arti-
cles in the popular press (Isn't intelligence determined mostly by envi-
ronment? Aren't the tests useless because they're biased?) are not major
topics of debate within the profession. On many of the publicly discussed
questions, a scholarly consensus has been reached.34 Rather, the con-
tending parties within the professional community divide along other
lines. By the early 1990s, they could be roughly divided into three fac-
tions for our purposes: the classicists, the revisionists, and the radicals.
The Classicists: Intelligence as a Structure
The classicists work within the tradition begun by Spearman, seeking
to identify the components of intelligence much as physicists seek to
identify the structure of the atom. As of the 1990s, the classicists are for
practical purposes unanimous in accepting that g sits at the center of
the structure in a dominating position-not
just as an artifact of statis-
tical manipulation but as an expression of a core human mental ability
much like the ability Spearman identified at the turn of the century. In
their view, g is one of the most thoroughly demonstrated entities in the
behavioral sciences and one of the most powerful for understanding so-
cially significant human variation.
The classicists took a long time to reach this level of consensus. The
ink on Spearman's first article on the topic in 1904 was barely dry be-
fore others were arguing that intellectual ability could not be adequately
captured by g or by any other unitary quantity-and
understandably so,
for common sense rebels against the idea that something so important
about people as their intellects can be captured even roughly by varia-
tions in a single quantity. Many of the famous names in the history of
psychometrics challenged the reality of g, starting with Galton's most
eminent early disciple, Karl Pearson, and continuing with many other
creative and influential psychometricians.
In diverse ways, they sought the grail of a set of primary and mutu-
ally independent mental abilities. For Spearman, there was just one such
primary ability, g. For Raymond Cattell, there are two kinds of g, mys-
tallized and fluid, with crystallized g being general intelligence trans.
formed into the skills of one's own culture, and fluid g being the
all-purpose intellectual capacity from which the crystallized skills are
formed. In Louis Thurstone's theory of intelligence, there are a half-
dozen or so primary mental abilities, such as verbal, quantitative, spatial,
and the like. In Philip Vernon's theory, intellectual capacities are
arranged in a hierarchy with g at its apex; in Joy Guilford's, the strut.
ture of intellect is refined into 120 or more intellectual components.
The theoretical alternatives to unitary, general intelligence have come
in many sizes, shapes, and degrees of plausibility.
Many of these efforts proved to have lasting value. For example, Cat.
tell's distinction between fluid and crystallized intelligence remains a
useful conceptual contrast, just as other work has done much to clarify
what lies in the domain of specific abilities that g cannot account for.
But no one has been able to devise a set of tests that do not reveal a
large general factor of intellectual ability-in
other words, something
very like Spearman's g. Furthermore, the classicists point out, the best
standardized tests, such as a modem IQ test, do a reasonably good job
of measuring g. When properly administered, the tests are not measur.
ably biased against socioeconomic, ethnic, or racial subgroups. They
predict a wide variety of socially important outcomes.
This is not the same as saying that the classicists are satisfied with
their understanding of intelligence. g is a statistical entity, and current
research is probing the underlying neurologic basis for it. Arthur Jensen,
the archetypal classicist, has been active in this effort for the last decade,
returning to Galton's intuition that performance on elementary cogni-
tive tasks, such as reaction time in recognizing simple patterns of lights
and shapes, provides an entry point into understanding the physiology
of g.
The Revisionists: Intelligence as Information Processing
A theory of intelligence need not be structural. The emphasis may be
on process rather than on structure. In other words, it may try to figure
out what a person is doing when exercising his or her intelligence, rather
than what elements of intelligence are put together. The great Swiss
psychologist, Jean Piaget, started his career in Alfred Binet's laboratory
trying to adapt Cyril Burt's intelligence tests for Parisian children. Piaget
Theories of Intellectual Structure
- Psychologists have proposed various models of intelligence, ranging from a dozen primary abilities to over 120 distinct components.
- Despite diverse theories, researchers consistently find a large general factor of ability, known as Spearman's g, in all standardized testing.
- Classicists argue that modern IQ tests effectively measure g and are not biased against specific socioeconomic or ethnic subgroups.
- Revisionists shift the focus from the structure of intelligence to the mental processes and information processing involved in thinking.
- Jean Piaget's work exemplified the process-oriented approach by studying the specific errors children made to understand their cognitive development.
- While revisionists acknowledge the existence of g, they question whether defining its structure is as important as understanding how intelligence is exercised.
Piaget discovered quickly that he was less interested in how well the children did than in what errors they made.
14
Introduction
Introduction
15
troversial hypotheses were put to the test. Sometimes they were con-
firmed, sometimes rejected. Often they led to new questions, which were
then explored. Substantial progress was made, Many of the issues that
created such a public furor in the 1970s were resolved, and the study of
cognitive abilities went on to explore new areas.
This is not to say that controversy has ended, only that the contro-
versy within the professional intelligence testing community is much
different from that outside it. The issues that seem most salient in arti-
cles in the popular press (Isn't intelligence determined mostly by envi-
ronment? Aren't the tests useless because they're biased?) are not major
topics of debate within the profession. On many of the publicly discussed
questions, a scholarly consensus has been reached.34 Rather, the con-
tending parties within the professional community divide along other
lines. By the early 1990s, they could be roughly divided into three fac-
tions for our purposes: the classicists, the revisionists, and the radicals.
The Classicists: Intelligence as a Structure
The classicists work within the tradition begun by Spearman, seeking
to identify the components of intelligence much as physicists seek to
identify the structure of the atom. As of the 1990s, the classicists are for
practical purposes unanimous in accepting that g sits at the center of
the structure in a dominating position-not
just as an artifact of statis-
tical manipulation but as an expression of a core human mental ability
much like the ability Spearman identified at the turn of the century. In
their view, g is one of the most thoroughly demonstrated entities in the
behavioral sciences and one of the most powerful for understanding so-
cially significant human variation.
The classicists took a long time to reach this level of consensus. The
ink on Spearman's first article on the topic in 1904 was barely dry be-
fore others were arguing that intellectual ability could not be adequately
captured by g or by any other unitary quantity-and
understandably so,
for common sense rebels against the idea that something so important
about people as their intellects can be captured even roughly by varia-
tions in a single quantity. Many of the famous names in the history of
psychometrics challenged the reality of g, starting with Galton's most
eminent early disciple, Karl Pearson, and continuing with many other
creative and influential psychometricians.
In diverse ways, they sought the grail of a set of primary and mutu-
ally independent mental abilities. For Spearman, there was just one such
primary ability, g. For Raymond Cattell, there are two kinds of g, mys-
tallized and fluid, with crystallized g being general intelligence trans.
formed into the skills of one's own culture, and fluid g being the
all-purpose intellectual capacity from which the crystallized skills are
formed. In Louis Thurstone's theory of intelligence, there are a half-
dozen or so primary mental abilities, such as verbal, quantitative, spatial,
and the like. In Philip Vernon's theory, intellectual capacities are
arranged in a hierarchy with g at its apex; in Joy Guilford's, the strut.
ture of intellect is refined into 120 or more intellectual components.
The theoretical alternatives to unitary, general intelligence have come
in many sizes, shapes, and degrees of plausibility.
Many of these efforts proved to have lasting value. For example, Cat.
tell's distinction between fluid and crystallized intelligence remains a
useful conceptual contrast, just as other work has done much to clarify
what lies in the domain of specific abilities that g cannot account for.
But no one has been able to devise a set of tests that do not reveal a
large general factor of intellectual ability-in
other words, something
very like Spearman's g. Furthermore, the classicists point out, the best
standardized tests, such as a modem IQ test, do a reasonably good job
of measuring g. When properly administered, the tests are not measur.
ably biased against socioeconomic, ethnic, or racial subgroups. They
predict a wide variety of socially important outcomes.
This is not the same as saying that the classicists are satisfied with
their understanding of intelligence. g is a statistical entity, and current
research is probing the underlying neurologic basis for it. Arthur Jensen,
the archetypal classicist, has been active in this effort for the last decade,
returning to Galton's intuition that performance on elementary cogni-
tive tasks, such as reaction time in recognizing simple patterns of lights
and shapes, provides an entry point into understanding the physiology
of g.
The Revisionists: Intelligence as Information Processing
A theory of intelligence need not be structural. The emphasis may be
on process rather than on structure. In other words, it may try to figure
out what a person is doing when exercising his or her intelligence, rather
than what elements of intelligence are put together. The great Swiss
psychologist, Jean Piaget, started his career in Alfred Binet's laboratory
trying to adapt Cyril Burt's intelligence tests for Parisian children. Piaget
1 6
Introduction
Introduction
1 7
discovered quickly that he was less interested in how well the children
did than in what errors they made."" Errors revealed what the underly-
ing processes of thought must have been, Piaget believed. It was the
processes of intelligence that fascinated him during his long and illus-
trious career, which led in time to his theory of the stages of cognitive
development.
Starting in the 1960s, research on human cognition became the pre-
occupation of experimental psychologists, displacing the animal learn-
ing experiments of the earlier period. It was inevitable that the new
experimentalists would turn to the study of human intelligence in nat-
ural settings. John B. Carroll and Earl B. Hunt led the way from the cog-
nition laboratory to the study of human intelligence in everyday life.
Today Yale psychologist Robert Sternberg is among the leaders of this
development.
The revisionists share much with the classicists. They accept that a
general mental ability much like Spearman's g has to be incorporated
into any theory of the structure of intelligence, although they would not
agree that it accounts for as much of the intellectual variation among
people as many classicists claim. They use many of the same statistical
tools as the classicists and are prepared to subject their work to the same
standards of rigor. Where they differ with the classicists, however, is
their attitude toward intellectual structure and the tests used to mea-
sure it.
Yes, the revisionists argue, human intelligence has a structure, but is
it worth investing all that effort in discovering what it is? The preoc-
cupation with structure has engendered preoccupation with summary
scores, the revisionists say. That, after all, is what an IQ score represents:
a composite of scores that individually measure quite distinct intellec-
tual processes. "Of course," Sternberg writes, "a tester can always aver-
age over multiple scores. But are such averages revealing, or do they
camouflage more than they reveal? If a person is a wonderful visualizer
but can barely compose a sentence, and another person can write glow-
ing prose but cannot begin to visualize the simplest spatial images, what
do you really learn about these two people if they are reported to have
the same IQlfl3'j
By focusing on processes, the revisionists argue, they are working
richer veins than are those who search for static structure. What really
counts about intelligence are the ways in which people process the in)
formation they receive. What problem-solving mechanisms do they em-
ploy? How do they trade off speed and accuracy? How do they combine
different problem-solving resources into a strategy? Sternberg has fash-
ioned his own thinking on this topic into what he calls a "triarchy of
intelligence," or "three aspects of human information processing."37
The first part of Sternberg's triarchy attempts to describe the inter-
nal architecture of intellectual functioning, the means by which hu-
mans translate sensory inputs into mental representations, allocate
mental resources, infer conclusions from raw material, and acquire skills.
This architectural component of Sternberg's theory bears a family re-
semblance to the classicists' view of the dimensions of intelligence, but
it emphasizes process over structure.
The second part of the triarchic theory addresses the role of intelli-
gence in routinizing performance, starting with completely novel tasks
that test a person's insightfulness, flexibility, and creativity, and even-
tually converting them to routine tasks that can be done without con.
scious thought. Understand this process, Sternberg argues, and we have
leverage not just for measuring intelligence but for improving it.
The third part of Sternberg's triarchy attacks the question that has
been central to the controversy over intelligence tests: the relationship
of intelligence to the real world in which people function. In Sternberg's
view, people function by means of three mechanisms: adaptation
(roughly, trying to make the best of the situation), shaping the external
environment so that it conforms more closely to the desired state of af-
fairs, or selecting a new environment altogether. Sternberg laments the
inadequacies of traditional intelligence tests in capturing this real-world
aspect of intelligence and seeks to develop tests that will do so-and,
in addition, lead to techniques for teaching people to raise their intel-
ligence.
The Radicals: The Theory of Multiple Intelligences
Walter Lippmann's hostility toward intelligence testing was grounded
in his belief that this most important of all human qualities was too di-
verse, too complex, too changeable, too dependent on cultural context,
and, above all, too subjective to be measured by answers to a mere list
of test questions. Intelligence seemed to him, as it does to many other
thoughtful people who are not themselves expert in testing, more like
beauty or justice than height or weight. Before something can be mea-
sured, it must be defined, this argument goes.38 And the problems of defi-
Revisionist Views on Intelligence
- Revisionists argue that traditional IQ scores camouflage individual strengths by averaging distinct intellectual processes into a single number.
- Robert Sternberg’s triarchic theory emphasizes the internal architecture of how humans process information rather than static mental structures.
- The theory explores how intelligence converts novel, creative tasks into routine performances that can be executed without conscious thought.
- A key component of the triarchy is the relationship between intelligence and the real world, focusing on adaptation, environmental shaping, and selection.
- Radical critics like Walter Lippmann and Howard Gardner argue that intelligence is too subjective and culturally dependent to be measured like height or weight.
- The shift toward 'multiple intelligences' suggests that intelligence is more akin to abstract concepts like beauty or justice than a simple quantifiable metric.
If a person is a wonderful visualizer but can barely compose a sentence, and another person can write glowing prose but cannot begin to visualize the simplest spatial images, what do you really learn about these two people if they are reported to have the same IQ?
1 6
Introduction
Introduction
1 7
discovered quickly that he was less interested in how well the children
did than in what errors they made."" Errors revealed what the underly-
ing processes of thought must have been, Piaget believed. It was the
processes of intelligence that fascinated him during his long and illus-
trious career, which led in time to his theory of the stages of cognitive
development.
Starting in the 1960s, research on human cognition became the pre-
occupation of experimental psychologists, displacing the animal learn-
ing experiments of the earlier period. It was inevitable that the new
experimentalists would turn to the study of human intelligence in nat-
ural settings. John B. Carroll and Earl B. Hunt led the way from the cog-
nition laboratory to the study of human intelligence in everyday life.
Today Yale psychologist Robert Sternberg is among the leaders of this
development.
The revisionists share much with the classicists. They accept that a
general mental ability much like Spearman's g has to be incorporated
into any theory of the structure of intelligence, although they would not
agree that it accounts for as much of the intellectual variation among
people as many classicists claim. They use many of the same statistical
tools as the classicists and are prepared to subject their work to the same
standards of rigor. Where they differ with the classicists, however, is
their attitude toward intellectual structure and the tests used to mea-
sure it.
Yes, the revisionists argue, human intelligence has a structure, but is
it worth investing all that effort in discovering what it is? The preoc-
cupation with structure has engendered preoccupation with summary
scores, the revisionists say. That, after all, is what an IQ score represents:
a composite of scores that individually measure quite distinct intellec-
tual processes. "Of course," Sternberg writes, "a tester can always aver-
age over multiple scores. But are such averages revealing, or do they
camouflage more than they reveal? If a person is a wonderful visualizer
but can barely compose a sentence, and another person can write glow-
ing prose but cannot begin to visualize the simplest spatial images, what
do you really learn about these two people if they are reported to have
the same IQlfl3'j
By focusing on processes, the revisionists argue, they are working
richer veins than are those who search for static structure. What really
counts about intelligence are the ways in which people process the in)
formation they receive. What problem-solving mechanisms do they em-
ploy? How do they trade off speed and accuracy? How do they combine
different problem-solving resources into a strategy? Sternberg has fash-
ioned his own thinking on this topic into what he calls a "triarchy of
intelligence," or "three aspects of human information processing."37
The first part of Sternberg's triarchy attempts to describe the inter-
nal architecture of intellectual functioning, the means by which hu-
mans translate sensory inputs into mental representations, allocate
mental resources, infer conclusions from raw material, and acquire skills.
This architectural component of Sternberg's theory bears a family re-
semblance to the classicists' view of the dimensions of intelligence, but
it emphasizes process over structure.
The second part of the triarchic theory addresses the role of intelli-
gence in routinizing performance, starting with completely novel tasks
that test a person's insightfulness, flexibility, and creativity, and even-
tually converting them to routine tasks that can be done without con.
scious thought. Understand this process, Sternberg argues, and we have
leverage not just for measuring intelligence but for improving it.
The third part of Sternberg's triarchy attacks the question that has
been central to the controversy over intelligence tests: the relationship
of intelligence to the real world in which people function. In Sternberg's
view, people function by means of three mechanisms: adaptation
(roughly, trying to make the best of the situation), shaping the external
environment so that it conforms more closely to the desired state of af-
fairs, or selecting a new environment altogether. Sternberg laments the
inadequacies of traditional intelligence tests in capturing this real-world
aspect of intelligence and seeks to develop tests that will do so-and,
in addition, lead to techniques for teaching people to raise their intel-
ligence.
The Radicals: The Theory of Multiple Intelligences
Walter Lippmann's hostility toward intelligence testing was grounded
in his belief that this most important of all human qualities was too di-
verse, too complex, too changeable, too dependent on cultural context,
and, above all, too subjective to be measured by answers to a mere list
of test questions. Intelligence seemed to him, as it does to many other
thoughtful people who are not themselves expert in testing, more like
beauty or justice than height or weight. Before something can be mea-
sured, it must be defined, this argument goes.38 And the problems of defi-
1 8
Introduction
Introduction
19
nition for beauty, justice, or intelligence are insuperable, To people who
hold these views, the claims of the intelligence testers seem naive at
best and vicious at worst. These views, which are generally advanced
primarily by nonspecialists, have found an influential spokesman from
the academy, which is mainly why we include them here. We refer here
to the theory of multiple intelligences formulated by Howard Gardner,
a Harvard psychologist.
Gardner's general definition of intelligent behavior does not seem
radical at all. For Gardner, as for many other thinkers on intelligence,
the notion of problem solving is central. "A human intellectual com-
petence must entail a set of skills of problem solving," he writes, "en-
abling the individual to resolve genuine problems or difficulties that he or
she encounters and, when appropriate, to create an effective product-
and also must entail the potential for finding or creating problems-
thereby laying the groundwork for the acquisition of new knowledge.""
Gardner's view is radical (a word he uses himself to describe his the-
ory) in that he rejects, virtually without qualification, the notion of a
general intelligence factor, which is to say that he denies g. Instead, he
argues the case for seven distinct intelligences: linguistic, musical,
logical~mathematical, spatial, bodily-kinesthetic, and two forms of "per-
sonal intelligence," the intrapersonal and the interpersonal, each based
on its own unique computational capacity.40 Gardner rejects the criti-
cism that he has merely redefined the word intelligence by broadening it
to include what may more properly be called talents: "I place no par-
ticular premium on the word intellgence, but I do place great importance
on the equivalence of various human faculties," he writes. "If critics [of
his theory] were willing to label language and logical thinking as talents
as well, and to remove these from the pedestal they currently occupy,
then I would be happy to speak of multiple talentsqn4'
Gardner's approach is also radical in that he does not defend his the-
ory with quantitative data. He draws on findings from anthropology to
zoology in his narrative, but, in a field that has been intensely quanti-
tative since its inception, Gardner's work is uniquely devoid of psycho-
metric or other quantitative evidence. He dismisses factor analysis:
"[Gliven the same set of data, it is possible, using one set of factor-
analytic procedures, to come up with a picture that supports the idea of
a 'g' factor; using another equally valid method of statistical analysis, it
is possible to support the notion of a family of relatively discrete men-
tal abilitie~.""~~
He is untroubled by the fact that tests of the varying in-
telligences in his theory seem to be intercorrelated: "I fear, . . that I can-
not accept these correlations at face value. Nearly all current tests are
so devised that they call principally upon linguistic and logical facil-
ity. . . . Accordingly, individuals with these skills are likely to do well
even in tests of musical or spatial abilities, while those who are not es-
pecially facile linguistically and logically are likely to be impaled on such
standardized tests."43 And in general, he invites his readers to disregard
the thorny complexities of the classical and revisionist approaches:
"When it comes to the interpretation of intelligence testing, we are
faced with an issue of taste or preference rather than one on which sci-
entific closure is likely to be reached."44
THE PERSPECTIVE OF THIS BOOK
Given these different ways of understanding intelligence, you will nat-
urally ask where our sympathies lie and how they shape this book.
We will be drawing most heavily from the classical tradition. That
body of scholarship represents an immense and rigorously analyzed body
of knowledge. By accepted standards of what constitutes scientific evi-
dence and scientific proof, the classical tradition has in our view given
the world a treasure of information that has been largely ignored in try-
ing to understand contemporary policy issues. Moreover, because our
topic is the relationship of human abilities to public policy, we will be
dealing in relationships that are based on aggregated data, which is
where the classical tradition has the most to offer. Perhaps an example
will illustrate what we mean.
Suppose that the question at issue regards individuals: "Given two 11
year olds, one with an IQ of 110 and one with an IQ of 90, what can
you tell us about the differences between those two children?" The an-
swer must be phrased very tentatively. On many important topics, the
answer must be, "We can tell you nothing with any confidence," It is
well worth a guidance counselor's time to know what these individual
scores are, but only in combination with a variety of other information
about the child's personality, talents, and background. The individual's
IQ score all by itself is a useful tool but a limited one.
Suppose instead that the question at issue is: "Given two sixth-grade
classes, one for which the average IQ is 110 and the other for which it
is 90, what can you tell us about the difference between those two classes
and their average prospects for the future!" Now there is a great deal to
Gardner and the Classical Tradition
- Howard Gardner defines intelligence as the ability to solve problems, create products, and identify new questions to acquire knowledge.
- Gardner's theory is considered radical because it rejects the concept of a general intelligence factor (g) in favor of seven distinct intelligences.
- The theory challenges the hierarchy of human faculties, arguing that linguistic and logical skills should not be placed on a pedestal above other talents.
- Gardner intentionally avoids psychometric data and factor analysis, claiming that statistical results are often a matter of interpretation or taste.
- He argues that correlations between different test scores are flawed because most tests are biased toward linguistic and logical facility.
- The authors of this book declare their alignment with the classical tradition, citing its rigorous quantitative evidence and relevance to public policy.
If critics were willing to label language and logical thinking as talents as well, and to remove these from the pedestal they currently occupy, then I would be happy to speak of multiple talents.
1 8
Introduction
Introduction
19
nition for beauty, justice, or intelligence are insuperable, To people who
hold these views, the claims of the intelligence testers seem naive at
best and vicious at worst. These views, which are generally advanced
primarily by nonspecialists, have found an influential spokesman from
the academy, which is mainly why we include them here. We refer here
to the theory of multiple intelligences formulated by Howard Gardner,
a Harvard psychologist.
Gardner's general definition of intelligent behavior does not seem
radical at all. For Gardner, as for many other thinkers on intelligence,
the notion of problem solving is central. "A human intellectual com-
petence must entail a set of skills of problem solving," he writes, "en-
abling the individual to resolve genuine problems or difficulties that he or
she encounters and, when appropriate, to create an effective product-
and also must entail the potential for finding or creating problems-
thereby laying the groundwork for the acquisition of new knowledge.""
Gardner's view is radical (a word he uses himself to describe his the-
ory) in that he rejects, virtually without qualification, the notion of a
general intelligence factor, which is to say that he denies g. Instead, he
argues the case for seven distinct intelligences: linguistic, musical,
logical~mathematical, spatial, bodily-kinesthetic, and two forms of "per-
sonal intelligence," the intrapersonal and the interpersonal, each based
on its own unique computational capacity.40 Gardner rejects the criti-
cism that he has merely redefined the word intelligence by broadening it
to include what may more properly be called talents: "I place no par-
ticular premium on the word intellgence, but I do place great importance
on the equivalence of various human faculties," he writes. "If critics [of
his theory] were willing to label language and logical thinking as talents
as well, and to remove these from the pedestal they currently occupy,
then I would be happy to speak of multiple talentsqn4'
Gardner's approach is also radical in that he does not defend his the-
ory with quantitative data. He draws on findings from anthropology to
zoology in his narrative, but, in a field that has been intensely quanti-
tative since its inception, Gardner's work is uniquely devoid of psycho-
metric or other quantitative evidence. He dismisses factor analysis:
"[Gliven the same set of data, it is possible, using one set of factor-
analytic procedures, to come up with a picture that supports the idea of
a 'g' factor; using another equally valid method of statistical analysis, it
is possible to support the notion of a family of relatively discrete men-
tal abilitie~.""~~
He is untroubled by the fact that tests of the varying in-
telligences in his theory seem to be intercorrelated: "I fear, . . that I can-
not accept these correlations at face value. Nearly all current tests are
so devised that they call principally upon linguistic and logical facil-
ity. . . . Accordingly, individuals with these skills are likely to do well
even in tests of musical or spatial abilities, while those who are not es-
pecially facile linguistically and logically are likely to be impaled on such
standardized tests."43 And in general, he invites his readers to disregard
the thorny complexities of the classical and revisionist approaches:
"When it comes to the interpretation of intelligence testing, we are
faced with an issue of taste or preference rather than one on which sci-
entific closure is likely to be reached."44
THE PERSPECTIVE OF THIS BOOK
Given these different ways of understanding intelligence, you will nat-
urally ask where our sympathies lie and how they shape this book.
We will be drawing most heavily from the classical tradition. That
body of scholarship represents an immense and rigorously analyzed body
of knowledge. By accepted standards of what constitutes scientific evi-
dence and scientific proof, the classical tradition has in our view given
the world a treasure of information that has been largely ignored in try-
ing to understand contemporary policy issues. Moreover, because our
topic is the relationship of human abilities to public policy, we will be
dealing in relationships that are based on aggregated data, which is
where the classical tradition has the most to offer. Perhaps an example
will illustrate what we mean.
Suppose that the question at issue regards individuals: "Given two 11
year olds, one with an IQ of 110 and one with an IQ of 90, what can
you tell us about the differences between those two children?" The an-
swer must be phrased very tentatively. On many important topics, the
answer must be, "We can tell you nothing with any confidence," It is
well worth a guidance counselor's time to know what these individual
scores are, but only in combination with a variety of other information
about the child's personality, talents, and background. The individual's
IQ score all by itself is a useful tool but a limited one.
Suppose instead that the question at issue is: "Given two sixth-grade
classes, one for which the average IQ is 110 and the other for which it
is 90, what can you tell us about the difference between those two classes
and their average prospects for the future!" Now there is a great deal to
Predictive Power of IQ
- Individual IQ scores are limited tools that require additional context like personality and background to be useful for guidance.
- Aggregate IQ scores for groups or classes allow for high-confidence predictions regarding social and educational outcomes.
- The authors focus on the classical tradition of intelligence because of its relevance to aggregate social and economic data.
- The text argues against the 'multiple intelligences' framework, preferring specific terms like talent, charm, or sensitivity to maintain linguistic precision.
- Intelligence is often overvalued as a human virtue, leading to the 'insidious' error of assuming one can judge IQ through casual interaction.
One of the most insidious but also widespread errors regarding IQ, especially among people who have high IQs, is the assumption that another person's intelligence can be inferred from casual interactions.
1 8
Introduction
Introduction
19
nition for beauty, justice, or intelligence are insuperable, To people who
hold these views, the claims of the intelligence testers seem naive at
best and vicious at worst. These views, which are generally advanced
primarily by nonspecialists, have found an influential spokesman from
the academy, which is mainly why we include them here. We refer here
to the theory of multiple intelligences formulated by Howard Gardner,
a Harvard psychologist.
Gardner's general definition of intelligent behavior does not seem
radical at all. For Gardner, as for many other thinkers on intelligence,
the notion of problem solving is central. "A human intellectual com-
petence must entail a set of skills of problem solving," he writes, "en-
abling the individual to resolve genuine problems or difficulties that he or
she encounters and, when appropriate, to create an effective product-
and also must entail the potential for finding or creating problems-
thereby laying the groundwork for the acquisition of new knowledge.""
Gardner's view is radical (a word he uses himself to describe his the-
ory) in that he rejects, virtually without qualification, the notion of a
general intelligence factor, which is to say that he denies g. Instead, he
argues the case for seven distinct intelligences: linguistic, musical,
logical~mathematical, spatial, bodily-kinesthetic, and two forms of "per-
sonal intelligence," the intrapersonal and the interpersonal, each based
on its own unique computational capacity.40 Gardner rejects the criti-
cism that he has merely redefined the word intelligence by broadening it
to include what may more properly be called talents: "I place no par-
ticular premium on the word intellgence, but I do place great importance
on the equivalence of various human faculties," he writes. "If critics [of
his theory] were willing to label language and logical thinking as talents
as well, and to remove these from the pedestal they currently occupy,
then I would be happy to speak of multiple talentsqn4'
Gardner's approach is also radical in that he does not defend his the-
ory with quantitative data. He draws on findings from anthropology to
zoology in his narrative, but, in a field that has been intensely quanti-
tative since its inception, Gardner's work is uniquely devoid of psycho-
metric or other quantitative evidence. He dismisses factor analysis:
"[Gliven the same set of data, it is possible, using one set of factor-
analytic procedures, to come up with a picture that supports the idea of
a 'g' factor; using another equally valid method of statistical analysis, it
is possible to support the notion of a family of relatively discrete men-
tal abilitie~.""~~
He is untroubled by the fact that tests of the varying in-
telligences in his theory seem to be intercorrelated: "I fear, . . that I can-
not accept these correlations at face value. Nearly all current tests are
so devised that they call principally upon linguistic and logical facil-
ity. . . . Accordingly, individuals with these skills are likely to do well
even in tests of musical or spatial abilities, while those who are not es-
pecially facile linguistically and logically are likely to be impaled on such
standardized tests."43 And in general, he invites his readers to disregard
the thorny complexities of the classical and revisionist approaches:
"When it comes to the interpretation of intelligence testing, we are
faced with an issue of taste or preference rather than one on which sci-
entific closure is likely to be reached."44
THE PERSPECTIVE OF THIS BOOK
Given these different ways of understanding intelligence, you will nat-
urally ask where our sympathies lie and how they shape this book.
We will be drawing most heavily from the classical tradition. That
body of scholarship represents an immense and rigorously analyzed body
of knowledge. By accepted standards of what constitutes scientific evi-
dence and scientific proof, the classical tradition has in our view given
the world a treasure of information that has been largely ignored in try-
ing to understand contemporary policy issues. Moreover, because our
topic is the relationship of human abilities to public policy, we will be
dealing in relationships that are based on aggregated data, which is
where the classical tradition has the most to offer. Perhaps an example
will illustrate what we mean.
Suppose that the question at issue regards individuals: "Given two 11
year olds, one with an IQ of 110 and one with an IQ of 90, what can
you tell us about the differences between those two children?" The an-
swer must be phrased very tentatively. On many important topics, the
answer must be, "We can tell you nothing with any confidence," It is
well worth a guidance counselor's time to know what these individual
scores are, but only in combination with a variety of other information
about the child's personality, talents, and background. The individual's
IQ score all by itself is a useful tool but a limited one.
Suppose instead that the question at issue is: "Given two sixth-grade
classes, one for which the average IQ is 110 and the other for which it
is 90, what can you tell us about the difference between those two classes
and their average prospects for the future!" Now there is a great deal to
20
Introduction
be said, and it can be said with considerable confidence-not
about any
one person in either class but about average outcomes that are impor-
tant to the school, educational policy in general, and society writ large.
The data accumulated under the classical tradition are extremely rich
in this regard, as will become evident in subsequent chapters.
If instead we were more concerned with the development of cogni-
tive processes than with aggregate social and economic outcomes, we
would correspondingly spend more time discussing the work of the re-
visionists. That we do not reflects our focus, not a dismissal of their work.
With regard to the radicals and the theory of multiple intelligences,
we share some common ground. Socially significant individual differ-
ences include a wide range of human talents that do not fit within the
classical conception of intelligence. For certain spheres of life, they mat-
ter profoundly. And even beyond intelligence and talents, people vary
temperamentally, in personality, style, and character. But we confess to
reservations about using the word intelligence to describe such factors as
musical abilities, kinesthetic abilities, or personal skills. It is easy to un-
derstand haw intelligence (ordinarily understood) is part of some as-
pects of each of those human qualities-obviously, Bach was engaging
in intelligent activity, and so was Ted Williams, and so is a good used-
car salesman-but
the part intelligence plays in these activities is cap-
tured fairly well by intelligence as the classicists and revisionists
conceive of it. In the case of music and kinesthetics, talent is a word with
a domain and weight of its own, and we are unclear why we gain any-
thing by discarding it in favor of another word, intelligence, that has had
another domain and weight. In the case of intrapersonal and interper-
sonal skills, conventional intelligence may play some role, and, to the
extent that other human qualities matter, words like sensitivity, chum,
persuasiveness, insight-the
list could go on and on-have
accumulated
over the centuries to describe them. We lose precision by using the word
intelligence to cover them all. Similarly, the effect that an artist or an
athlete or a salesman creates is complex, with some aspects that may be
dominated by specific endowments or capacities, others that may be the
product of learned technique, others that may be linked to desires and
drives, and still others that are characteristic of the kind of cognitive
ability denoted by intelligence. Why try to make intelligence do triple or
quadruple duty?
We agree emphatically with Howard Gardner, however, that the con-
cept of intelligence has taken on a much higher place in the pantheon
of human virtues than it deserves. One of the most insidious but also
widespread errors regarding IQ, especially among people who have high
IQs, is the assutnption that another person's intelligence can be inferred
from casual interactions. Many people conclude that if they see some-
one who is sensitive, humorous, and talks fluently, the person must
surely have an above-average IQ.
This identification of IQ with attractive human qualities in general
is unfortunate and wrong. Statistically, there is often a modest correla-
tion with such qualities. But modest correlations are of little use in siz-
ing up other individuals one by one. For example, a person can have a
terrific sense of humor without giving you a clue about where he is
within thirty points on the IQ scale. Or a plumber with a measured IQ
of 100--only an average IQ--can know a great deal about the func-
tioning of plumbing systems. He may be able to diagnose problems, dis-
cuss them artic~~lately,
make shrewd decisions about how to fix them,
and, while he is working, make some pithy remarks about the president's
recent speech.
At the same time, high intelligence has earmarks that correspond to
a first approximation to the cotnmonly understood meaning of smart. In
our experience, people do not use smart ro mean (necessarily) that aper-
son is prudent or knowledgeable b ~ ~ t
rather to refer to qualities of men-
tal quickness and complexity that do in fact show up in high test scores.
To return to our examples: Many witty people do not have unusually
high test scores, hut someone who regularly tosses off impromptu com-
plex puns probably does (which does nor necessarily mean that such
puns are very funny, we hasten to add). If the plumber runs into a prob-
lem he has never seen before and diagnoses its source through inferences
from what he does know, he probably has an IQ of more than 100 after
all. In this, language tends to reflect real differences: In everyday lan-
guage, people who are called very smart tend to have high IQs.
All of this is another way of making a point so important that we will
italicize it now and repeat elsewhere: Measures of intelligence haere reli-
able statistical relationships with important social phenomena, but they are a
limited tool for deciding what to make of any given individual. Repeat it we
must, for one of the problems of writing about intelligence is how to re-
mind readers often enough how little an IQ score tells about whether
the human being next to you is someone whom you will admire or cher-
ish. This thing we know as IQ is important but not a synonym for hu-
man excellence.
Defining Intelligence and IQ
- The common tendency to equate high IQ with attractive personality traits like humor or fluency is statistically weak and often misleading.
- While 'smartness' in everyday language often aligns with mental quickness and complexity, an IQ score is not a synonym for general human excellence.
- Individuals with average or low IQs can demonstrate high levels of specialized expertise, such as complex plumbing diagnostics or intricate betting systems.
- The phenomenon of 'idiot savants' and successful track bettors illustrates that low measured IQ does not preclude the performance of complex cognitive tasks.
- The authors advocate for the more neutral term 'cognitive ability' to avoid the political and emotional baggage associated with the word 'intelligence'.
- IQ scores serve as reliable statistical tools for studying social phenomena but are limited when evaluating the worth or character of a specific individual.
This thing we know as IQ is important but not a synonym for human excellence.
20
Introduction
be said, and it can be said with considerable confidence-not
about any
one person in either class but about average outcomes that are impor-
tant to the school, educational policy in general, and society writ large.
The data accumulated under the classical tradition are extremely rich
in this regard, as will become evident in subsequent chapters.
If instead we were more concerned with the development of cogni-
tive processes than with aggregate social and economic outcomes, we
would correspondingly spend more time discussing the work of the re-
visionists. That we do not reflects our focus, not a dismissal of their work.
With regard to the radicals and the theory of multiple intelligences,
we share some common ground. Socially significant individual differ-
ences include a wide range of human talents that do not fit within the
classical conception of intelligence. For certain spheres of life, they mat-
ter profoundly. And even beyond intelligence and talents, people vary
temperamentally, in personality, style, and character. But we confess to
reservations about using the word intelligence to describe such factors as
musical abilities, kinesthetic abilities, or personal skills. It is easy to un-
derstand haw intelligence (ordinarily understood) is part of some as-
pects of each of those human qualities-obviously, Bach was engaging
in intelligent activity, and so was Ted Williams, and so is a good used-
car salesman-but
the part intelligence plays in these activities is cap-
tured fairly well by intelligence as the classicists and revisionists
conceive of it. In the case of music and kinesthetics, talent is a word with
a domain and weight of its own, and we are unclear why we gain any-
thing by discarding it in favor of another word, intelligence, that has had
another domain and weight. In the case of intrapersonal and interper-
sonal skills, conventional intelligence may play some role, and, to the
extent that other human qualities matter, words like sensitivity, chum,
persuasiveness, insight-the
list could go on and on-have
accumulated
over the centuries to describe them. We lose precision by using the word
intelligence to cover them all. Similarly, the effect that an artist or an
athlete or a salesman creates is complex, with some aspects that may be
dominated by specific endowments or capacities, others that may be the
product of learned technique, others that may be linked to desires and
drives, and still others that are characteristic of the kind of cognitive
ability denoted by intelligence. Why try to make intelligence do triple or
quadruple duty?
We agree emphatically with Howard Gardner, however, that the con-
cept of intelligence has taken on a much higher place in the pantheon
of human virtues than it deserves. One of the most insidious but also
widespread errors regarding IQ, especially among people who have high
IQs, is the assutnption that another person's intelligence can be inferred
from casual interactions. Many people conclude that if they see some-
one who is sensitive, humorous, and talks fluently, the person must
surely have an above-average IQ.
This identification of IQ with attractive human qualities in general
is unfortunate and wrong. Statistically, there is often a modest correla-
tion with such qualities. But modest correlations are of little use in siz-
ing up other individuals one by one. For example, a person can have a
terrific sense of humor without giving you a clue about where he is
within thirty points on the IQ scale. Or a plumber with a measured IQ
of 100--only an average IQ--can know a great deal about the func-
tioning of plumbing systems. He may be able to diagnose problems, dis-
cuss them artic~~lately,
make shrewd decisions about how to fix them,
and, while he is working, make some pithy remarks about the president's
recent speech.
At the same time, high intelligence has earmarks that correspond to
a first approximation to the cotnmonly understood meaning of smart. In
our experience, people do not use smart ro mean (necessarily) that aper-
son is prudent or knowledgeable b ~ ~ t
rather to refer to qualities of men-
tal quickness and complexity that do in fact show up in high test scores.
To return to our examples: Many witty people do not have unusually
high test scores, hut someone who regularly tosses off impromptu com-
plex puns probably does (which does nor necessarily mean that such
puns are very funny, we hasten to add). If the plumber runs into a prob-
lem he has never seen before and diagnoses its source through inferences
from what he does know, he probably has an IQ of more than 100 after
all. In this, language tends to reflect real differences: In everyday lan-
guage, people who are called very smart tend to have high IQs.
All of this is another way of making a point so important that we will
italicize it now and repeat elsewhere: Measures of intelligence haere reli-
able statistical relationships with important social phenomena, but they are a
limited tool for deciding what to make of any given individual. Repeat it we
must, for one of the problems of writing about intelligence is how to re-
mind readers often enough how little an IQ score tells about whether
the human being next to you is someone whom you will admire or cher-
ish. This thing we know as IQ is important but not a synonym for hu-
man excellence.
Introduction
23
Idiot Savants and Other Anomalies
To add one final complication, it is also known that some people with low
measured IQ occasionally engage in highly developed, complex cognitive
tasks. So-called idiot savants can (for example) tell you on what day Easter
occurred in any of the past or future two thousand years.H51
There are also
many less exotic examples. For example, a study of successful track bettors
revealed that some of them who used extremely complicated betting sys-
tems had below-average IQs and that IQ was not correlated with success.46
The trick in interpreting such results is to keep separate two questions: (1)
If one selects people who have already demonstrated an obsession and suc-
cess with racetrack betting systems, will one find a relationship with IQ
(the topic of the study in question)? versus (2) if one selects a thousand
people at random and asks them to develop racetrack betting systems, will
there be a relationship with IQ (in broad terms, the topic of this book)?
Howard Gardner has also convinced us that the word intelligence car-
ries with it undue affect and political baggage. It is still a useful word,
but we shall subsequently employ the more neutral term cognitive ability
as often as possible to refer to the concept that we have hitherto called
intelligence, just as we will use IQ as a generic synonym for intelligence test
score. Since cognitive ability is an uneuphonious phrase, we lapse often
so as to make the text readable. But at least we hope that it will help
you think of intelligence as just a noun, not an accolade.
We have said that we will be drawing most heavily on data from the
classical tradition. That implies that we also accept certain conclusions
undergirding that tradition. To draw the strands of our perspective to-
gether and to set the stage for the rest of the book, let us set them down
explicitly. Here are six conclusions regarding tests of cognitive ability,
drawn from the classical tradition, that are by now beyond significant
technical dispute:
1. There is such a thing as a general factor of cognitive ability on which
human beings differ.
2. All standardized tests of academic aptitude or achievement measure
this general factor to some degree, but IQ tests expressly designed for
that purpose measure it most accurately.
3. IQ scores match, to a first degree, whatever it is that people mean
when they use the word intelligent or smart in ordinary language.
4. IQ scores are stable, although not perfectly so, over much of a per-
son's life.
5. Properly administered IQ tests are not demonstrably biased against
social, economic, ethnic, or racial groups.
6, Cognitive ability is substantially heritable, apparently no less than
40 percent and no more than 80 percent.
All six points have an inverse worth noting. For example, some
people's scores change a lot; cognitive ability is not synonymous with
test scores or with a single general mental factor, and so on, When we
say that all are "beyond significant technical dispute," we mean, in
effect, that if you gathered the top experts on testing and cog.
nitive ability, drawn from all points of view, to argue over these
points, away from television cameras and reporters, it would quickly
become apparent that a consensus already exists on all of the points,
in some cases amounting to near unanimity. And although dispute
would ensue about some of the points, one side-the
side repre-
sented by the way the points are stated-would
have a clear pre-
ponderance of evidence favoring it, and those of another viewpoint
would be forced to lean heavily on isolated studies showing anom-
alous results.
This does not mean that the experts should leave the room with their
differences resolved. All six points can be accurate as general rules and
still leave room for differences in the theoretical and practical conclu.
sions that people of different values and perspectives draw from them
(and from the mass of material about cognitive ability and testing not
incorporated in the six points). Radicals in the Gardner mold might still
balk at all the attention being paid to intelligence as the tests measure
it, But these points, in themselves, are squarely in the middle of the sci-
entific road.
Having said this, however, we are left with a dilemma. The received
wisdom in the media is roughly 180 degrees opposite from each of the
six points. To prove our case, taking each point and amassing a full ac-
count of the evidence for and against, would lead us to write a book just
about them. Such books have already been written. There is no point
in our trying to duplicate them.[471
We have taken two steps to help you form your own judgments within
the limits of this book, First, we deal with specific issues involving the
six points as they arise in the natural course of the discussion--cultural
The Classical View of Intelligence
- The authors define intelligence as a neutral noun describing cognitive ability rather than a moral accolade.
- Six core conclusions from the classical tradition of testing are presented as being beyond significant technical dispute among experts.
- These conclusions assert that a general factor of cognitive ability exists, is measurable by IQ tests, remains relatively stable, and is substantially heritable.
- The text claims that properly administered IQ tests are not demonstrably biased against specific social, economic, or ethnic groups.
- A significant gap exists between scientific consensus and media perception, which often contradicts these six foundational points.
- While the data points are considered scientifically robust, the authors acknowledge that different values can lead to different practical and theoretical interpretations.
But at least we hope that it will help you think of intelligence as just a noun, not an accolade.
Introduction
23
Idiot Savants and Other Anomalies
To add one final complication, it is also known that some people with low
measured IQ occasionally engage in highly developed, complex cognitive
tasks. So-called idiot savants can (for example) tell you on what day Easter
occurred in any of the past or future two thousand years.H51
There are also
many less exotic examples. For example, a study of successful track bettors
revealed that some of them who used extremely complicated betting sys-
tems had below-average IQs and that IQ was not correlated with success.46
The trick in interpreting such results is to keep separate two questions: (1)
If one selects people who have already demonstrated an obsession and suc-
cess with racetrack betting systems, will one find a relationship with IQ
(the topic of the study in question)? versus (2) if one selects a thousand
people at random and asks them to develop racetrack betting systems, will
there be a relationship with IQ (in broad terms, the topic of this book)?
Howard Gardner has also convinced us that the word intelligence car-
ries with it undue affect and political baggage. It is still a useful word,
but we shall subsequently employ the more neutral term cognitive ability
as often as possible to refer to the concept that we have hitherto called
intelligence, just as we will use IQ as a generic synonym for intelligence test
score. Since cognitive ability is an uneuphonious phrase, we lapse often
so as to make the text readable. But at least we hope that it will help
you think of intelligence as just a noun, not an accolade.
We have said that we will be drawing most heavily on data from the
classical tradition. That implies that we also accept certain conclusions
undergirding that tradition. To draw the strands of our perspective to-
gether and to set the stage for the rest of the book, let us set them down
explicitly. Here are six conclusions regarding tests of cognitive ability,
drawn from the classical tradition, that are by now beyond significant
technical dispute:
1. There is such a thing as a general factor of cognitive ability on which
human beings differ.
2. All standardized tests of academic aptitude or achievement measure
this general factor to some degree, but IQ tests expressly designed for
that purpose measure it most accurately.
3. IQ scores match, to a first degree, whatever it is that people mean
when they use the word intelligent or smart in ordinary language.
4. IQ scores are stable, although not perfectly so, over much of a per-
son's life.
5. Properly administered IQ tests are not demonstrably biased against
social, economic, ethnic, or racial groups.
6, Cognitive ability is substantially heritable, apparently no less than
40 percent and no more than 80 percent.
All six points have an inverse worth noting. For example, some
people's scores change a lot; cognitive ability is not synonymous with
test scores or with a single general mental factor, and so on, When we
say that all are "beyond significant technical dispute," we mean, in
effect, that if you gathered the top experts on testing and cog.
nitive ability, drawn from all points of view, to argue over these
points, away from television cameras and reporters, it would quickly
become apparent that a consensus already exists on all of the points,
in some cases amounting to near unanimity. And although dispute
would ensue about some of the points, one side-the
side repre-
sented by the way the points are stated-would
have a clear pre-
ponderance of evidence favoring it, and those of another viewpoint
would be forced to lean heavily on isolated studies showing anom-
alous results.
This does not mean that the experts should leave the room with their
differences resolved. All six points can be accurate as general rules and
still leave room for differences in the theoretical and practical conclu.
sions that people of different values and perspectives draw from them
(and from the mass of material about cognitive ability and testing not
incorporated in the six points). Radicals in the Gardner mold might still
balk at all the attention being paid to intelligence as the tests measure
it, But these points, in themselves, are squarely in the middle of the sci-
entific road.
Having said this, however, we are left with a dilemma. The received
wisdom in the media is roughly 180 degrees opposite from each of the
six points. To prove our case, taking each point and amassing a full ac-
count of the evidence for and against, would lead us to write a book just
about them. Such books have already been written. There is no point
in our trying to duplicate them.[471
We have taken two steps to help you form your own judgments within
the limits of this book, First, we deal with specific issues involving the
six points as they arise in the natural course of the discussion--cultural
24
Introduction
bias when discussing differences in scores across ethnic groups, for ex-
ample. Second, we try to provide a level of detail that will satisfy dif-
ferent levels of technical curiosity through the use of boxed material
(you have already come across some examples), notes, and appendixes.
Because we expect (and fear) that many readers will go directly to chap-
ters that especially interest them rather than read the book from cover
to cover, we also insert periodic reminders about where discussion of
certain key topics may be found.
PART I
The Emergence of a
Cognitive Elite
The twentieth century dawned on a world segregated into social classes
defined in terms of money, power, and status. The ancient lines of sep-
aration based on hereditary rank were being erased, replaced by a more
complicated set of overlapping lines. Social standing still played a ma-
jor role, if less often accompanied by a sword or tiara, but so did out-
and-out wealth, educational credentials, and, increasingly, talent.
Our thesis is that the twentieth century has continued the transfor-
mation, so that the twenty-first will open on a world in which cogni-
tive ability is the decisive dividing force. The shift is more subtle than
the previous one but more momentous. Social class remains the vehi-
cle of social life, but intelligence now pulls the train.
Cognitive stratification takes different forms at the top and the bot-
tom of the scale of intelligence. Part I1 will look at the bottom. In Part
I, we look at the top. Its story line is that modern societies identify the
brightest youths with ever increasing efficiency and then guide them
into fairly narrow educational and occupational channels. These chan-
nels are increasingly lucrative and influential, leading to the develop-
ment of a distinct stratum in the social hierarchy, which we hereby dub
the Cognitive Elite. The isolation of the brightest from the rest of soci-
ety is already extreme; the forces driving it are growing stronger rather
than weaker. Governments can influence these forces but cannot neu-
tralize them.
This does not mean that a member of the cognitive elite never crosses
paths with a person with a low IQ, but the encounters that matter tend
to be limited. The more intimate or more enduring the human rela-
tionship is, the more likely it is to be among people similar in intellec-
tual level. That the brightest are identified has its benefits. That they
become so isolated and inbred has its costs. Some of these costs are al-
ready visible in American society, while others lie over the horizon.
2 5
The Rise of Cognitive Stratification
- The 20th century transitioned from social classes defined by hereditary rank and wealth to a system increasingly dominated by cognitive ability.
- Modern societies have become highly efficient at identifying the brightest youths and funneling them into lucrative, influential career paths.
- This process has created a 'Cognitive Elite' that is increasingly isolated and inbred, rarely forming intimate bonds with those outside their intellectual level.
- Historically, cognitive stratification was prevented by factors like clerical celibacy and the biological regression to the mean within aristocratic lineages.
- The authors argue that intelligence has become the 'decisive dividing force' of the 21st century, pulling the train of social class.
- While identifying talent has societal benefits, the extreme isolation of the intellectual top tier carries significant social and cultural costs.
Social class remains the vehicle of social life, but intelligence now pulls the train.
24
Introduction
bias when discussing differences in scores across ethnic groups, for ex-
ample. Second, we try to provide a level of detail that will satisfy dif-
ferent levels of technical curiosity through the use of boxed material
(you have already come across some examples), notes, and appendixes.
Because we expect (and fear) that many readers will go directly to chap-
ters that especially interest them rather than read the book from cover
to cover, we also insert periodic reminders about where discussion of
certain key topics may be found.
PART I
The Emergence of a
Cognitive Elite
The twentieth century dawned on a world segregated into social classes
defined in terms of money, power, and status. The ancient lines of sep-
aration based on hereditary rank were being erased, replaced by a more
complicated set of overlapping lines. Social standing still played a ma-
jor role, if less often accompanied by a sword or tiara, but so did out-
and-out wealth, educational credentials, and, increasingly, talent.
Our thesis is that the twentieth century has continued the transfor-
mation, so that the twenty-first will open on a world in which cogni-
tive ability is the decisive dividing force. The shift is more subtle than
the previous one but more momentous. Social class remains the vehi-
cle of social life, but intelligence now pulls the train.
Cognitive stratification takes different forms at the top and the bot-
tom of the scale of intelligence. Part I1 will look at the bottom. In Part
I, we look at the top. Its story line is that modern societies identify the
brightest youths with ever increasing efficiency and then guide them
into fairly narrow educational and occupational channels. These chan-
nels are increasingly lucrative and influential, leading to the develop-
ment of a distinct stratum in the social hierarchy, which we hereby dub
the Cognitive Elite. The isolation of the brightest from the rest of soci-
ety is already extreme; the forces driving it are growing stronger rather
than weaker. Governments can influence these forces but cannot neu-
tralize them.
This does not mean that a member of the cognitive elite never crosses
paths with a person with a low IQ, but the encounters that matter tend
to be limited. The more intimate or more enduring the human rela-
tionship is, the more likely it is to be among people similar in intellec-
tual level. That the brightest are identified has its benefits. That they
become so isolated and inbred has its costs. Some of these costs are al-
ready visible in American society, while others lie over the horizon.
2 5
26
The Emergence of a Cognitive Elite
27
Human society has always had some measure of cognitive stratifica-
tion. The best hunters among the Bushmen of the Kalahari tend to score
above the average of their tribe on modem intelligence tests and so,
doubtless, would have the chief ministers in Cheopls ~
~
~
~
t
.
'
The Man-
darins who ran China for centuries were chosen by examinations that
tested for understanding of the Confucian classics and, in so doing,
screened for intelligence. The priests and monks of medieval Europe,
recruited and self+selected for reasons correlated with cognitive ability,
must have been brighter than average.
This differentiation by cognitive ability did not coalesce into cogni-
tive classes in premodern societies for various reasons. Clerical celibacy
was one. Another was that the people who rose to the top on their brains
were co-opted by aristocratic systems that depleted their descendants'
talent, mainly through the mechanism known as primogeniture. Be-
cause parents could not pick the brightest of their progeny to inherit
the title and land, aristocracies fell victim to regression to the mean:
children of parents with above-average IQs tend to have lower IQs than
their parents, and their children's IQs are lower still. Over the course of
a few generations, the average intelligence in an aristocratic family fell
toward the population average, hastened by marriages that matched
bride and groom by lineage, not ability.
On the other hand, aristocratic societies were not as impermeable to
social mobility as they tried to be. They allowed at least some avenues
for ability to rise toward the top, whereupon the brains of the newcomer
were swapped in marriage for family connections and titles, England was
notably sagacious in this regard, steadily infusing new talent into the
aristocracy by creating peerages for its most successful commoners. The
traditional occupations for the younger sons of British peers-army,
navy, church, and the administration of the empire-gave
the ablest
younger sons in the aristocracy a good chance to rise to the top and help
sustain the system. Indeed, the success of some English families in sus-
taining their distinction over several generations was one of the factors
that prompted Francis Galton to hypothesize that intelligence was in-
herited. But only a minority of aristocratic families managed this trick.
It remained true even in England that, after a few generations, the
holder of any given aristocratic title was unlikely to be smarter than an?
one else. When one observer wrote of the aristocracy in Queen Victo-
ria's day that "all the social talk is stupid and insipid," he was being more
accurate than perhaps he realized,*
Even in less rigidly stratified societies, stratification by cognitive abil*
ity has been weak and inconsistent until this century because the num-
ber of very bright people was so much greater than the specialized jobs
for which high intelligence is indispensable. A true cognitive elite re-
quires a technological society. This raises a distinction that is so impor-
tant, and forgetting it can so easily lead to needless misunderstanding,
that it is worth emphasizing: To say that most of the people in the cogni-
tively demanding positions of a society have a high IQ is not the same as say-
ing that most of the people with high IQs are in such positions. It is possible
to have cognitive screening without having cognitive classes. Mathe-
matical necessity tells us that a large majority of the smart people in
Cheap's Egypt, dynastic China, Elizabethan England, and Teddy Roo*
sevelt's America were engaged in ordinary pursuits, mingling, working,
and living with everyone else. Many were housewives. Most of the rest
were farmers, smiths, millers, bakers, carpenters, and shopkeepers. So-
cial and economic stratification was extreme, but cognitive stratifica-
tion was minor.
So it has been from the beginning of history into this century, Then,
comparatively rapidly, a new class structure emerged in which it became
much more consistently and universally advantageous to be smart. In
the next four chapters, we examine that process and its meaning.
The Rise of Cognitive Stratification
- Historically, the British aristocracy maintained power by absorbing talented commoners and funneling younger sons into high-level military and administrative roles.
- Despite social hierarchies, cognitive stratification remained low in the past because most high-IQ individuals were scattered across ordinary occupations like farming and trade.
- A true cognitive elite only emerges in a technological society where high intelligence becomes an indispensable requirement for specialized, high-status jobs.
- The 20th century saw a massive democratization of education, yet this process created new, more intractable barriers based on cognitive ability rather than birth.
- The 1950s marked a turning point where elite colleges began aggressively sorting and concentrating the nation's brightest students into a distinct social class.
Mathematical necessity tells us that a large majority of the smart people in Cheops's Egypt, dynastic China, Elizabethan England, and Teddy Roosevelt's America were engaged in ordinary pursuits, mingling, working, and living with everyone else.
26
The Emergence of a Cognitive Elite
27
Human society has always had some measure of cognitive stratifica-
tion. The best hunters among the Bushmen of the Kalahari tend to score
above the average of their tribe on modem intelligence tests and so,
doubtless, would have the chief ministers in Cheopls ~
~
~
~
t
.
'
The Man-
darins who ran China for centuries were chosen by examinations that
tested for understanding of the Confucian classics and, in so doing,
screened for intelligence. The priests and monks of medieval Europe,
recruited and self+selected for reasons correlated with cognitive ability,
must have been brighter than average.
This differentiation by cognitive ability did not coalesce into cogni-
tive classes in premodern societies for various reasons. Clerical celibacy
was one. Another was that the people who rose to the top on their brains
were co-opted by aristocratic systems that depleted their descendants'
talent, mainly through the mechanism known as primogeniture. Be-
cause parents could not pick the brightest of their progeny to inherit
the title and land, aristocracies fell victim to regression to the mean:
children of parents with above-average IQs tend to have lower IQs than
their parents, and their children's IQs are lower still. Over the course of
a few generations, the average intelligence in an aristocratic family fell
toward the population average, hastened by marriages that matched
bride and groom by lineage, not ability.
On the other hand, aristocratic societies were not as impermeable to
social mobility as they tried to be. They allowed at least some avenues
for ability to rise toward the top, whereupon the brains of the newcomer
were swapped in marriage for family connections and titles, England was
notably sagacious in this regard, steadily infusing new talent into the
aristocracy by creating peerages for its most successful commoners. The
traditional occupations for the younger sons of British peers-army,
navy, church, and the administration of the empire-gave
the ablest
younger sons in the aristocracy a good chance to rise to the top and help
sustain the system. Indeed, the success of some English families in sus-
taining their distinction over several generations was one of the factors
that prompted Francis Galton to hypothesize that intelligence was in-
herited. But only a minority of aristocratic families managed this trick.
It remained true even in England that, after a few generations, the
holder of any given aristocratic title was unlikely to be smarter than an?
one else. When one observer wrote of the aristocracy in Queen Victo-
ria's day that "all the social talk is stupid and insipid," he was being more
accurate than perhaps he realized,*
Even in less rigidly stratified societies, stratification by cognitive abil*
ity has been weak and inconsistent until this century because the num-
ber of very bright people was so much greater than the specialized jobs
for which high intelligence is indispensable. A true cognitive elite re-
quires a technological society. This raises a distinction that is so impor-
tant, and forgetting it can so easily lead to needless misunderstanding,
that it is worth emphasizing: To say that most of the people in the cogni-
tively demanding positions of a society have a high IQ is not the same as say-
ing that most of the people with high IQs are in such positions. It is possible
to have cognitive screening without having cognitive classes. Mathe-
matical necessity tells us that a large majority of the smart people in
Cheap's Egypt, dynastic China, Elizabethan England, and Teddy Roo*
sevelt's America were engaged in ordinary pursuits, mingling, working,
and living with everyone else. Many were housewives. Most of the rest
were farmers, smiths, millers, bakers, carpenters, and shopkeepers. So-
cial and economic stratification was extreme, but cognitive stratifica-
tion was minor.
So it has been from the beginning of history into this century, Then,
comparatively rapidly, a new class structure emerged in which it became
much more consistently and universally advantageous to be smart. In
the next four chapters, we examine that process and its meaning.
Chapter 1
Cognitive Class and Education,
1900-1990
In the course of the twentieth century, America opened the doors of its col-
legs wider than any previous generation of Americans, or other society in his-
tory, could have imagined possible. This democratization of higher education
has raised new barriers between peopk that may prove to be more divisive and
intractable than the old ones.
The growth in the proportion of people getting college degrees is the most
obo~ious result, with a fifteen-fold increase from 1900 to 1990. Even more
important, the students going to college were being selected ever more effi-
ciently for their high IQ. The crucial decade was the 19.50~~
when the per-
centage of top stthnts who went to college rose by more than it had in the
preceding three decades. By the beginning of the 1990s' about 80 percent of
all students in the top quartile of ability continued to college after high school.
Among the high school graduates in the top few percentiles of cognitive abil-
ity, the chances of going to college already exceeded 90 percent.
Perhaps the most important of all the changes was the transformation of
America's elite colleges. As more bright youngsters went off to college, the col-
leges themseleles begun to sort themselves out. Startingin the 1950s, a hand.
ful of institutions became magnets for the very brightest of each year's new
class. In these schools, the cognitive level of the students rose far above the
rest of the college population.
Taken together, these trends have stratified America according to cognitive
ability.
A
perusal of Harvard's FreshmanRegister for 1952 shows a class look-
ing very much as Harvard freshman classes had always looked.
Under the photographs of the well-scrubbed, mostly East Coast, aver-
The Rise of Cognitive Stratification
- In the early 1950s, elite institutions like Harvard prioritized socioeconomic status and lineage over raw academic performance.
- By 1960, a rapid shift occurred where admission became significantly more competitive and based on standardized test scores.
- The average Harvard freshman from 1952 would have ranked in the bottom 10 percent of the 1960 incoming class.
- This transition moved the university from a regional school for the wealthy to a national hub for the 'brightest of the bright.'
- While expanding access is a success story, it created a new social divide based on cognitive ability rather than just family background.
- Education acts as a powerful classifier that sorts the population by income, occupation, and social tastes.
The average Harvard freshman in 1952 would have placed in the bottom 10 percent of the incoming class by 1960.
Chapter 1
Cognitive Class and Education,
1900-1990
In the course of the twentieth century, America opened the doors of its col-
legs wider than any previous generation of Americans, or other society in his-
tory, could have imagined possible. This democratization of higher education
has raised new barriers between peopk that may prove to be more divisive and
intractable than the old ones.
The growth in the proportion of people getting college degrees is the most
obo~ious result, with a fifteen-fold increase from 1900 to 1990. Even more
important, the students going to college were being selected ever more effi-
ciently for their high IQ. The crucial decade was the 19.50~~
when the per-
centage of top stthnts who went to college rose by more than it had in the
preceding three decades. By the beginning of the 1990s' about 80 percent of
all students in the top quartile of ability continued to college after high school.
Among the high school graduates in the top few percentiles of cognitive abil-
ity, the chances of going to college already exceeded 90 percent.
Perhaps the most important of all the changes was the transformation of
America's elite colleges. As more bright youngsters went off to college, the col-
leges themseleles begun to sort themselves out. Startingin the 1950s, a hand.
ful of institutions became magnets for the very brightest of each year's new
class. In these schools, the cognitive level of the students rose far above the
rest of the college population.
Taken together, these trends have stratified America according to cognitive
ability.
A
perusal of Harvard's FreshmanRegister for 1952 shows a class look-
ing very much as Harvard freshman classes had always looked.
Under the photographs of the well-scrubbed, mostly East Coast, aver-
30
The Emergence ofa Cognitive Elite
Cognitive Class and Education, 1900-1 990
3 1
whelmingl~ white andChristian young men were home addresses from
places like Philadelphia's Main Line, the Upper East Side of New York,
and Boston's Beacon Hill. A large proportion of the class came from a
handful of America's most exclusive boarding schools; Phillips Exeter
and Phillips Andover alone contributed almost 10 percent of the fresh-
men that year.
And yet for all its apparent exclusivity, Harvard was not so hard to
get into in the fall of 1952. An applicant's chances of being admitted
were about two out of three, and close to 90 percent if his father had
gone to ~arvard.' With this modest level of competition, it is not sur-
prising to learn that the Harvard student body was not uniformly bril-
liant. In fact, the mean SATVerbal score of the incoming freshmen class
was only 583, well above the national mean but nothing to brag about.'*]
Harvard men came from a range of ability that could be duplicated in
the top half of many state universities.
Let us advance the scene to 1960. Wilbur J. Bender, Harvard's dean
of admissions, was about to leave his post and trying to sum up for the
board of overseers what had happened in the eight years of his tenure.
"The figures," he wrote, "report the greatest change in Harvard admis-
sions, and thus in the Harvard student body, in a short time-two
col-
lege generations-in
our recorded hi~tory."~
Unquestionably, suddenly,
but for no obvious reason, Harvard had become a different kind of place.
The proportion of the incoming students from New England had
dropped by a third. Public school graduates now outnumbered private
school graduates. Instead of rejecting a third of its applicants, Harvard
was rejecting more than two-thirds-and
the quality of those applicants
had increased as well, so that many students who would have been ad-
mitted in 1952 were not even bothering to apply in 1960,
The SAT scores at Harvard had skyrocketed. In the fall of 1960, the
average verbaI score was 678 and the average math score was 695, an
increase of almost a hundred points for each test. The average Harvard
freshman in 1952 would have placed in the bottom 10 percent of the
incoming class by 1960. In eight years, Harvard had been transformed
from a school primarily for the northeastern socioeconomic elite into a
school populated by the brightest of the bright, drawn from all over the
country.
The story of higher education in the United States during the twenti-
eth century is generally raken to be one of the great American success
stories, and with good reason. The record was not without blemishes,
but the United States led the rest of the world in opening college to a
mass population of young people of ability, regardless of race, color,
creed, gender, and financial resources.
But this success story also has a paradoxically shadowy side, for edu-
cation is a powerful divider and classifier. Education affects income, and
income divides. Education affects occupation, and occupations divide.
Education affects tastes and interests, grammar and accent, all of which
divide. When access to higher education is restricted by class, race, or
religion, these divisions cut across cognitive levels. But school is in it-
self, more immediately and directly than any other institution, the place
where people of high cognitive ability excel and people of low cogni.
tive ability fail. As America opened access to higher education, it
opened up as well a revolution in the way that the American popula-
tion sorted itself and divided itself. Three successively more efficient
sorting processes were at work: the college population grew, it was re-
cruited by cognitive ability more efficiently, and then it was further
sorted among the colleges.
THE COLLEGE POPULATION GROWS
A social and economic gap separated high school graduates from col-
lege graduates in 1900 as in 1990; that much is not new. But the social
and economic gap was not accompanied by much of a cognitive gap, bed
cause the vast majority of the brightest people in the United States had
not gone to college. We may make that statement despite the lack of
IQ scores from 1900 for the same reason that we can make such state.
ments about Elizabethan England: It is true by mathematical necessity.
In 1900, only about 2 percent of 23.year-olds got college degrees. Even
if all of the 2 percent who went to college had IQs of 115 and above
(and they did not), seven out of eight of the brightest 23-year-olds in
the America of 1900 would have been without college degrees. This sit.
uation harely changed for the first two decades of the new century. Then,
at the close of World War I, the role of college for American youths be-
gan an expansion that would last until 1974, interrupted only by the
Great Depression and World War 11.
The three lines in the figure show trends established in 1920-1929,
1935-1940, and 1954-1973, then extrapolated. They are there to high.
The Rise of Cognitive Sorting
- In 1900, a college degree was rare, held by only 2 percent of 23-year-olds, meaning the vast majority of the nation's brightest individuals were not college-educated.
- The growth of the college population was not a sudden post-WWII phenomenon but a steady trend established as early as the 1920s.
- Between 1900 and 1990, the prevalence of college degrees shifted from one in fifty people to nearly a third of the population.
- A significant upward tilt in degree attainment began in the mid-1950s and continued through the early 1970s, regardless of the political or social climate.
- The 1970s saw a counterintuitive decline in graduates despite high financial aid, followed by a sharp rise in the 1980s despite increasing costs.
- This expansion of higher education acted as a mechanism for more efficiently sorting the population based on cognitive ability.
In 1900, only about 2 percent of 23-year-olds got college degrees. Even if all of the 2 percent who went to college had IQs of 115 and above (and they did not), seven out of eight of the brightest 23-year-olds in the America of 1900 would have been without college degrees.
30
The Emergence ofa Cognitive Elite
Cognitive Class and Education, 1900-1 990
3 1
whelmingl~ white andChristian young men were home addresses from
places like Philadelphia's Main Line, the Upper East Side of New York,
and Boston's Beacon Hill. A large proportion of the class came from a
handful of America's most exclusive boarding schools; Phillips Exeter
and Phillips Andover alone contributed almost 10 percent of the fresh-
men that year.
And yet for all its apparent exclusivity, Harvard was not so hard to
get into in the fall of 1952. An applicant's chances of being admitted
were about two out of three, and close to 90 percent if his father had
gone to ~arvard.' With this modest level of competition, it is not sur-
prising to learn that the Harvard student body was not uniformly bril-
liant. In fact, the mean SATVerbal score of the incoming freshmen class
was only 583, well above the national mean but nothing to brag about.'*]
Harvard men came from a range of ability that could be duplicated in
the top half of many state universities.
Let us advance the scene to 1960. Wilbur J. Bender, Harvard's dean
of admissions, was about to leave his post and trying to sum up for the
board of overseers what had happened in the eight years of his tenure.
"The figures," he wrote, "report the greatest change in Harvard admis-
sions, and thus in the Harvard student body, in a short time-two
col-
lege generations-in
our recorded hi~tory."~
Unquestionably, suddenly,
but for no obvious reason, Harvard had become a different kind of place.
The proportion of the incoming students from New England had
dropped by a third. Public school graduates now outnumbered private
school graduates. Instead of rejecting a third of its applicants, Harvard
was rejecting more than two-thirds-and
the quality of those applicants
had increased as well, so that many students who would have been ad-
mitted in 1952 were not even bothering to apply in 1960,
The SAT scores at Harvard had skyrocketed. In the fall of 1960, the
average verbaI score was 678 and the average math score was 695, an
increase of almost a hundred points for each test. The average Harvard
freshman in 1952 would have placed in the bottom 10 percent of the
incoming class by 1960. In eight years, Harvard had been transformed
from a school primarily for the northeastern socioeconomic elite into a
school populated by the brightest of the bright, drawn from all over the
country.
The story of higher education in the United States during the twenti-
eth century is generally raken to be one of the great American success
stories, and with good reason. The record was not without blemishes,
but the United States led the rest of the world in opening college to a
mass population of young people of ability, regardless of race, color,
creed, gender, and financial resources.
But this success story also has a paradoxically shadowy side, for edu-
cation is a powerful divider and classifier. Education affects income, and
income divides. Education affects occupation, and occupations divide.
Education affects tastes and interests, grammar and accent, all of which
divide. When access to higher education is restricted by class, race, or
religion, these divisions cut across cognitive levels. But school is in it-
self, more immediately and directly than any other institution, the place
where people of high cognitive ability excel and people of low cogni.
tive ability fail. As America opened access to higher education, it
opened up as well a revolution in the way that the American popula-
tion sorted itself and divided itself. Three successively more efficient
sorting processes were at work: the college population grew, it was re-
cruited by cognitive ability more efficiently, and then it was further
sorted among the colleges.
THE COLLEGE POPULATION GROWS
A social and economic gap separated high school graduates from col-
lege graduates in 1900 as in 1990; that much is not new. But the social
and economic gap was not accompanied by much of a cognitive gap, bed
cause the vast majority of the brightest people in the United States had
not gone to college. We may make that statement despite the lack of
IQ scores from 1900 for the same reason that we can make such state.
ments about Elizabethan England: It is true by mathematical necessity.
In 1900, only about 2 percent of 23.year-olds got college degrees. Even
if all of the 2 percent who went to college had IQs of 115 and above
(and they did not), seven out of eight of the brightest 23-year-olds in
the America of 1900 would have been without college degrees. This sit.
uation harely changed for the first two decades of the new century. Then,
at the close of World War I, the role of college for American youths be-
gan an expansion that would last until 1974, interrupted only by the
Great Depression and World War 11.
The three lines in the figure show trends established in 1920-1929,
1935-1940, and 1954-1973, then extrapolated. They are there to high.
32
The Emergence of a Cognitive Elite
Cognitive Class and Education, 1900-1 990
33
In the twentieth century, the re valence of the college
degree goes from one in fifty to a third of the population
New bachelor's degrees as a percentage of 23-year-olds
/' ... 1954-73
Trendlines established in ...
P
r
Sortrces: 1900-1959: U.S. Bureau of the Censi~s 1975, H751-765. 1960-1992: DES, 1992,
Table 229.
light the three features of the figure worth noting. First, the long per-
spective serves as a counterweight to the common belief that the col-
lege population exploded suddenly after World War 11. It certainly
exploded in the sense that the number of college students went from a
wartime trough to record highs, but this is because two generations of
college students were crowded onto campuses at one time. In terms of
trendlines, World War I1 and its aftermath was a blip, albeit a large blip.
When this anomalous turmoil ended in the mid- 1950s, the proportion
of people getting college degrees was no higher than would have been
predicted from the trends esrablished in the 1920s or the last half of the
1930s (which are actually a single trend interrupted by the worst years
of the depression).
The second notable feature of the figure is the large upward tilt in
the trendline from the mid-1950s until 1974. That it began when it
did-the
Eisenhower years--comes as a surprise, The GI bill's impact
had faded and the postwar baby boom had not yet reached college age.
Presumably postwar prosperity had something to do with it, but the ex-
planation cannot be simple, The slope remained steep in periods as dif-
ferent as Eisenhower's late 1950s, LBJ's mid.l960s, and Nixon's early
1970s.
After 1974 came a peculiar plunge in college degrees that lasted un-
til 1981-peculiar
because it occurred when the generosity of scholar-
ships and loans, from colleges, foundations, and government alike, was
at its peak. This period of declining graduates was then followed by a
steep increase from 1981 to 1990-also
peculiar, in that college was be-
coming harder to afford for middle-class Americans during those years.
As of 1990, the proportion of students getting college degrees had more
than made up for the losses during the 1970s and had established a new
record, with B.A.s and B.S.s being awarded in such profusion that they
amounted to 30 percent of the 23-year-old population.
MAKING GOOD ON THE IDEAL OF OPPORTUNITY
At first glance, we are telling a story of increasing democracy and in*
termingling, not of stratification. Once upon a time, the college degree
was the preserve of a tiny minority; now almost a third of each new co.
hort of youths earns it. Surely, it would seem, this must mean that a
broader range of people is going to college-including
people with a
broader, not narrower, range of cognitive ability. Not so. At the same
time that many more young people were going to college, they were also
being selected ever more efficiently by cognitive ability.
A compilation of the studies conducted over the course of the cen-
tury suggests that the crucial decade was the 1950s. The next figure
shows the data for the students in the top quartile (the top 25 percent)
in ability and is based on the proportion of students entering college
(though not necessarily finishing) in the year following graduation from
high school.
Again, the lines highlight trends set in particular periods, here
1925-1950 and 1950-1960. From one period to the next, the propor-
tion of bright students getting to college leaped to new heights. There
are two qualifications regarding this figure. First, it is based on high
school graduates-the
only data available over this time period-and
therefore drastically understates the magnitude of the real change from
the 1920s to the 1960s and thereafter, because so many of the top quar-
tile in ability never made it through high school early in the century
(see Chapter 6). It is impossible to be more precise with the available
data, but a reasonable estimate is that as of the mid.1920~~
only about
15 percent of all of the nation's youth in the top IQ quartile were going
on to college.[41 It is further the case that almost all of those moving on
The Rise of Cognitive Sorting
- While college attendance expanded to a third of the youth population, it did not result in a broader range of cognitive ability among students.
- The 1950s marked a pivotal decade where the American education system became significantly more efficient at funneling high-IQ students into college.
- In the 1920s, only about 15 percent of the nation's top IQ quartile attended college, a figure that rose to over 50 percent by the 1960s.
- The correlation between cognitive ability and the probability of attending college has become increasingly tight and regular over the last seventy years.
- Early in the century, high cognitive ability only marginally improved one's chances of attending college compared to the rigid 'pegging' of IQ to education seen today.
At mid-century America abruptly becomes more efficient in getting the top students to college.
32
The Emergence of a Cognitive Elite
Cognitive Class and Education, 1900-1 990
33
In the twentieth century, the re valence of the college
degree goes from one in fifty to a third of the population
New bachelor's degrees as a percentage of 23-year-olds
/' ... 1954-73
Trendlines established in ...
P
r
Sortrces: 1900-1959: U.S. Bureau of the Censi~s 1975, H751-765. 1960-1992: DES, 1992,
Table 229.
light the three features of the figure worth noting. First, the long per-
spective serves as a counterweight to the common belief that the col-
lege population exploded suddenly after World War 11. It certainly
exploded in the sense that the number of college students went from a
wartime trough to record highs, but this is because two generations of
college students were crowded onto campuses at one time. In terms of
trendlines, World War I1 and its aftermath was a blip, albeit a large blip.
When this anomalous turmoil ended in the mid- 1950s, the proportion
of people getting college degrees was no higher than would have been
predicted from the trends esrablished in the 1920s or the last half of the
1930s (which are actually a single trend interrupted by the worst years
of the depression).
The second notable feature of the figure is the large upward tilt in
the trendline from the mid-1950s until 1974. That it began when it
did-the
Eisenhower years--comes as a surprise, The GI bill's impact
had faded and the postwar baby boom had not yet reached college age.
Presumably postwar prosperity had something to do with it, but the ex-
planation cannot be simple, The slope remained steep in periods as dif-
ferent as Eisenhower's late 1950s, LBJ's mid.l960s, and Nixon's early
1970s.
After 1974 came a peculiar plunge in college degrees that lasted un-
til 1981-peculiar
because it occurred when the generosity of scholar-
ships and loans, from colleges, foundations, and government alike, was
at its peak. This period of declining graduates was then followed by a
steep increase from 1981 to 1990-also
peculiar, in that college was be-
coming harder to afford for middle-class Americans during those years.
As of 1990, the proportion of students getting college degrees had more
than made up for the losses during the 1970s and had established a new
record, with B.A.s and B.S.s being awarded in such profusion that they
amounted to 30 percent of the 23-year-old population.
MAKING GOOD ON THE IDEAL OF OPPORTUNITY
At first glance, we are telling a story of increasing democracy and in*
termingling, not of stratification. Once upon a time, the college degree
was the preserve of a tiny minority; now almost a third of each new co.
hort of youths earns it. Surely, it would seem, this must mean that a
broader range of people is going to college-including
people with a
broader, not narrower, range of cognitive ability. Not so. At the same
time that many more young people were going to college, they were also
being selected ever more efficiently by cognitive ability.
A compilation of the studies conducted over the course of the cen-
tury suggests that the crucial decade was the 1950s. The next figure
shows the data for the students in the top quartile (the top 25 percent)
in ability and is based on the proportion of students entering college
(though not necessarily finishing) in the year following graduation from
high school.
Again, the lines highlight trends set in particular periods, here
1925-1950 and 1950-1960. From one period to the next, the propor-
tion of bright students getting to college leaped to new heights. There
are two qualifications regarding this figure. First, it is based on high
school graduates-the
only data available over this time period-and
therefore drastically understates the magnitude of the real change from
the 1920s to the 1960s and thereafter, because so many of the top quar-
tile in ability never made it through high school early in the century
(see Chapter 6). It is impossible to be more precise with the available
data, but a reasonable estimate is that as of the mid.1920~~
only about
15 percent of all of the nation's youth in the top IQ quartile were going
on to college.[41 It is further the case that almost all of those moving on
34
The Emergence of a Cognitive Elite
Cognitive Class and Education, 1900-1 990
35
At mid-century America abruptly becomes more efficient in
getting the top students to college
High school graduates in the top IQ
quartile who went directly to college
65% - : Trendlines established in ...
60% 1
P'
. ... 1925-50 . /
55% : -.--
"-.------
'
-
Sources: Eagle 1988b; Taubman and Wales 1972; authors' analysis of the National Longiru-
dinal Survey of Youth (NLSY). See below and the introduction to Part 11.
to college in the 1920s were going to four- ear colleges, and this leads
to the second qualification to keep in mind: By the 1970s and 1980s,
substantial numbers of those shown as continuing to college were going
to a junior college, which are on average less demanding than four-year
colleges. Interpreting all the available data, it appears that the propor-
tion of all American youth in the top IQ cluartile who went directly to
four+year colleges rose from roughly one youth in seven in 1925 to about
two out of seven in 1950 to more than four out of seven in the early
1960s, where it has remained, with perhaps a shallow upward trend, ever
since.IS1
But it is not just that the top quartile of talent has been more effi-
ciently tapped for college. At every level of cognitive ability, the links
between IQ and the probability of going to college became tighter and
more regular. The next figure summarizes three studies that permit us to
calculate the probability of going to college throughout the ability range
over the last seventy years. Once again we are restricted to high school
Between the 1920s and the 1960s, college attendance
becomes much more closely pegged to IQ
High school graduates going directly to college
100%-
fl
0%
I
I
I
I
I
I
I
I
I
I
0
10
20
30
40
50
60
70
80
90
100
IQ
Percentile
Source: Tauhman and Wales 1972, Figures 3, 4; and authors' analysis of NLSY students who
graduated from high school in 1980-1982.
graduates for the 1925 data, which overstates the probability of going
to college during this period. Even for the fortunate few who got a high
school degree in 1925, high cognitive ability improved their chances of
getting to college-but
not by much.i61 The brightest high school grad-
uates had altnost a 60 percent chance of going to college, which means
that they had more than a 40 percent chance of not going, despite hav-
ing graduated from high school and being very bright. The chances of
college for someone merely in the 80th percentile in ability were no
greater than classmates who were at the 50th percentile, and only
slightly greater than classmates in the bottom third of the class.
Between the 1920s and the 1960s, the largest change in the proba-
bility of going to college was at the top of the cognitive ability distri-
bution. By 1960, a student who was really smart-at
or near the 100th
percentile in IQ-had
a chance of going to college of nearly 100 per-
cent,17] Furthermore, as the figure shows, going to college had gotten
more dependent on intelligence at the bottom of the distribution, too.'
A student at the 30th percentile had only about a 25 percent chance of
The Rise of Cognitive Sorting
- Between the 1920s and 1960s, the probability of attending college became increasingly tied to cognitive ability rather than just high school graduation.
- By 1960, students at the top of the IQ distribution had a nearly 100 percent chance of attending college, a significant shift from earlier decades.
- Data from the early 1980s shows that despite educational upheavals, the correlation between intelligence and college attendance remained remarkably stable.
- The college system acts as a 'weeding' mechanism, where students with lower test scores may enter college but rarely complete a bachelor's degree.
- While 20 percent of students in the second decile of ability entered college in the 1980s, fewer than 2 percent actually graduated with a B.A.
- This educational partitioning has effectively created a 'cognitive elite' by ensuring the most able youths are concentrated within the ranks of college graduates.
The line for students completing the B.A. shows an even more efficient sorting process.
34
The Emergence of a Cognitive Elite
Cognitive Class and Education, 1900-1 990
35
At mid-century America abruptly becomes more efficient in
getting the top students to college
High school graduates in the top IQ
quartile who went directly to college
65% - : Trendlines established in ...
60% 1
P'
. ... 1925-50 . /
55% : -.--
"-.------
'
-
Sources: Eagle 1988b; Taubman and Wales 1972; authors' analysis of the National Longiru-
dinal Survey of Youth (NLSY). See below and the introduction to Part 11.
to college in the 1920s were going to four- ear colleges, and this leads
to the second qualification to keep in mind: By the 1970s and 1980s,
substantial numbers of those shown as continuing to college were going
to a junior college, which are on average less demanding than four-year
colleges. Interpreting all the available data, it appears that the propor-
tion of all American youth in the top IQ cluartile who went directly to
four+year colleges rose from roughly one youth in seven in 1925 to about
two out of seven in 1950 to more than four out of seven in the early
1960s, where it has remained, with perhaps a shallow upward trend, ever
since.IS1
But it is not just that the top quartile of talent has been more effi-
ciently tapped for college. At every level of cognitive ability, the links
between IQ and the probability of going to college became tighter and
more regular. The next figure summarizes three studies that permit us to
calculate the probability of going to college throughout the ability range
over the last seventy years. Once again we are restricted to high school
Between the 1920s and the 1960s, college attendance
becomes much more closely pegged to IQ
High school graduates going directly to college
100%-
fl
0%
I
I
I
I
I
I
I
I
I
I
0
10
20
30
40
50
60
70
80
90
100
IQ
Percentile
Source: Tauhman and Wales 1972, Figures 3, 4; and authors' analysis of NLSY students who
graduated from high school in 1980-1982.
graduates for the 1925 data, which overstates the probability of going
to college during this period. Even for the fortunate few who got a high
school degree in 1925, high cognitive ability improved their chances of
getting to college-but
not by much.i61 The brightest high school grad-
uates had altnost a 60 percent chance of going to college, which means
that they had more than a 40 percent chance of not going, despite hav-
ing graduated from high school and being very bright. The chances of
college for someone merely in the 80th percentile in ability were no
greater than classmates who were at the 50th percentile, and only
slightly greater than classmates in the bottom third of the class.
Between the 1920s and the 1960s, the largest change in the proba-
bility of going to college was at the top of the cognitive ability distri-
bution. By 1960, a student who was really smart-at
or near the 100th
percentile in IQ-had
a chance of going to college of nearly 100 per-
cent,17] Furthermore, as the figure shows, going to college had gotten
more dependent on intelligence at the bottom of the distribution, too.'
A student at the 30th percentile had only about a 25 percent chance of
36
The Emergence of a Cognitive Elite
Cognitive Class and Education, 1900-1 990
37
going to college-lower
than it had been for high school graduates in
the 1920s. But a student in the 80th percentile had a 70 percent chance
of going to college, well above the proportion in the 1920s.
The line for the early 1980s is based on students who graduated from
high school between 1980 and 1982. The data are taken from the Na-
tional Longitudinal Survey of Youth (NLSY), which will figure promi-
nently in the chapters ahead. Briefly, the NLSY is a very large (originally
12,686 persons), nationally representative sample of American youths
who were aged 14 to 22 in 1979, when the study began, and have been
followed ever since. (The NLSY is discussed more fully in the intro-
duction to Part 11.) The curve is virtually identical to that from the early
1960s, which is in itself a finding of some significance in the light of the
many upheavals that occurred in American education in the 1960s and
1970s.
Didn't Equal Opportunity in Higher Education Really Open Up
During the 1960sl
The conventional wisdom holds that the revolution in higher education
occurred in the last half of the 1960s, as part of the changes of the Great
Society, especially its affirmative action policies. We note here that the
proportion of youths going to college rose about as steeply in the 1950s as
in the 1960s, as shown in the opening figure in this chapter and the ace
a Irma-
companying discussion. Chapter 19 considers the role played by ff'
tive action in the changing college population of recent decades.
Meanwhile, the sorting process continued in college. College weeds
out many students, disproportionately the least able. The figure below
shows the situation as of the 1980s.' The line for students entering col-
lege reproduces the one shown in the preceding figure. The line for stu-
dents completing the B.A. shows an even more efficient sorting process,
A high proportion of people with poor test scores-more
than 20 per+
cent of those in the second decile (between the 10th and 20th centile),
for example-entered
a two- or four.year college. But fewer than 2 per+
cent of them actually completed a bachelor's degree. Meanwhile, about
70 percent of the students in the top decile of ability were completing
a B.A.
Cognitive sorting continues from the time that students
enter college to the time they get a degree
Percentage of college students
90% -
/
50% -
Students entering college
'
/I
.<-'
40% -
/ i.
30% -
0
0
*' ,.-"\
20% -
0
a*--+
..
Students completing the B.A.
-
.'
O%, - .,
I
I
I
I
I
I
I
I
I
0
10
20
30
40
50
60
70
80
90
100
IQ
Percentile
So a variety of forces have combined to ensure that a high propor-
tion of the nation's most able youths got into the category of college
graduates. But the process of defining a cognitive elite through educa-
tion is not complete. The socially most significant part of the parti-
tioning remains to be described. In the 19.50~~
American higher
education underwent a revolution in the way that sorted the college
population itself.
THE CREATION OF A COGNITIVE ELITE WITHIN THE
COLLEGE SYSTEM
The experience of Harvard with which we began this discussion is a
parable for the experience of the nation's university system, Insofar as
many more people now go to college, the college degree has become
more democratic during the twentieth century. But as it became demo*
cratic, a new elite was developing even more rapidly within the system.
From the early 1950s into the mid-1960s, the nation's university system
not only became more efficient in bringing the bright youngsters to col-
The Rise of Cognitive Sorting
- While college degrees became more democratic and accessible in the 20th century, a new internal hierarchy emerged based on cognitive ability.
- Between the 1950s and 1960s, the university system became radically more efficient at concentrating the 'brightest of the bright' into a few elite institutions.
- Prior to World War II, elite schools like the Ivy League hosted a mix of brilliant, mediocre, and average students rather than a concentrated cognitive elite.
- In the 1920s, high-IQ students from rural or non-elite backgrounds typically attended local state universities or religious colleges rather than national elite schools.
- Historical SAT and IQ data from 1926 show that the average student at a prestigious Ivy League school was only at the 88th percentile of the general population.
- The data suggests that early 20th-century elite colleges tapped only a small fragment of the nation's total cognitive talent pool.
The valedictorian in Kalamazoo and the Kansas farm girl with an IQ of 140 might not even be going to college at all.
36
The Emergence of a Cognitive Elite
Cognitive Class and Education, 1900-1 990
37
going to college-lower
than it had been for high school graduates in
the 1920s. But a student in the 80th percentile had a 70 percent chance
of going to college, well above the proportion in the 1920s.
The line for the early 1980s is based on students who graduated from
high school between 1980 and 1982. The data are taken from the Na-
tional Longitudinal Survey of Youth (NLSY), which will figure promi-
nently in the chapters ahead. Briefly, the NLSY is a very large (originally
12,686 persons), nationally representative sample of American youths
who were aged 14 to 22 in 1979, when the study began, and have been
followed ever since. (The NLSY is discussed more fully in the intro-
duction to Part 11.) The curve is virtually identical to that from the early
1960s, which is in itself a finding of some significance in the light of the
many upheavals that occurred in American education in the 1960s and
1970s.
Didn't Equal Opportunity in Higher Education Really Open Up
During the 1960sl
The conventional wisdom holds that the revolution in higher education
occurred in the last half of the 1960s, as part of the changes of the Great
Society, especially its affirmative action policies. We note here that the
proportion of youths going to college rose about as steeply in the 1950s as
in the 1960s, as shown in the opening figure in this chapter and the ace
a Irma-
companying discussion. Chapter 19 considers the role played by ff'
tive action in the changing college population of recent decades.
Meanwhile, the sorting process continued in college. College weeds
out many students, disproportionately the least able. The figure below
shows the situation as of the 1980s.' The line for students entering col-
lege reproduces the one shown in the preceding figure. The line for stu-
dents completing the B.A. shows an even more efficient sorting process,
A high proportion of people with poor test scores-more
than 20 per+
cent of those in the second decile (between the 10th and 20th centile),
for example-entered
a two- or four.year college. But fewer than 2 per+
cent of them actually completed a bachelor's degree. Meanwhile, about
70 percent of the students in the top decile of ability were completing
a B.A.
Cognitive sorting continues from the time that students
enter college to the time they get a degree
Percentage of college students
90% -
/
50% -
Students entering college
'
/I
.<-'
40% -
/ i.
30% -
0
0
*' ,.-"\
20% -
0
a*--+
..
Students completing the B.A.
-
.'
O%, - .,
I
I
I
I
I
I
I
I
I
0
10
20
30
40
50
60
70
80
90
100
IQ
Percentile
So a variety of forces have combined to ensure that a high propor-
tion of the nation's most able youths got into the category of college
graduates. But the process of defining a cognitive elite through educa-
tion is not complete. The socially most significant part of the parti-
tioning remains to be described. In the 19.50~~
American higher
education underwent a revolution in the way that sorted the college
population itself.
THE CREATION OF A COGNITIVE ELITE WITHIN THE
COLLEGE SYSTEM
The experience of Harvard with which we began this discussion is a
parable for the experience of the nation's university system, Insofar as
many more people now go to college, the college degree has become
more democratic during the twentieth century. But as it became demo*
cratic, a new elite was developing even more rapidly within the system.
From the early 1950s into the mid-1960s, the nation's university system
not only became more efficient in bringing the bright youngsters to col-
38
The Emergence of a Cognitive Elite
Cognitive Class and Education, 1900-1990
39
lege, it became radically more efficient at sorting the brightest of the
bright into a handful of elite colleges.
The Case of Ivy League and the State of Pennsybania: The 1920s
Versus the 1960s
Prior to World War 11, America had a stratum of elite colleges just as it
has now, with the Ivy League being the best known. Then as now, these
schools attracted the most celebrated faculty, had the best libraries, and
sent their graduates on to the best graduate schools and to prestigious
jobs. Of these elite schools, Harvard was among the most famous and
the most selective. But what was true of Harvard then was true of the
other elite schools. They all had a thin layer of the very brightest among
their students but also many students who were merely bright and a fair
number of students who were mediocre. They tapped only a fragment
of the cognitive talent in the country. The valedictorian in Kalamazoo
and the Kansas farm girl with an IQ of 140 might not even be going to
college at all. If they did, they probably went to the nearest state uni-
versity or to a private college affiliated with their church.
One of the rare windows on this period is provided by two little-
known sources of test score data. The first involves the earliest SATs,
which were first administered in 1926. As part of that effort, a stan-
dardized intelligence test was also completed by 1,080 of the SAT suh-
jects. In its first annual report, a Commission appointed by the College
Entrance Examination Board provided a table for converting the SAT
of that era to IQ s~ores."~'
Combining that information with reports of
the mean SAT scores for entrants to schools using the SAT, we are able
to approximate the mean lQs of the entering students to the Ivy League
and the Seven Sisters, the most prestigious schools in the country at
that time.["'
Judging from this information, the entering classes of these schools
in 1926 had a mean IQ of about 1 17, which places the average student
at the most selective schools in the country at about the 88th percentile
of all the nation's youths and barely above the 115 level that has often
been considered the basic demarcation point for prime college tnate-
rial.
In the same year as these SAT data were collected, the Carnegie
Foundation began an ambitious statewide study of high school seniors
and their college experience in the entire state of Pennsylvania.12 By
happy coincidence, the investigators used the same form of the Otis In-
telligence Test used by the SAT Commission. Among other tests, they
reported means for the sophomore classes at all the colleges and uni.
versities in Pennsylvania in 1928, Pennsylvania was (then as now) a
large state with a wide variety of public and private schools, small and
large, prestigious and pedestrian. The IQ equivalent of the average of
all Pennsylvania colleges was 107, which put the average Pennsylvania
student at the 68th percentile, considerably below the average of the
elite schools. But ten Pennsylvania colleges had freshman classes with
mean IQs that put them at the 75th to 90 percentiles.[131 In other words,
students going to any of several Pennsylvania colleges were, on average,
virtually indistinguishable in cognitive ability from the students in the
Ivy League and the Seven Sisters.
Now let us jump to 1964, the first year for which SAT data for a large
number of Pennsylvania colleges are available. We repeat the exercise,
this time using the SAT-Verbal test as the basis for analysis.[141
Two im-
portant changes had occurred since 1928. The average freshman in a
Pennsylvania college in 1964 was much smarter than the average Penn.
sylvania freshman in 1928-at
about the 89th percentile. At the same
time, however, the elite colleges, using the same fourteen schools rep-
resented in the 1928 data, had moved much further out toward the edge,
now boasting an average freshman who was at the 99th percentile of
the nation's youth.
Cognitive Stratification Throughout the College System by the 1960s
The same process occurred around the country, as the figure below
shows. We picked out colleges with freshman SAT+Verbal means that
were separated by roughly fiftypoint intervals as of 1961.'"' The spe-
cific schools named are representative of those clustering near each
break point. At the bottom is a state college in the second echelon of a
state system (represented by Georgia Southern); then comes a large state
university (North Carolina State), then five successively more selective
private schools: Villanova, Tulane, Colby, Amherst, and Harvard. We
have placed the SAT scores against the backdrop of the overall distri-
bution of SAT scores for the entire population of high school seniors
(not just those who ordinarily take the SAT), using a special study that
the College Board conducted in the fall of 1960. The figure points to
the general phenomenon already noted for Harvard: By 1961, a large
The Rise of Cognitive Stratification
- Between 1928 and 1964, the average intelligence of college freshmen rose significantly, but elite institutions pulled away from the rest of the system.
- By the early 1960s, a massive cognitive gap had formed between elite private schools and large state universities.
- This shift toward cognitive stratification was highly concentrated, occurring rapidly during the 1950s.
- Economic democratization was not the driver of this change, as the cost of attending elite schools like Harvard rose 40 percent during the decade.
- The concentration of high-ability students at elite schools happened despite faculty concerns about admitting students solely based on test scores.
What led the nation's most able college age youth (and their parents) to begin deciding so abruptly that State U. was no longer good enough?
38
The Emergence of a Cognitive Elite
Cognitive Class and Education, 1900-1990
39
lege, it became radically more efficient at sorting the brightest of the
bright into a handful of elite colleges.
The Case of Ivy League and the State of Pennsybania: The 1920s
Versus the 1960s
Prior to World War 11, America had a stratum of elite colleges just as it
has now, with the Ivy League being the best known. Then as now, these
schools attracted the most celebrated faculty, had the best libraries, and
sent their graduates on to the best graduate schools and to prestigious
jobs. Of these elite schools, Harvard was among the most famous and
the most selective. But what was true of Harvard then was true of the
other elite schools. They all had a thin layer of the very brightest among
their students but also many students who were merely bright and a fair
number of students who were mediocre. They tapped only a fragment
of the cognitive talent in the country. The valedictorian in Kalamazoo
and the Kansas farm girl with an IQ of 140 might not even be going to
college at all. If they did, they probably went to the nearest state uni-
versity or to a private college affiliated with their church.
One of the rare windows on this period is provided by two little-
known sources of test score data. The first involves the earliest SATs,
which were first administered in 1926. As part of that effort, a stan-
dardized intelligence test was also completed by 1,080 of the SAT suh-
jects. In its first annual report, a Commission appointed by the College
Entrance Examination Board provided a table for converting the SAT
of that era to IQ s~ores."~'
Combining that information with reports of
the mean SAT scores for entrants to schools using the SAT, we are able
to approximate the mean lQs of the entering students to the Ivy League
and the Seven Sisters, the most prestigious schools in the country at
that time.["'
Judging from this information, the entering classes of these schools
in 1926 had a mean IQ of about 1 17, which places the average student
at the most selective schools in the country at about the 88th percentile
of all the nation's youths and barely above the 115 level that has often
been considered the basic demarcation point for prime college tnate-
rial.
In the same year as these SAT data were collected, the Carnegie
Foundation began an ambitious statewide study of high school seniors
and their college experience in the entire state of Pennsylvania.12 By
happy coincidence, the investigators used the same form of the Otis In-
telligence Test used by the SAT Commission. Among other tests, they
reported means for the sophomore classes at all the colleges and uni.
versities in Pennsylvania in 1928, Pennsylvania was (then as now) a
large state with a wide variety of public and private schools, small and
large, prestigious and pedestrian. The IQ equivalent of the average of
all Pennsylvania colleges was 107, which put the average Pennsylvania
student at the 68th percentile, considerably below the average of the
elite schools. But ten Pennsylvania colleges had freshman classes with
mean IQs that put them at the 75th to 90 percentiles.[131 In other words,
students going to any of several Pennsylvania colleges were, on average,
virtually indistinguishable in cognitive ability from the students in the
Ivy League and the Seven Sisters.
Now let us jump to 1964, the first year for which SAT data for a large
number of Pennsylvania colleges are available. We repeat the exercise,
this time using the SAT-Verbal test as the basis for analysis.[141
Two im-
portant changes had occurred since 1928. The average freshman in a
Pennsylvania college in 1964 was much smarter than the average Penn.
sylvania freshman in 1928-at
about the 89th percentile. At the same
time, however, the elite colleges, using the same fourteen schools rep-
resented in the 1928 data, had moved much further out toward the edge,
now boasting an average freshman who was at the 99th percentile of
the nation's youth.
Cognitive Stratification Throughout the College System by the 1960s
The same process occurred around the country, as the figure below
shows. We picked out colleges with freshman SAT+Verbal means that
were separated by roughly fiftypoint intervals as of 1961.'"' The spe-
cific schools named are representative of those clustering near each
break point. At the bottom is a state college in the second echelon of a
state system (represented by Georgia Southern); then comes a large state
university (North Carolina State), then five successively more selective
private schools: Villanova, Tulane, Colby, Amherst, and Harvard. We
have placed the SAT scores against the backdrop of the overall distri-
bution of SAT scores for the entire population of high school seniors
(not just those who ordinarily take the SAT), using a special study that
the College Board conducted in the fall of 1960. The figure points to
the general phenomenon already noted for Harvard: By 1961, a large
40
The Emergence of a Cognitive Elite
Cognitive stratification in colleges by 1961
The SAT Distribution for All High School Seniors
Mean of high school
seniors who did not
go to college
ofseniors who went to ...
orth Carolina State
S AT-Verbal Score
Source: Seibel 1962; College Entrance Examination Board 1961.
gap separated the student bodies of the elite schools from those of the
public universities. Within the elite schools, another and significant
level of stratification had also developed.
As the story about Harvard indicated, the period of this stratification
seems to have been quite concentrated, beginning in the early 1950s."~'
It remains to explain why. What led the nation's most able college age
youth (and their parents) to begin deciding so abruptly that State U.
was no longer good enough and that they should strike out for New
Haven or Palo Alto instead?
If the word democracy springs to your tongue, note that democracy-
at least in the economic sense-had
little to do with it. The Harvard
freshman class of 1960 comprised fewer children from low-income fam-
ilies, not more, than the freshman class in 1952." And no wonder, Har-
vard in 1950 had been cheap by today's standards. In 1950, total costs
for a year at Harvard were only $8,80Lin 1990 dollars, parents of to-
day's college students will be saddened to learn. By 1960, total costs
there had risen to $12,200 in 1990 dollars, a hefty 40 percent increase.
According to the guidelines of the times, the average family could, if it
Cognitive Class and Education, 1900-1990
41
stretched, afford to spend 20 percent of its income to send a child to
~arvard."" Seen in that light, the proportion of families who could af.
ford Harvard decreased slightly during the 1950s.['~]
Scholarship help in+
creased but not fast enough to keep pace.
Nor had Harvard suddenly decided to maximize the test scores of its
entering class. In a small irony of history, the Harvard faculty had dee
cided in 1960 not to admit students purely on the basis of academic po.
tential as measured by tests but to consider a broader range of human
qualities.20 Dean Bender explained why, voicing his fears that Harvard
would "become such an intellectual hot-house that the unfortunate as*
pects of a self-conscious 'intellectualism' would become dominant and
the precious, the brittle and the neurotic take over." He asked a very
good question indeed: "In other words, would being part of a super+elite
in a high prestige institution be good for the healthy development of
the ablest 18- to 22-year-olds, or would it tend to be a warping and nar-
rowing e~~erience?"~'
In any case, Harvard in 1960 continued, as it had
in the past and would in the future, to give weight to such factors as the
applicant's legacy (was the father a Harvard alum?), his potential as a
quarterback or stroke for the eight-man shell, and other nonacademic
The baby boom had nothing to do with the change, The leading edge
of the baby boomer tidal wave was just beginning to reach the campus
by 1960.'~~~
So what had happened? With the advantage of thirty additional years
of hindsight, two trends stand out more clearly than they did in 1960.
First, the 1950s were the years in which television came of age and
long-distance travel became commonplace. Their effects on the atti.
tildes toward college choices can only be estimated, but they were surely
significant. For students coming East from the Midwest and West, the
growth of air travel and the interstate highway system made travel to
school faster for affluent families and cheaper for less affluent ones.
Other effects may have reflected the decreased psychic distance of
Boston from parents and prospective students living in Chicago or Salt
Lake City, because of the ways in which the world had become elec-
tronically smaller.
Second, the 1950s saw the early stages of an increased demand that
results not from proportional changes in wealth but from an expanding
number of affluent customers competing for scarce goods. Price in.
creases for a wide variety of elite goods have outstripped changes in the
The Rise of Cognitive Screens
- Critics feared that concentrating the brightest students into a 'super-elite' would create a neurotic, brittle, and warped intellectual environment.
- Despite the shift toward meritocracy, Harvard maintained traditional preferences for legacies and athletes throughout the 1960s.
- Technological advances like television and air travel reduced the 'psychic distance' of elite Eastern schools for families across the country.
- The 1950s saw an explosion in the number of affluent families competing for a fixed supply of 'elite goods,' including prestigious university degrees.
- The primary filter for elite admissions shifted from social class and religion to a fine-meshed screen of cognitive ability.
Instead of the old screen-woven of class, religion, region, and old school ties-the new screen was cognitive ability, and its mesh was already exceeding fine.
40
The Emergence of a Cognitive Elite
Cognitive stratification in colleges by 1961
The SAT Distribution for All High School Seniors
Mean of high school
seniors who did not
go to college
ofseniors who went to ...
orth Carolina State
S AT-Verbal Score
Source: Seibel 1962; College Entrance Examination Board 1961.
gap separated the student bodies of the elite schools from those of the
public universities. Within the elite schools, another and significant
level of stratification had also developed.
As the story about Harvard indicated, the period of this stratification
seems to have been quite concentrated, beginning in the early 1950s."~'
It remains to explain why. What led the nation's most able college age
youth (and their parents) to begin deciding so abruptly that State U.
was no longer good enough and that they should strike out for New
Haven or Palo Alto instead?
If the word democracy springs to your tongue, note that democracy-
at least in the economic sense-had
little to do with it. The Harvard
freshman class of 1960 comprised fewer children from low-income fam-
ilies, not more, than the freshman class in 1952." And no wonder, Har-
vard in 1950 had been cheap by today's standards. In 1950, total costs
for a year at Harvard were only $8,80Lin 1990 dollars, parents of to-
day's college students will be saddened to learn. By 1960, total costs
there had risen to $12,200 in 1990 dollars, a hefty 40 percent increase.
According to the guidelines of the times, the average family could, if it
Cognitive Class and Education, 1900-1990
41
stretched, afford to spend 20 percent of its income to send a child to
~arvard."" Seen in that light, the proportion of families who could af.
ford Harvard decreased slightly during the 1950s.['~]
Scholarship help in+
creased but not fast enough to keep pace.
Nor had Harvard suddenly decided to maximize the test scores of its
entering class. In a small irony of history, the Harvard faculty had dee
cided in 1960 not to admit students purely on the basis of academic po.
tential as measured by tests but to consider a broader range of human
qualities.20 Dean Bender explained why, voicing his fears that Harvard
would "become such an intellectual hot-house that the unfortunate as*
pects of a self-conscious 'intellectualism' would become dominant and
the precious, the brittle and the neurotic take over." He asked a very
good question indeed: "In other words, would being part of a super+elite
in a high prestige institution be good for the healthy development of
the ablest 18- to 22-year-olds, or would it tend to be a warping and nar-
rowing e~~erience?"~'
In any case, Harvard in 1960 continued, as it had
in the past and would in the future, to give weight to such factors as the
applicant's legacy (was the father a Harvard alum?), his potential as a
quarterback or stroke for the eight-man shell, and other nonacademic
The baby boom had nothing to do with the change, The leading edge
of the baby boomer tidal wave was just beginning to reach the campus
by 1960.'~~~
So what had happened? With the advantage of thirty additional years
of hindsight, two trends stand out more clearly than they did in 1960.
First, the 1950s were the years in which television came of age and
long-distance travel became commonplace. Their effects on the atti.
tildes toward college choices can only be estimated, but they were surely
significant. For students coming East from the Midwest and West, the
growth of air travel and the interstate highway system made travel to
school faster for affluent families and cheaper for less affluent ones.
Other effects may have reflected the decreased psychic distance of
Boston from parents and prospective students living in Chicago or Salt
Lake City, because of the ways in which the world had become elec-
tronically smaller.
Second, the 1950s saw the early stages of an increased demand that
results not from proportional changes in wealth but from an expanding
number of affluent customers competing for scarce goods. Price in.
creases for a wide variety of elite goods have outstripped changes in the
42
The Emergence of a Cognitive Elite
Cognitive Class and Education, 1900-1 990
43
consumer price index or changes in mean income in recent decades,
sometimes by orders of magnitude. The cost of Fifth Avenue apartments,
seashore property, Van Gogh paintings, and rare stamps are all exam-
ples. Prices have risen because demand has increased and supply can-
not. In the case of education, new universities are built, but not new
Princetons, Harvards, Yales, or Stanfords. And though the proportion
of families with incomes sufficient to pay for a Harvard education did
not increase significantly during the 1950s, the raw number did. Using
the 20-percent-of-family-income rule, the number of families that could
afford Harvard increased by 184,000 from 1950 to 1960. Using a 10 per-
cent rule, the number increased by 55,000. Only a small portion of these
new families had children applying to college, but the number of slots
in the freshmen classes of the elite schools was also small. College en-
rollment increased from 2.1 million students in 1952 to 2.6 million by
1960, meaning a half.million more competitors for available places. It
would not take much of an increase in the propensity to seek elite ed-
ucations to produce a substantial increase in the annual applications to
Harvard, Yale, and the others.[241
We suspect also that the social and cultural forces unleashed by World
War II played a central role, but probing them would take us far afield.
Whatever the combination of reasons, the basics of the situation were
straightforward: By the early 1960s, the entire top echelon of American
universities had been transformed. The screens filtering their students
from the masses had not been lowered but changed. Instead of the old
screen-woven
of class, religion, region, and old school ties-the
new
screen was cognitive ability, and its mesh was already exceeding fine.
Changes Since the 1960s
There have been no equivalent sea changes since the early 1960s, but
the concentration of top students at elite schools has intensified, As of
the early 1990s, Harvard did not get four applicants for each opening,
but closer to seven, highly self-selected and better prepared than ever.
Competition for entry into the other elite schools has stiffened compa-
rably.
Philip Cook and Robert Frank have drawn together a wide variety of
data documenting the increasing c~ncentration.~~
There are, for exam-
ple, the Westinghouse Science Talent Search finalists. In the 1960s, 47
percent went to the top seven colleges (as ranked in the Bawon's list
that Cook and Frank used). In the 1 9 8 0 ~ ~
that proportion had risen to
59 percent, with 39 percent going to just three colleges (Harvard, MIT,
and ~rinceton).[*~]
Cook and Frank also found that from 1979 to 1989,
the percentage of students scoring over 700 on the SAT-Verbal who
chose one of the "most competitive colleges" increased from 32 to 43
percent. 1271
The degree of partitioning off of the top students as of the early 1990s
has reached startling proportions. Consider the list of schools that were
named as the nation's top twenty-five large universities and the top
twenty-five small colleges in a well-known 1990 ranking,I2'] Together,
these fifty schools accounted for just 59,000 out of approximately 1.2
million students who entered four-year institutions in the fall of 1990-
fewer than one out of twenty of the nation's freshmen in four-year col-
leges. But they took in twelve out of twenty of the students who scored
in the 700s on their SAT-Verbal test. They took in seven out of twenty
of students who scored in the 600s.[*"'
The concentration is even more extreme than that. Suppose we take
just the top ten schools, as ranked by the number of their freshmen who
scored it1 the 700s on the SAT-Verbal. Now we are talking about schools
that enrolled a total of only 18,000 freshmen, one out of every sixty-
seven nationwide. Just these ten schools-Harvard,
Yale, Stanford,
University of Pennsylvania, Princeton, Brown, University of California
at Berkeley, Cornell, Dartmouth, and Columbia-soaked up 31 percent
of the nation's students who scored in the 700s on the SAT-Verbal. Har-
vard and Yale alone, enrolling just 2,900 freshmen-roughly
1 out of
every 400 freshmen-accout~ted for 10 percent. In other words, scoring
above 700 is forty times more concentrated in the freshman classes at
Yale anJ Harvard than in the national SAT population at large-and
the national SAT population is already a slice off the top of the distri-
bution.['*]
HOW HIGH ARE THE PARTITIONS?
We have spoken of "cognitive partitioning" through education, which
implies separate bins into which the population has been distributed.
But there has always been substantial intellectual overlap across educa-
tional levels, and that remains true today. We are trying to convey a sit.
uation that is as much an ongoing process as an outcome. But before
doing so, the time has come for the first of a few essential hits of statis-
The Rise of Cognitive Partitioning
- Elite universities have seen a dramatic intensification in the concentration of top-performing students since the early 1990s.
- Data from the Westinghouse Science Talent Search shows a significant shift of finalists toward a handful of top-tier colleges.
- A small group of fifty schools accounts for only five percent of freshmen but captures sixty percent of students with top-tier SAT scores.
- The top ten universities alone enroll nearly one-third of all students nationwide who score in the 700s on the SAT-Verbal.
- This trend creates a 'cognitive partitioning' where the most intellectually gifted are increasingly isolated from the general population.
- The authors introduce the concept of the normal distribution to explain how these elite populations represent the extreme 'tail' of the curve.
The degree of partitioning off of the top students as of the early 1990s has reached startling proportions.
42
The Emergence of a Cognitive Elite
Cognitive Class and Education, 1900-1 990
43
consumer price index or changes in mean income in recent decades,
sometimes by orders of magnitude. The cost of Fifth Avenue apartments,
seashore property, Van Gogh paintings, and rare stamps are all exam-
ples. Prices have risen because demand has increased and supply can-
not. In the case of education, new universities are built, but not new
Princetons, Harvards, Yales, or Stanfords. And though the proportion
of families with incomes sufficient to pay for a Harvard education did
not increase significantly during the 1950s, the raw number did. Using
the 20-percent-of-family-income rule, the number of families that could
afford Harvard increased by 184,000 from 1950 to 1960. Using a 10 per-
cent rule, the number increased by 55,000. Only a small portion of these
new families had children applying to college, but the number of slots
in the freshmen classes of the elite schools was also small. College en-
rollment increased from 2.1 million students in 1952 to 2.6 million by
1960, meaning a half.million more competitors for available places. It
would not take much of an increase in the propensity to seek elite ed-
ucations to produce a substantial increase in the annual applications to
Harvard, Yale, and the others.[241
We suspect also that the social and cultural forces unleashed by World
War II played a central role, but probing them would take us far afield.
Whatever the combination of reasons, the basics of the situation were
straightforward: By the early 1960s, the entire top echelon of American
universities had been transformed. The screens filtering their students
from the masses had not been lowered but changed. Instead of the old
screen-woven
of class, religion, region, and old school ties-the
new
screen was cognitive ability, and its mesh was already exceeding fine.
Changes Since the 1960s
There have been no equivalent sea changes since the early 1960s, but
the concentration of top students at elite schools has intensified, As of
the early 1990s, Harvard did not get four applicants for each opening,
but closer to seven, highly self-selected and better prepared than ever.
Competition for entry into the other elite schools has stiffened compa-
rably.
Philip Cook and Robert Frank have drawn together a wide variety of
data documenting the increasing c~ncentration.~~
There are, for exam-
ple, the Westinghouse Science Talent Search finalists. In the 1960s, 47
percent went to the top seven colleges (as ranked in the Bawon's list
that Cook and Frank used). In the 1 9 8 0 ~ ~
that proportion had risen to
59 percent, with 39 percent going to just three colleges (Harvard, MIT,
and ~rinceton).[*~]
Cook and Frank also found that from 1979 to 1989,
the percentage of students scoring over 700 on the SAT-Verbal who
chose one of the "most competitive colleges" increased from 32 to 43
percent. 1271
The degree of partitioning off of the top students as of the early 1990s
has reached startling proportions. Consider the list of schools that were
named as the nation's top twenty-five large universities and the top
twenty-five small colleges in a well-known 1990 ranking,I2'] Together,
these fifty schools accounted for just 59,000 out of approximately 1.2
million students who entered four-year institutions in the fall of 1990-
fewer than one out of twenty of the nation's freshmen in four-year col-
leges. But they took in twelve out of twenty of the students who scored
in the 700s on their SAT-Verbal test. They took in seven out of twenty
of students who scored in the 600s.[*"'
The concentration is even more extreme than that. Suppose we take
just the top ten schools, as ranked by the number of their freshmen who
scored it1 the 700s on the SAT-Verbal. Now we are talking about schools
that enrolled a total of only 18,000 freshmen, one out of every sixty-
seven nationwide. Just these ten schools-Harvard,
Yale, Stanford,
University of Pennsylvania, Princeton, Brown, University of California
at Berkeley, Cornell, Dartmouth, and Columbia-soaked up 31 percent
of the nation's students who scored in the 700s on the SAT-Verbal. Har-
vard and Yale alone, enrolling just 2,900 freshmen-roughly
1 out of
every 400 freshmen-accout~ted for 10 percent. In other words, scoring
above 700 is forty times more concentrated in the freshman classes at
Yale anJ Harvard than in the national SAT population at large-and
the national SAT population is already a slice off the top of the distri-
bution.['*]
HOW HIGH ARE THE PARTITIONS?
We have spoken of "cognitive partitioning" through education, which
implies separate bins into which the population has been distributed.
But there has always been substantial intellectual overlap across educa-
tional levels, and that remains true today. We are trying to convey a sit.
uation that is as much an ongoing process as an outcome. But before
doing so, the time has come for the first of a few essential hits of statis-
44
The Emergence of a Cognitive Elite
tics: the concepts of distribution and standard deviation. If you are
new to statistics, we recommend that you read the more detailed
explanation in Appendix 1; you will enjoy the rest of the book more
if you do.
A Digression: Standard Deviations and Why They Are Important
Very briefly, a distributiori is the pattern formed by many individual
scores. The famous "normal distribution" is a bell-shaped curve, with
most people getting scores in the middle range and a few at each end,
or "tail," of the distribution. Most mental tests are designed to produce
normal distributions.
A standard deviation is a common language for expressing scores.
Why not just use the raw scores (SAT points, IQ points, etc.)? There
are many reasons, but one of the simplest is that we need to compare re-
sults on many different tests. Suppose you are told that a horse is six-
teen hands tall and a snake is quarter of a rod long. Not many people
can tell you from that information how the height of the horse cotn-
pares to the length of the snake. If instead people use inches for both,
there is no problem, The same is true for statistics. The standard devi-
ation is akin to the inch, an all+purpose measure that can be used for
any distribution. Suppose we tell you that Joe has an ACT score of 24
and Tom has an SAT-Verbal of 720. As in the case of the snake and the
horse, you need a lot of information about those two tests before you
can tell much from those two numbers. But if we tell you instead that
Joe has an ACT score that is .7 standard deviation above the mean and
Tom has an SAT-Verbal that is 2.7 standard deviations above the mean,
you know a lot.
How big is a standard deviation? For a test distributed normally, a per-
son whose score is one standard deviation below the mean is at the 16th
percentile. A person whose score is a standard deviation above the mean
is at the 84th percentile. Two standard deviations from the mean mark
the 2d and 98th percentiles. Three standard deviations from the mean
marks the bottom and top thousandth of a distribution. Or, in short, as
a measure of distance from the mean, one standard deviation means
"big,,' two standard deviations means "very big," and three standard de-
viations means "huge." Standard deviation is often abbreviated "SD," a
convention we will often use in the rest of the book,
Cognitive Class and Education, 1900-1 990
45
Understanding HOW the Partitions Have Risen
The figure below summarizes the situation as of 1930, after three decades
of expansion in college enrollment but before the surging changes of the
decades to come. The area under each distribution is composed of peo-
Americans with and without a college degree as of 1930
--
- -
Three Populations of 23-Year-Olds in 1930
Everyone without
Areas are proportionnl
a college degree
to the relative sizes of
the populations
A? college graduates
K
Mean of graduates
from the Ivy League
& Seven Sisters (the
\ / distribution is too
-3
-2
-1
0
1
2
3
IQ, in standard deviations from the mean
Sources: Rrigham, 1932; Learned and Wood, 1938.
ple age 23 and is proportional to its representation in the national pop-
ulation of such people. The vertical lines denote the mean score for
each distribution. Around them are drawn normal distributions-
bell curves-expressed in terms of standard deviations from the mean.""
It is easy to see from the figure above why cognitive stratification was
only a minor part of the social landscape in 1930. At any given level of
cognitive ability, the number of people without college degrees dwarfed
the number who had them. College graduates and the noncollege pope
ulation did not differ much in IQ. And even the graduates of the top
universities (an estimate based on the Ivy League data for 1928) had
IQs well within the ordinary range of ability.
The Language of Standard Deviation
- Standard deviation serves as a universal metric, similar to the inch, allowing for the comparison of disparate data sets like ACT and SAT scores.
- In a normal distribution, standard deviations correspond to specific percentiles, where one SD above the mean represents the 84th percentile and three represents the top thousandth.
- In 1930, cognitive stratification was minimal because the vast majority of high-ability individuals did not possess college degrees.
- Historical data shows that the IQ distributions of college graduates and the general population overlapped significantly in the early 20th century.
- The emergence of a 'cognitive elite' is traced through the increasing concentration of high-IQ individuals into specific educational tiers over sixty years.
Suppose you are told that a horse is sixteen hands tall and a snake is quarter of a rod long. Not many people can tell you from that information how the height of the horse compares to the length of the snake.
44
The Emergence of a Cognitive Elite
tics: the concepts of distribution and standard deviation. If you are
new to statistics, we recommend that you read the more detailed
explanation in Appendix 1; you will enjoy the rest of the book more
if you do.
A Digression: Standard Deviations and Why They Are Important
Very briefly, a distributiori is the pattern formed by many individual
scores. The famous "normal distribution" is a bell-shaped curve, with
most people getting scores in the middle range and a few at each end,
or "tail," of the distribution. Most mental tests are designed to produce
normal distributions.
A standard deviation is a common language for expressing scores.
Why not just use the raw scores (SAT points, IQ points, etc.)? There
are many reasons, but one of the simplest is that we need to compare re-
sults on many different tests. Suppose you are told that a horse is six-
teen hands tall and a snake is quarter of a rod long. Not many people
can tell you from that information how the height of the horse cotn-
pares to the length of the snake. If instead people use inches for both,
there is no problem, The same is true for statistics. The standard devi-
ation is akin to the inch, an all+purpose measure that can be used for
any distribution. Suppose we tell you that Joe has an ACT score of 24
and Tom has an SAT-Verbal of 720. As in the case of the snake and the
horse, you need a lot of information about those two tests before you
can tell much from those two numbers. But if we tell you instead that
Joe has an ACT score that is .7 standard deviation above the mean and
Tom has an SAT-Verbal that is 2.7 standard deviations above the mean,
you know a lot.
How big is a standard deviation? For a test distributed normally, a per-
son whose score is one standard deviation below the mean is at the 16th
percentile. A person whose score is a standard deviation above the mean
is at the 84th percentile. Two standard deviations from the mean mark
the 2d and 98th percentiles. Three standard deviations from the mean
marks the bottom and top thousandth of a distribution. Or, in short, as
a measure of distance from the mean, one standard deviation means
"big,,' two standard deviations means "very big," and three standard de-
viations means "huge." Standard deviation is often abbreviated "SD," a
convention we will often use in the rest of the book,
Cognitive Class and Education, 1900-1 990
45
Understanding HOW the Partitions Have Risen
The figure below summarizes the situation as of 1930, after three decades
of expansion in college enrollment but before the surging changes of the
decades to come. The area under each distribution is composed of peo-
Americans with and without a college degree as of 1930
--
- -
Three Populations of 23-Year-Olds in 1930
Everyone without
Areas are proportionnl
a college degree
to the relative sizes of
the populations
A? college graduates
K
Mean of graduates
from the Ivy League
& Seven Sisters (the
\ / distribution is too
-3
-2
-1
0
1
2
3
IQ, in standard deviations from the mean
Sources: Rrigham, 1932; Learned and Wood, 1938.
ple age 23 and is proportional to its representation in the national pop-
ulation of such people. The vertical lines denote the mean score for
each distribution. Around them are drawn normal distributions-
bell curves-expressed in terms of standard deviations from the mean.""
It is easy to see from the figure above why cognitive stratification was
only a minor part of the social landscape in 1930. At any given level of
cognitive ability, the number of people without college degrees dwarfed
the number who had them. College graduates and the noncollege pope
ulation did not differ much in IQ. And even the graduates of the top
universities (an estimate based on the Ivy League data for 1928) had
IQs well within the ordinary range of ability.
46
The Emergence of a Cognitive Elite
Cognitive Class and Education, 1900-1 990
47
The comparable picture sixty years later, based on our analysis of the
NLSY, is shown in the next figure, again depicted as normal distribu-
tions.'"' Note that the actual distributions may deviate from perfect nor-
mality, especially out in the tails.
Americans with and without a college degree as of 1990
Three Populations of 23-Year-Olds in 1990
Areus we proportional
Everyone without
to the relative sizes of
the populntions.
All college graduates
Mean of the graduates
of the too dozen
universities (the
distribution is too
A
small to be visible)
-3
-2
- 1
0
1
2
3
I
IQ, in standard deviations from the mean
The college population has grown a lot while its mean IQ has risen a
bit. Most bright people were not going to college in 1930 (or earlier)-
waiting on the bench, so to speak, until the game opened up to them. By
1990, the noncollege population, drained of many bright youngsters,
had shifted downward in IQ. While the college population grew, the gap
between college and noncollege populations therefore also grew, The
largest change, however, has been the huge increase in the intelligence
of the average student in the top dozen universities, up a standard devi-
ation and a half from where the Ivies and the Seven Sisters were in 1930.
One may see other features in the figure evidently less supportive of cog-
nitive partitioning. Our picture suggests that for every person within the
ranks of college graduates, there is another among those without a col-
lege degree who has just as high an IQ--or at least almost. And as for the
graduates of the dozen top schools,'331
while it is true that their mean IQ
is extremely high (designated by the +2.7 SDs to which the line points),
they are such a small proportion of the nation's population that they do
not even register visually on this graph, and they too are apparently out-
numbered by people with similar IQs who do not graduate from those
colleges, or do not graduate from college at all. Is there anything to be
concerned abuut? How much partitioning has really occurred?
Perhaps a few examples will illustrate. Think of your twelve closest
friends or colleagues. For most readers of this book, a large majority will
be college graduates. Does it surprise you to learn that the odds of hav-
ing even half of them be college graduates are only six in a thousand, if
people were randomly paired off?[341
Many of you will not think it odd
that half or more of the dozen have advanced degrees. But the odds
against finding such a result among a randomly chosen group of twelve
Americans are actually more than a million to one. Are any of the dozen
a graduate of Harvard, Stanford, Yale, Princeton, Cal Tech, MIT, Duke,
Dartmouth, Cornell, Columbia, University of Chicago, or Brown? The
chance that even one is a graduate of those twelve schools is one in a
thousand. The chance of finding two among that group is one in fifty
thousand. The chance of finding four or more is less than one in a bil-
lion.
Most readers of this book-this
may be said because we know a great
deal about the statistical tendencies of people who read a book like
this-are
in preposterously unlikely groups, and this reflects the degree
of partitioning that has already occurred.
In some respects, the results of the exercise today are not so different
from the results that would have been obtained in former years. Sixty
years ago as now, the people who were most likely to read a book of this
nature would be skewed toward those who had friends with college or
Ivy League college educations and advanced degrees. The differences
between 1930 and 1990 are these:
First, only a small portion of the 1930 population was in a position
to have the kind of circle of friends and colleagues that characterizes
the readers of this book. We will not try to estimate the proportion,
which would involve too many assumptions, but you may get an idea by
examining the small area under the curve for college graduates in the
1930 figure, and visualize some fraction of that area as representing peo-
ple in 1930 who could conceivably have had the educational circle of
friends and colleagues you have, They constituted the thinnest cream
floating on the surface of American society in 1930. In 1990, they con-
stituted a class.
Second, the people who obtained such educations changed. Suppose
that it is 1930 and you are one of the small number of people whose cir-
The Rise of Cognitive Partitioning
- The average IQ of students at elite universities has surged by 1.5 standard deviations since 1930, creating a distinct cognitive layer.
- While the college population has expanded, the non-college population has seen a downward shift in mean IQ as bright individuals are increasingly siphoned into higher education.
- Despite the concentration of high IQs in elite schools, there remains a significant number of highly intelligent individuals who do not graduate from top-tier institutions.
- Social circles have become highly segregated; the statistical probability of a random American having a friend group dominated by elite degree holders is nearly zero.
- What was once a 'thin cream' of educated individuals in 1930 has transformed into a distinct and isolated social class by 1990.
Most readers of this book are in preposterously unlikely groups, and this reflects the degree of partitioning that has already occurred.
46
The Emergence of a Cognitive Elite
Cognitive Class and Education, 1900-1 990
47
The comparable picture sixty years later, based on our analysis of the
NLSY, is shown in the next figure, again depicted as normal distribu-
tions.'"' Note that the actual distributions may deviate from perfect nor-
mality, especially out in the tails.
Americans with and without a college degree as of 1990
Three Populations of 23-Year-Olds in 1990
Areus we proportional
Everyone without
to the relative sizes of
the populntions.
All college graduates
Mean of the graduates
of the too dozen
universities (the
distribution is too
A
small to be visible)
-3
-2
- 1
0
1
2
3
I
IQ, in standard deviations from the mean
The college population has grown a lot while its mean IQ has risen a
bit. Most bright people were not going to college in 1930 (or earlier)-
waiting on the bench, so to speak, until the game opened up to them. By
1990, the noncollege population, drained of many bright youngsters,
had shifted downward in IQ. While the college population grew, the gap
between college and noncollege populations therefore also grew, The
largest change, however, has been the huge increase in the intelligence
of the average student in the top dozen universities, up a standard devi-
ation and a half from where the Ivies and the Seven Sisters were in 1930.
One may see other features in the figure evidently less supportive of cog-
nitive partitioning. Our picture suggests that for every person within the
ranks of college graduates, there is another among those without a col-
lege degree who has just as high an IQ--or at least almost. And as for the
graduates of the dozen top schools,'331
while it is true that their mean IQ
is extremely high (designated by the +2.7 SDs to which the line points),
they are such a small proportion of the nation's population that they do
not even register visually on this graph, and they too are apparently out-
numbered by people with similar IQs who do not graduate from those
colleges, or do not graduate from college at all. Is there anything to be
concerned abuut? How much partitioning has really occurred?
Perhaps a few examples will illustrate. Think of your twelve closest
friends or colleagues. For most readers of this book, a large majority will
be college graduates. Does it surprise you to learn that the odds of hav-
ing even half of them be college graduates are only six in a thousand, if
people were randomly paired off?[341
Many of you will not think it odd
that half or more of the dozen have advanced degrees. But the odds
against finding such a result among a randomly chosen group of twelve
Americans are actually more than a million to one. Are any of the dozen
a graduate of Harvard, Stanford, Yale, Princeton, Cal Tech, MIT, Duke,
Dartmouth, Cornell, Columbia, University of Chicago, or Brown? The
chance that even one is a graduate of those twelve schools is one in a
thousand. The chance of finding two among that group is one in fifty
thousand. The chance of finding four or more is less than one in a bil-
lion.
Most readers of this book-this
may be said because we know a great
deal about the statistical tendencies of people who read a book like
this-are
in preposterously unlikely groups, and this reflects the degree
of partitioning that has already occurred.
In some respects, the results of the exercise today are not so different
from the results that would have been obtained in former years. Sixty
years ago as now, the people who were most likely to read a book of this
nature would be skewed toward those who had friends with college or
Ivy League college educations and advanced degrees. The differences
between 1930 and 1990 are these:
First, only a small portion of the 1930 population was in a position
to have the kind of circle of friends and colleagues that characterizes
the readers of this book. We will not try to estimate the proportion,
which would involve too many assumptions, but you may get an idea by
examining the small area under the curve for college graduates in the
1930 figure, and visualize some fraction of that area as representing peo-
ple in 1930 who could conceivably have had the educational circle of
friends and colleagues you have, They constituted the thinnest cream
floating on the surface of American society in 1930. In 1990, they con-
stituted a class.
Second, the people who obtained such educations changed. Suppose
that it is 1930 and you are one of the small number of people whose cir-
48
The Emergence ofa Cognitive Elite
Cognitive Class and Education, 1900-1 990
49
cle of twelve friends and colleagues included a sizable fraction of col-
lege graduates. Suppose you are one of the even tinier number whose
circle came primarily from the top universities. Your circle, selective and
uncommon as it is, nonetheless will have been scattered across a wide
range of intelligence, with IQs from 100 on up. Given the same educa-
tional profile in one's circle today, it would consist of a set of people with
IQs where the bottom tenth is likely to be in the vicinity of 120, and
the mean is likely to be in excess of 130-people
whose cognitive abil-
ity puts them out at the edge of the population at large. What might
have been a circle with education or social class as its most salient fea-
ture in 1930 has become a circle circumscribing a narrow range of high
IQ scores today.
The sword cuts both ways. Although they are not likely to be among
our readers, the circles at the bottom of the educational scale comprise
lower and narrower ranges of IQ today than they did in 1930. When
many youngsters in the top 25 percent of the intelligence distribution
who formerly would have stopped school in or immediately after high
school go to college instead, the proportion of high-school-only persons
whose intelligence is in the top 25 percent of the distribution has to fall
correspondingly. The occupational effect of this change is that bright
youngsters who formerly would have become carpenters or truck drivers
or postal clerks go to college instead, thence to occupations higher on
the socioeconomic ladder. Those left on the lower rungs are therefore
likely to be lower and more homogeneous intellectually. Likewise their
neighborhoods, which get drained of the bright and no longer poor, have
become more homogeneously populated by a less bright, and even
poorer, residuum. In other chapters we focus on what is happening at
the bottom of the distribution of intelligence.
The point of the exercise in thinking about your dozen closest friends
and colleagues is to encourage you to detach yourself momentarily from
the way the world looks to you from day to day and contemplate how
extraordinarily different your circle of friends and acquaintances is from
what would be the norm in a perfectly fluid society. This profound iso-
lation from other parts of the IQ distribution probably dulls our aware-
ness of how unrepresentative our circle actually is.
With these thoughts in mind, let us proceed to the technical answer
to the question, How much partitioning is there in America? It is done
by expressing the overlap of two distributions after they are equated for
size. There are various ways to measure overlap. In the following table
we use a measure called median ouerhp, which says what proportion of
IQ scores in the lower-scoring group matched or exceeded the median
score in the higher-scoring group. For the nationally representative
- -
Overlap Across the Educational Partitions
Groups Being Compared
Median Overlap
High school graduates with college graduates
7%
High school graduates with Ph.D.s, M.D.s, or LL.B.s
1%
College graduates with Ph.D.s, M.D.s, and LL.Bs
21%
NLSY sample, most of whom attended college in the late 1970s and
through the 1980s, the median overlap is as follows: By this measure,
there is only about 7 percent overlap between people with only a high
school diploma and people with a B.A. or M.A+ And even this small de-
gree of overlap refers to all colleges. If you went to any of the top hun-
dred colleges and universities in the country, the measure of overlap
would be a few percentage points. If you went to an elite school, the
overlap would approach zero.
Even among college graduates, the partitions are high. Only 21 per-
cent of those with just a B.A. or a B.S. had scores as high as the median
for those with advanced graduate degrees. Once again, these degrees of
overlap are for graduates of all colleges. The overlap between the B.A.
from a state teachers' college and an MIT Ph.D, can be no more than a
few percentage points.
What difference does it make? The answer to that question will un-
fold over the course of the book. Many of the answers involve the ways
that the social fabric in the middle class and working class is altered
when the most talented children of those families are so efficiently ex-
tracted to live in other worlds. But for the time being, we can begin by
thinking about that thin layer of students of the highest cognitive abil-
ity who are being funneled through rarefied college environments,
whence they go forth to acquire eventually not just the good life but of-
ten an influence on the life of the nation. They are coming of age in en-
vironments that are utterly atypical of the nation as a whole. The
national percentage of 18-year-olds with the ability to get a score of 700
or above on the SAT-Verbal test is in the vicinity of one in three hun-
dred. Think about the consequences when about half of these students
are going to universities in which 17 percent of their classmates also had
The Great Cognitive Partitioning
- Social circles that were once defined by class or education have shifted to being defined by narrow ranges of high IQ.
- The migration of high-IQ individuals into higher education has drained the intellectual diversity of blue-collar occupations and neighborhoods.
- Modern society has created a 'residuum' at the bottom of the distribution that is more intellectually and economically homogeneous than in the past.
- There is a profound isolation between cognitive classes, with only a 7 percent IQ overlap between high school and college graduates.
- For those at elite universities, the cognitive overlap with the general population approaches zero, creating a distorted view of the world.
- This partitioning suggests that the most educated segments of society are increasingly detached from the norms of a fluid society.
This profound isolation from other parts of the IQ distribution probably dulls our awareness of how unrepresentative our circle actually is.
48
The Emergence ofa Cognitive Elite
Cognitive Class and Education, 1900-1 990
49
cle of twelve friends and colleagues included a sizable fraction of col-
lege graduates. Suppose you are one of the even tinier number whose
circle came primarily from the top universities. Your circle, selective and
uncommon as it is, nonetheless will have been scattered across a wide
range of intelligence, with IQs from 100 on up. Given the same educa-
tional profile in one's circle today, it would consist of a set of people with
IQs where the bottom tenth is likely to be in the vicinity of 120, and
the mean is likely to be in excess of 130-people
whose cognitive abil-
ity puts them out at the edge of the population at large. What might
have been a circle with education or social class as its most salient fea-
ture in 1930 has become a circle circumscribing a narrow range of high
IQ scores today.
The sword cuts both ways. Although they are not likely to be among
our readers, the circles at the bottom of the educational scale comprise
lower and narrower ranges of IQ today than they did in 1930. When
many youngsters in the top 25 percent of the intelligence distribution
who formerly would have stopped school in or immediately after high
school go to college instead, the proportion of high-school-only persons
whose intelligence is in the top 25 percent of the distribution has to fall
correspondingly. The occupational effect of this change is that bright
youngsters who formerly would have become carpenters or truck drivers
or postal clerks go to college instead, thence to occupations higher on
the socioeconomic ladder. Those left on the lower rungs are therefore
likely to be lower and more homogeneous intellectually. Likewise their
neighborhoods, which get drained of the bright and no longer poor, have
become more homogeneously populated by a less bright, and even
poorer, residuum. In other chapters we focus on what is happening at
the bottom of the distribution of intelligence.
The point of the exercise in thinking about your dozen closest friends
and colleagues is to encourage you to detach yourself momentarily from
the way the world looks to you from day to day and contemplate how
extraordinarily different your circle of friends and acquaintances is from
what would be the norm in a perfectly fluid society. This profound iso-
lation from other parts of the IQ distribution probably dulls our aware-
ness of how unrepresentative our circle actually is.
With these thoughts in mind, let us proceed to the technical answer
to the question, How much partitioning is there in America? It is done
by expressing the overlap of two distributions after they are equated for
size. There are various ways to measure overlap. In the following table
we use a measure called median ouerhp, which says what proportion of
IQ scores in the lower-scoring group matched or exceeded the median
score in the higher-scoring group. For the nationally representative
- -
Overlap Across the Educational Partitions
Groups Being Compared
Median Overlap
High school graduates with college graduates
7%
High school graduates with Ph.D.s, M.D.s, or LL.B.s
1%
College graduates with Ph.D.s, M.D.s, and LL.Bs
21%
NLSY sample, most of whom attended college in the late 1970s and
through the 1980s, the median overlap is as follows: By this measure,
there is only about 7 percent overlap between people with only a high
school diploma and people with a B.A. or M.A+ And even this small de-
gree of overlap refers to all colleges. If you went to any of the top hun-
dred colleges and universities in the country, the measure of overlap
would be a few percentage points. If you went to an elite school, the
overlap would approach zero.
Even among college graduates, the partitions are high. Only 21 per-
cent of those with just a B.A. or a B.S. had scores as high as the median
for those with advanced graduate degrees. Once again, these degrees of
overlap are for graduates of all colleges. The overlap between the B.A.
from a state teachers' college and an MIT Ph.D, can be no more than a
few percentage points.
What difference does it make? The answer to that question will un-
fold over the course of the book. Many of the answers involve the ways
that the social fabric in the middle class and working class is altered
when the most talented children of those families are so efficiently ex-
tracted to live in other worlds. But for the time being, we can begin by
thinking about that thin layer of students of the highest cognitive abil-
ity who are being funneled through rarefied college environments,
whence they go forth to acquire eventually not just the good life but of-
ten an influence on the life of the nation. They are coming of age in en-
vironments that are utterly atypical of the nation as a whole. The
national percentage of 18-year-olds with the ability to get a score of 700
or above on the SAT-Verbal test is in the vicinity of one in three hun-
dred. Think about the consequences when about half of these students
are going to universities in which 17 percent of their classmates also had
The Emergence of Cognitive Partitioning
- Elite universities extract the most talented children from diverse backgrounds and funnel them into rarefied, atypical environments.
- The concentration of high-ability students creates a 'cognitive elite' with social and political outlooks that differ vastly from the general population.
- While educational access for the bright is heartening, it creates 'encapsulated worlds' where leaders lack experience with the realities of those they influence.
- The sorting process continues after graduation as occupations further seal the partitions between different cognitive layers of society.
- Intelligence serves as a primary predictor for job status, becoming increasingly critical as the intellectual demands of a profession rise.
When people live in encapsulated worlds, it becomes difficult for them, even with the best of intentions, to grasp the realities of worlds with which they have little experience but over which they also have great influence.
48
The Emergence ofa Cognitive Elite
Cognitive Class and Education, 1900-1 990
49
cle of twelve friends and colleagues included a sizable fraction of col-
lege graduates. Suppose you are one of the even tinier number whose
circle came primarily from the top universities. Your circle, selective and
uncommon as it is, nonetheless will have been scattered across a wide
range of intelligence, with IQs from 100 on up. Given the same educa-
tional profile in one's circle today, it would consist of a set of people with
IQs where the bottom tenth is likely to be in the vicinity of 120, and
the mean is likely to be in excess of 130-people
whose cognitive abil-
ity puts them out at the edge of the population at large. What might
have been a circle with education or social class as its most salient fea-
ture in 1930 has become a circle circumscribing a narrow range of high
IQ scores today.
The sword cuts both ways. Although they are not likely to be among
our readers, the circles at the bottom of the educational scale comprise
lower and narrower ranges of IQ today than they did in 1930. When
many youngsters in the top 25 percent of the intelligence distribution
who formerly would have stopped school in or immediately after high
school go to college instead, the proportion of high-school-only persons
whose intelligence is in the top 25 percent of the distribution has to fall
correspondingly. The occupational effect of this change is that bright
youngsters who formerly would have become carpenters or truck drivers
or postal clerks go to college instead, thence to occupations higher on
the socioeconomic ladder. Those left on the lower rungs are therefore
likely to be lower and more homogeneous intellectually. Likewise their
neighborhoods, which get drained of the bright and no longer poor, have
become more homogeneously populated by a less bright, and even
poorer, residuum. In other chapters we focus on what is happening at
the bottom of the distribution of intelligence.
The point of the exercise in thinking about your dozen closest friends
and colleagues is to encourage you to detach yourself momentarily from
the way the world looks to you from day to day and contemplate how
extraordinarily different your circle of friends and acquaintances is from
what would be the norm in a perfectly fluid society. This profound iso-
lation from other parts of the IQ distribution probably dulls our aware-
ness of how unrepresentative our circle actually is.
With these thoughts in mind, let us proceed to the technical answer
to the question, How much partitioning is there in America? It is done
by expressing the overlap of two distributions after they are equated for
size. There are various ways to measure overlap. In the following table
we use a measure called median ouerhp, which says what proportion of
IQ scores in the lower-scoring group matched or exceeded the median
score in the higher-scoring group. For the nationally representative
- -
Overlap Across the Educational Partitions
Groups Being Compared
Median Overlap
High school graduates with college graduates
7%
High school graduates with Ph.D.s, M.D.s, or LL.B.s
1%
College graduates with Ph.D.s, M.D.s, and LL.Bs
21%
NLSY sample, most of whom attended college in the late 1970s and
through the 1980s, the median overlap is as follows: By this measure,
there is only about 7 percent overlap between people with only a high
school diploma and people with a B.A. or M.A+ And even this small de-
gree of overlap refers to all colleges. If you went to any of the top hun-
dred colleges and universities in the country, the measure of overlap
would be a few percentage points. If you went to an elite school, the
overlap would approach zero.
Even among college graduates, the partitions are high. Only 21 per-
cent of those with just a B.A. or a B.S. had scores as high as the median
for those with advanced graduate degrees. Once again, these degrees of
overlap are for graduates of all colleges. The overlap between the B.A.
from a state teachers' college and an MIT Ph.D, can be no more than a
few percentage points.
What difference does it make? The answer to that question will un-
fold over the course of the book. Many of the answers involve the ways
that the social fabric in the middle class and working class is altered
when the most talented children of those families are so efficiently ex-
tracted to live in other worlds. But for the time being, we can begin by
thinking about that thin layer of students of the highest cognitive abil-
ity who are being funneled through rarefied college environments,
whence they go forth to acquire eventually not just the good life but of-
ten an influence on the life of the nation. They are coming of age in en-
vironments that are utterly atypical of the nation as a whole. The
national percentage of 18-year-olds with the ability to get a score of 700
or above on the SAT-Verbal test is in the vicinity of one in three hun-
dred. Think about the consequences when about half of these students
are going to universities in which 17 percent of their classmates also had
50
The Emergence of a Cognitive Elite
SAT-Vs in the 700s and another 48 percent had scores in the 600s.~~~'
It is difficult to exaggerate how different the elite college population is
from the population at large-first
in its level of intellectual talent, and
correlatively in its outlook on society, politics, ethics, religion, and all
the other domains in which intellectuals, especially intellectuals con-
centrated into communities, tend to develop their own conventional
wisdoms.
The news about education is heartening and frightening, more or less
in equal measure. Heartening, because the nation is providing a college
education for a high proportion of those who could profit from it.
Among those who graduate from high school, just about all the bright
youngsters now get a crack at a college education. Heartening also be-
cause our most elite colleges have opened their doors wide for young-
sters of outstanding promise. But frightening too. When people live in
encapsulated worlds, it becomes difficult for them, even with the best
of intentions, to grasp the realities of worlds with which they have lit-
tle experience but over which they also have great influence, both pub-
lic and private. Many of those promising undergraduates are never going
to live in a community where they will be disabused of their misper-
ceptions, for after education comes another sorting mechanism, occu-
pations, and many of the holes that are still left in the cognitive
partitions begin to get sealed. We now turn to that story.
Chapter 2
Cognitive Partitioning by
Occupation
People in different jobs have different average IQs. Lawyers, for example,
have higher lQs on the average than bus drivers. Whether they must have
higher IQs than bus drivers is a topic we take up in detail in the next chapter.
Here we start by noting simply that people from different ranges on the IQ
scale end up in different jobs.
Whatever the reason for the link between IQ and occupation, it goes deep.
I f you want to guess an adult male's job status, the results of his childhood IQ
test help you as much as knowing how many years he went to school.
1Q becomes more important as the job gets intellectually tougher. To be
able to dig a ditch, you need a strong back but not necessarily a high IQ score.
To be a master carpenter, you need some higher degree of intelligence along
with skill with your hands. To be afirst-rate lawyer, you had better come from
the upper end of the cognitive ability distribution. The same may be said of a
handful of other occupatioru, such as accountants, engineers and architects,
college teachers, dentists and physicians, mathematicians, and scientists. The
mean IQ ofpeople entering those fields is in the neighborhood of 120. In 1900,
only one out of twenty people in the top 10 percent in intelligence were in any
of these occupations, a figure that did not change much through 1940. But
after 1940, more and more people with high IQs flowed into those jobs, and
by 1990 the same handful of occupations employed about 25 percent of all
the people in the top tenth of intelligence.
During the same period, IQ became more important for business execu-
tives. In 1900, the CEO ofa large company was likely to be a WASP born
into affluence. He may have been bright, but that was not mainly how he was
chosen. Much was still the same as late as 1950. The next three decades saw
agreat social leveling, as the executive suites filled with bright people who could
maximize corporate profits, and never mind if they came from the aurong side
The Rise of Cognitive Partitioning
- Between 1940 and 1990, the concentration of high-IQ individuals in a handful of elite professions increased from roughly 5% to 25%.
- The corporate world shifted from a system of aristocratic privilege and social pedigree to a meritocracy that prioritizes cognitive ability and profit maximization.
- Higher education credentials, once rare in business, have become a mandatory screening mechanism for senior executive positions.
- Unlike the temporary sorting of the school years, occupational sorting defines a person's social circles, communities, and lifelong environment.
- The 'invisible hand' of the labor market naturally aligns job status with intelligence scores, a phenomenon observed across various countries and eras.
- Debates persist regarding whether high-IQ requirements for certain jobs are functional necessities or merely by-products of educational gatekeeping.
The next three decades saw a great social leveling, as the executive suites filled with bright people who could maximize corporate profits, and never mind if they came from the wrong side of the tracks or worshipped at a temple instead of a church.
50
The Emergence of a Cognitive Elite
SAT-Vs in the 700s and another 48 percent had scores in the 600s.~~~'
It is difficult to exaggerate how different the elite college population is
from the population at large-first
in its level of intellectual talent, and
correlatively in its outlook on society, politics, ethics, religion, and all
the other domains in which intellectuals, especially intellectuals con-
centrated into communities, tend to develop their own conventional
wisdoms.
The news about education is heartening and frightening, more or less
in equal measure. Heartening, because the nation is providing a college
education for a high proportion of those who could profit from it.
Among those who graduate from high school, just about all the bright
youngsters now get a crack at a college education. Heartening also be-
cause our most elite colleges have opened their doors wide for young-
sters of outstanding promise. But frightening too. When people live in
encapsulated worlds, it becomes difficult for them, even with the best
of intentions, to grasp the realities of worlds with which they have lit-
tle experience but over which they also have great influence, both pub-
lic and private. Many of those promising undergraduates are never going
to live in a community where they will be disabused of their misper-
ceptions, for after education comes another sorting mechanism, occu-
pations, and many of the holes that are still left in the cognitive
partitions begin to get sealed. We now turn to that story.
Chapter 2
Cognitive Partitioning by
Occupation
People in different jobs have different average IQs. Lawyers, for example,
have higher lQs on the average than bus drivers. Whether they must have
higher IQs than bus drivers is a topic we take up in detail in the next chapter.
Here we start by noting simply that people from different ranges on the IQ
scale end up in different jobs.
Whatever the reason for the link between IQ and occupation, it goes deep.
I f you want to guess an adult male's job status, the results of his childhood IQ
test help you as much as knowing how many years he went to school.
1Q becomes more important as the job gets intellectually tougher. To be
able to dig a ditch, you need a strong back but not necessarily a high IQ score.
To be a master carpenter, you need some higher degree of intelligence along
with skill with your hands. To be afirst-rate lawyer, you had better come from
the upper end of the cognitive ability distribution. The same may be said of a
handful of other occupatioru, such as accountants, engineers and architects,
college teachers, dentists and physicians, mathematicians, and scientists. The
mean IQ ofpeople entering those fields is in the neighborhood of 120. In 1900,
only one out of twenty people in the top 10 percent in intelligence were in any
of these occupations, a figure that did not change much through 1940. But
after 1940, more and more people with high IQs flowed into those jobs, and
by 1990 the same handful of occupations employed about 25 percent of all
the people in the top tenth of intelligence.
During the same period, IQ became more important for business execu-
tives. In 1900, the CEO ofa large company was likely to be a WASP born
into affluence. He may have been bright, but that was not mainly how he was
chosen. Much was still the same as late as 1950. The next three decades saw
agreat social leveling, as the executive suites filled with bright people who could
maximize corporate profits, and never mind if they came from the aurong side
52
The Emergence ofa Cognitive Elite
Cognitive Partitioning by Occupation
53
of the tracks or worshipped at a temple instead of a church. Meanwhile, the
college degree became a requirement for many business positions, and gradu-
ate education went from a rarity to a commonplace among senior executives.
W h e n one combines the people known to be in high-IQ professions with
estimates of the numbers of business executives who are drawn from the top
tenth in cognitive ability, the results do not leave much room for maneuver.
The specific popo~tions are open to argument, but the main point seems be-
yond dispute: E w n as recently as midcentury, America was still a society in
which most bright people were scattered throughout the wide range of jobs. As
the century draws to a close, a very high poportion of that same group is now
concentrated within a few occupations that are highly screened for IQ.
J
obs sort people by their IQs, just as college does. But there is a differ.
ence between educational and occupational sorting. People spend
only one to two decades in school. School may seem like forever when
we are there, but we spend most of our lives with the sorting that cen-
ters on work and carries over into circles of friends and colleagues, and
into communities-if
not physically the same workplaces, communi-
ties, and friends throughout the life span, then generically similar ones.
In this chapter, we continue our discussion of the contours of the intel.
lectual landscape. A n examination of occupational sorting will carry us
through to the end of Part I.
JOBS AND INTELLIGENCE
No one decreed that occupations should sort us out by our cognitive
abilities, and no one enforces the process. It goes on beneath the sur-
face, guided by its own invisible hand. Testers observe that job status
and intelligence test scores have gone together since there were in-
telligence tests to give.' As tests evolved and as the measurement of
status was formalized, studying the relation between the jobs and in.
telligence became a cottage industry for social scientists. By now, the
relation has been confirmed many times, in many countries, and in
many approaches to the data.*
This is not to say that the experts find nothing to quarrel about. The
technical literature is replete with disagreement. Aside from the purely
technical bones of contention, the experts argue about whether the IQ-
job status connection is a by-product of a more fundamental link be-
tween educational level and job status. For example, it takes a law de-
gree to be a lawyer, and it takes intelligence to get into and through law
school, but aside from that, is there any good reason why lawyers need
to have higher IQs on average than, say, bus drivers? At the height of
egalitarianism in the 1970s, the received wisdom in many academic cir-
cles was "no," with Christopher Jencks's Inequality the accepted text.3
A related argument, stated forcefully by James Fallows, arises over
whether an IQ score is a credential for certain jobs, like a union card for
a musician, or whether there is a necessary link between job status and
intelligence, like a good ear,4 By the time we get to the end of Part I,
our answers to such questions should be clear. Here we review a few of
the more illuminating findings, to push the discussion beyond the fact
that occupational status is correlated with IQ.
One notable finding is that the correlation between IQ and job sta-
tus is just about as high if the IQ test is given in childhood, decades be-
fore people enter the job market, as it is among young adults who are
taking an intelligence test after years of education. For example, in a
small but elegant longitudinal study of childhood intelligence and adult
outcomes, the boys and girls in the sample were given IQ tests in child-
hood and then their job statuses and levels of schooling were measured
on standard scales after they were at least 26 years old.5 The IQ scores
they got when they were 7 or 8 years old were about as correlated with
the status level of their adult jobs as their adult IQs would have been.I6]
Inasmuch as childhood IQ is more correlated with status than com-
pleted education, as it is in some studies, the thesis that IQ scores really
just measure educational level is weakened.
Family members typically resemble each other in their occupational
status.i71 We are talking here not about a son or a niece or a brother-in-
law going into the family business but about job status, however mea-
sured. On rating scales that categorize jobs from those with the highest
status to those with the lowest, family members tend to land at similar
levels, There are many exceptions; we all hear occasionally about fam-
ilies with several members who are doctors and lawyers plus another
who is a blue-collar worker, or vice versa. But such stories call attention
to themselves because they describe rarities. Mostly, relatives occupy
neighboring, if not the same, rungs on the job status ladder, and the
closer the relationship is, the nearer they are. Such commonplace find-
ings have many possible explanations, but an obvious one that is not
mentioned or tested often by social scientists is that since intelligence
IQ and Occupational Status
- Childhood IQ scores are as predictive of adult job status as IQ tests taken later in life, suggesting a stable underlying trait.
- The correlation between early intelligence and later career success persists regardless of the total years of education completed.
- Family members tend to occupy similar rungs on the occupational ladder, a phenomenon often attributed to shared cognitive traits.
- A Danish adoption study revealed that biological siblings raised apart show more similar job status than adoptive siblings raised together.
- The data suggests that genetic factors play a more significant role in determining professional status than the shared home environment.
- The link between intelligence and occupation becomes increasingly rigid as the cognitive demands of a profession rise.
The biologically related siblings resembled each other in job status, even though they grew up in different homes.
52
The Emergence ofa Cognitive Elite
Cognitive Partitioning by Occupation
53
of the tracks or worshipped at a temple instead of a church. Meanwhile, the
college degree became a requirement for many business positions, and gradu-
ate education went from a rarity to a commonplace among senior executives.
W h e n one combines the people known to be in high-IQ professions with
estimates of the numbers of business executives who are drawn from the top
tenth in cognitive ability, the results do not leave much room for maneuver.
The specific popo~tions are open to argument, but the main point seems be-
yond dispute: E w n as recently as midcentury, America was still a society in
which most bright people were scattered throughout the wide range of jobs. As
the century draws to a close, a very high poportion of that same group is now
concentrated within a few occupations that are highly screened for IQ.
J
obs sort people by their IQs, just as college does. But there is a differ.
ence between educational and occupational sorting. People spend
only one to two decades in school. School may seem like forever when
we are there, but we spend most of our lives with the sorting that cen-
ters on work and carries over into circles of friends and colleagues, and
into communities-if
not physically the same workplaces, communi-
ties, and friends throughout the life span, then generically similar ones.
In this chapter, we continue our discussion of the contours of the intel.
lectual landscape. A n examination of occupational sorting will carry us
through to the end of Part I.
JOBS AND INTELLIGENCE
No one decreed that occupations should sort us out by our cognitive
abilities, and no one enforces the process. It goes on beneath the sur-
face, guided by its own invisible hand. Testers observe that job status
and intelligence test scores have gone together since there were in-
telligence tests to give.' As tests evolved and as the measurement of
status was formalized, studying the relation between the jobs and in.
telligence became a cottage industry for social scientists. By now, the
relation has been confirmed many times, in many countries, and in
many approaches to the data.*
This is not to say that the experts find nothing to quarrel about. The
technical literature is replete with disagreement. Aside from the purely
technical bones of contention, the experts argue about whether the IQ-
job status connection is a by-product of a more fundamental link be-
tween educational level and job status. For example, it takes a law de-
gree to be a lawyer, and it takes intelligence to get into and through law
school, but aside from that, is there any good reason why lawyers need
to have higher IQs on average than, say, bus drivers? At the height of
egalitarianism in the 1970s, the received wisdom in many academic cir-
cles was "no," with Christopher Jencks's Inequality the accepted text.3
A related argument, stated forcefully by James Fallows, arises over
whether an IQ score is a credential for certain jobs, like a union card for
a musician, or whether there is a necessary link between job status and
intelligence, like a good ear,4 By the time we get to the end of Part I,
our answers to such questions should be clear. Here we review a few of
the more illuminating findings, to push the discussion beyond the fact
that occupational status is correlated with IQ.
One notable finding is that the correlation between IQ and job sta-
tus is just about as high if the IQ test is given in childhood, decades be-
fore people enter the job market, as it is among young adults who are
taking an intelligence test after years of education. For example, in a
small but elegant longitudinal study of childhood intelligence and adult
outcomes, the boys and girls in the sample were given IQ tests in child-
hood and then their job statuses and levels of schooling were measured
on standard scales after they were at least 26 years old.5 The IQ scores
they got when they were 7 or 8 years old were about as correlated with
the status level of their adult jobs as their adult IQs would have been.I6]
Inasmuch as childhood IQ is more correlated with status than com-
pleted education, as it is in some studies, the thesis that IQ scores really
just measure educational level is weakened.
Family members typically resemble each other in their occupational
status.i71 We are talking here not about a son or a niece or a brother-in-
law going into the family business but about job status, however mea-
sured. On rating scales that categorize jobs from those with the highest
status to those with the lowest, family members tend to land at similar
levels, There are many exceptions; we all hear occasionally about fam-
ilies with several members who are doctors and lawyers plus another
who is a blue-collar worker, or vice versa. But such stories call attention
to themselves because they describe rarities. Mostly, relatives occupy
neighboring, if not the same, rungs on the job status ladder, and the
closer the relationship is, the nearer they are. Such commonplace find-
ings have many possible explanations, but an obvious one that is not
mentioned or tested often by social scientists is that since intelligence
54
The Emergence of a Cognitive Elite
Cognitive Partitioning by Occupation
55
runs in families and intelligence ~redicts status, status must run in fam.
ilies. In fact, this explanation somehow manages to be both obvious and
contro~ersial.~
One useful study of family resemblance in status comes from Den-
mark and is based on several hundred men and women adopted in or
around Copenhagen between 1924 and 1947.' Four out of five of these
adopted people had been placed with their adopting families in their
first year of life; the average age of placement overall was 3 months. To
all intents and purposes, then, the adoptees shared little common en-
vironment with their biological siblings, but they shared a home envi-
ronment with their adoptive siblings. In adulthood, they were compared
with both their biological siblings and their adoptive siblings, the idea
being to see whether common genes or common home life determined
where they landed on the occupational ladder. The biologically related
siblings resembled each other in job status, even though they grew up
in different homes. And among them, the full siblings had more simi-
lar job status than the half siblings. Meanwhile, adoptive siblings were
not significantly correlated with each other in job status.[101
THE GROWTH OF HIGHeIQ PROFESSlONS
The above comments apply to all sorts of occupations, from low status
to high. But the relationship of IQ to occupations changes as the job
becomes more cognitively demanding. Almost anyone can become a
ditch digger (if he has a strong enough back); many can become cabi-
netmakers (if they have good enough small-motor skills), but only peo-
ple from a fairly narrow range of cognitive ability can become lawyers.
If lawyering pays more than cabinetmaking, what happens as the num-
ber of lawyering jobs increases, as it has in America? More people with
high IQs are diverted to lawyering, which means that they are not go-
ing to become cabinetmakers or ditch diggers.
Now imagine that process writ large, and consider what has happened
within the handful of occupations that are most highly screened for IQ,
We will concentrate here on a dozen such occupations, which we will
refer to as "high-IQ professions." Some of them have existed as long as
IQ tests and are included in the list of occupations for the 1900 census:
accountants, architects, chemists, college teachers, dentists, engineers,
lawyers, and physicians. Others have emerged more recently or are re-
labeled in more recent occupational breakdowns: computer scientists,
mathematicians, natural scientists, and social scientists.
The mean IQ of people entering those fields is about 120, give or take
a few points.11 The state of knowledge is not perfect, and the sorting
process is not precise. Different studies find slightly different means for
these occupations, with some suggesting that physicians have a mean
closer to 125, for example.'2 Theoretical physicists probably average
higher than natural scientists in general. Within each profession, the
range of scores may be large. Even an occupation with a high mean may
include individuals with modest scores; it will certainly include a sizable
proportion below its mean-50
percent of them, if the distribution is
symmetrical above and below its mean.''']
Nonetheless, 120 is a good ballpark figure for estimating the mean
person in these high-IQ professions, and it also has the advantage of
marking the cutoff point for approximately the top tenth of the entire
population in IQ." Armed with this information plus a few conjectures,
we may explore how cognitive stratification at the top of the American
labor market has changed over the years. The figure below shows the
answer for the twentieth century to date.
Once again, the portrait of American society depends on vantage
point. Let us begin with the bottom line, showing the percentage of the
entire labor force that is engaged in high-IQ professions. There has been
a proportional increase during the twentieth century, but these people
still constituted only about one out of fifteen Americans in the labor
force as of 1990.
Now consider Americans in the top 10 percent (the top decile, in
other words) in cognitive ability-everyone over the age of 25, includ-
ing housewives, the retired, and others who are not counted as being
part of the labor force. These people are represented by the middle line
in the graph. In 1900, the number of jobs in the high-IQ professions
soaked up only about one out of twenty of these talented people. By
1990, they soaked up almost five times as many, or one out of four.
Finally, consider the top line in the graph, which is limited to Arner-
icans who are in both the top decile of IQ and the labor force. In 1900,
about one out of eleven was in one of the high.IQ professions; by 1990,
more than one out of three. This still leaves almost two out of three of
them unaccounted for, but we will get to them in the next section of
the chapter.
The Rise of Cognitive Stratification
- High-IQ professions, such as law, engineering, and medicine, typically require a mean IQ of approximately 120, representing the top tenth of the population.
- Economic incentives and the expansion of professional roles have diverted high-ability individuals away from manual trades like cabinetmaking.
- In 1900, only about one out of twenty people in the top IQ decile worked in these high-IQ professions.
- By 1990, the concentration of high-ability individuals in these specific fields increased fivefold, 'soaking up' one out of four talented people.
- This trend illustrates a rapid cognitive partitioning of the American labor market, where the most intellectually gifted are increasingly clustered into a narrow set of occupations.
In 1900, the number of jobs in the high-IQ professions soaked up only about one out of twenty of these talented people. By 1990, they soaked up almost five times as many, or one out of four.
54
The Emergence of a Cognitive Elite
Cognitive Partitioning by Occupation
55
runs in families and intelligence ~redicts status, status must run in fam.
ilies. In fact, this explanation somehow manages to be both obvious and
contro~ersial.~
One useful study of family resemblance in status comes from Den-
mark and is based on several hundred men and women adopted in or
around Copenhagen between 1924 and 1947.' Four out of five of these
adopted people had been placed with their adopting families in their
first year of life; the average age of placement overall was 3 months. To
all intents and purposes, then, the adoptees shared little common en-
vironment with their biological siblings, but they shared a home envi-
ronment with their adoptive siblings. In adulthood, they were compared
with both their biological siblings and their adoptive siblings, the idea
being to see whether common genes or common home life determined
where they landed on the occupational ladder. The biologically related
siblings resembled each other in job status, even though they grew up
in different homes. And among them, the full siblings had more simi-
lar job status than the half siblings. Meanwhile, adoptive siblings were
not significantly correlated with each other in job status.[101
THE GROWTH OF HIGHeIQ PROFESSlONS
The above comments apply to all sorts of occupations, from low status
to high. But the relationship of IQ to occupations changes as the job
becomes more cognitively demanding. Almost anyone can become a
ditch digger (if he has a strong enough back); many can become cabi-
netmakers (if they have good enough small-motor skills), but only peo-
ple from a fairly narrow range of cognitive ability can become lawyers.
If lawyering pays more than cabinetmaking, what happens as the num-
ber of lawyering jobs increases, as it has in America? More people with
high IQs are diverted to lawyering, which means that they are not go-
ing to become cabinetmakers or ditch diggers.
Now imagine that process writ large, and consider what has happened
within the handful of occupations that are most highly screened for IQ,
We will concentrate here on a dozen such occupations, which we will
refer to as "high-IQ professions." Some of them have existed as long as
IQ tests and are included in the list of occupations for the 1900 census:
accountants, architects, chemists, college teachers, dentists, engineers,
lawyers, and physicians. Others have emerged more recently or are re-
labeled in more recent occupational breakdowns: computer scientists,
mathematicians, natural scientists, and social scientists.
The mean IQ of people entering those fields is about 120, give or take
a few points.11 The state of knowledge is not perfect, and the sorting
process is not precise. Different studies find slightly different means for
these occupations, with some suggesting that physicians have a mean
closer to 125, for example.'2 Theoretical physicists probably average
higher than natural scientists in general. Within each profession, the
range of scores may be large. Even an occupation with a high mean may
include individuals with modest scores; it will certainly include a sizable
proportion below its mean-50
percent of them, if the distribution is
symmetrical above and below its mean.''']
Nonetheless, 120 is a good ballpark figure for estimating the mean
person in these high-IQ professions, and it also has the advantage of
marking the cutoff point for approximately the top tenth of the entire
population in IQ." Armed with this information plus a few conjectures,
we may explore how cognitive stratification at the top of the American
labor market has changed over the years. The figure below shows the
answer for the twentieth century to date.
Once again, the portrait of American society depends on vantage
point. Let us begin with the bottom line, showing the percentage of the
entire labor force that is engaged in high-IQ professions. There has been
a proportional increase during the twentieth century, but these people
still constituted only about one out of fifteen Americans in the labor
force as of 1990.
Now consider Americans in the top 10 percent (the top decile, in
other words) in cognitive ability-everyone over the age of 25, includ-
ing housewives, the retired, and others who are not counted as being
part of the labor force. These people are represented by the middle line
in the graph. In 1900, the number of jobs in the high-IQ professions
soaked up only about one out of twenty of these talented people. By
1990, they soaked up almost five times as many, or one out of four.
Finally, consider the top line in the graph, which is limited to Arner-
icans who are in both the top decile of IQ and the labor force. In 1900,
about one out of eleven was in one of the high.IQ professions; by 1990,
more than one out of three. This still leaves almost two out of three of
them unaccounted for, but we will get to them in the next section of
the chapter.
56
The Emergence of a Cognitive Elite
Cognitive Partitioning by Occupation
5 7
The top IQ decile becomes rapidly more concentrated
in high-IQ professions from 1940 onward
People in the high-IQ occupations, expressed as a percentage of ...
40% -
... the top IQ decile in
the adult population
8
I
I
I
I
I
I
I
I t
I
I
... the total labor force
1900 1910 1920 1930 1940 1950 1960 1970 1980 1990
Source: U.S.
Bureau of the Census 1975, Table D233-682; SAVS 1981, Table 675; U.S. De-
partment of Labor, 1991, Table 22.
Note: Included are accountants, architects, chemists, college teachers, computer scientists,
dentists, engineers, lawyers, mathematicians, natural scientists, physicians, and social scien-
tists. Assumes 50 percent of persons in these professions have IQs of 120 or higher.
The specific proportions should be taken with a grain of salt, based,
as they are, on estimates of IQs within the occupations. But we have a
way of checking the 1990 estimate against actual experience, using the
National Longitudinal Survey of Youth (described fully in the intro-
duction to Part 11), and our estimate fits quite closely.[15' In any case, the
basic trends are unmistakable. Unlike the steep slopes we saw for edu-
cational changes in the first half of the century, the high-IQ professions
gained proportionally little of the working force through 1940. But af-
ter 1940, the trickle swelled to a flood, shown by the nonlinear upward
sweep of the proportion in the top IQ decile who have more recently
gone to work in this limited number of jobs.
The HigheIQ Professions and the Cognitive Elite
We have been discussing the top decile: everyone with an IQ of 120 or
higher. What about people in the even more rarefied cognitive elite, the
top fraction of a centile who are so concentrated in a handful of universi-
ties during their college years? We have little to tell us exactly what is hap-
pening now, but we know what the situation was fifty years ago, through
Lewis Terman's famous study of 1,500 higl~ly gifted children who were born
in the early 1900s and followed tl~roughout their lives. Their average IQs
were over three standard deviations above the mean, meaning that the Ter-
Inan sample represented about 1/300th of the population. As of 1940, the
members of the Terman sample who had finished their schooling were en-
gaged in high-IQ professions at three times the rate of people in the top
10 percent-24
percent for the Terman sample against 8 percent for the
top decile in 1940, as the preceding figure shows.'"f
that was the case in
1940, when fewer than one in twelve people in the top decile were work-
ing in high-IQ professions, what might be the proportion for a compara-
ble sample today? Presumably much higher, though how much higher is
impossible to estimate with the available data."7'
COGNITIVE SCREENS IN THE EXECUTIVE SUITE
The changes in our twelve high.IQ professions understate how much
occupational cognitive segregation there has been in this century. We
lack data about other professions and occupations in which mean IQ
may be comparably high (e.g., military officers, writers, journalists). But
the biggest omission involves business executives. For while the mean
IQ of all people who go into business cannot be near 120,"~~
both com-
mon sense and circumstantial evidence suggest that people who rise to
the upper echelons of large businesses tend to have high IQs and that
this tendency has increased during the course of the century.
One source of circumstantial evidence that ties success in major busi-
ness to intelligence is the past and present level of education of busi-
ness executives.['g1 In 1900, more than two-thirds of the presidents and
chairmen of America's largest corporations did not have even a college
degree-not
because many of them were poor (few had risen from out-
The Rise of Cognitive Segregation
- The proportion of high-IQ individuals entering specialized professions like law, engineering, and science shifted from a trickle to a flood after 1940.
- Historical data from the Terman study suggests that the most gifted individuals are increasingly concentrated in a narrow set of elite occupations.
- Occupational cognitive segregation is likely understated because data often excludes high-IQ roles in the military, journalism, and executive leadership.
- In 1900, a college degree was often viewed as a hindrance to business success, with two-thirds of top corporate leaders lacking a degree.
- Modern business recruitment has undergone a revolution, increasingly using educational attainment and cognitive ability as primary screens for executive roles.
But after 1940, the trickle swelled to a flood, shown by the nonlinear upward sweep of the proportion in the top IQ decile who have more recently gone to work in this limited number of jobs.
56
The Emergence of a Cognitive Elite
Cognitive Partitioning by Occupation
5 7
The top IQ decile becomes rapidly more concentrated
in high-IQ professions from 1940 onward
People in the high-IQ occupations, expressed as a percentage of ...
40% -
... the top IQ decile in
the adult population
8
I
I
I
I
I
I
I
I t
I
I
... the total labor force
1900 1910 1920 1930 1940 1950 1960 1970 1980 1990
Source: U.S.
Bureau of the Census 1975, Table D233-682; SAVS 1981, Table 675; U.S. De-
partment of Labor, 1991, Table 22.
Note: Included are accountants, architects, chemists, college teachers, computer scientists,
dentists, engineers, lawyers, mathematicians, natural scientists, physicians, and social scien-
tists. Assumes 50 percent of persons in these professions have IQs of 120 or higher.
The specific proportions should be taken with a grain of salt, based,
as they are, on estimates of IQs within the occupations. But we have a
way of checking the 1990 estimate against actual experience, using the
National Longitudinal Survey of Youth (described fully in the intro-
duction to Part 11), and our estimate fits quite closely.[15' In any case, the
basic trends are unmistakable. Unlike the steep slopes we saw for edu-
cational changes in the first half of the century, the high-IQ professions
gained proportionally little of the working force through 1940. But af-
ter 1940, the trickle swelled to a flood, shown by the nonlinear upward
sweep of the proportion in the top IQ decile who have more recently
gone to work in this limited number of jobs.
The HigheIQ Professions and the Cognitive Elite
We have been discussing the top decile: everyone with an IQ of 120 or
higher. What about people in the even more rarefied cognitive elite, the
top fraction of a centile who are so concentrated in a handful of universi-
ties during their college years? We have little to tell us exactly what is hap-
pening now, but we know what the situation was fifty years ago, through
Lewis Terman's famous study of 1,500 higl~ly gifted children who were born
in the early 1900s and followed tl~roughout their lives. Their average IQs
were over three standard deviations above the mean, meaning that the Ter-
Inan sample represented about 1/300th of the population. As of 1940, the
members of the Terman sample who had finished their schooling were en-
gaged in high-IQ professions at three times the rate of people in the top
10 percent-24
percent for the Terman sample against 8 percent for the
top decile in 1940, as the preceding figure shows.'"f
that was the case in
1940, when fewer than one in twelve people in the top decile were work-
ing in high-IQ professions, what might be the proportion for a compara-
ble sample today? Presumably much higher, though how much higher is
impossible to estimate with the available data."7'
COGNITIVE SCREENS IN THE EXECUTIVE SUITE
The changes in our twelve high.IQ professions understate how much
occupational cognitive segregation there has been in this century. We
lack data about other professions and occupations in which mean IQ
may be comparably high (e.g., military officers, writers, journalists). But
the biggest omission involves business executives. For while the mean
IQ of all people who go into business cannot be near 120,"~~
both com-
mon sense and circumstantial evidence suggest that people who rise to
the upper echelons of large businesses tend to have high IQs and that
this tendency has increased during the course of the century.
One source of circumstantial evidence that ties success in major busi-
ness to intelligence is the past and present level of education of busi-
ness executives.['g1 In 1900, more than two-thirds of the presidents and
chairmen of America's largest corporations did not have even a college
degree-not
because many of them were poor (few had risen from out-
58
The Emergence of a Cognitive Elite
Cognitive Partitioning by Occupation
59
right poverty) but because a college degree was not considered impor-
tant for running a business.20 A Wall Street tycoon (himself a Harvard
alumnus) writing in 1908 advised parents that "practical business is the
best school and college" for their sons who sought a business career and
that, indeed, a college education "is in many instances not only a hin-
drance, but absolutely fatal to success."21
The lack of a college education does not mean that senior executives
of 1900 were necessarily less bright than their counterparts in 1990. But
other evidence points to a revolution in the recruitment of senior ex-
ecutives that was not much different from the revolution in educational
stratification that began in the 1950s. In 1900, the CEO of a large com-
pany was likely to be the archetype of the privileged capitalist elite that
C. Wright Mills described in The Power Elite: born into affluence, the
son of a business executive or a professional person, not only a WASP
but an Episcopalian WASP.22 In 1950, it was much the same. The fa-
thers' occupations were about the same as they had been in 1900, with
over 70 percent having been business executives or professionals, and,
while Protestantism was less overwhelmingly dominant than it had been
in 1900, it remained the right religion, with Episcopalianism still being
the rightest of all. Fewer CEOs in 1950 had been born into wealthy fam-
ilies (down from almost half in 1900 to about a third), but they were
continuing to be drawn primarily from the economically comfortable
part of the population. The proportion coming from poor families had
not changed. Many CEOs in the first half of the century had their jobs
because their family's name was on the sign above the factory door; many
had reached their eminent positions only because they did not have to
compete against more able people who were excluded from the compe-
tition for lack of the right religion, skin color, national origin, or fam.
ily connections.
In the next twenty-five years, the picture changed. The proportion
of CEOs who came from wealthy families had dropped from almost half
in 1900 and a third in 1950 to 5.5 percent by 1976.23 The CEO of 1976
was still disproportionately likely to be Episcopalian but much less so
than in 1900-and
by 1976 he was also disproportionately likely to be
Jewish, unheard of in 1920 or earlier. In short, social and economic back-
ground was no longer nearly as important in 1976 as in the first half of
the century. Educational level was becoming the high road to the ex-
ecutive suite at the same time that education was becoming more de-
In fifty years, the education of the typical CEO
increases from high school to graduate school
Percentage of CEOs with ...
70% -
... no more than a
high school diploma
... bachelqr' s degree /
. . .graduatk training
0%
I
I
I
I
1900
1925
1950
1976
Source: Burck 1976, p. 172; Newcomer 1955, Table 24.
pendent on cognitive ability, as Chapter 1 showed. The figure above
traces the change in highest educational attainment from 1900 to 1976
for CEOs of the largest U.S. companies.
The timing of the changes is instructive. The decline of the high
school-educated chief executive was fairly steady rhroughout the period.
College-educated CEOs surged into the executive suite in the
1925-1950 period. But as in the case of educational stratification, the
most dramatic shift occurred after 1950, represented by the skyrocket-
ing proportion of chief executives who had attended graduate scho01.'~"
By 1976,40 percent of the Fortune 500 companies were headed by in-
dividuals whose background was in finance or law, fields of study that
are highly screened for intelligence. So we are left with this conserva-
tive interpretation: Nobody knows what the IQ mean or distribution
was for executives at the turn of the century, but it is clear that, as of
the 1990s, the cognitive screens were up. How far up? The broad enve-
lope of possibilities suggests that senior business executives soak up a
large proportion of the top IQ decile who are not engaged in the dozen
The Rise of Cognitive Meritocracy
- From 1900 to 1950, the American corporate elite was defined by inherited wealth, social connections, and specific religious affiliations like Episcopalianism.
- By 1976, the influence of family background plummeted, with CEOs from wealthy families dropping from nearly half to only 5.5 percent.
- Educational attainment replaced social pedigree as the primary path to the executive suite, shifting from high school diplomas to graduate degrees.
- The post-1950 era saw a surge in CEOs with backgrounds in finance and law, fields that act as rigorous cognitive screens for high intelligence.
- Modern executive selection functions as a 'cognitive partition,' drawing heavily from the top decile of the IQ distribution.
- The transition represents a shift from a closed capitalist elite to a meritocracy based on cognitive ability and academic credentials.
Many had reached their eminent positions only because they did not have to compete against more able people who were excluded from the competition for lack of the right religion, skin color, national origin, or family connections.
58
The Emergence of a Cognitive Elite
Cognitive Partitioning by Occupation
59
right poverty) but because a college degree was not considered impor-
tant for running a business.20 A Wall Street tycoon (himself a Harvard
alumnus) writing in 1908 advised parents that "practical business is the
best school and college" for their sons who sought a business career and
that, indeed, a college education "is in many instances not only a hin-
drance, but absolutely fatal to success."21
The lack of a college education does not mean that senior executives
of 1900 were necessarily less bright than their counterparts in 1990. But
other evidence points to a revolution in the recruitment of senior ex-
ecutives that was not much different from the revolution in educational
stratification that began in the 1950s. In 1900, the CEO of a large com-
pany was likely to be the archetype of the privileged capitalist elite that
C. Wright Mills described in The Power Elite: born into affluence, the
son of a business executive or a professional person, not only a WASP
but an Episcopalian WASP.22 In 1950, it was much the same. The fa-
thers' occupations were about the same as they had been in 1900, with
over 70 percent having been business executives or professionals, and,
while Protestantism was less overwhelmingly dominant than it had been
in 1900, it remained the right religion, with Episcopalianism still being
the rightest of all. Fewer CEOs in 1950 had been born into wealthy fam-
ilies (down from almost half in 1900 to about a third), but they were
continuing to be drawn primarily from the economically comfortable
part of the population. The proportion coming from poor families had
not changed. Many CEOs in the first half of the century had their jobs
because their family's name was on the sign above the factory door; many
had reached their eminent positions only because they did not have to
compete against more able people who were excluded from the compe-
tition for lack of the right religion, skin color, national origin, or fam.
ily connections.
In the next twenty-five years, the picture changed. The proportion
of CEOs who came from wealthy families had dropped from almost half
in 1900 and a third in 1950 to 5.5 percent by 1976.23 The CEO of 1976
was still disproportionately likely to be Episcopalian but much less so
than in 1900-and
by 1976 he was also disproportionately likely to be
Jewish, unheard of in 1920 or earlier. In short, social and economic back-
ground was no longer nearly as important in 1976 as in the first half of
the century. Educational level was becoming the high road to the ex-
ecutive suite at the same time that education was becoming more de-
In fifty years, the education of the typical CEO
increases from high school to graduate school
Percentage of CEOs with ...
70% -
... no more than a
high school diploma
... bachelqr' s degree /
. . .graduatk training
0%
I
I
I
I
1900
1925
1950
1976
Source: Burck 1976, p. 172; Newcomer 1955, Table 24.
pendent on cognitive ability, as Chapter 1 showed. The figure above
traces the change in highest educational attainment from 1900 to 1976
for CEOs of the largest U.S. companies.
The timing of the changes is instructive. The decline of the high
school-educated chief executive was fairly steady rhroughout the period.
College-educated CEOs surged into the executive suite in the
1925-1950 period. But as in the case of educational stratification, the
most dramatic shift occurred after 1950, represented by the skyrocket-
ing proportion of chief executives who had attended graduate scho01.'~"
By 1976,40 percent of the Fortune 500 companies were headed by in-
dividuals whose background was in finance or law, fields of study that
are highly screened for intelligence. So we are left with this conserva-
tive interpretation: Nobody knows what the IQ mean or distribution
was for executives at the turn of the century, but it is clear that, as of
the 1990s, the cognitive screens were up. How far up? The broad enve-
lope of possibilities suggests that senior business executives soak up a
large proportion of the top IQ decile who are not engaged in the dozen
60
The Emergence o f a Cognitive Elite
Cognitive Partitioning by Occupation
61
high-IQ professions. The constraints leave no other ~ossibility. Here are
the constraints and the arithmetic:
In 1990, the resident population ages 25 to 64 (the age group in which
the vast majority of people working in high-IQ professions fall) con-
sisted of 127 millionpeople.25 By definition, the top IQ decile thus con-
sisted of 12.7 million people. The labor force of persons aged 25 to 64
consisted of 100 million people. The smartest working-age people are
disproportionately likely to be in the labor force (especially since career
opportunities have opened up for women). As a working assumption,
suppose that the labor force of 100 million included 11 million of the
12.7 million people in the top IQ decile.
We already know that 7.3 million people worked in the high-IQ pro-
fessions that year and have reason to believe that about half of those
(3.65 million) have IQs of 120 or more. Subtracting 3.65 million from
11 million leaves us with about 7.4 million people in the labor force
with IQs of 120 or more unaccounted for. Meanwhile, 12.9 million peo.
ple were classified in 1980 as working in executive, administrative, and
managerial positions.'261 A high proportion of people in those positions
graduated from college, one screen. They have risen in the corporate
hierarchy over the course of their careers, which is probably another
screen for IQ. What is their mean IQ? There is no precise answer. Stud*
ies suggest that the mean for the job category including all white-collar
and professionals is around 107, but that category is far broader than the
one we have in mind. Moreover, the mean IQ of four-year college grad*
uates in general was estimated at about 115 in 1972, and senior execu-
tives probably have a mean above that average.27
At this point, we are left with startlingly little room for maneuver.
How many of those 12.9 million people in executive, administrative,
and managerial positions have IQs above 1201 Any plausible assump-
tion digs deep into the 7.4 million people with IQs of 120 or more who
are not already engaged in one of the other high4Q professions and
leaves us with an extremely high proportion of people of the labor force
with IQs above 120 who are already working in a high-IQ profession or
in an executive or managerial position. One could easily make a case
that the figure is in the neighborhood of 70 to 80 percent.
Cognitive sorting has become highly efficient in the last half century,
but has it really become that efficient? We cannot answer definitely yes,
bur it is difficult to work back through the logic and come up with good
reasons for thinking that the estimates are far off the mark.
It is not profitable to push much further along this line because the
uncertainties become too great, but the main point is solidly established
in any case: In midcentury, America was still a society in which a large
proportion of the top tenth of IQ, probably a majority, were scattered
throughout the population, not working in a high-IQ profession and not
in a managerial position. As the century draws to a close, some very high
proportion of that same group is concentrated within those highly
screened jobs.
The Efficiency of Cognitive Sorting
- Statistical analysis suggests that a vast majority of individuals in the top IQ decile are now concentrated in high-IQ professions or managerial roles.
- Historical shifts show that in the mid-20th century, high-IQ individuals were more evenly scattered throughout various levels of the workforce.
- Modern corporate hierarchies and college graduation requirements act as effective screens that filter for higher cognitive ability.
- While education is the fashionable explanation for occupational placement, the underlying driver is the inherent proficiency of smarter employees.
- The concentration of cognitive talent into specific sectors has reached a point where 70 to 80 percent of the top IQ tier may already be 'captured' by elite professions.
At this point, we are left with startlingly little room for maneuver.
60
The Emergence o f a Cognitive Elite
Cognitive Partitioning by Occupation
61
high-IQ professions. The constraints leave no other ~ossibility. Here are
the constraints and the arithmetic:
In 1990, the resident population ages 25 to 64 (the age group in which
the vast majority of people working in high-IQ professions fall) con-
sisted of 127 millionpeople.25 By definition, the top IQ decile thus con-
sisted of 12.7 million people. The labor force of persons aged 25 to 64
consisted of 100 million people. The smartest working-age people are
disproportionately likely to be in the labor force (especially since career
opportunities have opened up for women). As a working assumption,
suppose that the labor force of 100 million included 11 million of the
12.7 million people in the top IQ decile.
We already know that 7.3 million people worked in the high-IQ pro-
fessions that year and have reason to believe that about half of those
(3.65 million) have IQs of 120 or more. Subtracting 3.65 million from
11 million leaves us with about 7.4 million people in the labor force
with IQs of 120 or more unaccounted for. Meanwhile, 12.9 million peo.
ple were classified in 1980 as working in executive, administrative, and
managerial positions.'261 A high proportion of people in those positions
graduated from college, one screen. They have risen in the corporate
hierarchy over the course of their careers, which is probably another
screen for IQ. What is their mean IQ? There is no precise answer. Stud*
ies suggest that the mean for the job category including all white-collar
and professionals is around 107, but that category is far broader than the
one we have in mind. Moreover, the mean IQ of four-year college grad*
uates in general was estimated at about 115 in 1972, and senior execu-
tives probably have a mean above that average.27
At this point, we are left with startlingly little room for maneuver.
How many of those 12.9 million people in executive, administrative,
and managerial positions have IQs above 1201 Any plausible assump-
tion digs deep into the 7.4 million people with IQs of 120 or more who
are not already engaged in one of the other high4Q professions and
leaves us with an extremely high proportion of people of the labor force
with IQs above 120 who are already working in a high-IQ profession or
in an executive or managerial position. One could easily make a case
that the figure is in the neighborhood of 70 to 80 percent.
Cognitive sorting has become highly efficient in the last half century,
but has it really become that efficient? We cannot answer definitely yes,
bur it is difficult to work back through the logic and come up with good
reasons for thinking that the estimates are far off the mark.
It is not profitable to push much further along this line because the
uncertainties become too great, but the main point is solidly established
in any case: In midcentury, America was still a society in which a large
proportion of the top tenth of IQ, probably a majority, were scattered
throughout the population, not working in a high-IQ profession and not
in a managerial position. As the century draws to a close, some very high
proportion of that same group is concentrated within those highly
screened jobs.
Chapter 3
The Economic Pressure
to Partition
What accounts for the way that people with different levels of IQ end up in
different occupations? The fashionable explanation has been education. Peo-
ple with high SAT scores get into the best colleges; people with the high GRE,
MCAT, or LSAT test scores get into professional and graduate schools; and
the education defines the occupation. The SAT score becomes unimportant
once the youngster has gotten into the right college or graduate school.
Without doubt, education is part of the explanation; physicians need a high
IQ to get into medical school, but they also need to learn the material that
medical school teaches before they can be physicians. Plenty of hollow me-
dentialing goes on as well, if not in medicine then in other occupations, as the
educational degree becomes a ticket for jobs that could be done just as well by
people without the degree.
But the relationship of cognitive ability to job performancegoes beyond that.
A smarter employee is, on the average, amore proficient employee. This holds
true within professions: Lawyers with higher 1Qs are, on the average, more
productive than lawyers with lower IQs. It holds true for skilled blue-collar
jobs: Carpenters with high IQs are also (on average) more productive than
carpenters with lower IQs. The relationship holds, although weakly, even
among people in unskilled manual jobs.
The magnitude of the relationship between cognitive ability and job per-
formance is greater than once thought. A &od of new analyses during the
1980s established several points with large economic and policy implications:
Test scores predict job performance because they measure g, Spearman's
general intelligence factor, not because they identify "aptitude" for a specific
job. Any broad test of general intelligence predicts proficiency in most com-
mon occupations, and does so more accurately than tests that are narrowly
constructed around the job's specific tasks.
Intelligence and Job Performance
- High IQ correlates with increased productivity across all job types, from skilled professions like law to manual labor.
- General intelligence (g) is a more accurate predictor of job proficiency than specific aptitude tests or traditional hiring metrics like interviews and transcripts.
- The economic advantage of hiring high-IQ employees is significant, leading to a more efficient economy when employers are free to select based on cognitive ability.
- Legal restrictions since 1971 have limited the use of intelligence tests in American hiring, creating a tension between policy and economic efficiency.
- The text explores whether the value of IQ in the workplace is inherent or merely a byproduct of educational credentials and social stratification.
- Despite legal prohibitions, the inherent relationship between cognitive ability and job performance remains a persistent economic reality.
Laws can make the economy less efficient by forbidding employers to rue intelligence tests, but laws cannot make intelligence unimportant.
Chapter 3
The Economic Pressure
to Partition
What accounts for the way that people with different levels of IQ end up in
different occupations? The fashionable explanation has been education. Peo-
ple with high SAT scores get into the best colleges; people with the high GRE,
MCAT, or LSAT test scores get into professional and graduate schools; and
the education defines the occupation. The SAT score becomes unimportant
once the youngster has gotten into the right college or graduate school.
Without doubt, education is part of the explanation; physicians need a high
IQ to get into medical school, but they also need to learn the material that
medical school teaches before they can be physicians. Plenty of hollow me-
dentialing goes on as well, if not in medicine then in other occupations, as the
educational degree becomes a ticket for jobs that could be done just as well by
people without the degree.
But the relationship of cognitive ability to job performancegoes beyond that.
A smarter employee is, on the average, amore proficient employee. This holds
true within professions: Lawyers with higher 1Qs are, on the average, more
productive than lawyers with lower IQs. It holds true for skilled blue-collar
jobs: Carpenters with high IQs are also (on average) more productive than
carpenters with lower IQs. The relationship holds, although weakly, even
among people in unskilled manual jobs.
The magnitude of the relationship between cognitive ability and job per-
formance is greater than once thought. A &od of new analyses during the
1980s established several points with large economic and policy implications:
Test scores predict job performance because they measure g, Spearman's
general intelligence factor, not because they identify "aptitude" for a specific
job. Any broad test of general intelligence predicts proficiency in most com-
mon occupations, and does so more accurately than tests that are narrowly
constructed around the job's specific tasks.
64
The Emergence of a Cognitive Elite
The Economic Pressure to Partition
65
The advantage confened by 1Q is long-lasting. Much remains to be
learned, but usually the smarter employee tends to remain more productive
than the less smart employee even after years on the job.
An IQ score is a better predictor of job productivity than a job interview,
reference checks, or college transcript.
Most sweepingly important, an employer that is free to pick among appli-
cants can realize large economic gains from hiring those with the highest 1Qs.
An economy that leu employers pick applicants with the highest lQs is a sig-
nificantly more efficient economy. Herein lies the policy problem: Since 1971 ,
Congress and the Supreme Court have effectively forbidden American em-
ployers from hiring based on intelligence tests. How much does this policy cost
the economy? Calculating the answer is complex, so estimates vary widely,
from what one authority thinks war a lower-bound estimate of $80 billion in
1980 to whot another authority called an upper-bound estimate of $13 billion
for that year,
Our main point has nothing to do with deciding how large the loss is or how
kzrge the gain would be if intelligence tests could be freely used for hiring.
Rather, it is simply that intelligence itself is importantly related to job oerfor-
mance. Laws can make the economy less efficient by forbidding employers to
rue intelligence tests, but laws cannot make intelligence unimportant.
o this point in the discussion, the forces that sort people into jobs
Taccording to their cognitive ability remain ambiguous. There are
three main possibilities, hinted at in the previous chapter but not as-
sessed.
The first is the standard one: IQ really reflects education. Education
imparts skills and knowledge-reading,
writing, doing arithmetic,
knowing some facts. The skills and knowledge are valuable in the work-
place, so employers prefer to hire educated people. Perhaps IQ, in and
of itself, has something to do with people's performance at work, but
probably not much. Education itself is the key. More is better, for just
about everybody, to just about any level.
The second possibility is that IQ is correlated with job status because
we live in a world of artificial credentials. The artisan guilds of old were
replaced somewhere along the way by college or graduate degrees. Most
parents want to see their children get at least as much education as
they got, in part because they want their children to profit from
the valuable credentials. As the society becomes richer, more child-
ren get more education. As it happens, education screens for IQ,
but that is largely incidental to job performance. The job market, in
turn, screens for educational credentials. So cognitive stratification
occurs in the workplace, but it reflects the premium put on educa-
tion, not on anything inherent in either education or cognitive ability
itself.
The third possibility is that cognitive ability itself-sheer
intellec-
tual horsepower, independent of education-has
market value, Seen
from this perspective, the college degree is not a credential but an in-
direct measure of intelligence. People with college degrees tend to be
smarter than people without them and, by extension, more valuable in
the marketplace. Employers recruit at Stanford or Yale not because grad-
uates of those schools know more than graduates of less prestigious
schools but for the same generic reason that Willie Sutton gave for rob-
bing banks. Places like Stanford and Yale are where you find the coin
of cognitive talent.
The first two explanations have some validity for some occupations.
Even the brightest child needs formal education, and some jobs require
many years of advanced training. The problem of credentialing is wide-
spread and real: the B.A, is a bogus requirement for many management
jobs, the requirement for teaching certificates often impedes hiring good
teachers in elementary and secondary schools, and the Ph.D. is irrele-
vant to the work that many Ph.D.s really do.
But whatever the mix of truth and fiction in the first two explana-
tions, the third explanation is almost always relevant and almost always
ignored. The process described in the previous chapter is driven by a
characteristic of cognitive ability that is at once little recognized and
essential for understanding how society is evolving: intelligence is fun-
damentally related to productivity. This relationship holds not only for
highly skilled professions but for jobs across the spectrum. The power of
the relationship is sufficient to give every business some incentive to
use IQ as an important selection criterion.
That in brief is the thesis of the chapter. We begin by reviewing the
received wisdom about the links between IQ and success in life, then
the evidence specifically linking cognitive ability to job productivity.
Intelligence and Economic Productivity
- A college degree often serves as an indirect measure of cognitive talent rather than a specific credential of acquired knowledge.
- Elite universities like Stanford and Yale act as hubs where employers 'rob the bank' for high-level cognitive ability.
- Credentialing requirements, such as the B.A. or Ph.D., are frequently irrelevant to the actual tasks performed in many professional roles.
- Intelligence is fundamentally linked to productivity across the entire job spectrum, creating a strong business incentive to use IQ as a selection tool.
- While test scores like the SAT may not predict individual success within a high-achieving group like Harvard, they remain powerful indicators of general economic partitioning.
Places like Stanford and Yale are where you find the coin of cognitive talent.
64
The Emergence of a Cognitive Elite
The Economic Pressure to Partition
65
The advantage confened by 1Q is long-lasting. Much remains to be
learned, but usually the smarter employee tends to remain more productive
than the less smart employee even after years on the job.
An IQ score is a better predictor of job productivity than a job interview,
reference checks, or college transcript.
Most sweepingly important, an employer that is free to pick among appli-
cants can realize large economic gains from hiring those with the highest 1Qs.
An economy that leu employers pick applicants with the highest lQs is a sig-
nificantly more efficient economy. Herein lies the policy problem: Since 1971 ,
Congress and the Supreme Court have effectively forbidden American em-
ployers from hiring based on intelligence tests. How much does this policy cost
the economy? Calculating the answer is complex, so estimates vary widely,
from what one authority thinks war a lower-bound estimate of $80 billion in
1980 to whot another authority called an upper-bound estimate of $13 billion
for that year,
Our main point has nothing to do with deciding how large the loss is or how
kzrge the gain would be if intelligence tests could be freely used for hiring.
Rather, it is simply that intelligence itself is importantly related to job oerfor-
mance. Laws can make the economy less efficient by forbidding employers to
rue intelligence tests, but laws cannot make intelligence unimportant.
o this point in the discussion, the forces that sort people into jobs
Taccording to their cognitive ability remain ambiguous. There are
three main possibilities, hinted at in the previous chapter but not as-
sessed.
The first is the standard one: IQ really reflects education. Education
imparts skills and knowledge-reading,
writing, doing arithmetic,
knowing some facts. The skills and knowledge are valuable in the work-
place, so employers prefer to hire educated people. Perhaps IQ, in and
of itself, has something to do with people's performance at work, but
probably not much. Education itself is the key. More is better, for just
about everybody, to just about any level.
The second possibility is that IQ is correlated with job status because
we live in a world of artificial credentials. The artisan guilds of old were
replaced somewhere along the way by college or graduate degrees. Most
parents want to see their children get at least as much education as
they got, in part because they want their children to profit from
the valuable credentials. As the society becomes richer, more child-
ren get more education. As it happens, education screens for IQ,
but that is largely incidental to job performance. The job market, in
turn, screens for educational credentials. So cognitive stratification
occurs in the workplace, but it reflects the premium put on educa-
tion, not on anything inherent in either education or cognitive ability
itself.
The third possibility is that cognitive ability itself-sheer
intellec-
tual horsepower, independent of education-has
market value, Seen
from this perspective, the college degree is not a credential but an in-
direct measure of intelligence. People with college degrees tend to be
smarter than people without them and, by extension, more valuable in
the marketplace. Employers recruit at Stanford or Yale not because grad-
uates of those schools know more than graduates of less prestigious
schools but for the same generic reason that Willie Sutton gave for rob-
bing banks. Places like Stanford and Yale are where you find the coin
of cognitive talent.
The first two explanations have some validity for some occupations.
Even the brightest child needs formal education, and some jobs require
many years of advanced training. The problem of credentialing is wide-
spread and real: the B.A, is a bogus requirement for many management
jobs, the requirement for teaching certificates often impedes hiring good
teachers in elementary and secondary schools, and the Ph.D. is irrele-
vant to the work that many Ph.D.s really do.
But whatever the mix of truth and fiction in the first two explana-
tions, the third explanation is almost always relevant and almost always
ignored. The process described in the previous chapter is driven by a
characteristic of cognitive ability that is at once little recognized and
essential for understanding how society is evolving: intelligence is fun-
damentally related to productivity. This relationship holds not only for
highly skilled professions but for jobs across the spectrum. The power of
the relationship is sufficient to give every business some incentive to
use IQ as an important selection criterion.
That in brief is the thesis of the chapter. We begin by reviewing the
received wisdom about the links between IQ and success in life, then
the evidence specifically linking cognitive ability to job productivity.
66
The Emergence ofa Cognitive Elite
The Economic Pressure to Partition
67
THE RECEIVED WISDOM
"Test scores have a modest correlation with first-year grades and no cor-
relation at all with what you do in the rest of your life," wrote Derek
Bok, then president of Harvard University, in 1985, referring to the
SATs that all Harvard applicants take.''] Bok was poetically correct in
ways that a college president understandably wants to emphasize. A 17-
year+old who has gotten back a disappointing SAT score should not
think that the future is bleak. Perhaps a freshman with an SAT math
score of 500 had better not have his heart set on being a mathemati-
cian, but if instead he wants to run his own business, become a U.S. sen-
ator, or make a million dollars, he should not put aside those dreams
because some of his friends have higher scores. The link between test
scores and those achievements is dwarfed by the totality of other char-
acteristics that h e brings to his life, and that's the fact that individuals
should remember when they look at their test scores. Bok was correct
in that, for practical purposes, the futures of most of the 18-year-olds
that he was addressing are open to most of the possibilities that attract
them.
President Bok was also technically correct about the students at his
own university. If one were to assemble the SATs of the incoming fresh-
men at Harvard and twenty years later match those scores against some
quantitative measure of professional success, the impact could be mod-
est, for reasons we shall discuss. Indeed, if the measure of success was
the most obvious one, cash income, then the relationship between IQ
and success among Harvard graduates could be less than modest; it could
be nil or even negative.IZ1
Finally, President Bok could assert that test scores were meaningless
as predictors of what you do in the rest of your life without fear of con-
tradiction, because he was expressing what "everyone knows" about test
scores and success. The received wisdom, promulgated not only in fea-
ture stories in the press but codified in landmark Supreme Court deci-
sions, has held that, first of all, the relation between 1Q scores and job
performance is weak, and, second, whatever weak relationship there is
depends not o n general intellectual capacity but on the particular men-
tal capacities or skills required by a particular job.I3l
There have been several reasons for the broad acceptance of the con-
clusions President Bok drew. Briefly:
A Primer on the Correlation Coefficient
We have periodically mentioned the "correlation coefficient" without say-
ing much except that it varies from -1 to +l. It is time for a bit more de-
tail, with even more to be found in Appendix 1. As in the case of standard
deviations, we urge readers who shy from statistics to take the few minutes
required to understand the concept. The nature of "correlation" will be in-
creasingly important as we go along.
A correlation coefficient represents the degree to which one phenom-
enon is linked to another. Height and weight, for example, have a positive
correlation (the taller, the heavier, usually). A positive correlation is one
that falls between zero and +l, with + 1 being an absolutely reliable, linear
relationship. A negative correlation falls between 0 and -1, with -1 also
representing an absolutely reliable, linear relationship, but in the inverse
direction. A correlation of 0 means no linear relationship what~oever!~'
A crucial point to keep in mind about correlation coefficients, now and
throughout the rest of the book, is that correlations in the social sciences
are seldom much higher than .5 (or lower than -.5) and often much
weaker-because social events are imprecisely measured and are usually af.
fected by variables besides the ones that happened to be included in any
particular body of data. A correlation of .2 can nevertheless be "big" for
many social science topics. In terms of social phenomena, modest correla-
tions can produce large aggregate effects. Witness the prosperity of casinos
despite the statistically modest edge they hold over their customers.
Moderate correhtions mean many exceptions. We all know people who
do not seem all that smart but who handle their jobs much more effec-
tively than colleagues who probably have more raw intelligence. The
correlations between IQ and various job-related measures are generally
in the .2 to .6 range. Throughout the rest of the book, keep the follow-
ing figure in mind, for it is what a highly significant correlation in the
social sciences looks like. The figure uses actual data from a randomly
selected 1 percent of a nationally representative sample, using two vari-
ables that are universally acknowledged to have a large and socially im.
portant relationship, income and education, with the line showing the
expected change in income for each increment in years of education."'
For this sample, the correlation was a statistically significant .33, and
the expected value of an additional year of education was an additional
$2,800 in family income-a
major substantive increase. Yet look at how
Understanding the Correlation Coefficient
- The relationship between IQ scores and job performance is often debated, with some arguing it depends more on specific job skills than general intelligence.
- A correlation coefficient measures the degree of linkage between two phenomena, ranging from -1 to +1, where 0 indicates no linear relationship.
- In the social sciences, correlations are rarely higher than .5 due to imprecise measurements and the influence of numerous external variables.
- Even modest correlations, such as .2 or .33, can result in significant aggregate social effects, much like the house edge in a casino.
- A correlation of .33 between education and income shows a clear trend but also reveals vast individual exceptions across the data spectrum.
Witness the prosperity of casinos despite the statistically modest edge they hold over their customers.
66
The Emergence ofa Cognitive Elite
The Economic Pressure to Partition
67
THE RECEIVED WISDOM
"Test scores have a modest correlation with first-year grades and no cor-
relation at all with what you do in the rest of your life," wrote Derek
Bok, then president of Harvard University, in 1985, referring to the
SATs that all Harvard applicants take.''] Bok was poetically correct in
ways that a college president understandably wants to emphasize. A 17-
year+old who has gotten back a disappointing SAT score should not
think that the future is bleak. Perhaps a freshman with an SAT math
score of 500 had better not have his heart set on being a mathemati-
cian, but if instead he wants to run his own business, become a U.S. sen-
ator, or make a million dollars, he should not put aside those dreams
because some of his friends have higher scores. The link between test
scores and those achievements is dwarfed by the totality of other char-
acteristics that h e brings to his life, and that's the fact that individuals
should remember when they look at their test scores. Bok was correct
in that, for practical purposes, the futures of most of the 18-year-olds
that he was addressing are open to most of the possibilities that attract
them.
President Bok was also technically correct about the students at his
own university. If one were to assemble the SATs of the incoming fresh-
men at Harvard and twenty years later match those scores against some
quantitative measure of professional success, the impact could be mod-
est, for reasons we shall discuss. Indeed, if the measure of success was
the most obvious one, cash income, then the relationship between IQ
and success among Harvard graduates could be less than modest; it could
be nil or even negative.IZ1
Finally, President Bok could assert that test scores were meaningless
as predictors of what you do in the rest of your life without fear of con-
tradiction, because he was expressing what "everyone knows" about test
scores and success. The received wisdom, promulgated not only in fea-
ture stories in the press but codified in landmark Supreme Court deci-
sions, has held that, first of all, the relation between 1Q scores and job
performance is weak, and, second, whatever weak relationship there is
depends not o n general intellectual capacity but on the particular men-
tal capacities or skills required by a particular job.I3l
There have been several reasons for the broad acceptance of the con-
clusions President Bok drew. Briefly:
A Primer on the Correlation Coefficient
We have periodically mentioned the "correlation coefficient" without say-
ing much except that it varies from -1 to +l. It is time for a bit more de-
tail, with even more to be found in Appendix 1. As in the case of standard
deviations, we urge readers who shy from statistics to take the few minutes
required to understand the concept. The nature of "correlation" will be in-
creasingly important as we go along.
A correlation coefficient represents the degree to which one phenom-
enon is linked to another. Height and weight, for example, have a positive
correlation (the taller, the heavier, usually). A positive correlation is one
that falls between zero and +l, with + 1 being an absolutely reliable, linear
relationship. A negative correlation falls between 0 and -1, with -1 also
representing an absolutely reliable, linear relationship, but in the inverse
direction. A correlation of 0 means no linear relationship what~oever!~'
A crucial point to keep in mind about correlation coefficients, now and
throughout the rest of the book, is that correlations in the social sciences
are seldom much higher than .5 (or lower than -.5) and often much
weaker-because social events are imprecisely measured and are usually af.
fected by variables besides the ones that happened to be included in any
particular body of data. A correlation of .2 can nevertheless be "big" for
many social science topics. In terms of social phenomena, modest correla-
tions can produce large aggregate effects. Witness the prosperity of casinos
despite the statistically modest edge they hold over their customers.
Moderate correhtions mean many exceptions. We all know people who
do not seem all that smart but who handle their jobs much more effec-
tively than colleagues who probably have more raw intelligence. The
correlations between IQ and various job-related measures are generally
in the .2 to .6 range. Throughout the rest of the book, keep the follow-
ing figure in mind, for it is what a highly significant correlation in the
social sciences looks like. The figure uses actual data from a randomly
selected 1 percent of a nationally representative sample, using two vari-
ables that are universally acknowledged to have a large and socially im.
portant relationship, income and education, with the line showing the
expected change in income for each increment in years of education."'
For this sample, the correlation was a statistically significant .33, and
the expected value of an additional year of education was an additional
$2,800 in family income-a
major substantive increase. Yet look at how
68
The Emergence of a Cognitive Elite
The Economic Pressure to Partition
69
The variation among individuals that lies
behind a significant correlation coefficient
Annual income (thousands of 1990 dollars)
80 -
70 -
.
60 -
•
.
0
.
Correlation: +.33
50 -
. . ,
.
40 -
Expected increase in --
income
education:
per $2,800
year of
20-
.
.
10-
; : : + i
I
.
0 ,
a
.
I
I
1
I
I
I
6
8
10
12
14
16
18
Years of education
numerous are the exceptions; note especially how people with twelfth.
grade educations are spread out all along the income continuum, For
virtually every topic we will be discussing throughout the rest of the book, n
plot of the raw data would reveal as many or more exceptions to the general
statistical relationship, and this must always be remembered in trying to trans-
late the general ruk to individuals.
The exceptions associated with modest correlations mean that a wide
range of IQ scores can be observed in almost any job, including com-
plex jobs such as engineer or physician, a fact that provides President
Bok and other critics of the importance of IQ with an abundant supply
of exceptions to any general relationship. The exceptions do not inval-
idate the importance of a statistically significant correlation.
Restriction of range. In any particular job setting, there is a restricted
range of cognitive ability, and the relationship between IQ scores and
job performance is probably very weak in that setting. Forget about IQ
for a moment and think about weight as a qualification for being an of+
fensive tackle in the National Football League. The All-Pro probably is
not the heaviest player. On the other hand, the lightest tackle in the
league weighs about 250 pounds. That is what we mean by restriction
of range. In terms of correlation coefficients, if we were to rate the per-
formance of every NFL offensive tackle and then correlate those ratings
with their weights, the result would probably be a correlation near zero.
Should we then approach the head coaches of the NFL and recommend
that they try out a superbly talented 150.pound athlete at offensive
tackle? The answer is no. We would be right in concluding that perfor-
mance does not correlate much with weight among NFL tackles, whose
weights range upward from around 250, but not about the correlation
in the general population. Imagine a sample of ordinary people drawn
from the general population and inserted into an offensive line, The
correlation between the performance of these people as tackles in foot*
ball games and their weights would be large indeed. The difference be-
tween these two correlations-one for the actual tackles in the NFL and
the other a hypothetical one for people at large-illustrates
the impact
of restriction of range on correlation coefficient^.[^]
Confusion between a credential and a comelation. Would it be silly to
require someone to have a minimum score on an IQ test to get a license
as a barber? Yes. Is it nonetheless possible that IQ scores are correlated
with barbering skills? Yes. Later in the chapter, we discuss the economic
pros and cons of using a weakly correlated score as a credential for hir-
ing, but here we note simply that some people confuse a well-founded
opposition to credentialing with a less well-founded denial that IQ cor-
relates with job performance.7
The wealcnesses of individual studies, Until the last decade, even the
experts had reason to think that the relationship must be negligible.
Scattered across journals, books, technical reports, conference pro-
ceedings, and the records of numberless personnel departments were
thousands of samples of workers for whom there were two measure-
ments: a cognitive ability test score of some sort and an estimate of pro-
ficiency or productivity of some sort, Hundreds of such findings were
published, but every aspect of this literature confounded any attempt to
draw general conclusions. The samples were usually small, the measures
of performance and of worker characteristics varied and were more or
less unreliable and invalid, and the ranges were restricted for both the
test score and the performance measure. This fragmented literature
seemed to support the received wisdom: Tests were often barely predic-
tive of worker performance and different jobs seemed to call for differ*
ent predictors. And yet millions of people are hired for jobs every year
in competition with other applicants. Employers make those millions
The Restriction of Range
- Statistical correlations between IQ and job performance are often masked by the restricted range of ability within specific professions.
- The NFL offensive tackle analogy demonstrates that while weight may not correlate with success among pros, it is a critical threshold for entry.
- Critics often confuse the opposition to using IQ as a formal credential with the statistical reality of its correlation to performance.
- Early research into IQ and productivity was fragmented by small sample sizes and unreliable performance measures.
- The historical lack of consensus on testing led to the landmark Supreme Court decision in Griggs v. Duke Power Co. regarding hiring practices.
Should we then approach the head coaches of the NFL and recommend that they try out a superbly talented 150.pound athlete at offensive tackle?
68
The Emergence of a Cognitive Elite
The Economic Pressure to Partition
69
The variation among individuals that lies
behind a significant correlation coefficient
Annual income (thousands of 1990 dollars)
80 -
70 -
.
60 -
•
.
0
.
Correlation: +.33
50 -
. . ,
.
40 -
Expected increase in --
income
education:
per $2,800
year of
20-
.
.
10-
; : : + i
I
.
0 ,
a
.
I
I
1
I
I
I
6
8
10
12
14
16
18
Years of education
numerous are the exceptions; note especially how people with twelfth.
grade educations are spread out all along the income continuum, For
virtually every topic we will be discussing throughout the rest of the book, n
plot of the raw data would reveal as many or more exceptions to the general
statistical relationship, and this must always be remembered in trying to trans-
late the general ruk to individuals.
The exceptions associated with modest correlations mean that a wide
range of IQ scores can be observed in almost any job, including com-
plex jobs such as engineer or physician, a fact that provides President
Bok and other critics of the importance of IQ with an abundant supply
of exceptions to any general relationship. The exceptions do not inval-
idate the importance of a statistically significant correlation.
Restriction of range. In any particular job setting, there is a restricted
range of cognitive ability, and the relationship between IQ scores and
job performance is probably very weak in that setting. Forget about IQ
for a moment and think about weight as a qualification for being an of+
fensive tackle in the National Football League. The All-Pro probably is
not the heaviest player. On the other hand, the lightest tackle in the
league weighs about 250 pounds. That is what we mean by restriction
of range. In terms of correlation coefficients, if we were to rate the per-
formance of every NFL offensive tackle and then correlate those ratings
with their weights, the result would probably be a correlation near zero.
Should we then approach the head coaches of the NFL and recommend
that they try out a superbly talented 150.pound athlete at offensive
tackle? The answer is no. We would be right in concluding that perfor-
mance does not correlate much with weight among NFL tackles, whose
weights range upward from around 250, but not about the correlation
in the general population. Imagine a sample of ordinary people drawn
from the general population and inserted into an offensive line, The
correlation between the performance of these people as tackles in foot*
ball games and their weights would be large indeed. The difference be-
tween these two correlations-one for the actual tackles in the NFL and
the other a hypothetical one for people at large-illustrates
the impact
of restriction of range on correlation coefficient^.[^]
Confusion between a credential and a comelation. Would it be silly to
require someone to have a minimum score on an IQ test to get a license
as a barber? Yes. Is it nonetheless possible that IQ scores are correlated
with barbering skills? Yes. Later in the chapter, we discuss the economic
pros and cons of using a weakly correlated score as a credential for hir-
ing, but here we note simply that some people confuse a well-founded
opposition to credentialing with a less well-founded denial that IQ cor-
relates with job performance.7
The wealcnesses of individual studies, Until the last decade, even the
experts had reason to think that the relationship must be negligible.
Scattered across journals, books, technical reports, conference pro-
ceedings, and the records of numberless personnel departments were
thousands of samples of workers for whom there were two measure-
ments: a cognitive ability test score of some sort and an estimate of pro-
ficiency or productivity of some sort, Hundreds of such findings were
published, but every aspect of this literature confounded any attempt to
draw general conclusions. The samples were usually small, the measures
of performance and of worker characteristics varied and were more or
less unreliable and invalid, and the ranges were restricted for both the
test score and the performance measure. This fragmented literature
seemed to support the received wisdom: Tests were often barely predic-
tive of worker performance and different jobs seemed to call for differ*
ent predictors. And yet millions of people are hired for jobs every year
in competition with other applicants. Employers make those millions
7 0
The Emergence of a Cognitive Elite
The Economic Pressure to Partition
7 1
of choices by trying to guess which will be the best worker. What then
is a fair way for the employer to make those hiring decisions?
Since 1971, the answer to that question has been governed by a land-
mark Supreme Court decision, Griggs v. Duke Power CO.~
The Court
held that any job requirement, including a minimum cutoff score on a
mental test, must have a "manifest relationship to the employment in
question" and that it was up to the employer to prove that it dida9 In
practice, this evolved into a doctrine: Employment tests must focus on
the skills that are specifically needed to perform the job in question."0'
An applicant for a job as a mechanic should be judged on how well he
does on a mechanical aptitude test, while an applicant for a job as a clerk
should be judged on tests measuring clerical skills, and so forth. So de+
creed the Supreme Court, and why not! In addition to the expert testi-
mony before the Court favoring it, it seemed to make good common
sense.
THE RECEIVED WISDOM OVERTURNED
The problem is that common sense turned out to be wrong. In the last
decade, the received wisdom has been repudiated by research and by
common agreement of the leading contemporary scholars.["] The most
comprehensive modem surveys of the use of tests for hiring, promotion,
and licensing, in civilian, military, private, and government occupa-
tions, repeatedly point to three conclusions about worker performance,
as follows.
1. Job training and job performance in many common occupations
are well predicted by any broadly based test of intelligence, as com-
pared to narrower tests more specifically targeted to the routines
of the job. As a corollary: Narrower tests that predict well do so
largely because they happen themselves to be correlated with tests
of general cognitive ability .
2. Mental tests predict job performance largely via their loading on
g.
3. The correlations between tested intelligence and job performance
or training are higher than had been estimated prior to the 1980s.
They are high enough to have economic consequences.
We state these conclusions qualitatively rather than quantitatively
so as to span the range of expert opinion. Whereas experts in employee
selection accept the existence of the relationship between cognitive
ability and job performance, they often disagree with each other's nu-
merical conclusions. Our qualitative characterizations should be ac-
ceptable to those who tend to minimize the economic importance of
general cognitive ability and to those at the other end of the range.12
Why has expert opinion shifted? The answer lies in a powerful
method of statistical analysis that was developing during the 1970s and
came of age in the 1980s. Known as meta-analysis, it combines the re-
sults from many separate studies and extracts broad and stable conclu-
sion~.["~
In the case of job performance, it was able to combine the results
from hundreds of studies. Experts had long known that the small sam-
ples and the varying validities, reliabilities, and restrictions of range in
such studies were responsible to some extent for the low, negligible, or
unstable correlations. What few realized was how different the picture
would look when these sources of error and underestimation were taken
into account through meta+analysis.14 Taken individually, the studies
said little that could be trusted or generalized; properly pooled, they were
full of gold. The leaders in this effort-psychologists
John Hunter and
Frank Schmidt have been the most prominent-launched
a new epoch
in understanding the link between individual traits and economic pro-
ductivity.
THE LINK BETWEEN COGNITIVE ABILITY AND JOB
PERFORMANCE
We begin with a review of the evidence that an important statistical
link between IQ and job performance does in fact exist. In reading the
discussion that follows, remember that job performance does vary in the
real world, and the variations are not small. Think of your own work-
place and of the people who hold similar jobs. How large is the differ-
ence between the best manager and the worst? The best and worst
secretary? If your workplace is anything like ours have been, the answer
is that the differences are large indeed. Outside the workplace, what is
it worth to you to have the name of a first-rate plumber instead of a poor
one? A first-rate auto mechanic instead of a poor one? Once again, the
Intelligence and Job Performance
- The Supreme Court initially ruled that employment tests must focus on specific job-related skills rather than general mental aptitude.
- Recent research and meta-analysis have overturned the common-sense belief that narrow skill tests are superior to general intelligence tests.
- Broadly based tests of intelligence (g) are better predictors of job training and performance than tests targeted at specific job routines.
- The correlation between cognitive ability and job performance is higher than previously estimated and carries significant economic consequences.
- Meta-analysis allowed researchers to pool hundreds of small studies, revealing stable patterns that were previously obscured by statistical noise.
- Experts now largely agree that general cognitive ability is a primary driver of individual economic productivity across various occupations.
The problem is that common sense turned out to be wrong.
7 0
The Emergence of a Cognitive Elite
The Economic Pressure to Partition
7 1
of choices by trying to guess which will be the best worker. What then
is a fair way for the employer to make those hiring decisions?
Since 1971, the answer to that question has been governed by a land-
mark Supreme Court decision, Griggs v. Duke Power CO.~
The Court
held that any job requirement, including a minimum cutoff score on a
mental test, must have a "manifest relationship to the employment in
question" and that it was up to the employer to prove that it dida9 In
practice, this evolved into a doctrine: Employment tests must focus on
the skills that are specifically needed to perform the job in question."0'
An applicant for a job as a mechanic should be judged on how well he
does on a mechanical aptitude test, while an applicant for a job as a clerk
should be judged on tests measuring clerical skills, and so forth. So de+
creed the Supreme Court, and why not! In addition to the expert testi-
mony before the Court favoring it, it seemed to make good common
sense.
THE RECEIVED WISDOM OVERTURNED
The problem is that common sense turned out to be wrong. In the last
decade, the received wisdom has been repudiated by research and by
common agreement of the leading contemporary scholars.["] The most
comprehensive modem surveys of the use of tests for hiring, promotion,
and licensing, in civilian, military, private, and government occupa-
tions, repeatedly point to three conclusions about worker performance,
as follows.
1. Job training and job performance in many common occupations
are well predicted by any broadly based test of intelligence, as com-
pared to narrower tests more specifically targeted to the routines
of the job. As a corollary: Narrower tests that predict well do so
largely because they happen themselves to be correlated with tests
of general cognitive ability .
2. Mental tests predict job performance largely via their loading on
g.
3. The correlations between tested intelligence and job performance
or training are higher than had been estimated prior to the 1980s.
They are high enough to have economic consequences.
We state these conclusions qualitatively rather than quantitatively
so as to span the range of expert opinion. Whereas experts in employee
selection accept the existence of the relationship between cognitive
ability and job performance, they often disagree with each other's nu-
merical conclusions. Our qualitative characterizations should be ac-
ceptable to those who tend to minimize the economic importance of
general cognitive ability and to those at the other end of the range.12
Why has expert opinion shifted? The answer lies in a powerful
method of statistical analysis that was developing during the 1970s and
came of age in the 1980s. Known as meta-analysis, it combines the re-
sults from many separate studies and extracts broad and stable conclu-
sion~.["~
In the case of job performance, it was able to combine the results
from hundreds of studies. Experts had long known that the small sam-
ples and the varying validities, reliabilities, and restrictions of range in
such studies were responsible to some extent for the low, negligible, or
unstable correlations. What few realized was how different the picture
would look when these sources of error and underestimation were taken
into account through meta+analysis.14 Taken individually, the studies
said little that could be trusted or generalized; properly pooled, they were
full of gold. The leaders in this effort-psychologists
John Hunter and
Frank Schmidt have been the most prominent-launched
a new epoch
in understanding the link between individual traits and economic pro-
ductivity.
THE LINK BETWEEN COGNITIVE ABILITY AND JOB
PERFORMANCE
We begin with a review of the evidence that an important statistical
link between IQ and job performance does in fact exist. In reading the
discussion that follows, remember that job performance does vary in the
real world, and the variations are not small. Think of your own work-
place and of the people who hold similar jobs. How large is the differ-
ence between the best manager and the worst? The best and worst
secretary? If your workplace is anything like ours have been, the answer
is that the differences are large indeed. Outside the workplace, what is
it worth to you to have the name of a first-rate plumber instead of a poor
one? A first-rate auto mechanic instead of a poor one? Once again, the
Intelligence and Job Performance
- Significant variations in job performance exist across all levels of employment, from menial labor to complex management.
- The correlation between cognitive ability and job productivity, known as validity, averages approximately .4 across various industries.
- Higher job complexity generally results in a stronger correlation between intelligence and performance, with managerial roles showing a validity of .53.
- Even in low-complexity industrial roles, such as 'comparing and copying,' cognitive ability remains a statistically significant predictor of success.
- Economic consequences of these performance differences are substantial, justifying the use of cognitive testing for worker screening.
In restaurants, there are better and worse dishwashers, better and worse busboys.
7 0
The Emergence of a Cognitive Elite
The Economic Pressure to Partition
7 1
of choices by trying to guess which will be the best worker. What then
is a fair way for the employer to make those hiring decisions?
Since 1971, the answer to that question has been governed by a land-
mark Supreme Court decision, Griggs v. Duke Power CO.~
The Court
held that any job requirement, including a minimum cutoff score on a
mental test, must have a "manifest relationship to the employment in
question" and that it was up to the employer to prove that it dida9 In
practice, this evolved into a doctrine: Employment tests must focus on
the skills that are specifically needed to perform the job in question."0'
An applicant for a job as a mechanic should be judged on how well he
does on a mechanical aptitude test, while an applicant for a job as a clerk
should be judged on tests measuring clerical skills, and so forth. So de+
creed the Supreme Court, and why not! In addition to the expert testi-
mony before the Court favoring it, it seemed to make good common
sense.
THE RECEIVED WISDOM OVERTURNED
The problem is that common sense turned out to be wrong. In the last
decade, the received wisdom has been repudiated by research and by
common agreement of the leading contemporary scholars.["] The most
comprehensive modem surveys of the use of tests for hiring, promotion,
and licensing, in civilian, military, private, and government occupa-
tions, repeatedly point to three conclusions about worker performance,
as follows.
1. Job training and job performance in many common occupations
are well predicted by any broadly based test of intelligence, as com-
pared to narrower tests more specifically targeted to the routines
of the job. As a corollary: Narrower tests that predict well do so
largely because they happen themselves to be correlated with tests
of general cognitive ability .
2. Mental tests predict job performance largely via their loading on
g.
3. The correlations between tested intelligence and job performance
or training are higher than had been estimated prior to the 1980s.
They are high enough to have economic consequences.
We state these conclusions qualitatively rather than quantitatively
so as to span the range of expert opinion. Whereas experts in employee
selection accept the existence of the relationship between cognitive
ability and job performance, they often disagree with each other's nu-
merical conclusions. Our qualitative characterizations should be ac-
ceptable to those who tend to minimize the economic importance of
general cognitive ability and to those at the other end of the range.12
Why has expert opinion shifted? The answer lies in a powerful
method of statistical analysis that was developing during the 1970s and
came of age in the 1980s. Known as meta-analysis, it combines the re-
sults from many separate studies and extracts broad and stable conclu-
sion~.["~
In the case of job performance, it was able to combine the results
from hundreds of studies. Experts had long known that the small sam-
ples and the varying validities, reliabilities, and restrictions of range in
such studies were responsible to some extent for the low, negligible, or
unstable correlations. What few realized was how different the picture
would look when these sources of error and underestimation were taken
into account through meta+analysis.14 Taken individually, the studies
said little that could be trusted or generalized; properly pooled, they were
full of gold. The leaders in this effort-psychologists
John Hunter and
Frank Schmidt have been the most prominent-launched
a new epoch
in understanding the link between individual traits and economic pro-
ductivity.
THE LINK BETWEEN COGNITIVE ABILITY AND JOB
PERFORMANCE
We begin with a review of the evidence that an important statistical
link between IQ and job performance does in fact exist. In reading the
discussion that follows, remember that job performance does vary in the
real world, and the variations are not small. Think of your own work-
place and of the people who hold similar jobs. How large is the differ-
ence between the best manager and the worst? The best and worst
secretary? If your workplace is anything like ours have been, the answer
is that the differences are large indeed. Outside the workplace, what is
it worth to you to have the name of a first-rate plumber instead of a poor
one? A first-rate auto mechanic instead of a poor one? Once again, the
72
The Emergence of a Cognitive Elite
The Economic Pressure to Partition
73
common experience is that job performance varies widely, with impor-
tant, tangible consequences for our everyday lives.
Nor is variation in job performance limited to skilled jobs. Readers
who have ever held menial jobs know this firsthand. In restaurants,
there are better and worse dishwashers, better and worse busboys. There
are better and worse ditch diggers and garbage collectors. People who
work in industry know that no matter how apparently mindless a job is,
the job can still be done better or worse, with significant economic con-
sequences. If the consequences are significant, it is worth knowing what
accounts for the difference.
Job performance may be measured in many different ways.['51 Sometimes
it is expressed as a natural quantitative measure (how many units a per-
son produces per hour, for example), sometimes as structured ratings by
supervisors or peers, sometimes as analyses of a work sample. When these
measures of job productivity are correlated with measures of intelli-
gence, the overall correlation, averaged over many tests and many jobs,
is about .4. In the study of job performance and tests, the correlation be-
tween a test and job performance is usually referred to as the validity of
the test, and we shall so refer to it for the rest of the discus~ion.['~'
Math-
ematically, validity and the correlation coefficient are identical. Later
in the chapter we will show that a validity of .4 has large economic im-
plications, and even validities half as large may warrant worrying about.
This figure of .4 is no more than a point of reference. As one might
expect, the validities are higher for complex jobs than for simple ones.
In Edwin Ghiselli's mammoth compilation of job performance studies,
mostly from the first half of the century, a reanalysis by John Hunter
found a mean validity of .53 for the job family labeled "manager" and
.46 for a "trades and crafts worker." Even an "elementary industrial
worker" had a mean validity of .37.17
The Ghiselli data were extremely heterogeneous, with different stud-
ies using many different measures of cognitive ability, and include data
that are decades old. A more recent set of data is available from a meta-
analysis of 425 studies of job proficiency as predicted by the General
Aptitude Test Battery (GATB), the U.S. Labor Department's cognitive
ability test for the screening of workers. The table below summarizes the
results of John and Ronda Hunter's reanalysis of these databases."
The average validity in the meta-analysis of the GATB studies was
.45.[lg1 The only job category with a validity lower than .40 was the in-
The Validity of the GATB for Different Types of Jobs
GATB Validity for:
% of U.S.
Proficiency Training Workers in These
Job Complexity
Ratings
Success
Occupations
General job families
High
(synthesizing/coordinating) .58
-50
14.7
Medium
(compiling/computing)
.5 1
.57
62.7
Low (comparing/copying)
.40
.54
17.7
Industrial job families
High (setup work)
.56
-65
2.5
Low (feedingloffbearing)
.23
NA
2.4
So~ircc: Hunter ilnd Hunter 1984, Table 2.
dustrial category of "feeding/offbearing"-putting
something into a ma+
chine or taking it out-which
occupies fewer than 3 percent of U.S.
workers in any case. Even at that bottom+most level of unskilled labor,
measured intelligence did not entirely lose its predictiveness, with a
mean validity of .23.
The third major database hearing on this issue comes from the mili-
tary, and it is in many ways the most satisfactory. The AFQT (Armed
Forces Qualification Test) is extracted from the scores on several tests
that everyone in the armed forces takes. It is an intelligence test, highly
loaded ong. Everyone in the military goes to training schools, and every.
one is measured for training success at the end of their schooling, with
"training SLICC~SS" based on measures that directly assess job performance
skills and knowledge. The job specialties in the armed forces include
most of those found in the civilian world, as well a number that are not
(e.g., combat). The military keeps all of these scores in personnel files
and puts them on computers, The resulting database has no equal in the
study of job productivity.
We will be returning to the military data for a closer look when we
turn to subjects for which they are uniquely suited. For now, we will sim.
ply point out that the results from the military conform to the results in
the civilian job market. The results for training success in the four ma-
Cognitive Ability and Job Performance
- The military maintains an unparalleled database linking intelligence test scores (AFQT) to training success across diverse job specialties.
- Data from over 470,000 personnel across 828 military schools shows a high average validity of .62 for predicting job performance.
- Even in physically demanding roles like combat, cognitive ability remains a substantial predictor of success with a validity of .45.
- Discrepancies in validity estimates often arise from whether researchers correct for 'restriction of range' within specific professional populations.
- The Hartigan committee's lower validity estimates were influenced by a priority on fairness and avoiding the exclusion of minority candidates.
- Evidence suggests that 'more' intelligence consistently correlates with better performance across all professions, rather than hitting a plateau of 'enough' intelligence.
Even the lowest-validity school, combat, in which training success is heavily dependent on physical skills, the validity was still a substantial .45.
72
The Emergence of a Cognitive Elite
The Economic Pressure to Partition
73
common experience is that job performance varies widely, with impor-
tant, tangible consequences for our everyday lives.
Nor is variation in job performance limited to skilled jobs. Readers
who have ever held menial jobs know this firsthand. In restaurants,
there are better and worse dishwashers, better and worse busboys. There
are better and worse ditch diggers and garbage collectors. People who
work in industry know that no matter how apparently mindless a job is,
the job can still be done better or worse, with significant economic con-
sequences. If the consequences are significant, it is worth knowing what
accounts for the difference.
Job performance may be measured in many different ways.['51 Sometimes
it is expressed as a natural quantitative measure (how many units a per-
son produces per hour, for example), sometimes as structured ratings by
supervisors or peers, sometimes as analyses of a work sample. When these
measures of job productivity are correlated with measures of intelli-
gence, the overall correlation, averaged over many tests and many jobs,
is about .4. In the study of job performance and tests, the correlation be-
tween a test and job performance is usually referred to as the validity of
the test, and we shall so refer to it for the rest of the discus~ion.['~'
Math-
ematically, validity and the correlation coefficient are identical. Later
in the chapter we will show that a validity of .4 has large economic im-
plications, and even validities half as large may warrant worrying about.
This figure of .4 is no more than a point of reference. As one might
expect, the validities are higher for complex jobs than for simple ones.
In Edwin Ghiselli's mammoth compilation of job performance studies,
mostly from the first half of the century, a reanalysis by John Hunter
found a mean validity of .53 for the job family labeled "manager" and
.46 for a "trades and crafts worker." Even an "elementary industrial
worker" had a mean validity of .37.17
The Ghiselli data were extremely heterogeneous, with different stud-
ies using many different measures of cognitive ability, and include data
that are decades old. A more recent set of data is available from a meta-
analysis of 425 studies of job proficiency as predicted by the General
Aptitude Test Battery (GATB), the U.S. Labor Department's cognitive
ability test for the screening of workers. The table below summarizes the
results of John and Ronda Hunter's reanalysis of these databases."
The average validity in the meta-analysis of the GATB studies was
.45.[lg1 The only job category with a validity lower than .40 was the in-
The Validity of the GATB for Different Types of Jobs
GATB Validity for:
% of U.S.
Proficiency Training Workers in These
Job Complexity
Ratings
Success
Occupations
General job families
High
(synthesizing/coordinating) .58
-50
14.7
Medium
(compiling/computing)
.5 1
.57
62.7
Low (comparing/copying)
.40
.54
17.7
Industrial job families
High (setup work)
.56
-65
2.5
Low (feedingloffbearing)
.23
NA
2.4
So~ircc: Hunter ilnd Hunter 1984, Table 2.
dustrial category of "feeding/offbearing"-putting
something into a ma+
chine or taking it out-which
occupies fewer than 3 percent of U.S.
workers in any case. Even at that bottom+most level of unskilled labor,
measured intelligence did not entirely lose its predictiveness, with a
mean validity of .23.
The third major database hearing on this issue comes from the mili-
tary, and it is in many ways the most satisfactory. The AFQT (Armed
Forces Qualification Test) is extracted from the scores on several tests
that everyone in the armed forces takes. It is an intelligence test, highly
loaded ong. Everyone in the military goes to training schools, and every.
one is measured for training success at the end of their schooling, with
"training SLICC~SS" based on measures that directly assess job performance
skills and knowledge. The job specialties in the armed forces include
most of those found in the civilian world, as well a number that are not
(e.g., combat). The military keeps all of these scores in personnel files
and puts them on computers, The resulting database has no equal in the
study of job productivity.
We will be returning to the military data for a closer look when we
turn to subjects for which they are uniquely suited. For now, we will sim.
ply point out that the results from the military conform to the results in
the civilian job market. The results for training success in the four ma-
74
The Emergence ofa Cognitive Elite
The Economic Pressure to Partition
75
The Validity of the AFQT for Military Training
Mean Validity of
AFQT Score and
Military Job Family
Training Success
Mechanical
.62
Clerical
.58
Electronic
+67
General technical
-62
Source: Hunter 1985, Table 3.
jor job families are shown in the table above. These results are based
on results from 828 military schools and 472,539 military personnel,
The average validity was .62. They hold true for individual schools as
well. Even the lowest-validity school, combat, in which training suc.
cess is heavily dependent on physical skills, the validity was still a sub-
stantial .45.[*01
The lowest modern estimate of validity for cognitive ability is the
one contained in the report by a panel convened by the National Acad-
emy of Sciences, Fairness in Employment ~estin~."
That report concluded
that the mean validity is only about .25 for the GATB, in contrast to
the Hunter estimate of .45 (which we cited earlier), Part of the reason
was that the Hartigan committee (we name it for its chairman, Yale sta-
tistician John Hartigan), analyzing 264 studies after 1972, concluded
that validities had generally dropped in the more recent studies. But the
main source of the difference in validities is that the committee declined
to make any correction whatsoever for restriction of range (see above
and note 6). It was, in effect, looking at just the tackles already in the
NFL; Hunter was considering the population at large. The Hartigan
committee's overriding concern, as the title of their report (Fairness in
Employment Testing) indicates, was that tests not be used to exclude peo-
ple, especially blacks, who might turn out to be satisfactory workers.
Given that priority, the committee's decision not to correct for restric-
tion of range makes sense. But failing to correct for restriction of range
produces a misleadingly low estimate of the overall relationship of IQ
to job performance and its economic consequences.[221 Had the Harti-
gan committee corrected for restriction of range, the estimates of the
relationship would have been .35 to .40, not much less than Hunter's.
THE REASONS FOR THE LINK BETWEEN COGNITIVE ABILITY
AND JOB PERFORMANCE
Why are job performance and cognitive ability correlated? Surgeons, for
example, will be drawn from the upper regions of the IQ distribution.
But isn't it possible that all one needs is "enough" intelligence to be a
surgeon, after which "more" intelligence doesn't make much difference?
Maybe small motor skills are more important. And yet "more" intelli-
gence always seems to be "better," for large groups of surgeons and every
other profession. What is going on that produces such a result?
Specific Skills or g?
As we begin to explore this issue, the story departs more drastically from
the received wisdom. One obvious, commonsense explanation is that
an IQ test indirectly measures how much somebody knows about the
specifics of a job and that that specific knowledge is the relevant thing
to measure. According to this logic, more general intellectual capaci-
ties are beside the point. But the logic, however commonsensical, is
wrong. Surprising as it may seem, the predictive power of tests for job
performance lies almost completely in their ability to measure the most
general form of cognitive ability, g, and has little to do with their abil-
ity to measure aptitude or knowledge for a particular job.
SPECIFIC SKILLS
VERSUS
G IN THE MILITARY.
The most complete data on
this issue come from the armed services, with their unique advantages
as an employer that trains hundreds of thousands of people for hundreds
of job specialties. We begin with them and then turn to the corre-
sponding data from the civilian sector.
In assigning recruits to training schools, the services use particular
combinations of subtests from a test battery that all recruits take, the
Armed Services Vocational Aptitude Battery (ASVAB).'~]
The Penta-
gon$ psychometricians have tried to determine whether there is any
practical benefit of using different weightings of the subtests for differ
ent jobs rather than, say, just using the overall score for all jobs The
overall score is itself tantamount to an intelligence test. One of the most
comprehensive studies of the predictive power of intelligence tests was
by Malcolm Ree and James Earles, who had both the intelligence test
scores and the final grades from military school for over 78,000 air force
The Dominance of General Intelligence
- Common sense suggests that specific job skills are the best predictors of performance, but data indicates that general cognitive ability (g) is actually the primary factor.
- The military provides a unique dataset for studying this phenomenon due to its massive scale and standardized testing of hundreds of thousands of recruits.
- Research on 78,000 Air Force personnel across 89 specialties showed that g accounted for nearly 60 percent of the variation in training success.
- In many technical fields, such as nuclear weapons and intelligence, the predictive power of g is dozens of times greater than all other cognitive factors combined.
- Large-scale studies across all four armed services confirm that specific vocational aptitudes offer very little additional predictive value beyond a general intelligence score.
The explanatory power of g was almost thirty times greater than of all other cognitive factors in ASVAB combined.
74
The Emergence ofa Cognitive Elite
The Economic Pressure to Partition
75
The Validity of the AFQT for Military Training
Mean Validity of
AFQT Score and
Military Job Family
Training Success
Mechanical
.62
Clerical
.58
Electronic
+67
General technical
-62
Source: Hunter 1985, Table 3.
jor job families are shown in the table above. These results are based
on results from 828 military schools and 472,539 military personnel,
The average validity was .62. They hold true for individual schools as
well. Even the lowest-validity school, combat, in which training suc.
cess is heavily dependent on physical skills, the validity was still a sub-
stantial .45.[*01
The lowest modern estimate of validity for cognitive ability is the
one contained in the report by a panel convened by the National Acad-
emy of Sciences, Fairness in Employment ~estin~."
That report concluded
that the mean validity is only about .25 for the GATB, in contrast to
the Hunter estimate of .45 (which we cited earlier), Part of the reason
was that the Hartigan committee (we name it for its chairman, Yale sta-
tistician John Hartigan), analyzing 264 studies after 1972, concluded
that validities had generally dropped in the more recent studies. But the
main source of the difference in validities is that the committee declined
to make any correction whatsoever for restriction of range (see above
and note 6). It was, in effect, looking at just the tackles already in the
NFL; Hunter was considering the population at large. The Hartigan
committee's overriding concern, as the title of their report (Fairness in
Employment Testing) indicates, was that tests not be used to exclude peo-
ple, especially blacks, who might turn out to be satisfactory workers.
Given that priority, the committee's decision not to correct for restric-
tion of range makes sense. But failing to correct for restriction of range
produces a misleadingly low estimate of the overall relationship of IQ
to job performance and its economic consequences.[221 Had the Harti-
gan committee corrected for restriction of range, the estimates of the
relationship would have been .35 to .40, not much less than Hunter's.
THE REASONS FOR THE LINK BETWEEN COGNITIVE ABILITY
AND JOB PERFORMANCE
Why are job performance and cognitive ability correlated? Surgeons, for
example, will be drawn from the upper regions of the IQ distribution.
But isn't it possible that all one needs is "enough" intelligence to be a
surgeon, after which "more" intelligence doesn't make much difference?
Maybe small motor skills are more important. And yet "more" intelli-
gence always seems to be "better," for large groups of surgeons and every
other profession. What is going on that produces such a result?
Specific Skills or g?
As we begin to explore this issue, the story departs more drastically from
the received wisdom. One obvious, commonsense explanation is that
an IQ test indirectly measures how much somebody knows about the
specifics of a job and that that specific knowledge is the relevant thing
to measure. According to this logic, more general intellectual capaci-
ties are beside the point. But the logic, however commonsensical, is
wrong. Surprising as it may seem, the predictive power of tests for job
performance lies almost completely in their ability to measure the most
general form of cognitive ability, g, and has little to do with their abil-
ity to measure aptitude or knowledge for a particular job.
SPECIFIC SKILLS
VERSUS
G IN THE MILITARY.
The most complete data on
this issue come from the armed services, with their unique advantages
as an employer that trains hundreds of thousands of people for hundreds
of job specialties. We begin with them and then turn to the corre-
sponding data from the civilian sector.
In assigning recruits to training schools, the services use particular
combinations of subtests from a test battery that all recruits take, the
Armed Services Vocational Aptitude Battery (ASVAB).'~]
The Penta-
gon$ psychometricians have tried to determine whether there is any
practical benefit of using different weightings of the subtests for differ
ent jobs rather than, say, just using the overall score for all jobs The
overall score is itself tantamount to an intelligence test. One of the most
comprehensive studies of the predictive power of intelligence tests was
by Malcolm Ree and James Earles, who had both the intelligence test
scores and the final grades from military school for over 78,000 air force
76
The Emergence of a Cognitive Elite
The Economic Pressure to Partition
7 7
enlisted personnel spread over eighty-nine military specialties. The per-
sonnel were educationally homogeneous (overwhelmingly high school
graduates without college degrees), conveniently "controlling" for edu-
cational background.f241
What explains how well they performed? For every one of the eighty-
nine military schools, the answer was g-Charles
Spearman's general
-
intelligence. The correlations betweengalone and military school grade
ranged from an almost unbelievably high .90 for the course for a tech-
nical job in avionics repair down to .41 for that for a low-skill job asso-
ciated with jet engine maintenance.[251
Most of the correlations were
above .7. Overall, g accounted for almost 60 percent of the observed
variation in school grades in the average military course, once the re-
sults were corrected for range restriction (the accompanying note spells
out what it means to "account for 60 percent of the observed varia-
t i ~ n " ) . [ ~ ~ ]
Did cognitive factors other than g matter at all? The answer is that
the explanatory power of g was almost thirty times greater than of all
other cognitive factors in ASVAB combined. The table below gives a
sampling of the results from the eighty-nine specialties, to illustrate the
The Role of g in Explaining Training Success for
Various Military Specialties
Enlisted Military
Percentage of Training
Skill Category
Success Explained by:
g
Everything Else
Nuclear weapons specialist
77.3
0.8
Air crew operations specialist
69.7
1.8
Weather specialist
68.7
2.6
Intelligence specialist
66.7
7.0
Fireman
59.7
0.6
Dental assistant
55.2
1 .O
Security police
53.6
1.4
Vehicle maintenance
49.3
7.7
Maintenance
28.4
2.7
Source: Ree and Earles 1990a, Table 9.
two commanding findings: g alone explains an extraordinary proportion
of training success; "everything else" in the test battery explained very
little.
An even larger study, not quite as detailed, involving almost 350,000
men and wotnen in 125 military specialties in all four armed ser-
vices, confirmed the predominant influence of g and the relatively
minor further predictive power of all the other factors extracted
from ASVAB scores.27 Still another study, of almost 25,000 air force
personnel in thirty-seven different military courses, similarly found that
the validity of individual ASVAB subtests in predicting the final tech-
nical school grades was highly correlated with the g loading of the
subte~t.'~~'
EVIDENCE FROM CIVILIAN
JOBS. There is no evidence to suggest that
military jobs are unique in their dependence on g. However, scholars
in the civilian sector are at a disadvantage to their military colleagues;
nothing approaches the military's database on this topic. In one of the
few major studies involving civilian jobs, performance in twenty-eight
occupations correlated virtually as well with an estimate of g from
GATB scores as it did with the most predictively weighted individual
subtest scores in the
The author concluded that, for
samples in the range of 100 to 200, a single factor, g, predicts job
performance as well as, or better than, batteries of weighted subtest
scores. With larger samples, for which it is possible to pick up the
effect of less potent influences, there may be some modest extra
benefit of specialized weighted scores. At no level of sampling,
however, does g become anything less than the best single predictor
known, across the occupational spectrum. Perhaps the most surprising
finding has been that tests of general intelligence often do better in
predicting future job performance than do contrived tesrs of job
performance itself. Attempts to devise measures that are specifically
keyed to a job's tasks-for
example, tests of filing, typing, answering
the telephone, searching in records, and the like for an office
worker--often yield low-validity tests, unless they happen to measure
g, such as a vocabulary test. Given how pervasive g is, it is almost
impossible to miss it entirely with any test, but some tests are far more
efficient measures of it than others.30
The Predictive Power of G
- General intelligence (g) consistently serves as the most effective single predictor of job performance across both military and civilian sectors.
- Large-scale studies indicate that weighted batteries of specific subtests rarely outperform a single measure of g in predicting occupational success.
- Surprisingly, general intelligence tests often predict future job performance more accurately than tests designed to mimic specific job tasks.
- Task-specific tests, such as filing or typing assessments, often yield low validity unless they inadvertently measure general cognitive ability.
- Even in menial roles like busing tables, higher intelligence allows workers to better manage complex queuing problems and prioritize tasks under pressure.
- While traits like diligence and cheerfulness are vital, g provides the cognitive flexibility needed to solve the spontaneous problems that arise in any workplace.
The point is one that should draw broad agreement from readers who have held menial jobs: Given the other necessary qualities of diligence and good spirits, intelligence helps.
76
The Emergence of a Cognitive Elite
The Economic Pressure to Partition
7 7
enlisted personnel spread over eighty-nine military specialties. The per-
sonnel were educationally homogeneous (overwhelmingly high school
graduates without college degrees), conveniently "controlling" for edu-
cational background.f241
What explains how well they performed? For every one of the eighty-
nine military schools, the answer was g-Charles
Spearman's general
-
intelligence. The correlations betweengalone and military school grade
ranged from an almost unbelievably high .90 for the course for a tech-
nical job in avionics repair down to .41 for that for a low-skill job asso-
ciated with jet engine maintenance.[251
Most of the correlations were
above .7. Overall, g accounted for almost 60 percent of the observed
variation in school grades in the average military course, once the re-
sults were corrected for range restriction (the accompanying note spells
out what it means to "account for 60 percent of the observed varia-
t i ~ n " ) . [ ~ ~ ]
Did cognitive factors other than g matter at all? The answer is that
the explanatory power of g was almost thirty times greater than of all
other cognitive factors in ASVAB combined. The table below gives a
sampling of the results from the eighty-nine specialties, to illustrate the
The Role of g in Explaining Training Success for
Various Military Specialties
Enlisted Military
Percentage of Training
Skill Category
Success Explained by:
g
Everything Else
Nuclear weapons specialist
77.3
0.8
Air crew operations specialist
69.7
1.8
Weather specialist
68.7
2.6
Intelligence specialist
66.7
7.0
Fireman
59.7
0.6
Dental assistant
55.2
1 .O
Security police
53.6
1.4
Vehicle maintenance
49.3
7.7
Maintenance
28.4
2.7
Source: Ree and Earles 1990a, Table 9.
two commanding findings: g alone explains an extraordinary proportion
of training success; "everything else" in the test battery explained very
little.
An even larger study, not quite as detailed, involving almost 350,000
men and wotnen in 125 military specialties in all four armed ser-
vices, confirmed the predominant influence of g and the relatively
minor further predictive power of all the other factors extracted
from ASVAB scores.27 Still another study, of almost 25,000 air force
personnel in thirty-seven different military courses, similarly found that
the validity of individual ASVAB subtests in predicting the final tech-
nical school grades was highly correlated with the g loading of the
subte~t.'~~'
EVIDENCE FROM CIVILIAN
JOBS. There is no evidence to suggest that
military jobs are unique in their dependence on g. However, scholars
in the civilian sector are at a disadvantage to their military colleagues;
nothing approaches the military's database on this topic. In one of the
few major studies involving civilian jobs, performance in twenty-eight
occupations correlated virtually as well with an estimate of g from
GATB scores as it did with the most predictively weighted individual
subtest scores in the
The author concluded that, for
samples in the range of 100 to 200, a single factor, g, predicts job
performance as well as, or better than, batteries of weighted subtest
scores. With larger samples, for which it is possible to pick up the
effect of less potent influences, there may be some modest extra
benefit of specialized weighted scores. At no level of sampling,
however, does g become anything less than the best single predictor
known, across the occupational spectrum. Perhaps the most surprising
finding has been that tests of general intelligence often do better in
predicting future job performance than do contrived tesrs of job
performance itself. Attempts to devise measures that are specifically
keyed to a job's tasks-for
example, tests of filing, typing, answering
the telephone, searching in records, and the like for an office
worker--often yield low-validity tests, unless they happen to measure
g, such as a vocabulary test. Given how pervasive g is, it is almost
impossible to miss it entirely with any test, but some tests are far more
efficient measures of it than others.30
78
The Emergence ofa Cognitive Elite
The Economic Pressure to Partition
79
Behind the Test Scores
Let us try to put these data in the framework of everyday experience.
Why should it be that variation in general cognitive ability, g, is more
important than job-specific skills and knowledge? We will use the job
of busboy as a specific example, asking the question: At a run-of-the-
mill family restaurant, what distinguishes a really good busboy from an
average one?
Being a busboy is a straightforward job. The waiter takes the orders,
deals with the kitchen, and serves the food while the busboy totes the
dirty dishes out to the kitchen, keeps the water glasses filled, and helps
the waiter serve or clear as required. In such a job, a high IQ is not re-
quired. One may be a good busboy simply with diligence and good spir-
its. But complications arise. A busboy usually works with more than one
waiter. The restaurant gets crowded. A dozen things are happening at
once. The busboy is suddenly faced with queuing problems, with setting
priorities. A really good busboy gets the key station cleared in the nick
of time, remembering that a table of new orders near that particular sta-
tion is going to be coming out of the kitchen; when he goes to the
kitchen, he gets a fresh water pitcher and a fresh condiment tray to save
an extra trip. He knows which waiters appreciate extra help and when
they need it. The point is one that should draw broad agreement from
readers who have held menial jobs: Given the other necessary qualities
of diligence and good spirits, intelligence helps. The really good busboy
is engaged in using g when he is solving the problems of his job, and the
more g he has, the more quickly he comes up with the solutions and can
call on them when appropriate.
Now imagine devising a test that would enable an employer to
choose the best busboy among applicants. One important aspect of the
test would measure diligence and good spirits. Perhaps the employer
should weigh the results of this part of the test more heavily than
anything else, if his choice is between a diligent and cheerful applicant
and a slightly smarter but sulky one. But when it comes to measuring
performance in general for most applicants, it is easy to see why the re-
sults will match the findings of the literature we just discussed. Job-
specific items reveal mostly whether an applicant has ever been a
busboy before. But that makes very little difference to job produc-
tivity, because a bright person can pick up the basic routine in the
course of a few shifts. The ploaded items, on the other hand, will
reveal whether the applicant will ever become the kind of busboy
who will clear table 12 before he clears table 20 because he relates the
needed task to something that happened twenty minutes earlier
regarding table 15. And that is why employers who want to select pro-
ductive busboys should give applicants a test of general intelligence
rather than a test of busboy skills. The kind of test that would pass
muster with the courts-a
test of job-specific skills-is
a less effective
kind of test to administer. What applies to busboys applies ever more
powerfully as the jobs become more complex.
DOES MORE EXPERIENCE MAKE UP FOR LESS INTELLIGENCE?
The busboy example leads to another question that bears on how we
should think about cognitive ability and job productivity: How much
can experience counterbalance ability? Yes, the smart busboy will be
more productive than the less-smart busboy a week into the job, and,
yes, perhaps there will always be a few things that the smart busboy can
do that the less smart cannot. But will the initial gap in productivity
narrow as the less-smart busboy gains experience! How much, and how
quickly?
Separately, job performance relates to both experience and intelli-
gence, but the relationships differ." That is, people who are new to a
job learn quickly at first, then more slowly. A busboy who has, say, one
month on the job may for that reason outperform someone who started
today, but the one-month difference in experience will have ceased to
matter in six months. No comparable leveling-off effect has been ob-
served for increasing intelligence, Wherever on the scale of intelligence
pairs of applicants are, the smarter ones not only will outperform the
others, on the average, but the benefit of having a score that is higher
by a given amount is approximately the same throughout the range. Or,
to put it more conservatively, no one has produced good evidence of di-
minishing returns to intelligence.'2
But what happens when both factors are considered jointly? Do
employees of differing intelligence converge after some time on the
job? If the answer were yes, then it could be argued that hiring less in+
telligent people imposes only a limited and passing cost, But the answer
seems to be closer to no than to yes, although much remains to be
learned.
Some convergence has been found when SATs are used as the mea-
Intelligence Versus Job Experience
- General intelligence is a better predictor of job productivity than job-specific skills, even for relatively simple roles like busing tables.
- While experience provides an initial boost in performance, its benefits typically level off after a few months on the job.
- Unlike experience, the advantages of higher intelligence do not show a 'leveling-off' effect or diminishing returns over time.
- Evidence suggests that the performance gap between high-ability and low-ability employees does not converge as they gain more experience.
- Apparent convergence in academic settings, such as college grades, may be due to students selecting easier courses rather than a closing of the ability gap.
- In controlled environments like the U.S. Military Academy, where course choice is limited, the performance gap between students remains constant.
The ploaded items, on the other hand, will reveal whether the applicant will ever become the kind of busboy who will clear table 12 before he clears table 20 because he relates the needed task to something that happened twenty minutes earlier regarding table 15.
78
The Emergence ofa Cognitive Elite
The Economic Pressure to Partition
79
Behind the Test Scores
Let us try to put these data in the framework of everyday experience.
Why should it be that variation in general cognitive ability, g, is more
important than job-specific skills and knowledge? We will use the job
of busboy as a specific example, asking the question: At a run-of-the-
mill family restaurant, what distinguishes a really good busboy from an
average one?
Being a busboy is a straightforward job. The waiter takes the orders,
deals with the kitchen, and serves the food while the busboy totes the
dirty dishes out to the kitchen, keeps the water glasses filled, and helps
the waiter serve or clear as required. In such a job, a high IQ is not re-
quired. One may be a good busboy simply with diligence and good spir-
its. But complications arise. A busboy usually works with more than one
waiter. The restaurant gets crowded. A dozen things are happening at
once. The busboy is suddenly faced with queuing problems, with setting
priorities. A really good busboy gets the key station cleared in the nick
of time, remembering that a table of new orders near that particular sta-
tion is going to be coming out of the kitchen; when he goes to the
kitchen, he gets a fresh water pitcher and a fresh condiment tray to save
an extra trip. He knows which waiters appreciate extra help and when
they need it. The point is one that should draw broad agreement from
readers who have held menial jobs: Given the other necessary qualities
of diligence and good spirits, intelligence helps. The really good busboy
is engaged in using g when he is solving the problems of his job, and the
more g he has, the more quickly he comes up with the solutions and can
call on them when appropriate.
Now imagine devising a test that would enable an employer to
choose the best busboy among applicants. One important aspect of the
test would measure diligence and good spirits. Perhaps the employer
should weigh the results of this part of the test more heavily than
anything else, if his choice is between a diligent and cheerful applicant
and a slightly smarter but sulky one. But when it comes to measuring
performance in general for most applicants, it is easy to see why the re-
sults will match the findings of the literature we just discussed. Job-
specific items reveal mostly whether an applicant has ever been a
busboy before. But that makes very little difference to job produc-
tivity, because a bright person can pick up the basic routine in the
course of a few shifts. The ploaded items, on the other hand, will
reveal whether the applicant will ever become the kind of busboy
who will clear table 12 before he clears table 20 because he relates the
needed task to something that happened twenty minutes earlier
regarding table 15. And that is why employers who want to select pro-
ductive busboys should give applicants a test of general intelligence
rather than a test of busboy skills. The kind of test that would pass
muster with the courts-a
test of job-specific skills-is
a less effective
kind of test to administer. What applies to busboys applies ever more
powerfully as the jobs become more complex.
DOES MORE EXPERIENCE MAKE UP FOR LESS INTELLIGENCE?
The busboy example leads to another question that bears on how we
should think about cognitive ability and job productivity: How much
can experience counterbalance ability? Yes, the smart busboy will be
more productive than the less-smart busboy a week into the job, and,
yes, perhaps there will always be a few things that the smart busboy can
do that the less smart cannot. But will the initial gap in productivity
narrow as the less-smart busboy gains experience! How much, and how
quickly?
Separately, job performance relates to both experience and intelli-
gence, but the relationships differ." That is, people who are new to a
job learn quickly at first, then more slowly. A busboy who has, say, one
month on the job may for that reason outperform someone who started
today, but the one-month difference in experience will have ceased to
matter in six months. No comparable leveling-off effect has been ob-
served for increasing intelligence, Wherever on the scale of intelligence
pairs of applicants are, the smarter ones not only will outperform the
others, on the average, but the benefit of having a score that is higher
by a given amount is approximately the same throughout the range. Or,
to put it more conservatively, no one has produced good evidence of di-
minishing returns to intelligence.'2
But what happens when both factors are considered jointly? Do
employees of differing intelligence converge after some time on the
job? If the answer were yes, then it could be argued that hiring less in+
telligent people imposes only a limited and passing cost, But the answer
seems to be closer to no than to yes, although much remains to be
learned.
Some convergence has been found when SATs are used as the mea-
80
The Emergence of a Cognitive Elite
The Economic Pressure to Partition
81
sure of ability and grade point average is used as the measure of achieve-
ment,33 Students with differing SATs sometimes differ more in their
freshman grades than in later years. That is why President Bok granted
predictive value to the SAT only for first.year grades.34 O n the other
hand, the shrinking predictive power may be because students learn
which courses they are likely to do well in: They drop out of physics or
thirddyear calculus, for example, and switch to easier courses. They find
out which professors are stingy with A's and B's. At the U.S. Military
Academy, where students have very little choice in courses, there is no
convergence in grades.35
When it comes to job performance, the balance of the evidence is
that convergence either does not occur or that the degree of conver-
gence is small. This was the finding of a study of over 23,000 civilian
employees at three levels of mental ability (high, medium, and low), us-
ing supervisor ratings as the measure of performance, and it extended
out to job tenures of twenty years and more.36 A study of four military
specialties (armor repairman, armor crewman, supply specialist, cook)
extending out to five years of experience and using three different mea-
sures of job performance (supervisor's ratings, work sample, and job
knowledge) found no reliable evidence of ~onver~ence.~'
Still another
military study, which examined several hundred marines working as ra-
dio repairmen, automotive mechanics, and riflemen, found 110 conver-
gence among personnel of differing intelligence when job knowledge
was the measure of performance but did find almost complete conver-
gence after a year or so when a work sample was the mea~ure.~'
Other studies convey a similarly mixed picture.[391
Some experts are
at this point concluding that convergence is uncommon in the ordinary
range of jobs.[401 It may be said conservatively that for most jobs, based
on most measures of productivity, the difference in productivity associ-
ated with differences in intelligence diminishes only slowly and par-
tially. Often it does not diminish at all. The cost ofhiring less intelligent
workers may last as long as they stay on the job.
TEST SCORES COMPARED TO OTHER PREDICTORS OF
PRODUCTIVITY
How good a predictor of job productivity is a cognitive test score com-
pared to a job interview? Reference checks! College transcript? The an-
swer, probably surprising to many, is that the test score is a better pre-
dictor of job performance than any other single measure. This is the
conclusion to be drawn from a meta-analysis on the different predictors
of job performance, as shown in the table below.
The Validity of Some Different Predictors
of Job Performance
Predictor
Validity Predicting Job
Performance Ratings
Cognitive test score
.53
Biographical data
.37
Reference checks
-26
Education
.22
Interview
.14
College grades
.I1
Interest
.10
Age
-,01
Source: Hunter and Hunter 1984.
The data used for this analysis were top heavy with higher-complex-
ity jobs, yielding a higher-than-usual validity of .53 for test scores. How-
ever, even if we were to substitute the more conservative validity
estimate of .4, the test score would remain the best predictor, though
with close competition from biographical data4' The method that many
people intuitively expect to be the most accurate, the job interview, has
a poor record as a predictor of job performance, with a validity of
only .14.
Readers who are absolutely sure nonetheless that they should tmst
their own assessment of people rather than a test score should pause to
consider what this conclusion means. It is not that you would select a
markedly different set of people through interviews than test scores
would lead you to select. Many of the decisions would be the same. The
results in the table say, in effect, that among those choices that would
be different, the employees chosen on the basis of test scores will on av-
erage be more productive than the employees chosen on the basis of any
other single item of information.
Intelligence and Job Productivity
- Long-term studies show that the performance gap between high and low intelligence workers often persists for decades rather than converging over time.
- Cognitive test scores are statistically superior to any other single predictor of job performance, including interviews and education.
- The job interview, despite being the most trusted method for many employers, has a very low validity rating of only .14.
- The economic cost of hiring less intelligent workers can last as long as their entire tenure on the job because productivity differences diminish slowly, if at all.
- While individual exceptions exist, the aggregate importance of cognitive ability increases as job complexity and the scale of hiring grow.
The method that many people intuitively expect to be the most accurate, the job interview, has a poor record as a predictor of job performance, with a validity of only .14.
80
The Emergence of a Cognitive Elite
The Economic Pressure to Partition
81
sure of ability and grade point average is used as the measure of achieve-
ment,33 Students with differing SATs sometimes differ more in their
freshman grades than in later years. That is why President Bok granted
predictive value to the SAT only for first.year grades.34 O n the other
hand, the shrinking predictive power may be because students learn
which courses they are likely to do well in: They drop out of physics or
thirddyear calculus, for example, and switch to easier courses. They find
out which professors are stingy with A's and B's. At the U.S. Military
Academy, where students have very little choice in courses, there is no
convergence in grades.35
When it comes to job performance, the balance of the evidence is
that convergence either does not occur or that the degree of conver-
gence is small. This was the finding of a study of over 23,000 civilian
employees at three levels of mental ability (high, medium, and low), us-
ing supervisor ratings as the measure of performance, and it extended
out to job tenures of twenty years and more.36 A study of four military
specialties (armor repairman, armor crewman, supply specialist, cook)
extending out to five years of experience and using three different mea-
sures of job performance (supervisor's ratings, work sample, and job
knowledge) found no reliable evidence of ~onver~ence.~'
Still another
military study, which examined several hundred marines working as ra-
dio repairmen, automotive mechanics, and riflemen, found 110 conver-
gence among personnel of differing intelligence when job knowledge
was the measure of performance but did find almost complete conver-
gence after a year or so when a work sample was the mea~ure.~'
Other studies convey a similarly mixed picture.[391
Some experts are
at this point concluding that convergence is uncommon in the ordinary
range of jobs.[401 It may be said conservatively that for most jobs, based
on most measures of productivity, the difference in productivity associ-
ated with differences in intelligence diminishes only slowly and par-
tially. Often it does not diminish at all. The cost ofhiring less intelligent
workers may last as long as they stay on the job.
TEST SCORES COMPARED TO OTHER PREDICTORS OF
PRODUCTIVITY
How good a predictor of job productivity is a cognitive test score com-
pared to a job interview? Reference checks! College transcript? The an-
swer, probably surprising to many, is that the test score is a better pre-
dictor of job performance than any other single measure. This is the
conclusion to be drawn from a meta-analysis on the different predictors
of job performance, as shown in the table below.
The Validity of Some Different Predictors
of Job Performance
Predictor
Validity Predicting Job
Performance Ratings
Cognitive test score
.53
Biographical data
.37
Reference checks
-26
Education
.22
Interview
.14
College grades
.I1
Interest
.10
Age
-,01
Source: Hunter and Hunter 1984.
The data used for this analysis were top heavy with higher-complex-
ity jobs, yielding a higher-than-usual validity of .53 for test scores. How-
ever, even if we were to substitute the more conservative validity
estimate of .4, the test score would remain the best predictor, though
with close competition from biographical data4' The method that many
people intuitively expect to be the most accurate, the job interview, has
a poor record as a predictor of job performance, with a validity of
only .14.
Readers who are absolutely sure nonetheless that they should tmst
their own assessment of people rather than a test score should pause to
consider what this conclusion means. It is not that you would select a
markedly different set of people through interviews than test scores
would lead you to select. Many of the decisions would be the same. The
results in the table say, in effect, that among those choices that would
be different, the employees chosen on the basis of test scores will on av-
erage be more productive than the employees chosen on the basis of any
other single item of information.
82
The Emergence of a Cognitive Elite
The Economic Pressure to Parti tion
83
THE DIFFERENCE INTELLIGENCE MAKES
We arrive finally at the question of what it all means. How important
is the overall correlation of .4, which we are using as our benchmark for
the relation between intelligence and job performance? The temptation
may be to say, not very. As we showed before, there will be many ex-
ceptions to the predicted productivity with correlations this modest.
And indeed it is not very important when an employer needs just a few
new employees for low-complexity jobs and is choosing among a small
group of job applicants who have small differences in test scores. But
the more reality departs from this scenario, the more important cogni-
tive ability becomes.
The Dollar Value of Cognitive Ability
How much is the variation in job performance worth? To answer that
question, we need a measure in dollars of how much the workers in a
given occupation vary. (Some of the methods for making this measure-
ment are recounted in the notes, to which we refer readers who would
like more detail.)"2' To cut a long story short, think now of a particular
worker-a
secretary, let us say. You have a choice between hiring an av-
erage secretary, who by definition is at the 50th percentile, or a first-rate
one-at
the 84th percentile, let us say. If you were free to set their
salaries at the figures you believe to reflect their true worth, how differ-
ent would they be? We imagine that anyone who has worked with av-
erage secretaries and first-rate ones will answer "a lot." The consensus
among experts has been that, measured in dollars, "a lot" works out, o n
the average, to about a 40 percent premium.
Put more technically and precisely, one standard deviation of the dis-
tribution of workers' annual productivities in a typical occupation is
worth 40 percent of the average worker's annual income.[431
New work
suggests the premium may actually be twice as large. Since the larger es-
timate has yet to be confirmed, we will base our calculations on the more
conservative estimate." To take a specific example, for a $20,000-a-year
job, which is correctly priced for an average worker, the incremental
value of hiring a new worker who is one standard deviation above the
mean-at
the 84th percentile-is
$8,000 per year,"51 Hiring a worker
for a $20,000-adyear job who is one standard deviation below the mean-
at the 16th percentile-would
cost the employer $8,000 in lost output.
The standard deviation for output is usually larger for more complex
jobs.46 This makes intuitive sense: an assembly-line worker can do his
job well or poorly, but ordinarily the gap that separates the proficiency
of the 16th and 84th percentiles of assembly-line workers is not as great
measured in the dollar value of the output as the gap that separates the
proficiency of the 16th and 84th percentiles of engineers. But when we
match this fact against an additional fact-that
engineers make a lot
more money than assembly-line workers-we
are faced with what is
known in statistics as an interaction effect. Getting high quality for a
complex job can be worth large multiples of what it is worth to get
equally high quality for a simpler job.
We may make this concrete with some hypothetical calculations.
Imagine a dental ofice, consisting of dentist and receptionist, Assume
that the annual salary of an average dentist is $100,000 and that of the
receptionist $25,000, and that these are correctly priced. For whatever
reasons, society finds the dentist to be worth four times as much as the
receptionist.[471 Suppose further that you are an employer-a
Health
Maintenance Organization (HMO), for example-who hires both den-
tists and receptionists. By using a certain selection procedure, you can
improve the quality of your new hirees, so that instead of hiring people
who are, on average, at the 50th percentile of proficiency (which is what
would happen if you picked randomly from the entire pool of recep.
tionists and dentists looking for jobs), you instead could hire people who
are, on average, at the 84th percentile. What is this screening proce-
dure worth to you?
For the value of the output produced, we use a standard deviation of
.5 of the annual income for dentists and of .15 for that of receptionists,
based on values actually ~bserved.~'
The answer, given these numbers,
is that it is worth $50,000 a year for the dentist and $3,750 per year for
the receptionist to hire people who are one standard deviation above
average in proficiency-not
the ratio of four to one that separates the
dentist's wages from the receptionist's but a ratio of more than thirteen
to one.[491
We are not home yet, for although we know what it is worth to hire
these more proficient dentists and receptionists, we have not yet fac-
tored in the validity of the selection test. The correlation between test
score and proficiency is roughly .6 for dentists and .2 for receptionists,
again based on observation and approximating the top and bottom of
The Value of Performance Variation
- The dollar value of variation in job performance is typically measured by standard deviations of annual productivity.
- Conservative estimates suggest that a worker at the 84th percentile of proficiency is worth a 40 percent premium over an average worker.
- The standard deviation for output increases significantly with the complexity of the job being performed.
- An interaction effect occurs because complex jobs both have higher base salaries and greater internal variance in performance value.
- In a hypothetical HMO, hiring a top-tier dentist provides over thirteen times more incremental value than hiring a top-tier receptionist.
- Effective screening procedures for high-complexity roles yield disproportionately large financial returns for employers.
Getting high quality for a complex job can be worth large multiples of what it is worth to get equally high quality for a simpler job.
82
The Emergence of a Cognitive Elite
The Economic Pressure to Parti tion
83
THE DIFFERENCE INTELLIGENCE MAKES
We arrive finally at the question of what it all means. How important
is the overall correlation of .4, which we are using as our benchmark for
the relation between intelligence and job performance? The temptation
may be to say, not very. As we showed before, there will be many ex-
ceptions to the predicted productivity with correlations this modest.
And indeed it is not very important when an employer needs just a few
new employees for low-complexity jobs and is choosing among a small
group of job applicants who have small differences in test scores. But
the more reality departs from this scenario, the more important cogni-
tive ability becomes.
The Dollar Value of Cognitive Ability
How much is the variation in job performance worth? To answer that
question, we need a measure in dollars of how much the workers in a
given occupation vary. (Some of the methods for making this measure-
ment are recounted in the notes, to which we refer readers who would
like more detail.)"2' To cut a long story short, think now of a particular
worker-a
secretary, let us say. You have a choice between hiring an av-
erage secretary, who by definition is at the 50th percentile, or a first-rate
one-at
the 84th percentile, let us say. If you were free to set their
salaries at the figures you believe to reflect their true worth, how differ-
ent would they be? We imagine that anyone who has worked with av-
erage secretaries and first-rate ones will answer "a lot." The consensus
among experts has been that, measured in dollars, "a lot" works out, o n
the average, to about a 40 percent premium.
Put more technically and precisely, one standard deviation of the dis-
tribution of workers' annual productivities in a typical occupation is
worth 40 percent of the average worker's annual income.[431
New work
suggests the premium may actually be twice as large. Since the larger es-
timate has yet to be confirmed, we will base our calculations on the more
conservative estimate." To take a specific example, for a $20,000-a-year
job, which is correctly priced for an average worker, the incremental
value of hiring a new worker who is one standard deviation above the
mean-at
the 84th percentile-is
$8,000 per year,"51 Hiring a worker
for a $20,000-adyear job who is one standard deviation below the mean-
at the 16th percentile-would
cost the employer $8,000 in lost output.
The standard deviation for output is usually larger for more complex
jobs.46 This makes intuitive sense: an assembly-line worker can do his
job well or poorly, but ordinarily the gap that separates the proficiency
of the 16th and 84th percentiles of assembly-line workers is not as great
measured in the dollar value of the output as the gap that separates the
proficiency of the 16th and 84th percentiles of engineers. But when we
match this fact against an additional fact-that
engineers make a lot
more money than assembly-line workers-we
are faced with what is
known in statistics as an interaction effect. Getting high quality for a
complex job can be worth large multiples of what it is worth to get
equally high quality for a simpler job.
We may make this concrete with some hypothetical calculations.
Imagine a dental ofice, consisting of dentist and receptionist, Assume
that the annual salary of an average dentist is $100,000 and that of the
receptionist $25,000, and that these are correctly priced. For whatever
reasons, society finds the dentist to be worth four times as much as the
receptionist.[471 Suppose further that you are an employer-a
Health
Maintenance Organization (HMO), for example-who hires both den-
tists and receptionists. By using a certain selection procedure, you can
improve the quality of your new hirees, so that instead of hiring people
who are, on average, at the 50th percentile of proficiency (which is what
would happen if you picked randomly from the entire pool of recep.
tionists and dentists looking for jobs), you instead could hire people who
are, on average, at the 84th percentile. What is this screening proce-
dure worth to you?
For the value of the output produced, we use a standard deviation of
.5 of the annual income for dentists and of .15 for that of receptionists,
based on values actually ~bserved.~'
The answer, given these numbers,
is that it is worth $50,000 a year for the dentist and $3,750 per year for
the receptionist to hire people who are one standard deviation above
average in proficiency-not
the ratio of four to one that separates the
dentist's wages from the receptionist's but a ratio of more than thirteen
to one.[491
We are not home yet, for although we know what it is worth to hire
these more proficient dentists and receptionists, we have not yet fac-
tored in the validity of the selection test. The correlation between test
score and proficiency is roughly .6 for dentists and .2 for receptionists,
again based on observation and approximating the top and bottom of
The Economic Value of Intelligence Testing
- The financial benefit of hiring high-IQ employees varies significantly by profession, with a 'brighter' dentist providing forty times more added value than a 'brighter' receptionist.
- Intelligence tests become exponentially more valuable to employers as the number of applicants per position increases, even with low test validity.
- A test validity of only .2 can still yield significant productivity gains if the employer is selective and only hires a small percentage of applicants.
- Legal restrictions on top-down hiring based on intelligence tests, stemming from the 1971 Griggs v. Duke Power Co. decision, have created substantial macroeconomic costs.
- Estimates of the annual loss to the American economy due to restricted intelligence testing range from $13 billion to over $80 billion in 1980 dollars.
- Alternative hiring methods, such as educational attainment or family connections, fail to capture the full predictive power of direct cognitive assessment.
But the value to the employer of hiring brighter dentists is forty times greater than the value of hiring comparably brighter receptionists.
82
The Emergence of a Cognitive Elite
The Economic Pressure to Parti tion
83
THE DIFFERENCE INTELLIGENCE MAKES
We arrive finally at the question of what it all means. How important
is the overall correlation of .4, which we are using as our benchmark for
the relation between intelligence and job performance? The temptation
may be to say, not very. As we showed before, there will be many ex-
ceptions to the predicted productivity with correlations this modest.
And indeed it is not very important when an employer needs just a few
new employees for low-complexity jobs and is choosing among a small
group of job applicants who have small differences in test scores. But
the more reality departs from this scenario, the more important cogni-
tive ability becomes.
The Dollar Value of Cognitive Ability
How much is the variation in job performance worth? To answer that
question, we need a measure in dollars of how much the workers in a
given occupation vary. (Some of the methods for making this measure-
ment are recounted in the notes, to which we refer readers who would
like more detail.)"2' To cut a long story short, think now of a particular
worker-a
secretary, let us say. You have a choice between hiring an av-
erage secretary, who by definition is at the 50th percentile, or a first-rate
one-at
the 84th percentile, let us say. If you were free to set their
salaries at the figures you believe to reflect their true worth, how differ-
ent would they be? We imagine that anyone who has worked with av-
erage secretaries and first-rate ones will answer "a lot." The consensus
among experts has been that, measured in dollars, "a lot" works out, o n
the average, to about a 40 percent premium.
Put more technically and precisely, one standard deviation of the dis-
tribution of workers' annual productivities in a typical occupation is
worth 40 percent of the average worker's annual income.[431
New work
suggests the premium may actually be twice as large. Since the larger es-
timate has yet to be confirmed, we will base our calculations on the more
conservative estimate." To take a specific example, for a $20,000-a-year
job, which is correctly priced for an average worker, the incremental
value of hiring a new worker who is one standard deviation above the
mean-at
the 84th percentile-is
$8,000 per year,"51 Hiring a worker
for a $20,000-adyear job who is one standard deviation below the mean-
at the 16th percentile-would
cost the employer $8,000 in lost output.
The standard deviation for output is usually larger for more complex
jobs.46 This makes intuitive sense: an assembly-line worker can do his
job well or poorly, but ordinarily the gap that separates the proficiency
of the 16th and 84th percentiles of assembly-line workers is not as great
measured in the dollar value of the output as the gap that separates the
proficiency of the 16th and 84th percentiles of engineers. But when we
match this fact against an additional fact-that
engineers make a lot
more money than assembly-line workers-we
are faced with what is
known in statistics as an interaction effect. Getting high quality for a
complex job can be worth large multiples of what it is worth to get
equally high quality for a simpler job.
We may make this concrete with some hypothetical calculations.
Imagine a dental ofice, consisting of dentist and receptionist, Assume
that the annual salary of an average dentist is $100,000 and that of the
receptionist $25,000, and that these are correctly priced. For whatever
reasons, society finds the dentist to be worth four times as much as the
receptionist.[471 Suppose further that you are an employer-a
Health
Maintenance Organization (HMO), for example-who hires both den-
tists and receptionists. By using a certain selection procedure, you can
improve the quality of your new hirees, so that instead of hiring people
who are, on average, at the 50th percentile of proficiency (which is what
would happen if you picked randomly from the entire pool of recep.
tionists and dentists looking for jobs), you instead could hire people who
are, on average, at the 84th percentile. What is this screening proce-
dure worth to you?
For the value of the output produced, we use a standard deviation of
.5 of the annual income for dentists and of .15 for that of receptionists,
based on values actually ~bserved.~'
The answer, given these numbers,
is that it is worth $50,000 a year for the dentist and $3,750 per year for
the receptionist to hire people who are one standard deviation above
average in proficiency-not
the ratio of four to one that separates the
dentist's wages from the receptionist's but a ratio of more than thirteen
to one.[491
We are not home yet, for although we know what it is worth to hire
these more proficient dentists and receptionists, we have not yet fac-
tored in the validity of the selection test. The correlation between test
score and proficiency is roughly .6 for dentists and .2 for receptionists,
again based on observation and approximating the top and bottom of
84
The Emergence ofa Cognitive Elite
The Economic Pressure to Partition
85
the range illustrated in the figure below. Given that information, we
may estimate the expected output difference between two dentists
who score at the 50th and 84th percentiles on an intelligence test as
being worth $30,000 a year.[501
The corresponding difference between
two receptionists who score at the 50th and 84th percentiles in in.
tefligence is $750 a year. And this is what we meant by an "interace
tion effect": the wage of the dentist is only four times that of the
receptionist. But the value to the employer of hiring brighter dentists
is forty times greater than the value of hiring comparably brighter
In a realelife situation, the value of a test (or any other selection pro.
cedure) depends on another factor: How much choice does the employer
have!52 There is no point in spending money on an intelligence test if
only one applicant shows up. If ten applicants show up for the job, how.
ever, a test becomes attractive. The figure below illustrates the eco-
nomic benefit of testing with different levels of competition for the job
(from one to fifty applicants per job) and different tests (from a very
The advantages of hiring by test score
Percentage increase in productivity
1 5 0 % ~
If the test's validity is .6 +
If the test's validity is .4
If the test's validity is .2
0% 11
,
I
I
0
I
10
I
20
i
30
40
50
Number of applicants for each job
poor one with a validity of .2 to a very strong one with a validity of .6).["'
If everyone is hired, then, on average, the hired person is just at the av-
erage level of proficiency, which is a standard score of 0,
But as soon as
even two applicants are available per position, the value of testing rises
quickly. With just two applicants per position, the employer gains 16 to
48 percent in productivity, depending on the validity of the test.[541
The
curve quickly begins to flatten out; much of the potential value of test-
ing has already been captured when there are three applicants per job.
The figure above is an answer to those who claim that a correlation of,
say, .4 is too small to bother
A validity of .4 (or even .6) may be
unimportant if allnost all applicants are hired, but even a correlation of
.2 (or still smaller) may be important if only a small proportion gets
hired.
The Macroeconomic Costs of Not Testing
Since the pivotal Supreme Court decision of Griggs v. Duke Power Co,
in 197 1, no large American employer has been able to hire from the top
down based on intelligence tests. Estimates vary widely for how much
the American economy loses by not doing so, from what Hunter and
Hunter conclude is a minimum loss of $80 billion in 1980 (and in 1980
dollars) to what the Hartigan committee thought was a maximum loss
of $13 billion for that year.56 The wide range reflects the many impon.
derables in rnaking these calculations. For one thing, many attributes of
an applicant other than a test score are correlated with intelligence-
educational level, for example. Schooling captures some, but not all, of
the predictive value of intelligence. Or consider an employer using fam.
ily connections to hire instead of tests. A bright worker is likely to have
a bright sister or brother. But: the average IQ score difference between
siblings is eleven or twelve points, so, again, test scores would predict
proficiency better than judging an applicant by the work of a brother or
sister.
Modeling the economic impact of testing has additional complexi-
ties. It has been noted that the applicant pool would gradually get de-
pleted of the top scorers when every successive employer tries to hire
top down.59 As the smart people are hired and thereby removed from
the applicant pool, the validity of a test for those still on the job mar-
ket may change because of, for example, restriction of range. The eco+
The Economic Pressure to Partition
- High-stakes industries like law and investment banking utilize extreme selection ratios, sometimes hiring only one in several hundred applicants.
- Even within a pool of elite candidates, significant productivity differences exist between those at the 98th percentile versus the 99.9th percentile.
- The economic value of output in top-tier firms is so high that marginal gains in cognitive ability translate into massive financial returns.
- A 1939 New York City police recruitment case study demonstrates that hiring from the top of the cognitive pool leads to extraordinary career success and leadership.
- The 'restriction of range' phenomenon complicates testing as top scorers are removed from the labor pool, yet the incentive to hire the smartest remains powerful.
The dollar value of output is so high that the difference between a new hiree who is two standard deviations above the mean and one who is four standard deviations above the mean on any given predictor measure can mean a huge economic difference.
84
The Emergence ofa Cognitive Elite
The Economic Pressure to Partition
85
the range illustrated in the figure below. Given that information, we
may estimate the expected output difference between two dentists
who score at the 50th and 84th percentiles on an intelligence test as
being worth $30,000 a year.[501
The corresponding difference between
two receptionists who score at the 50th and 84th percentiles in in.
tefligence is $750 a year. And this is what we meant by an "interace
tion effect": the wage of the dentist is only four times that of the
receptionist. But the value to the employer of hiring brighter dentists
is forty times greater than the value of hiring comparably brighter
In a realelife situation, the value of a test (or any other selection pro.
cedure) depends on another factor: How much choice does the employer
have!52 There is no point in spending money on an intelligence test if
only one applicant shows up. If ten applicants show up for the job, how.
ever, a test becomes attractive. The figure below illustrates the eco-
nomic benefit of testing with different levels of competition for the job
(from one to fifty applicants per job) and different tests (from a very
The advantages of hiring by test score
Percentage increase in productivity
1 5 0 % ~
If the test's validity is .6 +
If the test's validity is .4
If the test's validity is .2
0% 11
,
I
I
0
I
10
I
20
i
30
40
50
Number of applicants for each job
poor one with a validity of .2 to a very strong one with a validity of .6).["'
If everyone is hired, then, on average, the hired person is just at the av-
erage level of proficiency, which is a standard score of 0,
But as soon as
even two applicants are available per position, the value of testing rises
quickly. With just two applicants per position, the employer gains 16 to
48 percent in productivity, depending on the validity of the test.[541
The
curve quickly begins to flatten out; much of the potential value of test-
ing has already been captured when there are three applicants per job.
The figure above is an answer to those who claim that a correlation of,
say, .4 is too small to bother
A validity of .4 (or even .6) may be
unimportant if allnost all applicants are hired, but even a correlation of
.2 (or still smaller) may be important if only a small proportion gets
hired.
The Macroeconomic Costs of Not Testing
Since the pivotal Supreme Court decision of Griggs v. Duke Power Co,
in 197 1, no large American employer has been able to hire from the top
down based on intelligence tests. Estimates vary widely for how much
the American economy loses by not doing so, from what Hunter and
Hunter conclude is a minimum loss of $80 billion in 1980 (and in 1980
dollars) to what the Hartigan committee thought was a maximum loss
of $13 billion for that year.56 The wide range reflects the many impon.
derables in rnaking these calculations. For one thing, many attributes of
an applicant other than a test score are correlated with intelligence-
educational level, for example. Schooling captures some, but not all, of
the predictive value of intelligence. Or consider an employer using fam.
ily connections to hire instead of tests. A bright worker is likely to have
a bright sister or brother. But: the average IQ score difference between
siblings is eleven or twelve points, so, again, test scores would predict
proficiency better than judging an applicant by the work of a brother or
sister.
Modeling the economic impact of testing has additional complexi-
ties. It has been noted that the applicant pool would gradually get de-
pleted of the top scorers when every successive employer tries to hire
top down.59 As the smart people are hired and thereby removed from
the applicant pool, the validity of a test for those still on the job mar-
ket may change because of, for example, restriction of range. The eco+
86
The Emergence of a Cognitive Elite
The Economic Pressure to Partition
87
When Only the Best Will Do
A selection ratio of one in fifty may seem unrealistic, and so it is for the
run-of-the-mill job. But for the most competitive jobs, much higher ratios,
up to one in several hundred, are common. Consider the handful of new
openings in top law firms or for internships in the most desirable research
hospitals or in the richest investment banking firms for which each year's
new graduates are competing. Many potential applicants select themselves
out of the pool for those prized jobs, realizing that the openings will be
filled by people with stronger credentials, but they must nevertheless be
reckoned as being part of the applicant pool in order to get a realistic
estimate of the importance of cognitive ability. This is again the issue
exemplified by the weight of offensive tackles, discussed earlier in the
chapter.
The question arises whether the employer gains much by a rigorous se-
lection process for choosing among the people who actually do show up at
the job interview. Aren't they already so highly screened that they are, in
effect, homogeneous? The answer is intimately related to the size of the
stakes. When the job is in a top Wall Street firm, for example, the dollar
value of output is so high that the difference between a new hiree who is
two standard deviations above the mean and one who is four standard de-
viations above the mean on any given predictor measure can mean a huge
economic difference, even though the "inferior" applicant is already far
into the top few centiles in ability.
nomic benefit of using a test would then decline. But if testing tended
to place the smartest people in the jobs where the test-job correlations
are large, the spread of the productivity distributions is broad, the ab-
solute levels of output value are high, and the proportions hired are
small, the benefits could be huge, even if the economic effects of test-
ing the last people in the pool are negligible. In short, figuring out the
net effects of testing or not testing is no small matter. N o one has yet
done it conclusively,
WHY PARTITIONING IS INEVITABLE
To recapitulate a complex discussion: Proficiency in most common
civilian and military occupations can be predicted by IQ, with a n over-
Choosing Police Applicants by IQ
A case study of what happens when a public service is able to hire from the
top down on a test of cognitive ability, drawing on a large applicant pool,
comes out of New York City. In April 1939, after a decade of economic de-
pression, New York City attracted almost 30,000 men to a written and
physical examination for 300 openings in the city's police force, a selec-
tion ratio of approximately one in a hundred.57 The written test was simi-
lar to the intelligence test then being given by the federal civil service.
Positions were offered top down for a composite score on the mental and
physical tests, with the mental test more heavily weighted by more than
two to one. Not everyone accepted the offer, but, times being what they
were, the 300 slots were filled by men who earned the top 350 scores. Inas-
much as the performance of police officers has been shown to correlate sig-
nificantly with scores on intelligence tests,5R this group of men should have
made outstanding policemen. And they did, achieving extraordinarily suc-
cessful careers in and out of policing. They attained far higher than aver-
age rank as police officers. Of the entire group, four have been police chiefs,
four deputy commissioners, two chiefs of personnel, one a chief inspector,
and one became commissioner of the New York Police Department. They
suffered far fewer disciplinary penalties, and they contributed significantly
to the study and teaching of policing and law enforcement. Many also had
successful careers as lawyers, businessmen, and academics after leaving the
police department.
all validity that may conservatively be placed at .4. The more demand*
ing a job is cognitively, the more predictive power such a test has, but
no common job is so undemanding that the test totally lacks predic-
tiveness. For the job market as a whole, cognitive ability predicts profi.
ciency better than any other known variable describing a n individual,
including educational level. Intelligence tests are usually more predic.
tive of proficiency than are paper-and-pencil tests that are specifically
based on a job's activities, For selecting large numbers of workers, there
may be some added predictive power, usually small, when a score on a
narrower test of performance is combined with a n intelligence test. For
low-complexity jobs, a test of motor skill often adds materially to pre-
dictiveness. The predictive power of I Q derives from its loading on g,
in Spearman's sense of general intelligence.
Intelligence and Job Performance
- Cognitive ability is the single most predictive variable for job proficiency across all employment sectors, often outperforming educational level and job-specific tests.
- The predictive power of intelligence tests is derived from 'g', or general intelligence, and increases as the cognitive demands of a job become more complex.
- From an economic standpoint, even marginally predictive tests can yield significant profit for employers by identifying high-productivity workers at a low administrative cost.
- Legislative or judicial restrictions on formal testing do not eliminate the underlying importance of intelligence in the labor market.
- Employers naturally gravitate toward hiring smarter individuals by refining their selection processes based on employee quality, even if they do not explicitly target 'intelligence.'
- Alternative hiring criteria like biographical data and reference checks are effective primarily because they serve as imperfect proxies for an applicant's cognitive ability.
Getting rid of intelligence tests in hiring--as policy is hying to do-will not get rid of the importance of intelligence.
86
The Emergence of a Cognitive Elite
The Economic Pressure to Partition
87
When Only the Best Will Do
A selection ratio of one in fifty may seem unrealistic, and so it is for the
run-of-the-mill job. But for the most competitive jobs, much higher ratios,
up to one in several hundred, are common. Consider the handful of new
openings in top law firms or for internships in the most desirable research
hospitals or in the richest investment banking firms for which each year's
new graduates are competing. Many potential applicants select themselves
out of the pool for those prized jobs, realizing that the openings will be
filled by people with stronger credentials, but they must nevertheless be
reckoned as being part of the applicant pool in order to get a realistic
estimate of the importance of cognitive ability. This is again the issue
exemplified by the weight of offensive tackles, discussed earlier in the
chapter.
The question arises whether the employer gains much by a rigorous se-
lection process for choosing among the people who actually do show up at
the job interview. Aren't they already so highly screened that they are, in
effect, homogeneous? The answer is intimately related to the size of the
stakes. When the job is in a top Wall Street firm, for example, the dollar
value of output is so high that the difference between a new hiree who is
two standard deviations above the mean and one who is four standard de-
viations above the mean on any given predictor measure can mean a huge
economic difference, even though the "inferior" applicant is already far
into the top few centiles in ability.
nomic benefit of using a test would then decline. But if testing tended
to place the smartest people in the jobs where the test-job correlations
are large, the spread of the productivity distributions is broad, the ab-
solute levels of output value are high, and the proportions hired are
small, the benefits could be huge, even if the economic effects of test-
ing the last people in the pool are negligible. In short, figuring out the
net effects of testing or not testing is no small matter. N o one has yet
done it conclusively,
WHY PARTITIONING IS INEVITABLE
To recapitulate a complex discussion: Proficiency in most common
civilian and military occupations can be predicted by IQ, with a n over-
Choosing Police Applicants by IQ
A case study of what happens when a public service is able to hire from the
top down on a test of cognitive ability, drawing on a large applicant pool,
comes out of New York City. In April 1939, after a decade of economic de-
pression, New York City attracted almost 30,000 men to a written and
physical examination for 300 openings in the city's police force, a selec-
tion ratio of approximately one in a hundred.57 The written test was simi-
lar to the intelligence test then being given by the federal civil service.
Positions were offered top down for a composite score on the mental and
physical tests, with the mental test more heavily weighted by more than
two to one. Not everyone accepted the offer, but, times being what they
were, the 300 slots were filled by men who earned the top 350 scores. Inas-
much as the performance of police officers has been shown to correlate sig-
nificantly with scores on intelligence tests,5R this group of men should have
made outstanding policemen. And they did, achieving extraordinarily suc-
cessful careers in and out of policing. They attained far higher than aver-
age rank as police officers. Of the entire group, four have been police chiefs,
four deputy commissioners, two chiefs of personnel, one a chief inspector,
and one became commissioner of the New York Police Department. They
suffered far fewer disciplinary penalties, and they contributed significantly
to the study and teaching of policing and law enforcement. Many also had
successful careers as lawyers, businessmen, and academics after leaving the
police department.
all validity that may conservatively be placed at .4. The more demand*
ing a job is cognitively, the more predictive power such a test has, but
no common job is so undemanding that the test totally lacks predic-
tiveness. For the job market as a whole, cognitive ability predicts profi.
ciency better than any other known variable describing a n individual,
including educational level. Intelligence tests are usually more predic.
tive of proficiency than are paper-and-pencil tests that are specifically
based on a job's activities, For selecting large numbers of workers, there
may be some added predictive power, usually small, when a score on a
narrower test of performance is combined with a n intelligence test. For
low-complexity jobs, a test of motor skill often adds materially to pre-
dictiveness. The predictive power of I Q derives from its loading on g,
in Spearman's sense of general intelligence.
88
The Emergence of a Cognitive Elite
The Economic Pressure to Partition
89
If we were writing a monograph for personnel managers, the appro-
priate next step would be to present a handbook of tables for comput-
ing when it makes economic sense to test new applicants (ignoring for
the moment legislative and judicial restrictions on such testing). Such
a calculation would be based on four variables: the predictive power of
the test for the job at hand, the variation in worker productivity for
the job at hand, the proportion of job applicants that are to be selected,
and the cost of testing, The conclusion would often be that testing is
profitable. Even a marginally predictive test can be economically itn-
portant if only a small fraction of applicants is to be selected. Even a
marginally predictive test may have a telling economic impact if the
variation in productivity is wide. And for most occupations, the test is
more than marginally predictive. In the average case, a test with a .4
validity, the employer who uses a cognitive test captures 40 percent of
the profit that would be realized from a perfectly predictive test-no
small advantage. In an era when a reliable intelligence test can be ad-
ministered in twelve minutes, the costs of testing can be low-lower
in terms of labor than, for example, conducting an interview or check-
ing references.
We are not writing a monograph for personnel managers, however,
and the main point has nothing to do with whether one favors or op-
poses the use of tests as a hiring device. The main point is rather that
intelligence itself is importantly related to job performance. Getting rid
of intelligence tests in hiring--as policy is hying to do-will not get rid of the
importance of intelligence. The alternatives that employers have available
to them-biographical
data, reference checks, educational record, and
so forth-are
valid predictors of job performance in part because they
imperfectly reflect something about the applicant's intelligence. Em-
ployers who are forbidden to obtain test scores nonetheless strive to ob.
tain the best possible work force, and it so happens that the way to get
the best possible work force, other things equal, is to hire the smartest
people they can find. It is not even necessary for employers to be aware
that intelligence is the attribute they are looking for. As employers
check their hiring procedures against the quality of their employees and
refine their procedures accordingly, the importance of intelligence in
the selection process converges on whatever real importance it has for
the job in question, whether or not they use a formal test.
Because the economic value of their employees is linked to intelli-
gence, so ultimately are their wages. Let us consider that issue in the
next chapter, along with some others that have interlocking implica-
tions as we try to foresee, however dimly, what the future holds for the
cognitive elite.
Steeper Ladders, Narrower Gates
- The economic value of intelligence is rising, causing wages in high-IQ occupations to pull away from the rest of the labor market.
- The cognitive elite are becoming physically and socially segregated, working and living in environments isolated from the general population.
- As environmental opportunities are equalized through social policy, genetic differences become the primary driver of remaining intellectual variance.
- Assortative mating—the tendency for people to marry those with similar IQs—is intensifying the concentration of cognitive ability in the next generation.
- The modern educational and occupational systems act as efficient sorting mechanisms that funnel high-ability individuals into a narrow set of elite roles.
- These trends are driven by market forces and productivity requirements that are unlikely to be reversed by any government administration.
The irony is that as America equalizes the circumstances of people's lives, the remaining differences in intelligence are increasingly determined by differences in genes.
88
The Emergence of a Cognitive Elite
The Economic Pressure to Partition
89
If we were writing a monograph for personnel managers, the appro-
priate next step would be to present a handbook of tables for comput-
ing when it makes economic sense to test new applicants (ignoring for
the moment legislative and judicial restrictions on such testing). Such
a calculation would be based on four variables: the predictive power of
the test for the job at hand, the variation in worker productivity for
the job at hand, the proportion of job applicants that are to be selected,
and the cost of testing, The conclusion would often be that testing is
profitable. Even a marginally predictive test can be economically itn-
portant if only a small fraction of applicants is to be selected. Even a
marginally predictive test may have a telling economic impact if the
variation in productivity is wide. And for most occupations, the test is
more than marginally predictive. In the average case, a test with a .4
validity, the employer who uses a cognitive test captures 40 percent of
the profit that would be realized from a perfectly predictive test-no
small advantage. In an era when a reliable intelligence test can be ad-
ministered in twelve minutes, the costs of testing can be low-lower
in terms of labor than, for example, conducting an interview or check-
ing references.
We are not writing a monograph for personnel managers, however,
and the main point has nothing to do with whether one favors or op-
poses the use of tests as a hiring device. The main point is rather that
intelligence itself is importantly related to job performance. Getting rid
of intelligence tests in hiring--as policy is hying to do-will not get rid of the
importance of intelligence. The alternatives that employers have available
to them-biographical
data, reference checks, educational record, and
so forth-are
valid predictors of job performance in part because they
imperfectly reflect something about the applicant's intelligence. Em-
ployers who are forbidden to obtain test scores nonetheless strive to ob.
tain the best possible work force, and it so happens that the way to get
the best possible work force, other things equal, is to hire the smartest
people they can find. It is not even necessary for employers to be aware
that intelligence is the attribute they are looking for. As employers
check their hiring procedures against the quality of their employees and
refine their procedures accordingly, the importance of intelligence in
the selection process converges on whatever real importance it has for
the job in question, whether or not they use a formal test.
Because the economic value of their employees is linked to intelli-
gence, so ultimately are their wages. Let us consider that issue in the
next chapter, along with some others that have interlocking implica-
tions as we try to foresee, however dimly, what the future holds for the
cognitive elite.
Chapter 4
Steeper Ladders, Narrower Gates
Cognitive partitioning through education and occupations will continue, and
there is not much that the government trr anyone else can do about it. Eco-
nomics wlill he the main reason. At the same time that elite colkges and pro-
fessional schools are turning out brighter and bnghter graduates, the value of
intelligence in the marketplace is rising. Wages earned by peopk in high-IQ
occupations have pulkd away from the wages in low-1Q occupations, and dif-
ferences in education cannot explain most of this change.
Another force for cognitive partitioning is the increasing physical segrega-
tion of the cognitive elite from the rest of society. Members of the cognitive
elite wcrrk in jobs that usually keep them off the shop floor, away from the con-
sm4cciot1 site, and close to others who also tend to he smart. Computers and
electronic communication make it increa$ingly likely that peopk who work
mainly with their minds collaburate only with other such people. The isolation
of the cognitie~e elite is compounded by its choices of where to live, shop, phy,
worship, and send its children to school.
Its isolation is intensified by an irony of a mobile and democratic society
like America's. Cognitiele ahility is a function of both genes and environment,
with implications for egalitarian social policies. The more we succeed in giv-
ing every youngster a chance to develop his or her latent cognitive ability, the
more we equalize the environmental sources of differences in intelligence.
The irony is that as America equalires the circumstances of people's lives,
the remaining differences in intelligence are increasingly determined
dif-
ferences in genes. Meanwhile, high cognitive ahility means, more than ever
before, that the chances of success in life are good and getting better all the
time. Putting it all together, success and failure in the American economy,
and all that goes with it, are increasingly a matter of the genes that people
inherit .
Add to this the phenomenon known as assortative mating. Likes attract
when it comes to marriage, and intelligence is one of the most important of
92
The Emergence of a Cognitive Elite
Steeper Ladders, Narrower Gates
93
those likes. When this propensity to mate
1Q is combined with inc~easindy
eficient educational and occupational stratification, assmtative mating ky IQ
has more powerful effects on the next generation than it had on the previow
one. This process too seems to be getting stronger, part of the brew creating
an American class sys tem .
A
s Mae West said in another context, goodness has nothing tc) cio
with it. We are not talking about what should have been but
what has been. The educational system does sort by cognitive ahility
at the close of the twentieth century in a way that it did not at the
opening of the century. The upper strata of intelligence are being
sucked into a comparatively few occupations in a way that they did not
used to be. Cognitive ability is importantly related to job proJuctivity.
All of these trends will continue under any social policy. We are op-
timistic enough to believe that no administration, Left or Right, is
going to impede the education of the brightest, or forhici the brightest
from entering the most cognitively demanding occupations, or find
a way to keep employers from rewarding productivity. Rut we are
not so optimistic that we can overlook dark shadows accompanying
the trends.
To this point, we have avoided saying what social consequences
might be expected. This omission has been deliberate, for part of a can-
did answer must be, "We aren't sure." We can he sure only that the trends
are important. Cognitive stratification as a central social process is
something genuinely new under the sun. One of our FUqWSeS is to bring
it to public attention, hopeful that wisdom will come from encouraging
more people to think about it.
It is impossible to predict all the ways in which cognitive strati-
fication will interact with the workings of an American democracy that
is in flux. We do have some thoughts on the matter, however, and in
this chapter use the available scientific data to peer into the future. The
data center on the dynamics that will make cognitive stratification more
pronounced in the years to come-the
differences greater, the over-
lap smaller, the separation wider. We reserve our larger speculations
about the social consequences for Chapters 21 and 22.
THE CHANGING MARKET FOR ABILITY
The overriding dynamic that will shape the effects of cognitive stratifi-
cation is the increasing value of intelligence in the marketplace. The
smart ones are not only being recruited to college more efficiently, they
are not only (on average) more productive in the workplace, their dol-
lar value to employers is increasing and there is every reason to believe
that this trend will continue. As it does so, the economic gap separat-
ing the upper cognitive classes from the rest of society will increase.
The general shape of what has been happening is shown in the fig-
ure for a representattve high-IQ occupation, engineering, compared to
the average manufacturing employee, starting back in 1932. As always,
dollar figures are expressed in 1990 dollars. The 1950s turn out to have
been the decade of hidden revolution for income, just as it was for ed-
ucation and status. Throughout the 1930s and 1940s, the average engi-
neer and the average manufacturing employee remained in roughly a
constant economic relationship, even convergrng slightly. Then from
Engineers' salaries as an example of how intelligence
became much more valuable in the 1950s
Annual salary in 1990 dollars
$80.000 -
$50.000 -
Trendlines established in ...
$40.000 -
I
Engineers
... 1929-53
-
--.-.---
-7
**--
-
- o
Manufacturing employees
Source: U.S. Bureau of the Census 1975, Tables D802-810, D913.926; Rureau of Lahor Sta-
tistics 19R9, Tahles 80. 106.
The Rising Value of Intelligence
- Cognitive stratification is identified as a novel social process where intelligence increasingly dictates social and economic standing.
- The marketplace value of high-IQ individuals is rising, leading to more efficient recruitment and higher productivity for the 'cognitive elite.'
- Historical data shows a divergence beginning in the 1950s, where salaries for high-IQ professions like engineering began to outpace manufacturing wages significantly.
- By the late 1980s, the purchasing power gap between engineers and manufacturing workers tripled, moving them into distinct economic brackets.
- The 1980s presented a complex economic picture where household income rose due to dual-income families, but real wages for blue-collar workers often declined.
Cognitive stratification as a central social process is something genuinely new under the sun.
92
The Emergence of a Cognitive Elite
Steeper Ladders, Narrower Gates
93
those likes. When this propensity to mate
1Q is combined with inc~easindy
eficient educational and occupational stratification, assmtative mating ky IQ
has more powerful effects on the next generation than it had on the previow
one. This process too seems to be getting stronger, part of the brew creating
an American class sys tem .
A
s Mae West said in another context, goodness has nothing tc) cio
with it. We are not talking about what should have been but
what has been. The educational system does sort by cognitive ahility
at the close of the twentieth century in a way that it did not at the
opening of the century. The upper strata of intelligence are being
sucked into a comparatively few occupations in a way that they did not
used to be. Cognitive ability is importantly related to job proJuctivity.
All of these trends will continue under any social policy. We are op-
timistic enough to believe that no administration, Left or Right, is
going to impede the education of the brightest, or forhici the brightest
from entering the most cognitively demanding occupations, or find
a way to keep employers from rewarding productivity. Rut we are
not so optimistic that we can overlook dark shadows accompanying
the trends.
To this point, we have avoided saying what social consequences
might be expected. This omission has been deliberate, for part of a can-
did answer must be, "We aren't sure." We can he sure only that the trends
are important. Cognitive stratification as a central social process is
something genuinely new under the sun. One of our FUqWSeS is to bring
it to public attention, hopeful that wisdom will come from encouraging
more people to think about it.
It is impossible to predict all the ways in which cognitive strati-
fication will interact with the workings of an American democracy that
is in flux. We do have some thoughts on the matter, however, and in
this chapter use the available scientific data to peer into the future. The
data center on the dynamics that will make cognitive stratification more
pronounced in the years to come-the
differences greater, the over-
lap smaller, the separation wider. We reserve our larger speculations
about the social consequences for Chapters 21 and 22.
THE CHANGING MARKET FOR ABILITY
The overriding dynamic that will shape the effects of cognitive stratifi-
cation is the increasing value of intelligence in the marketplace. The
smart ones are not only being recruited to college more efficiently, they
are not only (on average) more productive in the workplace, their dol-
lar value to employers is increasing and there is every reason to believe
that this trend will continue. As it does so, the economic gap separat-
ing the upper cognitive classes from the rest of society will increase.
The general shape of what has been happening is shown in the fig-
ure for a representattve high-IQ occupation, engineering, compared to
the average manufacturing employee, starting back in 1932. As always,
dollar figures are expressed in 1990 dollars. The 1950s turn out to have
been the decade of hidden revolution for income, just as it was for ed-
ucation and status. Throughout the 1930s and 1940s, the average engi-
neer and the average manufacturing employee remained in roughly a
constant economic relationship, even convergrng slightly. Then from
Engineers' salaries as an example of how intelligence
became much more valuable in the 1950s
Annual salary in 1990 dollars
$80.000 -
$50.000 -
Trendlines established in ...
$40.000 -
I
Engineers
... 1929-53
-
--.-.---
-7
**--
-
- o
Manufacturing employees
Source: U.S. Bureau of the Census 1975, Tables D802-810, D913.926; Rureau of Lahor Sta-
tistics 19R9, Tahles 80. 106.
94
7%
Emergence of a Cognitive Elite
Steeper Ladders, Narrower Gates
95
Were the 1980s Good or Bad for Income?
There are half a dozen different ways to view the economy during the
1980s. Because most of it fell in Ronald Reagan's presidency, an intense
political struggle to characterize the decade as economically "good" or
"bad" has ensued. The main source of confusion lies in the distinction be-
tween household income, which went up for all income groups, driven by
the increase in two-income families and low unemployment, and real
wages, which (generally) rose for white-collar workers and fell for hlue-col-
lar workers. There are also confusions that arise hecause the value of hen-
efit packages rose even though cash wages did not and because of
controversies over the proper calculation of changes in real purchasing
power. We will not try to adjudicate these issues or the role that President
Reagan's economic policies played, which have taken whole hooks to ar-
gue out.
1953 to 1961 the average engineer's salary nearly doubled while the
manufacturing employee's salary followed the same gradually rising
trend and increased by only 20 percent. By the end of the 1980s, the av-
erage manufacturing employee had to get by on about $23,000 a year
while the engineer made an average of $72,000. The difference in their
purchasing power had tripled since the 1940s, which is enough to put
them in separate economic brackets.
The comparison between engineers and manufacturing employees 1s
a microcosm of what has happened generally to American workers. Us-
ing data from the Current Population Surveys, economists Lawrence
Katz and Kevin Murphy, among others, have established that from 1963
to 1987, male workers making the highest 10 percent of wages enjoyed
a rise of about 40 percent, while the real wages of those at the corre-
sponding low end were close to static.'
We opened the chapter by asserting that cognitive ability has been a
key factor in this process. Next we look at the reasons for this conclu-
sion.
The Role of Education
The standard way of interpreting the figure for engineers and manufac-
turing is to talk about education. During the last quarterecentury, real
wages rose more than twice as much for workers with college educations
than for those with high school or less.'21 Trends were not uninterrupted
within the interval. Following the huge expansion of the post-World
War I1 college population, it seemed for a while that the economic ben-
efits of education were being swamped by oversupply, as wages fell dur-
ing the 1970s for college-educated people.3 But in the 1980s, the trend
reversed. Real wages for highly educated people started once again to
climb and wages fell for those with twelve or fewer years of schooling.'''
The table below gives the percentage change in real wages for full-
time male workersl5I at three educational levels during the 1980s, bro-
ken out by whether they are new workers (one to five or twenty-six to
thirty-five years of work experience). The dramatic changes occurred
Education, Experience, and Wages, 1979-1987
Percentage Change
in Wages
New workers ( 1-5 years of experience)
Less than 12 years of school
-15.8
High schcx)I degree
- 19.8
16 or more years of school
+10.R
Old workers (26-35 years of experience)
Less than 12 years of school
-1.9
High school degree
-2.8
16 or more years of school
+ 1.8
Source. Adapted from Katz and Murphy, 1990, Table 1.
among young men just coming into the labor market. High school grad-
uates and dropouts saw their real wages plunge, while young men with
college educations enjoyed a healthy increase.'" Meanwhile, experi-
enced older men saw little real change in income whatever their level
of education. Why the difference between the age groups? Interpre-
tively, wages for men with many years of experience reflect their work
history as well as their immediate economic value. Wages for people just
entering the labor force are more purely an expression of prevailing mar-
ket forces. The job market reevaluated schooling during the past two
decades: Educated workers, having been devalued in the 1970s, became
increasingly valuable in the 1980s, in comparison with less educated
workers.'"
Education and Wage Inequality
- From 1963 to 1987, the highest-earning American male workers saw a 40 percent wage increase while low-end wages remained static.
- The 1980s marked a sharp reversal of 1970s trends, with real wages climbing for the college-educated and falling for those with high school diplomas or less.
- Wage shifts were most dramatic among young workers entering the labor market, where high school dropouts saw real wages plunge by nearly 16 percent.
- Wages for new entrants are viewed as a 'pure' expression of market forces, indicating a fundamental reevaluation of the economic value of schooling.
- The widening income gap is attributed to various factors including technological displacement, global outsourcing of blue-collar jobs, and the decline of labor unions.
- The text questions whether simply increasing years of schooling can fix the economic disadvantage of low-wage earners in a changing market.
The job market reevaluated schooling during the past two decades: Educated workers, having been devalued in the 1970s, became increasingly valuable in the 1980s, in comparison with less educated workers.
94
7%
Emergence of a Cognitive Elite
Steeper Ladders, Narrower Gates
95
Were the 1980s Good or Bad for Income?
There are half a dozen different ways to view the economy during the
1980s. Because most of it fell in Ronald Reagan's presidency, an intense
political struggle to characterize the decade as economically "good" or
"bad" has ensued. The main source of confusion lies in the distinction be-
tween household income, which went up for all income groups, driven by
the increase in two-income families and low unemployment, and real
wages, which (generally) rose for white-collar workers and fell for hlue-col-
lar workers. There are also confusions that arise hecause the value of hen-
efit packages rose even though cash wages did not and because of
controversies over the proper calculation of changes in real purchasing
power. We will not try to adjudicate these issues or the role that President
Reagan's economic policies played, which have taken whole hooks to ar-
gue out.
1953 to 1961 the average engineer's salary nearly doubled while the
manufacturing employee's salary followed the same gradually rising
trend and increased by only 20 percent. By the end of the 1980s, the av-
erage manufacturing employee had to get by on about $23,000 a year
while the engineer made an average of $72,000. The difference in their
purchasing power had tripled since the 1940s, which is enough to put
them in separate economic brackets.
The comparison between engineers and manufacturing employees 1s
a microcosm of what has happened generally to American workers. Us-
ing data from the Current Population Surveys, economists Lawrence
Katz and Kevin Murphy, among others, have established that from 1963
to 1987, male workers making the highest 10 percent of wages enjoyed
a rise of about 40 percent, while the real wages of those at the corre-
sponding low end were close to static.'
We opened the chapter by asserting that cognitive ability has been a
key factor in this process. Next we look at the reasons for this conclu-
sion.
The Role of Education
The standard way of interpreting the figure for engineers and manufac-
turing is to talk about education. During the last quarterecentury, real
wages rose more than twice as much for workers with college educations
than for those with high school or less.'21 Trends were not uninterrupted
within the interval. Following the huge expansion of the post-World
War I1 college population, it seemed for a while that the economic ben-
efits of education were being swamped by oversupply, as wages fell dur-
ing the 1970s for college-educated people.3 But in the 1980s, the trend
reversed. Real wages for highly educated people started once again to
climb and wages fell for those with twelve or fewer years of schooling.'''
The table below gives the percentage change in real wages for full-
time male workersl5I at three educational levels during the 1980s, bro-
ken out by whether they are new workers (one to five or twenty-six to
thirty-five years of work experience). The dramatic changes occurred
Education, Experience, and Wages, 1979-1987
Percentage Change
in Wages
New workers ( 1-5 years of experience)
Less than 12 years of school
-15.8
High schcx)I degree
- 19.8
16 or more years of school
+10.R
Old workers (26-35 years of experience)
Less than 12 years of school
-1.9
High school degree
-2.8
16 or more years of school
+ 1.8
Source. Adapted from Katz and Murphy, 1990, Table 1.
among young men just coming into the labor market. High school grad-
uates and dropouts saw their real wages plunge, while young men with
college educations enjoyed a healthy increase.'" Meanwhile, experi-
enced older men saw little real change in income whatever their level
of education. Why the difference between the age groups? Interpre-
tively, wages for men with many years of experience reflect their work
history as well as their immediate economic value. Wages for people just
entering the labor force are more purely an expression of prevailing mar-
ket forces. The job market reevaluated schooling during the past two
decades: Educated workers, having been devalued in the 1970s, became
increasingly valuable in the 1980s, in comparison with less educated
workers.'"
96
The Emergence of a Cognitive Elite
Steeper Ladders, Narrower Gates
97
Why have the economic returns to education lately risen, thereby
widening the income gap between the educated and the uneducated?
Perhaps, say some commentators, the wage inequality prohlem is tech-
nological, as machines displace people from low-skill jobs. Perhaps
schools are failing to teach people skills that they used to teach, or maybe
the schools are doing as well as ever but the blue-collar jobs that require
only low-level skills are emigrating to countries where labor is cheaper,
thereby creating an oversupply of less educated workers in America. Per-
haps the welfare system is eroding the need to work among the low-skill
population, or the weakening lahor unions are not protecting their eco-
nomic interests, or a declining real minimum wage is letting the wage
structure sag at the low end.
These possibilities all bear on a crucial issue: How much good would ~t
do to improve education for the popk earning low wages? If somehow the
government can cajole or entice youths to stay in school for a few rx-
tra years, will their economic disadvantage in the new labor market go
away? We doubt it. Thew disadvantage might he dimin~shed, hut only
modestly. There is reason to think that the job market has heen re-
warding not just education but intelligence.'
The My s ten'ous Residual
The indispensable database for analyzing wages over time is the Cur-
rent Population Survey, the monthly national survey conducted hy the
Bureau of the Census and the Bureau of Labor Statistics, which asks peo-
ple only about their years of education, not their lQs. Rut as the so-
phisticated statistical analyses d wage variation have accumulated,
experts have come to agree that something beyond education, gender,
and experience has been at work to increase income disparities in re-
cent times9 The spread in real wages grew between 1963 and 1987 even
after taking those other factors into account."" l
e
economic term for
this unexplained variation in wages is "the residual."'"'
To understand the growing wage inequality requires an account
of this residual variation. Residual wage variation for hoth men and
women started rising in about 1970 and seems still to be rising. Among
economists, there is a consensus that, whatever those residual charac-
teristics consist of, it has been mainly the demand for them, not their
supply, that has been changing and causing increasing wage inequality
for a generation, with no signs of abating." Despite the public focus on
the increasing importance of education in the workplace, most of the
increasing wage inequality during the past two and a half decades is due
to changes in the demand for the residual characteristics of workers
rather than to changes in the demand for education or experience.13 The
job market for people lacking the residual characteristics declined, while
expanding for people having them.
The Case for IQ as the Residual
What then is this residual, this X factor, that increasingly commands a
wage premium over and above education? I t could be a variety of fac-
tors. It could be rooted in diligence, ambition, or sociability."41 It could
be associated with different industries or different firms within indus-
tries, or different wage norms (e.g., regional variations, variations in
merit pay), again insofar as they are not accounted for by the measured
variables. Or it could be cognitive ability. Conclusive evidence is hard
to come by, but readers will not be surprised to learn that we believe
that it includes cognitive ability. There are several lines of support for
this hypothesis.
As a first cut at the problem, the changing wages have something to
do with the shifting occupational structure of our economy. High-sta-
tus, and therefore relatively high-paying, jobs are tipped toward people
with high intelligence, as Chapter 2 showed. As the high-end jobs have
become more numerous, demand must rise for the intellectual abilities
that they require. When demand rises for any good, including intelli-
gence, the price (in this case, the wages) goes up. Purely on economic
grounds, then, wage inequality grew as the economic demand for intel-
ligence climbed.
We further know from the data discussed in Chapter 3 that cogni-
tive ability affects how well workers at all levels do their jobs. If smarter
workers are, on average, better workers, there is reason to believe
that income within job categories may be correlated with intelli-
gence.
Still further, we know that the correlation between intelligence and
income is not much diminished by partialing out the contributions of
education, work experience, marital status, and other demographic vari-
able~.'~
Such a finding strengthens the idea that the job market is in-
creasingly rewarding not just education but intelligence.
Finally, McKinley Blackbum and David Neumark have provided
The Mysterious Wage Residual
- Statistical analysis of wage variation reveals a 'residual' factor beyond education, gender, and experience that drives income disparity.
- Since 1970, the demand for these residual characteristics has risen steadily while the supply has not kept pace.
- Most of the increasing wage inequality over the last twenty-five years is attributed to this residual rather than formal education levels.
- The authors argue that cognitive ability is a primary component of this X factor, commanding an increasing wage premium.
- The shifting occupational structure toward high-status jobs naturally increases the economic demand and price for high intelligence.
- Data suggests that intelligence correlates with job performance and income even when controlling for demographic variables and work experience.
The job market for people lacking the residual characteristics declined, while expanding for people having them.
96
The Emergence of a Cognitive Elite
Steeper Ladders, Narrower Gates
97
Why have the economic returns to education lately risen, thereby
widening the income gap between the educated and the uneducated?
Perhaps, say some commentators, the wage inequality prohlem is tech-
nological, as machines displace people from low-skill jobs. Perhaps
schools are failing to teach people skills that they used to teach, or maybe
the schools are doing as well as ever but the blue-collar jobs that require
only low-level skills are emigrating to countries where labor is cheaper,
thereby creating an oversupply of less educated workers in America. Per-
haps the welfare system is eroding the need to work among the low-skill
population, or the weakening lahor unions are not protecting their eco-
nomic interests, or a declining real minimum wage is letting the wage
structure sag at the low end.
These possibilities all bear on a crucial issue: How much good would ~t
do to improve education for the popk earning low wages? If somehow the
government can cajole or entice youths to stay in school for a few rx-
tra years, will their economic disadvantage in the new labor market go
away? We doubt it. Thew disadvantage might he dimin~shed, hut only
modestly. There is reason to think that the job market has heen re-
warding not just education but intelligence.'
The My s ten'ous Residual
The indispensable database for analyzing wages over time is the Cur-
rent Population Survey, the monthly national survey conducted hy the
Bureau of the Census and the Bureau of Labor Statistics, which asks peo-
ple only about their years of education, not their lQs. Rut as the so-
phisticated statistical analyses d wage variation have accumulated,
experts have come to agree that something beyond education, gender,
and experience has been at work to increase income disparities in re-
cent times9 The spread in real wages grew between 1963 and 1987 even
after taking those other factors into account."" l
e
economic term for
this unexplained variation in wages is "the residual."'"'
To understand the growing wage inequality requires an account
of this residual variation. Residual wage variation for hoth men and
women started rising in about 1970 and seems still to be rising. Among
economists, there is a consensus that, whatever those residual charac-
teristics consist of, it has been mainly the demand for them, not their
supply, that has been changing and causing increasing wage inequality
for a generation, with no signs of abating." Despite the public focus on
the increasing importance of education in the workplace, most of the
increasing wage inequality during the past two and a half decades is due
to changes in the demand for the residual characteristics of workers
rather than to changes in the demand for education or experience.13 The
job market for people lacking the residual characteristics declined, while
expanding for people having them.
The Case for IQ as the Residual
What then is this residual, this X factor, that increasingly commands a
wage premium over and above education? I t could be a variety of fac-
tors. It could be rooted in diligence, ambition, or sociability."41 It could
be associated with different industries or different firms within indus-
tries, or different wage norms (e.g., regional variations, variations in
merit pay), again insofar as they are not accounted for by the measured
variables. Or it could be cognitive ability. Conclusive evidence is hard
to come by, but readers will not be surprised to learn that we believe
that it includes cognitive ability. There are several lines of support for
this hypothesis.
As a first cut at the problem, the changing wages have something to
do with the shifting occupational structure of our economy. High-sta-
tus, and therefore relatively high-paying, jobs are tipped toward people
with high intelligence, as Chapter 2 showed. As the high-end jobs have
become more numerous, demand must rise for the intellectual abilities
that they require. When demand rises for any good, including intelli-
gence, the price (in this case, the wages) goes up. Purely on economic
grounds, then, wage inequality grew as the economic demand for intel-
ligence climbed.
We further know from the data discussed in Chapter 3 that cogni-
tive ability affects how well workers at all levels do their jobs. If smarter
workers are, on average, better workers, there is reason to believe
that income within job categories may be correlated with intelli-
gence.
Still further, we know that the correlation between intelligence and
income is not much diminished by partialing out the contributions of
education, work experience, marital status, and other demographic vari-
able~.'~
Such a finding strengthens the idea that the job market is in-
creasingly rewarding not just education but intelligence.
Finally, McKinley Blackbum and David Neumark have provided
98
The Emergence of a Cognitive Elite
Steeper Ladders, Narrower Gates
99
direct evidence in their analysis of white men in the National Longitu-
dinal Survey of Youth (NLSY). Education and intelligence each con-
tributed to a worker's income, but the smart men earned most of the
extra wage benefit of education during the past decade."" The growing
economic benefits of either schooling or intelligence are dispropor-
tionately embodied in the rising income of educated people with high
test scores and in the falling wages earned by less educated people with
low scores.""
This premium for IQ applies even within the high-IQ occupations
that we discussed in Chapter 2. In the NLSY, among people holding one
of these jobs, the 1989 weekly earnings (expressed in 1990 dollars) of
those in the top 10 percent of IQ were $977, compared to $697 for those
with IQs below the top 10 percent, for an annual income difference of
over $14,000.~~~'
Even after extracting any effects of their specific occu-
pations (as well as of the differing incomes of men and women), being
in the top 10 percent in IQ was still worth over $1 1,000 in income for
those in this collection of prestigious occupations.
Why Cognitive Ability Hm Become More Valuahk to Employers
This brings us as far as the data on income and intelligence go. Before
leaving the topic, we offer several reasons why the wage premium for
intelligence might have increased recently and may be expected to con-
tinue to increase.
Perhaps most obviously is that technology has increased the eco-
nomic value of intelligence. As robots replace factory workers, the fac-
tory workers' jobs vanish, but new jobs pop up for people who can design,
program, and repair robots. The new jobs are not necessarily going to
be filled by the same people, for they require more intelligence than the
old ones did. Today's technological frontier is more complex than yes-
terday's. Even in traditional industries like retailing, banking, mining,
manufacturing, and fanning, management gets ever more complex. The
capacity to understand and manipulate complexity, as earlier chapters
showed, is approximated by g, or general intelligence. We would have
predicted that a market economy, faced with this turn of events, would
soon put intelligence on the sales block. It has. Business consultancy is
a new profession that is soaking up a growing fraction of the graduates
of the elite business schools. The consultants sell mainly their trained
intelligence to the businesses paying their huge fees.
A second reason involves the effects of scale, spurred by the growth
in the size of corporations and markets since World War 11. A person
who can dream up a sales campaign worth another percentage point or
two of market share will be sought after. What "sought after" means in
dollars and cents depends on what a point of market share is worth. If
it is worth $500,000, the market for his services will produce one range
of salar~es. If a point of market share is worth $5 million, he is much
more valuable. If a point of market share is worth $100 million, he is
worth a fortune. Now consider that since just 1960, the average annual
sales, per corporation, of America's five hundred largest industrial cor-
porations has jumped from $1.8 billion to $4.6 billion (both figures in
1990 dollars). The same gigantism has affected the value of everything
from the ability to float successful bond offerings to the ability to nego-
tiate the best prices for volume purchases by huge retail chains. The
magnitude of the economic consequences of ordinary business transac-
tions has mushroomed, and with it the value of people who can do their
work at a marginally higher level of skill. All the evidence we have sug-
gests that such people have, among their other characteristics, high in-
telligence. There is no reason to think that this process will stop soon.
Then there are the effects of legislation and regulation. Why are cer.
tam kinds of lawyers who never see the inside of a courtroom able to
command such large fees? In many cases, because a first-rate lawyer can
make a difference worth tens of millions of dollars in getting a favorable
decision from a government agency or slipping through a tax loophole.
Lawyers are not the only beneficiaries. As the rules of the game gov-
erning private enterprise become ever more labyrinthine, intelligence
grows in value, sometimes in the most surprising places. One of our col-
leagues is a social psychologist who supplements his university salary by
serving as an adviser on jury selection, at a consulting fee of several thou-
sand dollars per day. Rased on his track record, his advice raises the prob-
ability of a favorable verdict in a liability or patent dispute by about 5
to 10 percent. When a verdict may represent a swing of $100 million,
an edge of that size makes him well worth his large fee.
We have not exhausted all the reasons that cognitive ability is
becoming more valuable in the labor market, but these will serve to
illustrate the theme: The more complex a society becomes, the more
valuable are the people who are especially good at dealing with com-
plexity. Barring a change in direction, the future is likely to see the rules
The Rising Premium of IQ
- Data from the National Longitudinal Survey of Youth indicates that the economic benefits of education are increasingly concentrated among those with high intelligence test scores.
- Even within high-IQ professional occupations, individuals in the top 10 percent of cognitive ability earn significantly higher annual incomes than their peers.
- Technological advancement is a primary driver of this trend, as complex new roles in robotics and programming replace simpler manual labor jobs.
- The increasing complexity of management in traditional industries like banking and farming has turned general intelligence into a highly marketable commodity.
- The growth in scale of global corporations means that even marginal improvements in performance by highly intelligent employees can result in millions of dollars in value.
- The rise of the business consultancy profession exemplifies the modern market's desire to 'buy' trained intelligence to navigate complex economic landscapes.
The magnitude of the economic consequences of ordinary business transactions has mushroomed, and with it the value of people who can do their work at a marginally higher level of skill.
98
The Emergence of a Cognitive Elite
Steeper Ladders, Narrower Gates
99
direct evidence in their analysis of white men in the National Longitu-
dinal Survey of Youth (NLSY). Education and intelligence each con-
tributed to a worker's income, but the smart men earned most of the
extra wage benefit of education during the past decade."" The growing
economic benefits of either schooling or intelligence are dispropor-
tionately embodied in the rising income of educated people with high
test scores and in the falling wages earned by less educated people with
low scores.""
This premium for IQ applies even within the high-IQ occupations
that we discussed in Chapter 2. In the NLSY, among people holding one
of these jobs, the 1989 weekly earnings (expressed in 1990 dollars) of
those in the top 10 percent of IQ were $977, compared to $697 for those
with IQs below the top 10 percent, for an annual income difference of
over $14,000.~~~'
Even after extracting any effects of their specific occu-
pations (as well as of the differing incomes of men and women), being
in the top 10 percent in IQ was still worth over $1 1,000 in income for
those in this collection of prestigious occupations.
Why Cognitive Ability Hm Become More Valuahk to Employers
This brings us as far as the data on income and intelligence go. Before
leaving the topic, we offer several reasons why the wage premium for
intelligence might have increased recently and may be expected to con-
tinue to increase.
Perhaps most obviously is that technology has increased the eco-
nomic value of intelligence. As robots replace factory workers, the fac-
tory workers' jobs vanish, but new jobs pop up for people who can design,
program, and repair robots. The new jobs are not necessarily going to
be filled by the same people, for they require more intelligence than the
old ones did. Today's technological frontier is more complex than yes-
terday's. Even in traditional industries like retailing, banking, mining,
manufacturing, and fanning, management gets ever more complex. The
capacity to understand and manipulate complexity, as earlier chapters
showed, is approximated by g, or general intelligence. We would have
predicted that a market economy, faced with this turn of events, would
soon put intelligence on the sales block. It has. Business consultancy is
a new profession that is soaking up a growing fraction of the graduates
of the elite business schools. The consultants sell mainly their trained
intelligence to the businesses paying their huge fees.
A second reason involves the effects of scale, spurred by the growth
in the size of corporations and markets since World War 11. A person
who can dream up a sales campaign worth another percentage point or
two of market share will be sought after. What "sought after" means in
dollars and cents depends on what a point of market share is worth. If
it is worth $500,000, the market for his services will produce one range
of salar~es. If a point of market share is worth $5 million, he is much
more valuable. If a point of market share is worth $100 million, he is
worth a fortune. Now consider that since just 1960, the average annual
sales, per corporation, of America's five hundred largest industrial cor-
porations has jumped from $1.8 billion to $4.6 billion (both figures in
1990 dollars). The same gigantism has affected the value of everything
from the ability to float successful bond offerings to the ability to nego-
tiate the best prices for volume purchases by huge retail chains. The
magnitude of the economic consequences of ordinary business transac-
tions has mushroomed, and with it the value of people who can do their
work at a marginally higher level of skill. All the evidence we have sug-
gests that such people have, among their other characteristics, high in-
telligence. There is no reason to think that this process will stop soon.
Then there are the effects of legislation and regulation. Why are cer.
tam kinds of lawyers who never see the inside of a courtroom able to
command such large fees? In many cases, because a first-rate lawyer can
make a difference worth tens of millions of dollars in getting a favorable
decision from a government agency or slipping through a tax loophole.
Lawyers are not the only beneficiaries. As the rules of the game gov-
erning private enterprise become ever more labyrinthine, intelligence
grows in value, sometimes in the most surprising places. One of our col-
leagues is a social psychologist who supplements his university salary by
serving as an adviser on jury selection, at a consulting fee of several thou-
sand dollars per day. Rased on his track record, his advice raises the prob-
ability of a favorable verdict in a liability or patent dispute by about 5
to 10 percent. When a verdict may represent a swing of $100 million,
an edge of that size makes him well worth his large fee.
We have not exhausted all the reasons that cognitive ability is
becoming more valuable in the labor market, but these will serve to
illustrate the theme: The more complex a society becomes, the more
valuable are the people who are especially good at dealing with com-
plexity. Barring a change in direction, the future is likely to see the rules
The Value of Complexity
- High-IQ professionals like lawyers and consultants command massive fees by navigating increasingly labyrinthine government regulations and tax loopholes.
- As society becomes more complex, the economic value of intelligence grows, creating a 'cognitive elite' that thrives on managing this complexity.
- High-IQ occupations, including engineering, medicine, and law, consistently occupy the highest tiers of the American wage distribution.
- Economic mobility is becoming more restricted, with a strong correlation between a father's income and his son's future earnings.
- Intellectual stratification acts as a primary driver of modern income inequality, as IQ becomes a dominant predictor of economic success.
The more complex a society becomes, the more valuable are the people who are especially good at dealing with complexity.
98
The Emergence of a Cognitive Elite
Steeper Ladders, Narrower Gates
99
direct evidence in their analysis of white men in the National Longitu-
dinal Survey of Youth (NLSY). Education and intelligence each con-
tributed to a worker's income, but the smart men earned most of the
extra wage benefit of education during the past decade."" The growing
economic benefits of either schooling or intelligence are dispropor-
tionately embodied in the rising income of educated people with high
test scores and in the falling wages earned by less educated people with
low scores.""
This premium for IQ applies even within the high-IQ occupations
that we discussed in Chapter 2. In the NLSY, among people holding one
of these jobs, the 1989 weekly earnings (expressed in 1990 dollars) of
those in the top 10 percent of IQ were $977, compared to $697 for those
with IQs below the top 10 percent, for an annual income difference of
over $14,000.~~~'
Even after extracting any effects of their specific occu-
pations (as well as of the differing incomes of men and women), being
in the top 10 percent in IQ was still worth over $1 1,000 in income for
those in this collection of prestigious occupations.
Why Cognitive Ability Hm Become More Valuahk to Employers
This brings us as far as the data on income and intelligence go. Before
leaving the topic, we offer several reasons why the wage premium for
intelligence might have increased recently and may be expected to con-
tinue to increase.
Perhaps most obviously is that technology has increased the eco-
nomic value of intelligence. As robots replace factory workers, the fac-
tory workers' jobs vanish, but new jobs pop up for people who can design,
program, and repair robots. The new jobs are not necessarily going to
be filled by the same people, for they require more intelligence than the
old ones did. Today's technological frontier is more complex than yes-
terday's. Even in traditional industries like retailing, banking, mining,
manufacturing, and fanning, management gets ever more complex. The
capacity to understand and manipulate complexity, as earlier chapters
showed, is approximated by g, or general intelligence. We would have
predicted that a market economy, faced with this turn of events, would
soon put intelligence on the sales block. It has. Business consultancy is
a new profession that is soaking up a growing fraction of the graduates
of the elite business schools. The consultants sell mainly their trained
intelligence to the businesses paying their huge fees.
A second reason involves the effects of scale, spurred by the growth
in the size of corporations and markets since World War 11. A person
who can dream up a sales campaign worth another percentage point or
two of market share will be sought after. What "sought after" means in
dollars and cents depends on what a point of market share is worth. If
it is worth $500,000, the market for his services will produce one range
of salar~es. If a point of market share is worth $5 million, he is much
more valuable. If a point of market share is worth $100 million, he is
worth a fortune. Now consider that since just 1960, the average annual
sales, per corporation, of America's five hundred largest industrial cor-
porations has jumped from $1.8 billion to $4.6 billion (both figures in
1990 dollars). The same gigantism has affected the value of everything
from the ability to float successful bond offerings to the ability to nego-
tiate the best prices for volume purchases by huge retail chains. The
magnitude of the economic consequences of ordinary business transac-
tions has mushroomed, and with it the value of people who can do their
work at a marginally higher level of skill. All the evidence we have sug-
gests that such people have, among their other characteristics, high in-
telligence. There is no reason to think that this process will stop soon.
Then there are the effects of legislation and regulation. Why are cer.
tam kinds of lawyers who never see the inside of a courtroom able to
command such large fees? In many cases, because a first-rate lawyer can
make a difference worth tens of millions of dollars in getting a favorable
decision from a government agency or slipping through a tax loophole.
Lawyers are not the only beneficiaries. As the rules of the game gov-
erning private enterprise become ever more labyrinthine, intelligence
grows in value, sometimes in the most surprising places. One of our col-
leagues is a social psychologist who supplements his university salary by
serving as an adviser on jury selection, at a consulting fee of several thou-
sand dollars per day. Rased on his track record, his advice raises the prob-
ability of a favorable verdict in a liability or patent dispute by about 5
to 10 percent. When a verdict may represent a swing of $100 million,
an edge of that size makes him well worth his large fee.
We have not exhausted all the reasons that cognitive ability is
becoming more valuable in the labor market, but these will serve to
illustrate the theme: The more complex a society becomes, the more
valuable are the people who are especially good at dealing with com-
plexity. Barring a change in direction, the future is likely to see the rules
100
The Emergence of a Cognitive Elite
Steeper Ladders, Narrower Gates
10 1
for doing business become yet more complex, to see regulation extend
still further, and to raise still higher the stakes for having a high 1Q.
The End Result: Prosperity for Those Lucky Enough to Be Intelligent
After all that has gone before, it will come as no surprise to find that
smart people tend to have high incomes. The advantage enjoyed by
those who have high enough 1Qs to get into the high-IQ occupations
is shown in the figure below. All of the high-lQ occupations have me-
dian wages well out on the right-hand side of the distribution.""' Those
The high-IQ occupations also are well-paid occupations
The Recent American Wage Distribution
Accountants
Social scientlrts
Natural scientists
Mathematician\ & computer rcienti\t\
College teachen
I
Engineers & arch~tectr
Physicians
Attorneys
4
1
o
460
600
RW
I oix)
I ZOO
Median weekly wage, in 1990 $
Source: U.S. Department of Lahor 1991.
in the top range of IQ had incomes that were conspicuously above those
with lower 1Qs even within the high-1Q occupations. The overall me-
dian family income with a member in one of these occupations and with
an IQ in the top 10 percent was $61,100, putting them at the 84th per-
centile of family incomes for their age group. These fortunate people
were newly out of graduate school or law school or medical schcwl, still
near the bottom of their eamings trajectory as of their early thirties,
whereas a large proportion of those who had gone into blue-collar jobs
(disproportionately in the lower IQ deciles) have much less room to ad-
Income as a Family Trait
America has taken great pride in the mobility of generations: enterprising
children of poor families are supposed to do better than their parents, and
the wastrel children of the rich are supposed to fritter away the family for-
tune. Rut in modem America, this mobility has its limits. The experts now
believe that the correlation between fathers' and sons' income is at least
.4 and perhaps closer to .5.12'1 Think of it this way: The son of a father whose
earnings are in the bottom 5 percent of the distribution has something like
one chance in twenty (or less) of rising to the top fifth of the income dis-
trihution and almost a fifty-fifty chance of staying in the bottom fifth. He
has less than one chance in four of rising above even the median income.22
Economists search for explanations of this phenomenon in structural fea-
tures of the economy. We add the element of intellectual stratification.
Most people at present are stuck near where their parents were on the in-
come distribution in part because IQ, which has become a major predic-
tor of income, passes on sufficiently from one generation to the next to
constrain economic mobility.
vance beyond this age.lZ0' In other words, the occupational elite is pros-
perous. Within it, the cognitive elite is more prosperous still.
COGNITIVE SORTING THROUGH PHYSICAL SEPARATION
The effects of cognitive sorting in education and occupation are reified
through geography. People with similar cognitive skills are put together
in the workplace and in neighborhoods.
Cognitive Segregation in the Workplace
The higher the level of cognitive ability and the greater the degree of
homogeneity among people involved in that line of work, the greater is
the degree of separation of the cognitive elite from everyone else. First,
consider a workplace with a comparatively low level of cognitive ho-
mogeneity-an
industrial plant. In the physical confines of the plant,
all kinds of abilities are being called upon: engineers and machinists,
Geography of Cognitive Sorting
- Cognitive sorting in education and occupation is increasingly reified through physical and geographic separation.
- Industrial plants represent low cognitive homogeneity where diverse skill levels must intermingle for efficient production.
- Corporate offices exhibit higher average intelligence and narrower spreads, leading to increased physical stratification between executives and support staff.
- Professional environments like law firms represent the extreme of this trend, where almost all employees reside in the upper portion of the ability distribution.
- The physical separation of the cognitive elite from the rest of society limits daily interaction between different cognitive classes.
- This segregation is driven by the requirement for high-level cognitive ability in specialized, competitive industries.
The executives do not spend much time with the janitors or the data entry clerks. They spend almost all their time interacting with other executives or with technical specialists, which means with people drawn from the upper portion of the ability distribution.
100
The Emergence of a Cognitive Elite
Steeper Ladders, Narrower Gates
10 1
for doing business become yet more complex, to see regulation extend
still further, and to raise still higher the stakes for having a high 1Q.
The End Result: Prosperity for Those Lucky Enough to Be Intelligent
After all that has gone before, it will come as no surprise to find that
smart people tend to have high incomes. The advantage enjoyed by
those who have high enough 1Qs to get into the high-IQ occupations
is shown in the figure below. All of the high-lQ occupations have me-
dian wages well out on the right-hand side of the distribution.""' Those
The high-IQ occupations also are well-paid occupations
The Recent American Wage Distribution
Accountants
Social scientlrts
Natural scientists
Mathematician\ & computer rcienti\t\
College teachen
I
Engineers & arch~tectr
Physicians
Attorneys
4
1
o
460
600
RW
I oix)
I ZOO
Median weekly wage, in 1990 $
Source: U.S. Department of Lahor 1991.
in the top range of IQ had incomes that were conspicuously above those
with lower 1Qs even within the high-1Q occupations. The overall me-
dian family income with a member in one of these occupations and with
an IQ in the top 10 percent was $61,100, putting them at the 84th per-
centile of family incomes for their age group. These fortunate people
were newly out of graduate school or law school or medical schcwl, still
near the bottom of their eamings trajectory as of their early thirties,
whereas a large proportion of those who had gone into blue-collar jobs
(disproportionately in the lower IQ deciles) have much less room to ad-
Income as a Family Trait
America has taken great pride in the mobility of generations: enterprising
children of poor families are supposed to do better than their parents, and
the wastrel children of the rich are supposed to fritter away the family for-
tune. Rut in modem America, this mobility has its limits. The experts now
believe that the correlation between fathers' and sons' income is at least
.4 and perhaps closer to .5.12'1 Think of it this way: The son of a father whose
earnings are in the bottom 5 percent of the distribution has something like
one chance in twenty (or less) of rising to the top fifth of the income dis-
trihution and almost a fifty-fifty chance of staying in the bottom fifth. He
has less than one chance in four of rising above even the median income.22
Economists search for explanations of this phenomenon in structural fea-
tures of the economy. We add the element of intellectual stratification.
Most people at present are stuck near where their parents were on the in-
come distribution in part because IQ, which has become a major predic-
tor of income, passes on sufficiently from one generation to the next to
constrain economic mobility.
vance beyond this age.lZ0' In other words, the occupational elite is pros-
perous. Within it, the cognitive elite is more prosperous still.
COGNITIVE SORTING THROUGH PHYSICAL SEPARATION
The effects of cognitive sorting in education and occupation are reified
through geography. People with similar cognitive skills are put together
in the workplace and in neighborhoods.
Cognitive Segregation in the Workplace
The higher the level of cognitive ability and the greater the degree of
homogeneity among people involved in that line of work, the greater is
the degree of separation of the cognitive elite from everyone else. First,
consider a workplace with a comparatively low level of cognitive ho-
mogeneity-an
industrial plant. In the physical confines of the plant,
all kinds of abilities are being called upon: engineers and machinists,
102
The Emergence of a Cognitive Elite
Steeper Ladders, Nanower Gates
103
electricians and pipefitters and sweepers, foremen and shift supervisors,
and the workers on the loading dock. The shift supervisors and engi-
neers may have offices that give them some physical separation from the
plant floor, but, as manufacturers have come to realize in recent years,
they had better not spend all their time in those offices. Efficient and
profitable production requires not only that very different tasks be ac-
complished, using people of every level of cognitive ability, but that they
be accomplished cooperatively. If the manufacturing company is pros-
pering, it is likely that a fair amount of daily intermingling of cognitive
classes goes on in the plant.
Now we move across the street to the company's office building. Here
the average level of intelligence is higher and the spread is narrower.
Only a handful of jobs, such as janitor, can be performed by people with
low cognitive ability. A number of jobs can be done by people of aver-
age ability--data entry clerks, for example. Some jobs that can be done
adequately by people with average cognitive ability turn into virtually
a different, and much more important, sort of job if done superbly. The
job of secretary is the classic example. The traditional executive secre-
tary, rising through the secretarial ranks until she takes charge of the
boss's office, was once a familiar career path for a really capable, no doubt
smart, woman. For still other jobs, cognitive ability is important but less
important than other talents-among
the sales representatives, for
example. And finally there is a layer of jobs among the senior execu-
tives and in the R&D department for which cognitive ability is im-
portant and where the mean IQ had better be high if the company
is to survive and grow in a competitive industry. In the office building,
not only cognitive homogeneity has increased; so has physical separa-
tion. The executives do not spend much time with the janitors or the
data entry clerks. They spend almost all their time interacting with
other executives or with technical specialists, which means with
people drawn from the upper portion of the ability distribution.
Although corporate offices are more stratified for intelligence than
the manufacturing plant, some workplaces are even more stratified. Let's
move across town to a law firm. Once again, the mean IQ rises and the
standard deviation narrows. Now there are only a few job categories--
for practical purposes, three: secretaries, paralegals or other forms of le-
gal assistants, and the attorneys. The lowest categories, secretarial and
paralegal work, require at least average cognitive skills for basic com-
petence, considerably more than that if their jobs are to be done as well
as they could be. The attorneys themselves are likely to be, virtually
without exception, at least a standard deviation above the mean, if only
because of the selection procedures in the law schools that enabled them
to become lawyers in the first place. It remains true that part of the suc-
cess of the law firm depends on qualities that are only slightly related to
cognitive skills-the
social skills involved in getting new business, for
example. And attorneys in almost any law firm can be found shaking
their heads over the highly paid (and smart) partner who is coasting on
his subordinates' talents. But the overall degree of cognitive stratifica-
tion in a good law firm is extremely high. And note an important dis-
tinction: It is not that stratification within the law firm is high; rather,
the entire workplace represents a stratum highly atypical of cognitive
ability in the population at large.
These rarefied environments are becoming more common because
the jobs that most demand intelligence are increasing in number and
economic importance. These are jobs that may be conducted in clois-
tered settings in the company of other smart workers. The brightest
lawyers and bankers increasingly work away from the courtroom and the
bank floor, away from all except the most handpicked of corporate
clients. The brightest engineers increasingly work on problems that
never require them to visit a construction site or a shop floor. They can
query their computers to get the answers they need. The brightest pub-
lic policy specialists shuttle among think tanks, bureaucracies, and grad-
uate schools of public policy, never having to encounter an angry voter.
The brightest youngsters launch their careers in business by getting an
M.B.A. from a top business school, thence to climb the corporate lad-
der without ever having had to sell soap or whatever to the company's
actual customers. In each example, a specialized profession within the
profession is developing that looks more and more like academia in the
way it recruits, insulates, and isolates members of the cognitive elite.
Residential Segregation
As soon as a town grows larger than a few dozen households in size, it
starts to develop neighborhoods. As towns become cities, this tendency
becomes a reliable law of human communities. People seek out corn-
fortable neighborhoods they can afford. For some people, this will mean
looking for a particular kind of setting. Parents with young children typ-
ically want parks, good schools, and neighbors with young children. Sin-
The Rise of Cognitive Isolation
- Modern professional environments, such as law firms and engineering hubs, are becoming increasingly stratified by cognitive ability rather than just social skill.
- The most intelligent professionals are being pulled into 'cloistered' roles that insulate them from the general public and traditional labor.
- Specialized professions are beginning to mimic academia by recruiting and isolating a cognitive elite from the rest of the population.
- Residential segregation is shifting from purely socioeconomic status to a partitioning based on cognitive and professional commonalities.
- Urbanization has reduced the natural socioeconomic mixing that once occurred in small-town schools and neighborhoods.
- The isolation of the cognitive elite's children within these rarefied environments poses a significant long-term social challenge.
The brightest public policy specialists shuttle among think tanks, bureaucracies, and graduate schools of public policy, never having to encounter an angry voter.
102
The Emergence of a Cognitive Elite
Steeper Ladders, Nanower Gates
103
electricians and pipefitters and sweepers, foremen and shift supervisors,
and the workers on the loading dock. The shift supervisors and engi-
neers may have offices that give them some physical separation from the
plant floor, but, as manufacturers have come to realize in recent years,
they had better not spend all their time in those offices. Efficient and
profitable production requires not only that very different tasks be ac-
complished, using people of every level of cognitive ability, but that they
be accomplished cooperatively. If the manufacturing company is pros-
pering, it is likely that a fair amount of daily intermingling of cognitive
classes goes on in the plant.
Now we move across the street to the company's office building. Here
the average level of intelligence is higher and the spread is narrower.
Only a handful of jobs, such as janitor, can be performed by people with
low cognitive ability. A number of jobs can be done by people of aver-
age ability--data entry clerks, for example. Some jobs that can be done
adequately by people with average cognitive ability turn into virtually
a different, and much more important, sort of job if done superbly. The
job of secretary is the classic example. The traditional executive secre-
tary, rising through the secretarial ranks until she takes charge of the
boss's office, was once a familiar career path for a really capable, no doubt
smart, woman. For still other jobs, cognitive ability is important but less
important than other talents-among
the sales representatives, for
example. And finally there is a layer of jobs among the senior execu-
tives and in the R&D department for which cognitive ability is im-
portant and where the mean IQ had better be high if the company
is to survive and grow in a competitive industry. In the office building,
not only cognitive homogeneity has increased; so has physical separa-
tion. The executives do not spend much time with the janitors or the
data entry clerks. They spend almost all their time interacting with
other executives or with technical specialists, which means with
people drawn from the upper portion of the ability distribution.
Although corporate offices are more stratified for intelligence than
the manufacturing plant, some workplaces are even more stratified. Let's
move across town to a law firm. Once again, the mean IQ rises and the
standard deviation narrows. Now there are only a few job categories--
for practical purposes, three: secretaries, paralegals or other forms of le-
gal assistants, and the attorneys. The lowest categories, secretarial and
paralegal work, require at least average cognitive skills for basic com-
petence, considerably more than that if their jobs are to be done as well
as they could be. The attorneys themselves are likely to be, virtually
without exception, at least a standard deviation above the mean, if only
because of the selection procedures in the law schools that enabled them
to become lawyers in the first place. It remains true that part of the suc-
cess of the law firm depends on qualities that are only slightly related to
cognitive skills-the
social skills involved in getting new business, for
example. And attorneys in almost any law firm can be found shaking
their heads over the highly paid (and smart) partner who is coasting on
his subordinates' talents. But the overall degree of cognitive stratifica-
tion in a good law firm is extremely high. And note an important dis-
tinction: It is not that stratification within the law firm is high; rather,
the entire workplace represents a stratum highly atypical of cognitive
ability in the population at large.
These rarefied environments are becoming more common because
the jobs that most demand intelligence are increasing in number and
economic importance. These are jobs that may be conducted in clois-
tered settings in the company of other smart workers. The brightest
lawyers and bankers increasingly work away from the courtroom and the
bank floor, away from all except the most handpicked of corporate
clients. The brightest engineers increasingly work on problems that
never require them to visit a construction site or a shop floor. They can
query their computers to get the answers they need. The brightest pub-
lic policy specialists shuttle among think tanks, bureaucracies, and grad-
uate schools of public policy, never having to encounter an angry voter.
The brightest youngsters launch their careers in business by getting an
M.B.A. from a top business school, thence to climb the corporate lad-
der without ever having had to sell soap or whatever to the company's
actual customers. In each example, a specialized profession within the
profession is developing that looks more and more like academia in the
way it recruits, insulates, and isolates members of the cognitive elite.
Residential Segregation
As soon as a town grows larger than a few dozen households in size, it
starts to develop neighborhoods. As towns become cities, this tendency
becomes a reliable law of human communities. People seek out corn-
fortable neighborhoods they can afford. For some people, this will mean
looking for a particular kind of setting. Parents with young children typ-
ically want parks, good schools, and neighbors with young children. Sin-
104
The Emergence of a Cognitive Elite
Steeper Ladders, Narrower Gates
105
gle people in their twenties and thirties making good money often grav-
itate toward upscale urban neighborhoods with lots of places to go and
things to do.
The result is to produce neighborhoods with a high level of socio-
economic partitioning. The factory worker seldom lives next door to
the executive, and this was as true in 1900 as in the last years of the
century. The wealthy people have always been the most moblle. But in
the late twentieth century, the most mobile people are increasingly
drawn from the cognitive elite. In thinking about these changes, we will
focus on their implications for the way that the children of the cogni-
tive elite are raised, for therein lies one of the main potential sources of
trouble.
First, the urbanlzatlon of the nation has meant that a much smaller
proportion of the population grows up in places where socioeconomic
mixing occurs naturally. Given a small enough town, there are not
enough elementary schools to segregate the children efficiently. The
children of the local upper crust may live on the street with the large
houses, but there are not enough of them to fill up a whole school. Af-
ter elementary school, every child in the town goes to the same middle
school and high school. Such towns now constitute a shrinking pro-
portion of the population, however. As of 1990,78 percent of the over-
all population lived in metropolitan areas."
Cognitive segregation is also being intensified by failures of gov-
ernment in large cities. As urban school systems deteriorate, people
with money relocate to rich suburbs because that is where the good
public school systems are; if they remain in the city, they send their
children to private schools, which are even more homogeneous.
As crime rates rise, people with money relocate to suhurhs where the
crime rates are low, or they concentrate ever more densely within
the safer parts of the city. As urban tax rates rise, the middle class
flees, leaving behind even more starkly segregated poles of rich and
poor.
Bright working-class youngsters mix with children of every other
level of ability in elementary school, but they are increasingly likely to
be drawn away to the more intellectually homogeneous high school
courses, thence to college. Much of the cognitive talent that used to he
in the working-class neighborhood is being whisked up and out of the
community through an educational system that is increasingly driven
by academic performance. Because of residential segregation, the chil-
dren of lawyers, physicians, college professors, engineers, and business
executives tend to go to schools with each other's children, and seldom
with the children of cab drivers or assembly-line workers, Let alone with
the children of welfare recipients or the chronically unemployed. They
may never go to school with children representative of the whole range
of cognitive ability. This tendency is exacerbated by another force work-
ing in the background, genes.
GENETIC PARTITIONING
Twenty years ago, one of us wrote a book that created a stir because it
discussed the heritability of IQ and the relationship of intelligence to
success in life, and foresaw a future in which socioeconomic status would
increasingly be inherited. The logic of the argument was couched in a
syllogism:
If differences in mental abilities are inherited, and
If success requires those abilities, and
If earnings and prestige depend on success,
Then social standing (which reflects earnings and prestige) will be
hased to some extent on inherited differences among people.24
As stated, the syllogism is not fearsome. If intelligence is only trivially
a matter of genes and if success in life is only trivially a matter of intel-
ligence, then success may be only trivially inherited.
How Much Is lQ a Matter of Genes?
In fact, 1Q is substantially heritable. The state of knowledge does not
permit a precise estimate, but half a century of work, now amounting to
hundreds of empirical and theoretical studies, permits a broad conclu-
sion that the genetic component of 1Q is unlikely to be smaller than 40
percent or higher than 80 percent.25 The most unambiguous direct es-
timates, based on identical twins raised apart, produce some of the high-
est estimates of heritability.16 For purposes of this discussion, we will
adopt a middling estimate of 60 percent heritability, which, by exten-
sion, means that IQ is about 40 percent a matter of environment. The
balance of the evidence suggests that 60 percent may err on the low side.
The Mechanics of Cognitive Segregation
- Urban decay and failing school systems drive wealthy families into homogeneous suburbs or private schools, intensifying residential and educational segregation.
- The modern educational system acts as a filter, 'whisking' intellectually talented youth out of working-class neighborhoods and into elite environments.
- Children of high-status professionals increasingly grow up in isolation from the broader spectrum of cognitive ability and socioeconomic backgrounds.
- The authors propose a syllogism suggesting that if mental abilities are inherited and success requires those abilities, social standing will become partially hereditary.
- Current scientific consensus estimates the heritability of IQ to be between 40 and 80 percent, with the authors adopting a 60 percent estimate for their analysis.
- The combination of environmental sorting and genetic partitioning creates a feedback loop that solidifies the emergence of a distinct cognitive elite.
Much of the cognitive talent that used to be in the working-class neighborhood is being whisked up and out of the community through an educational system that is increasingly driven by academic performance.
104
The Emergence of a Cognitive Elite
Steeper Ladders, Narrower Gates
105
gle people in their twenties and thirties making good money often grav-
itate toward upscale urban neighborhoods with lots of places to go and
things to do.
The result is to produce neighborhoods with a high level of socio-
economic partitioning. The factory worker seldom lives next door to
the executive, and this was as true in 1900 as in the last years of the
century. The wealthy people have always been the most moblle. But in
the late twentieth century, the most mobile people are increasingly
drawn from the cognitive elite. In thinking about these changes, we will
focus on their implications for the way that the children of the cogni-
tive elite are raised, for therein lies one of the main potential sources of
trouble.
First, the urbanlzatlon of the nation has meant that a much smaller
proportion of the population grows up in places where socioeconomic
mixing occurs naturally. Given a small enough town, there are not
enough elementary schools to segregate the children efficiently. The
children of the local upper crust may live on the street with the large
houses, but there are not enough of them to fill up a whole school. Af-
ter elementary school, every child in the town goes to the same middle
school and high school. Such towns now constitute a shrinking pro-
portion of the population, however. As of 1990,78 percent of the over-
all population lived in metropolitan areas."
Cognitive segregation is also being intensified by failures of gov-
ernment in large cities. As urban school systems deteriorate, people
with money relocate to rich suburbs because that is where the good
public school systems are; if they remain in the city, they send their
children to private schools, which are even more homogeneous.
As crime rates rise, people with money relocate to suhurhs where the
crime rates are low, or they concentrate ever more densely within
the safer parts of the city. As urban tax rates rise, the middle class
flees, leaving behind even more starkly segregated poles of rich and
poor.
Bright working-class youngsters mix with children of every other
level of ability in elementary school, but they are increasingly likely to
be drawn away to the more intellectually homogeneous high school
courses, thence to college. Much of the cognitive talent that used to he
in the working-class neighborhood is being whisked up and out of the
community through an educational system that is increasingly driven
by academic performance. Because of residential segregation, the chil-
dren of lawyers, physicians, college professors, engineers, and business
executives tend to go to schools with each other's children, and seldom
with the children of cab drivers or assembly-line workers, Let alone with
the children of welfare recipients or the chronically unemployed. They
may never go to school with children representative of the whole range
of cognitive ability. This tendency is exacerbated by another force work-
ing in the background, genes.
GENETIC PARTITIONING
Twenty years ago, one of us wrote a book that created a stir because it
discussed the heritability of IQ and the relationship of intelligence to
success in life, and foresaw a future in which socioeconomic status would
increasingly be inherited. The logic of the argument was couched in a
syllogism:
If differences in mental abilities are inherited, and
If success requires those abilities, and
If earnings and prestige depend on success,
Then social standing (which reflects earnings and prestige) will be
hased to some extent on inherited differences among people.24
As stated, the syllogism is not fearsome. If intelligence is only trivially
a matter of genes and if success in life is only trivially a matter of intel-
ligence, then success may be only trivially inherited.
How Much Is lQ a Matter of Genes?
In fact, 1Q is substantially heritable. The state of knowledge does not
permit a precise estimate, but half a century of work, now amounting to
hundreds of empirical and theoretical studies, permits a broad conclu-
sion that the genetic component of 1Q is unlikely to be smaller than 40
percent or higher than 80 percent.25 The most unambiguous direct es-
timates, based on identical twins raised apart, produce some of the high-
est estimates of heritability.16 For purposes of this discussion, we will
adopt a middling estimate of 60 percent heritability, which, by exten-
sion, means that IQ is about 40 percent a matter of environment. The
balance of the evidence suggests that 60 percent may err on the low side.
106
The Emergence of a Cognitive Elite
Steeper Ladders, Narrower Gates
1 07
Because IQ and genes has been such a sensitive topic, it is worth a
short digression to give some idea of where these estimates come from
and how trustworthy they are.
First, consider the question that heads this section, not its answer.
What we want to know is how much of the variation in IQ in a popula-
tion-the
aggregated differences among the indi~idua1sl"~-is due to
variations in genetic endowments and how much is due to variations in
environment. If all the population variation in IQ is due to variations
in environment, then the heritability is o;'~" if half is due to environ-
mental variations, it is .5; if none is due to environmental variations, it
is 1.0. Heritability, in other words, is a ratio that ranges between 0 and
1 and measures the relative contribution of genes to the variation ob-
served in a trait.lZ9l
Specialists have come up with dozens of procedures for estimat~ng
heritahility. Nonspecialists need not concern themselves with nuts and
bolts, but they may need to be reassured on a few basic points. First the
heritability of any trait can be estimated as long as its variation in a pop-
ulation can be measured. IQ meets that criterion handily. There are, In
fact, no other human traits-physical
or psychological-that
provide as
many good data for the estimation ofheritability as the IQ. Second, her-
itability descrihes something about a population of people, not an indi-
vidual. It makes no more sense to talk about the heritability of an
individual's 1Q than it does to talk about his birthrate. A given indi-
vidual's IQ may have been greatly affected by his special circumstances
even though IQ is substantially heritable in the population as a whole.
Third, the heritability of a trait may change when the conditions pro-
ducing variation change. If, one hundred years ago, the variations in ex-
posure to education were greater than they are now (as is no douht the
case), and if education is one source of variation in IQ, then, other
things equal, the heritability of IQ was lower then than it is now.
This last point is especially important in the modem societies, with
their intense efforts to equalize opportunity. As a general rule, a$ envi-
ronments become more unifonn, heritability rises. When heritability rises,
children resemble their parents more, and siblings increasingly resem-
ble each other; in general, family members become more similar to each
other and more different from people in other families. It is the central
irony of egalitarianism: Uniformity in society makes the members of
families more similar to each other and members of different families
more different.
Now for the answer to the question, How much is IQ a matter of
genes? Heritability is estimated from data on people with varying
amounts of genetic overlap and varying amounts of shared environ-
ment. Broadly speaking, the estimates may be characterized as direct or
indirect." Direct estimates are based on samples of blood relatives who
were raised apart. Their genetic overlap can be estimated from basic ge-
netic considerations. The direct methods assume that the correlations
between them are due to the shared genes rather than shared environ-
ments because they do not, in fact, share environments, an assumption
that is more or less plausible, given the particular conditions of the study.
The purest of the direct comparisons is based on identical (monozygotic,
MZ) twins reared apart, often not knowing of each other's existence.
Identical twins share all their genes, and if they have been raised apart
since birth, then the only environment they shared was that in the
womb. Except for the effects on their 1Qs of the shared uterine envi-
ronment, their IQ correlation directly estimates heritabi\ity. The most
modern study of identical twins reared in separate homes suggests a her-
itability for general intelligence between .75 and .80, a value near the
top of the range found in the contemporary technical literature." Other
direct estimates use data on ordinary siblings who were raised apart or
on parents and their adopted-away children. Usually, the heritability es-
timates from such data are lower but rarely below .4.'"l
Indirect methods compare the IQ correlations between people with
different levels of shared genes growing up in comparable environ-
ments-siblings
versus half-siblings or versus cousins, for example, or
MZ twins versus fraternal (dizygotic, DZ) twins, or nonadoptive siblings
versus adoptive siblings. The underlying idea is that, for example, if full
siblings raised in the same home and half-siblings raised in the same
home differ in their IQ correlations, it is because they differ in the pro-
portion of genes they share: full siblings share about 50 percent of genes,
half siblings about 25 percent. Similarly, if siblings raised in unshared
environments and cousins raised in unshared environments differ in
their IQ correlations, it is because of the differing degrees of genetic
overlap between cousins and siblings and not hecause of differing envi-
ronmental influences, which are unshared by definition. And so on.
Fleshed out in some sort of statistical model, this idea makes it possihle
to estimate the heritability, but the modeling can get complex. Some
studies use mixtures of direct and indirect methods.'"'
The technical literature is filled with varying estimates of the heri-
The Heritability of IQ
- Heritability measures the relative contribution of genes to the variation of a trait within a specific population rather than an individual.
- IQ is uniquely suited for heritability studies because it provides more high-quality data than any other human physical or psychological trait.
- As environments become more uniform through egalitarian efforts, the heritability of traits actually increases because environmental variation is minimized.
- Direct estimates of heritability are derived from studying blood relatives, such as identical twins, who were raised in separate environments.
- Modern studies of identical twins reared apart suggest that the heritability of general intelligence may be as high as .75 to .80.
- The central irony of social equalization is that making environments more uniform causes family members to resemble each other more and differ more from others.
It is the central irony of egalitarianism: Uniformity in society makes the members of families more similar to each other and members of different families more different.
106
The Emergence of a Cognitive Elite
Steeper Ladders, Narrower Gates
1 07
Because IQ and genes has been such a sensitive topic, it is worth a
short digression to give some idea of where these estimates come from
and how trustworthy they are.
First, consider the question that heads this section, not its answer.
What we want to know is how much of the variation in IQ in a popula-
tion-the
aggregated differences among the indi~idua1sl"~-is due to
variations in genetic endowments and how much is due to variations in
environment. If all the population variation in IQ is due to variations
in environment, then the heritability is o;'~" if half is due to environ-
mental variations, it is .5; if none is due to environmental variations, it
is 1.0. Heritability, in other words, is a ratio that ranges between 0 and
1 and measures the relative contribution of genes to the variation ob-
served in a trait.lZ9l
Specialists have come up with dozens of procedures for estimat~ng
heritahility. Nonspecialists need not concern themselves with nuts and
bolts, but they may need to be reassured on a few basic points. First the
heritability of any trait can be estimated as long as its variation in a pop-
ulation can be measured. IQ meets that criterion handily. There are, In
fact, no other human traits-physical
or psychological-that
provide as
many good data for the estimation ofheritability as the IQ. Second, her-
itability descrihes something about a population of people, not an indi-
vidual. It makes no more sense to talk about the heritability of an
individual's 1Q than it does to talk about his birthrate. A given indi-
vidual's IQ may have been greatly affected by his special circumstances
even though IQ is substantially heritable in the population as a whole.
Third, the heritability of a trait may change when the conditions pro-
ducing variation change. If, one hundred years ago, the variations in ex-
posure to education were greater than they are now (as is no douht the
case), and if education is one source of variation in IQ, then, other
things equal, the heritability of IQ was lower then than it is now.
This last point is especially important in the modem societies, with
their intense efforts to equalize opportunity. As a general rule, a$ envi-
ronments become more unifonn, heritability rises. When heritability rises,
children resemble their parents more, and siblings increasingly resem-
ble each other; in general, family members become more similar to each
other and more different from people in other families. It is the central
irony of egalitarianism: Uniformity in society makes the members of
families more similar to each other and members of different families
more different.
Now for the answer to the question, How much is IQ a matter of
genes? Heritability is estimated from data on people with varying
amounts of genetic overlap and varying amounts of shared environ-
ment. Broadly speaking, the estimates may be characterized as direct or
indirect." Direct estimates are based on samples of blood relatives who
were raised apart. Their genetic overlap can be estimated from basic ge-
netic considerations. The direct methods assume that the correlations
between them are due to the shared genes rather than shared environ-
ments because they do not, in fact, share environments, an assumption
that is more or less plausible, given the particular conditions of the study.
The purest of the direct comparisons is based on identical (monozygotic,
MZ) twins reared apart, often not knowing of each other's existence.
Identical twins share all their genes, and if they have been raised apart
since birth, then the only environment they shared was that in the
womb. Except for the effects on their 1Qs of the shared uterine envi-
ronment, their IQ correlation directly estimates heritabi\ity. The most
modern study of identical twins reared in separate homes suggests a her-
itability for general intelligence between .75 and .80, a value near the
top of the range found in the contemporary technical literature." Other
direct estimates use data on ordinary siblings who were raised apart or
on parents and their adopted-away children. Usually, the heritability es-
timates from such data are lower but rarely below .4.'"l
Indirect methods compare the IQ correlations between people with
different levels of shared genes growing up in comparable environ-
ments-siblings
versus half-siblings or versus cousins, for example, or
MZ twins versus fraternal (dizygotic, DZ) twins, or nonadoptive siblings
versus adoptive siblings. The underlying idea is that, for example, if full
siblings raised in the same home and half-siblings raised in the same
home differ in their IQ correlations, it is because they differ in the pro-
portion of genes they share: full siblings share about 50 percent of genes,
half siblings about 25 percent. Similarly, if siblings raised in unshared
environments and cousins raised in unshared environments differ in
their IQ correlations, it is because of the differing degrees of genetic
overlap between cousins and siblings and not hecause of differing envi-
ronmental influences, which are unshared by definition. And so on.
Fleshed out in some sort of statistical model, this idea makes it possihle
to estimate the heritability, but the modeling can get complex. Some
studies use mixtures of direct and indirect methods.'"'
The technical literature is filled with varying estimates of the heri-
The Heritability of Intelligence
- Genetic overlap, rather than shared environment, explains why siblings and cousins show varying degrees of IQ correlation.
- While technical estimates vary, a broad consensus places the heritability of IQ between .4 and .8, with .6 serving as a responsible midpoint.
- The heritability of intelligence appears to increase as individuals age, meaning genes play a larger role in IQ during adulthood than in childhood.
- Surprisingly, the 'shared environment' of a family has relatively little impact on adult IQ compared to unique individual experiences and genetic inheritance.
- As environmental conditions become more equal across society, the proportion of remaining inequality attributable to genetic differences necessarily increases.
- These findings suggest that social stratification is increasingly rooted in inherited cognitive differences that are difficult to manipulate through policy.
The fact that family members resemble each other in intelligence in adulthood as much as they do is very largely explained by the genes they share rather than the family environment they shared as children.
106
The Emergence of a Cognitive Elite
Steeper Ladders, Narrower Gates
1 07
Because IQ and genes has been such a sensitive topic, it is worth a
short digression to give some idea of where these estimates come from
and how trustworthy they are.
First, consider the question that heads this section, not its answer.
What we want to know is how much of the variation in IQ in a popula-
tion-the
aggregated differences among the indi~idua1sl"~-is due to
variations in genetic endowments and how much is due to variations in
environment. If all the population variation in IQ is due to variations
in environment, then the heritability is o;'~" if half is due to environ-
mental variations, it is .5; if none is due to environmental variations, it
is 1.0. Heritability, in other words, is a ratio that ranges between 0 and
1 and measures the relative contribution of genes to the variation ob-
served in a trait.lZ9l
Specialists have come up with dozens of procedures for estimat~ng
heritahility. Nonspecialists need not concern themselves with nuts and
bolts, but they may need to be reassured on a few basic points. First the
heritability of any trait can be estimated as long as its variation in a pop-
ulation can be measured. IQ meets that criterion handily. There are, In
fact, no other human traits-physical
or psychological-that
provide as
many good data for the estimation ofheritability as the IQ. Second, her-
itability descrihes something about a population of people, not an indi-
vidual. It makes no more sense to talk about the heritability of an
individual's 1Q than it does to talk about his birthrate. A given indi-
vidual's IQ may have been greatly affected by his special circumstances
even though IQ is substantially heritable in the population as a whole.
Third, the heritability of a trait may change when the conditions pro-
ducing variation change. If, one hundred years ago, the variations in ex-
posure to education were greater than they are now (as is no douht the
case), and if education is one source of variation in IQ, then, other
things equal, the heritability of IQ was lower then than it is now.
This last point is especially important in the modem societies, with
their intense efforts to equalize opportunity. As a general rule, a$ envi-
ronments become more unifonn, heritability rises. When heritability rises,
children resemble their parents more, and siblings increasingly resem-
ble each other; in general, family members become more similar to each
other and more different from people in other families. It is the central
irony of egalitarianism: Uniformity in society makes the members of
families more similar to each other and members of different families
more different.
Now for the answer to the question, How much is IQ a matter of
genes? Heritability is estimated from data on people with varying
amounts of genetic overlap and varying amounts of shared environ-
ment. Broadly speaking, the estimates may be characterized as direct or
indirect." Direct estimates are based on samples of blood relatives who
were raised apart. Their genetic overlap can be estimated from basic ge-
netic considerations. The direct methods assume that the correlations
between them are due to the shared genes rather than shared environ-
ments because they do not, in fact, share environments, an assumption
that is more or less plausible, given the particular conditions of the study.
The purest of the direct comparisons is based on identical (monozygotic,
MZ) twins reared apart, often not knowing of each other's existence.
Identical twins share all their genes, and if they have been raised apart
since birth, then the only environment they shared was that in the
womb. Except for the effects on their 1Qs of the shared uterine envi-
ronment, their IQ correlation directly estimates heritabi\ity. The most
modern study of identical twins reared in separate homes suggests a her-
itability for general intelligence between .75 and .80, a value near the
top of the range found in the contemporary technical literature." Other
direct estimates use data on ordinary siblings who were raised apart or
on parents and their adopted-away children. Usually, the heritability es-
timates from such data are lower but rarely below .4.'"l
Indirect methods compare the IQ correlations between people with
different levels of shared genes growing up in comparable environ-
ments-siblings
versus half-siblings or versus cousins, for example, or
MZ twins versus fraternal (dizygotic, DZ) twins, or nonadoptive siblings
versus adoptive siblings. The underlying idea is that, for example, if full
siblings raised in the same home and half-siblings raised in the same
home differ in their IQ correlations, it is because they differ in the pro-
portion of genes they share: full siblings share about 50 percent of genes,
half siblings about 25 percent. Similarly, if siblings raised in unshared
environments and cousins raised in unshared environments differ in
their IQ correlations, it is because of the differing degrees of genetic
overlap between cousins and siblings and not hecause of differing envi-
ronmental influences, which are unshared by definition. And so on.
Fleshed out in some sort of statistical model, this idea makes it possihle
to estimate the heritability, but the modeling can get complex. Some
studies use mixtures of direct and indirect methods.'"'
The technical literature is filled with varying estimates of the heri-
108
The Emergence of a Cognitive Elite
Steeper Ladders, Narrower Gates
109
tability of IQ, owing to the varying models being used for estimation
and to the varying sets of data. Some people seem eager to throw up
their hands and declare, "No one knows (or can know) how her~tahle
IQ is." But that reaction is as unwarranted as it is hasty, if one is con-
tent, as we are, to accept a range of uncertainty about the heritability
that specialists may find nerve-racking. We are content, in other words,
to say that the heritability of IQ falls somewhere within a broad range
and that, for purposes of our discussion, a value of .6 f
.2 does no vio-
lence to any of the competent and responsible recent estimates. The
range of .4 to .8 includes virtually all recent (since 1980) estimates-
competent, responsible, or other~ise."~'
Recent studies have uncovered other salient facts about the way IQ
scores depend on genes. They have found, for example, that the more
general the measure of intelligence-the closer it is to g-the
higher is
the heritabili~.'~
Also, the evidence seems to say that the heritability
of IQ rises as one ages, all the way from early childhood to late adult-
hood.'%is
means that the variation in IQ among, say, youths ages 18
to 22 is less dependent on genes than that among people ages 40 to 44.l"'
Most of the traditional estimates of heritability have been based on
youngsters, which means that they are likely to underestimate the role
of genes later in life.
Finally, and most surprisingly, the evidence is growing that whatever
variation is left over for the environment to explain (i.e., 40 percent of
the total variation, if the heritability of IQ is taken to be .6), relat~vely
little can be traced to the shared environments created by families." It
is, rather, a set of environmental influences, mostly unknown at present,
that are experienced by individuals as individuals. The fact that family
members resemble each other in intelligence in adulthood as much as
they do is very largely explained by the genes they share rather than the
family environment they shared as children. These findings suggest deep
roots indeed for the cognitive stratification of society.
The SyllMsm in Practice
The heritability of PQ is substantial. In Chapters 2 and 3, we presented
evidence that the relationship of cognitive ability to success in life is far
from trivial. Inasmuch as the syllogism's premises cannot be dismissed
out of hand, neither can its conclusion that success in life will be based
to some extent on inherited differences among
Furthermore, a variety of other scientific findings leads us to conclude
that the heritability of success is going to increase rather than diminish.
Begin with the limits that heritability puts on the ability to manipulate
intelligence, by imagining a United States that has magically made good
on the contemporary ideal of equality. Every child in this imaginary
America experiences exactly the same environmental effects, for good
or ill, on his or her intelligence. How much intellectual variation would
remain? If the heritability of 1Q is .6, the standard deviation of IQ in
our magical world of identical environments would be 1 1.6 instead of
15 (see the note for how this calculation is done)-smaller,
but still leav-
ing a great deal of variation in intellectual talent that could not be re-
duced further by mere equali~ation.~~"
As we noted earlier, when a
society makes good on the ideal of letting every youngster have equal
access to the things that allow latent cognitive ability to develop, it is
in effect driving the environmental component of 1Q variation closer
and closer to nil.
The United States is still very far from this state of affairs at the ex-
tremes. If one thinks of babies growing up in slums with crack-addicted
mothers, at one extreme, compared to children growing up in affluent,
culturally rich homes with parents dedicated to squeezing every last
IQ point out of them, then even a heritability of .6 leaves room for
considerable change if the changes in environment are commen-
surably large. We take up the evidence on that issue in detail in
Chapter 17, when we consider the many educational and social in-
terventions that have attempted to raise IQ. But those are, by defini-
tion, the extremes, the two tails of the distribution of environments.
Moving a child from an environment that is the very worst to the very
best may make a big difference. In reality, what most interventions
accomplish is to move children from awful environments to ones that
are merely below average, and such changes are limited in their poten-
tial consequences when heritahility so constrains the limits of environ-
mental effects.14"
So while we can look forward to a future in which science discovers
how to foster intelligence environmentally and how to use the science
humanely, inherited cognitive ability is now extremely important. In
this sense, luck continues to matter in life's outcomes, hut now it is more
a matter of the IQ handed out in life's lottery than anything else about
circumstances. High cognitive ability as of the 1990s means, more than
even before, that the chances of success in life are good and getting het.
The Genetic Lottery and Assortative Mating
- Equalizing environmental opportunities paradoxically increases the relative importance of genetic inheritance in determining IQ variation.
- While extreme environmental shifts can impact cognitive development, most social interventions only move children from 'awful' to 'below average' conditions.
- Success in the modern era is increasingly tied to the 'IQ lottery' rather than social circumstances as environmental barriers are reduced.
- Assortative mating—the tendency for people to marry those with similar traits—is particularly strong regarding cognitive ability.
- The correlation between the IQs of spouses is approximately .45, which is nearly as high as the correlation between siblings.
- The combination of educational stratification and cognitive-based mating patterns reinforces the emergence of a distinct cognitive elite.
In this sense, luck continues to matter in life's outcomes, hut now it is more a matter of the IQ handed out in life's lottery than anything else about circumstances.
108
The Emergence of a Cognitive Elite
Steeper Ladders, Narrower Gates
109
tability of IQ, owing to the varying models being used for estimation
and to the varying sets of data. Some people seem eager to throw up
their hands and declare, "No one knows (or can know) how her~tahle
IQ is." But that reaction is as unwarranted as it is hasty, if one is con-
tent, as we are, to accept a range of uncertainty about the heritability
that specialists may find nerve-racking. We are content, in other words,
to say that the heritability of IQ falls somewhere within a broad range
and that, for purposes of our discussion, a value of .6 f
.2 does no vio-
lence to any of the competent and responsible recent estimates. The
range of .4 to .8 includes virtually all recent (since 1980) estimates-
competent, responsible, or other~ise."~'
Recent studies have uncovered other salient facts about the way IQ
scores depend on genes. They have found, for example, that the more
general the measure of intelligence-the closer it is to g-the
higher is
the heritabili~.'~
Also, the evidence seems to say that the heritability
of IQ rises as one ages, all the way from early childhood to late adult-
hood.'%is
means that the variation in IQ among, say, youths ages 18
to 22 is less dependent on genes than that among people ages 40 to 44.l"'
Most of the traditional estimates of heritability have been based on
youngsters, which means that they are likely to underestimate the role
of genes later in life.
Finally, and most surprisingly, the evidence is growing that whatever
variation is left over for the environment to explain (i.e., 40 percent of
the total variation, if the heritability of IQ is taken to be .6), relat~vely
little can be traced to the shared environments created by families." It
is, rather, a set of environmental influences, mostly unknown at present,
that are experienced by individuals as individuals. The fact that family
members resemble each other in intelligence in adulthood as much as
they do is very largely explained by the genes they share rather than the
family environment they shared as children. These findings suggest deep
roots indeed for the cognitive stratification of society.
The SyllMsm in Practice
The heritability of PQ is substantial. In Chapters 2 and 3, we presented
evidence that the relationship of cognitive ability to success in life is far
from trivial. Inasmuch as the syllogism's premises cannot be dismissed
out of hand, neither can its conclusion that success in life will be based
to some extent on inherited differences among
Furthermore, a variety of other scientific findings leads us to conclude
that the heritability of success is going to increase rather than diminish.
Begin with the limits that heritability puts on the ability to manipulate
intelligence, by imagining a United States that has magically made good
on the contemporary ideal of equality. Every child in this imaginary
America experiences exactly the same environmental effects, for good
or ill, on his or her intelligence. How much intellectual variation would
remain? If the heritability of 1Q is .6, the standard deviation of IQ in
our magical world of identical environments would be 1 1.6 instead of
15 (see the note for how this calculation is done)-smaller,
but still leav-
ing a great deal of variation in intellectual talent that could not be re-
duced further by mere equali~ation.~~"
As we noted earlier, when a
society makes good on the ideal of letting every youngster have equal
access to the things that allow latent cognitive ability to develop, it is
in effect driving the environmental component of 1Q variation closer
and closer to nil.
The United States is still very far from this state of affairs at the ex-
tremes. If one thinks of babies growing up in slums with crack-addicted
mothers, at one extreme, compared to children growing up in affluent,
culturally rich homes with parents dedicated to squeezing every last
IQ point out of them, then even a heritability of .6 leaves room for
considerable change if the changes in environment are commen-
surably large. We take up the evidence on that issue in detail in
Chapter 17, when we consider the many educational and social in-
terventions that have attempted to raise IQ. But those are, by defini-
tion, the extremes, the two tails of the distribution of environments.
Moving a child from an environment that is the very worst to the very
best may make a big difference. In reality, what most interventions
accomplish is to move children from awful environments to ones that
are merely below average, and such changes are limited in their poten-
tial consequences when heritahility so constrains the limits of environ-
mental effects.14"
So while we can look forward to a future in which science discovers
how to foster intelligence environmentally and how to use the science
humanely, inherited cognitive ability is now extremely important. In
this sense, luck continues to matter in life's outcomes, hut now it is more
a matter of the IQ handed out in life's lottery than anything else about
circumstances. High cognitive ability as of the 1990s means, more than
even before, that the chances of success in life are good and getting het.
1 10
The Emergence of a Cognitive Elite
Steeper Ladders, Narrower Gates
1 1 1
ter all the time, and these are decreasingly affected by the social envi-
ronment, which by extension indicates that they must be increasingly af-
fected by genes. Holding these thoughts in mind, now consider the
phenomenon known as asswfative mating.
Love, Marriage, and IQ
The old saw notwithstanding, opposites do not really attract when it
comes to love and marriage. Likes attract. In one of the classic papers,
originally published in 1943, two sociologists studied 1,000 engaged
couples in Chicago, expecting to find at least some traits in which op-
posites did indeed attract. But out of fifty-one social characteristics stud-
ied, the sign of the correlation was positive for every single one. For all
but six of the fifty-one traits, the correlations were statistically signifi-
cant.42 Modest but consistently positive correlations have been found
for a wide variety of physical traits as well, ranging from stature (the cor-
relations from many studies average about +.25) to eye color (also av-
eraging about +.25, even within national p~pulations).~~
OF the many correlations involving husbands and wives, one of the
highest is for IQ. In most of the major studies, the correlation of hus-
band and wife 1Q has been in the region of .4, though estimates as low
as .2 and as high as .6 have been observed. Jensen's review of the liter-
ature in the late 1970s found that the average correlation of forty-three
spouse correlations for various tests of cognitive ability was +.45, almost
as high as the typical correlation of IQs among ~ib1ings.l'~'
I f the Propensity to Mate by Cognitive Ability Has Remained the Same:
When the propensity to mate by cognitive ability is combined with the
educational and occupational stratification we have described, the im-
pact on the next generation will be larger than on the previous one, even
if the underlying propensity to mate by cognitive ability remains the same.
Consider 100 Haward/Radcliffe marriages from the class of 1930 ver-
sus another 100 from the class of 1964. We stipulate that the propen-
sity to marry people of similar intelligence has not changed in the
intervening thirty-four years. Nonetheless, the ones who marry in 1964
will produce a set of children with considerably higher mean IQ than
the ones who married in 1930, because the level of intelligence at Har-
vard and Radcliffe had risen so dramatically.
How much difference can it make? If the average Harvard man in the
class of 1930 married the average Radcliffe woman in the same gradu-
ating class-as
far as we can tell, both would have had 1Qs of about
117-then
the expected mean IQ of their children, after taking regres-
sion to the mean into account, will be about 114, or at the 82d per-
~enti1e.l~~~
But average Harvard and Radcliffe newlyweds in the class of
1964 were likely to have children with a mean IQ of about 124, at the
95th percentile. In terms of distributions rather than averages, about a
third of the children of the Harvard newlyweds of 1930 could be ex-
pected to have IQs of less than I 10-not
even college material by some
definitions.14'l In contrast, only 6 percent of the children of the Harvard
newlyweds of 1965 could be expected to fall below this cutoff. Mean-
while, only about 22 percent of the children of the 1930 newlyweds
could be expected to match or exceed the average of the children of the
1965 newlyweds. In such numbers lurk large social effects.
If the Propensity to Mate by Cognitive Ability Has Increased:
We have been assuming that the propensity to mate by IQ has remained
the same. In reality, it has almost certainly increased and will continue
to increase.
We hedge with "almost" because no quantitative studies tell whether
assortative mating by intelligence has been increasing recently. But we
do know from sociologist Robert Mare of the University of Wisconsin
that assortative mating by educational kevel increased over the period
from 1940 to 1987-an
increase in "homogamy," in the sociologists' lan-
guage. The increase in homogamy was most pronounced among college-
educated persons. Specifically, the odds of a college graduate's marrying
someone who was not a college graduate declined from 44 percent in
1940 to 35 percent in Mare's most recent data (for 1985 to 1987). The
proportion hit a low of 33 percent in the 1980 data.'47' Because educa-
tional attainment and IQ are so closely linked and became more closely
linked in the postwar period, Mare's results suggest a substantial increase
in assortative mating by IQ, with the greatest change occurring at the
upper levels of IQ.
Mare identifies some of the reasons for increased homogamy in the
trends involving educational attainment, age at leaving school, and age
at marriage. But there are a variety of other potential explanations
(some of which he notes) that involve cognitive ability specifically. For
example, a smart wife in the 1990s has a much greater dollar payoff for
The Rise of Cognitive Homogamy
- Even if the propensity to mate by intelligence remains constant, the rising average IQ at elite universities ensures that the next generation will have a higher mean IQ.
- A comparison of Harvard/Radcliffe graduates from 1930 and 1964 shows a dramatic shift in the expected intelligence of their offspring due to more rigorous student selection.
- Data suggests that assortative mating, or 'homogamy,' by educational level increased significantly between 1940 and 1987, particularly among college graduates.
- The link between educational attainment and IQ has tightened in the postwar period, suggesting a substantial increase in mating based on cognitive ability.
- Social changes, including the feminist movement and the shift to coeducational elite colleges, have increased the frequency of high-IQ individuals meeting and marrying.
- The economic value of a high-ability spouse has risen, providing a greater 'dollar payoff' for marrying within one's own cognitive stratum.
In such numbers lurk large social effects.
1 10
The Emergence of a Cognitive Elite
Steeper Ladders, Narrower Gates
1 1 1
ter all the time, and these are decreasingly affected by the social envi-
ronment, which by extension indicates that they must be increasingly af-
fected by genes. Holding these thoughts in mind, now consider the
phenomenon known as asswfative mating.
Love, Marriage, and IQ
The old saw notwithstanding, opposites do not really attract when it
comes to love and marriage. Likes attract. In one of the classic papers,
originally published in 1943, two sociologists studied 1,000 engaged
couples in Chicago, expecting to find at least some traits in which op-
posites did indeed attract. But out of fifty-one social characteristics stud-
ied, the sign of the correlation was positive for every single one. For all
but six of the fifty-one traits, the correlations were statistically signifi-
cant.42 Modest but consistently positive correlations have been found
for a wide variety of physical traits as well, ranging from stature (the cor-
relations from many studies average about +.25) to eye color (also av-
eraging about +.25, even within national p~pulations).~~
OF the many correlations involving husbands and wives, one of the
highest is for IQ. In most of the major studies, the correlation of hus-
band and wife 1Q has been in the region of .4, though estimates as low
as .2 and as high as .6 have been observed. Jensen's review of the liter-
ature in the late 1970s found that the average correlation of forty-three
spouse correlations for various tests of cognitive ability was +.45, almost
as high as the typical correlation of IQs among ~ib1ings.l'~'
I f the Propensity to Mate by Cognitive Ability Has Remained the Same:
When the propensity to mate by cognitive ability is combined with the
educational and occupational stratification we have described, the im-
pact on the next generation will be larger than on the previous one, even
if the underlying propensity to mate by cognitive ability remains the same.
Consider 100 Haward/Radcliffe marriages from the class of 1930 ver-
sus another 100 from the class of 1964. We stipulate that the propen-
sity to marry people of similar intelligence has not changed in the
intervening thirty-four years. Nonetheless, the ones who marry in 1964
will produce a set of children with considerably higher mean IQ than
the ones who married in 1930, because the level of intelligence at Har-
vard and Radcliffe had risen so dramatically.
How much difference can it make? If the average Harvard man in the
class of 1930 married the average Radcliffe woman in the same gradu-
ating class-as
far as we can tell, both would have had 1Qs of about
117-then
the expected mean IQ of their children, after taking regres-
sion to the mean into account, will be about 114, or at the 82d per-
~enti1e.l~~~
But average Harvard and Radcliffe newlyweds in the class of
1964 were likely to have children with a mean IQ of about 124, at the
95th percentile. In terms of distributions rather than averages, about a
third of the children of the Harvard newlyweds of 1930 could be ex-
pected to have IQs of less than I 10-not
even college material by some
definitions.14'l In contrast, only 6 percent of the children of the Harvard
newlyweds of 1965 could be expected to fall below this cutoff. Mean-
while, only about 22 percent of the children of the 1930 newlyweds
could be expected to match or exceed the average of the children of the
1965 newlyweds. In such numbers lurk large social effects.
If the Propensity to Mate by Cognitive Ability Has Increased:
We have been assuming that the propensity to mate by IQ has remained
the same. In reality, it has almost certainly increased and will continue
to increase.
We hedge with "almost" because no quantitative studies tell whether
assortative mating by intelligence has been increasing recently. But we
do know from sociologist Robert Mare of the University of Wisconsin
that assortative mating by educational kevel increased over the period
from 1940 to 1987-an
increase in "homogamy," in the sociologists' lan-
guage. The increase in homogamy was most pronounced among college-
educated persons. Specifically, the odds of a college graduate's marrying
someone who was not a college graduate declined from 44 percent in
1940 to 35 percent in Mare's most recent data (for 1985 to 1987). The
proportion hit a low of 33 percent in the 1980 data.'47' Because educa-
tional attainment and IQ are so closely linked and became more closely
linked in the postwar period, Mare's results suggest a substantial increase
in assortative mating by IQ, with the greatest change occurring at the
upper levels of IQ.
Mare identifies some of the reasons for increased homogamy in the
trends involving educational attainment, age at leaving school, and age
at marriage. But there are a variety of other potential explanations
(some of which he notes) that involve cognitive ability specifically. For
example, a smart wife in the 1990s has a much greater dollar payoff for
1 12
The Emergence of a Cognitive Elite
Steeper Ladders, Narrower Gates
1 13
a man than she did fifty years ago.4A The feminist movement has also
increased the likelihood of marrying by cognitive ability.
First, the feminist revolution in practice (which began in the 1950s,
antedating the revolution in rhetoric) drastically increased the odds
that bright young women will be thrown in contact with bright young
men during the years when people choose spouses. This is most obvious
in college, where the proportion of women continuing to college surged
from about half the proportion of men in 1950 to equality in 1 9 7 5 . ~ ~
It
was not just the numbers, however. All of the elite men's colleges be-
came coeducational, as did many of elite women's colleges. Strict pari-
etal rules gave way to coeducational dorms. Intelligence has always been
an important factor for sorting among prospective mates, hut compari-
son shopping at single-sex colleges like Vassar or Yale was a struggle; the
feminist revolution in the universities led to an explosion of informa-
tion, as it were, that made it easier for the brightest to pair up.
The same phenomenon extended to the workplace. Large propor-
tions of the cognitive elite delay marriage until the later twenties or
even thirties. Only a few decades ago, delay tended to dilute the chances
of assortative mating by IQ. In a world where the brightest women were
usually not in the work force or were in a few restricted occupations, the
pool from which a man in his late twenties found a bride were moder-
ated primarily by socioeconomic status; he found his mate among the
women he encountered in his neighborhood, church, social organiza-
tions, and other settings that were matched mostly hy socioeconomic
status. But today background status is less important than intelligence.
The young man newly graduated from his elite law school joins his elite
New York firm, thereupon encountering young women, just as highly
selected for cognitive ability as he was, in the adjacent offices at his own
firm, at business lunches, across the table in negotiations, on a daily ba-
sis. The opportunities for propinquity to work its magic were increased
in the workplace too, and will continue to increase in the years to come.
The second effect of feminism is less ponderable but may he impor-
tant anyway. Not so many years ago, the cliche was true: brains were not
considered sexy in a woman, and many men undervalued brains as an
asset in a prospective spouse or even felt threatened by smart women.
Such attitudes may linger in some men, but feminism has surely weak-
ened them and, to some degree, freed relationships among men and
women so that a woman's potential for occupational success can take as
dominant a place in the man's marriage calculus as it has traditionally
taken in the
We speculate that the effect has been most lib-
erating among the brightest. If we are right, then the trends in educa-
tional homogamy that Mare has demonstrated are an understated
reflection of what is really going on. Intermarriage among people in the
top few percentiles of intelligence may be increasing far more rapidly
than suspected.
THE LIMITS OF CHURNING
American society has historically been full of churning, as new groups
came to this country, worked their way up, and joined the ranks of the
rich and powerful. Meanwhile, some of the children of the rich and pow-
erful, or their grandchildren, were descending the ladder. This process
has made for a vibrant, self-renewing society. In depressing contrast, we
have been env~sioning a society that becomes increasingly quiescent at
the top, as a cognitive elite moves toward the upper income brackets
and runs most of the institutions of society, taking on some of the char-
acteristics of a caste.
Is the situation really so extreme? To some extent, not yet. For ex-
ample, national surveys still indicate that fewer than 60 percent in the
top quartile of intelligence actually complete a bachelor's degree.15" This
would seem to leave a lot of room for churning. But when we focus in-
stead on the students in the top few centiles of cognitive ability (from
which the nation's elite colleges pick almost exclusively), an extremely
high proportion are already being swept into the comfortable precincts
of the cognitive elite.52 In the NLSY, for example, 81 percent of those
in the top 5 percent of IQ had obtained at least a bachelor's degree by
1990, when the youngest members of the sample were 25 years old.5'
When we examine the remaining 19 percent who had not obtained
college degrees, the efficiency of American society in pushing the most
talented to the top looks even more impressive. For example, only a
small portion of that 19 percent were smart students who had been raised
in a low-income family and did not get to college for lack of opportu-
nity. Only 6 percent of persons in the top five IQ centiles did not have
a college degree and came from families in the lower half of socioeco-
nomic status. 54
If this 19 percent of high-IQ persons-without-E3.A.s does not fit the
stereotype of the deprived student, who were they? Some were be-
The Rise of Cognitive Assortative Mating
- The shift to coeducational universities and the feminist revolution have significantly increased the 'information' available for high-IQ individuals to find and pair with one another.
- Delayed marriage among the cognitive elite now favors intelligence over socioeconomic background, as professionals meet intellectual peers in high-stakes workplaces.
- Cultural shifts have redefined intelligence in women as a desirable asset rather than a social liability, altering the 'marriage calculus' for high-achieving men.
- There is a growing concern that the top percentiles of intelligence are intermarrying at a rate that could create a self-perpetuating cognitive caste.
- While historical American society was characterized by 'churning' across social classes, modern educational efficiency is increasingly capturing almost all high-IQ individuals into the elite.
- Data suggests that over 80 percent of those in the top 5 percent of IQ are now funneled into elite educational and professional tracks, reducing social mobility.
In depressing contrast, we have been envisioning a society that becomes increasingly quiescent at the top, as a cognitive elite moves toward the upper income brackets and runs most of the institutions of society, taking on some of the characteristics of a caste.
1 12
The Emergence of a Cognitive Elite
Steeper Ladders, Narrower Gates
1 13
a man than she did fifty years ago.4A The feminist movement has also
increased the likelihood of marrying by cognitive ability.
First, the feminist revolution in practice (which began in the 1950s,
antedating the revolution in rhetoric) drastically increased the odds
that bright young women will be thrown in contact with bright young
men during the years when people choose spouses. This is most obvious
in college, where the proportion of women continuing to college surged
from about half the proportion of men in 1950 to equality in 1 9 7 5 . ~ ~
It
was not just the numbers, however. All of the elite men's colleges be-
came coeducational, as did many of elite women's colleges. Strict pari-
etal rules gave way to coeducational dorms. Intelligence has always been
an important factor for sorting among prospective mates, hut compari-
son shopping at single-sex colleges like Vassar or Yale was a struggle; the
feminist revolution in the universities led to an explosion of informa-
tion, as it were, that made it easier for the brightest to pair up.
The same phenomenon extended to the workplace. Large propor-
tions of the cognitive elite delay marriage until the later twenties or
even thirties. Only a few decades ago, delay tended to dilute the chances
of assortative mating by IQ. In a world where the brightest women were
usually not in the work force or were in a few restricted occupations, the
pool from which a man in his late twenties found a bride were moder-
ated primarily by socioeconomic status; he found his mate among the
women he encountered in his neighborhood, church, social organiza-
tions, and other settings that were matched mostly hy socioeconomic
status. But today background status is less important than intelligence.
The young man newly graduated from his elite law school joins his elite
New York firm, thereupon encountering young women, just as highly
selected for cognitive ability as he was, in the adjacent offices at his own
firm, at business lunches, across the table in negotiations, on a daily ba-
sis. The opportunities for propinquity to work its magic were increased
in the workplace too, and will continue to increase in the years to come.
The second effect of feminism is less ponderable but may he impor-
tant anyway. Not so many years ago, the cliche was true: brains were not
considered sexy in a woman, and many men undervalued brains as an
asset in a prospective spouse or even felt threatened by smart women.
Such attitudes may linger in some men, but feminism has surely weak-
ened them and, to some degree, freed relationships among men and
women so that a woman's potential for occupational success can take as
dominant a place in the man's marriage calculus as it has traditionally
taken in the
We speculate that the effect has been most lib-
erating among the brightest. If we are right, then the trends in educa-
tional homogamy that Mare has demonstrated are an understated
reflection of what is really going on. Intermarriage among people in the
top few percentiles of intelligence may be increasing far more rapidly
than suspected.
THE LIMITS OF CHURNING
American society has historically been full of churning, as new groups
came to this country, worked their way up, and joined the ranks of the
rich and powerful. Meanwhile, some of the children of the rich and pow-
erful, or their grandchildren, were descending the ladder. This process
has made for a vibrant, self-renewing society. In depressing contrast, we
have been env~sioning a society that becomes increasingly quiescent at
the top, as a cognitive elite moves toward the upper income brackets
and runs most of the institutions of society, taking on some of the char-
acteristics of a caste.
Is the situation really so extreme? To some extent, not yet. For ex-
ample, national surveys still indicate that fewer than 60 percent in the
top quartile of intelligence actually complete a bachelor's degree.15" This
would seem to leave a lot of room for churning. But when we focus in-
stead on the students in the top few centiles of cognitive ability (from
which the nation's elite colleges pick almost exclusively), an extremely
high proportion are already being swept into the comfortable precincts
of the cognitive elite.52 In the NLSY, for example, 81 percent of those
in the top 5 percent of IQ had obtained at least a bachelor's degree by
1990, when the youngest members of the sample were 25 years old.5'
When we examine the remaining 19 percent who had not obtained
college degrees, the efficiency of American society in pushing the most
talented to the top looks even more impressive. For example, only a
small portion of that 19 percent were smart students who had been raised
in a low-income family and did not get to college for lack of opportu-
nity. Only 6 percent of persons in the top five IQ centiles did not have
a college degree and came from families in the lower half of socioeco-
nomic status. 54
If this 19 percent of high-IQ persons-without-E3.A.s does not fit the
stereotype of the deprived student, who were they? Some were be-
The Efficiency of Cognitive Funneling
- A very small percentage of high-IQ individuals fail to obtain college degrees due to socioeconomic barriers, suggesting the educational funnel is highly efficient.
- Many high-IQ individuals without degrees, like Bill Gates, still enter the cognitive elite through high-income occupations and social status.
- The number of talented individuals who 'slip between the cracks' has decreased radically since the early 1900s and is expected to continue shrinking.
- Policy interventions aimed at expanding college access for the disadvantaged may have limited impact on the most talented, as most are already being identified.
- The cognitive elite is becoming increasingly isolated through three interlocking phenomena: rising wealth, physical segregation, and assortative mating.
- The author raises concerns about the potential for this elite class to develop distinct political interests that may conflict with the values of a free society.
What if the cognitive elite were to become not only richer than everyone else, increasingly segregated, and more genetically distinct as time goes on—but were also to acquire common political interests?
1 12
The Emergence of a Cognitive Elite
Steeper Ladders, Narrower Gates
1 13
a man than she did fifty years ago.4A The feminist movement has also
increased the likelihood of marrying by cognitive ability.
First, the feminist revolution in practice (which began in the 1950s,
antedating the revolution in rhetoric) drastically increased the odds
that bright young women will be thrown in contact with bright young
men during the years when people choose spouses. This is most obvious
in college, where the proportion of women continuing to college surged
from about half the proportion of men in 1950 to equality in 1 9 7 5 . ~ ~
It
was not just the numbers, however. All of the elite men's colleges be-
came coeducational, as did many of elite women's colleges. Strict pari-
etal rules gave way to coeducational dorms. Intelligence has always been
an important factor for sorting among prospective mates, hut compari-
son shopping at single-sex colleges like Vassar or Yale was a struggle; the
feminist revolution in the universities led to an explosion of informa-
tion, as it were, that made it easier for the brightest to pair up.
The same phenomenon extended to the workplace. Large propor-
tions of the cognitive elite delay marriage until the later twenties or
even thirties. Only a few decades ago, delay tended to dilute the chances
of assortative mating by IQ. In a world where the brightest women were
usually not in the work force or were in a few restricted occupations, the
pool from which a man in his late twenties found a bride were moder-
ated primarily by socioeconomic status; he found his mate among the
women he encountered in his neighborhood, church, social organiza-
tions, and other settings that were matched mostly hy socioeconomic
status. But today background status is less important than intelligence.
The young man newly graduated from his elite law school joins his elite
New York firm, thereupon encountering young women, just as highly
selected for cognitive ability as he was, in the adjacent offices at his own
firm, at business lunches, across the table in negotiations, on a daily ba-
sis. The opportunities for propinquity to work its magic were increased
in the workplace too, and will continue to increase in the years to come.
The second effect of feminism is less ponderable but may he impor-
tant anyway. Not so many years ago, the cliche was true: brains were not
considered sexy in a woman, and many men undervalued brains as an
asset in a prospective spouse or even felt threatened by smart women.
Such attitudes may linger in some men, but feminism has surely weak-
ened them and, to some degree, freed relationships among men and
women so that a woman's potential for occupational success can take as
dominant a place in the man's marriage calculus as it has traditionally
taken in the
We speculate that the effect has been most lib-
erating among the brightest. If we are right, then the trends in educa-
tional homogamy that Mare has demonstrated are an understated
reflection of what is really going on. Intermarriage among people in the
top few percentiles of intelligence may be increasing far more rapidly
than suspected.
THE LIMITS OF CHURNING
American society has historically been full of churning, as new groups
came to this country, worked their way up, and joined the ranks of the
rich and powerful. Meanwhile, some of the children of the rich and pow-
erful, or their grandchildren, were descending the ladder. This process
has made for a vibrant, self-renewing society. In depressing contrast, we
have been env~sioning a society that becomes increasingly quiescent at
the top, as a cognitive elite moves toward the upper income brackets
and runs most of the institutions of society, taking on some of the char-
acteristics of a caste.
Is the situation really so extreme? To some extent, not yet. For ex-
ample, national surveys still indicate that fewer than 60 percent in the
top quartile of intelligence actually complete a bachelor's degree.15" This
would seem to leave a lot of room for churning. But when we focus in-
stead on the students in the top few centiles of cognitive ability (from
which the nation's elite colleges pick almost exclusively), an extremely
high proportion are already being swept into the comfortable precincts
of the cognitive elite.52 In the NLSY, for example, 81 percent of those
in the top 5 percent of IQ had obtained at least a bachelor's degree by
1990, when the youngest members of the sample were 25 years old.5'
When we examine the remaining 19 percent who had not obtained
college degrees, the efficiency of American society in pushing the most
talented to the top looks even more impressive. For example, only a
small portion of that 19 percent were smart students who had been raised
in a low-income family and did not get to college for lack of opportu-
nity. Only 6 percent of persons in the top five IQ centiles did not have
a college degree and came from families in the lower half of socioeco-
nomic status. 54
If this 19 percent of high-IQ persons-without-E3.A.s does not fit the
stereotype of the deprived student, who were they? Some were be-
1 14
The Emergence of a Cognitive Elite
Steeper Ladders, Narrower Gates
1 1 5
coming members of the cognitive elite even though they do not have
a college degree. Bcll Gates, college dropout and founder of Microsoft,
is the larger-than-life prototype. Five percentage points of the 19 per-
cent were working in one of the high-IQ occupations, indicating that
they were roba ably of the minor-league Rill Gates variety (corrobo-
rated by their incomes, which were high). Of the remaining 14 per-
cent who were not working in high-IQ occupations, a quarter had
family incomes in excess of $50,000 while they were still only in their
late twenties and early thirties, putting them in the top 20 percent of
family incomes for their age
In total, roughly half of these smart
non-college graduates are already taking their place among the smart
college graduates, by virtue of their incomes, their occupations, or both.
It seems a safe bet that the neighborhoods where they live and the way
they socialize their children are going to be indistinguishable from
those of most of their counterparts in the top five centiles who com-
pleted college.
There is doubtless some relatively small fraction of those in the top
5 percent intellectually who will never rise to successful positions,
whether because of lack of motivation or objective barriers. But what a
small percentage of the highly talented they are. And we may add a re-
minder that we are watching an ongoing process. Think back to Chap-
ter 1 and imagine the trend tine from 1900 to 1990 stretched out to,
say, 2020. Whatever the number of the cognitive elite who slip between
the cracks now, it is a much smaller figure than it was in the 1950s, rad-
ically smaller than it was in the 1900s, and presumably it will get smaller
still in the future.
These observations have several implications. At a practical policy
level, the most obvious is that programs to expand opportunity for the
disadvantaged are not going to make much difference in getting the
most talented youths to college. An extremely high proportion of those
who want to go are already going. The broader implication is that the
funneling system is already functioning at a high level of efficiency,
thereby promoting three interlocking phenomena:
These phenomena are driven by forces that do not lend themselves
to easy reconfiguration by politicians. As we leave Part I, here is a topic
to keep in the back of your mind: What if the cognitive elite were to
become not only richer than everyone else, increasingly segregated, and
more genetically distinct as time goes o n but were atso to acquire com-
mon political interests? What might those interests be, and how con-
gruent might they be with a free society? How decisively could the
cognitive elite affect policy if it were to acquire such a common politi-
cal interest?
These issues will return in the last chapters in the book. They are
postponed for now, because we must first explore the social problems
that might help create such a new political coalition.
1. The cognitive elite is getting richer, in an era when everybody else
is having to struggle to stay even.
2. The cognitive elite is increasingly segregated physically from every-
one else, in both the workplace and the neighborhood.
3. The cognitive elite is increasingly likely to intermany.
PART I1
Cognitive Classes and
Social Behavior
Whereas Part I dealt with positive outcomes-attainment
of high edu-
cational levels, prestigious occupations, high incomes-Part
I1 presents
our best estimate of how much intelligence has to do with America's
most pressing social problems. The short answer is "quite a lot," and the
reason is that different levels of cognitive ability are associated with dif-
ferent patterns of social behavior. High cognitive ability is generally as-
sociated with socially desirable behaviors, low cognitive ability with
socially undesirable ones.
"Generally associated with" does not mean "coincident with." For
virtually all of the topics we will be discussing, cognitive ability accounts
for only small to middling proportions of the variation among people.
It almost always explains less than 20 percent of the variance, to use the
statistician's term, usually less than 10 percent and often less than 5 per-
cent. What this means in English is that you cannot predict what a given
person will do from his 1Q score-a
point that we have made in Part I
and will make again, for it needs repeating. On the other hand, despite
the low association at the individual level, large differences in social be-
havior separate groups of people when the groups differ intellectually
on the average.
We will argue that intelligence itself, not just its correlation with
socioeconomic status, is responsible for these group differences. Our
thesis appears to be radical, judging from its neglect by other social
scientists. Could low intelligence possibly be a cause of irresponsible
childbearing and parenting behaviors, for example? Scholars of child-
bearing and parenting do not seem to think so. The 850 double-column
pages of the authoritative Handbook of Marriage and the Family, for
example, allude to intelligence about half a dozen times, always in
passing.' Could low intelligence possibly be a cause of unemployment
Intelligence and Social Behavior
- The authors argue that cognitive ability is significantly linked to America's most pressing social problems.
- While IQ is a poor predictor of individual behavior, accounting for less than 20 percent of variance, it reveals large behavioral differences between groups.
- The text claims that intelligence itself, rather than just socioeconomic status, is a primary driver of social outcomes like parenting and employment.
- Mainstream social science is criticized for neglecting cognitive ability as a causal factor in studies of marriage, family, and poverty.
- The authors contend that the correlation between low IQ and social issues must inform public policy regardless of the specific causal path.
- Part II of the work utilizes data from the National Longitudinal Survey of Youth (NLSY) to provide statistical evidence for these claims.
It is not that cognitive ability has been considered and found inconsequential but that it has barely been considered at all.
PART I1
Cognitive Classes and
Social Behavior
Whereas Part I dealt with positive outcomes-attainment
of high edu-
cational levels, prestigious occupations, high incomes-Part
I1 presents
our best estimate of how much intelligence has to do with America's
most pressing social problems. The short answer is "quite a lot," and the
reason is that different levels of cognitive ability are associated with dif-
ferent patterns of social behavior. High cognitive ability is generally as-
sociated with socially desirable behaviors, low cognitive ability with
socially undesirable ones.
"Generally associated with" does not mean "coincident with." For
virtually all of the topics we will be discussing, cognitive ability accounts
for only small to middling proportions of the variation among people.
It almost always explains less than 20 percent of the variance, to use the
statistician's term, usually less than 10 percent and often less than 5 per-
cent. What this means in English is that you cannot predict what a given
person will do from his 1Q score-a
point that we have made in Part I
and will make again, for it needs repeating. On the other hand, despite
the low association at the individual level, large differences in social be-
havior separate groups of people when the groups differ intellectually
on the average.
We will argue that intelligence itself, not just its correlation with
socioeconomic status, is responsible for these group differences. Our
thesis appears to be radical, judging from its neglect by other social
scientists. Could low intelligence possibly be a cause of irresponsible
childbearing and parenting behaviors, for example? Scholars of child-
bearing and parenting do not seem to think so. The 850 double-column
pages of the authoritative Handbook of Marriage and the Family, for
example, allude to intelligence about half a dozen times, always in
passing.' Could low intelligence possibly be a cause of unemployment
118
Cognitive Classes and Social Behavior
Cognitive Chses and Social Behavior
1 19
or poverty? Only a scattering of economists have broached the pos-
sibility.'
This neglect points to a gaping hole in the state of knowledge about
social behavior. It is not that cognitive ability has been considered and
found inconsequential but that it has barely been considered at all. The
chapters in, Part 11 add cognitive ability to the mix of variables that so-
cial scientists have traditionally used, clearing away some of the mys-
tery that has surrounded the nation's most serious social problems.
We will also argue that cognitive ability is an important factor in
thinking about the nature of the present problems, whether or not cog-
nitive ability is a cause. For example, if many of the single women who
have babies also have low IQ, it makes no difference (in one sense)
whether the low IQ caused them to have the babies or whether the path
of causation takes a more winding route. The reality that less intelligent
women have most of the out-of-wedlock babies affects and constrains
public policy, whatever the path of causation. The simple correlation,
unadjusted for other factors-what
social scientists called the zero-or-
der correlation-between
cognitive ability and social behaviors is so-
cially important.
The chapters of Part I1 cover a wide range of topics, each requiring
extensive documentation. Many statistics, many tables and graphs,
many citations to technical journals crowd the pages. But the chapters
generally follow a similar pattern, and many of the complexities will
be less daunting if you understand three basics: the NLSY, our use of
cognitive classes, and our standard operating procedure for statistical
analysis.
THE NLSY
In Part 1, we occasionally made use of the National Longitudinal Sur-
vey of Youth, the NLSY. In the chapters that follow, it will play the cen-
tral role in the analysis, with other studies called in as available and
appropriate.
Until a few years ago, there were no answers to many of the questions
we will ask, or only very murky answers. No one knew what the rela-
tionship of cognitive ability to illegitimacy might be, or even the rela-
tionship of cognitive ability to poverty. Despite the millions of mental
tests that have been given, very few of the systematic surveys, and some-
times none, gave the analyst a way to conclude with any confidence that
this is how IQ interacts with behavior X for a representative sample of
Americans.
Several modem sources of data have begun to answer such questions.
The TALENT database, the huge national sample of high school stu-
dents taken in 1961, is the most venerable of the sources, but its follow-
up surveys have been limited in the range and continuity of their data.
The Panel Study of Income Dynamics, begun in 1968 and the nation's
longest-running longitudinal database, administered a brief vocabulary
test in 1972 to part of its sample, but the scores allow only rough dis-
criminations among people in the lower portions of the distribution of
intelligence. The National Longitudinal Survey begun by the Depart-
ment of Education in 1972 (not to be confused with the NLSY) pro-
vides answers to many questions associated with educational outcomes.
The department's more ambitious study, High School and Beyond, con-
ducted in the early 1980s, is also useful.
But the mother lode for scholars who wish to understand the rela-
tionship of cognitive ability to social and economic outcomes is the
NLSY, whose official name is the National Longitudinal Survey of La-
bor Market Experience of Youth. When the study began in 1979, the
participants in the study were aged 14 to 22.13' There were originally
12,686 of them, chosen to provide adequate sample sizes for analyzing
crucial groups (for example, by oversampling blacks, Latinos, and low-
income whites), and also incorporating a weighting system so that
analysts could determine the correct estimates for nationally represen-
tative samples of their age group. Sample attrition has been kept low
and the quality of the data, gathered by the National Opinion Research
Council under the supervision of the Center for Human Resources Re-
search at Ohio State University, has been excellent.
The NLSY is unique because it combines in one database all the el-
ements that hitherto had to be studied piecemeal. Only the NLSY com-
bined detailed information on the childhood environment and parental
socioeconomic status and subsequent educational and occupational
achievement and work history and family formation and-crucially for
our interestdetailed psychometric measures of cognitive skills.
The NLSY acquired its cognitive measures by a lucky coincidence.
In 1980, a year after the first wave of data collection, the Department
of Defense decided to update the national norms for its battery of en-
listment tests. A t the time, it was still using test scores from World War
I1 recruits as the reference population. Because the NLSY had just gone
The NLSY Data Mother Lode
- Historically, researchers lacked high-quality data to link cognitive ability with specific social behaviors like poverty or illegitimacy.
- While several longitudinal studies exist, most have limitations regarding sample size, continuity, or the precision of their intelligence metrics.
- The National Longitudinal Survey of Youth (NLSY) is identified as the premier dataset for analyzing the intersection of IQ and socioeconomic outcomes.
- The NLSY is uniquely comprehensive, tracking childhood environment, parental status, work history, and family formation in a single representative sample.
- A 'lucky coincidence' involving the Department of Defense allowed the NLSY to include high-quality psychometric data via the Armed Forces Qualification Test (AFQT).
- The AFQT serves as a 'highly g-loaded' measure, providing a reliable estimate of general cognitive ability for the study's participants.
But the mother lode for scholars who wish to understand the relationship of cognitive ability to social and economic outcomes is the NLSY.
118
Cognitive Classes and Social Behavior
Cognitive Chses and Social Behavior
1 19
or poverty? Only a scattering of economists have broached the pos-
sibility.'
This neglect points to a gaping hole in the state of knowledge about
social behavior. It is not that cognitive ability has been considered and
found inconsequential but that it has barely been considered at all. The
chapters in, Part 11 add cognitive ability to the mix of variables that so-
cial scientists have traditionally used, clearing away some of the mys-
tery that has surrounded the nation's most serious social problems.
We will also argue that cognitive ability is an important factor in
thinking about the nature of the present problems, whether or not cog-
nitive ability is a cause. For example, if many of the single women who
have babies also have low IQ, it makes no difference (in one sense)
whether the low IQ caused them to have the babies or whether the path
of causation takes a more winding route. The reality that less intelligent
women have most of the out-of-wedlock babies affects and constrains
public policy, whatever the path of causation. The simple correlation,
unadjusted for other factors-what
social scientists called the zero-or-
der correlation-between
cognitive ability and social behaviors is so-
cially important.
The chapters of Part I1 cover a wide range of topics, each requiring
extensive documentation. Many statistics, many tables and graphs,
many citations to technical journals crowd the pages. But the chapters
generally follow a similar pattern, and many of the complexities will
be less daunting if you understand three basics: the NLSY, our use of
cognitive classes, and our standard operating procedure for statistical
analysis.
THE NLSY
In Part 1, we occasionally made use of the National Longitudinal Sur-
vey of Youth, the NLSY. In the chapters that follow, it will play the cen-
tral role in the analysis, with other studies called in as available and
appropriate.
Until a few years ago, there were no answers to many of the questions
we will ask, or only very murky answers. No one knew what the rela-
tionship of cognitive ability to illegitimacy might be, or even the rela-
tionship of cognitive ability to poverty. Despite the millions of mental
tests that have been given, very few of the systematic surveys, and some-
times none, gave the analyst a way to conclude with any confidence that
this is how IQ interacts with behavior X for a representative sample of
Americans.
Several modem sources of data have begun to answer such questions.
The TALENT database, the huge national sample of high school stu-
dents taken in 1961, is the most venerable of the sources, but its follow-
up surveys have been limited in the range and continuity of their data.
The Panel Study of Income Dynamics, begun in 1968 and the nation's
longest-running longitudinal database, administered a brief vocabulary
test in 1972 to part of its sample, but the scores allow only rough dis-
criminations among people in the lower portions of the distribution of
intelligence. The National Longitudinal Survey begun by the Depart-
ment of Education in 1972 (not to be confused with the NLSY) pro-
vides answers to many questions associated with educational outcomes.
The department's more ambitious study, High School and Beyond, con-
ducted in the early 1980s, is also useful.
But the mother lode for scholars who wish to understand the rela-
tionship of cognitive ability to social and economic outcomes is the
NLSY, whose official name is the National Longitudinal Survey of La-
bor Market Experience of Youth. When the study began in 1979, the
participants in the study were aged 14 to 22.13' There were originally
12,686 of them, chosen to provide adequate sample sizes for analyzing
crucial groups (for example, by oversampling blacks, Latinos, and low-
income whites), and also incorporating a weighting system so that
analysts could determine the correct estimates for nationally represen-
tative samples of their age group. Sample attrition has been kept low
and the quality of the data, gathered by the National Opinion Research
Council under the supervision of the Center for Human Resources Re-
search at Ohio State University, has been excellent.
The NLSY is unique because it combines in one database all the el-
ements that hitherto had to be studied piecemeal. Only the NLSY com-
bined detailed information on the childhood environment and parental
socioeconomic status and subsequent educational and occupational
achievement and work history and family formation and-crucially for
our interestdetailed psychometric measures of cognitive skills.
The NLSY acquired its cognitive measures by a lucky coincidence.
In 1980, a year after the first wave of data collection, the Department
of Defense decided to update the national norms for its battery of en-
listment tests. A t the time, it was still using test scores from World War
I1 recruits as the reference population. Because the NLSY had just gone
120
Cognitive Classes and Social Behavior
through the technically difficult and tedious task of selecting a nation-
ally representative sample, the Department of Defense proposed to
piggyback its study on the NLSY sample.4 And so the NLSY became the
beneficiary of an expensive, well-designed set of cognitive and aptitude
tests that were given under carefully controlled conditions to almost 94
percent of the 12,686 young men and women in the NLSY sample.15'
The measure of cognitive ability extracted from this test battery was
the Armed Forces Qualification Test, the AFQT. It is what the psycho-
metricians call "highly g-loaded," meaning that it is a good measure of
general cognitive ability."he
AFQT's most significant shortcoming is
that it is truncated at the high end; about one person in a thousand gets
a perfect score, which means both that the test does not discriminate
among the very highest levels of intelligence and that the variance in
the population is somewhat understated. Otherwise the AFQT is an ex-
cellent test, with psychometric reliability and validity that compare well
with those of the other major tests of intelligence. Because the raw
scores on the AFQT mean nothing to the average reader, we express
them in the 1Q metric (with a mean of 100 and a standard deviation of
15) or in centiles. Also, we will subsequently refer to them as "IQscores,"
in keeping with our policy of using IQ as a generic term for intelligence
test scores. When we use centiles, they are age equated. A centile score
of 45, for example, means that the subject would rank in the 45th per-
centile of everyone born in the same year, if everyone took the AFQT.~"
A final point about the presentation of NLSY results is that all results
are based on weighted analyses, which means that all may be interpreted
in terms of a nationally representative sample of Americans in the NLSY
age group. We use data collected through the 1990 interview wave.
THE DEFINITION OF COGNITIVE CLASSES
To this point, we have been referring to cognitive classes without being
specific. In these chapters, we divide the world into cognitive classes-
five of them, hecause that has been the most common number among
sociologists who have broken down socioeconomic status into classes
and because five allows the natural groupings of "very high," "high,"
"mid," "low," and "very low." We have chosen to break the intervals at
the Sth, 25th, 75th, and 95th percentiles of the distribution. The figure
shows how this looks for a normally distributed population.
Break points are arbitrary, but we did have some reasons for these.
Cognitive Classes and Social Behavior
12 1
Defining the cognitive classes
The Distribution of IQ
IQ Score
Mainly, we wanted to focus on the extremes; hence, we avoided a sim-
ple breakdown into quintiles (i.e., into equal cuts of 20 percent). A great
deal of interest goes on within the top 20 percent and bottom 20 per-
cent of the population. Indeed, if the sample sizes were large enough,
we would have defined the top cognitive class as consisting of the top
I or 2 percent of the population. Important gradations in social hehav-
ior occasionally separate the top 2 percent from the next 2 percent. This
is in line with another of the themes that we keep reiterating because
they are so easily forgotten: You-meaning
the self-selected person who
has read this far into this book-live
in a world that probably looks noth-
ing like the figure. In all likelihood, almost all of your friends and pro-
fessional associates belong in that top Class I slice. Your friends and
associates whom you consider to be unusually slow are probably some-
where in Class 11. Those whom you consider to he unusually bright are
probably somewhere in the upper fraction of the 99th centile, a very
thin slice of the overall distribution. In defining Class 1, which we will
use as an operational definition of the more amorphous group called the
"cognitive elite," as being the top 5 percent, we are being quite inclu-
sive. It does, after all, embrace some 12 112 million people. Class 111, the
normals, comprises half of the population. Classes 11 and 1V each com-
rises 20 Dercent, and Class V, like Class I, comprises 5 percent.
Defining the Cognitive Classes
- The Armed Forces Qualification Test (AFQT) is utilized as a reliable proxy for IQ, though it is noted to be truncated at the highest levels of intelligence.
- The authors divide the population into five distinct cognitive classes based on IQ percentiles: Class I (top 5%), Class II (next 20%), Class III (middle 50%), Class IV (next 20%), and Class V (bottom 5%).
- The classification system prioritizes the extremes of the distribution over equal quintiles to better analyze social behavior at the margins.
- Class I is defined as the 'cognitive elite,' a group that includes approximately 12.5 million people in the United States.
- The authors suggest that the typical reader's social circle is likely composed almost entirely of Class I individuals, creating a skewed perception of the general population's intelligence.
- The terminology used for these classes, such as 'very dull' for Class V, is chosen to be descriptive while attempting to navigate the lack of neutral language for intelligence levels.
In all likelihood, almost all of your friends and professional associates belong in that top Class I slice.
120
Cognitive Classes and Social Behavior
through the technically difficult and tedious task of selecting a nation-
ally representative sample, the Department of Defense proposed to
piggyback its study on the NLSY sample.4 And so the NLSY became the
beneficiary of an expensive, well-designed set of cognitive and aptitude
tests that were given under carefully controlled conditions to almost 94
percent of the 12,686 young men and women in the NLSY sample.15'
The measure of cognitive ability extracted from this test battery was
the Armed Forces Qualification Test, the AFQT. It is what the psycho-
metricians call "highly g-loaded," meaning that it is a good measure of
general cognitive ability."he
AFQT's most significant shortcoming is
that it is truncated at the high end; about one person in a thousand gets
a perfect score, which means both that the test does not discriminate
among the very highest levels of intelligence and that the variance in
the population is somewhat understated. Otherwise the AFQT is an ex-
cellent test, with psychometric reliability and validity that compare well
with those of the other major tests of intelligence. Because the raw
scores on the AFQT mean nothing to the average reader, we express
them in the 1Q metric (with a mean of 100 and a standard deviation of
15) or in centiles. Also, we will subsequently refer to them as "IQscores,"
in keeping with our policy of using IQ as a generic term for intelligence
test scores. When we use centiles, they are age equated. A centile score
of 45, for example, means that the subject would rank in the 45th per-
centile of everyone born in the same year, if everyone took the AFQT.~"
A final point about the presentation of NLSY results is that all results
are based on weighted analyses, which means that all may be interpreted
in terms of a nationally representative sample of Americans in the NLSY
age group. We use data collected through the 1990 interview wave.
THE DEFINITION OF COGNITIVE CLASSES
To this point, we have been referring to cognitive classes without being
specific. In these chapters, we divide the world into cognitive classes-
five of them, hecause that has been the most common number among
sociologists who have broken down socioeconomic status into classes
and because five allows the natural groupings of "very high," "high,"
"mid," "low," and "very low." We have chosen to break the intervals at
the Sth, 25th, 75th, and 95th percentiles of the distribution. The figure
shows how this looks for a normally distributed population.
Break points are arbitrary, but we did have some reasons for these.
Cognitive Classes and Social Behavior
12 1
Defining the cognitive classes
The Distribution of IQ
IQ Score
Mainly, we wanted to focus on the extremes; hence, we avoided a sim-
ple breakdown into quintiles (i.e., into equal cuts of 20 percent). A great
deal of interest goes on within the top 20 percent and bottom 20 per-
cent of the population. Indeed, if the sample sizes were large enough,
we would have defined the top cognitive class as consisting of the top
I or 2 percent of the population. Important gradations in social hehav-
ior occasionally separate the top 2 percent from the next 2 percent. This
is in line with another of the themes that we keep reiterating because
they are so easily forgotten: You-meaning
the self-selected person who
has read this far into this book-live
in a world that probably looks noth-
ing like the figure. In all likelihood, almost all of your friends and pro-
fessional associates belong in that top Class I slice. Your friends and
associates whom you consider to be unusually slow are probably some-
where in Class 11. Those whom you consider to he unusually bright are
probably somewhere in the upper fraction of the 99th centile, a very
thin slice of the overall distribution. In defining Class 1, which we will
use as an operational definition of the more amorphous group called the
"cognitive elite," as being the top 5 percent, we are being quite inclu-
sive. It does, after all, embrace some 12 112 million people. Class 111, the
normals, comprises half of the population. Classes 11 and 1V each com-
rises 20 Dercent, and Class V, like Class I, comprises 5 percent.
122
Cognitive Classes and Social Behavior
123
The labels for the classes are the best we could do. It is impossible to
devise neutral terms for people in the lowest classes or the highest ones.
Our choice of "very dull" for Class V sounds to us less damning than the
standard "retarded" (which is generally defined as below an IQ of 70,
with "borderline retarded" referring to IQs between 70 and 80). "Very
bright" seems more focused than "superior," which is the standard term
for people with IQs of 120 to 130 (those with IQs above 130 are called
"very superior" in that nomenclature).'"
PRESENTING STATISTICAL RESULTS
The basic tool for multivariate analysis in the social sciences is known
as regression adysis.[91 The many forms of regression analysis have a
common structure. There is a result to explain, the dependent vanable.
There are some things that might be the causes, the independent vari-
abks. Regression analysis tells how much each cause actually affects the
result, taking the role of all the other hypothesized cawes into account-an
enormously useful thing for a statistical procedure to do, hence its wide-
spread use.
In most of the chapters of Part 11, we will be looking at a variety of
social behaviors, ranging from crime to childbearing to unemployment
to citizenship. In each instance, we will look first at the direct rela-
tionship of cognitive ability to that behavior. After observing a statis-
tical connection, the next question to come to mind is, What else might
be another source of the relationship?
In the case of IQ, the obvious answer is socioeconomic status. To what
What Is a Variable?
The word vasiabk confuses some people who are new to statistics, because
it sounds as if a variable is something that keeps changing. In fact, it is
something that has different values among the members of a population.
Consider weight as a variable. For any given observation, weight is a sin-
gle number: the number of pounds that an object weighed at the time the
observation was taken. But over all the members of the sample, weight has
different values: It varies, hence it is a variable. A mnemonic for keeping
"independent" and "dependent" straight is that the dependent variable is
thought to "depend on" the values of the independent variables.
extent is this relationship really founded on the social background and
economic resources that shaped the environment in which the person
grew up-the
parents' socioeconomic status (SES)-rather
than intel-
ligence? Our measure of SES is an index combining indicators of
parental education, income, and occupational prestige (details may be
found in Appendix 2). Our basic procedure has been to run regression
analyses in which the independent variables include IQ and parental
SES."" The result is a statement of the form: "Here is the relationship
of IQ to social behavior X after the effects of socioeconomic background
have been extracted," or vice versa. Usually this takes the analysis most
of the distance it can sensibly be pushed. If the independent relation-
ship of IQ to social behavior X is small, there is no point in looking fur-
ther. If the role of IQ remains large independent of SES, then it is worth
thinking about, for it may cast social behavior and public policy in a
new light.
But What About Other Explanations?
We do not have the choice of leaving the issue of causation at that, how-
ever. Because intelligence has been such a taboo explanation for social
behavior, we assume that our conclusions will often be resisted, if not
condemned. We can already hear critics saying, "If only they had added
this other variable to the analysis, they would have seen that intelli-
gence has nothing to do with X." A major part of our analysis accord-
ingly has been to anticipate what other variables might be invoked and
seeing if they do in fact attenuate the relationship of IQ to any given
social behavior. This was not a scattershot effort. For each relationship,
we asked ourselves if evidence, theory, or common sense suggests an-
other major causal story. Sometimes it did. When looking at whether a
new mother went on welfare, for example, it clearly was not enough to
know the general socioeconomic background of the woman's parents.
It was also essential to examine her own economic situation at the time
she had the baby: Whatever her IQ is, would she go on welfare if she
had economic resources to draw on?
At this point, however, statistical analysis can become a bottomless
pit. It is not uncommon in technical journals to read articles built
around the estimated effects of a dozen or more independent variables.
Sometimes the entire set of variables is loaded into a single regression
equation. Sometimes sets of equations are used-modeling
even more
Statistical Methods and IQ
- The text defines regression analysis as the primary tool for determining how much specific independent variables affect a dependent variable.
- A central goal of the study is to isolate the relationship between cognitive ability and various social behaviors like crime and unemployment.
- The authors use a socioeconomic status (SES) index—combining parental education, income, and occupation—to test if IQ's effects are merely environmental.
- If the relationship between IQ and a behavior remains significant after controlling for SES, the authors argue it warrants serious policy consideration.
- The methodology anticipates and addresses potential criticism by testing alternative causal variables that might explain away the influence of intelligence.
Because intelligence has been such a taboo explanation for social behavior, we assume that our conclusions will often be resisted, if not condemned.
122
Cognitive Classes and Social Behavior
123
The labels for the classes are the best we could do. It is impossible to
devise neutral terms for people in the lowest classes or the highest ones.
Our choice of "very dull" for Class V sounds to us less damning than the
standard "retarded" (which is generally defined as below an IQ of 70,
with "borderline retarded" referring to IQs between 70 and 80). "Very
bright" seems more focused than "superior," which is the standard term
for people with IQs of 120 to 130 (those with IQs above 130 are called
"very superior" in that nomenclature).'"
PRESENTING STATISTICAL RESULTS
The basic tool for multivariate analysis in the social sciences is known
as regression adysis.[91 The many forms of regression analysis have a
common structure. There is a result to explain, the dependent vanable.
There are some things that might be the causes, the independent vari-
abks. Regression analysis tells how much each cause actually affects the
result, taking the role of all the other hypothesized cawes into account-an
enormously useful thing for a statistical procedure to do, hence its wide-
spread use.
In most of the chapters of Part 11, we will be looking at a variety of
social behaviors, ranging from crime to childbearing to unemployment
to citizenship. In each instance, we will look first at the direct rela-
tionship of cognitive ability to that behavior. After observing a statis-
tical connection, the next question to come to mind is, What else might
be another source of the relationship?
In the case of IQ, the obvious answer is socioeconomic status. To what
What Is a Variable?
The word vasiabk confuses some people who are new to statistics, because
it sounds as if a variable is something that keeps changing. In fact, it is
something that has different values among the members of a population.
Consider weight as a variable. For any given observation, weight is a sin-
gle number: the number of pounds that an object weighed at the time the
observation was taken. But over all the members of the sample, weight has
different values: It varies, hence it is a variable. A mnemonic for keeping
"independent" and "dependent" straight is that the dependent variable is
thought to "depend on" the values of the independent variables.
extent is this relationship really founded on the social background and
economic resources that shaped the environment in which the person
grew up-the
parents' socioeconomic status (SES)-rather
than intel-
ligence? Our measure of SES is an index combining indicators of
parental education, income, and occupational prestige (details may be
found in Appendix 2). Our basic procedure has been to run regression
analyses in which the independent variables include IQ and parental
SES."" The result is a statement of the form: "Here is the relationship
of IQ to social behavior X after the effects of socioeconomic background
have been extracted," or vice versa. Usually this takes the analysis most
of the distance it can sensibly be pushed. If the independent relation-
ship of IQ to social behavior X is small, there is no point in looking fur-
ther. If the role of IQ remains large independent of SES, then it is worth
thinking about, for it may cast social behavior and public policy in a
new light.
But What About Other Explanations?
We do not have the choice of leaving the issue of causation at that, how-
ever. Because intelligence has been such a taboo explanation for social
behavior, we assume that our conclusions will often be resisted, if not
condemned. We can already hear critics saying, "If only they had added
this other variable to the analysis, they would have seen that intelli-
gence has nothing to do with X." A major part of our analysis accord-
ingly has been to anticipate what other variables might be invoked and
seeing if they do in fact attenuate the relationship of IQ to any given
social behavior. This was not a scattershot effort. For each relationship,
we asked ourselves if evidence, theory, or common sense suggests an-
other major causal story. Sometimes it did. When looking at whether a
new mother went on welfare, for example, it clearly was not enough to
know the general socioeconomic background of the woman's parents.
It was also essential to examine her own economic situation at the time
she had the baby: Whatever her IQ is, would she go on welfare if she
had economic resources to draw on?
At this point, however, statistical analysis can become a bottomless
pit. It is not uncommon in technical journals to read articles built
around the estimated effects of a dozen or more independent variables.
Sometimes the entire set of variables is loaded into a single regression
equation. Sometimes sets of equations are used-modeling
even more
Statistical Limits and Education
- Statistical analysis risks becoming a 'bottomless pit' when too many independent variables are introduced into a single regression equation.
- Researchers must avoid including variables that are merely different expressions of factors already present in the model, such as IQ and socioeconomic status.
- Education is a uniquely difficult variable because it is heavily influenced by both parental background and the individual's cognitive ability.
- The impact of education is often discontinuous, meaning a degree carries more weight than the specific number of years spent in school.
- The effectiveness of education is fundamentally tied to cognitive ability, as the same schooling will yield different life outcomes for individuals with different IQs.
Indisputably, giving nineteen years of education to a person with an IQ of 75 is not going to have the same impact on life as it would for a person with an IQ of 125.
122
Cognitive Classes and Social Behavior
123
The labels for the classes are the best we could do. It is impossible to
devise neutral terms for people in the lowest classes or the highest ones.
Our choice of "very dull" for Class V sounds to us less damning than the
standard "retarded" (which is generally defined as below an IQ of 70,
with "borderline retarded" referring to IQs between 70 and 80). "Very
bright" seems more focused than "superior," which is the standard term
for people with IQs of 120 to 130 (those with IQs above 130 are called
"very superior" in that nomenclature).'"
PRESENTING STATISTICAL RESULTS
The basic tool for multivariate analysis in the social sciences is known
as regression adysis.[91 The many forms of regression analysis have a
common structure. There is a result to explain, the dependent vanable.
There are some things that might be the causes, the independent vari-
abks. Regression analysis tells how much each cause actually affects the
result, taking the role of all the other hypothesized cawes into account-an
enormously useful thing for a statistical procedure to do, hence its wide-
spread use.
In most of the chapters of Part 11, we will be looking at a variety of
social behaviors, ranging from crime to childbearing to unemployment
to citizenship. In each instance, we will look first at the direct rela-
tionship of cognitive ability to that behavior. After observing a statis-
tical connection, the next question to come to mind is, What else might
be another source of the relationship?
In the case of IQ, the obvious answer is socioeconomic status. To what
What Is a Variable?
The word vasiabk confuses some people who are new to statistics, because
it sounds as if a variable is something that keeps changing. In fact, it is
something that has different values among the members of a population.
Consider weight as a variable. For any given observation, weight is a sin-
gle number: the number of pounds that an object weighed at the time the
observation was taken. But over all the members of the sample, weight has
different values: It varies, hence it is a variable. A mnemonic for keeping
"independent" and "dependent" straight is that the dependent variable is
thought to "depend on" the values of the independent variables.
extent is this relationship really founded on the social background and
economic resources that shaped the environment in which the person
grew up-the
parents' socioeconomic status (SES)-rather
than intel-
ligence? Our measure of SES is an index combining indicators of
parental education, income, and occupational prestige (details may be
found in Appendix 2). Our basic procedure has been to run regression
analyses in which the independent variables include IQ and parental
SES."" The result is a statement of the form: "Here is the relationship
of IQ to social behavior X after the effects of socioeconomic background
have been extracted," or vice versa. Usually this takes the analysis most
of the distance it can sensibly be pushed. If the independent relation-
ship of IQ to social behavior X is small, there is no point in looking fur-
ther. If the role of IQ remains large independent of SES, then it is worth
thinking about, for it may cast social behavior and public policy in a
new light.
But What About Other Explanations?
We do not have the choice of leaving the issue of causation at that, how-
ever. Because intelligence has been such a taboo explanation for social
behavior, we assume that our conclusions will often be resisted, if not
condemned. We can already hear critics saying, "If only they had added
this other variable to the analysis, they would have seen that intelli-
gence has nothing to do with X." A major part of our analysis accord-
ingly has been to anticipate what other variables might be invoked and
seeing if they do in fact attenuate the relationship of IQ to any given
social behavior. This was not a scattershot effort. For each relationship,
we asked ourselves if evidence, theory, or common sense suggests an-
other major causal story. Sometimes it did. When looking at whether a
new mother went on welfare, for example, it clearly was not enough to
know the general socioeconomic background of the woman's parents.
It was also essential to examine her own economic situation at the time
she had the baby: Whatever her IQ is, would she go on welfare if she
had economic resources to draw on?
At this point, however, statistical analysis can become a bottomless
pit. It is not uncommon in technical journals to read articles built
around the estimated effects of a dozen or more independent variables.
Sometimes the entire set of variables is loaded into a single regression
equation. Sometimes sets of equations are used-modeling
even more
124
Cognitive Classes and Social Behavior
Coffnitive Classes and Social Behavior
12 5
complex relationships, in which all the variables can exert mutual ef-
fects on one another.
Why should we not press forward? Why not also ask if religious back-
ground has an effect on the decision to go on welfare, for example? It is
an interesting question, as are another fifty others that might come to
mind. Our principle was to explore additional dynamics when there was
another factor that was not only conceivably important but for clear
logical reasons might he important because of dynamics having little or
nothing to do with lQ. This last proviso is crucial, for one of the most
common misuses of regression analysis is to introduce an additional
variable that in reality is mostly another expression of variables that are
already in the equation.
The Special Case of Education
Education posed a special and continuing problem. O n the one hand,
education can be important independent of cognitive ability. For ex-
ample, education tends to delay marriage and childbirth because the
time and commitment involved in being in school competes with the
time and commitment it takes to be married or have a baby. Education
shapes tastes and values in ways that are independent of the cognitive
ability of the student. At the same time, however, the role of education
versus IQ as calculated by a regression equation is tricky to interpret, for
four reasons.
First, the number of years of education that a youth gets is caused to
an important degree by both the parents' SES and the youth's own aca-
demic ability. In the NLSY, for example, the correlation of years of ed-
ucation with parental SES and youth's 1Q are +.50 and +.64,
respectively. This means that when years of education is used as an in-
dependent variable, it is to some extent expressing the effects of SES
and IQ in another form.
Second, any role that education plays independent of intelligence is
likely to be discontinuous. For example, it may make a big difference to
many outcomes that a person has a college degree. But how is one to in-
terpret the substantive difference between one year of college and two?
Between one year of graduate school and two? They are unlikely to be
nearly as important as the difference hetween "a college degree" and "no
college degree."
Third, variables that are closely related can in some circumstances
produce a technical problem known as multicollinearity, whereby the so-
lutions produced by regression equations are unstable and often mis-
leading.
Fourth and finally, to take education's regression coefficient seriously
tacitly assumes that intelligence and education could vary indepen-
dently and produce similar results. No one can believe this to be true in
general: indisputably, giving nineteen years of education to a person
with an IQ of 75 is not going to have the same impact on life as it would
for a person with an IQ of 125. The effects of education, whatever they
may be, depend on the coexistence of suitable cognitive ability in ways
that often require complex and extensive modeling of interaction ef-
fects---once again, problems that we hope others will take up but would
push us far heyond the purposes of this book.
Our solution to this situation is to report the role of cognitive abil-
~ t y
for two subpopulations of the NLSY that each have the same level
of education: a high school diploma, no more and no less in one group;
a bachelor's degree, no more and no less, in the other. This is a simple,
but we believe reasonable, way of bounding the degree to which cogni-
tive ability makes a difference independent of education.
We walk through all three of these basics-the
NLSY, the five cogni-
tlve classes, and the format for the statistical analysis-in
a step-by-step
f;lshlon in the next chapter, where we use poverty to set the stage for
the social behaviors to follow. Chapter 6 returns to education, this time
not just talking about how far people got hut the comparative roles of
IQ and SES in determining how far someone gets in school. Then, se-
riatim, we take up unemployment and labor force dropout (Chapter 7),
single-parent families and illegitimacy (Chapter 8), welfare dependency
(Chapter 9), parenting (Chapter lo), crime (Chapter 1 l), and civic be-
havior (Chapter 12).
In these eight chapters, we limit the analysis to whites, and more
specifically to non-Latino whites.'"' This is, we think, the best way to
make yet another central point: Cognitive ability affects social behav-
ior without regard to race or ethnicity. The influence of race and eth-
nicity is deferred to Part 111.
Intelligence and the Poverty Trap
- The authors utilize the NLSY dataset to analyze the independent roles of cognitive ability and education by comparing subpopulations with identical degree levels.
- The study focuses exclusively on non-Latino whites in this section to demonstrate that cognitive ability influences social behavior independently of race or ethnicity.
- Statistical analysis reveals that low intelligence is a significantly stronger predictor of poverty than low socioeconomic background.
- A youth of average intelligence born into extreme poverty has a 90 percent chance of escaping it by their early 30s, whereas a youth with low intelligence from a middle-class home faces a higher poverty risk.
- While marital status and education are important factors, intelligence remains the dominant precursor of poverty even when multiple variables are controlled.
- The historical context shows that significant progress against poverty made between World War II and the 1960s has since stagnated.
If you have to choose, is it better to be born smart or rich? The answer is unequivocally "smart."
124
Cognitive Classes and Social Behavior
Coffnitive Classes and Social Behavior
12 5
complex relationships, in which all the variables can exert mutual ef-
fects on one another.
Why should we not press forward? Why not also ask if religious back-
ground has an effect on the decision to go on welfare, for example? It is
an interesting question, as are another fifty others that might come to
mind. Our principle was to explore additional dynamics when there was
another factor that was not only conceivably important but for clear
logical reasons might he important because of dynamics having little or
nothing to do with lQ. This last proviso is crucial, for one of the most
common misuses of regression analysis is to introduce an additional
variable that in reality is mostly another expression of variables that are
already in the equation.
The Special Case of Education
Education posed a special and continuing problem. O n the one hand,
education can be important independent of cognitive ability. For ex-
ample, education tends to delay marriage and childbirth because the
time and commitment involved in being in school competes with the
time and commitment it takes to be married or have a baby. Education
shapes tastes and values in ways that are independent of the cognitive
ability of the student. At the same time, however, the role of education
versus IQ as calculated by a regression equation is tricky to interpret, for
four reasons.
First, the number of years of education that a youth gets is caused to
an important degree by both the parents' SES and the youth's own aca-
demic ability. In the NLSY, for example, the correlation of years of ed-
ucation with parental SES and youth's 1Q are +.50 and +.64,
respectively. This means that when years of education is used as an in-
dependent variable, it is to some extent expressing the effects of SES
and IQ in another form.
Second, any role that education plays independent of intelligence is
likely to be discontinuous. For example, it may make a big difference to
many outcomes that a person has a college degree. But how is one to in-
terpret the substantive difference between one year of college and two?
Between one year of graduate school and two? They are unlikely to be
nearly as important as the difference hetween "a college degree" and "no
college degree."
Third, variables that are closely related can in some circumstances
produce a technical problem known as multicollinearity, whereby the so-
lutions produced by regression equations are unstable and often mis-
leading.
Fourth and finally, to take education's regression coefficient seriously
tacitly assumes that intelligence and education could vary indepen-
dently and produce similar results. No one can believe this to be true in
general: indisputably, giving nineteen years of education to a person
with an IQ of 75 is not going to have the same impact on life as it would
for a person with an IQ of 125. The effects of education, whatever they
may be, depend on the coexistence of suitable cognitive ability in ways
that often require complex and extensive modeling of interaction ef-
fects---once again, problems that we hope others will take up but would
push us far heyond the purposes of this book.
Our solution to this situation is to report the role of cognitive abil-
~ t y
for two subpopulations of the NLSY that each have the same level
of education: a high school diploma, no more and no less in one group;
a bachelor's degree, no more and no less, in the other. This is a simple,
but we believe reasonable, way of bounding the degree to which cogni-
tive ability makes a difference independent of education.
We walk through all three of these basics-the
NLSY, the five cogni-
tlve classes, and the format for the statistical analysis-in
a step-by-step
f;lshlon in the next chapter, where we use poverty to set the stage for
the social behaviors to follow. Chapter 6 returns to education, this time
not just talking about how far people got hut the comparative roles of
IQ and SES in determining how far someone gets in school. Then, se-
riatim, we take up unemployment and labor force dropout (Chapter 7),
single-parent families and illegitimacy (Chapter 8), welfare dependency
(Chapter 9), parenting (Chapter lo), crime (Chapter 1 l), and civic be-
havior (Chapter 12).
In these eight chapters, we limit the analysis to whites, and more
specifically to non-Latino whites.'"' This is, we think, the best way to
make yet another central point: Cognitive ability affects social behav-
ior without regard to race or ethnicity. The influence of race and eth-
nicity is deferred to Part 111.
Chapter 5
Poverty
Who becomes poor? One familiar answer is that peopk who are unlucky
enough to be born to poor parents become poor. There is some nuth to this.
Whites, the focus of our analyses in the chapters of Part 11, who grew up in
the worst 5 percent of socioeconomic circumstances are eight times more likely
to fall below the poverty line than those growing up in the top 5 percent of so-
cioeconomic circumstances. But h w intelligence is a stronger precursor of
poverty than low socioeconomic background. Whites with IQs in the bottom
5 percent of the distribution of cognitive ability are fifteen times more likely to
be poor than those with IQs in the top 5 percent.
How does each of these causes of poverty look when the other is held con-
stant? Or to put it another way: If you have to choose, is it better to be born
smart or rich? The answer is unequivocally "smart. " A white youth reared in
a home in which the parent or parents were chronically unemployed, worked
at only the most menial of jobs, and had not gotten past ninth grade, but of
just average intelligence--an IQ of 100-has
nearly a 90 percent chance of
being out of poverty by his or her early 30s. Conversely, a white youth b m
to a solid middk-class family but with an IQ equivalently below average faces
a much higher risk of poverty, despite his more fortunate background.
When the picture is complicated by adding the effects of sex, marital sta-
tus, and years of education, intelligence remains more important than any of
them, with marital status running a close second. Among peopk who are both
smart and well educated, the risk of poverty approaches zero. But it should
also be noted that young white adults who many are seldom in poverty, even
if they are below average in intelligence or education. Even in these more corn-
plicated analyses, low IQ continues to be a much stronger precursor of poverty
than the socioeconomic circumstances in which peopk grow up.
W
e begin with poverty because it has been so much at the center
of concern about social problems. We will be asking, "What
128
Cognitive Classes and Social Behavior
Poverty
129
causes poverty?"focusing on the role that cognitive ability might play.
Our point of departure is a quick look at the history of poverty in the
next figure, which scholars from the Institute for Research on Poverty
have now enabled us to take back to the 1930s.'''
Dramatic progress against poverty from World War I1
through the 1960s, stagnation since then
Proportion of Americans below the poverty line
50% -
40% -
Trendline established in 1939-69
30% -
20% -
106-
Sources: SAUS. various editions; Ross and others, 1987.
In 1939, over half of the people of the United States lived in fami-
lies with an income below the amount that constitutes the present
poverty line-in
constant dollars, of course. This figure declined steeply
through World War 11, and then through the Truman, Eisenhower,
Kennedy, and Johnson administrations. Then came a sudden and last-
ing halt to progress. As of 1992, 14.5 percent of Americans were below
the poverty line, within a few percentage points of the level in 1969.
This history provokes three observations.
The first is that poverty cannot be a simple, direct cause of such prob-
lems as crime, illegitimacy, and drug abuse. Probably no single obsewa-
tion about poverty is at once so indisputable and so ignored. It is
indisputable because poverty was endemic at a time when those prob-
lems were minor. We know that reducing poverty cannot, by itself, be
expected to produce less criminality, illegitimacy, drug abuse, or the rest
of the catalog of social problems, else the history of the twentieth cen.
tury would have chronicled their steep decline.
The second point illustrated by the graph of poverty is that the pool
of poor people must have changed over time. As late as the 1940s, so
many people were poor in economic terms that to be poor did not n e c ~
essarily mean to be distinguishable from the rest of the population in
any other way. To rephrase the dialogue between E Scott Fitzgerald and
Ernest Hemingway, the poor were different from you and me: They had
less money. But that was almost the only reliable difference. As afflu-
ence spread, people who escaped from poverty were not a random sam-
ple of the population. When a group shrinks from over 50 percent of
the population to the less than 15 percent that has prevailed since the
late 1960s, the people who are left behind are likely to be dispropor-
tionately those who suffer not only bad luck but also a lack of energy,
thrift, farsightedness, determination-and
brains.
The third point of the graph is that some perspective is in order about
what happened to poverty during the 1960s and the famous War on
Poverty. The trendline we show for 1936-1 969 would have had about the
same slope if we had chosen any of the decades in between to calculate it.
The United States was not only getting richer but had been reducing the
percentage of people below the modem poverty line for at least three
decades before the 1960s came to a close. We will not reopen here the
continuing debate a b u t why progress came to an end when it did.
In this chapter, we explore some basic findings about the different
roles that intelligence and social background play in keeping individu-
als out of poverty. The basics may be stated in a few paragraphs, as we
did in the chapter's introduction. But we also want to speak to readers
who ask, "Yes, but what about the role of. . . ," thinking of the many
other potential causes of white poverty. Ry the end of the chapter, we
will have drawn a controversial conclusion. How did we get there? What
makes us think that we have got our causal ordering right? We will walk
through the analyses that lie behind our conclusions, taking a more
leisurely approach than in the chapters to come.
CAN AN IQ SCORE TAKEN AT AGE 15 BE A CAUSE OF
POVERTY AT AGE 30?
We need to deal at once with an issue that applies to most of the top-
ics in Part 11. We want to consider poverty as an effect rather than as a
The Changing Nature of Poverty
- Historical data shows a steep decline in U.S. poverty from over 50% in 1939 to approximately 15% by 1969, after which progress halted.
- The author argues that poverty is not a direct cause of social ills like crime or drug abuse, as these problems were minor when poverty was most widespread.
- As the poverty rate shrank, the remaining 'poor' population became less of a random sample and more concentrated with specific personal and cognitive deficits.
- The decline in poverty was a long-term trend that predated the 1960s War on Poverty, suggesting that government programs were not the sole driver of progress.
- The text proposes shifting the analytical focus to treat poverty as a dependent variable, specifically examining how intelligence influences the likelihood of being poor.
To rephrase the dialogue between F. Scott Fitzgerald and Ernest Hemingway, the poor were different from you and me: They had less money.
128
Cognitive Classes and Social Behavior
Poverty
129
causes poverty?"focusing on the role that cognitive ability might play.
Our point of departure is a quick look at the history of poverty in the
next figure, which scholars from the Institute for Research on Poverty
have now enabled us to take back to the 1930s.'''
Dramatic progress against poverty from World War I1
through the 1960s, stagnation since then
Proportion of Americans below the poverty line
50% -
40% -
Trendline established in 1939-69
30% -
20% -
106-
Sources: SAUS. various editions; Ross and others, 1987.
In 1939, over half of the people of the United States lived in fami-
lies with an income below the amount that constitutes the present
poverty line-in
constant dollars, of course. This figure declined steeply
through World War 11, and then through the Truman, Eisenhower,
Kennedy, and Johnson administrations. Then came a sudden and last-
ing halt to progress. As of 1992, 14.5 percent of Americans were below
the poverty line, within a few percentage points of the level in 1969.
This history provokes three observations.
The first is that poverty cannot be a simple, direct cause of such prob-
lems as crime, illegitimacy, and drug abuse. Probably no single obsewa-
tion about poverty is at once so indisputable and so ignored. It is
indisputable because poverty was endemic at a time when those prob-
lems were minor. We know that reducing poverty cannot, by itself, be
expected to produce less criminality, illegitimacy, drug abuse, or the rest
of the catalog of social problems, else the history of the twentieth cen.
tury would have chronicled their steep decline.
The second point illustrated by the graph of poverty is that the pool
of poor people must have changed over time. As late as the 1940s, so
many people were poor in economic terms that to be poor did not n e c ~
essarily mean to be distinguishable from the rest of the population in
any other way. To rephrase the dialogue between E Scott Fitzgerald and
Ernest Hemingway, the poor were different from you and me: They had
less money. But that was almost the only reliable difference. As afflu-
ence spread, people who escaped from poverty were not a random sam-
ple of the population. When a group shrinks from over 50 percent of
the population to the less than 15 percent that has prevailed since the
late 1960s, the people who are left behind are likely to be dispropor-
tionately those who suffer not only bad luck but also a lack of energy,
thrift, farsightedness, determination-and
brains.
The third point of the graph is that some perspective is in order about
what happened to poverty during the 1960s and the famous War on
Poverty. The trendline we show for 1936-1 969 would have had about the
same slope if we had chosen any of the decades in between to calculate it.
The United States was not only getting richer but had been reducing the
percentage of people below the modem poverty line for at least three
decades before the 1960s came to a close. We will not reopen here the
continuing debate a b u t why progress came to an end when it did.
In this chapter, we explore some basic findings about the different
roles that intelligence and social background play in keeping individu-
als out of poverty. The basics may be stated in a few paragraphs, as we
did in the chapter's introduction. But we also want to speak to readers
who ask, "Yes, but what about the role of. . . ," thinking of the many
other potential causes of white poverty. Ry the end of the chapter, we
will have drawn a controversial conclusion. How did we get there? What
makes us think that we have got our causal ordering right? We will walk
through the analyses that lie behind our conclusions, taking a more
leisurely approach than in the chapters to come.
CAN AN IQ SCORE TAKEN AT AGE 15 BE A CAUSE OF
POVERTY AT AGE 30?
We need to deal at once with an issue that applies to most of the top-
ics in Part 11. We want to consider poverty as an effect rather than as a
130
Cognitive Classes and Social Behavior
Poverty
13 1
cause-in
social science terminology, as a dependent, not an indepen-
dent, ~ariable.~
Intelligence will be evaluated as a factor that bears on
becoming poor. But what, after all, does an intelligence test score mean
for an adolescent who has grown up poor? Wouldn't his test score have
been higher if his luck in home environment had been better? Can IQ
be causing poverty if poverty is causing IQ?
The Stability of IQ over the Life Span
The stability of IQ over time in the general population has heen studied
for decades, and the main findings are not in much dispute among psy-
chometricians. Up to about 4 or 5 years of age, measures of IQ are not of
much use in predicting later 1Q. Indeed, you will get a better prediction of
the child's 1Q at age 15 by knowing his parents' IQ than by any test of the
child given before age 5.' Between ages 5 and 10, the tests rapidly hecome
more predictive of adult IQ.'~'
After about the age of 10, the 1Q score is es-
sentially stable within the constraints of measurement error.'" On the com-
paratively rare occasions when large changes in IQ are observed, there is
usually an obvious explanation. The child had heen hedridden with a long
illness before one of the tests, for example, or there was severe emotional
disturbance at the time of one or both of the tests.
The 1Q score of an individual might have been higher if he had been
raised in more fortunate circumstances. Chapter 17 discusses this issue
in more detail. But for purposes of Part 11, the question is not what might
have been but what is. In discussions of intelligence, people obsess about
nature versus nurture, thinking that it matters fundamentally whether
a person with a low IQ at, say, age 15 came by that IQ through a defi-
cient environment or by bad luck in the genetic draw. But it does not
matter for the kinds of issues we consider in Part 11. The AFQT test
scores for the NLSY sample were obtained when the subjects were 15
to 23 years of age, and their IQ scores were already as deeply rooted a
fact about them as their height.16'
SOCIOECONOMIC BACKGROUND VERSUS COGNITIVE
ABILITY
For a century after poverty became a topic of systematic analysis in the
mid-1800s, it was taken for granted that there were different kinds of
poor people, with "deserving" and "undeserving" being one of the pri-
mary divisions.? Some people were poor because of circumstances be-
yond their control; others were poor as a result of their own behavior.
Such distinctions among types of poverty were still intellectually re-
spectable into the beginning of the Kennedy administration in 1961.
By the end of the 1960s, they were not. Poverty was now seen as a prod-
uct of broad systemic causes, not of individual characteristics. To say
otherwise was to "blame the victim."' Accordingly, the technical lit-
erature about the causes of current poverty deals almost exclusively in
economic and social explanations rather than with individual charac-
teristics. Much of this literature focuses on poverty among blacks and
its roots in racism and does not apply to the topic at hand: poverty
among whites.
It seems easy to make the case that poverty among whites also arises
from social and economic causes. Using the NLSY, we convert infor-
mation about the education, occupations, and income of the parents of
the NLSY youths into an index of socioeconomic status (SES) in which
the highest scores indicate advanced education, affluence, and presti-
gious occupations. The lowest scores indicate poverty, meager educa-
tion, and the most menial jobs. Suppose we then take the SES index
and divide all the NLSY youngsters into five socioeconomic classes on
exactly the same basis that we defined cognitive classes (split into cat-
egories of 5-20-50-20-5
percent of the population). We then ask,
What percentage of people who came from those socioeconomic back-
grounds were below the poverty line in their late 20s and early 30s (i.e.,
in 1989)? We exclude those who were still in school. The answer for
non-Latino whites in the NLSY sample is shown in the following table.
What could be plainer? Hardly any of the lucky 5 percent who had
grown up in the most advantaged circumstances were in poverty (only
White Poverty by Parents' Socioeconomic Class
Parents'
Percentage in Poverty
Socioeconomic Class
Very high
3
High
3
Mid
7
Low
12
Very low
24
Overall average
7
IQ Stability and Poverty Origins
- IQ scores become highly predictive of adult intelligence between ages 5 and 10, reaching essential stability after age 10.
- The authors argue that by late adolescence, an individual's IQ is as 'deeply rooted' a fact as their physical height.
- While environmental factors may influence early IQ development, the text posits that the origin of a low IQ (nature vs. nurture) is irrelevant to its social consequences in adulthood.
- The historical view of poverty shifted in the 1960s from individual-based 'deserving vs. undeserving' distinctions to systemic and economic explanations.
- The study utilizes a socioeconomic status (SES) index to compare how parental background correlates with the likelihood of living in poverty as an adult.
The AFQT test scores for the NLSY sample were obtained when the subjects were 15 to 23 years of age, and their IQ scores were already as deeply rooted a fact about them as their height.
130
Cognitive Classes and Social Behavior
Poverty
13 1
cause-in
social science terminology, as a dependent, not an indepen-
dent, ~ariable.~
Intelligence will be evaluated as a factor that bears on
becoming poor. But what, after all, does an intelligence test score mean
for an adolescent who has grown up poor? Wouldn't his test score have
been higher if his luck in home environment had been better? Can IQ
be causing poverty if poverty is causing IQ?
The Stability of IQ over the Life Span
The stability of IQ over time in the general population has heen studied
for decades, and the main findings are not in much dispute among psy-
chometricians. Up to about 4 or 5 years of age, measures of IQ are not of
much use in predicting later 1Q. Indeed, you will get a better prediction of
the child's 1Q at age 15 by knowing his parents' IQ than by any test of the
child given before age 5.' Between ages 5 and 10, the tests rapidly hecome
more predictive of adult IQ.'~'
After about the age of 10, the 1Q score is es-
sentially stable within the constraints of measurement error.'" On the com-
paratively rare occasions when large changes in IQ are observed, there is
usually an obvious explanation. The child had heen hedridden with a long
illness before one of the tests, for example, or there was severe emotional
disturbance at the time of one or both of the tests.
The 1Q score of an individual might have been higher if he had been
raised in more fortunate circumstances. Chapter 17 discusses this issue
in more detail. But for purposes of Part 11, the question is not what might
have been but what is. In discussions of intelligence, people obsess about
nature versus nurture, thinking that it matters fundamentally whether
a person with a low IQ at, say, age 15 came by that IQ through a defi-
cient environment or by bad luck in the genetic draw. But it does not
matter for the kinds of issues we consider in Part 11. The AFQT test
scores for the NLSY sample were obtained when the subjects were 15
to 23 years of age, and their IQ scores were already as deeply rooted a
fact about them as their height.16'
SOCIOECONOMIC BACKGROUND VERSUS COGNITIVE
ABILITY
For a century after poverty became a topic of systematic analysis in the
mid-1800s, it was taken for granted that there were different kinds of
poor people, with "deserving" and "undeserving" being one of the pri-
mary divisions.? Some people were poor because of circumstances be-
yond their control; others were poor as a result of their own behavior.
Such distinctions among types of poverty were still intellectually re-
spectable into the beginning of the Kennedy administration in 1961.
By the end of the 1960s, they were not. Poverty was now seen as a prod-
uct of broad systemic causes, not of individual characteristics. To say
otherwise was to "blame the victim."' Accordingly, the technical lit-
erature about the causes of current poverty deals almost exclusively in
economic and social explanations rather than with individual charac-
teristics. Much of this literature focuses on poverty among blacks and
its roots in racism and does not apply to the topic at hand: poverty
among whites.
It seems easy to make the case that poverty among whites also arises
from social and economic causes. Using the NLSY, we convert infor-
mation about the education, occupations, and income of the parents of
the NLSY youths into an index of socioeconomic status (SES) in which
the highest scores indicate advanced education, affluence, and presti-
gious occupations. The lowest scores indicate poverty, meager educa-
tion, and the most menial jobs. Suppose we then take the SES index
and divide all the NLSY youngsters into five socioeconomic classes on
exactly the same basis that we defined cognitive classes (split into cat-
egories of 5-20-50-20-5
percent of the population). We then ask,
What percentage of people who came from those socioeconomic back-
grounds were below the poverty line in their late 20s and early 30s (i.e.,
in 1989)? We exclude those who were still in school. The answer for
non-Latino whites in the NLSY sample is shown in the following table.
What could be plainer? Hardly any of the lucky 5 percent who had
grown up in the most advantaged circumstances were in poverty (only
White Poverty by Parents' Socioeconomic Class
Parents'
Percentage in Poverty
Socioeconomic Class
Very high
3
High
3
Mid
7
Low
12
Very low
24
Overall average
7
Cognitive Ability vs Socioeconomic Status
- Statistical data shows that white children from the highest socioeconomic backgrounds have only a 3 percent poverty rate, compared to 24 percent for those from the lowest class.
- When analyzed by cognitive class, the disparity is even more pronounced: only 2 percent of the 'very bright' are in poverty, while 30 percent of the 'very dull' fall below the line.
- While both parental background and IQ correlate with poverty, cognitive ability shows a steeper relationship with economic disadvantage at the lower end of the spectrum.
- The authors utilize regression analysis to disentangle the independent effects of IQ, age, and parental socioeconomic status (SES) on the probability of being in poverty.
- Initial findings suggest that age has a negligible impact on poverty status once intelligence and family background are statistically controlled.
- The analysis aims to determine whether a person's own IQ or their parents' social standing is the more powerful predictor of their economic future.
Rank hath its privileges, and in the United States one of those privileges is to confer economic benefits on your children.
130
Cognitive Classes and Social Behavior
Poverty
13 1
cause-in
social science terminology, as a dependent, not an indepen-
dent, ~ariable.~
Intelligence will be evaluated as a factor that bears on
becoming poor. But what, after all, does an intelligence test score mean
for an adolescent who has grown up poor? Wouldn't his test score have
been higher if his luck in home environment had been better? Can IQ
be causing poverty if poverty is causing IQ?
The Stability of IQ over the Life Span
The stability of IQ over time in the general population has heen studied
for decades, and the main findings are not in much dispute among psy-
chometricians. Up to about 4 or 5 years of age, measures of IQ are not of
much use in predicting later 1Q. Indeed, you will get a better prediction of
the child's 1Q at age 15 by knowing his parents' IQ than by any test of the
child given before age 5.' Between ages 5 and 10, the tests rapidly hecome
more predictive of adult IQ.'~'
After about the age of 10, the 1Q score is es-
sentially stable within the constraints of measurement error.'" On the com-
paratively rare occasions when large changes in IQ are observed, there is
usually an obvious explanation. The child had heen hedridden with a long
illness before one of the tests, for example, or there was severe emotional
disturbance at the time of one or both of the tests.
The 1Q score of an individual might have been higher if he had been
raised in more fortunate circumstances. Chapter 17 discusses this issue
in more detail. But for purposes of Part 11, the question is not what might
have been but what is. In discussions of intelligence, people obsess about
nature versus nurture, thinking that it matters fundamentally whether
a person with a low IQ at, say, age 15 came by that IQ through a defi-
cient environment or by bad luck in the genetic draw. But it does not
matter for the kinds of issues we consider in Part 11. The AFQT test
scores for the NLSY sample were obtained when the subjects were 15
to 23 years of age, and their IQ scores were already as deeply rooted a
fact about them as their height.16'
SOCIOECONOMIC BACKGROUND VERSUS COGNITIVE
ABILITY
For a century after poverty became a topic of systematic analysis in the
mid-1800s, it was taken for granted that there were different kinds of
poor people, with "deserving" and "undeserving" being one of the pri-
mary divisions.? Some people were poor because of circumstances be-
yond their control; others were poor as a result of their own behavior.
Such distinctions among types of poverty were still intellectually re-
spectable into the beginning of the Kennedy administration in 1961.
By the end of the 1960s, they were not. Poverty was now seen as a prod-
uct of broad systemic causes, not of individual characteristics. To say
otherwise was to "blame the victim."' Accordingly, the technical lit-
erature about the causes of current poverty deals almost exclusively in
economic and social explanations rather than with individual charac-
teristics. Much of this literature focuses on poverty among blacks and
its roots in racism and does not apply to the topic at hand: poverty
among whites.
It seems easy to make the case that poverty among whites also arises
from social and economic causes. Using the NLSY, we convert infor-
mation about the education, occupations, and income of the parents of
the NLSY youths into an index of socioeconomic status (SES) in which
the highest scores indicate advanced education, affluence, and presti-
gious occupations. The lowest scores indicate poverty, meager educa-
tion, and the most menial jobs. Suppose we then take the SES index
and divide all the NLSY youngsters into five socioeconomic classes on
exactly the same basis that we defined cognitive classes (split into cat-
egories of 5-20-50-20-5
percent of the population). We then ask,
What percentage of people who came from those socioeconomic back-
grounds were below the poverty line in their late 20s and early 30s (i.e.,
in 1989)? We exclude those who were still in school. The answer for
non-Latino whites in the NLSY sample is shown in the following table.
What could be plainer? Hardly any of the lucky 5 percent who had
grown up in the most advantaged circumstances were in poverty (only
White Poverty by Parents' Socioeconomic Class
Parents'
Percentage in Poverty
Socioeconomic Class
Very high
3
High
3
Mid
7
Low
12
Very low
24
Overall average
7
13 2
Cognitive Classes and Social Behavior
Poverty
133
3 percent). Meanwhile, the white children of parents in the lowest so-
cioeconomic class had a poverty rate of 24 percent. Rank hath its priv-
ileges, and in the United States one of those privileges is to confer
economic benefits on your children. The way to avoid poverty in the
United States is to be born into an advantaged home.
Now we switch lenses. Instead of using socioeconomic class, we now
ask, What percentage of the people who are in the different cognitive
classes were below the poverty line in 1989? The answer is in the next
table. There are similarities at the top of the ladder. Those in the top
White Poverty by Cognitive Class
Cognitive Class
Percentage in Poverty
I Very bright
2
I1 Bright
3
111 Normal
6
1V Dull
16
V Very dull
30
Overall average
7
three classes-75
percent of the population-in
either socioeconomic
background or intelligence had similar poverty rates. But then the story
diverges. As cognitive ability fell below average, poverty rose even more
steeply among the cognitively disadvantaged than the socioeconomi-
cally disadvantaged. For the very dull, in the bottom 5 percent in IQ,
30 percent were below the poverty line, fifteen times the rate for the
people in the top cognitive class.
Taken one variable at a time, the data fit both hypotheses: Poverty
is associated with socioeconomic disadvantage and even more strongly
with cognitive disadvantage. Which is really explaining the relation-
ship? And so we introduce a way of assessing the comparative roles of
intelligence and socioeconomic background, which we will be using
several times in the course of the subsequent chapters.
We want to disentangle the comparative roles of cognitive ability and
socioeconomic background in explaining poverty. The dependent vari-
able, poverty, has just two possible values: Yes, the family had an income
below the poverty line in 1989, or no, its income was above the poverty
line. The statistical method is a type of regression analysis specifically
designed to estimate relationships for a yes-no kind of dependent vari-
able.[9' In our first look at this question, we see how much poverty de-
pends on three independent variables: IQ, age, and parental
socioeconomic status (hereafter called "parental SES"). The sample
consists of all whites in the NLSY who were out of school in 1989."~'
We are asking a straightfonvard question:
Given information about intelligence, socioeconomic status, and age,
what is our best estimate of the probability that a family was below the
poverty line in 1989?
for which a computer, using the suitable software, can provide an an-
swer. Then we ask a second question:
Taking the other facwrs into account, how much remaining effect does any
one of the independent variables have on the probability of being in
poverty?
for which the computer can also provide an answer.
When we apply these questions to the NLSY data, the figure below
shows what emerges. First, age in itself is not important in determining
whether someone is in poverty once the other factors of intelligence
and parental family background are taken into account.'"' Statistically,
its impact is negligible.
This leaves us with the two competing explanations that prompted
the analysis in the first place: the socioeconomic background in which
the NLSY youth grew up, and his own 1Q score.
The black line lets you ask, "Imagine a person in the NLSY who
comes from a family of exactly average socioeconomic background and
exactly average age.''*' What are this person's chances of being in
poverty if he is very smart? Very dumb!" To find out his chances if he is
smart, look toward the far right-hand part of the graph. A person with
an IQ 2 SDs above the mean has an I Q of 130, which is higher than 98
percent of the population. Reading across to the vertical axis on the left,
that person has less than a 2 percent chance of being in poverty (always
assuming that his socioeconomic background was average). Now think
about someone who is far below average in cognitive ability, with an 1Q
2 SDs below the mean (an IQ of 70, higher than just 2 percent of the
IQ, SES, and Poverty Risk
- The text compares the influence of cognitive ability (IQ) and parental socioeconomic status (SES) on the likelihood of living in poverty.
- Statistical analysis suggests that cognitive ability is a more significant predictor of poverty than the socioeconomic background of one's parents.
- A person with an average IQ from an extremely deprived background has an 11 percent chance of being in poverty.
- In contrast, a person with a very low IQ (70) from an average socioeconomic background faces a much higher poverty risk of 26 percent.
- While the 'starting line' in American society remains unequal due to SES, the data suggests that intelligence acts as a more powerful buffer against economic hardship.
- The findings imply that high cognitive ability significantly reduces the probability of poverty regardless of initial social standing.
Despite coming from that solid background, his odds of being in poverty are 26 percent, more than twice as great as the odds facing the person from a deprived home but with average intelligence.
13 2
Cognitive Classes and Social Behavior
Poverty
133
3 percent). Meanwhile, the white children of parents in the lowest so-
cioeconomic class had a poverty rate of 24 percent. Rank hath its priv-
ileges, and in the United States one of those privileges is to confer
economic benefits on your children. The way to avoid poverty in the
United States is to be born into an advantaged home.
Now we switch lenses. Instead of using socioeconomic class, we now
ask, What percentage of the people who are in the different cognitive
classes were below the poverty line in 1989? The answer is in the next
table. There are similarities at the top of the ladder. Those in the top
White Poverty by Cognitive Class
Cognitive Class
Percentage in Poverty
I Very bright
2
I1 Bright
3
111 Normal
6
1V Dull
16
V Very dull
30
Overall average
7
three classes-75
percent of the population-in
either socioeconomic
background or intelligence had similar poverty rates. But then the story
diverges. As cognitive ability fell below average, poverty rose even more
steeply among the cognitively disadvantaged than the socioeconomi-
cally disadvantaged. For the very dull, in the bottom 5 percent in IQ,
30 percent were below the poverty line, fifteen times the rate for the
people in the top cognitive class.
Taken one variable at a time, the data fit both hypotheses: Poverty
is associated with socioeconomic disadvantage and even more strongly
with cognitive disadvantage. Which is really explaining the relation-
ship? And so we introduce a way of assessing the comparative roles of
intelligence and socioeconomic background, which we will be using
several times in the course of the subsequent chapters.
We want to disentangle the comparative roles of cognitive ability and
socioeconomic background in explaining poverty. The dependent vari-
able, poverty, has just two possible values: Yes, the family had an income
below the poverty line in 1989, or no, its income was above the poverty
line. The statistical method is a type of regression analysis specifically
designed to estimate relationships for a yes-no kind of dependent vari-
able.[9' In our first look at this question, we see how much poverty de-
pends on three independent variables: IQ, age, and parental
socioeconomic status (hereafter called "parental SES"). The sample
consists of all whites in the NLSY who were out of school in 1989."~'
We are asking a straightfonvard question:
Given information about intelligence, socioeconomic status, and age,
what is our best estimate of the probability that a family was below the
poverty line in 1989?
for which a computer, using the suitable software, can provide an an-
swer. Then we ask a second question:
Taking the other facwrs into account, how much remaining effect does any
one of the independent variables have on the probability of being in
poverty?
for which the computer can also provide an answer.
When we apply these questions to the NLSY data, the figure below
shows what emerges. First, age in itself is not important in determining
whether someone is in poverty once the other factors of intelligence
and parental family background are taken into account.'"' Statistically,
its impact is negligible.
This leaves us with the two competing explanations that prompted
the analysis in the first place: the socioeconomic background in which
the NLSY youth grew up, and his own 1Q score.
The black line lets you ask, "Imagine a person in the NLSY who
comes from a family of exactly average socioeconomic background and
exactly average age.''*' What are this person's chances of being in
poverty if he is very smart? Very dumb!" To find out his chances if he is
smart, look toward the far right-hand part of the graph. A person with
an IQ 2 SDs above the mean has an I Q of 130, which is higher than 98
percent of the population. Reading across to the vertical axis on the left,
that person has less than a 2 percent chance of being in poverty (always
assuming that his socioeconomic background was average). Now think
about someone who is far below average in cognitive ability, with an 1Q
2 SDs below the mean (an IQ of 70, higher than just 2 percent of the
134
Cognitive Classes and Social Behavior
Poverty
13 5
The comparative roles of IQ and parental SES in determining
whether young white adults are below the poverty line
Probability of being in poverty
30% -
As IQ goes from low to high
:\ ,
As parental SES goes
- from low to high
Very low
(-2 SDs)
Note: For computing the plot, age and either SES (for the hlack curve) or 1Q (for the gray
curve) were set at their mean values.
population). Look at the far left-hand part of the graph. Now, our imag-
inary person with an average socioeconomic background has about a 26
percent chance of being in poverty. The gray line lets you ask, "Imag-
ine a person in the NLSY who is exactly average in IQ and age. What
are this person's chances of being in poverty if he came from an ex-
tremely advantaged socioeconomic background? An extremely de-
I
Refresher
112 standard deviation below and above the mean cuts off the 31st and
69th percentiles. A 112 SD difference is substantial.
1 standard deviation below and above the mean cuts off the 16th and
84th percentiles. A 1 SD difference is big.
2 standard deviations below and above the mean cuts off the 2d and
98th percentiles. A 2 SD difference is very big.
A "standard score" means one that is expressed in terms of standard de-
viations.
prived socioeconomic background!" As the gray line indicates, the proh-
ability of being in poverty rises if he was raised by parents who were low
in socioeconomic status , but only gradually.
In general, the visual appearance of the graph lets you see quickly the
result that emerges from a close analysis: Cognitive ability is more im-
portant than parental SES in determining poverty."3'
This does not mean that socioeconomic background is irrelevant.
The magnitude of the effect shown in the graph and its statistical reg-
ularity makes socioeconomic status significant in a statistical sense. To
put it into policy terms, the starting line remains unequal in American
society, even among whites. On the other hand, the magnitude of the
disadvantage is not as large as one might expect. For example, imagine
a wh~te person born in 1961 who came from an unusually deprived so-
cioeconomic background: parents who worked at the most menial of
jobs, often unemployed, neither of whom had a high school education
(a description of what it means to have a socioeconomic status index
score in the 2d centile on soc~oeconomic class). If that person ha. an I Q
of 100-nothing
special, just the national average-the
chance of
falling below a poverty-level income in 1989 was 11 percent. It is not
zero, and it is not as small as the risk of poverty for someone from a less
punishing environment, but in many ways this is an astonishing state-
ment of progress. Conversely, suppose that the person comes from the
2d centile in IQ but his parents were average in socioeconomic status-
which means that his parents worked at skilled jobs, had at least fin-
ished high school, and had an average income. Despite coming from
that solid background, his odds of being in poverty are 26 percent, more
than twice as great as the odds facing the person from a deprived home
but w~th average intelligence.
In sum: Low intelligence means a comparatively high risk of poverty.
If a white child of the next generation could be given a choice between
being disadvantaged in socioeconomic status or disadvantaged in intel-
ligence, there is no question about the right choice.
Education
Now let us consider whether education really explains what is going on.
One familiar hypothesis is that if you can only get people to stick with
school long enough, they will be able to stay out of poverty even if they
have modest test scores.
As in subsequent chapters, we will consider two educational groups:
Intelligence, Education, and Poverty
- The text compares the influence of socioeconomic status (SES) versus cognitive ability (IQ) on the likelihood of living in poverty.
- For college graduates, the risk of poverty is consistently low regardless of IQ or background, suggesting a degree provides a high economic floor.
- Among high school graduates, IQ is a much stronger predictor of poverty than parental socioeconomic background.
- A high school graduate in the bottom 2 percent of IQ has a 24 percent chance of being in poverty, compared to less than 2 percent for those at the top.
- The author argues that cognitive ability has a major effect on economic outcomes even when educational attainment is identical.
- The discussion transitions to the 'scandalous' rise of child poverty in America, questioning common political explanations for the trend.
College has economic value independent of cognitive ability, whether as a credential, for the skills that are acquired, or as an indicator of personal qualities besides IQ.
134
Cognitive Classes and Social Behavior
Poverty
13 5
The comparative roles of IQ and parental SES in determining
whether young white adults are below the poverty line
Probability of being in poverty
30% -
As IQ goes from low to high
:\ ,
As parental SES goes
- from low to high
Very low
(-2 SDs)
Note: For computing the plot, age and either SES (for the hlack curve) or 1Q (for the gray
curve) were set at their mean values.
population). Look at the far left-hand part of the graph. Now, our imag-
inary person with an average socioeconomic background has about a 26
percent chance of being in poverty. The gray line lets you ask, "Imag-
ine a person in the NLSY who is exactly average in IQ and age. What
are this person's chances of being in poverty if he came from an ex-
tremely advantaged socioeconomic background? An extremely de-
I
Refresher
112 standard deviation below and above the mean cuts off the 31st and
69th percentiles. A 112 SD difference is substantial.
1 standard deviation below and above the mean cuts off the 16th and
84th percentiles. A 1 SD difference is big.
2 standard deviations below and above the mean cuts off the 2d and
98th percentiles. A 2 SD difference is very big.
A "standard score" means one that is expressed in terms of standard de-
viations.
prived socioeconomic background!" As the gray line indicates, the proh-
ability of being in poverty rises if he was raised by parents who were low
in socioeconomic status , but only gradually.
In general, the visual appearance of the graph lets you see quickly the
result that emerges from a close analysis: Cognitive ability is more im-
portant than parental SES in determining poverty."3'
This does not mean that socioeconomic background is irrelevant.
The magnitude of the effect shown in the graph and its statistical reg-
ularity makes socioeconomic status significant in a statistical sense. To
put it into policy terms, the starting line remains unequal in American
society, even among whites. On the other hand, the magnitude of the
disadvantage is not as large as one might expect. For example, imagine
a wh~te person born in 1961 who came from an unusually deprived so-
cioeconomic background: parents who worked at the most menial of
jobs, often unemployed, neither of whom had a high school education
(a description of what it means to have a socioeconomic status index
score in the 2d centile on soc~oeconomic class). If that person ha. an I Q
of 100-nothing
special, just the national average-the
chance of
falling below a poverty-level income in 1989 was 11 percent. It is not
zero, and it is not as small as the risk of poverty for someone from a less
punishing environment, but in many ways this is an astonishing state-
ment of progress. Conversely, suppose that the person comes from the
2d centile in IQ but his parents were average in socioeconomic status-
which means that his parents worked at skilled jobs, had at least fin-
ished high school, and had an average income. Despite coming from
that solid background, his odds of being in poverty are 26 percent, more
than twice as great as the odds facing the person from a deprived home
but w~th average intelligence.
In sum: Low intelligence means a comparatively high risk of poverty.
If a white child of the next generation could be given a choice between
being disadvantaged in socioeconomic status or disadvantaged in intel-
ligence, there is no question about the right choice.
Education
Now let us consider whether education really explains what is going on.
One familiar hypothesis is that if you can only get people to stick with
school long enough, they will be able to stay out of poverty even if they
have modest test scores.
As in subsequent chapters, we will consider two educational groups:
136
Cognitive Classes and Socral Behavior
Poverty
137
In the white high school sample, high IQ makes a difference in
avoiding poverty; in the college sample, hardly anyone was poor
Probability of being in poverty
25% -
20%- \
Black lines: As IQ goes from low to high
Gray lines: As parental SES goes from low to high
15%-
graduates
1111 1
College
0% ,
graduates
I
1
I
1
Very low
(-2 SDS)
Very high
(+2 SDI)
Note: For computing the plot, age and either SES (for the hlack curve) or IQ (for the gray
curve) were set at their mean values.
white people with a high school degree (no more, no less) and those
with a bachelor's degree (no more, no less). The figure above shows the
results when the poverty rates for these two groups are considered sep-
arately.
First, look at the pair of lines for the college graduates. We show them
only for values greater than the mean, to avoid nonsensical implications
(such as showing predicted poverty rate for a college graduate with an
IQ two standard deviations below the mean). The basic lesson of the
graph is that people who can complete a bachelor's degree seldom end
up poor, no matter what. This makes sense. Although income varies im-
portantly for college graduates at different cognitive levels (as we dis-
cussed in Chapters 2 through 4), the floor income is likely to he well
above the poverty line. College has economic value independent of
cognitive ability, whether as a credential, for the skills that are acquired,
or as an indicator of personal qualities besides IQ (diligence, persis-
tence) that make for economic success in life. It is impossible with these
data to disentangle what contributions these different explanations
make.
The two lines showing the results for high school graduates are much
more informative. These people are taking a homogeneous and modest
set of educational skills to the workplace. Within this group, IQ has a
strong effect independent of socioeconomic background. A young adult
at the bottom 2 percent of IQ had about a 24 percent change of being
in poverty compared to less than a 2 percent chance for one at the top
2 percent of IQ (given average age and socioeconomic background, and
just a high school diploma). The parents' background made much less
difference. Cognitive ability still has a major effect on poverty even
within groups with identical education.
COMPLICATING THE ISSUE: POVERTY AMONG CHILDREN
How does the information we have just presented help in trying to un-
derstand the nature of poverty in America? To illustrate, consider one
of the most painful topics in recent American social policy, the grow-
ing proportion of poor who consist of children. As of the 1991 figures,
22 percent of all children under the age of 15 were below the official
poverty line, twice as high as the poverty rate among those age 15 and
over.'14' It is a scandalously high figure in a country as wealthy as the
United States. Presumably every reader wishes for policies that would
reduce poverty among children.
Why are so many children in poverty in a rich country? In political
debate, the question is usually glossed over. A n impression is conveyed
that poverty among children is something that has grown everywhere
in the United States, for all kinds of families, for reasons vaguely con-
nected with economic troubles, ungenerous social policies during the
1980s, and discrimination against women and minority groups.
Specialists who have followed these figures know that this explana-
tion is misleading.15 Poverty among children has always been much
higher in families headed by a single woman, whether she is divorced
or never married. For families headed by a single woman, the poverty
rate in 1991 was 36 percent; for all other American families, 6 percent.'"
Indeed, the national poverty rate for households headed hy a single
woman has been above 30 percent since official poverty figures began
to be available in 1959.17 The equation is brutally simple: The higher
the proportion of children who live in households headed hy single
women, then, ceteris paribus, the higher the proportion of children who
will live in poverty. An important part of the increasing child poverty
IQ, Marriage, and Child Poverty
- Single motherhood is identified as a primary driver of child poverty, with poverty rates for single-mother households consistently exceeding 30 percent since 1959.
- Marriage acts as a powerful economic buffer, significantly reducing the risk of poverty even for women with below-average cognitive ability.
- A mother's IQ is a critical determinant of poverty risk in single-parent households, with the probability of poverty rising steeply as cognitive scores decrease.
- Even women with high IQs (130+) face a 10 percent poverty risk if they are single mothers, which is notably high compared to the general population of married women.
- The economic outcomes for separated, divorced, and never-married mothers are remarkably similar, suggesting that the absence of a husband is the defining factor regardless of the specific cause.
The equation is brutally simple: The higher the proportion of children who live in households headed hy single women, then, ceteris paribus, the higher the proportion of children who will live in poverty.
136
Cognitive Classes and Socral Behavior
Poverty
137
In the white high school sample, high IQ makes a difference in
avoiding poverty; in the college sample, hardly anyone was poor
Probability of being in poverty
25% -
20%- \
Black lines: As IQ goes from low to high
Gray lines: As parental SES goes from low to high
15%-
graduates
1111 1
College
0% ,
graduates
I
1
I
1
Very low
(-2 SDS)
Very high
(+2 SDI)
Note: For computing the plot, age and either SES (for the hlack curve) or IQ (for the gray
curve) were set at their mean values.
white people with a high school degree (no more, no less) and those
with a bachelor's degree (no more, no less). The figure above shows the
results when the poverty rates for these two groups are considered sep-
arately.
First, look at the pair of lines for the college graduates. We show them
only for values greater than the mean, to avoid nonsensical implications
(such as showing predicted poverty rate for a college graduate with an
IQ two standard deviations below the mean). The basic lesson of the
graph is that people who can complete a bachelor's degree seldom end
up poor, no matter what. This makes sense. Although income varies im-
portantly for college graduates at different cognitive levels (as we dis-
cussed in Chapters 2 through 4), the floor income is likely to he well
above the poverty line. College has economic value independent of
cognitive ability, whether as a credential, for the skills that are acquired,
or as an indicator of personal qualities besides IQ (diligence, persis-
tence) that make for economic success in life. It is impossible with these
data to disentangle what contributions these different explanations
make.
The two lines showing the results for high school graduates are much
more informative. These people are taking a homogeneous and modest
set of educational skills to the workplace. Within this group, IQ has a
strong effect independent of socioeconomic background. A young adult
at the bottom 2 percent of IQ had about a 24 percent change of being
in poverty compared to less than a 2 percent chance for one at the top
2 percent of IQ (given average age and socioeconomic background, and
just a high school diploma). The parents' background made much less
difference. Cognitive ability still has a major effect on poverty even
within groups with identical education.
COMPLICATING THE ISSUE: POVERTY AMONG CHILDREN
How does the information we have just presented help in trying to un-
derstand the nature of poverty in America? To illustrate, consider one
of the most painful topics in recent American social policy, the grow-
ing proportion of poor who consist of children. As of the 1991 figures,
22 percent of all children under the age of 15 were below the official
poverty line, twice as high as the poverty rate among those age 15 and
over.'14' It is a scandalously high figure in a country as wealthy as the
United States. Presumably every reader wishes for policies that would
reduce poverty among children.
Why are so many children in poverty in a rich country? In political
debate, the question is usually glossed over. A n impression is conveyed
that poverty among children is something that has grown everywhere
in the United States, for all kinds of families, for reasons vaguely con-
nected with economic troubles, ungenerous social policies during the
1980s, and discrimination against women and minority groups.
Specialists who have followed these figures know that this explana-
tion is misleading.15 Poverty among children has always been much
higher in families headed by a single woman, whether she is divorced
or never married. For families headed by a single woman, the poverty
rate in 1991 was 36 percent; for all other American families, 6 percent.'"
Indeed, the national poverty rate for households headed hy a single
woman has been above 30 percent since official poverty figures began
to be available in 1959.17 The equation is brutally simple: The higher
the proportion of children who live in households headed hy single
women, then, ceteris paribus, the higher the proportion of children who
will live in poverty. An important part of the increasing child poverty
138
Cognitive Classes and Social Behavior
Poverty ' 139
in the United States is owed to the increasing proportion of children
who live in those families.'"he
political left and right differ in their
views of what policies to follow in response to this state of affairs, but
recently they have broadly agreed on the joint roles of gender and
changes in family structure in pushing up the figures for child poverty.
Poverty Among ChiIdren: The Role of the Mother's IQ
What does IQ add to this picture? It allows us to focus sharply on who
is poor and why, and to dispense with a number of mistaken ideas. To
see how, let us consider women, and specifically women with chil-
dret~."~'
Here is the graph that results when we ask how often mothers
with differing IQs and differing family structures suffer from poverty. (In
the figure, the effects of the mothers' socioeconomic background are
held constant, as are the number of children, which is factored into the
calculation of the poverty line.)
The first, glaring point of the figure is that marriage is a powerful
poverty preventative, and this is true for women even of modest cogni-
The role of the mother's IQ in determining
which white children are poor
Probability of being in poverty as IQ goes from low to high
\ White mothers who are separated,
50% -
divorced, or never married
4070 -
308 -
Very low
(-2 SDs)
very high
IQ
(+Z SDs)
Notes: For computing the plot, aae and SES were set at their mean values.
tive ability. A married white woman with children who is markedly be-
low average in cognitive ability-at
the 16th centile, say, one standard
deviation below the mean-from
an average socioeconomic back-
ground had only a 10 percent probability of poverty.
The second point of the graph is that t o be without a husband in the
house is to run a high risk of poverty, even if the woman was raised
in an average socioeconomic background. Such a woman, with even
an average IQ, ran a 33 percent chance of being in poverty. If she
was unlucky enough to have an IQ of only 85, she had more than a
50 percent chance-five
times as high as the risk faced by a married
woman of identical IQ and socioeconomic background. Even a woman
with a conspicuously high IQ of 130 (two standard deviations above
the mean) was predicted to have a poverty rate of 10 percent if she
was a single mother, which is quite high compared to white women
in general. Perhaps surprisingly, it did not make much difference which
of the three kinds of "nonmarriagev-separation,
divorce, or no mar-
riage at all-was
involved. The results for all three groups of women
were drastically different from the results for married women, and
quite similar to each other (which is why they are grouped in the figure.)
The third obvious conclusion is that IQ is extremely important in de-
termining poverty among women without a husband present. A poverty
rate of 10 percent for women with IQs of 130 may be high compared to
some standards, but it is tiny compared to the steeply rising probahili-
ties of poverty that characterize women with below average cognitive
ability.
Poverty Among Children: The Role of the Mother's Socioeconomic
Background
Now we pursue the same issue but in terms of socioeconomic back-
ground. Remember that the steep downward curve in the figure above
for unmarried mothers is the effect of IQ after holding the effects of so-
cioeconomic status constant. What is the role of socioeconomic back-
ground after we take IQ into account? Not much, as the next figure
shows.
We used the same scale on the vertical axis in both of the preceding
graphs to make the comparison with 1Q easier. The conclusion is that
no matter how rich and well educated the parents of the mother might
have been, a separated, divorced, or never-married white woman with
children and an average IQ was still looking at nearly a 30 percent
IQ vs Socioeconomic Background
- The text argues that a mother's IQ is a more significant predictor of poverty than her socioeconomic background.
- For unmarried white mothers, even high parental socioeconomic status does not significantly lower the risk of poverty if IQ is average.
- Statistical analysis suggests that the downward slope of poverty risk relative to parental SES lacks statistical significance once IQ is controlled.
- The authors contend that social problems like child poverty cannot be fully understood without accounting for cognitive ability.
- While factors like family breakup are important, they disproportionately affect those at lower levels of intelligence.
- The authors acknowledge that while social science often demands complexity, the primary relationship between IQ and poverty remains a central, simplified truth.
The conclusion is that no matter how rich and well educated the parents of the mother might have been, a separated, divorced, or never-married white woman with children and an average IQ was still looking at nearly a 30 percent chance of being below the poverty line.
138
Cognitive Classes and Social Behavior
Poverty ' 139
in the United States is owed to the increasing proportion of children
who live in those families.'"he
political left and right differ in their
views of what policies to follow in response to this state of affairs, but
recently they have broadly agreed on the joint roles of gender and
changes in family structure in pushing up the figures for child poverty.
Poverty Among ChiIdren: The Role of the Mother's IQ
What does IQ add to this picture? It allows us to focus sharply on who
is poor and why, and to dispense with a number of mistaken ideas. To
see how, let us consider women, and specifically women with chil-
dret~."~'
Here is the graph that results when we ask how often mothers
with differing IQs and differing family structures suffer from poverty. (In
the figure, the effects of the mothers' socioeconomic background are
held constant, as are the number of children, which is factored into the
calculation of the poverty line.)
The first, glaring point of the figure is that marriage is a powerful
poverty preventative, and this is true for women even of modest cogni-
The role of the mother's IQ in determining
which white children are poor
Probability of being in poverty as IQ goes from low to high
\ White mothers who are separated,
50% -
divorced, or never married
4070 -
308 -
Very low
(-2 SDs)
very high
IQ
(+Z SDs)
Notes: For computing the plot, aae and SES were set at their mean values.
tive ability. A married white woman with children who is markedly be-
low average in cognitive ability-at
the 16th centile, say, one standard
deviation below the mean-from
an average socioeconomic back-
ground had only a 10 percent probability of poverty.
The second point of the graph is that t o be without a husband in the
house is to run a high risk of poverty, even if the woman was raised
in an average socioeconomic background. Such a woman, with even
an average IQ, ran a 33 percent chance of being in poverty. If she
was unlucky enough to have an IQ of only 85, she had more than a
50 percent chance-five
times as high as the risk faced by a married
woman of identical IQ and socioeconomic background. Even a woman
with a conspicuously high IQ of 130 (two standard deviations above
the mean) was predicted to have a poverty rate of 10 percent if she
was a single mother, which is quite high compared to white women
in general. Perhaps surprisingly, it did not make much difference which
of the three kinds of "nonmarriagev-separation,
divorce, or no mar-
riage at all-was
involved. The results for all three groups of women
were drastically different from the results for married women, and
quite similar to each other (which is why they are grouped in the figure.)
The third obvious conclusion is that IQ is extremely important in de-
termining poverty among women without a husband present. A poverty
rate of 10 percent for women with IQs of 130 may be high compared to
some standards, but it is tiny compared to the steeply rising probahili-
ties of poverty that characterize women with below average cognitive
ability.
Poverty Among Children: The Role of the Mother's Socioeconomic
Background
Now we pursue the same issue but in terms of socioeconomic back-
ground. Remember that the steep downward curve in the figure above
for unmarried mothers is the effect of IQ after holding the effects of so-
cioeconomic status constant. What is the role of socioeconomic back-
ground after we take IQ into account? Not much, as the next figure
shows.
We used the same scale on the vertical axis in both of the preceding
graphs to make the comparison with 1Q easier. The conclusion is that
no matter how rich and well educated the parents of the mother might
have been, a separated, divorced, or never-married white woman with
children and an average IQ was still looking at nearly a 30 percent
140
Cognitive Chses and Social Behavior
Poverty
141
The role of the mother's socioeconomic background in
determining which white children are poor
Probability of being in poverty as
parental SES goes from low to high
70% -
50% -
White mother.7 who are separated,
divorced, or never married
20% -
Married white mothers
Very low
Very high
(-2 SDs)
Parental SES
(+2 SDg)
Note: For computing the plot, age and 1Q were set at their mean valtres.
chance of being below the poverty line, far ahove the usual level for
whites and far ahove the level facing a woman of average socioeconomic
background but superior IQ. We cannot even be sure that higher so-
cioeconomic background reduces the poverty rate at all for unmarried
women after the contribution of 1Q has been extracted; the downward
slope of the line plotted in the graph does not approach statistical sig-
nifi~ance."~'
There are few clearer arguments for bringing cognitive ability into
the analysis of social problems. Consider the hundreds of articles writ-
ten about poverty among children and about the effects of single-par-
ent families on poverty. Of course, these are important factors: Children
are more often poor than adults. Family breakup is responsible for a ma-
jor portion of the increase in child poverty. But if analysts are trying to
understand the high rates of poverty among children, it must be done
against the background that whatever other factors increase the risk of
poverty among unmarried mothers, they hit unmarried mothers at low
levels of intelligence much harder than they do those at high levels of
intelligence--even after socioeconomic background is held constant.
HOLDING BOTH COMPLICATIONS AND POLICY THOUGHTS
AT BAY
You have been following a common process in social science. An ini-
tially simple issue becomes successively more complicated. And we have
barely gotten started-an
analysis in a technical journal seldom has as
few independent variables as the ones we have examined. For that mat-
ter, even this simplified analysis represents only the end result of a long
process. In the attached note, we describe how big the rest of the ice-
berg is.lUl
Complex analysis has both merits and faults. The merit is that the
complications are part of reality. Einstein's injunction that solutions
should be as simple as possible, but no simpler, still applies. At the same
time, social science often seems more in need of the inverse injunction,
to introduce as much complexity as necessary, but no more. Complica-
tions can make us forget what we were trying to understand in the first
place. Here is where we believe the situation stands:
By complicating the picture, we raise additional questions: Education
is important in affecting poverty; the appropriate next step is to explore
how intelligence and socioeconomic status are related to years of edu-
cation. Marriage is important in determining poverty; we should explore
how ~ntelligence and socioeconomic status are related to marriage.
These things we shall do in subsequent chapters.
But the simple picture, with only IQ, parental SES, and age in the
equation, restricted to our all-white sample, continues to tell a story of
its own. A major theme in the public dialogue in the United States has
been that socioeconomic disadvantage is the primary driving force be-
hind poverty. The simple picture shows that it just isn't so for
The high rates of poverty that afflict certain segments of the white pop-
ulation are determined more by intelligence than by socioeconomic
background. The force and relevance of this statement does not seem
to us diminished by the complications it does not embrace.
Indeed, now that we are returning to basics, let us remember some-
thing else that could be overlooked in the welter of regression analyses.
The poverty rate for whites in Class V was 30 percent-a
percentage
usually associated with poverty in poor urban neighborhoods. Ethnically
Intelligence and Social Outcomes
- The authors argue that intelligence is a more significant predictor of poverty among white Americans than socioeconomic background.
- Low intelligence is framed as a disability that is largely fixed by the time an individual reaches adulthood, creating a sense of inherent unfairness.
- The text suggests that traditional socioeconomic analyses are inadequate for understanding the root causes of modern American poverty.
- Solving income inequality alone may not address the broader social 'discontents' arising from cognitive stratification.
- High school dropout rates are shown to be almost non-existent among those with high IQs, regardless of their family's financial status.
- Socioeconomic disadvantage primarily impacts school completion for those who are already in the lower half of the intelligence distribution.
Ethnically and culturally, these are supposed to be the advantaged Americans: whites of European descent. But they have one big thing working against them: they are not very smart.
140
Cognitive Chses and Social Behavior
Poverty
141
The role of the mother's socioeconomic background in
determining which white children are poor
Probability of being in poverty as
parental SES goes from low to high
70% -
50% -
White mother.7 who are separated,
divorced, or never married
20% -
Married white mothers
Very low
Very high
(-2 SDs)
Parental SES
(+2 SDg)
Note: For computing the plot, age and 1Q were set at their mean valtres.
chance of being below the poverty line, far ahove the usual level for
whites and far ahove the level facing a woman of average socioeconomic
background but superior IQ. We cannot even be sure that higher so-
cioeconomic background reduces the poverty rate at all for unmarried
women after the contribution of 1Q has been extracted; the downward
slope of the line plotted in the graph does not approach statistical sig-
nifi~ance."~'
There are few clearer arguments for bringing cognitive ability into
the analysis of social problems. Consider the hundreds of articles writ-
ten about poverty among children and about the effects of single-par-
ent families on poverty. Of course, these are important factors: Children
are more often poor than adults. Family breakup is responsible for a ma-
jor portion of the increase in child poverty. But if analysts are trying to
understand the high rates of poverty among children, it must be done
against the background that whatever other factors increase the risk of
poverty among unmarried mothers, they hit unmarried mothers at low
levels of intelligence much harder than they do those at high levels of
intelligence--even after socioeconomic background is held constant.
HOLDING BOTH COMPLICATIONS AND POLICY THOUGHTS
AT BAY
You have been following a common process in social science. An ini-
tially simple issue becomes successively more complicated. And we have
barely gotten started-an
analysis in a technical journal seldom has as
few independent variables as the ones we have examined. For that mat-
ter, even this simplified analysis represents only the end result of a long
process. In the attached note, we describe how big the rest of the ice-
berg is.lUl
Complex analysis has both merits and faults. The merit is that the
complications are part of reality. Einstein's injunction that solutions
should be as simple as possible, but no simpler, still applies. At the same
time, social science often seems more in need of the inverse injunction,
to introduce as much complexity as necessary, but no more. Complica-
tions can make us forget what we were trying to understand in the first
place. Here is where we believe the situation stands:
By complicating the picture, we raise additional questions: Education
is important in affecting poverty; the appropriate next step is to explore
how intelligence and socioeconomic status are related to years of edu-
cation. Marriage is important in determining poverty; we should explore
how ~ntelligence and socioeconomic status are related to marriage.
These things we shall do in subsequent chapters.
But the simple picture, with only IQ, parental SES, and age in the
equation, restricted to our all-white sample, continues to tell a story of
its own. A major theme in the public dialogue in the United States has
been that socioeconomic disadvantage is the primary driving force be-
hind poverty. The simple picture shows that it just isn't so for
The high rates of poverty that afflict certain segments of the white pop-
ulation are determined more by intelligence than by socioeconomic
background. The force and relevance of this statement does not seem
to us diminished by the complications it does not embrace.
Indeed, now that we are returning to basics, let us remember some-
thing else that could be overlooked in the welter of regression analyses.
The poverty rate for whites in Class V was 30 percent-a
percentage
usually associated with poverty in poor urban neighborhoods. Ethnically
142
Cognitive Classes and Social Behavior
and culturally, these are supposed to be the advantaged Americans:
whites of European descent. But they have one big thing working against
them: they are not very smart.
Like many other disabilities, low intelligence is not the fault of the
individual. Everything we know about the causes of cognitive ability,
genetic and environmental, tells us that by the time people grow to an
age at which they can be considered responsible moral agents, their IQ
is fairly well set. Many readers will find that, before writing another
word, we have already made the case for sweeping policy changes meant
to rectift what can only be interpreted as a palpably unfair result.
And yet between this and the chapters that will explore those policy
issues stretch a few hundred pages of intervening analysis. There is a rea-
son for them. By adding poverty to the portrait of cognitive stratifica-
tion described in Part I, we hope to have set the terms of a larger problem
than income inequality. The issue is not simply how people who are pcnx
through no fault of their own can be made not poor but how we-all
of
us, of all abilities and income levels-can live together in a society in
which all of us can pursue happiness. Changing policy in ways that af-
fect poverty rates may well be part of that solution. But as we observed
at the outset of the chapter, poverty itself has been declining as various
cl~scontents have been rising during this century, and curing poverty is
not necessarily going to do much to cure the other pains that afflict
American society. This chapter's analysis should establish that the tra-
ditional socioeconomic analysis of the origins of poverty is inadequate
and that intelligence plays a crucial role. We are just at the beginning
d
understanding how intelligence interacts with the other problems in
America's crisis.
Chapter 6
Schooling
Leaving school before getting a high school diploma in the old days was wu-
ally not a sign of failure. The youngster had not dropped out but simply moved
on. As late
1940, fewer than half of 1 8-year-old? got a high school diploma.
But in the postwar era, the high school diploma became the norm. Now, not
having one is a social disability of some gravity.
The usual picture of high school dropouts focuses on their socioeconomic
circumstances. It is true that most of them are fiom poor families, but the re-
lationship of socioeconomics to school dropout is not simple. Among whites,
almost no one with an IQ in the top quarter of the disnihution faib to get a
high school education, no matter how poor their families. Dropout is extremely
rare throrlghout the upper half of the IQ distribution. Socioeconomic back-
ground has its most powerful effect at the lowest end of the social specnum,
among students who are already below average in intelligence. Being poor has
a small effect on dropping out of school idpendent of la; it has a sizable in-
dependent effect on whether a person finishes school with a regular diploma
or a high school equivalency certificate.
To raise the chances of getting a college dq-ee, it helps to be in the upper
half of the distribution for either IQ or socioeconomic status. But the advan-
tage of a high lQ outweighs that of high status. Similarly, the disadvantage of
a low ZQ outweighs that of low status. Youngsters fiompoor backgrounds with
high IQs are likely to get through college these days, but those with low lQs,
even if they come from well-to-do backgrounds, are not.
all the social behaviors that might be linked to cognitive ability,
school dropout prior to high school graduation is the most ohvi-
Of
ous. Low intelligence is one of the best predictors of school failure, and
students who fail a grade or two are likely to have the least attachment
to school. And yet this relationship, as strong as it is now, is also new.
The Evolution of School Failure
- High IQ is a stronger predictor of college completion than high socioeconomic status, while low IQ is a greater barrier than poverty.
- The concepts of 'school failure' and 'dropping out' are modern inventions that did not exist in the era of one-room schoolhouses.
- High school graduation was rare in 1900, with only 6 percent of 17-year-olds receiving a diploma.
- The graduation ratio did not surpass the 50 percent mark until the beginning of World War II.
- Historical perspectives often opposed universal education, with some early 20th-century thinkers arguing that many students were being educated beyond their abilities.
- Despite fears of educating the 'ineducable,' psychometric evidence from the mid-century found little support for the idea that students were over-extended.
The very concept of school failure is a modern invention.
142
Cognitive Classes and Social Behavior
and culturally, these are supposed to be the advantaged Americans:
whites of European descent. But they have one big thing working against
them: they are not very smart.
Like many other disabilities, low intelligence is not the fault of the
individual. Everything we know about the causes of cognitive ability,
genetic and environmental, tells us that by the time people grow to an
age at which they can be considered responsible moral agents, their IQ
is fairly well set. Many readers will find that, before writing another
word, we have already made the case for sweeping policy changes meant
to rectift what can only be interpreted as a palpably unfair result.
And yet between this and the chapters that will explore those policy
issues stretch a few hundred pages of intervening analysis. There is a rea-
son for them. By adding poverty to the portrait of cognitive stratifica-
tion described in Part I, we hope to have set the terms of a larger problem
than income inequality. The issue is not simply how people who are pcnx
through no fault of their own can be made not poor but how we-all
of
us, of all abilities and income levels-can live together in a society in
which all of us can pursue happiness. Changing policy in ways that af-
fect poverty rates may well be part of that solution. But as we observed
at the outset of the chapter, poverty itself has been declining as various
cl~scontents have been rising during this century, and curing poverty is
not necessarily going to do much to cure the other pains that afflict
American society. This chapter's analysis should establish that the tra-
ditional socioeconomic analysis of the origins of poverty is inadequate
and that intelligence plays a crucial role. We are just at the beginning
d
understanding how intelligence interacts with the other problems in
America's crisis.
Chapter 6
Schooling
Leaving school before getting a high school diploma in the old days was wu-
ally not a sign of failure. The youngster had not dropped out but simply moved
on. As late
1940, fewer than half of 1 8-year-old? got a high school diploma.
But in the postwar era, the high school diploma became the norm. Now, not
having one is a social disability of some gravity.
The usual picture of high school dropouts focuses on their socioeconomic
circumstances. It is true that most of them are fiom poor families, but the re-
lationship of socioeconomics to school dropout is not simple. Among whites,
almost no one with an IQ in the top quarter of the disnihution faib to get a
high school education, no matter how poor their families. Dropout is extremely
rare throrlghout the upper half of the IQ distribution. Socioeconomic back-
ground has its most powerful effect at the lowest end of the social specnum,
among students who are already below average in intelligence. Being poor has
a small effect on dropping out of school idpendent of la; it has a sizable in-
dependent effect on whether a person finishes school with a regular diploma
or a high school equivalency certificate.
To raise the chances of getting a college dq-ee, it helps to be in the upper
half of the distribution for either IQ or socioeconomic status. But the advan-
tage of a high lQ outweighs that of high status. Similarly, the disadvantage of
a low ZQ outweighs that of low status. Youngsters fiompoor backgrounds with
high IQs are likely to get through college these days, but those with low lQs,
even if they come from well-to-do backgrounds, are not.
all the social behaviors that might be linked to cognitive ability,
school dropout prior to high school graduation is the most ohvi-
Of
ous. Low intelligence is one of the best predictors of school failure, and
students who fail a grade or two are likely to have the least attachment
to school. And yet this relationship, as strong as it is now, is also new.
144
Cognitive Classes and Social Behavior
Schooling
1 45
The very concept of school failure is a modern invention. In the era of
the one-room schoolhouse, students advanced at their own pace. There
were no formal grade levels, no promotions to the next grade, hence no
way to fail.'
"Dropping out" is an even more recent concept, created by the as-
sumption that it is normal to remain in school through age 17. Until re-
cently, it wasn't typical. In 1900, the high school diploma was the
preserve of a tiny minority of American youth: The number of those
who got one amounted to only 6 percent of the crop of potential seniors
that year. This figure, known as the graduation ratio, is calculated as the
percentage of the 17- ear-old population.2 Perhaps even more startling,
it was not until the beginning of World War I1 that the graduation ra-
tio first passed the 50 percent mark. The figure shows the story from
1900 to 1990."'
The trendlines that overlie the data indicate two broad phases in this
ninety-year history. The first phase, from 1908 until the early 1920s, fea-
tured moderate expansion of high school education. It did not appear
moderate at the time-the
graduation rate more than doubled from
1900 to 1922-but
the growth was nonetheless moderate by compari-
son with steep surge from 1922 until the beginning of World War 11.
In the first half of the century, the
high school diploma becomes the norm
Graduation ratio
... 192264
80% -
70% -
60% -
Trendlines established in ...
50% -
40% -
30% -
20% -
10%-
Source: DES 1992, Tahle 95; U.S. Bureau of the Census, 1975, Table H598-601
This was the opening of the second growth phase, which lasted, with
an interruption for World War 11, until 1964. The story since 1964 has
been mixed. Graduation rates stalled during the last half of the 1960s
and then reversed during the 1970s. The trend since 1980 has been un-
certainly and shallowly upward. As of 1992, the graduation ratio for 17-
year-olds stood at 76 percent, near the 1969 high of 77 percent. The
proportion of people who eventually graduate or get a high school equiv-
alency certificate now stands at about 86 percent for the population as
a whole.14'
Americans today take it for granted that the goal is to graduate every-
one and that a high school dropout rate is a social evil. But earlier
thinkers, even those in our liberal tradition, were dubious about edu-
cating the entire population beyond the rudiments of literacy. Voltaire's
view that "the lower classes should be guided, not educated," was typi-
cal until this ~entury.~
Even early in this century, many observers feared
that unqualified youngsters were being educated beyond their abilities.
''We must turn back the clock," one prominent educator wrote in 1936,
"to take some five million boys and girls from the educational dole.""
And yet when the psychometricians sought to document the fear that
the country was trying to educate the ineducable, they found little ev-
idence for it. One investigator, Frank Finch, assembled all of the com-
petent studies of the intelligence of high school students conducted
from 1916 (the earliest study he could find) to 1942. The mean IQ of
ninth graders in these studies was 105; the mean IQ of the twelfth
graders or graduates was 107, trivially different.'" The data suggest that
the large number of youngsters who dropped out between ninth grade
and high school graduation averaged less than 105 in IQ, but not by
much (a calculation explained in the note).lR'
Finch found no increasing trend over time in the 1Q gap between
dropouts and graduates during the early part of the century. Replicating
the story that we described regarding the college level in Chapter 1, the
first decades of the century saw American high school education mush-
room in size without having to dip much deeper into the intellectual
pool. This process could not go on forever. As the high school diploma
became the norm, the dropouts were likely to become more self-selected
for low IQ, and so indeed it transpired.
We have not been able to determine exactly when the gap between
nongraduates and graduates began to open up. Probably it was widen-
ing even by the early 1940s. By the early 1950s, a study in Iowa found
The Widening IQ Gap
- Early 20th-century data showed a trivial IQ difference between high school graduates and dropouts as the education system expanded.
- As high school diplomas became the societal norm, dropouts became increasingly self-selected for lower cognitive ability.
- By 1960, the IQ gap between graduates and dropouts had widened to approximately sixteen points, or one standard deviation.
- Current NLSY data indicates that cognitive class is a stark predictor of educational attainment among white students.
- While 39 percent of whites in the bottom IQ quartile fail to graduate, over 60 percent of that same group still manage to obtain a diploma.
As the high school diploma became the norm, the dropouts were likely to become more self-selected for low IQ, and so indeed it transpired.
144
Cognitive Classes and Social Behavior
Schooling
1 45
The very concept of school failure is a modern invention. In the era of
the one-room schoolhouse, students advanced at their own pace. There
were no formal grade levels, no promotions to the next grade, hence no
way to fail.'
"Dropping out" is an even more recent concept, created by the as-
sumption that it is normal to remain in school through age 17. Until re-
cently, it wasn't typical. In 1900, the high school diploma was the
preserve of a tiny minority of American youth: The number of those
who got one amounted to only 6 percent of the crop of potential seniors
that year. This figure, known as the graduation ratio, is calculated as the
percentage of the 17- ear-old population.2 Perhaps even more startling,
it was not until the beginning of World War I1 that the graduation ra-
tio first passed the 50 percent mark. The figure shows the story from
1900 to 1990."'
The trendlines that overlie the data indicate two broad phases in this
ninety-year history. The first phase, from 1908 until the early 1920s, fea-
tured moderate expansion of high school education. It did not appear
moderate at the time-the
graduation rate more than doubled from
1900 to 1922-but
the growth was nonetheless moderate by compari-
son with steep surge from 1922 until the beginning of World War 11.
In the first half of the century, the
high school diploma becomes the norm
Graduation ratio
... 192264
80% -
70% -
60% -
Trendlines established in ...
50% -
40% -
30% -
20% -
10%-
Source: DES 1992, Tahle 95; U.S. Bureau of the Census, 1975, Table H598-601
This was the opening of the second growth phase, which lasted, with
an interruption for World War 11, until 1964. The story since 1964 has
been mixed. Graduation rates stalled during the last half of the 1960s
and then reversed during the 1970s. The trend since 1980 has been un-
certainly and shallowly upward. As of 1992, the graduation ratio for 17-
year-olds stood at 76 percent, near the 1969 high of 77 percent. The
proportion of people who eventually graduate or get a high school equiv-
alency certificate now stands at about 86 percent for the population as
a whole.14'
Americans today take it for granted that the goal is to graduate every-
one and that a high school dropout rate is a social evil. But earlier
thinkers, even those in our liberal tradition, were dubious about edu-
cating the entire population beyond the rudiments of literacy. Voltaire's
view that "the lower classes should be guided, not educated," was typi-
cal until this ~entury.~
Even early in this century, many observers feared
that unqualified youngsters were being educated beyond their abilities.
''We must turn back the clock," one prominent educator wrote in 1936,
"to take some five million boys and girls from the educational dole.""
And yet when the psychometricians sought to document the fear that
the country was trying to educate the ineducable, they found little ev-
idence for it. One investigator, Frank Finch, assembled all of the com-
petent studies of the intelligence of high school students conducted
from 1916 (the earliest study he could find) to 1942. The mean IQ of
ninth graders in these studies was 105; the mean IQ of the twelfth
graders or graduates was 107, trivially different.'" The data suggest that
the large number of youngsters who dropped out between ninth grade
and high school graduation averaged less than 105 in IQ, but not by
much (a calculation explained in the note).lR'
Finch found no increasing trend over time in the 1Q gap between
dropouts and graduates during the early part of the century. Replicating
the story that we described regarding the college level in Chapter 1, the
first decades of the century saw American high school education mush-
room in size without having to dip much deeper into the intellectual
pool. This process could not go on forever. As the high school diploma
became the norm, the dropouts were likely to become more self-selected
for low IQ, and so indeed it transpired.
We have not been able to determine exactly when the gap between
nongraduates and graduates began to open up. Probably it was widen-
ing even by the early 1940s. By the early 1950s, a study in Iowa found
146
Cognitive Classes and Social Behavior
Schooling
147
a ten-point gap in IQ between dropouts and high school graduates.9n-
other study, in 1949, of 2,600 students who had been given an 1Q test
in the seventh grade, found a gap between the graduates and nongrad-
uates of about thirteen IQ points, close to the IQ's standard deviation
of 15." The proportion of students getting a high school diploma had
reached about 55 percent by then. By the spring of 1960, when 70 per-
cent of students were graduating, the data from Project TALENT-the
large, nationally representative sample of high school students men-
tioned in Chapter 1-indicate
a gap equivalent to almost sixteen IQ
points between the academic aptitude of those who graduated and those
who did not, slightly more than a standard deviation.'"' This is tanta-
mount to saying that the average dropout had an IQ that put him at the
15th centile of those who graduated.
The situation seems to have remained roughly the same since then. By
the standard current definition of the population that "gets a high schcml
educationn-meaning either a diploma or by passing an equivalency ex-
amination-the
NLSY data reveal that the mean score of those who get
a high school education is 1.28 standard deviations higher than those
who do not. Comparing those who get the ordinary high school diploma
with all those who left high school before doing so (including those who
later get an equivalency certificate), the gap is 1.02 standard deviations.
WHITE HIGH SCHOOL DROPOUT IN THE NLSY
Who drops out of high school these days? The following tahle shows
the story for NLSY whites in the various cognitive classes. The results
Failure to Get a High School
Education Among Whites
Percentage Who Did Not
Graduate or Pass a High
Cognitive Class
School Equivalency Exam
I Very bright
0
I1 Bright
0"
111 Normal
6
IV Dull
35
V Very dull
5 5
Overall average
9
" The actual figure was 0.4 percent.
could hardly be starker. Among whites in the top quartile (Classes I and
11 together), virtually everyone got a high school education. In the bot-
tom quartile of the IQ distribution (Classes IV and V together), 39 per-
cent of whites did not."*' This huge discrepancy is also predictable,
however, given the close relationship between IQ and educational at-
tainment-~~ predictable that we should pause for a moment before
viewing dropout rates with alarm. Is a 39 percent dropout rate for stu-
dents in the lowest quartile of IQ "high"? From one perspective, it seems
so, considering how essential education appears to be for making a liv-
ing. From another perspective, it is remarkable that over 60 percent of
white youths with IQs under 90 did get a high school education. It is
particularly remarkable that nearly half of the youths in Class V, with
IQs of 75 and under, completed a high school education, despite being
on the borderline (or beyond) of the clinical definition of retarded.''3'
Whether these figures say something about the ability of low-IQ stu-
dents to learn or about the state of American secondary education is a
topic we defer until Chapter 18.
What Does "A High School Education" Mean?
The standard question now arises: To what extent are we looking at an
effect of cognitive ability, and to what extent are white children from
poor socioeconomic backgrounds being shunted out of the school system
because of their backgrounds? The answer depends on exactly how the
question is asked. Specifically, it is important to be precise about what "a
high school education" means. In the table above, it was defined to in-
clude anyone who graduated from high school in the normal way or who
passed an equivalency examination, known generically as a GED (for
General Educational Development).14 This has become nearly standard
practice when researchers and journalists alike talk about high school
dropout. But recent work by economists Steven Cameron and James
Heckman has demonstrated that GED youths are not equivalent tol'nor-
mal" graduates in terms of their success in the job market.15 In their un-
employment rates, job tenure, and wages, the GEDs look more like
dropouts than they look like high school graduates, raising the possibil-
ity that they differ from other high school graduates in a variety of ways
that makes it dangerous to lump all people with "a high school educa-
tion" into a single group. We know from our own analyses that the white
GEDs in the NLSY had an average IQ half a standard deviation lower
Redefining the High School Dropout
- Nearly half of students with IQs below 75 managed to complete high school, raising questions about educational standards.
- Research by Cameron and Heckman suggests that GED recipients are not economically equivalent to traditional high school graduates.
- GED holders tend to mirror the unemployment rates and job tenures of dropouts rather than those of diploma holders.
- The population of GED graduates grew significantly from 5 percent in 1968 to over 13 percent by 1980.
- Data suggests the 'gifted-but-disadvantaged' dropout is a myth, as almost no high-IQ white students in the NLSY sample failed to graduate.
- The study argues for a strict separation between 'normal' graduates, GED recipients, and permanent dropouts in social analysis.
A closer look at these numbers dispels the stereotype of the high school dropout as the bright but unlucky youngster whose talents are wasted because of economic disadvantage or a school system that cannot hold onto him.
146
Cognitive Classes and Social Behavior
Schooling
147
a ten-point gap in IQ between dropouts and high school graduates.9n-
other study, in 1949, of 2,600 students who had been given an 1Q test
in the seventh grade, found a gap between the graduates and nongrad-
uates of about thirteen IQ points, close to the IQ's standard deviation
of 15." The proportion of students getting a high school diploma had
reached about 55 percent by then. By the spring of 1960, when 70 per-
cent of students were graduating, the data from Project TALENT-the
large, nationally representative sample of high school students men-
tioned in Chapter 1-indicate
a gap equivalent to almost sixteen IQ
points between the academic aptitude of those who graduated and those
who did not, slightly more than a standard deviation.'"' This is tanta-
mount to saying that the average dropout had an IQ that put him at the
15th centile of those who graduated.
The situation seems to have remained roughly the same since then. By
the standard current definition of the population that "gets a high schcml
educationn-meaning either a diploma or by passing an equivalency ex-
amination-the
NLSY data reveal that the mean score of those who get
a high school education is 1.28 standard deviations higher than those
who do not. Comparing those who get the ordinary high school diploma
with all those who left high school before doing so (including those who
later get an equivalency certificate), the gap is 1.02 standard deviations.
WHITE HIGH SCHOOL DROPOUT IN THE NLSY
Who drops out of high school these days? The following tahle shows
the story for NLSY whites in the various cognitive classes. The results
Failure to Get a High School
Education Among Whites
Percentage Who Did Not
Graduate or Pass a High
Cognitive Class
School Equivalency Exam
I Very bright
0
I1 Bright
0"
111 Normal
6
IV Dull
35
V Very dull
5 5
Overall average
9
" The actual figure was 0.4 percent.
could hardly be starker. Among whites in the top quartile (Classes I and
11 together), virtually everyone got a high school education. In the bot-
tom quartile of the IQ distribution (Classes IV and V together), 39 per-
cent of whites did not."*' This huge discrepancy is also predictable,
however, given the close relationship between IQ and educational at-
tainment-~~ predictable that we should pause for a moment before
viewing dropout rates with alarm. Is a 39 percent dropout rate for stu-
dents in the lowest quartile of IQ "high"? From one perspective, it seems
so, considering how essential education appears to be for making a liv-
ing. From another perspective, it is remarkable that over 60 percent of
white youths with IQs under 90 did get a high school education. It is
particularly remarkable that nearly half of the youths in Class V, with
IQs of 75 and under, completed a high school education, despite being
on the borderline (or beyond) of the clinical definition of retarded.''3'
Whether these figures say something about the ability of low-IQ stu-
dents to learn or about the state of American secondary education is a
topic we defer until Chapter 18.
What Does "A High School Education" Mean?
The standard question now arises: To what extent are we looking at an
effect of cognitive ability, and to what extent are white children from
poor socioeconomic backgrounds being shunted out of the school system
because of their backgrounds? The answer depends on exactly how the
question is asked. Specifically, it is important to be precise about what "a
high school education" means. In the table above, it was defined to in-
clude anyone who graduated from high school in the normal way or who
passed an equivalency examination, known generically as a GED (for
General Educational Development).14 This has become nearly standard
practice when researchers and journalists alike talk about high school
dropout. But recent work by economists Steven Cameron and James
Heckman has demonstrated that GED youths are not equivalent tol'nor-
mal" graduates in terms of their success in the job market.15 In their un-
employment rates, job tenure, and wages, the GEDs look more like
dropouts than they look like high school graduates, raising the possibil-
ity that they differ from other high school graduates in a variety of ways
that makes it dangerous to lump all people with "a high school educa-
tion" into a single group. We know from our own analyses that the white
GEDs in the NLSY had an average IQ half a standard deviation lower
148
Cognitiue Classes and Social Behavior
Schooling
149
than the average for white high school graduates. Furthermore, apart
from the specifics of the data, it is apparent that the nature of the GED
student's behavior--giving up on school, then later returning to pass the
examination-is
different in kind from that of both the dropout who
leaves school and never goes back, and from that of the youth who sticks
with four consecutive years of schooling and gets a diploma.
To clinch their case for separating GED from "normal" graduates,
Cameron and Heckman also point out that the size of the GED
population, once negligible, has grown to become a substantial minor-
ity. In 1968, GED graduates accounted for only 5 percent of all high
school certifications. By 1980, that proportion had reached more than
13 percent, where it has remained, with minor fluctuations, ever since.'16'
We are persuaded that these disparate groups need to be separated
and will therefore analyze separately the relationship of IQ and socio-
economic background to each of these two types of dropouts.
The Permanent Dropouts
First, we compare students who got a high school degree through the
normal process with dropouts who left school never to return, shown in
the next figure.
Staying through high school to receive a diploma did not require
genius or high-status parents. Dropout rates were extremely low for
white students who were of at least average intelligence or socio-
economic background. But dropout rates rose rapidly when those vari-
ables fell below average, with the rise being precipitous for students
with low IQ.
A closer look at these numbers dispels the stereotype of the high
school dropout as the bright but unlucky youngster whose talents are
wasted because of economic disadvantage or a school system that can-
not hold onto him-the
stereotype that people have in mind when they
lament the American dropout rate because it is frittering away the na-
tion's human ~a~ita1.l'~'
Among whites, hardly anyone in the NLSY fit
that description. Of the whites who dropped out never to return, only
three-tenths of 1 percent met a realistic definition of the gifted-but-dis-
advantaged dropout (top quartile of IQ, bottom quartile of socioeco-
nomic background.) Another eight-tenths of 1 percent were in the top
quattile of IQ and the third quartile of the socioeconomic distribution.
In predicting which white youths will never complete a
high school education, IQ is more important than SES
Probability of permanently dropping out of high school
708 -
Very low
(-2 SDs)
Very high
(+2 SDs)
Note: For computing the plot, age and either SES (for the hlack curve) or 1Q (for the gray
curve) were set at the~r mean values.
Even when we relax the definition to include everyone who is from the
top half of the IQ distribution and the bottom half of the socioeconomic
distribution-a
very loose definition indeed-we
are talking about a
grand total of only 5.5 percent of the permanent dropouts, or half of 1
percent of American whites in the NLSY."~'
The permanent dropout instead fits the older image, more common
among the general public than intellectuals, of the youngster who is
both not very smart and from the wrong side of the tracks. To put it
technically, the effects of socioeconomic status and intelligence inter-
act. A white youth who had both low cognitive ability and a poor so-
cioeconomic background was at even more risk of dropout than the
separate effects of each variable would lead one to expect."9' Of white
youths who were in the bottom quartile o n both IQ and socioeconomic
status, half permanently dropped out of school.
IQ, SES, and Dropout Dynamics
- For permanent high school dropouts, cognitive ability (IQ) is a more significant predictor than socioeconomic status (SES).
- The 'advantaged dropout'—someone with high IQ but low SES—is statistically rare, representing only a tiny fraction of the dropout population.
- A synergistic risk effect exists where white youths with both low IQ and low SES have a 50% chance of permanently dropping out.
- Temporary dropouts who eventually earn a GED are influenced more by parental SES than by their own IQ scores.
- Higher-SES parents often intervene through therapy or alternative schooling to prevent permanent dropout, whereas lower-SES backgrounds correlate with higher GED rates.
- Despite having higher intelligence than permanent dropouts, GED recipients often struggle in the labor market due to social backgrounds that may not emphasize a traditional work ethic.
The permanent dropout instead fits the older image, more common among the general public than intellectuals, of the youngster who is both not very smart and from the wrong side of the tracks.
148
Cognitiue Classes and Social Behavior
Schooling
149
than the average for white high school graduates. Furthermore, apart
from the specifics of the data, it is apparent that the nature of the GED
student's behavior--giving up on school, then later returning to pass the
examination-is
different in kind from that of both the dropout who
leaves school and never goes back, and from that of the youth who sticks
with four consecutive years of schooling and gets a diploma.
To clinch their case for separating GED from "normal" graduates,
Cameron and Heckman also point out that the size of the GED
population, once negligible, has grown to become a substantial minor-
ity. In 1968, GED graduates accounted for only 5 percent of all high
school certifications. By 1980, that proportion had reached more than
13 percent, where it has remained, with minor fluctuations, ever since.'16'
We are persuaded that these disparate groups need to be separated
and will therefore analyze separately the relationship of IQ and socio-
economic background to each of these two types of dropouts.
The Permanent Dropouts
First, we compare students who got a high school degree through the
normal process with dropouts who left school never to return, shown in
the next figure.
Staying through high school to receive a diploma did not require
genius or high-status parents. Dropout rates were extremely low for
white students who were of at least average intelligence or socio-
economic background. But dropout rates rose rapidly when those vari-
ables fell below average, with the rise being precipitous for students
with low IQ.
A closer look at these numbers dispels the stereotype of the high
school dropout as the bright but unlucky youngster whose talents are
wasted because of economic disadvantage or a school system that can-
not hold onto him-the
stereotype that people have in mind when they
lament the American dropout rate because it is frittering away the na-
tion's human ~a~ita1.l'~'
Among whites, hardly anyone in the NLSY fit
that description. Of the whites who dropped out never to return, only
three-tenths of 1 percent met a realistic definition of the gifted-but-dis-
advantaged dropout (top quartile of IQ, bottom quartile of socioeco-
nomic background.) Another eight-tenths of 1 percent were in the top
quattile of IQ and the third quartile of the socioeconomic distribution.
In predicting which white youths will never complete a
high school education, IQ is more important than SES
Probability of permanently dropping out of high school
708 -
Very low
(-2 SDs)
Very high
(+2 SDs)
Note: For computing the plot, age and either SES (for the hlack curve) or 1Q (for the gray
curve) were set at the~r mean values.
Even when we relax the definition to include everyone who is from the
top half of the IQ distribution and the bottom half of the socioeconomic
distribution-a
very loose definition indeed-we
are talking about a
grand total of only 5.5 percent of the permanent dropouts, or half of 1
percent of American whites in the NLSY."~'
The permanent dropout instead fits the older image, more common
among the general public than intellectuals, of the youngster who is
both not very smart and from the wrong side of the tracks. To put it
technically, the effects of socioeconomic status and intelligence inter-
act. A white youth who had both low cognitive ability and a poor so-
cioeconomic background was at even more risk of dropout than the
separate effects of each variable would lead one to expect."9' Of white
youths who were in the bottom quartile o n both IQ and socioeconomic
status, half permanently dropped out of school.
150
Cognitive Classes and Social Behavior
Schooling
15 1
The Temporary Dropouts
The "temporary dropouts," who go back to get a GED, tell a different
story. In the figure below, they are compared with students who re-
ceived a high school diploma in the usual way. In effect, the figure says
For temporary dropouts, the importance of SES increases sharply
Probability of getting a GED instead of a high school diploma
30% -
As parental SES goes from low to high
20% -
10%-
As IQ goes from
low to high
0%
I
I
I
I
Very low
Very high
(-2 SDs)
(+2 SDs)
Note: For computing the plot, age and either SES (for the black curve) or 1Q (for the gray
curve) were set at their mean values.
that if you want to predict who will stay in high school through the
diploma, and who will instead drop out of school and eventually get a
GED, you are better off sizing up their parents than looking at their 1Q
scores. In speculating about what lies behind these numbers, three im-
ages come to mind. First, there are middle- and the upper-class parents
who find it unthinkable that their children should drop out of high
school--call the therapist, find a special school, do anything, but keep
the child in school. Then one thinks of working-class parents (most of
whom are somewhere around the mean on the socioeconomic index),
urging their children to get an education and do better than their par-
ents. Finally, one thinks of lower-class parents, the Pap Finns of Amer-
ican folklore, complaining about their children wasting all that time
on book learning. The NLSY data are consistent with these popular
images. For youths with a socioeconomic background anywhere near
or above the mean, the high school diploma is the norm. As socio-
economic background falls below the mean, the probability that the
high school certification came through a GED instead of the normal
route soars.
This view also fits into the Cameron and Heckman finding that
GED students are more like dropouts than high school graduates in the
problems they experience in the labor market. Interpretively, the
brighter dropouts may go back to get a GED, but they continue to share
in common with the permanent dropouts a lower-class social back-
ground that has not inculcated a work ethic that makes for success in
the labor fc~rce."~'
Thus, GEDs are more like normal graduates in their
intelligence but more like other dropouts in their success in the labor
force.
All of this interpretation is speculative, and we will leave it to oth-
ers to determine whether these possibilities stand up to examination.
Meanwhile, the results emphasize the need for more open exploration
of a topic that has been almost as taboo in some circles as IQ: the pos-
s~bility that "lower class" in its old-fashioned sense has an impact on
how people behave.
One concrete result of this analysis bears on the presentation in this
hook. The differences between GED graduates and those with regular
diplomas are too great to justify grouping them together. Whenever we
refer to "a high school education" throughout the rest of Part 11, we are
referring specifically to the normal high school career, completed by a
diploma. (;ED graduates are excluded.
THE COMPARATIVE ROLE OF 1Q AND FAMILY BACKGROUND
IN GETTING A COLLEGE DEGREE
As a general statement, the relationship of IQ to educational attain-
ment seems to have been remarkably stable. Twenty years ago, one of
the leading texts on the Wechsler Adult Intelligence Scale reported that
the mean of high school graduates was about 105, the mean of college
IQ, Class, and College Attainment
- The authors argue that the concept of 'lower class' behavior should be explored more openly, despite being a taboo subject in academic circles.
- Data suggests that GED graduates differ significantly from traditional high school diploma holders, necessitating their separation in educational analysis.
- Mean IQ scores for various levels of educational attainment have remained remarkably stable since the mid-20th century, with college graduates averaging around 115.
- Statistical analysis indicates that for white youths, cognitive ability (IQ) is a more significant predictor of obtaining a college degree than parental socioeconomic status.
- The 'talented-but-disadvantaged' youth who is denied education due to poverty is described as a statistically tiny group that does not constitute a major public policy problem.
- Privileged but low-IQ students rarely obtain degrees, debunking the stereotype of untalented wealthy children being shepherded through college.
The differences between GED graduates and those with regular diplomas are too great to justify grouping them together.
150
Cognitive Classes and Social Behavior
Schooling
15 1
The Temporary Dropouts
The "temporary dropouts," who go back to get a GED, tell a different
story. In the figure below, they are compared with students who re-
ceived a high school diploma in the usual way. In effect, the figure says
For temporary dropouts, the importance of SES increases sharply
Probability of getting a GED instead of a high school diploma
30% -
As parental SES goes from low to high
20% -
10%-
As IQ goes from
low to high
0%
I
I
I
I
Very low
Very high
(-2 SDs)
(+2 SDs)
Note: For computing the plot, age and either SES (for the black curve) or 1Q (for the gray
curve) were set at their mean values.
that if you want to predict who will stay in high school through the
diploma, and who will instead drop out of school and eventually get a
GED, you are better off sizing up their parents than looking at their 1Q
scores. In speculating about what lies behind these numbers, three im-
ages come to mind. First, there are middle- and the upper-class parents
who find it unthinkable that their children should drop out of high
school--call the therapist, find a special school, do anything, but keep
the child in school. Then one thinks of working-class parents (most of
whom are somewhere around the mean on the socioeconomic index),
urging their children to get an education and do better than their par-
ents. Finally, one thinks of lower-class parents, the Pap Finns of Amer-
ican folklore, complaining about their children wasting all that time
on book learning. The NLSY data are consistent with these popular
images. For youths with a socioeconomic background anywhere near
or above the mean, the high school diploma is the norm. As socio-
economic background falls below the mean, the probability that the
high school certification came through a GED instead of the normal
route soars.
This view also fits into the Cameron and Heckman finding that
GED students are more like dropouts than high school graduates in the
problems they experience in the labor market. Interpretively, the
brighter dropouts may go back to get a GED, but they continue to share
in common with the permanent dropouts a lower-class social back-
ground that has not inculcated a work ethic that makes for success in
the labor fc~rce."~'
Thus, GEDs are more like normal graduates in their
intelligence but more like other dropouts in their success in the labor
force.
All of this interpretation is speculative, and we will leave it to oth-
ers to determine whether these possibilities stand up to examination.
Meanwhile, the results emphasize the need for more open exploration
of a topic that has been almost as taboo in some circles as IQ: the pos-
s~bility that "lower class" in its old-fashioned sense has an impact on
how people behave.
One concrete result of this analysis bears on the presentation in this
hook. The differences between GED graduates and those with regular
diplomas are too great to justify grouping them together. Whenever we
refer to "a high school education" throughout the rest of Part 11, we are
referring specifically to the normal high school career, completed by a
diploma. (;ED graduates are excluded.
THE COMPARATIVE ROLE OF 1Q AND FAMILY BACKGROUND
IN GETTING A COLLEGE DEGREE
As a general statement, the relationship of IQ to educational attain-
ment seems to have been remarkably stable. Twenty years ago, one of
the leading texts on the Wechsler Adult Intelligence Scale reported that
the mean of high school graduates was about 105, the mean of college
152
Cognitive Chses and Social Behavior
Schooling
1 53
graduates was 115, and the mean of people getting medical degrees and
Ph.D.s was about 125.*' The book, published in 1972, was based on clin-
ical experience in the 1950s and 1960s. This summary is virtually iden-
tical to the story told by the NLSY for whites (who correspond most
closely with the college population in the 1950s and early 1960s). The
mean 1Q of high school graduates was 106, the mean of college gradu-
ates was 116, and the mean of people with professional degrees was 126.
The relative roles of socioeconomic status and IQ in getting a bache-
lor's degree for youths of the late 1970s and 1980s are shown in the fig-
ure below.
For white youths, being smart is more important
than being privileged in getting a college degree
Probability of getting a bachelor's degree
80% -
40% -
30% -
20% -
105%-
As parenral SES goes
from low to high
0%
Very low
(-2 SDs)
gree are minuscule. The second broad implication is that parental SES
is important but not decisive. In terms of this figure, a student with very
well-placed parents, in the top 2 percent of the socioeconomic scale,
had only a 40 percent chance of getting a college degree if he had only
average intelligence. A student with parents of only average SES-
lower middle class, probably without college degrees themselves-who
is himself in the top 2 percent of 1Q had more than a 75 percent chance
of getting a degree.
Once again, the common stereotype of the talented-but-disadvan-
taged-youth-denied-educational-opportunity does not seem to exist in
significant numbers any longer. Only seven-tenths of 1 percent of whites
in the NLSY were both "prime college material" (IQs of 1 15 or above)
and markedly disadvantaged in their socioeconomic background (in the
bottom quartile on the SES index). Among this tiny group, it is true
that fewer than half (46 percent) got college degrees. Those who did
not, despite having high IQs, may be seen as youths who suffered from
having a disadvantaged background. But recall that this group consists
of only four-tenths of 1 percent of all white youths. A category of wor-
thy white young persons denied a college education because of circum-
stances surely exists to some degree, but of such small size that it does
not constitute a public policy problem.
What about another stereotype, the untalented child of rich parents
who gets shepherded through to a degree? Almost 5 percent of white
youths had below-average 1Qs (under 100) and parents in the top quar-
tile of socioeconomic status. Of those, only 12 percent had gotten col-
lege degrees, representing just six-tenths of 1 percent of white youths.
Judging from these data, the common assertion that privileged white
parents can make sure their children do well in school, no matter what,
may be exaggerated.
Note: For computing the plot, age and either SES (for the black curve) or IQ (for the Fay
curve) were set at their mean values.
SUMMING UP
Two broad implications of these results stand out. The first is sug-
gested by the way that both curves hug the bottom throughout the left-
hand side of the graph. The combination of average-or-below parental
SES or average-or-below IQ meant that the odds of getting a college de-
The act of leaving high school before graduating is a rare event among
white youths, conspicuously concentrated in the lowest quartile of cog-
nitive ability. Among those who drop out, both socioeconomic status
and cognitive ability are involved. Most dropouts with above-average
intelligence go back to get a GED.~~"
But socioeconomic status remains
Cognitive Ability and Social Outcomes
- High cognitive ability acts as a significant equalizer, making socioeconomic disadvantage less of a barrier to obtaining a college degree.
- While socioeconomic status is a strong predictor of high school dropout rates, its influence diminishes significantly for high-IQ individuals seeking higher education.
- Labor force participation among young white men is strongly predicted by cognitive ability, with lower IQ scores correlating to higher rates of unemployment and idleness.
- Surprisingly, after controlling for IQ, higher parental socioeconomic status actually correlates with an increased probability of a young man being out of the labor force.
- Physical disability claims are heavily concentrated in the bottom quartile of the IQ distribution, suggesting a potential link between cognitive ability and accident proneness or self-perception of health.
- The data suggests that parental influence on academic and professional success may be exaggerated compared to the impact of innate cognitive ability.
But while socioeconomic privilege can help if the youngster is reasonably bright, there are limits to what it can do if he is not.
152
Cognitive Chses and Social Behavior
Schooling
1 53
graduates was 115, and the mean of people getting medical degrees and
Ph.D.s was about 125.*' The book, published in 1972, was based on clin-
ical experience in the 1950s and 1960s. This summary is virtually iden-
tical to the story told by the NLSY for whites (who correspond most
closely with the college population in the 1950s and early 1960s). The
mean 1Q of high school graduates was 106, the mean of college gradu-
ates was 116, and the mean of people with professional degrees was 126.
The relative roles of socioeconomic status and IQ in getting a bache-
lor's degree for youths of the late 1970s and 1980s are shown in the fig-
ure below.
For white youths, being smart is more important
than being privileged in getting a college degree
Probability of getting a bachelor's degree
80% -
40% -
30% -
20% -
105%-
As parenral SES goes
from low to high
0%
Very low
(-2 SDs)
gree are minuscule. The second broad implication is that parental SES
is important but not decisive. In terms of this figure, a student with very
well-placed parents, in the top 2 percent of the socioeconomic scale,
had only a 40 percent chance of getting a college degree if he had only
average intelligence. A student with parents of only average SES-
lower middle class, probably without college degrees themselves-who
is himself in the top 2 percent of 1Q had more than a 75 percent chance
of getting a degree.
Once again, the common stereotype of the talented-but-disadvan-
taged-youth-denied-educational-opportunity does not seem to exist in
significant numbers any longer. Only seven-tenths of 1 percent of whites
in the NLSY were both "prime college material" (IQs of 1 15 or above)
and markedly disadvantaged in their socioeconomic background (in the
bottom quartile on the SES index). Among this tiny group, it is true
that fewer than half (46 percent) got college degrees. Those who did
not, despite having high IQs, may be seen as youths who suffered from
having a disadvantaged background. But recall that this group consists
of only four-tenths of 1 percent of all white youths. A category of wor-
thy white young persons denied a college education because of circum-
stances surely exists to some degree, but of such small size that it does
not constitute a public policy problem.
What about another stereotype, the untalented child of rich parents
who gets shepherded through to a degree? Almost 5 percent of white
youths had below-average 1Qs (under 100) and parents in the top quar-
tile of socioeconomic status. Of those, only 12 percent had gotten col-
lege degrees, representing just six-tenths of 1 percent of white youths.
Judging from these data, the common assertion that privileged white
parents can make sure their children do well in school, no matter what,
may be exaggerated.
Note: For computing the plot, age and either SES (for the black curve) or IQ (for the Fay
curve) were set at their mean values.
SUMMING UP
Two broad implications of these results stand out. The first is sug-
gested by the way that both curves hug the bottom throughout the left-
hand side of the graph. The combination of average-or-below parental
SES or average-or-below IQ meant that the odds of getting a college de-
The act of leaving high school before graduating is a rare event among
white youths, conspicuously concentrated in the lowest quartile of cog-
nitive ability. Among those who drop out, both socioeconomic status
and cognitive ability are involved. Most dropouts with above-average
intelligence go back to get a GED.~~"
But socioeconomic status remains
154
Cognitive Classes and Social Behavior
bound up with the dropout process. The children of lower-class families
are more likely to end up with a GED than are the children of average
or upper-class families. There is irony in this: Throughout Part 11, we
describe social problems that are more understandable once cognitive
ability is brought into the picture and for which socioeconomic back-
ground is not as important as most people think. But the one social prob-
lem that has a widely acknowledged cause in cognitive ability-school
dropout-also
has a strong and complex socioeconomic link.
When it comes to explaining who gets a college education among
whites, both academic merit and socioeconomic hackground play im-
portant roles. But while socioeconomic privilege can help if the young-
ster is reasonably bright, there are limits to what it can do if he is not.
And if cognitive ability is high, socioeconomic disadvantage is no longer
a significant barrier to getting a college degree.
Chapter 7
Unemployment, Idleness, and
lnj ury
Economists distinguish between being unemployed and being out of the labor
force. The unemployed are looking for work unsuccessfully. Those out of the
labor force are not looking, at least for the time being. Among young white
men in their late 20s and early 3Os, both unemployment and being out of the
labor force are st.rongly predicted by low cognitive ability, even after taking
other factors into account.
Many of the white males in the NLSY who were out of the labor force had
the obvious excuse: They were still in college or graduate school. Of those not
in school, 15 percent spent at least a month out of the labor force in 1989.
The proportion was more than twice as high in cognitive Class V as in Class
I. Socioeconomic background was not the explanation. After the effects of IQ
were taken into account, the probability of spending time out of the labor force
went up, not down, as parental SES rose.
Why are young men out of the labor force? One obvious possibility is phys-
ical disability. Yet here too cognitive ability is a strong predictor: Of the men
who described themselves ns being too disabkd to work, more than nine out
of ten were in the bottom quarter of the I Q distribution; fewer than one in
twenty were in the top quarter. A man's IQ predicted whether he described
himself as disabled better than the kinds of job he had held. We do not know
why intelligence and physical problem are so closely related, but one possi-
bility is that less intelligent people are more accident pone.
The results are similar for unemployment. Among young white men who
were in the labor market, the likelihood of unemployment for high school grad-
uates and college graduates was equally dependent on cognitive ability. So-
cioeconomic background was irrelevant once intelligence was taken into
account.
Most men, whatever their intelligence, are working steadrly. However, for
that minon'ty ofmen who are either out of the labor force or unemployed, the
Cognitive Ability and Employment
- The text investigates the relationship between low cognitive ability and the inability to secure or maintain employment.
- Data shows a significant long-term decline in employment for young men not in school, dropping from 86 percent in 1953 to 66 percent in 1992.
- The analysis focuses specifically on white males to isolate cognitive factors from complex social variables associated with gender and race.
- Labor force dropout is distinguished from unemployment, as the former involves men who are not even actively seeking work.
- While high-IQ individuals may be out of the labor force due to advanced schooling, the study seeks to identify why others in their prime working years drop out.
In 1953, the first year for which data are available, more than 86 percent of these young men had jobs. In 1992, it was just 66 percent.
156
Cognitive CClses and Social Behavior
Unemployment, Idleness, and Injuly
15 7
primary risk factor seems to be neither socioeconomic background nor educa-
tion but low cognitive ability.
H
aving a high IQ makes it easier to do well in a job; we followed
that story in Chapter 3. But what about the relationship of cogni-
tive ability to that crucially important social behavior known as "being
able to get and hold a job." To what extent are dropouts from the lahor
force concentrated in the low-IQ classes? To what extent are the un-
employed concentrated there?
In the following discussion, we limit the analysis to males. It is still
accepted that women enter and leave the labor force for reasons hav-
ing to do with home and family, introducing a large and complex set of
issues, whereas healthy adult men are still expected to work. And yet
something troubling has been happening in that area, and for a long
time. The problem is shown in the figure below for a group of young
men who are likely to be (on average) in the lower half of the IQ dis-
tribution: men 16 to 19 years who are not enrolled in school.
Since mid-century, teenage boys not in school are
increasingly not employed either
Employment among men ages 16-19 who are not in school
90% -
Trendline established in 1953-92
80% -
70% -
60% -
Sources: Bureau of Lahor Statistics, 1982, Tahle C-42; unpuhlished data provided hy the Ru-
reau of Lahor Statistics.
Although the economy has gone up and down over the last forty years
and the employment of these young men with it, the long-term em-
ployment trend of their employment has been downhill. The overall
drop has not been small. In 1953, the first year for which data are avail-
able, more than 86 percent of these young men had jobs. In 1992, it was
just 66 percent.
Large macroeconomic and macrosocial forces, which we will not try
to cover, have been associated with this trend in employment.i" In this
chapter, we are concerned with what intelligence now has to do with
getting and holding a job. To explore the answer, we divide the em-
ployment problem into its two constituent parts, the unemployed and
those not even looking for work. All of the analyses that follow refer ex-
clusively to whites; in this case white males.
LABOR FORCE DROPOUT
To qualify as "participating in the lahor force," it is not necessary to be
employed; it is necessary only to be looking for work. Seen from this
perspective, there are only a few valid reasons why a man might not be
in the labor force. He might he a full+time student; disabled; institu-
tionalized or in the armed forces; retired; independently wealthy; stay-
ing at home caring for the children while his wife makes a salary. Or, it
may be argued, a man may legitimately be out of the lahor force if he is
convinced that he cannot find a job even if he tries. But this comes close
to exhausting the list of legitimate reasons.
As of the 1990 interview wave, the members of the NLSY sample
were in an ideal position for assessing lahor force participation. They
were 25 to 33 years old, in their prime working years, and they were in-
deed a hardworking group. Ninety-three percent of them had jobs.
Fewer than 5 percent were out of the labor force altogether. What had
caused that small minority to drop out of the labor force? And was there
any relationship between being out of the labor force and intelligence?
One such relationship was entirely predictable. A few men were out
of the labor force because they were still in school in their late 20s and
early 30s-most
of them in law school, medical school, or studying for
the doctorate. They were concentrated in the top cognitive classes. But
this does not tell us much about who leaves the labor force. We will ex-
clude them from the subsequent analysis and focus on men who were
out of the labor force for reasons other than school.
158
Cognitive Classes and Social Behavior
Unemployment, Idleness, and lnjury
1 59
To structure the analysis, let us ask who spent at least a month out of
the labor force during calendar year 1989. Here is the breakdown of la-
bor force dropout by cognitive class for white males.'*' Dropout from the
labor force rose as cognitive ability fell. The percentage of Class V men
Which White Young Men Spent a
Month or More Out of the Labor
Force in 1989?
Cognitive Class
Percentage
I Very bright
10
11 Bright
14
111 Normal
15
IV Dull
19
V Very dull
22
Overall average
15
who were out of the labor force was a little more than twice the per.
centage for men in Class I.
SOCIOECONOMIC
BACKGROUND
VERSUS COGNITIVE
A R I L I ~ .
The next
step, in line with our standard procedure, is to examine how much of
the difference may be accounted for by the man's socioeconomic
background. The thing to be explained (the dependent variable) is
the probability of spending at least a month out of the labor force in
1989. Our basic analysis has the usual three explanatory variables:
parental SES, age, and IQ. The results are shown in the figure below.
In this analysis, we exclude all men who in either 1989 or 1990
reported that they were in school, the military, or were physically
unable to work.
These results are the first example of a phenomenon you will see again
in the chapters of Part 11. If we had run this analysis with just socioeco-
nomic background and age as the explanatory variables, we would have
found a mildly interesting but unsurprising result: Holding age constant,
white men from more privileged backgrounds have a modestly smaller
chance of dropping out of the labor force than white men from deprived
IQ and socioeconomic background have opposite effects
on leaving the labor force among white men
Probability of being out of the labor force for a month or more
20% -
As lQ ~ o e s
from 1012' to high
10%-
As part-ntal SES Roes
from low to high
0% ,
1
1
I
I
Very low
Very high
(-2 SDs)
(+2 SDs)
Notr For c o ~ n p ~ ~ t ~ n g
the plot, age and e~ther SES (for the hlack curve) or IQ (for the my
curve) were set at thew mean values.
backgrounds. Rut when IQ is added to the equation, the role of socio-
economic background either disappears entirely or moves in the oppo-
site direction. Given equal age and IQ, a young man from a family with
high socioeconomic status was more likely to spend time out of the lahor
force than the young man from a family with low socioeconomic status.13'
In contrast, IQ had a large positive impact on staying at work. A man
of average age and socioeconomic background in the 2d centile of IQ
had almost a 20 percent chance of spending at least a month out of the
lahor force, compared to only a 5 percent chance for a man at the 98th
centile.
It is not hard to imagine why high intelligence helps keep a man at
work. As Chapter 3 discussed, competence in the workplace is related
to intelligence, and competent people more than incompetent people
are likely to find the workplace a congenial and rewarding place. Hence,
Cognitive Ability and Labor Dropout
- The study examines the relationship between cognitive class and the likelihood of white males spending at least a month out of the labor force.
- Data shows a clear inverse correlation: men in the lowest cognitive class (Class V) are more than twice as likely to drop out as those in the highest class (Class I).
- When controlling for IQ, socioeconomic status (SES) has a counterintuitive effect: men from high-SES backgrounds are actually more likely to leave the labor force than those from low-SES backgrounds.
- Intelligence is positively correlated with workplace competence, making the labor market a more rewarding environment for those with higher cognitive ability.
- The authors suggest that higher intelligence is linked to longer time horizons, encouraging young men to build reliable employment records rather than succumbing to short-term diversions.
Given equal age and IQ, a young man from a family with high socioeconomic status was more likely to spend time out of the labor force than the young man from a family with low socioeconomic status.
158
Cognitive Classes and Social Behavior
Unemployment, Idleness, and lnjury
1 59
To structure the analysis, let us ask who spent at least a month out of
the labor force during calendar year 1989. Here is the breakdown of la-
bor force dropout by cognitive class for white males.'*' Dropout from the
labor force rose as cognitive ability fell. The percentage of Class V men
Which White Young Men Spent a
Month or More Out of the Labor
Force in 1989?
Cognitive Class
Percentage
I Very bright
10
11 Bright
14
111 Normal
15
IV Dull
19
V Very dull
22
Overall average
15
who were out of the labor force was a little more than twice the per.
centage for men in Class I.
SOCIOECONOMIC
BACKGROUND
VERSUS COGNITIVE
A R I L I ~ .
The next
step, in line with our standard procedure, is to examine how much of
the difference may be accounted for by the man's socioeconomic
background. The thing to be explained (the dependent variable) is
the probability of spending at least a month out of the labor force in
1989. Our basic analysis has the usual three explanatory variables:
parental SES, age, and IQ. The results are shown in the figure below.
In this analysis, we exclude all men who in either 1989 or 1990
reported that they were in school, the military, or were physically
unable to work.
These results are the first example of a phenomenon you will see again
in the chapters of Part 11. If we had run this analysis with just socioeco-
nomic background and age as the explanatory variables, we would have
found a mildly interesting but unsurprising result: Holding age constant,
white men from more privileged backgrounds have a modestly smaller
chance of dropping out of the labor force than white men from deprived
IQ and socioeconomic background have opposite effects
on leaving the labor force among white men
Probability of being out of the labor force for a month or more
20% -
As lQ ~ o e s
from 1012' to high
10%-
As part-ntal SES Roes
from low to high
0% ,
1
1
I
I
Very low
Very high
(-2 SDs)
(+2 SDs)
Notr For c o ~ n p ~ ~ t ~ n g
the plot, age and e~ther SES (for the hlack curve) or IQ (for the my
curve) were set at thew mean values.
backgrounds. Rut when IQ is added to the equation, the role of socio-
economic background either disappears entirely or moves in the oppo-
site direction. Given equal age and IQ, a young man from a family with
high socioeconomic status was more likely to spend time out of the lahor
force than the young man from a family with low socioeconomic status.13'
In contrast, IQ had a large positive impact on staying at work. A man
of average age and socioeconomic background in the 2d centile of IQ
had almost a 20 percent chance of spending at least a month out of the
lahor force, compared to only a 5 percent chance for a man at the 98th
centile.
It is not hard to imagine why high intelligence helps keep a man at
work. As Chapter 3 discussed, competence in the workplace is related
to intelligence, and competent people more than incompetent people
are likely to find the workplace a congenial and rewarding place. Hence,
160
Cognitive Classes and Social Behavior
Unemployment, Idkness , and Injury
16 1
other things equal, they are more likely than incompetent people to be
in the labor force. Intelligence is also related to time horizons. A male
in his 20s has many diverting ways to spend his time, from traveling the
world to seeing how many women he can romance, all of them a lot
more fun than working forty hours a week at a job. A shortsighted man
may be tempted to take a few months off here and there; he thinks he
can always pick up again when he feels like it. A farsighted man tells
himself that if he wants to lay the groundwork for a secure future, he
had better establish a record as a reliable employee now, while he is
young. Statistically, smart men tend to be more farsighted than dumb
men.
In contrast to IQ, the role of parental SES is inherently ambiguous.
One possibility is that growing up in a privileged home foretells low
dropout rates, because the parents in such households socialize their sons
to conventional work. But this relationship may break down among the
wealthy, whose son has the option of living comfortably without a
weekly paycheck. In any case, aren't working-class homes also adamant
about raising sons to go out and get a job? And don't young men from
lower-class homes have a strong economic incentive to stay in the labor
force because they are likely to need the money? The statistical
relationship with parental SES that shows up in the analysis suggests
that higher status may facilitate labor force dropout, at least for short
periods.
The analysis of labor force dropout is also the first example in Part I1
of a significant relationship that is nonetheless modest. When we know
from the outset that 78 percent of white men in Class V-borderline
retarded or below--did not drop out of the labor force for as much as a
month, we can also infer that all sorts of things besides IQ are impor-
tant in determining whether someone stays at work. The analysis we
have presented adds to our understanding without enabling us to ex-
plain fully the phenomenon of labor force dropout.
EDUCATION.
Conducting the analysis separately for our two educational
samples (those with a bachelor's degree, no more and no less, and those
with a high school diploma, no more and no less) does not change the
picture. High intelligence played a larger independent role in reducing
labor force dropout among the college sample than among the high
school sample. And for both samples, high socioeconomic background
did not decrease labor force dropout independent of IQ and age. Once
again, the probability of dropout actually increased with socioeconomic
background.
JOB DISABILITIES
In the preceding analysis, we excluded all the cases in which men re-
ported that they were unable to work. But it is not that simple. Low cog-
nitive ability increases the risk of being out of the labor force for healthy
young men, but it also increases the risk of not being healthy. The break-
down by cognitive classes is shown in the following table. The rela-
Job Disability Among Young White Males
No. per 1,000
No. per 1,000 Who
Who Reported Being
Reported Limits in
Prevented from
Amount or Kind of
Working by Health
Cognitive
Work by Health
Problems
Class
Problems
0
I Very Bright
13
5
I1 Bright
2 1
5
111 Normal
37
36
IV Dull
45
7 8
V Very dull
62
1 1
Overall average
3 3
tionship of IQ with both variables is conspicuous but more dramatic for
men reporting that their disability prevents them from working. The
rate per 1,000 of men who said they were prevented from working by a
physical disability jumped sevenfold from Class 111 to Class IV, and then
more than doubled again from Class IV to Class V.
A moment's thought suggests a plausible explanation: Men with low
intelligence work primarily in blue-collar, manual jobs and thus are
more likely to get hurt than are men sitting around conference tables.
Being injured is more likely to shrink the job market for a blue-collar
worker than a for a white-collar worker. A n executive with a limp can
still be an executive; a manual laborer with a limp faces a more serious
job impediment. This plausible hypothesis appears to be modestly con-
firmed in a simple cross-classification of disabilities with type of job.
Intelligence and Labor Force Participation
- High socioeconomic status (SES) does not necessarily prevent labor force dropout and may actually facilitate it among the wealthy who lack immediate financial pressure.
- While cognitive ability is a significant factor in staying employed, the majority of even the lowest IQ groups remain in the labor force, indicating other influential variables.
- The protective effect of high intelligence against labor force dropout is more pronounced among college graduates than high school graduates.
- There is a dramatic correlation between low cognitive ability and reported job disabilities, with rates of total work prevention increasing sharply in lower IQ classes.
- The higher disability rates in lower cognitive classes are partially explained by the physical nature of blue-collar work, where injuries are more common and more debilitating to career prospects.
An executive with a limp can still be an executive; a manual laborer with a limp faces a more serious job impediment.
160
Cognitive Classes and Social Behavior
Unemployment, Idkness , and Injury
16 1
other things equal, they are more likely than incompetent people to be
in the labor force. Intelligence is also related to time horizons. A male
in his 20s has many diverting ways to spend his time, from traveling the
world to seeing how many women he can romance, all of them a lot
more fun than working forty hours a week at a job. A shortsighted man
may be tempted to take a few months off here and there; he thinks he
can always pick up again when he feels like it. A farsighted man tells
himself that if he wants to lay the groundwork for a secure future, he
had better establish a record as a reliable employee now, while he is
young. Statistically, smart men tend to be more farsighted than dumb
men.
In contrast to IQ, the role of parental SES is inherently ambiguous.
One possibility is that growing up in a privileged home foretells low
dropout rates, because the parents in such households socialize their sons
to conventional work. But this relationship may break down among the
wealthy, whose son has the option of living comfortably without a
weekly paycheck. In any case, aren't working-class homes also adamant
about raising sons to go out and get a job? And don't young men from
lower-class homes have a strong economic incentive to stay in the labor
force because they are likely to need the money? The statistical
relationship with parental SES that shows up in the analysis suggests
that higher status may facilitate labor force dropout, at least for short
periods.
The analysis of labor force dropout is also the first example in Part I1
of a significant relationship that is nonetheless modest. When we know
from the outset that 78 percent of white men in Class V-borderline
retarded or below--did not drop out of the labor force for as much as a
month, we can also infer that all sorts of things besides IQ are impor-
tant in determining whether someone stays at work. The analysis we
have presented adds to our understanding without enabling us to ex-
plain fully the phenomenon of labor force dropout.
EDUCATION.
Conducting the analysis separately for our two educational
samples (those with a bachelor's degree, no more and no less, and those
with a high school diploma, no more and no less) does not change the
picture. High intelligence played a larger independent role in reducing
labor force dropout among the college sample than among the high
school sample. And for both samples, high socioeconomic background
did not decrease labor force dropout independent of IQ and age. Once
again, the probability of dropout actually increased with socioeconomic
background.
JOB DISABILITIES
In the preceding analysis, we excluded all the cases in which men re-
ported that they were unable to work. But it is not that simple. Low cog-
nitive ability increases the risk of being out of the labor force for healthy
young men, but it also increases the risk of not being healthy. The break-
down by cognitive classes is shown in the following table. The rela-
Job Disability Among Young White Males
No. per 1,000
No. per 1,000 Who
Who Reported Being
Reported Limits in
Prevented from
Amount or Kind of
Working by Health
Cognitive
Work by Health
Problems
Class
Problems
0
I Very Bright
13
5
I1 Bright
2 1
5
111 Normal
37
36
IV Dull
45
7 8
V Very dull
62
1 1
Overall average
3 3
tionship of IQ with both variables is conspicuous but more dramatic for
men reporting that their disability prevents them from working. The
rate per 1,000 of men who said they were prevented from working by a
physical disability jumped sevenfold from Class 111 to Class IV, and then
more than doubled again from Class IV to Class V.
A moment's thought suggests a plausible explanation: Men with low
intelligence work primarily in blue-collar, manual jobs and thus are
more likely to get hurt than are men sitting around conference tables.
Being injured is more likely to shrink the job market for a blue-collar
worker than a for a white-collar worker. A n executive with a limp can
still be an executive; a manual laborer with a limp faces a more serious
job impediment. This plausible hypothesis appears to be modestly con-
firmed in a simple cross-classification of disabilities with type of job.
162
Cognitive CClses and Social Behavior
Unemployment, Idleness, a d Injury
163
More blue-collar workers reported some health limitation than did
white-collar workers (38 per 1,000 versus 28 per 1,000), and more blue-
collar workers reported being prevented from working than did white-
collar workers (5 per 1,000 versus 2 per 1,000).
But the explanation fails to account for the relationship of disability
with intelligence. For example, given average cognitive ability and age,
the odds of having reported a job limitation because of health were about
3.3 percent for white men working in white-collar jobs compared to 3.8
percent for white men working in blue-collar jobs, a very minor differ-
ence. But given that both men have blue-collar jobs, the man with an IQ
of 85 had double the probability of a work disability of a man with an
IQ of 115.
Might there be something within job categories to explain away this
apparent relationship of IQ to job disability? We explored the question
from many angles, as described in the extended note, and the finding
seems to be robust. For whatever reasons, white men with low IQs are
more likely to report being unable to work because of health than their
smarter counterparts, even when the occupational hazards have been
similar.14'
Why might intelligence be related to disability, independent of the
line of work itself? An answer leaps to mind: The smarter you are, the
less likely that you will have accidents. In Lewis Terman's sample of peo-
ple with IQs above 140 (see Chapter 2)) accidents were well below the
level observed in the general population.5 In other studies, the risk of
motor vehicle accidents rises as the driver's IQ falls.' Level of educa-
tion-to
some degree, a proxy measure of intelligence-has
been linked
to accidents and injury, including fatal injury, in other activities as well.'
Smarter workers are typically more productive workers (see Part l), and
we can presume that some portion of what makes a worker productive
is that he avoids needless accidents.
Whatever validity this explanation may have, however, it is unlikely
to be the whole story. We will simply observe that self-reported health
problems are subject to a variety of biases, especially when the question
is so sensitive as one that asks, in effect, "What is your excuse for not
looking for a job, young man!" The evidence in the NLSY regarding the
seriousness of the ailments, whether a doctor has been consulted, and
their duration raises questions about whether the self-reported disabil-
ity data have the same meaning when reported by (for example) a sub-
ject who reports that he was two months out of the labor market because
of a broken leg and another who reports that he has been out of the la-
bor market for five years because of a bad back.
We leave the analysis of labor force participation with a strong case
to be made for two points: Cognitive ability is a significant determinant
of dropout from the labor force by healthy young men, independent of
other plausibly important variables. And the group of men who are our
of the labor force because of self-described physical disability tend to-
ward low cognitive ability, independent of the physical demands of their
work.
UNEMPLOYMENT
Men who are out of the labor force are in one way or another unavail-
able for work; unemployed men, in contrast, want work but cannot find
it. The distinction is important. The nation's unemployment statistics
are calculated on the basis of people who are looking for work, not on
those who are out of the labor force. Being unemployed is transitory, a
way station on the road to finding a job or dropping out of the work
force. But it is hard to see much difference between unemployment and
dropping out in the relationship with intelligence. We begin with the
basic breakdown, set out in the following table. The extremes--Classes
I and V--differed markedly in the frequency of unemployment lasting
a month or more, with Class V experiencing six times the unemploy-
ment of Class 1. Class IV also had higher unemployment than the up-
per three-quarters of the IQ distribution.
Which White Young Men Spent a Month
or More Unemployed in 1989?
Cognitive Class
I Very bright
I1 Bright
I11 Normal
IV Dull
V Very dull
Overall average
Percentage
2
7
7
10
12
7
Intelligence and Labor Force Participation
- Research indicates that white men with lower IQs have a significantly higher probability of reporting work disabilities than their higher-IQ counterparts in the same job categories.
- The correlation between intelligence and disability remains robust even when controlling for the physical hazards of blue-collar versus white-collar occupations.
- Higher cognitive ability is linked to a lower frequency of accidents, including motor vehicle and workplace injuries, which may partially explain the disability gap.
- The data suggests potential biases in self-reported health problems, as some disability claims may serve as social justifications for long-term labor force withdrawal.
- Cognitive ability is identified as a primary determinant for healthy young men dropping out of the labor force entirely.
- Unemployment rates show a stark gradient across cognitive classes, with the 'very dull' group experiencing six times the month-long unemployment of the 'very bright' group.
The evidence in the NLSY regarding the seriousness of the ailments, whether a doctor has been consulted, and their duration raises questions about whether the self-reported disability data have the same meaning.
162
Cognitive CClses and Social Behavior
Unemployment, Idleness, a d Injury
163
More blue-collar workers reported some health limitation than did
white-collar workers (38 per 1,000 versus 28 per 1,000), and more blue-
collar workers reported being prevented from working than did white-
collar workers (5 per 1,000 versus 2 per 1,000).
But the explanation fails to account for the relationship of disability
with intelligence. For example, given average cognitive ability and age,
the odds of having reported a job limitation because of health were about
3.3 percent for white men working in white-collar jobs compared to 3.8
percent for white men working in blue-collar jobs, a very minor differ-
ence. But given that both men have blue-collar jobs, the man with an IQ
of 85 had double the probability of a work disability of a man with an
IQ of 115.
Might there be something within job categories to explain away this
apparent relationship of IQ to job disability? We explored the question
from many angles, as described in the extended note, and the finding
seems to be robust. For whatever reasons, white men with low IQs are
more likely to report being unable to work because of health than their
smarter counterparts, even when the occupational hazards have been
similar.14'
Why might intelligence be related to disability, independent of the
line of work itself? An answer leaps to mind: The smarter you are, the
less likely that you will have accidents. In Lewis Terman's sample of peo-
ple with IQs above 140 (see Chapter 2)) accidents were well below the
level observed in the general population.5 In other studies, the risk of
motor vehicle accidents rises as the driver's IQ falls.' Level of educa-
tion-to
some degree, a proxy measure of intelligence-has
been linked
to accidents and injury, including fatal injury, in other activities as well.'
Smarter workers are typically more productive workers (see Part l), and
we can presume that some portion of what makes a worker productive
is that he avoids needless accidents.
Whatever validity this explanation may have, however, it is unlikely
to be the whole story. We will simply observe that self-reported health
problems are subject to a variety of biases, especially when the question
is so sensitive as one that asks, in effect, "What is your excuse for not
looking for a job, young man!" The evidence in the NLSY regarding the
seriousness of the ailments, whether a doctor has been consulted, and
their duration raises questions about whether the self-reported disabil-
ity data have the same meaning when reported by (for example) a sub-
ject who reports that he was two months out of the labor market because
of a broken leg and another who reports that he has been out of the la-
bor market for five years because of a bad back.
We leave the analysis of labor force participation with a strong case
to be made for two points: Cognitive ability is a significant determinant
of dropout from the labor force by healthy young men, independent of
other plausibly important variables. And the group of men who are our
of the labor force because of self-described physical disability tend to-
ward low cognitive ability, independent of the physical demands of their
work.
UNEMPLOYMENT
Men who are out of the labor force are in one way or another unavail-
able for work; unemployed men, in contrast, want work but cannot find
it. The distinction is important. The nation's unemployment statistics
are calculated on the basis of people who are looking for work, not on
those who are out of the labor force. Being unemployed is transitory, a
way station on the road to finding a job or dropping out of the work
force. But it is hard to see much difference between unemployment and
dropping out in the relationship with intelligence. We begin with the
basic breakdown, set out in the following table. The extremes--Classes
I and V--differed markedly in the frequency of unemployment lasting
a month or more, with Class V experiencing six times the unemploy-
ment of Class 1. Class IV also had higher unemployment than the up-
per three-quarters of the IQ distribution.
Which White Young Men Spent a Month
or More Unemployed in 1989?
Cognitive Class
I Very bright
I1 Bright
I11 Normal
IV Dull
V Very dull
Overall average
Percentage
2
7
7
10
12
7
164
Cognitive Classes and Social Behavior
Unemployment, Idleness, and Injury
1 65
Socioeconomic Background Versus Cognitive Ability
The independent roles of our three basic variables are shown in the fig-
ure below. For a man of average age and socioeconomic background,
cognitive ability lowered the probability of being unemployed for a
month from 15 percent for a man at the 2d centile of IQ to 4 percent
for men at the 98th centile. Neither parental SES nor age had an ap-
preciable (or statistically significant) independent effect.
The Role of Education
Before looking at the numbers, we would have guessed that cogni-
tive ability would be more important for explaining unemployment
among the high school sample than among the college sample. The
logic is straightforward: A college degree supplies a credential and
sometimes specific job skills that, combined with the college gradu-
High IQ lowers the probability of a month-long spell
of unemployment among white men, while
socioeconomic background has no effect
Probability of being unemployed for a month or more
16%-
As IQ goes from low to high
As parental SES goes
from low to high
0%
1
I
I
I
I
Very low
Very high
(-2 SDs)
(+2 SDs)
Note: For computin~ the plot, age and either SES (for the hlack curve) or 1Q (for the p
y
curve) were set at their mean values.
ate's greater average level of intelligence, should reduce the inde-
pendent role of IQ in ways that would not apply as strongly to high
school graduates.'" But this logic is not borne out by the NLSY.
Cognitive ahility was more important in determining unemployment
among college graduates than among the high school sample, although
the \mall sample sizes in this analysis make this conclusion only
tentative. Socioeconomic background and age were not indepen-
dently important in explaining unemployment in the high school or
college samples.
A CONCLUSION AND A REMINDER ABOUT INTERPRETING
RARE EVENTS
The most haslc implication of the analysis is that intelligence and its
correlates-maturity,
farsightedness, and personal competence-are
Important in keeping a person employed and in the labor force. Because
such qualities are not entirely governed by economic conditions, the
question of who is working and who is not cannot be answered just in
terms of what jobs are available.
T h ~ s
does not mean we reject the relevance of structural or economic
conditions. In had economic times, we assume, finding a job is harder
for the mature and farsighted as well as for the immature and the short-
sighted, and it is easier to get discouraged and drop the search. Our goal
is to add some leavening to the usual formulation. The state of the econ-
omy matters, but so do personal qualities, a point that most economists
would prohably accept if it were brought to their attention so baldly, but
somehow it gets left out of virtually all discussions of unemployment
and lahor force participation.
As we close this discussion of cognitive ability and labor force be-
havior, let us be clear about what has and has not been demonstrated.
In focusing on those who did drop out of the labor force and those
who were unemployed, we do not want to forget that most white males
at every level of cognitive ability were in the lahor force and working,
even at the lowest cognitive levels. Among physically ahle white males
in Class V, the bottom 5 percent of the I Q distribution, comprising
men who are intellectually borderline or clinically retarded, seven
out of ten were in the labor force for all fifty-two weeks of 1989.
Of those who were in the labor force throughout the year, more than
eight out of ten experienced not a single week of unemployment.
IQ and Labor Force Stability
- Cognitive ability significantly reduces the probability of unemployment, dropping from 15% at the 2nd centile of IQ to 4% at the 98th centile.
- Parental socioeconomic status and age have no statistically significant independent effect on the likelihood of a month-long unemployment spell.
- Contrary to expectations, cognitive ability appears more important for determining unemployment among college graduates than high school graduates.
- The analysis suggests that personal qualities like maturity and farsightedness, correlated with intelligence, are essential for maintaining employment.
- Economic conditions are not the sole factor in labor participation; personal competence plays a critical role that is often overlooked in policy discussions.
- Despite statistical disadvantages, the vast majority of men at the lowest cognitive levels remain in the labor force and avoid unemployment.
Condescension toward these men is not in order, nor are glib assumptions that those who are cognitively disadvantaged cannot be productive citizens.
164
Cognitive Classes and Social Behavior
Unemployment, Idleness, and Injury
1 65
Socioeconomic Background Versus Cognitive Ability
The independent roles of our three basic variables are shown in the fig-
ure below. For a man of average age and socioeconomic background,
cognitive ability lowered the probability of being unemployed for a
month from 15 percent for a man at the 2d centile of IQ to 4 percent
for men at the 98th centile. Neither parental SES nor age had an ap-
preciable (or statistically significant) independent effect.
The Role of Education
Before looking at the numbers, we would have guessed that cogni-
tive ability would be more important for explaining unemployment
among the high school sample than among the college sample. The
logic is straightforward: A college degree supplies a credential and
sometimes specific job skills that, combined with the college gradu-
High IQ lowers the probability of a month-long spell
of unemployment among white men, while
socioeconomic background has no effect
Probability of being unemployed for a month or more
16%-
As IQ goes from low to high
As parental SES goes
from low to high
0%
1
I
I
I
I
Very low
Very high
(-2 SDs)
(+2 SDs)
Note: For computin~ the plot, age and either SES (for the hlack curve) or 1Q (for the p
y
curve) were set at their mean values.
ate's greater average level of intelligence, should reduce the inde-
pendent role of IQ in ways that would not apply as strongly to high
school graduates.'" But this logic is not borne out by the NLSY.
Cognitive ahility was more important in determining unemployment
among college graduates than among the high school sample, although
the \mall sample sizes in this analysis make this conclusion only
tentative. Socioeconomic background and age were not indepen-
dently important in explaining unemployment in the high school or
college samples.
A CONCLUSION AND A REMINDER ABOUT INTERPRETING
RARE EVENTS
The most haslc implication of the analysis is that intelligence and its
correlates-maturity,
farsightedness, and personal competence-are
Important in keeping a person employed and in the labor force. Because
such qualities are not entirely governed by economic conditions, the
question of who is working and who is not cannot be answered just in
terms of what jobs are available.
T h ~ s
does not mean we reject the relevance of structural or economic
conditions. In had economic times, we assume, finding a job is harder
for the mature and farsighted as well as for the immature and the short-
sighted, and it is easier to get discouraged and drop the search. Our goal
is to add some leavening to the usual formulation. The state of the econ-
omy matters, but so do personal qualities, a point that most economists
would prohably accept if it were brought to their attention so baldly, but
somehow it gets left out of virtually all discussions of unemployment
and lahor force participation.
As we close this discussion of cognitive ability and labor force be-
havior, let us be clear about what has and has not been demonstrated.
In focusing on those who did drop out of the labor force and those
who were unemployed, we do not want to forget that most white males
at every level of cognitive ability were in the lahor force and working,
even at the lowest cognitive levels. Among physically ahle white males
in Class V, the bottom 5 percent of the I Q distribution, comprising
men who are intellectually borderline or clinically retarded, seven
out of ten were in the labor force for all fifty-two weeks of 1989.
Of those who were in the labor force throughout the year, more than
eight out of ten experienced not a single week of unemployment.
166
Cognitive Chses and Soclal Behavior
Condescension toward these men is not in order, nor are glib as-
sumptions that those who are cognitively disadvantaged cannot be
productive citizens. The world is statistically tougher for them than
for others who are more fortunate, but most of them are overcoming
the odds.
Chapter 8
Family Matters
Rumors of the death of the traditional family have much truth in them for some
parts of white American society-those
with low cognitive ability and little ed-
ucation--and much less truth for the college educated and very bright Amer-
icans of all educational levels. In this instance, cognitive ability and education
appear to phy mutually reinforcing but also independent roks.
For marriage, the general rule is that the more intelligent get manied at
higher rates than the less intelligent. This relationship, which applies across the
range of intelligence, is obscured among people with high levels of education
because college and graduate school are powerful delayers of marriage.
Divorce has long been more prevalent in the lower socioeconomic and ed-
ucational brackets, but this turns out to be explained better by cognitive kvel
than by social status. Once the marriage-breaking impact of low intelligence
is taken into account, people of higher socioeconomic status are more likely to
get divorced than people of lower status.
Illegitimacy, one of the central social problems of the times, is strongly re-
lated to intelligence. White women in the bottom 5 percent of the cognitive
ability distribution are six times as likely to have an illegitimate first child as
those in the top 5 percent. One out of five of the legitimate first babies of
women in the bottom 5 percent was conceived prior to marriage, compared
to fewer than one out of twenty of the legitimate babies to women in the top
5 percent. Even among young women who have grown up in broken homes
and among young women who are poor-both
of which foster illegitimacy-
low cognitive ability further raises the odds of giving birth illegitimately. Low
cognitive ability is a much stronger predisposing factor for ikgitimacy than
low socioeconomic background.
At lower educational levels, a woman's intelligence best predicts whether
she will bear an illegitimate child. Toward the higher reaches of education, al-
most no white women are having illegitimate children, whatever their family
background or intelligence.
Intelligence and Family Structure
- The decline of the traditional family is not uniform across society but is heavily concentrated among those with lower cognitive ability and less education.
- Higher intelligence is positively correlated with higher marriage rates, though this trend is often masked by the tendency of higher education to delay marriage.
- Cognitive level is a more accurate predictor of divorce than socioeconomic status, with lower intelligence being a significant driver of marital instability.
- Illegitimacy is strongly linked to cognitive ability, with women in the bottom 5 percent of intelligence being six times more likely to have an illegitimate first child than those in the top 5 percent.
- Low cognitive ability acts as a stronger predisposing factor for out-of-wedlock births than being raised in poverty or a broken home.
- At the highest levels of education, illegitimacy is virtually nonexistent regardless of a woman's family background or intelligence level.
Rumors of the death of the traditional family have much truth in them for some parts of white American society—those with low cognitive ability and little education.
166
Cognitive Chses and Soclal Behavior
Condescension toward these men is not in order, nor are glib as-
sumptions that those who are cognitively disadvantaged cannot be
productive citizens. The world is statistically tougher for them than
for others who are more fortunate, but most of them are overcoming
the odds.
Chapter 8
Family Matters
Rumors of the death of the traditional family have much truth in them for some
parts of white American society-those
with low cognitive ability and little ed-
ucation--and much less truth for the college educated and very bright Amer-
icans of all educational levels. In this instance, cognitive ability and education
appear to phy mutually reinforcing but also independent roks.
For marriage, the general rule is that the more intelligent get manied at
higher rates than the less intelligent. This relationship, which applies across the
range of intelligence, is obscured among people with high levels of education
because college and graduate school are powerful delayers of marriage.
Divorce has long been more prevalent in the lower socioeconomic and ed-
ucational brackets, but this turns out to be explained better by cognitive kvel
than by social status. Once the marriage-breaking impact of low intelligence
is taken into account, people of higher socioeconomic status are more likely to
get divorced than people of lower status.
Illegitimacy, one of the central social problems of the times, is strongly re-
lated to intelligence. White women in the bottom 5 percent of the cognitive
ability distribution are six times as likely to have an illegitimate first child as
those in the top 5 percent. One out of five of the legitimate first babies of
women in the bottom 5 percent was conceived prior to marriage, compared
to fewer than one out of twenty of the legitimate babies to women in the top
5 percent. Even among young women who have grown up in broken homes
and among young women who are poor-both
of which foster illegitimacy-
low cognitive ability further raises the odds of giving birth illegitimately. Low
cognitive ability is a much stronger predisposing factor for ikgitimacy than
low socioeconomic background.
At lower educational levels, a woman's intelligence best predicts whether
she will bear an illegitimate child. Toward the higher reaches of education, al-
most no white women are having illegitimate children, whatever their family
background or intelligence.
168
Cognitive Chses and Social Behavior
Family Matters
169
T
he conventional understanding of troubles in the American fam-
ily has several story lines. The happily married couple where the
husband works and the wife stays home with the children is said to be
as outmoded as the bustle. Large proportions of young people are stay-
ing single. Half the marriages end in divorce. Out-of-wedlock births are
soaring.
These features of modem families are usually discussed in the media
(and often in academic presentations) as if they were spread more or less
evenly across society.ll' In this chapter, we introduce greater discrimi-
nation into that description. Unquestionably, the late twentieth cen-
tury has seen profound changes in the structure of the family. Rut it is
easy to misperceive what is going on. The differences across socioeco-
nomic classes are large, and they reflect important differences by cog-
nitive class as well.
MARRIAGE
Marriage is a fundamental building block of social life and society itself
and thus is a good place to start, because this is one area where much
has changed and little has changed, depending on the vantage point
one takes.
From a demographic perspective, the changes are huge, as shown in
the next figure. The marriage rate since the 1920s has been volatile, but
the valleys and ~ e a k s
in the figure have explanations that do not nec-
essarily involve the underlying propensity to many. The Great Depres-
sion probably had a lot to do with the valley in the early 1930s, and
World War I1 not only had a lot to do with the spike in the late 1940s
but may well have had reverberations on the marriage rate that lasted
into the 1950s. It could even be argued that once these disruptive events
are taken into account, the underlying propensity to marry did not
change from 1930 to the early 1970s. The one prolonged decline for
which there is no obvious explanation except a change in the propen-
sity to marry began in 1973, when marriage rates per 1,000 women be-
gan dropping and have been dropping ever since, in good years and bad.
In 1987, the nation passed a landmark: Marriage rates hit an all-time
low, dropping below the previous mark set in the depths of the depres-
sion. A new record was promptly set again in 1988.
This change, apparently reflecting some bedrock shifts in attitudes
toward marriage in postindustrial societies, may have profound signifi-
In the early 1970s, the marriage rate began a
prolonged decline for no immediately apparent reason
Marriages per 1,000 women
120-
The Great
ends
Sou~ces: U.S. Rureau of the Census, 1975, Tahle 8214-215; SAUS, 1992, Tahle 127, and
comparable tahles In various editions.
cance. And yet marriage is still alive and well in the sense that it re-
mains a hugely popular institution. Over 90 percent of Americans of
both sexes have married by the time they reach their 40s.'
Marriage and IQ
What does cognitive ability have to do with marriage, and is there any
reason to think that it could be interacting with society's declining
propensity to marry?
We know from work by Robert Retherford that in premodern soci-
eties the wealthy and successful married at younger ages than the poor
and underprivileged.' Retherford further notes that intelligence and so-
cial status are correlated wherever they have been examined; hence, we
can assume that intelligence-via
social status-facilitated
marriage in
premodern societies,
With the advent of modernity, however, this relationship flips over.
Throughout the West since the nineteenth century, people in the more
Cognitive Ability and Marriage Trends
- Since 1973, marriage rates in the United States have entered a prolonged decline, eventually dropping below the record lows of the Great Depression.
- Despite declining rates, marriage remains a popular institution with over 90 percent of Americans marrying by their 40s.
- The historical relationship between status and marriage has flipped; while the wealthy once married earlier, modernity has led the privileged to marry later or not at all.
- High cognitive ability is increasingly associated with a 'new tribe' of single professionals, including career-focused women and men who avoid traditional commitments.
- Individuals at the lowest end of the IQ distribution also face lower marriage rates due to disadvantages in competing for partners.
- Data suggests that public and media perceptions of family life often diverge from the statistical reality of marriage ages and rates.
The intelligent professional woman is the most visible of this new tribe, rising in her career, too busy for, or not interested in, marriage and children.
168
Cognitive Chses and Social Behavior
Family Matters
169
T
he conventional understanding of troubles in the American fam-
ily has several story lines. The happily married couple where the
husband works and the wife stays home with the children is said to be
as outmoded as the bustle. Large proportions of young people are stay-
ing single. Half the marriages end in divorce. Out-of-wedlock births are
soaring.
These features of modem families are usually discussed in the media
(and often in academic presentations) as if they were spread more or less
evenly across society.ll' In this chapter, we introduce greater discrimi-
nation into that description. Unquestionably, the late twentieth cen-
tury has seen profound changes in the structure of the family. Rut it is
easy to misperceive what is going on. The differences across socioeco-
nomic classes are large, and they reflect important differences by cog-
nitive class as well.
MARRIAGE
Marriage is a fundamental building block of social life and society itself
and thus is a good place to start, because this is one area where much
has changed and little has changed, depending on the vantage point
one takes.
From a demographic perspective, the changes are huge, as shown in
the next figure. The marriage rate since the 1920s has been volatile, but
the valleys and ~ e a k s
in the figure have explanations that do not nec-
essarily involve the underlying propensity to many. The Great Depres-
sion probably had a lot to do with the valley in the early 1930s, and
World War I1 not only had a lot to do with the spike in the late 1940s
but may well have had reverberations on the marriage rate that lasted
into the 1950s. It could even be argued that once these disruptive events
are taken into account, the underlying propensity to marry did not
change from 1930 to the early 1970s. The one prolonged decline for
which there is no obvious explanation except a change in the propen-
sity to marry began in 1973, when marriage rates per 1,000 women be-
gan dropping and have been dropping ever since, in good years and bad.
In 1987, the nation passed a landmark: Marriage rates hit an all-time
low, dropping below the previous mark set in the depths of the depres-
sion. A new record was promptly set again in 1988.
This change, apparently reflecting some bedrock shifts in attitudes
toward marriage in postindustrial societies, may have profound signifi-
In the early 1970s, the marriage rate began a
prolonged decline for no immediately apparent reason
Marriages per 1,000 women
120-
The Great
ends
Sou~ces: U.S. Rureau of the Census, 1975, Tahle 8214-215; SAUS, 1992, Tahle 127, and
comparable tahles In various editions.
cance. And yet marriage is still alive and well in the sense that it re-
mains a hugely popular institution. Over 90 percent of Americans of
both sexes have married by the time they reach their 40s.'
Marriage and IQ
What does cognitive ability have to do with marriage, and is there any
reason to think that it could be interacting with society's declining
propensity to marry?
We know from work by Robert Retherford that in premodern soci-
eties the wealthy and successful married at younger ages than the poor
and underprivileged.' Retherford further notes that intelligence and so-
cial status are correlated wherever they have been examined; hence, we
can assume that intelligence-via
social status-facilitated
marriage in
premodern societies,
With the advent of modernity, however, this relationship flips over.
Throughout the West since the nineteenth century, people in the more
170
Cognitive Classes and Social Behavior
Family Matters
17 1
privileged sector of society have married later and at lower rates than
the less privileged. We examine the demographic implications of this
phenomenon in Chapter 15. For now, the implication is that in late-
twentieth-century America, we should expect to find lower marriage
rates among the highly intelligent in the NLSY.
Everyday experience bears out this finding for people who live in aca-
demic communities or professional circles, where they see many smart
men and women in their 30s and 40s who are still single and look as if
they might stay that way forever. The intelligent professional woman is
the most visible of this new tribe, rising in her career, too busy for, or
not interested in, marriage and children. Among men, other images
have recently hecome part of the culture: the intelligent, successful, and
unmarried heterosexual male who cannot make a commitment and the
intelligent, successful, and unmarried homosexual male who no longer
needs to go through the motions of a marriage.
At the other end of the scale, there are similar reasons in research
and common sense to suggest that marriage rates will tend to be low
among people at the very bottom of the IQ di~tribution.~
For a numher
of reasons, having to do with everything from initiative to romance to
economics, people with very low IQs are likely to he at a disadvantage
in competing for marriage partners.
Our first look at the NLSY data conforms to these expectations,
though not dramatically. The next table shows the situation for the
NLSY sample among whites who had reached the age of 30. There were
surprises in these results for us, and perhaps for some of our readers. We
would not have guessed that the average age of marriage for people in
the top 5 percent of the intelligence distribution was only 25, for ex-
ample.'51 A main point of the table is to introduce the theme threaded
throughout the chapter: Our, your, and the media's impressions of the
state of the American family are not necessarily accurate.
The Role of Socioeconomic Background
Note in the table below that marriage percentages are highest for peo-
ple in the middle of the intelligence distribution and taper off on both
ends. The same is true, though less dramatically, if the table is con-
structed by socioeconomic class: The percentage of whites who had mar-
ried before the age of 30 declines at both extremes. Furthermore, we
have good reasons for thinking that this pattern is not a sampling fluke
Which Whites Get Married When?
Percentage who
Had Ever Married
Average Age at
Before Age 30
Cognitive Class
First Marriage
6 7
I Very bright
25.4
7 2
I1 Bright
24.3
8 1
111 Normal
22.9
8 1
IV Dull
21.5
7 2
V Very dull
21.3
7 8
Overall averages
22.1
but reflects underlying dynamics of marriage. This pattern makes inter-
preting regression results tricky, because the regression techniques we
are using compute the lines in the graphs based on the assumption that
the lines are not trying to make U-turns. For the record: When we run
the standard initial analysis incorporating IQ, age, and socioeconomic
status as predictors of marriage, IQ has no significant independent role;
there is a slight, statistically insignificant downward probability of mar-
riage as 1Q goes up. Socioeconomic background has a much larger sup-
pressive role on marriage: The richer and better educated your parents,
the less likely you are to marry, according to these results, which, again,
must be interpreted cautiously.
The Role of Education
The real culprit in explaining marriage rates in a young population is
education. In the rest of the chapters of Part 11, we point out many in-
stances in which taking education into account does not much affect
1Q's independent role. Not so with marriage. When we take education
into account, the apparent relationship reverses: The probability of mar-
rying goes up, not down, for people with high IQs-a
result found in
other databases as
Our standard analysis with the two educational
samples, high school graduates (no more and no less) and college grad-
uates (no more and no less) elucidates this finding.
The figure shows that neither IQ nor socioeconomic hackground was
important in determining marriage for the college sample. In sharp con-
Intelligence, Education, and Marriage Trends
- Marriage rates among whites follow a bell-shaped curve relative to intelligence, with the highest rates found in the middle of the IQ distribution.
- Standard regression analysis initially suggests that IQ has no significant independent role in marriage probability, while high socioeconomic status appears to suppress it.
- Education is identified as the primary variable that complicates the relationship between cognitive ability and marriage rates.
- When controlling for education, high IQ actually increases the probability of marriage, particularly among high school graduates where the likelihood jumps from 60% to 89% across the IQ spectrum.
- The data reveals a 'divorce revolution' starting in the mid-1960s, marking a cataclysmic shift from the historical stability of American marriages.
The real culprit in explaining marriage rates in a young population is education.
170
Cognitive Classes and Social Behavior
Family Matters
17 1
privileged sector of society have married later and at lower rates than
the less privileged. We examine the demographic implications of this
phenomenon in Chapter 15. For now, the implication is that in late-
twentieth-century America, we should expect to find lower marriage
rates among the highly intelligent in the NLSY.
Everyday experience bears out this finding for people who live in aca-
demic communities or professional circles, where they see many smart
men and women in their 30s and 40s who are still single and look as if
they might stay that way forever. The intelligent professional woman is
the most visible of this new tribe, rising in her career, too busy for, or
not interested in, marriage and children. Among men, other images
have recently hecome part of the culture: the intelligent, successful, and
unmarried heterosexual male who cannot make a commitment and the
intelligent, successful, and unmarried homosexual male who no longer
needs to go through the motions of a marriage.
At the other end of the scale, there are similar reasons in research
and common sense to suggest that marriage rates will tend to be low
among people at the very bottom of the IQ di~tribution.~
For a numher
of reasons, having to do with everything from initiative to romance to
economics, people with very low IQs are likely to he at a disadvantage
in competing for marriage partners.
Our first look at the NLSY data conforms to these expectations,
though not dramatically. The next table shows the situation for the
NLSY sample among whites who had reached the age of 30. There were
surprises in these results for us, and perhaps for some of our readers. We
would not have guessed that the average age of marriage for people in
the top 5 percent of the intelligence distribution was only 25, for ex-
ample.'51 A main point of the table is to introduce the theme threaded
throughout the chapter: Our, your, and the media's impressions of the
state of the American family are not necessarily accurate.
The Role of Socioeconomic Background
Note in the table below that marriage percentages are highest for peo-
ple in the middle of the intelligence distribution and taper off on both
ends. The same is true, though less dramatically, if the table is con-
structed by socioeconomic class: The percentage of whites who had mar-
ried before the age of 30 declines at both extremes. Furthermore, we
have good reasons for thinking that this pattern is not a sampling fluke
Which Whites Get Married When?
Percentage who
Had Ever Married
Average Age at
Before Age 30
Cognitive Class
First Marriage
6 7
I Very bright
25.4
7 2
I1 Bright
24.3
8 1
111 Normal
22.9
8 1
IV Dull
21.5
7 2
V Very dull
21.3
7 8
Overall averages
22.1
but reflects underlying dynamics of marriage. This pattern makes inter-
preting regression results tricky, because the regression techniques we
are using compute the lines in the graphs based on the assumption that
the lines are not trying to make U-turns. For the record: When we run
the standard initial analysis incorporating IQ, age, and socioeconomic
status as predictors of marriage, IQ has no significant independent role;
there is a slight, statistically insignificant downward probability of mar-
riage as 1Q goes up. Socioeconomic background has a much larger sup-
pressive role on marriage: The richer and better educated your parents,
the less likely you are to marry, according to these results, which, again,
must be interpreted cautiously.
The Role of Education
The real culprit in explaining marriage rates in a young population is
education. In the rest of the chapters of Part 11, we point out many in-
stances in which taking education into account does not much affect
1Q's independent role. Not so with marriage. When we take education
into account, the apparent relationship reverses: The probability of mar-
rying goes up, not down, for people with high IQs-a
result found in
other databases as
Our standard analysis with the two educational
samples, high school graduates (no more and no less) and college grad-
uates (no more and no less) elucidates this finding.
The figure shows that neither IQ nor socioeconomic hackground was
important in determining marriage for the college sample. In sharp con-
172
Cognitive Clarses and Social Behavior
High IQ raises the probability of marriage for the white high school
sample, while high socioeconomic background lowers it
Probability of marriage by age 30
100% -
904h -
AS parental SES goes from low to high
80% -
The college
60%-
As IQ goes from low to high
1
I
I
I
I
Very low
Very high
(-2 SDs)
(+2 SDs)
Note: For computing the plot, age, and either SES (for the hlack curves) or 1Q (for the gray
curves) were set at their mean values.
trast, IQ made a significant difference in the high school sample. A high
school graduate from an average socioeconomic background who was at
the bottom of the IQ distribution (2 standard deviations below the
mean) had a 60 percent chance of having married. A high school
graduate at the top of the IQ distribution had an 89 percent chance of
having married. Meanwhile, the independent role of socioeconomic
status in the high school sample was either slightly negative or nil (the
downward slope is not statistically significant).
DIVORCE
People marry, but do they stay married? Here is where the change has
been not only dramatic but, some would say, cataclysmic, as shown be-
low, In 1920, only death parted husbands and wives in about 82 percent
of marriages and, in any given year (the datum shown in the next
figure below), only about 8 out of 1,000 married females experienced a
divorce. As late as 1964, despite the sweeping changes in technology,
Family Matters
173
T h e divorce revolution
Divorces per 1,000 women
E
25 -
... 1965-79
Trendlines established in ...
20 -
Sources: U.S. Bureau of the Census, 1975, Tahle B2 14-21 5; SAUS, 1992, Tahle 127, and
comp;~r;lhle table in various editions.
wealth, and social life that had occurred in the intervening forty-four
years, the number was very little changed: 10 of every 1,000. The peak
divorce rates just fc~llowing World War I1 had fully subsided, and the di-
vorce rate still lay upon a trendline established hetween 1920 and 1940.
Then came the revolution. The steep upward sweep of the divorce
rate from the mid-1960s through the end of the 1970s represents one of
the most rapid, compressed changes in a basic social behavior that the
twentieth century has witnessed. When the divorce rate hit its peak at
the end of the 1970s, a marriage had more than a fifty-fifty chance of
ending in divorce.' Despite a downward trend since 1980, divorce re-
mains at twice the annual rate of the mid-1960s.
Divmce and IQ
We do not attempt to explain this profound change in our lives, which
no doubt has roots in changing mores, changing laws, changing roles of
women, changing labor markets, and who knows what else. Instead, we
address the narrow question: How does divorce currently correlate with
intelligence?
Intelligence and Divorce Trends
- The divorce rate underwent a massive 'revolution' from the mid-1960s to the late 1970s, doubling the rates seen in previous decades.
- Statistical data suggests a correlation between cognitive ability and marital stability, particularly within the first five years of marriage.
- Individuals in the highest cognitive class are significantly more likely to remain married than those in the bottom three-quarters of the distribution.
- The protective effect of intelligence against divorce is most pronounced at the top of the IQ scale, while rates remain similar across the lower three-quarters.
- Socioeconomic background and IQ have opposite effects: higher parental status actually correlates with a higher likelihood of early divorce when IQ is held constant.
The steep upward sweep of the divorce rate from the mid-1960s through the end of the 1970s represents one of the most rapid, compressed changes in a basic social behavior that the twentieth century has witnessed.
172
Cognitive Clarses and Social Behavior
High IQ raises the probability of marriage for the white high school
sample, while high socioeconomic background lowers it
Probability of marriage by age 30
100% -
904h -
AS parental SES goes from low to high
80% -
The college
60%-
As IQ goes from low to high
1
I
I
I
I
Very low
Very high
(-2 SDs)
(+2 SDs)
Note: For computing the plot, age, and either SES (for the hlack curves) or 1Q (for the gray
curves) were set at their mean values.
trast, IQ made a significant difference in the high school sample. A high
school graduate from an average socioeconomic background who was at
the bottom of the IQ distribution (2 standard deviations below the
mean) had a 60 percent chance of having married. A high school
graduate at the top of the IQ distribution had an 89 percent chance of
having married. Meanwhile, the independent role of socioeconomic
status in the high school sample was either slightly negative or nil (the
downward slope is not statistically significant).
DIVORCE
People marry, but do they stay married? Here is where the change has
been not only dramatic but, some would say, cataclysmic, as shown be-
low, In 1920, only death parted husbands and wives in about 82 percent
of marriages and, in any given year (the datum shown in the next
figure below), only about 8 out of 1,000 married females experienced a
divorce. As late as 1964, despite the sweeping changes in technology,
Family Matters
173
T h e divorce revolution
Divorces per 1,000 women
E
25 -
... 1965-79
Trendlines established in ...
20 -
Sources: U.S. Bureau of the Census, 1975, Tahle B2 14-21 5; SAUS, 1992, Tahle 127, and
comp;~r;lhle table in various editions.
wealth, and social life that had occurred in the intervening forty-four
years, the number was very little changed: 10 of every 1,000. The peak
divorce rates just fc~llowing World War I1 had fully subsided, and the di-
vorce rate still lay upon a trendline established hetween 1920 and 1940.
Then came the revolution. The steep upward sweep of the divorce
rate from the mid-1960s through the end of the 1970s represents one of
the most rapid, compressed changes in a basic social behavior that the
twentieth century has witnessed. When the divorce rate hit its peak at
the end of the 1970s, a marriage had more than a fifty-fifty chance of
ending in divorce.' Despite a downward trend since 1980, divorce re-
mains at twice the annual rate of the mid-1960s.
Divmce and IQ
We do not attempt to explain this profound change in our lives, which
no doubt has roots in changing mores, changing laws, changing roles of
women, changing labor markets, and who knows what else. Instead, we
address the narrow question: How does divorce currently correlate with
intelligence?
1 74
Cognitive Classes and Social Behavior
Family Matters
175
There are plausible reasons for expecting that cognitive ability will
have an impact on divorce. For example, one may hypothesize that
bright people less often marry on a whim, hence they have fewer disas-
trous short marriages. Bright people are perhaps less likely to act on im-
pulse when the marriage has problems, hence are less likely to divorce
precipitously during the first years of marriage. More generally, it may be
argued that brighter people are better able to work out differences that
might otherwise eventually destroy a marriage. We are, of course, refer-
ring to statistical tendencies for which individual exceptions abound.
Within the confines of the NLSY experience, these expectations are
borne out to some degree, as shown in the tahle. The results are based
Which Whites Get Divorced When?
Percentage Divorced in First
Cognitive Class
Five Years of Marriage
1 Very bright
9
11 Bright
15
111 Normal
2 3
IV Dull
2 2
V Very dull
2 1
Overall averages
20
on the first five years of marriage. Those in Class 1 were ten times ils
likely to stay married for at least five years as to get divorced; for those
in Classes 111, IV, and V-the
bottom three-quarters of the population-
the ratio of marital survival to divorce for at least five years was only 3.5
to 1 .I" Virtually all of the effect of IQ seems to have been concentrated
at the top of the distribution. The divorce rates across the bottom three-
quarters of the cognitive ability distribution were essentially identical.
The Role of Socioeconomic Background
Do these findings hold up when we begin to add in other considera-
tions? The figure below shows the results for the white sample who had
been married at least five years.'y' The consistent finding, represented
fairly by the figure, was that higher IQ was still associated with a lower
probability of divorce after extracting the effects of other variables, and
parental SES had a significant positive relationship to divorce-that
is,
IQ and socioeconomic background have opposite effects on the
likelihood of an early divorce among young whites
-- -
Probability of divorce in the first five years of mamage
40% -
As IQ goes from low to high
30% -
20%- -
10%-
As parental SES goes
from low to high
Very low
(-2 SDs)
Very high
(+2 SDs)
Note: In addition to IQ, age, and parental SES, the independent variahles included date of
first mxriage. For computing the plot, age, date of first marriage, and either SES (for the
hlack curve) or IQ (for the gray curve) were set at rheir mean values.
IQ being equal, children of higher-status families were more likely to
get divorced than children of lower-status
The Role of Education
It is clear to all researchers who examine the data that higher education
is associated with lower levels of divorce. This was certainly true of the
NLSY, where the college sample (persons with a bachelor's degree, no
more and no less) had a divorce rate in the first five years of marriage
that was less than half that of the high school sample: 7 percent com-
pared to 19 percent. But this raw outcome is deceptive." Holding some
critical other things equal-IQ,
socioeconomic status, age, and date of
marriage-the
divorce rate for the high school graduates in the first five
years of marriage was lower than for college graduates.
Cognitive Ability and Marital Stability
- Raw data suggests college graduates have lower divorce rates, but when controlling for IQ and age, high school graduates actually show higher stability in early marriage.
- IQ has a significantly stronger protective effect against divorce for college graduates than for high school graduates.
- Growing up in a broken home increases the risk of divorce, though the statistical impact is less pronounced than cognitive ability in this specific sample.
- The presence of two biological parents in the childhood home remains the most favorable predictor for a child's future marital stability.
- Many socioeconomic risk factors for divorce, such as low income or unemployment, are highly correlated with and often secondary to cognitive ability.
- The study focuses on the first five years of marriage, noting that long-term trends for this generation are still unfolding.
For them, the probability of divorce in the first five years plunged from 28 percent for someone with an IQ of 100 to 9 percent for someone with an IQ of 130.
1 74
Cognitive Classes and Social Behavior
Family Matters
175
There are plausible reasons for expecting that cognitive ability will
have an impact on divorce. For example, one may hypothesize that
bright people less often marry on a whim, hence they have fewer disas-
trous short marriages. Bright people are perhaps less likely to act on im-
pulse when the marriage has problems, hence are less likely to divorce
precipitously during the first years of marriage. More generally, it may be
argued that brighter people are better able to work out differences that
might otherwise eventually destroy a marriage. We are, of course, refer-
ring to statistical tendencies for which individual exceptions abound.
Within the confines of the NLSY experience, these expectations are
borne out to some degree, as shown in the tahle. The results are based
Which Whites Get Divorced When?
Percentage Divorced in First
Cognitive Class
Five Years of Marriage
1 Very bright
9
11 Bright
15
111 Normal
2 3
IV Dull
2 2
V Very dull
2 1
Overall averages
20
on the first five years of marriage. Those in Class 1 were ten times ils
likely to stay married for at least five years as to get divorced; for those
in Classes 111, IV, and V-the
bottom three-quarters of the population-
the ratio of marital survival to divorce for at least five years was only 3.5
to 1 .I" Virtually all of the effect of IQ seems to have been concentrated
at the top of the distribution. The divorce rates across the bottom three-
quarters of the cognitive ability distribution were essentially identical.
The Role of Socioeconomic Background
Do these findings hold up when we begin to add in other considera-
tions? The figure below shows the results for the white sample who had
been married at least five years.'y' The consistent finding, represented
fairly by the figure, was that higher IQ was still associated with a lower
probability of divorce after extracting the effects of other variables, and
parental SES had a significant positive relationship to divorce-that
is,
IQ and socioeconomic background have opposite effects on the
likelihood of an early divorce among young whites
-- -
Probability of divorce in the first five years of mamage
40% -
As IQ goes from low to high
30% -
20%- -
10%-
As parental SES goes
from low to high
Very low
(-2 SDs)
Very high
(+2 SDs)
Note: In addition to IQ, age, and parental SES, the independent variahles included date of
first mxriage. For computing the plot, age, date of first marriage, and either SES (for the
hlack curve) or IQ (for the gray curve) were set at rheir mean values.
IQ being equal, children of higher-status families were more likely to
get divorced than children of lower-status
The Role of Education
It is clear to all researchers who examine the data that higher education
is associated with lower levels of divorce. This was certainly true of the
NLSY, where the college sample (persons with a bachelor's degree, no
more and no less) had a divorce rate in the first five years of marriage
that was less than half that of the high school sample: 7 percent com-
pared to 19 percent. But this raw outcome is deceptive." Holding some
critical other things equal-IQ,
socioeconomic status, age, and date of
marriage-the
divorce rate for the high school graduates in the first five
years of marriage was lower than for college graduates.
176
Cognitive Classes and Socd Behavior
Family Matters
1 7 7
For whom did IQ make more difference: the high school sample or
the college sample? The answer is the college sample, by far. For them,
the probability of divorce in the first five years plunged from 28 percent
for someone with an IQ of 100 to 9 percent for someone with an IQ of
130. The much more minor effect of lQ among high school graduates
was not statistically significant."21
Do Broken Families Beget Broken Families?
One other cause of divorce is mentioned so commonly that it requires
exploration: a broken home in the preceding generation. The children
of divorced parents have an elevated risk themselves of getting di-
vorced.'' It is not hard to think of reasons why: They have not witnessed
how a successful marriage works, they are more likely to see divorce as
an acceptable alternative, the turbulence of a failing marriage leaves
psychological scars, and so forth.'l4'
None of these reasons has an obvious connection with cognitive abil-
ity. They could be valid without necessarily affecting the independent
prophylactic role that being smart plays in preventing (or perhaps sim-
ply delaying) divorce. And so indeed it worked out in the NLSY. Given
a young person of average IQ and socioeconomic background, the proh-
ability of divorce within the first five years of marriage was lowest for
those who at age 14 had been living with both parents (20 percent), a
bit higher for those who had been living with a remarried parent (22
percent), and higher still for those living with an un-remarried or never-
married mother (25 percent)."51 These are not large effects, however,
and are not significant in a statistical sense. We can say only that the
results supported the general proposition that, when it comes to raising
children who will themselves stay married, two adults as parents are gen-
erally better than one and that two biological parents in the household
are better than one or none. But it is worth noting that the introduc-
tion of these variables did nothing to change the importance of the rest
of the variables. Higher cognitive ability conferred just about as much
protection from, and higher status just as much risk for, divorce as in the
preceding analyses.
The NLSY gives us a window on the early years of marriage, though not
necessarily about marriage as a whole. Based on national divorce rates,
we know that most of the divorces that the members of the NLSY will
experience have yet to occur. We will have to wait and see what hap-
pens to the NLSY sample in later years.
One final point about the divorce results is worth noting, however.
These findings may help explain the common observation that divorce
is less likely when the husband has high education, income, or socio-
economic status or that marriages are more likely to fall apart if they
start when the couple is afflicted with unemployment.'6 If we had
showed a hreakdown of divorce rates in the NLSY by social and eco-
nomic measures alone, we too would have shown such effects. But each
of those variables is correlated with cognitive ability, and the studies
that examine them almost never include an independent measure of in-
telligence per se. Some portion of what has so often been observed about
the risk factors for divorce turns out to be more narrowly the result of
low cognitive ability.
ILLEGITIMACY
Childbearing touches on one of the most sensitive topics in the study
of intelligence and its social consequences: fertility patterns among the
smart and the dumb, and their possible long-term effects on the intel-
lectual capital of a nation's population. W e devote a full chapter to this
topic (Chapter 15) in the portion of the book dealing with the national,
multiracial perspective. In this chapter, the focus is on family problems,
and one of the leading current problems is the failure of two-parent fam-
ilies to form in the first place, as denoted by births to single women-
illegitimacy.
We use the older term "illegitimacy" in favor of the phrases currently
in favor, "out-of-wedlock births" or "births to single women," because
we think that, in the long run, the word illegitimacy will prove to be
the right one. We are instructed in this by the anthropologist Bronis-
law Malinowski. In his research early in the century, Malinowski ob-
served a constant running throughout the rich diversity of human
cultures and indeed throughout history. H e decided that this amounted
to "a universal sociological law" and called it the "principle of legiti-
macy." No matter what the culture might be, "there runs the rule that
the father is indispensable for the full sociological status of the child as
well as of the mother, that the group consisting of a woman and her off-
spring is sociologically incomplete and illegitimate."" The rule applied
alike to East or West, primitive cultures or advanced ones, cultures
The Illegitimacy Revolution
- The authors explore the relationship between intelligence and social consequences, specifically focusing on fertility patterns and the decline of the two-parent family.
- They defend the use of the term 'illegitimacy' by citing anthropologist Bronislaw Malinowski’s 'principle of legitimacy,' which posits that a father is sociologically indispensable to a child's status.
- Statistical data shows a dramatic shift in American birth patterns, where out-of-wedlock births rose from under 3 percent in 1920 to 30 percent by 1991.
- The growth of the unmarried mother population has been exponential, with the number of never-married mothers increasing fortyfold between 1960 and 1990.
- The text suggests that while IQ is likely a factor in these trends, the rapid pace of social change indicates that other environmental or cultural factors are also at play.
No matter what the culture might be, 'there runs the rule that the father is indispensable for the full sociological status of the child as well as of the mother, that the group consisting of a woman and her offspring is sociologically incomplete and illegitimate.'
176
Cognitive Classes and Socd Behavior
Family Matters
1 7 7
For whom did IQ make more difference: the high school sample or
the college sample? The answer is the college sample, by far. For them,
the probability of divorce in the first five years plunged from 28 percent
for someone with an IQ of 100 to 9 percent for someone with an IQ of
130. The much more minor effect of lQ among high school graduates
was not statistically significant."21
Do Broken Families Beget Broken Families?
One other cause of divorce is mentioned so commonly that it requires
exploration: a broken home in the preceding generation. The children
of divorced parents have an elevated risk themselves of getting di-
vorced.'' It is not hard to think of reasons why: They have not witnessed
how a successful marriage works, they are more likely to see divorce as
an acceptable alternative, the turbulence of a failing marriage leaves
psychological scars, and so forth.'l4'
None of these reasons has an obvious connection with cognitive abil-
ity. They could be valid without necessarily affecting the independent
prophylactic role that being smart plays in preventing (or perhaps sim-
ply delaying) divorce. And so indeed it worked out in the NLSY. Given
a young person of average IQ and socioeconomic background, the proh-
ability of divorce within the first five years of marriage was lowest for
those who at age 14 had been living with both parents (20 percent), a
bit higher for those who had been living with a remarried parent (22
percent), and higher still for those living with an un-remarried or never-
married mother (25 percent)."51 These are not large effects, however,
and are not significant in a statistical sense. We can say only that the
results supported the general proposition that, when it comes to raising
children who will themselves stay married, two adults as parents are gen-
erally better than one and that two biological parents in the household
are better than one or none. But it is worth noting that the introduc-
tion of these variables did nothing to change the importance of the rest
of the variables. Higher cognitive ability conferred just about as much
protection from, and higher status just as much risk for, divorce as in the
preceding analyses.
The NLSY gives us a window on the early years of marriage, though not
necessarily about marriage as a whole. Based on national divorce rates,
we know that most of the divorces that the members of the NLSY will
experience have yet to occur. We will have to wait and see what hap-
pens to the NLSY sample in later years.
One final point about the divorce results is worth noting, however.
These findings may help explain the common observation that divorce
is less likely when the husband has high education, income, or socio-
economic status or that marriages are more likely to fall apart if they
start when the couple is afflicted with unemployment.'6 If we had
showed a hreakdown of divorce rates in the NLSY by social and eco-
nomic measures alone, we too would have shown such effects. But each
of those variables is correlated with cognitive ability, and the studies
that examine them almost never include an independent measure of in-
telligence per se. Some portion of what has so often been observed about
the risk factors for divorce turns out to be more narrowly the result of
low cognitive ability.
ILLEGITIMACY
Childbearing touches on one of the most sensitive topics in the study
of intelligence and its social consequences: fertility patterns among the
smart and the dumb, and their possible long-term effects on the intel-
lectual capital of a nation's population. W e devote a full chapter to this
topic (Chapter 15) in the portion of the book dealing with the national,
multiracial perspective. In this chapter, the focus is on family problems,
and one of the leading current problems is the failure of two-parent fam-
ilies to form in the first place, as denoted by births to single women-
illegitimacy.
We use the older term "illegitimacy" in favor of the phrases currently
in favor, "out-of-wedlock births" or "births to single women," because
we think that, in the long run, the word illegitimacy will prove to be
the right one. We are instructed in this by the anthropologist Bronis-
law Malinowski. In his research early in the century, Malinowski ob-
served a constant running throughout the rich diversity of human
cultures and indeed throughout history. H e decided that this amounted
to "a universal sociological law" and called it the "principle of legiti-
macy." No matter what the culture might be, "there runs the rule that
the father is indispensable for the full sociological status of the child as
well as of the mother, that the group consisting of a woman and her off-
spring is sociologically incomplete and illegitimate."" The rule applied
alike to East or West, primitive cultures or advanced ones, cultures
178
Cognitive Classes and Social Behavior
Family Matters
1 79
where premarital sex was accepted or banned, where children were con-
sidered an asset or a burden, where fathers could have one wife or many.
Despite our faith that Malinowski was observing something that will
once again be considered true about human societies, the contemporary
Western democracies, including the United States, seem intent on
proving Malinowski wrong, as shown in the next figure.
The illegitimacy revolution
Percentage of children born out of wedlock
30 -
lo-
Trendlines established in ...
52
5 -
Sources: Various editions of the Natality volume of Vim1 Statistics, compiled annually hy the
Puhlic Health Service.
In the seventy-one years from 1920 to 1990, the proportion of chil-
dren born to single women in the United States went from less than 3
percent, roughly where it had been throughout American history, to 30
It would have been about 6 percent had the trendline es-
tablished from 1920 to 1952 remained unchanged. The trendline shifted
upward during the 1950s, but not dramatically. If we had maintained
the trendline established from 1952 to 1963, the United States would
have had about 11 percent of births out of wedlock in 1991. Instead, the
figure was 30 percent, the result of a steep, sustained increase that gath-
ered steam in the mid-1960s and continued into the early 2990s. The
increase for the most recent available year, 1991, was one of the largest
in history. There are no signs as we write that illegitimacy is reaching
an asymptote.
Anyone who is trying to understand social trends must also realize
that the magic of compound interest has created an even more explo-
sive rise in the population of unmarried mothers and children. In 1960,
for example, there were just 73,000 never-married mothers between the
ages of 18 and 34. In 1980, there were 1.0 million."91 In 1990, there were
approximately 2.9 mi1li0n.l~~~
Thus the illegitimacy ratio increased by
sixfold from 1960 to 1990-bad
enough-but
the number of never-
married mothers increased fortyfold. From just 1980 to 1990, while the
illegitimacy ratio was increasing by half, the number of unmarried moth-
ers almost tripled.
Illegitimacy and IQ
If IQ is a factor in illegitimacy, as we will conclude it is, it must be in
combination with other things (as common sense would suggest), be-
cause IQ itself has not changed nearly enough in recent years to account
for the explosive growth in
But we will also be explor-
ing the possibility that some of these "other things" that have changed
in the last three decades-broken
homes and the welfare system being
prime suspects-interact
with intelligence, making it still more likely
than before that a woman of low cognitive ability will have a baby out
of wedlock.
Among other reasons that cognitive ability may be related to illegit-
imacy, we have this causal model in mind: The smarter a woman is, the
more likely that she deliberately decides to have a child and calculates
the best time to do it. The less intelligent the woman is, the more likely
that she does not think ahead from sex to procreation, does not re-
member to use birth control, does not carefully consider when and un-
der what circumstances she should have a child. How intelligent a
woman is may interact with her impulsiveness, and hence her ability to
exert self-discipline and restraint on her partner in order to avoid preg-
nancy. The result is a direct and strong relationship between high in-
telligence and the likelihood that a child is conceived after marriage,
and between low intelligence and the likelihood that the child will be
born out of wedlock.
Intelligence and Illegitimacy
- The text explores the correlation between low cognitive ability and the likelihood of a woman having a child out of wedlock.
- A causal model is proposed where higher intelligence leads to deliberate family planning, while lower intelligence may correlate with impulsiveness and a lack of foresight regarding procreation.
- Statistical data presented shows a stark disparity: only 2% of 'Very bright' white women had an illegitimate child compared to 32% of 'Very dull' women.
- The authors argue that conceiving within marriage is the objectively 'intelligent' choice for the well-being of the child and society.
- The data suggests that illegitimacy is conspicuously concentrated in the lowest cognitive groups, with the proportion of illegitimate first births rising significantly as IQ scores decrease.
The less intelligent the woman is, the more likely that she does not think ahead from sex to procreation, does not remember to use birth control, does not carefully consider when and under what circumstances she should have a child.
178
Cognitive Classes and Social Behavior
Family Matters
1 79
where premarital sex was accepted or banned, where children were con-
sidered an asset or a burden, where fathers could have one wife or many.
Despite our faith that Malinowski was observing something that will
once again be considered true about human societies, the contemporary
Western democracies, including the United States, seem intent on
proving Malinowski wrong, as shown in the next figure.
The illegitimacy revolution
Percentage of children born out of wedlock
30 -
lo-
Trendlines established in ...
52
5 -
Sources: Various editions of the Natality volume of Vim1 Statistics, compiled annually hy the
Puhlic Health Service.
In the seventy-one years from 1920 to 1990, the proportion of chil-
dren born to single women in the United States went from less than 3
percent, roughly where it had been throughout American history, to 30
It would have been about 6 percent had the trendline es-
tablished from 1920 to 1952 remained unchanged. The trendline shifted
upward during the 1950s, but not dramatically. If we had maintained
the trendline established from 1952 to 1963, the United States would
have had about 11 percent of births out of wedlock in 1991. Instead, the
figure was 30 percent, the result of a steep, sustained increase that gath-
ered steam in the mid-1960s and continued into the early 2990s. The
increase for the most recent available year, 1991, was one of the largest
in history. There are no signs as we write that illegitimacy is reaching
an asymptote.
Anyone who is trying to understand social trends must also realize
that the magic of compound interest has created an even more explo-
sive rise in the population of unmarried mothers and children. In 1960,
for example, there were just 73,000 never-married mothers between the
ages of 18 and 34. In 1980, there were 1.0 million."91 In 1990, there were
approximately 2.9 mi1li0n.l~~~
Thus the illegitimacy ratio increased by
sixfold from 1960 to 1990-bad
enough-but
the number of never-
married mothers increased fortyfold. From just 1980 to 1990, while the
illegitimacy ratio was increasing by half, the number of unmarried moth-
ers almost tripled.
Illegitimacy and IQ
If IQ is a factor in illegitimacy, as we will conclude it is, it must be in
combination with other things (as common sense would suggest), be-
cause IQ itself has not changed nearly enough in recent years to account
for the explosive growth in
But we will also be explor-
ing the possibility that some of these "other things" that have changed
in the last three decades-broken
homes and the welfare system being
prime suspects-interact
with intelligence, making it still more likely
than before that a woman of low cognitive ability will have a baby out
of wedlock.
Among other reasons that cognitive ability may be related to illegit-
imacy, we have this causal model in mind: The smarter a woman is, the
more likely that she deliberately decides to have a child and calculates
the best time to do it. The less intelligent the woman is, the more likely
that she does not think ahead from sex to procreation, does not re-
member to use birth control, does not carefully consider when and un-
der what circumstances she should have a child. How intelligent a
woman is may interact with her impulsiveness, and hence her ability to
exert self-discipline and restraint on her partner in order to avoid preg-
nancy. The result is a direct and strong relationship between high in-
telligence and the likelihood that a child is conceived after marriage,
and between low intelligence and the likelihood that the child will be
born out of wedlock.
180
Cognitive Classes and Social Behavior
Family Matters
18 1
There are, of course, objections to this explanation. Sotne will hris-
tle at our identification of conception within marriage with the intelli-
gent thing to do. But is it really controversial or even arguahle? Under
what circumstances can a thoughtful, coolheaded appraisal lead one to
conclude that it is better to conceive a child outside marriage? If such
circumstances exist, are they not exceptional? Perhaps a woman wants
to conceive a child out of marriage, but how likely is it that a disinter-
ested person would consider it to be in the best interest of all concerned,
including the child's?
We begin our exploration with the overall numbers. First, how many
white women are engaging in this behavior? As the next table shows,
the differences among the cognitive classes are extremely large. Only 2
percent of white women in Class 1 had given birth to an illegitimate
child as of the 1990 interview, compared to 32 percent of the women in
Class V.
The Incidence of Illegitimacy Among
Young White Women
Percentage Who
Have Given Birth to an
Cognitive Class
Illegitimate Baby
1 Very bright
2
11 Bright
4
Ill Normal
8
IV Dull
17
V Very dull
3 2
Overall average
R
Now we switch lenses. Instead of asking how many women have ever
had an illegitimate baby, we ask what proportion of first babies born to
white women are illegitimate. The next table shows the results. The
proportions of illegitimate first births in the top two cognitive classes
are nearly the same, rounding to 7 percent-about
half the proportion
for Ciass 111, a third of the proportion for Class IV, and a sixth of the
proportion for Class V. Illegitimacy is again conspicuously concentrated
in the lowest cognitive groups.
The Proportion of White First Births
That Are Illegitimate
Percentage of
Cognitive Class
Illegitimate Births
1 Very bright
7
11 Bright
7
Ill Nornlal
13
IV Dull
2 3
V Very dull
42
Overall average
14
The relationship hetween intelligence and illegitimacy is strong not
only in these hasic respects, hut also in more subtle ways, as the num-
hers hased on the women's first births, shown in the next table, reveal.
Circumstances of the First Birth Among Whites
Born Illegitimate
Born After Marriage
Mother
Mother
Conceived
Conceived
Hasn't
Eventually
Cognitive
Before
After
Married"
Married"
Class
Marriage
Marriage
3 '%,
4'%1
I Very hright
4%)
89%
3
4
1 3
80
11 Rr~ght
3
10
111 Normal
20
67
7
16
IV Dull
22
55
17
24
V Very dull
12
47
4
10
Population averages
19
68
' Ry the ttme crf the 1990 lntervlcw
Not only are children of mothers in the top quartile cd intelligence
(Classes I and 11) more likely to he born within marriage, they are more
likely to have heen conceived within marriage (no shotgun wedding).
The differences among the cognitive classes are large, as if they lived in
different worlds. For the women in Class V, only 47 percent of the first
children were conceived after a marriage ceremony; for the women in
Class 1, 89 percent.
The table makes a strong prima facie case for a relationship between
cognitive ability and illegitimacy. The question is whether it survives
scrutiny when we introduce other factors into the analysis.'221
Cognitive Ability and Illegitimacy
- Data reveals a stark contrast in marriage and conception patterns between cognitive classes, with Class I women being nearly twice as likely to conceive within marriage as Class V women.
- While modern cultural narratives suggest that out-of-wedlock births have become normalized across all social strata, statistical evidence indicates they remain heavily concentrated in the lower socioeconomic quartiles.
- A 1980 study found that white women without a high school diploma were twenty times more likely to have a child out of wedlock than those with a college degree.
- Research from the RAND Corporation and NLSY suggests that cognitive ability serves as a significant predictor of illegitimacy, independent of a woman's socioeconomic background.
- Statistical modeling shows that as IQ increases, the probability of an illegitimate first birth drops significantly, even when controlling for parental status.
The differences among the cognitive classes are large, as if they lived in different worlds.
180
Cognitive Classes and Social Behavior
Family Matters
18 1
There are, of course, objections to this explanation. Sotne will hris-
tle at our identification of conception within marriage with the intelli-
gent thing to do. But is it really controversial or even arguahle? Under
what circumstances can a thoughtful, coolheaded appraisal lead one to
conclude that it is better to conceive a child outside marriage? If such
circumstances exist, are they not exceptional? Perhaps a woman wants
to conceive a child out of marriage, but how likely is it that a disinter-
ested person would consider it to be in the best interest of all concerned,
including the child's?
We begin our exploration with the overall numbers. First, how many
white women are engaging in this behavior? As the next table shows,
the differences among the cognitive classes are extremely large. Only 2
percent of white women in Class 1 had given birth to an illegitimate
child as of the 1990 interview, compared to 32 percent of the women in
Class V.
The Incidence of Illegitimacy Among
Young White Women
Percentage Who
Have Given Birth to an
Cognitive Class
Illegitimate Baby
1 Very bright
2
11 Bright
4
Ill Normal
8
IV Dull
17
V Very dull
3 2
Overall average
R
Now we switch lenses. Instead of asking how many women have ever
had an illegitimate baby, we ask what proportion of first babies born to
white women are illegitimate. The next table shows the results. The
proportions of illegitimate first births in the top two cognitive classes
are nearly the same, rounding to 7 percent-about
half the proportion
for Ciass 111, a third of the proportion for Class IV, and a sixth of the
proportion for Class V. Illegitimacy is again conspicuously concentrated
in the lowest cognitive groups.
The Proportion of White First Births
That Are Illegitimate
Percentage of
Cognitive Class
Illegitimate Births
1 Very bright
7
11 Bright
7
Ill Nornlal
13
IV Dull
2 3
V Very dull
42
Overall average
14
The relationship hetween intelligence and illegitimacy is strong not
only in these hasic respects, hut also in more subtle ways, as the num-
hers hased on the women's first births, shown in the next table, reveal.
Circumstances of the First Birth Among Whites
Born Illegitimate
Born After Marriage
Mother
Mother
Conceived
Conceived
Hasn't
Eventually
Cognitive
Before
After
Married"
Married"
Class
Marriage
Marriage
3 '%,
4'%1
I Very hright
4%)
89%
3
4
1 3
80
11 Rr~ght
3
10
111 Normal
20
67
7
16
IV Dull
22
55
17
24
V Very dull
12
47
4
10
Population averages
19
68
' Ry the ttme crf the 1990 lntervlcw
Not only are children of mothers in the top quartile cd intelligence
(Classes I and 11) more likely to he born within marriage, they are more
likely to have heen conceived within marriage (no shotgun wedding).
The differences among the cognitive classes are large, as if they lived in
different worlds. For the women in Class V, only 47 percent of the first
children were conceived after a marriage ceremony; for the women in
Class 1, 89 percent.
The table makes a strong prima facie case for a relationship between
cognitive ability and illegitimacy. The question is whether it survives
scrutiny when we introduce other factors into the analysis.'221
182
Cognitive Classes and Social Behavior
Family Matters
183
The Role of Socioeconomic Background
The socioeconomic background of a young woman was traditionally
thought to be crucial in determining whether she bore a child out of
wedlock. The old-fashioned view of illegitimacy was that it occurred
mostly among girls from the lower classes, with occasional and scan-
dalous slip-ups by higher-class "good girls" who "got in trouble." But dur-
ing the last few decades, as births outside marriage became more
common and as examples proliferated of film stars and career women
who were choosing to have babies without husbands, an alternative
view spread. The sexual revolution had obviously penetrated to all lev-
els of society, it was argued, and births out of wedlock were occurring at
all levels of our sexually liberated society.
There were never any systematic data to support this view, hut nei-
ther did scholars rush to check it out. A 1980 article in the American
Sociological Review on education and fertility reported that white women
with less than a high school education were twenty times more likely
to have a child out of wedlock than white women with at least a col-
lege degree, but illegitimacy was only a side issue in the article and the
datum never got noticed in the public dialogue.2' The relationship of
teenage illegitimacy to social and cognitive factors was first treated in
detail in an analysis of the High School and Beyond survey puhlished
by the RAND Corporation in 1988.1241
The report revealed that more
than three-quarters of the teenage girls in this national sample who had
babies while they were still of high school age came from families in the
bottom half of the socioeconomic stratum. More than half came from
the bottom quartile. This finding also held true among just the white
teenage girls who had babies out of wedlock, with 70 percent coming
from the bottom halfof the socioeconomic distribution and only 12 per-
cent from the top quartile.1251
The RAND study was also the first to re-
veal that cognitive ability played an important role, independent of
socioeconomic status. lznl
The data from the NLSY generally confirm those reported in the
RAND analysis. On the surface, white illegitimacy is associated with
socioeconomic status: About 9 percent of babies of women who come
from the upper socioeconomic quartile are illegitimate, compared to
about 23 percent of the children of women who come From the bottom
socioeconomic quartile. But white women of varying status backgrounds
differ in cognitive ability as well. Our standard analysis with IQ, age,
and parental SES as independent variables helps to clarify the situation.
The dependent variable is whether the first child was born out of wed-
IQ has a large effect on white illegitimate births independent
of the mother's socioeconomic background
Probability of an illegitimate first birth
40% -
As IQ goes from low to high
As parental SES goes
from low to high
I
I
I
T
Very low
Very high
(-2 SDs)
(t2 SD\)
Note: For computing the plot, age and either SES (for the black curve) or IQ (for the gray
curve) were set at their mean values.
Higher social status reduces the chances of an illegitimate first baby
from about 19 percent for a woman who came from a very low status
family to about 8 percent for a woman from a very high status family,
given that the woman has average intelligence. Let us compare that 11
percentage point swing with the effect of an equivalent shift in intelli-
gence (given average socioeconomic background).12R'
The odds of hav-
ing an illegitimate first child drop from 34 percent for a very dull woman
to about 4 percent for a very smart woman, a swing of 30 percentage
points independent of any effect of socioeconomic status.
Intelligence and Illegitimacy Factors
- Statistical analysis suggests that a woman's cognitive ability has a significantly larger impact on the likelihood of having a child out of wedlock than her socioeconomic background.
- While media attention often focuses on educated women choosing single motherhood, the vast majority of births to college-educated women occur within marriage.
- Among high school graduates, the probability of an illegitimate first birth varies drastically based on IQ, ranging from 3 percent for high-IQ women to 34 percent for low-IQ women.
- Family structure during adolescence plays a critical role, with girls living with both biological parents at age 14 showing the lowest rates of out-of-wedlock births.
- The presence of a biological father appears to be a protective factor, whereas living in a mother-only household correlates with the highest risk of illegitimacy.
Among white women in the NLSY who had a bachelor's degree (no more, no less) and who had given birth to a child, 99 percent of the babies were born within marriage.
182
Cognitive Classes and Social Behavior
Family Matters
183
The Role of Socioeconomic Background
The socioeconomic background of a young woman was traditionally
thought to be crucial in determining whether she bore a child out of
wedlock. The old-fashioned view of illegitimacy was that it occurred
mostly among girls from the lower classes, with occasional and scan-
dalous slip-ups by higher-class "good girls" who "got in trouble." But dur-
ing the last few decades, as births outside marriage became more
common and as examples proliferated of film stars and career women
who were choosing to have babies without husbands, an alternative
view spread. The sexual revolution had obviously penetrated to all lev-
els of society, it was argued, and births out of wedlock were occurring at
all levels of our sexually liberated society.
There were never any systematic data to support this view, hut nei-
ther did scholars rush to check it out. A 1980 article in the American
Sociological Review on education and fertility reported that white women
with less than a high school education were twenty times more likely
to have a child out of wedlock than white women with at least a col-
lege degree, but illegitimacy was only a side issue in the article and the
datum never got noticed in the public dialogue.2' The relationship of
teenage illegitimacy to social and cognitive factors was first treated in
detail in an analysis of the High School and Beyond survey puhlished
by the RAND Corporation in 1988.1241
The report revealed that more
than three-quarters of the teenage girls in this national sample who had
babies while they were still of high school age came from families in the
bottom half of the socioeconomic stratum. More than half came from
the bottom quartile. This finding also held true among just the white
teenage girls who had babies out of wedlock, with 70 percent coming
from the bottom halfof the socioeconomic distribution and only 12 per-
cent from the top quartile.1251
The RAND study was also the first to re-
veal that cognitive ability played an important role, independent of
socioeconomic status. lznl
The data from the NLSY generally confirm those reported in the
RAND analysis. On the surface, white illegitimacy is associated with
socioeconomic status: About 9 percent of babies of women who come
from the upper socioeconomic quartile are illegitimate, compared to
about 23 percent of the children of women who come From the bottom
socioeconomic quartile. But white women of varying status backgrounds
differ in cognitive ability as well. Our standard analysis with IQ, age,
and parental SES as independent variables helps to clarify the situation.
The dependent variable is whether the first child was born out of wed-
IQ has a large effect on white illegitimate births independent
of the mother's socioeconomic background
Probability of an illegitimate first birth
40% -
As IQ goes from low to high
As parental SES goes
from low to high
I
I
I
T
Very low
Very high
(-2 SDs)
(t2 SD\)
Note: For computing the plot, age and either SES (for the black curve) or IQ (for the gray
curve) were set at their mean values.
Higher social status reduces the chances of an illegitimate first baby
from about 19 percent for a woman who came from a very low status
family to about 8 percent for a woman from a very high status family,
given that the woman has average intelligence. Let us compare that 11
percentage point swing with the effect of an equivalent shift in intelli-
gence (given average socioeconomic background).12R'
The odds of hav-
ing an illegitimate first child drop from 34 percent for a very dull woman
to about 4 percent for a very smart woman, a swing of 30 percentage
points independent of any effect of socioeconomic status.
184
Cognitive Classes and Soc~al Behavior
Family Matters
185
The Role of Education
Without doubt, the number of well-educated women who are deliber-
ately deciding to have a baby out of wedlock-the
name "Murphy
Brown" comes to mind-has
increased. The Bureau of the Census's most
recent study of fertility of American women revealed that the percent-
age of never-married women with a bachelor's degree who had a haby
had increased from 3 to 6 percent from 1982 to 1992.'' But during the
same decade, the percentage of never-married women with less than a
high school education who had a baby increased from 35 to 48 percent.'@
The role of education continues to be large.
In the NLSY, the statistics contrast even more starkly. Among white
women in the NLSY who had a bachelor's degree (no more, no less) and
who had given birth to a child, 99 percent of the bahies were horn within
marriage. In other words, there is virtually no independent role for 1Q
to play among women in the college sample. It is true that the women
in that 1 percent who gave birth out of wedlock were more likely to have
the lower test scores-independent
of any effect of their socioeconomic
backgrounds-but
this is of theoretical interest only.
Meanwhile, for white women in the NLSY who had a high school
diploma (no more, no less) and had given birth to a child, 13 percent
of the children had been born out of wedlock (compared to 1 per-
cent for the college sample). For them, the independent role of IQ
was as large as the one for the entire population (as shown in the
preceding figure). A high school graduate with an 1Q of 70 had a 34
percent probability that the first baby would he born out of wedlock;
a high school graduate with an IQ of 130 had less than a 3 percent
chance, after extracting the effects of age and socicxconomic back-
ground. The independent effect of socioeconomic status was com-
paratively minor.
The Role of Broken Homes
We have already noted that family structure at the age of 14 had only
modest influence on the chances of getting divorced in the NLSY sam-
ple after controlling for IQ and parental SES. Now the question is how
the same characteristic affects illegitimacy. Let us consider a white
woman of average intelligence and average socioeconomic background.
The odds that her first child would be born out of wedlock were:
10 percent if she was living with both biological parents.
18 percent if she was living with a biological parent and a steppar-
ent.
25 percent if she was living with her mother (with or without a live-
in boyfriend).
The difference between coming from a traditional family versus any-
thing else was large, with the stepfamily about halfway between the tra-
ditional family and the mother-only family.
As we examined the role of family structure with different break-
downs (the permutations of arrangements that can exist are numer-
ous), a few patterns kept recurring. It seemed that girls who were still
living with their biological father at age 14 were protected from hav-
ing their first baby out of wedlock. The girls who had heen living with
neither biological parent (usually living with adopted parents) were
also protected. The worst outcomes seemed conspicuously associated
with situations in which the 14-year-old had been living with the
biological mother but not the biological father. Here is one such break-
down. The odds that a white woman's first baby would he born out
of wedlock (again assuming average intelligence and socioeconomic
background) were:
8 percent if the biological mother, but not the biological father, was
absent by age 14.
8 percent if both biological parents were absent at age 14 (mostly
adopted children).
10 percent if both biological parents were present at age 14.
23 percent if the biological father was absent by age 14 but not the
bioloeical mother.
There is considerable food for thought here, but we refrain from spec-
ulation. The main point for our purposes is that family structure is clearly
important as a cause of illegitimacy in the next generation.
Did cognitive ability still continue to play an independent role? Yes,
for all the different family configurations that we examined. Indeed, the
independent effect of IQ was sometimes augmented by taking family
structure into account. Consider the case of a young woman at risk, hav-
ing lived with an unmarried biological mother at age 14. Given aver-
Family Structure and Cognitive Ability
- Statistical data suggests that a white woman's likelihood of having a child out of wedlock is significantly higher if her biological father was absent during her youth.
- Cognitive ability remains a powerful independent predictor of illegitimacy across all family configurations.
- High IQ acts as a significant protective factor, reducing the probability of out-of-wedlock births even in high-risk family environments.
- Socioeconomic status offers surprisingly weak protection against illegitimacy once cognitive ability is factored into the analysis.
- The 'welfare explanation' suggests that government support enables low-income women to bear children by mitigating the immediate economic penalties of single motherhood.
- Social stigma regarding out-of-wedlock births has largely eroded in the poorest communities, making welfare a more relevant factor in decision-making.
If she had an IQ at the 98th centile (an IQ of 130 or above), the probability plunged to 8 percent. If she had an IQ at the 2d centile (an IQ of 70 or below), the probability soared to 55 percent.
184
Cognitive Classes and Soc~al Behavior
Family Matters
185
The Role of Education
Without doubt, the number of well-educated women who are deliber-
ately deciding to have a baby out of wedlock-the
name "Murphy
Brown" comes to mind-has
increased. The Bureau of the Census's most
recent study of fertility of American women revealed that the percent-
age of never-married women with a bachelor's degree who had a haby
had increased from 3 to 6 percent from 1982 to 1992.'' But during the
same decade, the percentage of never-married women with less than a
high school education who had a baby increased from 35 to 48 percent.'@
The role of education continues to be large.
In the NLSY, the statistics contrast even more starkly. Among white
women in the NLSY who had a bachelor's degree (no more, no less) and
who had given birth to a child, 99 percent of the bahies were horn within
marriage. In other words, there is virtually no independent role for 1Q
to play among women in the college sample. It is true that the women
in that 1 percent who gave birth out of wedlock were more likely to have
the lower test scores-independent
of any effect of their socioeconomic
backgrounds-but
this is of theoretical interest only.
Meanwhile, for white women in the NLSY who had a high school
diploma (no more, no less) and had given birth to a child, 13 percent
of the children had been born out of wedlock (compared to 1 per-
cent for the college sample). For them, the independent role of IQ
was as large as the one for the entire population (as shown in the
preceding figure). A high school graduate with an 1Q of 70 had a 34
percent probability that the first baby would he born out of wedlock;
a high school graduate with an IQ of 130 had less than a 3 percent
chance, after extracting the effects of age and socicxconomic back-
ground. The independent effect of socioeconomic status was com-
paratively minor.
The Role of Broken Homes
We have already noted that family structure at the age of 14 had only
modest influence on the chances of getting divorced in the NLSY sam-
ple after controlling for IQ and parental SES. Now the question is how
the same characteristic affects illegitimacy. Let us consider a white
woman of average intelligence and average socioeconomic background.
The odds that her first child would be born out of wedlock were:
10 percent if she was living with both biological parents.
18 percent if she was living with a biological parent and a steppar-
ent.
25 percent if she was living with her mother (with or without a live-
in boyfriend).
The difference between coming from a traditional family versus any-
thing else was large, with the stepfamily about halfway between the tra-
ditional family and the mother-only family.
As we examined the role of family structure with different break-
downs (the permutations of arrangements that can exist are numer-
ous), a few patterns kept recurring. It seemed that girls who were still
living with their biological father at age 14 were protected from hav-
ing their first baby out of wedlock. The girls who had heen living with
neither biological parent (usually living with adopted parents) were
also protected. The worst outcomes seemed conspicuously associated
with situations in which the 14-year-old had been living with the
biological mother but not the biological father. Here is one such break-
down. The odds that a white woman's first baby would he born out
of wedlock (again assuming average intelligence and socioeconomic
background) were:
8 percent if the biological mother, but not the biological father, was
absent by age 14.
8 percent if both biological parents were absent at age 14 (mostly
adopted children).
10 percent if both biological parents were present at age 14.
23 percent if the biological father was absent by age 14 but not the
bioloeical mother.
There is considerable food for thought here, but we refrain from spec-
ulation. The main point for our purposes is that family structure is clearly
important as a cause of illegitimacy in the next generation.
Did cognitive ability still continue to play an independent role? Yes,
for all the different family configurations that we examined. Indeed, the
independent effect of IQ was sometimes augmented by taking family
structure into account. Consider the case of a young woman at risk, hav-
ing lived with an unmarried biological mother at age 14. Given aver-
186
Cognitive Classes and Social Behatior
Family Matters
187
age socioeconomic background and an average IQ, the probability that
her first baby would be born out of wedlock was 25 percent. If she had
an IQ at the 98th centile (an IQ of 130 or above), the probability
plunged to 8 percent. If she had an IQ at the 2d centile (an 1Q of 70 or
below), the probability soared to 55 percent. High socioeconomic sta-
tus offered weak protection against illegitimacy once IQ had been taken
into a~count.~"'
The Rok of Poverty and Welfare
In the next chapter, we discuss IQ in relation to welfare dependence.
Here, we take up a common argument about welfare as a cause of ille-
gitimacy. It is not that low IQ causes women to have Illegitimate hahies,
this argument suggests, but that the combination of poverty and wel-
fare causes women to have illegitimate babies. The logic ls that a poor
woman who is assured of clothes, shelter, food, and medical care will
take fewer precautions to avoid getting pregnant, or, once pregnant, wlll
put less pressure on the baby's father to marry her, than a woman who
is not assured of support. There are two versions of the argument. One
sees the welfare system as bribing women to have babies; they get preg-
nant so they can get a welfare check. The alternative, which we find
more plausible, is that the welfare check (and the collateral goods and
services that are part of the welfare system) enabks women to do some-
thing that many young women might naturally like to do anyway: bear
children.
The controversy about the welfare explanation, in either the "en-
abling" or "bribe" version, has been intense, with many issues still un-
resolved.'32' Whichever version is employed, the reason for focuslng on
the role of poverty is obvious: For affluent young women, the welfare
system is obviously irrelevant. They are restrained from having bahies
out of wedlock by moral considerations or by fear of the social penalties
(both of which still exist, though weakened, in middle-class circles), by
a concern that the child have a father around the house, and because
having a baby would interfere with their plans for the future. In the poor-
est communities, having a baby out of wedlock is no longer subject to
social stigma, nor do moral considerations appear to carry much weight
any longer; it is not irresponsible to have a child out of wedlock, the ar-
gument is more likely to go, because a single young woman can in fact
support the child without the help of a husband." And that brings the
welfare system into the picture. For poor young women, the welfare sys-
tem is highly relevant, easing the short-term economic penalties that
might ordinarily restrain their ~hi1dbearin.g.'~
The poorer she is, the
more attractive the welfare package is and the more likely that she will
think herself enabled to have a baby by receiving it.
Given this argument and given that poverty and low IQ are related,
let us ask whether the apparent relationship between IQ and illegiti-
macy is an artifact. Poor women disproportionately have low IQs, and
bear a disproportionate number of illegitimate babies. Control for the
effects of poverty, says this logic, and the relationship between IQ and
illegitimacy will diminish.
Let us see. First, we ask whether the initial condition is true: Is hav-
lng bahies out of wedlock something that is done disproportionately not
only by women who come from low soc~oeconomic backgrounds (a fact
which we already have discussed), but women who are literally poor
themselves when they reach childbearma age? Even more specifically,
are they disproportionately living below the poverty line before the birth?
We use the italics to emphasize a distinction that we believe offers an
important new perspective on single motherhood and poverty. It is one
thing to say that single women with babies are disproportionately poor,
as we discussed in Chapter 5. That makes sense, because a single woman
with a child is often not a viable economlc unit. It is quite another thing
to say that women who are already poor becorne mothers. Now we are
arguing that there is something about being in the state of poverty it-
self (after holding the soc~oeconomic status in which they were raised
constant) that makes having a baby without a husband attractive.
To put the question in operational terms: Atnong NLSY white moth-
ers who were below the poverty line in the year prior to giving birth,
what proportion of the babies were born out of wedlock? The answer is
44 percent. Among NLSY white mothers who were anywhere above the
poverty line in the year before giving birth, what proportion of the ha-
hies were born out of wedlock? The answer is cmly 6 percent. It is a huge
difference and makes a prima facie case for those who argue that poverty
itself, presumably via the welfare system, is an important cause of iHe-
gitimacy.
But now we turn to the rest of the hypothesis: that controlling for
poverty will explain away at least some of the apparent relationship be-
Poverty, IQ, and Illegitimacy
- The text investigates whether the correlation between low IQ and illegitimacy is merely an artifact of poverty.
- Data shows a stark contrast in out-of-wedlock births: 44 percent for white mothers below the poverty line versus 6 percent for those above it.
- The authors argue that being in a state of poverty itself may make single motherhood more 'attractive,' potentially due to the welfare system.
- Statistical analysis reveals that IQ is actually a more powerful predictor of illegitimacy among poor white women than among the general population.
- When focusing on poor women, the influence of socioeconomic background in restraining illegitimacy effectively disappears once IQ is controlled for.
It is one thing to say that single women with babies are disproportionately poor... It is quite another thing to say that women who are already poor become mothers.
186
Cognitive Classes and Social Behatior
Family Matters
187
age socioeconomic background and an average IQ, the probability that
her first baby would be born out of wedlock was 25 percent. If she had
an IQ at the 98th centile (an IQ of 130 or above), the probability
plunged to 8 percent. If she had an IQ at the 2d centile (an 1Q of 70 or
below), the probability soared to 55 percent. High socioeconomic sta-
tus offered weak protection against illegitimacy once IQ had been taken
into a~count.~"'
The Rok of Poverty and Welfare
In the next chapter, we discuss IQ in relation to welfare dependence.
Here, we take up a common argument about welfare as a cause of ille-
gitimacy. It is not that low IQ causes women to have Illegitimate hahies,
this argument suggests, but that the combination of poverty and wel-
fare causes women to have illegitimate babies. The logic ls that a poor
woman who is assured of clothes, shelter, food, and medical care will
take fewer precautions to avoid getting pregnant, or, once pregnant, wlll
put less pressure on the baby's father to marry her, than a woman who
is not assured of support. There are two versions of the argument. One
sees the welfare system as bribing women to have babies; they get preg-
nant so they can get a welfare check. The alternative, which we find
more plausible, is that the welfare check (and the collateral goods and
services that are part of the welfare system) enabks women to do some-
thing that many young women might naturally like to do anyway: bear
children.
The controversy about the welfare explanation, in either the "en-
abling" or "bribe" version, has been intense, with many issues still un-
resolved.'32' Whichever version is employed, the reason for focuslng on
the role of poverty is obvious: For affluent young women, the welfare
system is obviously irrelevant. They are restrained from having bahies
out of wedlock by moral considerations or by fear of the social penalties
(both of which still exist, though weakened, in middle-class circles), by
a concern that the child have a father around the house, and because
having a baby would interfere with their plans for the future. In the poor-
est communities, having a baby out of wedlock is no longer subject to
social stigma, nor do moral considerations appear to carry much weight
any longer; it is not irresponsible to have a child out of wedlock, the ar-
gument is more likely to go, because a single young woman can in fact
support the child without the help of a husband." And that brings the
welfare system into the picture. For poor young women, the welfare sys-
tem is highly relevant, easing the short-term economic penalties that
might ordinarily restrain their ~hi1dbearin.g.'~
The poorer she is, the
more attractive the welfare package is and the more likely that she will
think herself enabled to have a baby by receiving it.
Given this argument and given that poverty and low IQ are related,
let us ask whether the apparent relationship between IQ and illegiti-
macy is an artifact. Poor women disproportionately have low IQs, and
bear a disproportionate number of illegitimate babies. Control for the
effects of poverty, says this logic, and the relationship between IQ and
illegitimacy will diminish.
Let us see. First, we ask whether the initial condition is true: Is hav-
lng bahies out of wedlock something that is done disproportionately not
only by women who come from low soc~oeconomic backgrounds (a fact
which we already have discussed), but women who are literally poor
themselves when they reach childbearma age? Even more specifically,
are they disproportionately living below the poverty line before the birth?
We use the italics to emphasize a distinction that we believe offers an
important new perspective on single motherhood and poverty. It is one
thing to say that single women with babies are disproportionately poor,
as we discussed in Chapter 5. That makes sense, because a single woman
with a child is often not a viable economlc unit. It is quite another thing
to say that women who are already poor becorne mothers. Now we are
arguing that there is something about being in the state of poverty it-
self (after holding the soc~oeconomic status in which they were raised
constant) that makes having a baby without a husband attractive.
To put the question in operational terms: Atnong NLSY white moth-
ers who were below the poverty line in the year prior to giving birth,
what proportion of the babies were born out of wedlock? The answer is
44 percent. Among NLSY white mothers who were anywhere above the
poverty line in the year before giving birth, what proportion of the ha-
hies were born out of wedlock? The answer is cmly 6 percent. It is a huge
difference and makes a prima facie case for those who argue that poverty
itself, presumably via the welfare system, is an important cause of iHe-
gitimacy.
But now we turn to the rest of the hypothesis: that controlling for
poverty will explain away at least some of the apparent relationship be-
188
Cognitive Classes and Social Behavior
Family Matters
189
tween IQ and illegitimacy. Here is the basic analysis-controlling for
IQ, parental SES, and age-restricted
to white women who were poor
the year before the birth of their babies.'351
Compare the graph below with the one before it and two points about
white poor women and illegitimacy are vividly clear. First, the inde-
IQ is a more powerful predictor of illegitimacy among poor white
women than among white women as a whole
Probability that the first child will be born out of wedlock
for white women already below the poverty line
80%-
from low to high
I
1
I
I
Very low
Very high
(-2 SDE)
(+? SD\)
Note: For computing the plot, age and either SES (for the black curve) or 1Q (L>r the Krey
curve) were set at their mean values.
pendent importance of intelligence is even greater for pwr white
women than for white women as a whole. A poor white woman of av-
erage socioeconomic background and average 1Q has more than a 35
percent chance of an illegitimate first birth. For white women in gen-
eral, average socioeconomic status and IQ resulted in less than a 15 per-
cent chance. Second, among poor women, the role of socioeconomic
background in restraining illegitimacy disappears once the role of IQ is
taken into account.
The results, taken literally, suggest that illegitimacy tends to rise
among poor women who came from higher socioeconomic background
after IQ is taken into account. However, the sample of white women in-
cludes too few women who fit all of the conditions (below the poverty
line, from a good socioeconomic background, with an illegitimate baby)
to make much of this. The more conservative interpretation is that low
socioeconomic background, independent of 1Q and current poverty it-
self, does not increase the chances of giving birth out of wedlock among
poor white women-in
itself a sufficiently provocative finding for soci-
ologists. 1361
Our main purpose has been to demonstrate that low intelligence is
an important independent cause of illegitimacy, and to do so we have
considered the role of poverty. In reality, however, we have also opened
up many new avenues of inquiry that we cannot fully pursue without
writing an entire book on this subject alone. For example, the results
raise many questions to be asked about the "culture of poverty" argu-
ment. To the extent that a culture of poverty is at work, transmitting
dysfunctional values from one generation to the next, it seems para-
doxical that low socioeconomic background does not foster illegitimacy
once poverty In the year prior to birth is brought into the picture.
Rut the main task posed by these results is to fill in the reason for that
extremely strong relationship between low IQ and illegitimacy within
the population of poor white women. The possibilities bear directly on
some of the core issues in the social policy debate. For example, many
people have argued that the welfare system cannot really be a cause of
illegitimacy, because, in objective terms, the welfare system is a bad deal.
It provides only enough to squeak by, it can easily trap young women
into long-term dependence, and even poor young women would be
much better off by completing their education and getting a job rather
than having a haby and going on welfare. The resirlts we have presented
can be interpreted as saying that the welfare system may he a had deal,
but it takes foresight and intelligence to understand why. For women
without foresight and intelligence, it may seem to be a good deal. Hence
poor young women who are bright tend not to have illegitimate babies
nearly as often as poor young women who are dull.
Another possibility fits in with those who argue that the best pre-
ventative for illegitimacy is better opportunities. It is not the welfare
system that is at fault but the lack of other avenues. Poor young women
who are bright are getting scholarships, or otherwise having positive in-
Intelligence and Family Structure
- The authors argue that low cognitive ability is a significant independent cause of illegitimacy among poor white women.
- Research suggests that poverty alone does not increase the chances of out-of-wedlock births as much as previously assumed by sociologists.
- The welfare system may be perceived as a 'bad deal' by those with high foresight, but women with lower cognitive ability may view it as a viable option.
- Bright young women in poverty often defer childbearing due to better educational opportunities and scholarships that are unavailable to their less intelligent peers.
- Family breakdown in America is highly selective, with divorce and illegitimacy rates being significantly lower in the top quartile of cognitive ability.
- The data shows that 87 percent of high-IQ households remain married couples compared to only 70 percent in the bottom IQ quartile.
The results we have presented can be interpreted as saying that the welfare system may be a bad deal, but it takes foresight and intelligence to understand why.
188
Cognitive Classes and Social Behavior
Family Matters
189
tween IQ and illegitimacy. Here is the basic analysis-controlling for
IQ, parental SES, and age-restricted
to white women who were poor
the year before the birth of their babies.'351
Compare the graph below with the one before it and two points about
white poor women and illegitimacy are vividly clear. First, the inde-
IQ is a more powerful predictor of illegitimacy among poor white
women than among white women as a whole
Probability that the first child will be born out of wedlock
for white women already below the poverty line
80%-
from low to high
I
1
I
I
Very low
Very high
(-2 SDE)
(+? SD\)
Note: For computing the plot, age and either SES (for the black curve) or 1Q (L>r the Krey
curve) were set at their mean values.
pendent importance of intelligence is even greater for pwr white
women than for white women as a whole. A poor white woman of av-
erage socioeconomic background and average 1Q has more than a 35
percent chance of an illegitimate first birth. For white women in gen-
eral, average socioeconomic status and IQ resulted in less than a 15 per-
cent chance. Second, among poor women, the role of socioeconomic
background in restraining illegitimacy disappears once the role of IQ is
taken into account.
The results, taken literally, suggest that illegitimacy tends to rise
among poor women who came from higher socioeconomic background
after IQ is taken into account. However, the sample of white women in-
cludes too few women who fit all of the conditions (below the poverty
line, from a good socioeconomic background, with an illegitimate baby)
to make much of this. The more conservative interpretation is that low
socioeconomic background, independent of 1Q and current poverty it-
self, does not increase the chances of giving birth out of wedlock among
poor white women-in
itself a sufficiently provocative finding for soci-
ologists. 1361
Our main purpose has been to demonstrate that low intelligence is
an important independent cause of illegitimacy, and to do so we have
considered the role of poverty. In reality, however, we have also opened
up many new avenues of inquiry that we cannot fully pursue without
writing an entire book on this subject alone. For example, the results
raise many questions to be asked about the "culture of poverty" argu-
ment. To the extent that a culture of poverty is at work, transmitting
dysfunctional values from one generation to the next, it seems para-
doxical that low socioeconomic background does not foster illegitimacy
once poverty In the year prior to birth is brought into the picture.
Rut the main task posed by these results is to fill in the reason for that
extremely strong relationship between low IQ and illegitimacy within
the population of poor white women. The possibilities bear directly on
some of the core issues in the social policy debate. For example, many
people have argued that the welfare system cannot really be a cause of
illegitimacy, because, in objective terms, the welfare system is a bad deal.
It provides only enough to squeak by, it can easily trap young women
into long-term dependence, and even poor young women would be
much better off by completing their education and getting a job rather
than having a haby and going on welfare. The resirlts we have presented
can be interpreted as saying that the welfare system may he a had deal,
but it takes foresight and intelligence to understand why. For women
without foresight and intelligence, it may seem to be a good deal. Hence
poor young women who are bright tend not to have illegitimate babies
nearly as often as poor young women who are dull.
Another possibility fits in with those who argue that the best pre-
ventative for illegitimacy is better opportunities. It is not the welfare
system that is at fault but the lack of other avenues. Poor young women
who are bright are getting scholarships, or otherwise having positive in-
190
Cognitive Classes and Social Behavior
centives offered to them, and they accordingly defer childhearing. Poor
young women who are dull do not get such opportunities; they have
nothing else to do, and so have a baby. The goal should he to provide
them too with other ways of seeing their futures.
Both of these explanations are stated as hypotheses that we hope oth-
ers will explore. Those explorations will have to incorporate our cen-
tral finding, however: Cognitive ability in itself is an important factor
in illegitimacy, and the dynamics for understanding illegitimacy-and
dealing with it through policy-must
take that strong link into account.
THE SELECTIVE DETERIORATION OF THE TRADITIONAL
FAMILY
Our goal has been to sharpen understanding of the much-lamented
breakdown of the American family. The American family has been as
battered in the latter decades of the twentieth century as the puhlic
rhetoric would have it, hut the damage as measured in terms of divorce
and illegitimacy has been far more selective than we hear. Ry way of
summary, let us consider the children of the white NLSY mothers in the
top quartile of cognitive ahility (Classes 1 and 11) versus those in the
hottom quartile (Classes IV and V):
The percentage of households with children that consist of a mamed cou-
pk: 87 percent in the top quartile of IQ, 70 percent in the hottom
quartile.
The percentage of households with children that have exfien'enced di-
vorce: 17 percent in the top quartile of IQ, 33 percent in the hot-
tom quartile.
The percentage of children born out of wedlock: 5 percent in the top
quartile of IQ, 23 percent in the bottom quartile.
The American family may be generally under siege, as people often
say. Rut it is at the bottom of the cognitive ahility distribution that its
defenses are most visibly crumbling.
Chapter 9
Welfare Dependency
People have had reason to assume for many years that welfare mothers are
concentrated at the low end of the cognitive ability distribution, if only because
they have generally done poorly in school. Beyond that, it makes sense that
smarter women can more easily find jobs and resist the temptations of welfare
dependency than duller ones, even if they have given birth out of wedlock.
The link is confirmed in the NLSY. Over three-quarters of the white women
who were on welfare within a year of the birth of their first child came from
the bottom quartik of la, compared to 5 percent from the top quartik. When
we subdivide welfare recipients into two groups, "temporary" and "chronic,"
the link persists, though differently for the two groups.
Among women who received welfare temporarily, low IQ is a powerful
risk factor even after the effects of marital status, povert?, age, and socioeco-
nomic background are statistically extracted. For chronic welfare recipiency,
the story is more complicated. For practical purposes, white women with
above-average cognitive ability or above-average socioeconomic backpound
do not become chronic welfare recipients. Among the restricted samgk of low-
la , low-SES , and relatively uneducated white women who are chronically
on welfare, low socioeconomic background is a more powerful predictor than
low lQ, even after taking account of whether they were themselves below the
poverty line at the time they had their babies.
The analyses provide some support for those who argue that a culture of
poverty tends to transmit chronic welfare dependency from one generation to
the next. But if a culture of poverty is at work, it seem$ to have influence pn'-
manly among women who are of low intelligence.
A
part from whether it causes increased illegitimacy, welfare has been
aprickly topic in the social policy debate since shortly after the core
welfare program, Aid to Families with Dependent Children (AFDC),
Cognitive Ability and Welfare Dependency
- Statistical analysis of the NLSY suggests a strong correlation between low cognitive ability and the likelihood of receiving welfare after a first child.
- While low IQ is a primary risk factor for temporary welfare use, chronic dependency is more heavily influenced by socioeconomic background and a 'culture of poverty.'
- The data indicates that white women with above-average cognitive ability or socioeconomic status almost never become chronic welfare recipients.
- The original intent of AFDC was to support widows, but the program's scope unexpectedly expanded to include abandoned and never-married women.
- Public antagonism toward welfare grew as the caseload shifted from 'deserving' widows to what many perceived as the subsidization of immorality.
- The welfare caseload remained relatively stable and low until the mid-1960s, when the dynamics of dependency underwent a sudden and dramatic shift.
It came as a distressing surprise to Frances Perkins, the first woman cabinet member and a primary sponsor of the legislation, to find that they were.
190
Cognitive Classes and Social Behavior
centives offered to them, and they accordingly defer childhearing. Poor
young women who are dull do not get such opportunities; they have
nothing else to do, and so have a baby. The goal should he to provide
them too with other ways of seeing their futures.
Both of these explanations are stated as hypotheses that we hope oth-
ers will explore. Those explorations will have to incorporate our cen-
tral finding, however: Cognitive ability in itself is an important factor
in illegitimacy, and the dynamics for understanding illegitimacy-and
dealing with it through policy-must
take that strong link into account.
THE SELECTIVE DETERIORATION OF THE TRADITIONAL
FAMILY
Our goal has been to sharpen understanding of the much-lamented
breakdown of the American family. The American family has been as
battered in the latter decades of the twentieth century as the puhlic
rhetoric would have it, hut the damage as measured in terms of divorce
and illegitimacy has been far more selective than we hear. Ry way of
summary, let us consider the children of the white NLSY mothers in the
top quartile of cognitive ahility (Classes 1 and 11) versus those in the
hottom quartile (Classes IV and V):
The percentage of households with children that consist of a mamed cou-
pk: 87 percent in the top quartile of IQ, 70 percent in the hottom
quartile.
The percentage of households with children that have exfien'enced di-
vorce: 17 percent in the top quartile of IQ, 33 percent in the hot-
tom quartile.
The percentage of children born out of wedlock: 5 percent in the top
quartile of IQ, 23 percent in the bottom quartile.
The American family may be generally under siege, as people often
say. Rut it is at the bottom of the cognitive ahility distribution that its
defenses are most visibly crumbling.
Chapter 9
Welfare Dependency
People have had reason to assume for many years that welfare mothers are
concentrated at the low end of the cognitive ability distribution, if only because
they have generally done poorly in school. Beyond that, it makes sense that
smarter women can more easily find jobs and resist the temptations of welfare
dependency than duller ones, even if they have given birth out of wedlock.
The link is confirmed in the NLSY. Over three-quarters of the white women
who were on welfare within a year of the birth of their first child came from
the bottom quartik of la, compared to 5 percent from the top quartik. When
we subdivide welfare recipients into two groups, "temporary" and "chronic,"
the link persists, though differently for the two groups.
Among women who received welfare temporarily, low IQ is a powerful
risk factor even after the effects of marital status, povert?, age, and socioeco-
nomic background are statistically extracted. For chronic welfare recipiency,
the story is more complicated. For practical purposes, white women with
above-average cognitive ability or above-average socioeconomic backpound
do not become chronic welfare recipients. Among the restricted samgk of low-
la , low-SES , and relatively uneducated white women who are chronically
on welfare, low socioeconomic background is a more powerful predictor than
low lQ, even after taking account of whether they were themselves below the
poverty line at the time they had their babies.
The analyses provide some support for those who argue that a culture of
poverty tends to transmit chronic welfare dependency from one generation to
the next. But if a culture of poverty is at work, it seem$ to have influence pn'-
manly among women who are of low intelligence.
A
part from whether it causes increased illegitimacy, welfare has been
aprickly topic in the social policy debate since shortly after the core
welfare program, Aid to Families with Dependent Children (AFDC),
192
Cognitive Classes and Social Behavior
was created in the mid-1930s. Originally AFDC was a popular idea. No
one in the community was a likelier object of sympathy than the young
widow with small children to raise, and AFDC seemed to be a way to help
her stay home with her children until they were old enough to begin tak-
ing care of her in their turn. And if some of the women going on AFDC
had not been widowed but abandoned by no-good husbands, most peo-
ple thought that they should be helped too, though some people voiced
concerns that helping such women undermined marriage.
Rut hardly anyone had imagined that never-married women would
be eligible for AFDC. It came as a distressing surprise to Frances Perkins,
the first woman cabinet member and a primary sponsor of the legisla-
tion, to find that they were.' But not only were they eligible; within a
few years after AFDC began, they constituted a large and growing por-
tion of the caseload. This created much of the general public's antago-
nism toward AFDC: It wasn't just the money, it was the principle of the
thing. Why should hardworking citizens support immorality?
Such complaints about welfare go far back into the 1940s and even
the 1930s, but, at least from our perspective in the 1990s, it was much
ado about a comparatively small problem, as the next figure shows. After
The welfare revolution
AFDC caseload as a percentage of families
Sources: U.S. Bureau of the Census, 1975, Table H 346-367; annual data puhlished in the
Social Security Bulletin.
a slow and meandering rise since the end of World War 11, the welfare
caseload was still less than 2 percent of families when John E Kennedy
took office. Then, as with so many other social phenomena, the dy-
namics abruptly changed in mid-1960s. In a concentrated period from
1966 to 1975, the percentage of American families on welfare nearly
tripled. The growth in the caseload then stopped and even declined
slightly through the 1980s. Welfare rolls have been rising steeply since
1988, apparently beginning a fourth era. As of 1992, more than 14 mil-
lion Americans were on welfare.
The steep rise in the welfare population is obviously not to be ex-
plained by intelligence, which did not plummet in the 1960s and 1970s.
More fundamental forces were reshaping the social landscape during
that time. The surging welfare population is just one outcropping among
others summarized in Part I1 of trouble in American society. In this chap-
ter, the theme will be, as it is elsewhere in the book, that as society
changes, some people are especially vulnerable to the changes-in
this
instance, to events that cause dependence on welfare. We show here
that low intelligence increases a white mother's risk of going on welfare,
independent of the other factors that might be expected to explain away
the relationship.
IQ AND WELFARE
It has not been an openly discussed topic, but there are many good rea-
sons for assuming that welfare mothers come mainly from the lower
reaches of the distribution of cognitive ability. Women on wetfare have
less education than women not on welfare, and chronic welfare recipi-
ents have less education than nonchronic recipients.' Welfare mothers
have been estimated to have reading skills that average three to five
years below grade level.3 Poor reading skills and little schooling define
populations with lower-than-average IQ, so even without access to IQ
tests, it can be deduced that welfare mothers have lower-than-average
intelligence. But can it be shown that low IQ has an independent link
with welfare itself, after taking account of the less direct links via being
poor and being an unwed mother?
By a direct link, we mean something like this: The smarter the woman
is, the more likely she will be able to find a job, the more likely she will
be able to line up other sources of support (from parents or the father of
the child), and the more farsighted she is likely to be about the dangers
Cognitive Ability and Welfare Dependency
- Welfare enrollment in America saw a massive tripling between 1966 and 1975, followed by a new steep rise beginning in 1988.
- The authors argue that while broad social forces reshape the landscape, individuals with lower cognitive ability are more vulnerable to welfare dependence.
- Data from the NLSY suggests a strong correlation between low IQ and the likelihood of a mother becoming a chronic welfare recipient.
- Higher intelligence is hypothesized to provide a 'direct link' to self-sufficiency by helping women find jobs and navigate social support systems.
- Statistical evidence shows a dramatic jump in welfare usage at the bottom of the cognitive distribution, specifically in 'Dull' and 'Very Dull' categories.
- The study aims to prove that low IQ remains a risk factor for welfare dependency even after controlling for poverty and unwed motherhood.
The smarter the woman is, the more likely she will be able to find a job, the more likely she will be able to line up other sources of support (from parents or the father of the child), and the more farsighted she is likely to be about the dangers of going on welfare.
192
Cognitive Classes and Social Behavior
was created in the mid-1930s. Originally AFDC was a popular idea. No
one in the community was a likelier object of sympathy than the young
widow with small children to raise, and AFDC seemed to be a way to help
her stay home with her children until they were old enough to begin tak-
ing care of her in their turn. And if some of the women going on AFDC
had not been widowed but abandoned by no-good husbands, most peo-
ple thought that they should be helped too, though some people voiced
concerns that helping such women undermined marriage.
Rut hardly anyone had imagined that never-married women would
be eligible for AFDC. It came as a distressing surprise to Frances Perkins,
the first woman cabinet member and a primary sponsor of the legisla-
tion, to find that they were.' But not only were they eligible; within a
few years after AFDC began, they constituted a large and growing por-
tion of the caseload. This created much of the general public's antago-
nism toward AFDC: It wasn't just the money, it was the principle of the
thing. Why should hardworking citizens support immorality?
Such complaints about welfare go far back into the 1940s and even
the 1930s, but, at least from our perspective in the 1990s, it was much
ado about a comparatively small problem, as the next figure shows. After
The welfare revolution
AFDC caseload as a percentage of families
Sources: U.S. Bureau of the Census, 1975, Table H 346-367; annual data puhlished in the
Social Security Bulletin.
a slow and meandering rise since the end of World War 11, the welfare
caseload was still less than 2 percent of families when John E Kennedy
took office. Then, as with so many other social phenomena, the dy-
namics abruptly changed in mid-1960s. In a concentrated period from
1966 to 1975, the percentage of American families on welfare nearly
tripled. The growth in the caseload then stopped and even declined
slightly through the 1980s. Welfare rolls have been rising steeply since
1988, apparently beginning a fourth era. As of 1992, more than 14 mil-
lion Americans were on welfare.
The steep rise in the welfare population is obviously not to be ex-
plained by intelligence, which did not plummet in the 1960s and 1970s.
More fundamental forces were reshaping the social landscape during
that time. The surging welfare population is just one outcropping among
others summarized in Part I1 of trouble in American society. In this chap-
ter, the theme will be, as it is elsewhere in the book, that as society
changes, some people are especially vulnerable to the changes-in
this
instance, to events that cause dependence on welfare. We show here
that low intelligence increases a white mother's risk of going on welfare,
independent of the other factors that might be expected to explain away
the relationship.
IQ AND WELFARE
It has not been an openly discussed topic, but there are many good rea-
sons for assuming that welfare mothers come mainly from the lower
reaches of the distribution of cognitive ability. Women on wetfare have
less education than women not on welfare, and chronic welfare recipi-
ents have less education than nonchronic recipients.' Welfare mothers
have been estimated to have reading skills that average three to five
years below grade level.3 Poor reading skills and little schooling define
populations with lower-than-average IQ, so even without access to IQ
tests, it can be deduced that welfare mothers have lower-than-average
intelligence. But can it be shown that low IQ has an independent link
with welfare itself, after taking account of the less direct links via being
poor and being an unwed mother?
By a direct link, we mean something like this: The smarter the woman
is, the more likely she will be able to find a job, the more likely she will
be able to line up other sources of support (from parents or the father of
the child), and the more farsighted she is likely to be about the dangers
194
Cognitive Classes and Social Behavior
Welfare Dependency
1 95
of going on welfare. Even within the population of women who go on
welfare, cognitive ability will vary, and the smarter ones will be better
able to get off.
No database until the NLSY has offered the chance to test these hy-
potheses in detail for a representative population. We begin as usual
with a look at the unadorned relationship with cognitive class.
Use of welfare is uncommon but not rare among these white moth-
ers, as the table below shows. Overall, 12 percent of the white mothers
Which White Women Go on Welfare
After the Birth of the First Child?
Percentage of
Percentage of
Mothers Who
Mothers Who
Went on AFDC
Became Chronic
Within a Year
Welfare
of First Birth
Cognitive Class
Recipients
1
I Very hright
d
4
11 Bright
2
12
I11 Normal
8
2 1
IV Dull
17
55
V Very dull
3 1
12
Overall average
9
"ample
= 17, with no one qualifying as a chronic welfare recipient. Mini-
mum sample reported: 25.
in the NLSY received welfare within a year of the birth of their first
child; 9 percent had become chronic recipients by our definition of
chronic welfare recipients (meaning that they had reported at least five
years of welfare income). Overall, 21 percent of white mothers had re-
ceived assistance from AFDC at some point in their live~.'~'
The differ-
ences among the cognitive classes are large, with a conspicuously large
jump in the rates at the bottom. The proportion of women in Class 1V
who became chronic welfare recipients is double the rate for Class 111,
with another big jump for Class V, to 31 percent of all mothers.
This result should come as no surprise, given what we already know
about the higher rates of illegitimate births in the lower half of the cog-
nitive ability distribution (Chapter 8). Women without husbands are
most at risk for going on welfare. We also know that poverty has a strong
association with the birth status of the child. In fact, it may be asked
whether we are looking at anything except a reflection of illegitimacy
and poverty in these figures. The answer is yes, but a somewhat differ-
ent "yes" for periodic and for chronic welfare recipiency.
GOING ON WELFARE AFTER THE BIRTH OF THE FIRST CHILD
First, we ask of the odds that a woman had received welfare by the end of
the first calendar year after the birth of her first child.[" In all cases, we
limit the analysis to white women whose first child was born prior to
1989, so that all have had a sufficient "chance" to go on welfare.
If we want to understand the independent relationship between IQ
and welfare, the standard analysis, using just age, IQ, and parental SES,
is not going to tell us much. We have to get rid of the confounding ef-
fects of being poor and unwed. For that reason, the analysis that yielded
the figure below extracted the effects of the marital status of the mother
Even after poverty and marital status are taken into account,
IQ played a substantial role in determining whether white
women eo on welfare
Probability of going on welfare within a year after birth
50% -
As lQ goes from low to high
As parental SES goes
from low to high
0% ,
I
I
I
I
Very low
Very high
(-2 SDs)
(+2 SDq)
Note: For computing the plot, age and either SES (for the hlack curves) or IQ (for the gray
curves) were set at their mean values. Additional independent variables of which the effects
have heen extracted for the plot: marital status at the time of first hirth, and pverty status
in the calendar year prior to the first birth.
Cognitive Ability and Welfare Dependency
- The analysis examines the independent relationship between IQ and welfare recipiency among white women, controlling for marital status and poverty.
- Even when accounting for socioeconomic background and marital status, cognitive ability remains a significant predictor of whether a woman goes on welfare after her first child.
- Statistical models show that a white woman at the 2nd IQ centile has a 47 percent chance of going on welfare, compared to only 8 percent for those at the 98th centile.
- Socioeconomic background was found to be a statistically insignificant factor in predicting welfare dependency when IQ and other variables were held constant.
- Welfare use among women with a bachelor's degree is extremely rare, with only one out of 102 women in the sample ever having received benefits.
- The data suggests that the impact of low intelligence on welfare use involves factors beyond just the failure to get an education or having a child out of wedlock.
The other variables swept away all of the connections between welfare and social class that seem so evident in everyday life.
194
Cognitive Classes and Social Behavior
Welfare Dependency
1 95
of going on welfare. Even within the population of women who go on
welfare, cognitive ability will vary, and the smarter ones will be better
able to get off.
No database until the NLSY has offered the chance to test these hy-
potheses in detail for a representative population. We begin as usual
with a look at the unadorned relationship with cognitive class.
Use of welfare is uncommon but not rare among these white moth-
ers, as the table below shows. Overall, 12 percent of the white mothers
Which White Women Go on Welfare
After the Birth of the First Child?
Percentage of
Percentage of
Mothers Who
Mothers Who
Went on AFDC
Became Chronic
Within a Year
Welfare
of First Birth
Cognitive Class
Recipients
1
I Very hright
d
4
11 Bright
2
12
I11 Normal
8
2 1
IV Dull
17
55
V Very dull
3 1
12
Overall average
9
"ample
= 17, with no one qualifying as a chronic welfare recipient. Mini-
mum sample reported: 25.
in the NLSY received welfare within a year of the birth of their first
child; 9 percent had become chronic recipients by our definition of
chronic welfare recipients (meaning that they had reported at least five
years of welfare income). Overall, 21 percent of white mothers had re-
ceived assistance from AFDC at some point in their live~.'~'
The differ-
ences among the cognitive classes are large, with a conspicuously large
jump in the rates at the bottom. The proportion of women in Class 1V
who became chronic welfare recipients is double the rate for Class 111,
with another big jump for Class V, to 31 percent of all mothers.
This result should come as no surprise, given what we already know
about the higher rates of illegitimate births in the lower half of the cog-
nitive ability distribution (Chapter 8). Women without husbands are
most at risk for going on welfare. We also know that poverty has a strong
association with the birth status of the child. In fact, it may be asked
whether we are looking at anything except a reflection of illegitimacy
and poverty in these figures. The answer is yes, but a somewhat differ-
ent "yes" for periodic and for chronic welfare recipiency.
GOING ON WELFARE AFTER THE BIRTH OF THE FIRST CHILD
First, we ask of the odds that a woman had received welfare by the end of
the first calendar year after the birth of her first child.[" In all cases, we
limit the analysis to white women whose first child was born prior to
1989, so that all have had a sufficient "chance" to go on welfare.
If we want to understand the independent relationship between IQ
and welfare, the standard analysis, using just age, IQ, and parental SES,
is not going to tell us much. We have to get rid of the confounding ef-
fects of being poor and unwed. For that reason, the analysis that yielded
the figure below extracted the effects of the marital status of the mother
Even after poverty and marital status are taken into account,
IQ played a substantial role in determining whether white
women eo on welfare
Probability of going on welfare within a year after birth
50% -
As lQ goes from low to high
As parental SES goes
from low to high
0% ,
I
I
I
I
Very low
Very high
(-2 SDs)
(+2 SDq)
Note: For computing the plot, age and either SES (for the hlack curves) or IQ (for the gray
curves) were set at their mean values. Additional independent variables of which the effects
have heen extracted for the plot: marital status at the time of first hirth, and pverty status
in the calendar year prior to the first birth.
196
Cognitive Classes and Social Behavior
Welfare Dependency
197
and whether she was below the poverty line in the year before birth, in
addition to the usual three variables. The dependent variable is whether
the mother received welfare benefits during the year after the birth of
her first child. As the black line indicates, cognitive ability predicts go-
ing on welfare even after the effects of marital status and poverty have
been extracted. This finding is worth thinking about, for it is not intu-
itively predictable. Presumably much of the impact of low intelligence
on being on welfare-the
failure to look ahead, to consider conse-
quences, or to get an education-is
already captured in the fact that the
woman had a baby out of wedlock. Other elements of competence, or
lack of it, are captured in the fact that the woman was poor before the
baby was born. Yet holding the effects of age, poverty, marital status,
and parental SES constant, a white woman with an IQ at the 2d cen-
tile had a 47 percent chance of going on welfare, compared to the 8 per-
cent chance facing a white woman at the 98th centile.
The socioeconomic background of these mothers was not a statisti-
cally significant factor in their going on welfare.
The Role of Education
We cannot analyze welfare recipiency among white women with a hach-
elor's degree because it was so rare: Of the 102 white mothers with a
R.A. (no more, no less) who met the criteria for the sample, 101 had
never received any welfare. But we can take a look at the high school
sample. For them, low cognitive ability was as decisive as for the entire
population of NLSY white mothers. The magnitude of the independent
effect of IQ was about the same, and the effect of socioeconomic status
was again statistically insignificant. The other variables swept away all
of the connections between welfare and social class that seem so evi.
dent in everyday life.
CHRONIC WELFARE DEPENDENCY
Now we focus on a subset of women who go on welfare, the chronic
welfare recipients. They constitute a world of their own. In the course
of the furious political and scholarly struggle over welfare during the
1980s, two stable and consistent findings emerged, each having different
implications: Taking all the women who ever go on welfare, the aver-
age spell lasts only about two years.7 Rut among never-married mothers
(all races) who had their babies in their teens, the average time on wel-
fare is eight or more years, depending on the sample being investigated.'
The white women who had met our definition of chronic welfare re-
cipient in the NLSY by the 1990 interview fit this profile to some ex-
tent. For example, of the white women who gave birth to an illegitimate
baby hefore they were 19 (that is, they probably got pregnant before they
would normally have graduated from high school) and stayed single, 22
percent became chronic welfare recipients by our definition-a
high
percentage compared to women at large. O n the other hancl, 22 percent
IS a long way from 100 percent. Even if we restrict the criteria further
so that we are talking about single teenage mothers who were below the
poverty line, the probability of hecoming a chronic welfare recipient
goes up only to 28 percent.
To get an idea of how restricted the population of chronic welfare
mothers is, consider the 152 white women in the NLSY who met our
definit~on of a chronic welfare recipient and also had IQ scores. None
of them was in Cognitive Class I, and only five were even in Class 11.
Only five had parents in the top quartile in socioeconomic class. One
lone woman of the 152 was from the top quartile in ahility and from the
top quartile in socioeconomic background. White women with above-
average cognitive ability or socioeconomic background rarely become
chron~c welfare recipients.
Keeping this tight restriction of range in mlnd, consider what hap-
pens when we repeat the previous analysis (including the extra variables
controlling for marital status and poverty at the time of first birth) but
this time comparing mothers who became chronic welfare recipients
with women who never received any welfare.'" According to the figure,
when it comes to chronic white welfare mothers, the independent ef-
fec t of the young woman's socioeconomic hackground is substantial.
Whether it becomes more important than IQ as the figure suggests is
doubtful (the corresponding analysis in Appendix 4 says no), but clearly
the role of socioeconomic background is different for all welfare recip-
ients and chronic ones. We spent much time exploring this shift in the
role of socioeconomic background, to try to pin down what was going
on. We will not describe our investigation with its many interesting hy-
ways, instead simply reporting where we came out. The answer turns out
to hinge on education.
Demographics of Chronic Welfare
- Research from the 1980s reveals a divide between short-term welfare spells, averaging two years, and chronic dependency, which often lasts eight or more years.
- Teenage motherhood and remaining single are significant risk factors, yet even among poor single teen mothers, only 28 percent become chronic recipients.
- Chronic welfare dependency is almost non-existent among white women with high cognitive ability or high socioeconomic backgrounds.
- Data from the NLSY shows that out of 152 chronic recipients, only one woman came from the top quartile of both ability and socioeconomic status.
- Education level is the most critical predictor, with over half of chronic recipients lacking a high school diploma and fewer than one percent holding a college degree.
White women with above-average cognitive ability or socioeconomic background rarely become chronic welfare recipients.
196
Cognitive Classes and Social Behavior
Welfare Dependency
197
and whether she was below the poverty line in the year before birth, in
addition to the usual three variables. The dependent variable is whether
the mother received welfare benefits during the year after the birth of
her first child. As the black line indicates, cognitive ability predicts go-
ing on welfare even after the effects of marital status and poverty have
been extracted. This finding is worth thinking about, for it is not intu-
itively predictable. Presumably much of the impact of low intelligence
on being on welfare-the
failure to look ahead, to consider conse-
quences, or to get an education-is
already captured in the fact that the
woman had a baby out of wedlock. Other elements of competence, or
lack of it, are captured in the fact that the woman was poor before the
baby was born. Yet holding the effects of age, poverty, marital status,
and parental SES constant, a white woman with an IQ at the 2d cen-
tile had a 47 percent chance of going on welfare, compared to the 8 per-
cent chance facing a white woman at the 98th centile.
The socioeconomic background of these mothers was not a statisti-
cally significant factor in their going on welfare.
The Role of Education
We cannot analyze welfare recipiency among white women with a hach-
elor's degree because it was so rare: Of the 102 white mothers with a
R.A. (no more, no less) who met the criteria for the sample, 101 had
never received any welfare. But we can take a look at the high school
sample. For them, low cognitive ability was as decisive as for the entire
population of NLSY white mothers. The magnitude of the independent
effect of IQ was about the same, and the effect of socioeconomic status
was again statistically insignificant. The other variables swept away all
of the connections between welfare and social class that seem so evi.
dent in everyday life.
CHRONIC WELFARE DEPENDENCY
Now we focus on a subset of women who go on welfare, the chronic
welfare recipients. They constitute a world of their own. In the course
of the furious political and scholarly struggle over welfare during the
1980s, two stable and consistent findings emerged, each having different
implications: Taking all the women who ever go on welfare, the aver-
age spell lasts only about two years.7 Rut among never-married mothers
(all races) who had their babies in their teens, the average time on wel-
fare is eight or more years, depending on the sample being investigated.'
The white women who had met our definition of chronic welfare re-
cipient in the NLSY by the 1990 interview fit this profile to some ex-
tent. For example, of the white women who gave birth to an illegitimate
baby hefore they were 19 (that is, they probably got pregnant before they
would normally have graduated from high school) and stayed single, 22
percent became chronic welfare recipients by our definition-a
high
percentage compared to women at large. O n the other hancl, 22 percent
IS a long way from 100 percent. Even if we restrict the criteria further
so that we are talking about single teenage mothers who were below the
poverty line, the probability of hecoming a chronic welfare recipient
goes up only to 28 percent.
To get an idea of how restricted the population of chronic welfare
mothers is, consider the 152 white women in the NLSY who met our
definit~on of a chronic welfare recipient and also had IQ scores. None
of them was in Cognitive Class I, and only five were even in Class 11.
Only five had parents in the top quartile in socioeconomic class. One
lone woman of the 152 was from the top quartile in ahility and from the
top quartile in socioeconomic background. White women with above-
average cognitive ability or socioeconomic background rarely become
chron~c welfare recipients.
Keeping this tight restriction of range in mlnd, consider what hap-
pens when we repeat the previous analysis (including the extra variables
controlling for marital status and poverty at the time of first birth) but
this time comparing mothers who became chronic welfare recipients
with women who never received any welfare.'" According to the figure,
when it comes to chronic white welfare mothers, the independent ef-
fec t of the young woman's socioeconomic hackground is substantial.
Whether it becomes more important than IQ as the figure suggests is
doubtful (the corresponding analysis in Appendix 4 says no), but clearly
the role of socioeconomic background is different for all welfare recip-
ients and chronic ones. We spent much time exploring this shift in the
role of socioeconomic background, to try to pin down what was going
on. We will not describe our investigation with its many interesting hy-
ways, instead simply reporting where we came out. The answer turns out
to hinge on education.
198
Cognitive Classes and Social Behavior
Welfare Dependency
199
Socioeconomic background and IQ are both important
in determining whether white women become
chronic welfare recipients
Probability of being a chronic welfare recipient
As parental SES goesfrom low to high
30% -
0% ,
I
1
I
I
Very low
Very high
(-2 SDS)
(+? SDs)
Note: For computing the plot, age and either SES (for the black curves) or 1Q (for the gray
curves) were set at their mean values. Additional independent variables of which the effects
have been extracted for the plot: marital status at the time of first birth, and pjveny starus
in the calendar year prlor to the first birth.
The Rok of Education
White chronic welfare recipients are virtually all women with modest
education at best, as set out in the next table. More than half of the
chronic welfare recipients had not gotten a high school diploma; only
six-tenths of 1 percent had gotten a college education. As in the case
of IQ and socioeconomic status, this is a radically unrepresentative sam-
ple of white ~ornen.''~'
It is obviously impossible (as well as unneces-
sary) to analyze chronic welfare recipiency among college graduates.
The women for whom socioeconomic background was the main risk
factor for being chronically on welfare are those who had not finished
high school, For women with a high school diploma or more, IQ was
Educational Attainment of White
Chronic Welfare Recipients
Highest Degree
Percentage
Advanced degree
0
B.A. or B.S.
1
Associate degree
3
High school diploma
42
GED
16
Less than high school
3 8
more important than socioeconomic status (other things equal) in af-
fecting the probability of becoming a chronic welfare recipient.'"'
Why? Apparently the women who did not finish high school and had
an illegitimate child were selected for low intelligence, especially if they
had the child while still in high school.'12' The average IQ of these
women was about 91, and analysis tells us that further variation in cog-
nitive ability does not have much power to predict which ones become
chronic welfare cases.'"' Instead, for this narrowly screened group of
women, family background matters more. Without trying to push the
analysis much further, a plausible explanation is that for most white
American parents, having a school-aged child go on welfare is highly
stigmatizing to them. If the daughter of a working-class or middle-class
couple has an illegitimate baby out of wedlock while still in high school,
chances are that her parents will take over support for the new baby
rather than let their daughter go on welfare. The parents who do not
keep their school.aged daughter off welfare will tend to be those who
are not deterred by the stigma or who are themselves too poor to sup-
port the new baby. Both sets of parents earn low scores on the socio-
economic status index. Hence what we are observing in the case of
chronic welfare recipiency among young women who do not finish high
school may reflect parental behavior as much as the young mother's be-
havior.'"'
Other hypotheses are possible, however. Generally these results pro-
vide evidence for those who argue that a culture of poverty transmits
chronic welfare dependency from one generation to the next. Our
analysis adds that women who are susceptible to this culture are likely
to have low intelligence in the first place.
Intelligence and Welfare Dependency
- The text argues that cognitive ability is a more significant predictor of chronic welfare dependency than socioeconomic status for women with at least a high school education.
- Among women who drop out of high school to have children, family background and parental support play a larger role in determining welfare status than the mother's own IQ.
- The authors suggest that middle-class and working-class parents often prevent their daughters from entering the welfare system due to social stigma, whereas lower-SES parents may lack the means or motivation to do so.
- Data shows a clear downward trend in mean IQ scores from women who remain childless or marry (105) to those who become chronic welfare recipients (92).
- The analysis supports the 'culture of poverty' theory, adding that those most susceptible to this cycle often possess lower cognitive ability.
- The prospect of welfare is theorized to be most attractive to women who are 'thinking least clearly about their futures' due to lower intelligence.
Altogether, almost a standard deviation separated the IQs of white women who became chronic welfare recipients from those who remained childless or had children within marriage.
198
Cognitive Classes and Social Behavior
Welfare Dependency
199
Socioeconomic background and IQ are both important
in determining whether white women become
chronic welfare recipients
Probability of being a chronic welfare recipient
As parental SES goesfrom low to high
30% -
0% ,
I
1
I
I
Very low
Very high
(-2 SDS)
(+? SDs)
Note: For computing the plot, age and either SES (for the black curves) or 1Q (for the gray
curves) were set at their mean values. Additional independent variables of which the effects
have been extracted for the plot: marital status at the time of first birth, and pjveny starus
in the calendar year prlor to the first birth.
The Rok of Education
White chronic welfare recipients are virtually all women with modest
education at best, as set out in the next table. More than half of the
chronic welfare recipients had not gotten a high school diploma; only
six-tenths of 1 percent had gotten a college education. As in the case
of IQ and socioeconomic status, this is a radically unrepresentative sam-
ple of white ~ornen.''~'
It is obviously impossible (as well as unneces-
sary) to analyze chronic welfare recipiency among college graduates.
The women for whom socioeconomic background was the main risk
factor for being chronically on welfare are those who had not finished
high school, For women with a high school diploma or more, IQ was
Educational Attainment of White
Chronic Welfare Recipients
Highest Degree
Percentage
Advanced degree
0
B.A. or B.S.
1
Associate degree
3
High school diploma
42
GED
16
Less than high school
3 8
more important than socioeconomic status (other things equal) in af-
fecting the probability of becoming a chronic welfare recipient.'"'
Why? Apparently the women who did not finish high school and had
an illegitimate child were selected for low intelligence, especially if they
had the child while still in high school.'12' The average IQ of these
women was about 91, and analysis tells us that further variation in cog-
nitive ability does not have much power to predict which ones become
chronic welfare cases.'"' Instead, for this narrowly screened group of
women, family background matters more. Without trying to push the
analysis much further, a plausible explanation is that for most white
American parents, having a school-aged child go on welfare is highly
stigmatizing to them. If the daughter of a working-class or middle-class
couple has an illegitimate baby out of wedlock while still in high school,
chances are that her parents will take over support for the new baby
rather than let their daughter go on welfare. The parents who do not
keep their school.aged daughter off welfare will tend to be those who
are not deterred by the stigma or who are themselves too poor to sup-
port the new baby. Both sets of parents earn low scores on the socio-
economic status index. Hence what we are observing in the case of
chronic welfare recipiency among young women who do not finish high
school may reflect parental behavior as much as the young mother's be-
havior.'"'
Other hypotheses are possible, however. Generally these results pro-
vide evidence for those who argue that a culture of poverty transmits
chronic welfare dependency from one generation to the next. Our
analysis adds that women who are susceptible to this culture are likely
to have low intelligence in the first place.
200
Cognitive CClass and Social Behavior
Welfare Dependency
20 1
DRAWING TOGETHER THE FINDINGS ON ILLEGITIMACY
AND WELFARE
As social scientists often do, we have spent much effort burrowing
through analyses that ultimately point to simple conclusions. Here is
how a great many parents around America have put it to their daugh-
ters: Having a baby without a husband is a dumb thing to do. Going on
welfare is an even dumber thing to do, if you can possibly avoid it. And
so it would seem to be among the white women in the NLSY. White
women who remained childless or had babies within marriage had a
mean IQ of 105. Those who had an illegitimate baby but never went on
welfare had a mean IQ of 98. Those who went on welfare but did not
become chronic recipients had a mean IQ of 94. Those who became
chronic welfare recipients had a mean IQ of 92.'15' Altogether, almost a
standard deviation separated the IQs of white women who became
chronic welfare recipients from those who remained childless or had
children within marriage.
In Chapter 8, we demonstrated that a low IQ is a factor in illegiti-
mate births that cannot be explained away by the woman's socio-
economic background, a broken family, or poverty at the time the child
was conceived. In particular, poor women of low intelligence seemed
especially likely to have illegitimate babies, which is consistent with the
idea that the prospect of welfare looms largest for women who are think-
ing least clearly about their futures. In this chapter, we have demon-
strated that even among women who are poor and even among those
who have a baby without a husband, the less intelligent tend to he the
ones who use the welfare system.
Two qualifications to this conclusion are that (1) we have no way
of knowing whether higher education or higher IQ explains why
college graduates do not use welfare-all
we know is that welfare is
almost unknown among college-educated whites, but that for women
with a high school education, intelligence plays a large independent
role-and
(2) for the low-IQ women without a high school education
who become chronic welfare recipients, a low socioeconomic back-
ground is a more important predictor than any further influence of
cognitive ability.
The remaining issue, which we defer to the discussion of welfare pol-
icy in Chapter 22, is how to reconcile two conflicting possibilities, both
of which may have some truth to them: Going on welfare really is a
dumb idea, and that is why women who are low in cognitive ability end
up there; but also such women have little to take to the job market, and
welfare is one of their few appropriate recourses when they have a baby
to care for and no husband to help.
Intelligence and Parental Competence
- Welfare usage is rare among college-educated whites, but for those with less education, cognitive ability serves as a significant independent predictor of welfare dependency.
- The text explores the tension between viewing welfare as a 'dumb idea' and viewing it as a necessary recourse for women with limited job market value.
- Research indicates that IQ often explains parenting differences previously attributed to socioeconomic status or education levels.
- Low maternal IQ in the NLSY sample correlates with negative outcomes including low birth weight and poor motor or social development in toddlers.
- While high IQ is not a prerequisite for good parenting, the most detrimental home environments are disproportionately concentrated among mothers with low cognitive scores.
- Parenting is framed as a public concern because it determines whether children become productive citizens or social burdens.
The disquieting finding is that the worst environments for raising children, of the kind that not even the most resilient children can easily overcome, are concentrated in the homes in which the mothers are at the low end of the intelligence distribution.
200
Cognitive CClass and Social Behavior
Welfare Dependency
20 1
DRAWING TOGETHER THE FINDINGS ON ILLEGITIMACY
AND WELFARE
As social scientists often do, we have spent much effort burrowing
through analyses that ultimately point to simple conclusions. Here is
how a great many parents around America have put it to their daugh-
ters: Having a baby without a husband is a dumb thing to do. Going on
welfare is an even dumber thing to do, if you can possibly avoid it. And
so it would seem to be among the white women in the NLSY. White
women who remained childless or had babies within marriage had a
mean IQ of 105. Those who had an illegitimate baby but never went on
welfare had a mean IQ of 98. Those who went on welfare but did not
become chronic recipients had a mean IQ of 94. Those who became
chronic welfare recipients had a mean IQ of 92.'15' Altogether, almost a
standard deviation separated the IQs of white women who became
chronic welfare recipients from those who remained childless or had
children within marriage.
In Chapter 8, we demonstrated that a low IQ is a factor in illegiti-
mate births that cannot be explained away by the woman's socio-
economic background, a broken family, or poverty at the time the child
was conceived. In particular, poor women of low intelligence seemed
especially likely to have illegitimate babies, which is consistent with the
idea that the prospect of welfare looms largest for women who are think-
ing least clearly about their futures. In this chapter, we have demon-
strated that even among women who are poor and even among those
who have a baby without a husband, the less intelligent tend to he the
ones who use the welfare system.
Two qualifications to this conclusion are that (1) we have no way
of knowing whether higher education or higher IQ explains why
college graduates do not use welfare-all
we know is that welfare is
almost unknown among college-educated whites, but that for women
with a high school education, intelligence plays a large independent
role-and
(2) for the low-IQ women without a high school education
who become chronic welfare recipients, a low socioeconomic back-
ground is a more important predictor than any further influence of
cognitive ability.
The remaining issue, which we defer to the discussion of welfare pol-
icy in Chapter 22, is how to reconcile two conflicting possibilities, both
of which may have some truth to them: Going on welfare really is a
dumb idea, and that is why women who are low in cognitive ability end
up there; but also such women have little to take to the job market, and
welfare is one of their few appropriate recourses when they have a baby
to care for and no husband to help.
Chapter 10
Parenting
Everyone agrees, in the abstract and at the extremes, that there is good par-
enting and poor parenting. This chapter addresses the uncomfortable ques-
tion: Is the competence of parents at all affected by how intelligent they are?
It has been known for some time that socioeconomic class and parenting
are linked, both to disciplinary practices and to the many ways in which the
intellectual and emotional development of the child are fostered. O n both
counts, parents with higher socioeconomic status look better. At the other end
of the parenting continuum, neglect and a h e are heavily concentrated in the
lower socioeconomic classes.
Whenever an IQ measure has been introduced into studies of parent-child
relationships, it has explained away much of the differences that otherwise
would have been attributed to education or social c h s , but the examples are
sparse. The NLSY provides an opportunity to fill in a few of the gaps.
With regard to prenatal and infant care, low IQ among the white mothers
in the NLSY sample was related to low birth weight, even after controlling for
socioeconomic background, poverty, and age of the mother. In the NLSY's
surveys of the home environment, mothers in the top cognitive classes pro-
vided, on average, better environments for children than the mothers in the
bottom cognitive classes. Socioeconomic background and current poverty also
played significant roles, depending on the specific type of measure and the age
of the children.
In the NLSY's measures of child development, low maternal IQ was asso-
ciated with problematic temperament in the baby and with low scores on an
index of "fnendliness," with poor motor and social development of toddkrs
and with behavioral problems from age 4 on up. Poverty usually had a mod-
est independent role but did not usually diminish the conmbution of IQ (which
was usually also modest). Predictably, the mother's IQ was also strongly re-
lated to the IQ of the child.
Taking these data together, the NLSY results say clearly that high IQ is by
no means a prerequisite for being a good mother. The disquieting finding is
204
Cognitive Classes and Social Behavior
Parenting
205
that the worst environments for raising children, of the kind that not even the
most resilient children can easily overcome, are concentrated in the homes in
which the mothers are at the low end of the intelligence distribution.
P
arenting, in one sense the most private of behaviors, is in another
the most public. Parents make a difference in the way their children
turn out-whether
they become law abiding or criminal, generous or
stingy, productive or dependent. How well parents raise their children
has much to do with how well the society functions.
But how are parents to know whether they are doing a good or a bad
job as parents? The results seem to be hopelessly unpredictable. Most
people know at least one couple who seem to be the ideal parents but
whose teenage child ends up on drugs. Parents with more than one child
are bemused by how differently their children respond to the same home
and parental style. And what makes a good parent anyway? Most peo-
ple also have friends who seem to be raising their children all wrong,
and yet the children flourish.
The exceptions notwithstanding, the apparent unpredictability of
parenting is another of those illusions fostered by the ground-level view
of life as we live it from day to day. Parenting is more predictable in the
aggregate than in the particular. The differences in parenting style that
you observe among your friends are usually minor-the
"restriction of
range" problem that we discussed in Chapter 3. A middle-class mother
may think that one of her friends is far too permissive or strict, but put
against the full range of variation that police and social workers are
forced to deal with, where "permissiveness" is converted into the num-
ber of days that small children are left on their own and "strictness" may
be calibrated by the number of stitches required to close the wounds
from a parental beating, the differences between her and her friend are
probably small.
Despite all the differences among children and parents, there is such
a thing as good parenting as opposed to bad-not
precisely defined but
generally understood. Our discussion proceeds from the assumption that
good parenting includes (though is not restricted to) seeing to nourish-
ment and health, keeping safe from harm, feeling and expressing love,
talking with and listening to, helping to explore the world, imparting
values, and providing a framework of rules enforced consistently but not
inflexibly. Parents who more or less manage to do all those things, we
assert, are better parents than people who do not. The touchy question
of this chapter is: Does cognitive ability play any role in this? Are peo-
ple with high IQs generally better parents than people with low IQs?
SOCIAL CLASS AND PARENTING STYLES
The relationship of IQ to parenting is another of those issues that so-
cial scientists have been slow to investigate. Furthermore, this is a topic
for which the NLSY is limited. For unemployment, school dropout, il-
legitimacy, or welfare recipiency, the NLSY permits us to cut directly to
the question, What does cognitive ability have to do with this behav-
ior? But many of the NLSY indicators about parenting give only indi-
rect evidence. To interpret that evidence, it is useful to begin with the
large body of studies that have investigated whether social class affects
parenting. Having described that relationship (which by now is rea-
sonably well understood), we will be on firmer ground in drawing in-
ferences about cognitive ability.
The first scholarly study of parenting styles among parents of differ*
ent social classes dates back to 1936 and a White House conference on
children.' Ever since, the anthropologists and sociologists have told sim-
ilar stories. Working-class parents tend to be more authoritarian than
middle-class parents. Working-class parents tend to use physical pun-
ishment and direct commands, whereas middle-class parents tend to use
reasoning and appeals to more abstract principles of behavior. The con-
sistency of these findings extends from the earliest studies to the most
recent, PI
In an influential article published in 1959, Melvin Kohn proposed
that the underlying difference was that working-class parents were most
concerned about qualities in their children that ensure respectability,
whereas middle-class parents were most concerned about internalized
standards of c ~ n d u c t . ~
Kohn argued that the real difference in the use
of physical punishment was not that working-class parents punish more
but that they punish differently from middle-class parents. Immediate
irritants like boisterous play might evoke a whack from working-class
parents, whereas middle-class parents tended to punish when the intent
of the child's behavior (knowingly hurting another child, for example)
was problematic.4 Kohn concluded that "the working-class orientation
. . . places few restraints on the impulse to punish the child when his be-
havior is out of bounds. Instead, it provides a positive rationale for pun-
Cognitive Ability and Parenting Styles
- The apparent unpredictability of parenting outcomes is often an illusion caused by a narrow observation of middle-class variation.
- Good parenting is defined by providing nourishment, safety, love, consistent rules, and intellectual engagement.
- Social scientists have historically focused on how social class, rather than IQ, influences parenting techniques.
- Working-class parents tend to favor authoritarian styles and physical punishment to ensure respectability.
- Middle-class parents generally prioritize internalized standards of conduct and use reasoning to guide behavior.
- The text questions whether cognitive ability is a primary driver behind these observed differences in parenting quality.
A middle-class mother may think that one of her friends is far too permissive or strict, but put against the full range of variation that police and social workers are forced to deal with, the differences between her and her friend are probably small.
204
Cognitive Classes and Social Behavior
Parenting
205
that the worst environments for raising children, of the kind that not even the
most resilient children can easily overcome, are concentrated in the homes in
which the mothers are at the low end of the intelligence distribution.
P
arenting, in one sense the most private of behaviors, is in another
the most public. Parents make a difference in the way their children
turn out-whether
they become law abiding or criminal, generous or
stingy, productive or dependent. How well parents raise their children
has much to do with how well the society functions.
But how are parents to know whether they are doing a good or a bad
job as parents? The results seem to be hopelessly unpredictable. Most
people know at least one couple who seem to be the ideal parents but
whose teenage child ends up on drugs. Parents with more than one child
are bemused by how differently their children respond to the same home
and parental style. And what makes a good parent anyway? Most peo-
ple also have friends who seem to be raising their children all wrong,
and yet the children flourish.
The exceptions notwithstanding, the apparent unpredictability of
parenting is another of those illusions fostered by the ground-level view
of life as we live it from day to day. Parenting is more predictable in the
aggregate than in the particular. The differences in parenting style that
you observe among your friends are usually minor-the
"restriction of
range" problem that we discussed in Chapter 3. A middle-class mother
may think that one of her friends is far too permissive or strict, but put
against the full range of variation that police and social workers are
forced to deal with, where "permissiveness" is converted into the num-
ber of days that small children are left on their own and "strictness" may
be calibrated by the number of stitches required to close the wounds
from a parental beating, the differences between her and her friend are
probably small.
Despite all the differences among children and parents, there is such
a thing as good parenting as opposed to bad-not
precisely defined but
generally understood. Our discussion proceeds from the assumption that
good parenting includes (though is not restricted to) seeing to nourish-
ment and health, keeping safe from harm, feeling and expressing love,
talking with and listening to, helping to explore the world, imparting
values, and providing a framework of rules enforced consistently but not
inflexibly. Parents who more or less manage to do all those things, we
assert, are better parents than people who do not. The touchy question
of this chapter is: Does cognitive ability play any role in this? Are peo-
ple with high IQs generally better parents than people with low IQs?
SOCIAL CLASS AND PARENTING STYLES
The relationship of IQ to parenting is another of those issues that so-
cial scientists have been slow to investigate. Furthermore, this is a topic
for which the NLSY is limited. For unemployment, school dropout, il-
legitimacy, or welfare recipiency, the NLSY permits us to cut directly to
the question, What does cognitive ability have to do with this behav-
ior? But many of the NLSY indicators about parenting give only indi-
rect evidence. To interpret that evidence, it is useful to begin with the
large body of studies that have investigated whether social class affects
parenting. Having described that relationship (which by now is rea-
sonably well understood), we will be on firmer ground in drawing in-
ferences about cognitive ability.
The first scholarly study of parenting styles among parents of differ*
ent social classes dates back to 1936 and a White House conference on
children.' Ever since, the anthropologists and sociologists have told sim-
ilar stories. Working-class parents tend to be more authoritarian than
middle-class parents. Working-class parents tend to use physical pun-
ishment and direct commands, whereas middle-class parents tend to use
reasoning and appeals to more abstract principles of behavior. The con-
sistency of these findings extends from the earliest studies to the most
recent, PI
In an influential article published in 1959, Melvin Kohn proposed
that the underlying difference was that working-class parents were most
concerned about qualities in their children that ensure respectability,
whereas middle-class parents were most concerned about internalized
standards of c ~ n d u c t . ~
Kohn argued that the real difference in the use
of physical punishment was not that working-class parents punish more
but that they punish differently from middle-class parents. Immediate
irritants like boisterous play might evoke a whack from working-class
parents, whereas middle-class parents tended to punish when the intent
of the child's behavior (knowingly hurting another child, for example)
was problematic.4 Kohn concluded that "the working-class orientation
. . . places few restraints on the impulse to punish the child when his be-
havior is out of bounds. Instead, it provides a positive rationale for pun-
Class Differences in Parenting
- Working-class parents tend to discipline based on the immediate irritation of a child's behavior, whereas middle-class parents focus on the child's underlying intent.
- Research suggests working-class physical punishment is often impulsive and serves as emotional relief for the parent rather than a strategic pedagogical tool.
- The author argues that middle-class parenting is qualitatively 'better' rather than just different, a claim often avoided by social scientists.
- Intellectual development varies by class; middle-class parents engage in 'Gateway' style interactions that encourage questioning and abstract reasoning.
- Working-class 'Roadville' parents prioritize directives and rote learning, which helps children in early grades but leaves them struggling with imaginative or analytical tasks.
- Middle-class conversational habits, such as discussing story meanings, serve as informal training for standardized intelligence tests and academic success.
The middle-class way sounds like 'better' behavior on the part of parents, not just a neutral socioeconomic difference in parenting style.
204
Cognitive Classes and Social Behavior
Parenting
205
that the worst environments for raising children, of the kind that not even the
most resilient children can easily overcome, are concentrated in the homes in
which the mothers are at the low end of the intelligence distribution.
P
arenting, in one sense the most private of behaviors, is in another
the most public. Parents make a difference in the way their children
turn out-whether
they become law abiding or criminal, generous or
stingy, productive or dependent. How well parents raise their children
has much to do with how well the society functions.
But how are parents to know whether they are doing a good or a bad
job as parents? The results seem to be hopelessly unpredictable. Most
people know at least one couple who seem to be the ideal parents but
whose teenage child ends up on drugs. Parents with more than one child
are bemused by how differently their children respond to the same home
and parental style. And what makes a good parent anyway? Most peo-
ple also have friends who seem to be raising their children all wrong,
and yet the children flourish.
The exceptions notwithstanding, the apparent unpredictability of
parenting is another of those illusions fostered by the ground-level view
of life as we live it from day to day. Parenting is more predictable in the
aggregate than in the particular. The differences in parenting style that
you observe among your friends are usually minor-the
"restriction of
range" problem that we discussed in Chapter 3. A middle-class mother
may think that one of her friends is far too permissive or strict, but put
against the full range of variation that police and social workers are
forced to deal with, where "permissiveness" is converted into the num-
ber of days that small children are left on their own and "strictness" may
be calibrated by the number of stitches required to close the wounds
from a parental beating, the differences between her and her friend are
probably small.
Despite all the differences among children and parents, there is such
a thing as good parenting as opposed to bad-not
precisely defined but
generally understood. Our discussion proceeds from the assumption that
good parenting includes (though is not restricted to) seeing to nourish-
ment and health, keeping safe from harm, feeling and expressing love,
talking with and listening to, helping to explore the world, imparting
values, and providing a framework of rules enforced consistently but not
inflexibly. Parents who more or less manage to do all those things, we
assert, are better parents than people who do not. The touchy question
of this chapter is: Does cognitive ability play any role in this? Are peo-
ple with high IQs generally better parents than people with low IQs?
SOCIAL CLASS AND PARENTING STYLES
The relationship of IQ to parenting is another of those issues that so-
cial scientists have been slow to investigate. Furthermore, this is a topic
for which the NLSY is limited. For unemployment, school dropout, il-
legitimacy, or welfare recipiency, the NLSY permits us to cut directly to
the question, What does cognitive ability have to do with this behav-
ior? But many of the NLSY indicators about parenting give only indi-
rect evidence. To interpret that evidence, it is useful to begin with the
large body of studies that have investigated whether social class affects
parenting. Having described that relationship (which by now is rea-
sonably well understood), we will be on firmer ground in drawing in-
ferences about cognitive ability.
The first scholarly study of parenting styles among parents of differ*
ent social classes dates back to 1936 and a White House conference on
children.' Ever since, the anthropologists and sociologists have told sim-
ilar stories. Working-class parents tend to be more authoritarian than
middle-class parents. Working-class parents tend to use physical pun-
ishment and direct commands, whereas middle-class parents tend to use
reasoning and appeals to more abstract principles of behavior. The con-
sistency of these findings extends from the earliest studies to the most
recent, PI
In an influential article published in 1959, Melvin Kohn proposed
that the underlying difference was that working-class parents were most
concerned about qualities in their children that ensure respectability,
whereas middle-class parents were most concerned about internalized
standards of c ~ n d u c t . ~
Kohn argued that the real difference in the use
of physical punishment was not that working-class parents punish more
but that they punish differently from middle-class parents. Immediate
irritants like boisterous play might evoke a whack from working-class
parents, whereas middle-class parents tended to punish when the intent
of the child's behavior (knowingly hurting another child, for example)
was problematic.4 Kohn concluded that "the working-class orientation
. . . places few restraints on the impulse to punish the child when his be-
havior is out of bounds. Instead, it provides a positive rationale for pun-
206
Cognitive Classes and Social Behavior
Parenting
207
ishing the child in precisely those circumstances when one might most
like to do ~ 0 . " ~
To put it more plainly, Kohn found that working-class
parents were more likely to use physical punishment impulsively, when
the parents themselves needed the relief, not when it was likely to do
the child the most good.
The middle-class way sounds like "better" behavior on the part of par-
ents, not just a neutral socioeconomic difference in parenting style, and
this raises a point that scholars on child development bend over back-
ward to avoid saying explicitly: Generally, and keeping in mind the
many exceptions, the conclusion to be drawn from the literature on par-
enting is that middle-class people are in fact better parents, on average,
than working-class people. Readers who bridle at this suggestion are in-
vited to reread the Kohn quotation above and ask themselves whether
they can avoid making a value judgment about it.
Parenting differences among the social classes are not restricted to
matters of discipline. Other major differences show up in the intellec-
tual development of the child. Anthropologist Shirley Brice ~ e a t h '
gives vivid examples in her description of parenting in "Roadville," a
white lower-class community in the Carolinas, versus "Gateway," a
nearby community of white middle-class parents.'71 The parents of Road-
ville were just as devoted to their children as the parents of Gateway.
Roadville newborns came home to nurseries complete with the same
mobiles, pictures, and books that the Gateway babies had. From an early
age, Roadville children were held on laps and read to, talked to, and
otherwise made as much the center of attention as Gateway babies. But
the interactions differed, Heath found. Take bedtime stories, for exam-
ple. In middle-class Gateway, the mother or father encouraged the chil-
dren to ask questions and talk about what the stories meant, pointing
at items on the page and asking what they were. The middle-class par-
ents praised right answers and explained what was wrong with wrong
ones.% It is no great stretch to argue, as Robert Sternberg and others do,
that this interaction amounts to excellent training for intelligence tests.
Lower-class Roadville parents did not do nearly as much of that kind of
explaining and asking9 When the children were learning to do new
tasks, the Roadville parents did not explain the "how" of things the way
the Gateway parents did. Instead, the Roadville parents were more
likely to issue directives ('(Don't twist the cookie cutter") and hardly
ever gave reasons for their instructions ("If you twist the cutter, the
cookies will be rough on the edge").10
When they got to school, the Roadville and Gateway children con-
tinued to differ. The working-class Roadville children ~erformed well
in the early tasks of each of the first three grades. They knew the al-
phabet when they went to kindergarten; they knew how to sit still in
class and could perform well in the reading exercises that asked them
to identify specific portions of words or to link two items on the same
page of the book. But if the teacher asked, "What did you like about the
story!" or "What would you have done if you had been the child in that
story!" the Roadville children were likely to say "I don't know" or shrug
their shoulders, while the middle-class Gateway children would more
often respond easily and imaginatively."
Heath's conclusions drawn from her anthropological observations are
buttressed by the quantitative work that has been done to date. A review
of the technical literature in the mid-1980s put it bluntly: "It is an empird
ical fact that children from relatively higher SES families receive an intel-
lectually more advantageous home environment. This finding holds for
white, black, and Hispanic children, for children within lower- and
middle-SES families, as well as for children born preterm and full-term.'"'
SOCIAL CLASS AND MALPARENTING
To this point, we have been talking about parenting within the normal
range. Now we turn to child neglect and child abuse, increasingly la-
beled "malparenting" in the technical literature.
Abuse and neglect are distinct. The physical battering and other
forms of extreme physical and emotional punishment that constitute
child abuse get most of the publicity, but child neglect is far more com-
mon, by ratios ranging from three to one to ten to one, depending on
the study.13 Among the distinctions that the experts draw between child
abuse and neglect are these:
Abuse is an act of commission, while neglect is more commonly
an act of omission.
Abuse is typically episodic and of short duration; neglect is chronic
and continual.
Abuse typically arises from impulsive outbursts of aggression and
anger; neglect arises from indifference, inattentiveness, or being
overwhelmed by parenthood.'141
Social Class and Malparenting
- Research confirms that children from higher socioeconomic backgrounds consistently receive more intellectually advantageous home environments across all racial groups.
- The technical literature distinguishes between child abuse as an act of commission and child neglect as a chronic act of omission.
- Neglect is significantly more common than abuse, occurring at ratios between three to one and ten to one.
- While extreme abuse can occur randomly across all demographics due to parental derangement, most malparenting is heavily concentrated in lower socioeconomic classes.
- The definition of neglect can be subjective, as behaviors considered normal in poor communities might be classified as neglect in more affluent neighborhoods.
- Despite the common belief that abuse afflicts all communities equally, data suggests a strong correlation between social class and the prevalence of malparenting.
Abuse is typically episodic and of short duration; neglect is chronic and continual.
206
Cognitive Classes and Social Behavior
Parenting
207
ishing the child in precisely those circumstances when one might most
like to do ~ 0 . " ~
To put it more plainly, Kohn found that working-class
parents were more likely to use physical punishment impulsively, when
the parents themselves needed the relief, not when it was likely to do
the child the most good.
The middle-class way sounds like "better" behavior on the part of par-
ents, not just a neutral socioeconomic difference in parenting style, and
this raises a point that scholars on child development bend over back-
ward to avoid saying explicitly: Generally, and keeping in mind the
many exceptions, the conclusion to be drawn from the literature on par-
enting is that middle-class people are in fact better parents, on average,
than working-class people. Readers who bridle at this suggestion are in-
vited to reread the Kohn quotation above and ask themselves whether
they can avoid making a value judgment about it.
Parenting differences among the social classes are not restricted to
matters of discipline. Other major differences show up in the intellec-
tual development of the child. Anthropologist Shirley Brice ~ e a t h '
gives vivid examples in her description of parenting in "Roadville," a
white lower-class community in the Carolinas, versus "Gateway," a
nearby community of white middle-class parents.'71 The parents of Road-
ville were just as devoted to their children as the parents of Gateway.
Roadville newborns came home to nurseries complete with the same
mobiles, pictures, and books that the Gateway babies had. From an early
age, Roadville children were held on laps and read to, talked to, and
otherwise made as much the center of attention as Gateway babies. But
the interactions differed, Heath found. Take bedtime stories, for exam-
ple. In middle-class Gateway, the mother or father encouraged the chil-
dren to ask questions and talk about what the stories meant, pointing
at items on the page and asking what they were. The middle-class par-
ents praised right answers and explained what was wrong with wrong
ones.% It is no great stretch to argue, as Robert Sternberg and others do,
that this interaction amounts to excellent training for intelligence tests.
Lower-class Roadville parents did not do nearly as much of that kind of
explaining and asking9 When the children were learning to do new
tasks, the Roadville parents did not explain the "how" of things the way
the Gateway parents did. Instead, the Roadville parents were more
likely to issue directives ('(Don't twist the cookie cutter") and hardly
ever gave reasons for their instructions ("If you twist the cutter, the
cookies will be rough on the edge").10
When they got to school, the Roadville and Gateway children con-
tinued to differ. The working-class Roadville children ~erformed well
in the early tasks of each of the first three grades. They knew the al-
phabet when they went to kindergarten; they knew how to sit still in
class and could perform well in the reading exercises that asked them
to identify specific portions of words or to link two items on the same
page of the book. But if the teacher asked, "What did you like about the
story!" or "What would you have done if you had been the child in that
story!" the Roadville children were likely to say "I don't know" or shrug
their shoulders, while the middle-class Gateway children would more
often respond easily and imaginatively."
Heath's conclusions drawn from her anthropological observations are
buttressed by the quantitative work that has been done to date. A review
of the technical literature in the mid-1980s put it bluntly: "It is an empird
ical fact that children from relatively higher SES families receive an intel-
lectually more advantageous home environment. This finding holds for
white, black, and Hispanic children, for children within lower- and
middle-SES families, as well as for children born preterm and full-term.'"'
SOCIAL CLASS AND MALPARENTING
To this point, we have been talking about parenting within the normal
range. Now we turn to child neglect and child abuse, increasingly la-
beled "malparenting" in the technical literature.
Abuse and neglect are distinct. The physical battering and other
forms of extreme physical and emotional punishment that constitute
child abuse get most of the publicity, but child neglect is far more com-
mon, by ratios ranging from three to one to ten to one, depending on
the study.13 Among the distinctions that the experts draw between child
abuse and neglect are these:
Abuse is an act of commission, while neglect is more commonly
an act of omission.
Abuse is typically episodic and of short duration; neglect is chronic
and continual.
Abuse typically arises from impulsive outbursts of aggression and
anger; neglect arises from indifference, inattentiveness, or being
overwhelmed by parenthood.'141
208
Cognitive Classes and Social Behavior
Parenting
209
Commonly, neglect is as simple as failure to provide a child with ad-
equate food, clothing, shelter, or hygiene. But it can also mean leaving
dangerous materials within reach, not keeping the child away from an
open window, or leaving toddlers alone for hours at a time. It means not
taking the child to a doctor when he is sick or not giving him the med-
icine the doctor prescribed. Neglect can also mean more subtle depri-
vations: habitually leaving babies in cribs for long periods, never talking
to infants and toddlers except to scold or demand, no smiles, no bed-
time stories. At its most serious, neglect becomes abandonment.
Are abusing parents also neglectful? Are neglectful parents also abu-
sive? Different studies have produced different answers. Child abuse in
some bizarre forms has nothing to do with anything except a profoundly
deranged parent. Such cases crop up unpredictably, independent of de-
mographic and socioeconomic variables.15
Once we move away from these exceptional cases, however, abuse
and neglect seem to be more alike than different in their origins.'%e
theories explaining them are complex, involving stress, social isolation,
personality characteristics, community characteristics, and transmis-
sion of malparenting from one generation to the next.'' But one con-
comitant of malparenting is not in much dispute: Malparenting of either
sort is heavily concentrated in the lower socioeconomic classes. Indeed,
the link is such that, as Douglas Besharov has pointed out, behaviors
that are sometimes classified as forms of neglect-letting
a child skip
school, for example-are
not considered neglectful in some poor com-
munities but part of the normal pattern of upbringing.lR What would he
considered just an overenthusiastic spanking in one neighborhood
might be called abuse in another.
We realize that once again we are contradicting what everyone
knows, which is that "child abuse and neglect afflict all communities,
regardless of race, religion, or economic status,'' to pick one formulation
of this common belief." And in a narrow technical sense, such state-
ments are correct, insofar as neglect and abuse are found at every social
and economic level, as is every other human behavior. It is also correct
that only a small minority of parents among the poor and disadvantaged
neglect or abuse their children. But the way such statements are usually
treated in the media, by politicians, and by child advocacy groups is to
imply that child neglect and abuse are spread evenly across social classes,
as if children have about an equal chance of being abused or neglected
whether they come from a rich home or a poor one, whether the mother
is a college graduate or a high school dropout. And yet from the earli-
est studies to the present, malparenting has been strongly associated
with socioeconomic class.
The people who argue otherwise do not offer data to make their case.
Instead, they argue that child neglect and abuse are reported when it
happens to poor children but not rich ones. Affluent families are be-
lieved to escape the reporting net (by using private physicians, for ex-
ample, who are less likely to report abuse). Social service agencies are
said to be reluctant to intervene in affluent families.'' Poor people are
likely to be labeled deviant for behaviors that would go unnoted or un-
remarked in richer neighborhoods.21 People are likely to think the worst
of socially unattractive people and give socially attractive people the
benefit of the doubt.22
Studies spread over the last twenty years have analyzed reporting bias
in a variety of ways, including surveys to identify abuse that goes unre-
ported through official channels. The results are consistent: The so-
cioeconomic link with maltreatment is a~thentic.~'
Probably the link is
stronger for neglect than for abuse.24 But specifying exactly how strongly
socioeconomic status and child maltreatment are linked is difficult be-
cause of the genuine shortcomings of official reports and because so
many different kinds of abuse and neglect are involved. The following
numbers give a sense of the situation:
In an early national study (using data for 1967) 60 percent of the
families involved in abuse incidents had been on welfare during
or prior to the study year.25
In data on 20,000 validated reports of child abuse and neglect col-
lected by the American Humane Association for 1976, half of the
reported families were below the poverty line and most of the rest
were concentrated just above it.26
In a 1984 study of child maltreatment in El Paso, Texas, 87
percent of the alleged perpetrators were in families with in-
comes under $18,000, roughly the bottom third of income.
Seventy-three percent of the alleged female perpetrators were
~nmarried.'~
In the federally sponsored National Incidence Study in 1979,
which obtained information on unreported as well as reported
cases, the families of 43 percent of the victims of child abuse or
neglect had an income under $7,000, compared to 17 percent of
Socioeconomic Status and Child Maltreatment
- Media and advocacy groups often portray child abuse and neglect as being evenly distributed across all social classes.
- Empirical data consistently shows a strong, authentic link between socioeconomic status and child maltreatment, particularly regarding neglect.
- Critics argue that reporting bias protects affluent families, but multiple studies over twenty years suggest the class disparity remains even when accounting for unreported cases.
- Statistical evidence from national studies indicates that a vast majority of families involved in abuse incidents live below or near the poverty line.
- Beyond income, other precursors to maltreatment include premature births, low birth weight, and illegitimacy, which occur at disproportionately high rates in abuse cases.
People are likely to think the worst of socially unattractive people and give socially attractive people the benefit of the doubt.
208
Cognitive Classes and Social Behavior
Parenting
209
Commonly, neglect is as simple as failure to provide a child with ad-
equate food, clothing, shelter, or hygiene. But it can also mean leaving
dangerous materials within reach, not keeping the child away from an
open window, or leaving toddlers alone for hours at a time. It means not
taking the child to a doctor when he is sick or not giving him the med-
icine the doctor prescribed. Neglect can also mean more subtle depri-
vations: habitually leaving babies in cribs for long periods, never talking
to infants and toddlers except to scold or demand, no smiles, no bed-
time stories. At its most serious, neglect becomes abandonment.
Are abusing parents also neglectful? Are neglectful parents also abu-
sive? Different studies have produced different answers. Child abuse in
some bizarre forms has nothing to do with anything except a profoundly
deranged parent. Such cases crop up unpredictably, independent of de-
mographic and socioeconomic variables.15
Once we move away from these exceptional cases, however, abuse
and neglect seem to be more alike than different in their origins.'%e
theories explaining them are complex, involving stress, social isolation,
personality characteristics, community characteristics, and transmis-
sion of malparenting from one generation to the next.'' But one con-
comitant of malparenting is not in much dispute: Malparenting of either
sort is heavily concentrated in the lower socioeconomic classes. Indeed,
the link is such that, as Douglas Besharov has pointed out, behaviors
that are sometimes classified as forms of neglect-letting
a child skip
school, for example-are
not considered neglectful in some poor com-
munities but part of the normal pattern of upbringing.lR What would he
considered just an overenthusiastic spanking in one neighborhood
might be called abuse in another.
We realize that once again we are contradicting what everyone
knows, which is that "child abuse and neglect afflict all communities,
regardless of race, religion, or economic status,'' to pick one formulation
of this common belief." And in a narrow technical sense, such state-
ments are correct, insofar as neglect and abuse are found at every social
and economic level, as is every other human behavior. It is also correct
that only a small minority of parents among the poor and disadvantaged
neglect or abuse their children. But the way such statements are usually
treated in the media, by politicians, and by child advocacy groups is to
imply that child neglect and abuse are spread evenly across social classes,
as if children have about an equal chance of being abused or neglected
whether they come from a rich home or a poor one, whether the mother
is a college graduate or a high school dropout. And yet from the earli-
est studies to the present, malparenting has been strongly associated
with socioeconomic class.
The people who argue otherwise do not offer data to make their case.
Instead, they argue that child neglect and abuse are reported when it
happens to poor children but not rich ones. Affluent families are be-
lieved to escape the reporting net (by using private physicians, for ex-
ample, who are less likely to report abuse). Social service agencies are
said to be reluctant to intervene in affluent families.'' Poor people are
likely to be labeled deviant for behaviors that would go unnoted or un-
remarked in richer neighborhoods.21 People are likely to think the worst
of socially unattractive people and give socially attractive people the
benefit of the doubt.22
Studies spread over the last twenty years have analyzed reporting bias
in a variety of ways, including surveys to identify abuse that goes unre-
ported through official channels. The results are consistent: The so-
cioeconomic link with maltreatment is a~thentic.~'
Probably the link is
stronger for neglect than for abuse.24 But specifying exactly how strongly
socioeconomic status and child maltreatment are linked is difficult be-
cause of the genuine shortcomings of official reports and because so
many different kinds of abuse and neglect are involved. The following
numbers give a sense of the situation:
In an early national study (using data for 1967) 60 percent of the
families involved in abuse incidents had been on welfare during
or prior to the study year.25
In data on 20,000 validated reports of child abuse and neglect col-
lected by the American Humane Association for 1976, half of the
reported families were below the poverty line and most of the rest
were concentrated just above it.26
In a 1984 study of child maltreatment in El Paso, Texas, 87
percent of the alleged perpetrators were in families with in-
comes under $18,000, roughly the bottom third of income.
Seventy-three percent of the alleged female perpetrators were
~nmarried.'~
In the federally sponsored National Incidence Study in 1979,
which obtained information on unreported as well as reported
cases, the families of 43 percent of the victims of child abuse or
neglect had an income under $7,000, compared to 17 percent of
210
Cognitive Chses and Social Behavior
Parenting
21 1
Other Precursors of Maltreatment
Premature births, low birth weight, and illegitimacy also have links with
maltreatment. Studies in America and Britain have found rates of low birth
weight among abused children running at three to four times the national
average.19 Prematurity has been found to be similarly disproportionate
among abused children." The proportion of neglected children who are il-
legitimate has run far above national averages in studies from the early
1960s onward. More than a quarter of the neglected children in the mid-
1960s were illegitimate, for example-almost four times the national pro-
portion.'' In a British sample, 36 percent of the neglected children were
illegitimate compared to 6 percent in the control group.'2
all American children. Only 6 percent of the abusive or neglect-
ful families had incomes of $25,000 or more.
The 1986 replication of the National Incidence Study found that
the rate of abuse and neglect among families with incomes under
$15,000 was five times that of families with incomes above
$15,000. Only 6 percent of the families involved in neglect or
abuse had incomes above the median for all American fa mi lie^.^'
Given the one-sided nature of the evidence, why has the "myth of
classlessness," in Leroy Pelton's phrase, been so tenacious? Pelton him-
self blamed social service professionals and politicians, arguing that both
of these powerful groups have a vested interest in a medical model of
child abuse, in which child abuse falls on its victims at random, like the
flu.j3 Pelton does not mention another reason that seems plausible to
us: Child abuse and neglect are held in intense distaste by most Amer-
icans, who feel great hostility toward parents who harm their children.
People who write about malparenting do not want to encourage this
hostility to spill over into hostility toward the poor and disadvantaged.
Whatever the reasons, the myth of classlessness is alive and well. It
is a safe bet that at the next Senate hearing on a child neglect bill, wit-
nesses and senators alike will agree that neglect and abuse are scattered
throughout society, and the next feature story on child neglect you see
on the evening news will report, as scientific fact, that child neglect is
not a special problem of the poor.
PARENTAL IQ AND PARENTING
In all of these studies of socioeconomic status and parenting, the obvi-
ous but usually ignored possibility has been that the parents' cognitive
ability, not their status, was an important source of the differences in
parenting styles and also an important source of the relationship be-
tween malparenting and children's IQs. Indeed, even without conduct-
ing any additional studies, some sort of role for cognitive ability must
be presupposed. If cognitive ability is a cause of socioeconomic status
(yes) and if socioeconomic status is related to parenting style (yes), then
cognitive ability must have at least some indirect role in parenting style.
The same causal chain applies to child maltreatment.
Direct evidence for a link with IQ is sparse. Even the educational at-
tainment of the abusing parents is often unreported. But a search of the
literature through the early 1990s uncovered a number offragments that
point to a potentially important role for cognitive ability, if we bear in
mind that cognitive ability is a stronger predictor ofschool dropout than
is socioeconomic status (Chapter 6):
In Gil's national study of child abuse reports, more than 65 per-
cent of the mothers and 56 percent of the fathers had not com-
pleted high scho01.l~~'
A study of 480 infants of women registering for prenatal care at an
urban hospital for indigent persons and their children found that
the less educated mothers even within this disadvantaged popula-
tion were more likely to neglect their babies.j5
Three studies of child maltreatment in a central Virginia city of
80,000 people found that neglecting families had an average
eighth-grade education, and almost three-quarters of them had
been placed in classes for the mentally retarded during their school
years. In contrast with the neglecting families, the abusing fami-
lies tended to be literate, high school graduates, and of normal in-
telligence.j6
A study of fifty-eight preschool children of unspecified race in the
Cleveland area with histories of failure to thrive found that their
mothers' IQs average was 81 .37 No comparison group was available
in this study, but a mean of 81 indicates cognitive functioning at
approximately the 10th centile.
The Myth of Classlessness
- The 'myth of classlessness' persists because professionals and politicians prefer a medical model where child abuse strikes randomly like a virus.
- Advocates may suppress the link between poverty and child abuse to prevent public hostility from being directed at disadvantaged populations.
- The authors argue that parental cognitive ability, rather than socioeconomic status alone, is a primary driver of parenting styles and maltreatment.
- Research indicates that neglecting parents often have significantly lower educational attainment and higher rates of placement in special education.
- Studies of 'failure to thrive' cases and severe battery show a high prevalence of mothers with IQs in the bottom decile or with 'mental deficiency.'
- A distinction is noted between neglecting families, who often have lower intelligence, and abusing families, who are more likely to be literate and of normal intelligence.
Pelton himself blamed social service professionals and politicians, arguing that both of these powerful groups have a vested interest in a medical model of child abuse, in which child abuse falls on its victims at random, like the flu.
210
Cognitive Chses and Social Behavior
Parenting
21 1
Other Precursors of Maltreatment
Premature births, low birth weight, and illegitimacy also have links with
maltreatment. Studies in America and Britain have found rates of low birth
weight among abused children running at three to four times the national
average.19 Prematurity has been found to be similarly disproportionate
among abused children." The proportion of neglected children who are il-
legitimate has run far above national averages in studies from the early
1960s onward. More than a quarter of the neglected children in the mid-
1960s were illegitimate, for example-almost four times the national pro-
portion.'' In a British sample, 36 percent of the neglected children were
illegitimate compared to 6 percent in the control group.'2
all American children. Only 6 percent of the abusive or neglect-
ful families had incomes of $25,000 or more.
The 1986 replication of the National Incidence Study found that
the rate of abuse and neglect among families with incomes under
$15,000 was five times that of families with incomes above
$15,000. Only 6 percent of the families involved in neglect or
abuse had incomes above the median for all American fa mi lie^.^'
Given the one-sided nature of the evidence, why has the "myth of
classlessness," in Leroy Pelton's phrase, been so tenacious? Pelton him-
self blamed social service professionals and politicians, arguing that both
of these powerful groups have a vested interest in a medical model of
child abuse, in which child abuse falls on its victims at random, like the
flu.j3 Pelton does not mention another reason that seems plausible to
us: Child abuse and neglect are held in intense distaste by most Amer-
icans, who feel great hostility toward parents who harm their children.
People who write about malparenting do not want to encourage this
hostility to spill over into hostility toward the poor and disadvantaged.
Whatever the reasons, the myth of classlessness is alive and well. It
is a safe bet that at the next Senate hearing on a child neglect bill, wit-
nesses and senators alike will agree that neglect and abuse are scattered
throughout society, and the next feature story on child neglect you see
on the evening news will report, as scientific fact, that child neglect is
not a special problem of the poor.
PARENTAL IQ AND PARENTING
In all of these studies of socioeconomic status and parenting, the obvi-
ous but usually ignored possibility has been that the parents' cognitive
ability, not their status, was an important source of the differences in
parenting styles and also an important source of the relationship be-
tween malparenting and children's IQs. Indeed, even without conduct-
ing any additional studies, some sort of role for cognitive ability must
be presupposed. If cognitive ability is a cause of socioeconomic status
(yes) and if socioeconomic status is related to parenting style (yes), then
cognitive ability must have at least some indirect role in parenting style.
The same causal chain applies to child maltreatment.
Direct evidence for a link with IQ is sparse. Even the educational at-
tainment of the abusing parents is often unreported. But a search of the
literature through the early 1990s uncovered a number offragments that
point to a potentially important role for cognitive ability, if we bear in
mind that cognitive ability is a stronger predictor ofschool dropout than
is socioeconomic status (Chapter 6):
In Gil's national study of child abuse reports, more than 65 per-
cent of the mothers and 56 percent of the fathers had not com-
pleted high scho01.l~~'
A study of 480 infants of women registering for prenatal care at an
urban hospital for indigent persons and their children found that
the less educated mothers even within this disadvantaged popula-
tion were more likely to neglect their babies.j5
Three studies of child maltreatment in a central Virginia city of
80,000 people found that neglecting families had an average
eighth-grade education, and almost three-quarters of them had
been placed in classes for the mentally retarded during their school
years. In contrast with the neglecting families, the abusing fami-
lies tended to be literate, high school graduates, and of normal in-
telligence.j6
A study of fifty-eight preschool children of unspecified race in the
Cleveland area with histories of failure to thrive found that their
mothers' IQs average was 81 .37 No comparison group was available
in this study, but a mean of 81 indicates cognitive functioning at
approximately the 10th centile.
2 12
Cognitive CClass and Social Behavior
Parenting
2 13
A study of twenty abusive or neglectful mothers and ten compar-
ison mothers from inner-city Rochester, New York, found that
maltreating and nonmaltreating mothers differed significantly in
their judgment about child behavior and in their prohlem-solving
abilities."
A clinical psychological study of ten parents who battered their
children severely (six of the children died) classified five as hav-
ing a "high-grade mental deficiency" (mentally retarded), one as
dull, and another as below average. The remaining three were clas-
sified as above average.jv
A quantitative study of 113 two-parent families in the Nether-
lands found that parents with a high level of "reasoning complex-
ity" (a measure of cognitive ability) responded to their children
more flexibly and sensitively, while those with low levels of rea-
soning complexity were more authoritarian and rigid, indepen-
dent of occupation and ed~cation.~'
The most extensive clinical studies of neglectful mothers have been
conducted by Norman Polansky, whose many years of research hegan
with a sample drawn from rural Appalachia, subsequently replicated
with an urban Philadelphia sample. He described the typical neglectfill
mother as follows:
She is of limited intelligence (IQ below 70), has failed to achieve
more than an eighth-grade education, and has never held. . . employ-
ment. . . . She has at best a vague, or extremely limited, idea of what
her children need emotionally and physically. She seldom is able to
see things from the point ofview of others and cannot take their needs
into consideration when responding to a conflict they experiencea4'
The specific IQ figure Polansky mentions corresponds to the upper edge
of retardation, and his description of her personality invokes further
links between neglect and intelligence.
Another body of literature links neglectful and abusive parents to
personality characteristics that have clear links to low cognitive abil-
ity.1421
The most extensive evidence describes the impulsiveness, incon-
sistency, and confusion that mark the parenting style of many abusive
parent^.^' The abusive parents may or may not punish their children
more often or severely in the ordinary course of events than other par-
ents (studies differ on this point),44 but the abuse characteristically
comes unpredictably, in episodic bursts. Abusive parents may punish a
given behavior on one occasion, ignore it on another, and encourage it
on a third. The inconsistency can reach mystifying proportions; one
study of parent-child interactions found that children in abusing fami-
lies had ahout the same chance of obtaining positive reinforcement for
aggressive hehaviors as for pro-social behaviors.45
The observed inconsistency of abusing parents was quantified in one
of the early and classic studies of child abuse by Leontine Young, Wednes-
day's Children. Ry her calculations, inconsistency was the rule in all of
the "severe abuse" families in her sample, in 91 percent of the "moder-
ate abuse" families, 97 percent of the "severe neglect" families, and 88
percent of the "moderate neglect" families.46 In one of the most exten-
sive literature reviews of the behavioral and personality dimensions of
abusive parents (as of 1985), the author concluded that the main prob-
lem was not that abusive parents were attached to punishment as such
hut that they were simply incompetent as parents.47
One might think that researchers seeing these malparenting patterns
would naturally be inspired to look at the parents' intelligence as a pre-
dictor. And yet in that same literature review, examining every rigorous
American study on the subject, the word intelligence (or any synonym
for it) does not occur until the next-to-last page of the arti~1e.l~~'
The
word finally makes its appearance as the literature review nears its end
and the author turns to his recommendations for future research. He
notes that in an ongoing British prospective study of parenting, "moth-
ers In their Excellent Care group, for example, were found to be of higher
intelligence . . . than parents in their Inadequate Care group," and then
describes several ways in which the study found that maternal intelli-
gence seemed to compensate for other deprivations in the child's life.'4v'
With such obvious signals about such tragic problems as child neglect
and abuse, perhaps an editorial comment is appropriate: The reluctance
of scholars and policymakers alike to look at the role of low intelligence
in malparenting may properly be called scandalous.
MATERNAL 1Q AND THE WELL-BEING OF INFANTS
Combined with the literature, the NLSY lends further insight into good
and bad parenting. We begin with information on the ways in which
women of varying cognitive ability care for their children and then turn
to the outcomes for the children themselves.
Cognitive Ability and Parenting Quality
- A Dutch study found that parents with higher 'reasoning complexity' respond to children with more flexibility and sensitivity than those with lower cognitive scores.
- Clinical research by Norman Polansky identifies a profile of neglectful mothers characterized by limited intelligence and an inability to perceive children's emotional needs.
- Abusive and neglectful parenting is frequently marked by extreme impulsiveness and a lack of consistency in discipline and reinforcement.
- Studies show that children in abusive families are often as likely to be rewarded for aggressive behavior as they are for pro-social behavior.
- Despite strong evidence linking parental incompetence to low cognitive ability, researchers have historically been reluctant to investigate intelligence as a primary factor.
- Evidence from British studies suggests that higher maternal intelligence can serve as a protective factor, compensating for other environmental deprivations.
The inconsistency can reach mystifying proportions; one study of parent-child interactions found that children in abusing families had ahout the same chance of obtaining positive reinforcement for aggressive hehaviors as for pro-social behaviors.
2 12
Cognitive CClass and Social Behavior
Parenting
2 13
A study of twenty abusive or neglectful mothers and ten compar-
ison mothers from inner-city Rochester, New York, found that
maltreating and nonmaltreating mothers differed significantly in
their judgment about child behavior and in their prohlem-solving
abilities."
A clinical psychological study of ten parents who battered their
children severely (six of the children died) classified five as hav-
ing a "high-grade mental deficiency" (mentally retarded), one as
dull, and another as below average. The remaining three were clas-
sified as above average.jv
A quantitative study of 113 two-parent families in the Nether-
lands found that parents with a high level of "reasoning complex-
ity" (a measure of cognitive ability) responded to their children
more flexibly and sensitively, while those with low levels of rea-
soning complexity were more authoritarian and rigid, indepen-
dent of occupation and ed~cation.~'
The most extensive clinical studies of neglectful mothers have been
conducted by Norman Polansky, whose many years of research hegan
with a sample drawn from rural Appalachia, subsequently replicated
with an urban Philadelphia sample. He described the typical neglectfill
mother as follows:
She is of limited intelligence (IQ below 70), has failed to achieve
more than an eighth-grade education, and has never held. . . employ-
ment. . . . She has at best a vague, or extremely limited, idea of what
her children need emotionally and physically. She seldom is able to
see things from the point ofview of others and cannot take their needs
into consideration when responding to a conflict they experiencea4'
The specific IQ figure Polansky mentions corresponds to the upper edge
of retardation, and his description of her personality invokes further
links between neglect and intelligence.
Another body of literature links neglectful and abusive parents to
personality characteristics that have clear links to low cognitive abil-
ity.1421
The most extensive evidence describes the impulsiveness, incon-
sistency, and confusion that mark the parenting style of many abusive
parent^.^' The abusive parents may or may not punish their children
more often or severely in the ordinary course of events than other par-
ents (studies differ on this point),44 but the abuse characteristically
comes unpredictably, in episodic bursts. Abusive parents may punish a
given behavior on one occasion, ignore it on another, and encourage it
on a third. The inconsistency can reach mystifying proportions; one
study of parent-child interactions found that children in abusing fami-
lies had ahout the same chance of obtaining positive reinforcement for
aggressive hehaviors as for pro-social behaviors.45
The observed inconsistency of abusing parents was quantified in one
of the early and classic studies of child abuse by Leontine Young, Wednes-
day's Children. Ry her calculations, inconsistency was the rule in all of
the "severe abuse" families in her sample, in 91 percent of the "moder-
ate abuse" families, 97 percent of the "severe neglect" families, and 88
percent of the "moderate neglect" families.46 In one of the most exten-
sive literature reviews of the behavioral and personality dimensions of
abusive parents (as of 1985), the author concluded that the main prob-
lem was not that abusive parents were attached to punishment as such
hut that they were simply incompetent as parents.47
One might think that researchers seeing these malparenting patterns
would naturally be inspired to look at the parents' intelligence as a pre-
dictor. And yet in that same literature review, examining every rigorous
American study on the subject, the word intelligence (or any synonym
for it) does not occur until the next-to-last page of the arti~1e.l~~'
The
word finally makes its appearance as the literature review nears its end
and the author turns to his recommendations for future research. He
notes that in an ongoing British prospective study of parenting, "moth-
ers In their Excellent Care group, for example, were found to be of higher
intelligence . . . than parents in their Inadequate Care group," and then
describes several ways in which the study found that maternal intelli-
gence seemed to compensate for other deprivations in the child's life.'4v'
With such obvious signals about such tragic problems as child neglect
and abuse, perhaps an editorial comment is appropriate: The reluctance
of scholars and policymakers alike to look at the role of low intelligence
in malparenting may properly be called scandalous.
MATERNAL 1Q AND THE WELL-BEING OF INFANTS
Combined with the literature, the NLSY lends further insight into good
and bad parenting. We begin with information on the ways in which
women of varying cognitive ability care for their children and then turn
to the outcomes for the children themselves.
Maternal Intelligence and Infant Health
- The text explores the relationship between maternal cognitive ability and parenting behaviors, specifically focusing on prenatal care and infant outcomes.
- While most prenatal behaviors like alcohol consumption and seeking medical care were similar across cognitive classes, smoking habits showed a stark divide.
- Higher maternal intelligence and education levels were strongly correlated with a significant decrease in smoking during pregnancy, even when controlling for socioeconomic status.
- Low birth weight is identified as a critical indicator of a child's future health and cognitive development, often influenced by maternal behaviors during pregnancy.
- Statistical analysis suggests that a mother's IQ plays a more significant role in determining the probability of a low-birth-weight baby than her socioeconomic background.
- The authors argue that failures in prenatal care may stem from low IQ factors such as slow comprehension, short time horizons, and difficulty connecting cause and effect.
The failure of scholars and policymakers alike to look at the role of low intelligence in malparenting may properly be called scandalous.
2 12
Cognitive CClass and Social Behavior
Parenting
2 13
A study of twenty abusive or neglectful mothers and ten compar-
ison mothers from inner-city Rochester, New York, found that
maltreating and nonmaltreating mothers differed significantly in
their judgment about child behavior and in their prohlem-solving
abilities."
A clinical psychological study of ten parents who battered their
children severely (six of the children died) classified five as hav-
ing a "high-grade mental deficiency" (mentally retarded), one as
dull, and another as below average. The remaining three were clas-
sified as above average.jv
A quantitative study of 113 two-parent families in the Nether-
lands found that parents with a high level of "reasoning complex-
ity" (a measure of cognitive ability) responded to their children
more flexibly and sensitively, while those with low levels of rea-
soning complexity were more authoritarian and rigid, indepen-
dent of occupation and ed~cation.~'
The most extensive clinical studies of neglectful mothers have been
conducted by Norman Polansky, whose many years of research hegan
with a sample drawn from rural Appalachia, subsequently replicated
with an urban Philadelphia sample. He described the typical neglectfill
mother as follows:
She is of limited intelligence (IQ below 70), has failed to achieve
more than an eighth-grade education, and has never held. . . employ-
ment. . . . She has at best a vague, or extremely limited, idea of what
her children need emotionally and physically. She seldom is able to
see things from the point ofview of others and cannot take their needs
into consideration when responding to a conflict they experiencea4'
The specific IQ figure Polansky mentions corresponds to the upper edge
of retardation, and his description of her personality invokes further
links between neglect and intelligence.
Another body of literature links neglectful and abusive parents to
personality characteristics that have clear links to low cognitive abil-
ity.1421
The most extensive evidence describes the impulsiveness, incon-
sistency, and confusion that mark the parenting style of many abusive
parent^.^' The abusive parents may or may not punish their children
more often or severely in the ordinary course of events than other par-
ents (studies differ on this point),44 but the abuse characteristically
comes unpredictably, in episodic bursts. Abusive parents may punish a
given behavior on one occasion, ignore it on another, and encourage it
on a third. The inconsistency can reach mystifying proportions; one
study of parent-child interactions found that children in abusing fami-
lies had ahout the same chance of obtaining positive reinforcement for
aggressive hehaviors as for pro-social behaviors.45
The observed inconsistency of abusing parents was quantified in one
of the early and classic studies of child abuse by Leontine Young, Wednes-
day's Children. Ry her calculations, inconsistency was the rule in all of
the "severe abuse" families in her sample, in 91 percent of the "moder-
ate abuse" families, 97 percent of the "severe neglect" families, and 88
percent of the "moderate neglect" families.46 In one of the most exten-
sive literature reviews of the behavioral and personality dimensions of
abusive parents (as of 1985), the author concluded that the main prob-
lem was not that abusive parents were attached to punishment as such
hut that they were simply incompetent as parents.47
One might think that researchers seeing these malparenting patterns
would naturally be inspired to look at the parents' intelligence as a pre-
dictor. And yet in that same literature review, examining every rigorous
American study on the subject, the word intelligence (or any synonym
for it) does not occur until the next-to-last page of the arti~1e.l~~'
The
word finally makes its appearance as the literature review nears its end
and the author turns to his recommendations for future research. He
notes that in an ongoing British prospective study of parenting, "moth-
ers In their Excellent Care group, for example, were found to be of higher
intelligence . . . than parents in their Inadequate Care group," and then
describes several ways in which the study found that maternal intelli-
gence seemed to compensate for other deprivations in the child's life.'4v'
With such obvious signals about such tragic problems as child neglect
and abuse, perhaps an editorial comment is appropriate: The reluctance
of scholars and policymakers alike to look at the role of low intelligence
in malparenting may properly be called scandalous.
MATERNAL 1Q AND THE WELL-BEING OF INFANTS
Combined with the literature, the NLSY lends further insight into good
and bad parenting. We begin with information on the ways in which
women of varying cognitive ability care for their children and then turn
to the outcomes for the children themselves.
2 14
Cognitive Classes and Social Behavior
Parenting
215
-
Prenatal Care
In most of the ways that are easily measurable, most white women in
the different cognitive classes behaved similarly during pregnancy. Al-
most everyone got prenatal care, and similar proportions in all cogni-
tive classes began getting it in the early months. If we take the NLSY
mothers' self-descriptions at face value, alcohol consumption during
pregnancy was about the same across the cognitive classes.'501 The risk
of miscarriage or a stillbirth was also spread more or less equally across
cognitive classes.
Smoking was the one big and medically important difference related
to maternal intelligence: The smarter the women, the less they smoked
while they were pregnant. Fifty-one percent of the women in the bot-
tom two cognitive classes smoked, and 19 percent of them admitted to
smoking more than a pack a day. In the top two cognitive classes, only
16 percent of the white women in the NLSY smoked at all, and only 4
percent admitted to smoking more than a pack a day. In Class I, no one
smoked. Smarter pregnant women smoked less even after controlling
for their socioeconomic backgrounds. Higher levels of education, inde-
pendent of intelligence, also deterred pregnant women from smoking.15"
Low Birth Weight
We focus here on an indicator that is known to have important impli-
cations for the subsequent health, cognitive ability, and emotional de-
velopment of the child and is also affected to some degree by how well
women have cared for themselves during pregnancy: low birth weight.5z
Low birth weight is often caused by behaviors during pregnancy, such
as smoking, drug or alcohol abuse, or living exclusively on junk food,
that are seldom caused by pure ignorance these days. The pregnant
woman who never registers the simple and ubiquitous lessons about tak-
ing care of herself and her baby, fails to remember them, or fails to act
on them could be willfully irresponsible or in the grip of an irresistible
addiction to drugs or junk food, but slow comprehension, a short time
horizon, and difficulty in connecting cause and effect are at least as plau-
sible an explanation, and all of these betoken low IQ.
A low-birth-weight baby is defined in these analyses as an infant
weighing less than 5.5 pounds at birth, excluding premature babies
whose weight was appropriate for their gestational age.I5" The experi-
ence of the NLSY mothers is shown in the table below. There does not
Low Birth Weight Among White Babies
Incidence per
Cognitive Class
1,000 Births
I Very bright
50
I1 Bright
16
111 Normal
3 2
IV Dull
72
V Very dull
5 7
Population average
62
appear to be much of a relationship between intelligence and low Birth
weight; note the high rate for babies of mothers in Class I (which is dis-
cussed in the accompanying box). But the table obscures a strong over-
all relationship between IQ and low birth weight that emerges in the
regression analysis shown in the following figure.
A white mother's IQ has a significant role in
determining whether her baby is underweight
while her socioeconomic background does not
Probability of being a low-birth-weight baby
8% -
As the mother's IQ
7% -
goes from low to high
6% -
5% -
4% -
3% -
2%-
As the mother's
socioeconomic background
-
goes from low to high
0%
1
1
I
I
I
Very low
Very high
(-2 SDs)
(+2 SDs)
Note: For computing the plot, age and either SES (for the hlack curve) or IQ (for the gray
curve) were set at their mean values.
IQ and Infant Health Outcomes
- Low maternal IQ is identified as a major risk factor for low birth weight, significantly outweighing the impact of socioeconomic background.
- Statistical analysis suggests that poverty's independent role in low birth weight is negligible once cognitive ability is accounted for.
- Mothers at the 2nd percentile of IQ have a 7 percent chance of having a low-birth-weight baby, compared to less than 2 percent for those at the 98th percentile.
- Traditional risk factors such as the mother's age at birth showed no appreciable relationship to birth weight outcomes in the NLSY data.
- The authors hypothesize a link between cognitive ability and infant mortality, suggesting that childproofing and medical judgment require foresight and intelligence.
- Data for the highest cognitive class (Class I) shows some anomalous results, though small sample sizes make these findings difficult to verify.
It takes more than love to childproof a house effectively; it also takes knowledge and foresight.
2 P 6
Cognitive Classes and Social Behavior
Parenting
2 1 7
A low IQ is a major risk factor, whereas the mother's socioeconomic
background is irrelevant. A mother at the 2d centile of IQ had a 7 per-
cent chance of giving birth to a lowdbirth-weight baby, while a mother
at the 98th percentile had less than a 2 percent chance.
Adding Poverty. Poverty is an obvious potential factor when trying to
explain low birth weight. Overall, poor white mothers (poor in the year
before birth) had 61 low-birth-weight babies per 1,000, while other
white mothers had 36. But poverty's independent role was small and sta-
tistically insignificant, once the other standard variables were taken into
account. Meanwhile, the independent role of IQ remained as large, and
that of socioeconomic background as small, even after the effects of
poverty were extracted.
Can Mothers Be Too Smart for Their Own Good?
The case of low birth weight is the first example of others you will see in
which the children of white women in Class I have anomalously had scores.
The obvious, but perhaps too obvious, culprit is sample size. The percent-
age of low-birth-weight babies for Class 1 mothers, calculated using sam-
ple weights, was produced by just two low-birth-weight hahies out of
seventy-four birth^."^' The sample sizes for white Class i mothers in the
other analyses that produce anomalous results are also small, sometimes
under fifty and always under one hundred, while the sample si:es for the
middle cognitive classes number several hundred or sometimes thousands.
On the other hand, perhaps the children of mothers at the very top of
the cognitive distribution do In fact have different tendencies than the rest
of the range. The poss~bility is sufficiently intriguing that we report the
anomalous data despite the small sample sizes, and hope that others will
explore where we cannot. In the logistic regression analyses, where each
case is treated as an individual unit (not grouped into cognitive classes),
these problems of sample size do not arise.
Adding mother's age at the time of birth. It is often thought that very
young mothers are vulnerable to having low-birth.weight babies, no
matter how good the prenatal care may be.55 This was not true in the
NLSY data for white women, however, where the mothers of low-birth
weight babies and other mothers had the same mean (24.2 years).
In sum, neither the mother's age in the NLSY cohort, nor age at birth
of the child, nor poverty status, nor socioeconomic background had any
appreciable relationship to her chances of giving birth to a low-birth-
weight baby after her cognitive ability had been taken into account.
Adding education. Among high school graduates (no more, no less)
in the NLSY, a plot of the results of the standard analysis looks visually
identical to the one presented for the entire sample, but the sample of
low-birth-weight babies was so small that the results do not reach sta-
tistical significance. Among the college graduates, low-birth-weight ba-
bies were so rare (only six out of 277 births to the white college sample)
that a multivariate analysis produced no interpretable results. We do
not know whether it is the education itself, or the self-selection that
goes into having more education, that is responsible for their low inci-
dence of underweight babies.
Infant Mortality
Though we have not been able to find any studies of cognitive ability
and infant mortality, it is not hard to think of a rationale linking them.
Many things can go wrong with a baby, and parents have to exercise
both watchfulness and judgment. It takes more than love to childproof
a house effectively; it also takes knowledge and foresight. It takes intel-
ligence to decide that an apparently ordinary bout of diarrhea has gone
on long enough to make dehydration a danger; and so on. Nor is sim-
ple knowledge enough. As pediatricians can attest, it may not be enough
to tell new parents that infants often spike a high fever, that such
episodes do not necessarily require a trip to the hospital, hut that they
require careful attention lest such a routine fever become life threaten-
ing. Good parental judgment remains vital. For that matter, the prob-
lem facing pediatricians dealing with children of less competent parents
is even more basic than getting them to apply good judgment: It is to
get such mothers to administer the medication that the doctor has pro-
vided.
This rationale is consistent with the link that has been found be-
tween education and infant mortality. In a study of all births registered
in California in 1978, for example, infant deaths per 1,000 to white
women numbered 12.2 for women with less than twelve years of edu-
Cognitive Ability and Child Welfare
- Effective parenting requires more than just medical knowledge; it demands the judgment to monitor symptoms and the diligence to follow treatment protocols.
- Statistical data from California shows a strong inverse correlation between a mother's education level and infant mortality rates.
- Preliminary NLSY data suggests that mothers of infants who die between two and twelve months of age have lower average IQs than mothers of surviving infants.
- The impact of maternal IQ on infant survival appears most pronounced in the period after the baby leaves the hospital but before they reach one year of age.
- A mother's IQ and her socioeconomic background are both powerful, independent predictors of whether a child will live in chronic poverty during their first three years.
- For mothers with average intelligence and socioeconomic status, the risk of a child spending their first three years in poverty is less than 5 percent.
The problem facing pediatricians dealing with children of less competent parents is even more basic than getting them to apply good judgment: It is to get such mothers to administer the medication that the doctor has provided.
2 P 6
Cognitive Classes and Social Behavior
Parenting
2 1 7
A low IQ is a major risk factor, whereas the mother's socioeconomic
background is irrelevant. A mother at the 2d centile of IQ had a 7 per-
cent chance of giving birth to a lowdbirth-weight baby, while a mother
at the 98th percentile had less than a 2 percent chance.
Adding Poverty. Poverty is an obvious potential factor when trying to
explain low birth weight. Overall, poor white mothers (poor in the year
before birth) had 61 low-birth-weight babies per 1,000, while other
white mothers had 36. But poverty's independent role was small and sta-
tistically insignificant, once the other standard variables were taken into
account. Meanwhile, the independent role of IQ remained as large, and
that of socioeconomic background as small, even after the effects of
poverty were extracted.
Can Mothers Be Too Smart for Their Own Good?
The case of low birth weight is the first example of others you will see in
which the children of white women in Class I have anomalously had scores.
The obvious, but perhaps too obvious, culprit is sample size. The percent-
age of low-birth-weight babies for Class 1 mothers, calculated using sam-
ple weights, was produced by just two low-birth-weight hahies out of
seventy-four birth^."^' The sample sizes for white Class i mothers in the
other analyses that produce anomalous results are also small, sometimes
under fifty and always under one hundred, while the sample si:es for the
middle cognitive classes number several hundred or sometimes thousands.
On the other hand, perhaps the children of mothers at the very top of
the cognitive distribution do In fact have different tendencies than the rest
of the range. The poss~bility is sufficiently intriguing that we report the
anomalous data despite the small sample sizes, and hope that others will
explore where we cannot. In the logistic regression analyses, where each
case is treated as an individual unit (not grouped into cognitive classes),
these problems of sample size do not arise.
Adding mother's age at the time of birth. It is often thought that very
young mothers are vulnerable to having low-birth.weight babies, no
matter how good the prenatal care may be.55 This was not true in the
NLSY data for white women, however, where the mothers of low-birth
weight babies and other mothers had the same mean (24.2 years).
In sum, neither the mother's age in the NLSY cohort, nor age at birth
of the child, nor poverty status, nor socioeconomic background had any
appreciable relationship to her chances of giving birth to a low-birth-
weight baby after her cognitive ability had been taken into account.
Adding education. Among high school graduates (no more, no less)
in the NLSY, a plot of the results of the standard analysis looks visually
identical to the one presented for the entire sample, but the sample of
low-birth-weight babies was so small that the results do not reach sta-
tistical significance. Among the college graduates, low-birth-weight ba-
bies were so rare (only six out of 277 births to the white college sample)
that a multivariate analysis produced no interpretable results. We do
not know whether it is the education itself, or the self-selection that
goes into having more education, that is responsible for their low inci-
dence of underweight babies.
Infant Mortality
Though we have not been able to find any studies of cognitive ability
and infant mortality, it is not hard to think of a rationale linking them.
Many things can go wrong with a baby, and parents have to exercise
both watchfulness and judgment. It takes more than love to childproof
a house effectively; it also takes knowledge and foresight. It takes intel-
ligence to decide that an apparently ordinary bout of diarrhea has gone
on long enough to make dehydration a danger; and so on. Nor is sim-
ple knowledge enough. As pediatricians can attest, it may not be enough
to tell new parents that infants often spike a high fever, that such
episodes do not necessarily require a trip to the hospital, hut that they
require careful attention lest such a routine fever become life threaten-
ing. Good parental judgment remains vital. For that matter, the prob-
lem facing pediatricians dealing with children of less competent parents
is even more basic than getting them to apply good judgment: It is to
get such mothers to administer the medication that the doctor has pro-
vided.
This rationale is consistent with the link that has been found be-
tween education and infant mortality. In a study of all births registered
in California in 1978, for example, infant deaths per 1,000 to white
women numbered 12.2 for women with less than twelve years of edu-
2 18
Cognitive Classes and Social Behavior
Parenting
2 1 9
cation, 8.3 for those with twelve years, and 6.3 for women with thirteen
or more years of education, and the role of education remained signifi-
cant after controlling for birth order, age of the mother, and marital
We have been unable to identify any study that uses tested IQ as an
explanatory factor, and, with such a rare event as infant mortality, even
the NLSY cannot answer our questions satisfactorily. The results cer-
tainly suggest that the questions are worth taking seriously. As of the
1990 survey, the NLSY recorded forty-two deaths among children born
to white women with known IQ. Some of these deaths were presumably
caused by severe medical problems at birth and occurred in a hospital
where the mother's behavior was irrele~ant.'~~'
For infants who died be-
tween the second and twelfth month (the closest we can come to defin-
ing "after the baby had left the hospital"), the mothers of the surviving
children tested six points higher in IQ than the mothers of the deceased
babies. (The difference for mothers of children who died in the first
month was not quite three points and for the mothers of children who
were older than 1 year old when they died, virtually zero.) The samples
here are too small to analyze in conjunction with socioeconomic status
and other variables.
POVERTY THROUGHOUT EARLY CHILDHOOD
In Chapter 5, we described how the high-visibility policy issue of chil-
dren in poverty can be better understood when the mother's 1Q is
brought into the picture. Here, we focus more specifically on the poverty
in the early years of a child's life, when it appears to be an especially im-
portant factor (independent of other variables) in affecting the child's
de~eloprnent.~~
The variable is much more stringent than simply expe-
riencing poverty at some point in childhood. Rather, we ask about the
mothers of children who lived under the poverty line throughout their
first three years of life, comparing them with mothers who were not in
poverty at any time during the child's first three years. The standard
analysis is shown in the figure below. There are few other analyses in
Part I1 that show such a steep effect for both intelligence and SES. If
the mother has even an average intelligence and average socioeconomic
background, the odds of a white child's living in poverty for his or her
first three years were under 5 percent. If either of those conditions fell
below average, the odds increased steeply.
A white mother's IQ and socioeconomic background each has
a large independent effect on her child's chances of spending
the first three years of life in poverty
Probability that a child will live in poverty
throughout the first three years of life
40% -
As the mother's socioeconomic
30% -
As the mother's IQ goes from low to high
20% -
10%-
0% ,
I
I
I
I
Very low
Very high
(-2 SD\)
(+2 SDI)
Note: Fur computing the plot, age and e~thrr SES (for the hlack curve) or IQ (for the gray
curve) were uet at rhelr mean values.
The Rok of Preexisting Poverty
When we ask whether the mother was in poverty in the year prior to
birth, it turns out that a substantial amount of the effect we attribute to
socioeconomic background in the figure really reflects whether the
mother was already in poverty when the child was born. If you want to
know whether a child will spend his first three years in poverty, the sin-
gle most useful piece of information is whether the mother was already
living under the poverty line when he was born. Nevertheless, adding
poverty to the equation does not diminish a large independent role for
cognitive ability. A child born to a white mother who was living under
the poverty line hut was of average intelligence had almost a 49 percent
chance of living his first three years in poverty. This is an extraordinarily
high chance of living in poverty for American whites as a whole. But if
the same woman were at the 2d centile of intelligence, the odds rose to
89 percent; if she were at the 98th centile, they dropped to 10 percent.'59'
Cognitive Ability and Childhood Poverty
- A mother's poverty status at the time of birth is the strongest predictor of whether a child will spend their first three years in poverty.
- Cognitive ability remains a powerful independent factor in poverty outcomes, even when controlling for the mother's socioeconomic background.
- Educational attainment significantly buffers against childhood poverty, with virtually no instances of poverty found among children of white college graduates in the sample.
- The HOME index reveals that mothers with higher cognitive scores tend to provide more enriched environments, such as reading more frequently and limiting television.
- Higher cognitive class is associated with lower rates of physical punishment, despite mothers across classes agreeing in principle that such punishment can be appropriate.
- While the correlation between maternal IQ and the quality of the home environment is statistically significant, it is described as moderate rather than overpowering.
A child born to a white mother who was living under the poverty line but was of average intelligence had almost a 49 percent chance of living his first three years in poverty.
2 18
Cognitive Classes and Social Behavior
Parenting
2 1 9
cation, 8.3 for those with twelve years, and 6.3 for women with thirteen
or more years of education, and the role of education remained signifi-
cant after controlling for birth order, age of the mother, and marital
We have been unable to identify any study that uses tested IQ as an
explanatory factor, and, with such a rare event as infant mortality, even
the NLSY cannot answer our questions satisfactorily. The results cer-
tainly suggest that the questions are worth taking seriously. As of the
1990 survey, the NLSY recorded forty-two deaths among children born
to white women with known IQ. Some of these deaths were presumably
caused by severe medical problems at birth and occurred in a hospital
where the mother's behavior was irrele~ant.'~~'
For infants who died be-
tween the second and twelfth month (the closest we can come to defin-
ing "after the baby had left the hospital"), the mothers of the surviving
children tested six points higher in IQ than the mothers of the deceased
babies. (The difference for mothers of children who died in the first
month was not quite three points and for the mothers of children who
were older than 1 year old when they died, virtually zero.) The samples
here are too small to analyze in conjunction with socioeconomic status
and other variables.
POVERTY THROUGHOUT EARLY CHILDHOOD
In Chapter 5, we described how the high-visibility policy issue of chil-
dren in poverty can be better understood when the mother's 1Q is
brought into the picture. Here, we focus more specifically on the poverty
in the early years of a child's life, when it appears to be an especially im-
portant factor (independent of other variables) in affecting the child's
de~eloprnent.~~
The variable is much more stringent than simply expe-
riencing poverty at some point in childhood. Rather, we ask about the
mothers of children who lived under the poverty line throughout their
first three years of life, comparing them with mothers who were not in
poverty at any time during the child's first three years. The standard
analysis is shown in the figure below. There are few other analyses in
Part I1 that show such a steep effect for both intelligence and SES. If
the mother has even an average intelligence and average socioeconomic
background, the odds of a white child's living in poverty for his or her
first three years were under 5 percent. If either of those conditions fell
below average, the odds increased steeply.
A white mother's IQ and socioeconomic background each has
a large independent effect on her child's chances of spending
the first three years of life in poverty
Probability that a child will live in poverty
throughout the first three years of life
40% -
As the mother's socioeconomic
30% -
As the mother's IQ goes from low to high
20% -
10%-
0% ,
I
I
I
I
Very low
Very high
(-2 SD\)
(+2 SDI)
Note: Fur computing the plot, age and e~thrr SES (for the hlack curve) or IQ (for the gray
curve) were uet at rhelr mean values.
The Rok of Preexisting Poverty
When we ask whether the mother was in poverty in the year prior to
birth, it turns out that a substantial amount of the effect we attribute to
socioeconomic background in the figure really reflects whether the
mother was already in poverty when the child was born. If you want to
know whether a child will spend his first three years in poverty, the sin-
gle most useful piece of information is whether the mother was already
living under the poverty line when he was born. Nevertheless, adding
poverty to the equation does not diminish a large independent role for
cognitive ability. A child born to a white mother who was living under
the poverty line hut was of average intelligence had almost a 49 percent
chance of living his first three years in poverty. This is an extraordinarily
high chance of living in poverty for American whites as a whole. But if
the same woman were at the 2d centile of intelligence, the odds rose to
89 percent; if she were at the 98th centile, they dropped to 10 percent.'59'
220
Cognitive Classes and Social Behavior
Parenting
2 2 1
The changes in the odds were proportionately large for women who were
not living in poverty when the child was born.
The Role of Education
For children of women with a high school diploma (no more, no less),
the relationships of IQ and socioeconomic background to the odds that
a child would live in poverty are the same as shown in the figure above-
almost equally important, with socioeconomic background fractionally
more so-except that the odds are a little lower than for the whole sam-
ple (the highest percentages, for mothers two standard deviations he-
low the mean, are in the high 20s, instead of the mid-30s). As this
implies, the highest incidence of childhood poverty occurs among
women who dropped out of school. Among the white college sample (a
bachelor's degree, no more and no less), there was nothing to analyze;
only one child of such mothers had lived his first three years in poverty.
IQ AND THE HOME ENVIRONMENT FOR CHILD
DEVELOPMENT
In 1986, 1988, and 1990, the NLSY conducted special supplementary
surveys of the children and mothers in the sample. The children were
given tests of mental, emotional, and physical development, to which
we shall turn presently. The mothers were questioned ahout their chil-
dren's development and their rearing practices. The home situation was
directly observed. The survey instruments were based on the so-called
HOME (Home Observation for Measurement of the Environment)
index.lhO'
Dozens of questions and observations go into creating the summary
measures, many of them interesting in themselves. Children of the
brightest mothers (who also tend to he the best educated and the most
affluent) have a big advantage in many ways, especially on such he-
havfors as reading to the child. On other indicators that are less criti-
cal in themselves, but indirectly suggest how the child is heing raised,
children with smarter mothers also do better. For example, mothers in
the top cognitive classes use physical punishment less often (though
they agree in principle that physical punishment can he an appropriate
response), and the television set is off more of the time in the homes of
the top cognitive classes.
Treating the HOME index as a continuous scale running from "very
bad" to "very good" home environments, the advantages of white chil-
dren with smarter mothers were clear. The average child of a Class V
woman lived in a home at the 32d percentile of home environment,
while the home of the average child of a Class I woman was at the 76th
percentile. The gradations for the three intervening classes were regu-
lar as well.'"' Overall, the correlation of the HOME index with IQ
for white mothers was +.24, statistically significant but hardly over-
powering.
In trying to identify children at risk, this way of looking at the rela-
tionship is not necessarily the most revealing. We are willing to assume
that a child growing up in a home at the 90th centile on the HOME in-
dex has a "better" environment than one growing up at the 50th. Per-
haps the difference between a terrific home environment and a merely
average one helps produce children who are at the high end on various
personality and achievement measures. But it does not necessarily fol-
low that the child in the home at the 50th centile is that much more at
risk for the worst outcomes of malparenting than the child at the 90th
centile. Both common sense and much of the scholarly work on child
development suggest that children are resilient in the face of moderate
disadvantages and obstacles and, on the other hand, that parents are
frustratingly unahle to fine-tune good results for their children.
Rut resilience has its limits. Children coming from the least nurtur-
ing, most punishing environments are indeed at risk. We will therefore
focus throughout this section on children who are in the bottom 10 per-
cent on various measures of their homes.'h2'
Which White Children Grow
Up in the Worst Homes?
Percentage of
Their Children Growing
Cognitive Class of
Up in Homes in the Bottom
the Mother
Decile of the HOME Index
I Very bright
0
I1 Bright
2
111 Normal
6
IV Dull
11
V Very dull
24
All whites
6
Cognitive Ability and Parenting Quality
- Children exhibit resilience against moderate disadvantages, but extreme environments in the bottom decile pose significant developmental risks.
- Data suggests a sharp correlation between a mother's cognitive class and the likelihood of providing a home environment in the bottom decile.
- While socioeconomic status (SES) is traditionally blamed for poor home environments, maternal IQ appears to be a stronger predictor of the 'worst homes.'
- A mother with average intelligence but very low SES has a lower probability of providing a poor home environment than a mother with low intelligence and average SES.
- The analysis challenges the assumption that poverty alone is the primary driver of developmental problems in children.
Both common sense and much of the scholarly work on child development suggest that children are resilient in the face of moderate disadvantages and obstacles and, on the other hand, that parents are frustratingly unable to fine-tune good results for their children.
220
Cognitive Classes and Social Behavior
Parenting
2 2 1
The changes in the odds were proportionately large for women who were
not living in poverty when the child was born.
The Role of Education
For children of women with a high school diploma (no more, no less),
the relationships of IQ and socioeconomic background to the odds that
a child would live in poverty are the same as shown in the figure above-
almost equally important, with socioeconomic background fractionally
more so-except that the odds are a little lower than for the whole sam-
ple (the highest percentages, for mothers two standard deviations he-
low the mean, are in the high 20s, instead of the mid-30s). As this
implies, the highest incidence of childhood poverty occurs among
women who dropped out of school. Among the white college sample (a
bachelor's degree, no more and no less), there was nothing to analyze;
only one child of such mothers had lived his first three years in poverty.
IQ AND THE HOME ENVIRONMENT FOR CHILD
DEVELOPMENT
In 1986, 1988, and 1990, the NLSY conducted special supplementary
surveys of the children and mothers in the sample. The children were
given tests of mental, emotional, and physical development, to which
we shall turn presently. The mothers were questioned ahout their chil-
dren's development and their rearing practices. The home situation was
directly observed. The survey instruments were based on the so-called
HOME (Home Observation for Measurement of the Environment)
index.lhO'
Dozens of questions and observations go into creating the summary
measures, many of them interesting in themselves. Children of the
brightest mothers (who also tend to he the best educated and the most
affluent) have a big advantage in many ways, especially on such he-
havfors as reading to the child. On other indicators that are less criti-
cal in themselves, but indirectly suggest how the child is heing raised,
children with smarter mothers also do better. For example, mothers in
the top cognitive classes use physical punishment less often (though
they agree in principle that physical punishment can he an appropriate
response), and the television set is off more of the time in the homes of
the top cognitive classes.
Treating the HOME index as a continuous scale running from "very
bad" to "very good" home environments, the advantages of white chil-
dren with smarter mothers were clear. The average child of a Class V
woman lived in a home at the 32d percentile of home environment,
while the home of the average child of a Class I woman was at the 76th
percentile. The gradations for the three intervening classes were regu-
lar as well.'"' Overall, the correlation of the HOME index with IQ
for white mothers was +.24, statistically significant but hardly over-
powering.
In trying to identify children at risk, this way of looking at the rela-
tionship is not necessarily the most revealing. We are willing to assume
that a child growing up in a home at the 90th centile on the HOME in-
dex has a "better" environment than one growing up at the 50th. Per-
haps the difference between a terrific home environment and a merely
average one helps produce children who are at the high end on various
personality and achievement measures. But it does not necessarily fol-
low that the child in the home at the 50th centile is that much more at
risk for the worst outcomes of malparenting than the child at the 90th
centile. Both common sense and much of the scholarly work on child
development suggest that children are resilient in the face of moderate
disadvantages and obstacles and, on the other hand, that parents are
frustratingly unahle to fine-tune good results for their children.
Rut resilience has its limits. Children coming from the least nurtur-
ing, most punishing environments are indeed at risk. We will therefore
focus throughout this section on children who are in the bottom 10 per-
cent on various measures of their homes.'h2'
Which White Children Grow
Up in the Worst Homes?
Percentage of
Their Children Growing
Cognitive Class of
Up in Homes in the Bottom
the Mother
Decile of the HOME Index
I Very bright
0
I1 Bright
2
111 Normal
6
IV Dull
11
V Very dull
24
All whites
6
222
Cognitive Classes and Social Behavior
Parenting
223
In the case of the HOME index, the percentages of white children of
mothers in the different cognitive classes who are growing up in homes
that scored at the bottom are displayed in the table. It was extremely
rare for children of women in the top cognitive classes to grow up in
these "worst homes" and quite uncommon for children of women
throughout the top three-fourths of the IQ distribution. Only in the bot-
tom cognitive classes did the proportion of such children grow, and then
the proportions rose rapidly. Nearly one out of four of the children of
the dullest mothers was growing up in a home that also ranked in the
bottom decile on the HOME index.I6"
The Role of Socioeconomic Background
The usual assumption about maternal behavior is that a woman's so-
cioeconomic status is crucial-that
she passes on to her children the
benefits or disadvantages of her own family background. The figure he-
low summarizes the standard analysis comparing SES and IQ.
A white mother's IQ is more important than her socioeconomic
background in predicting the worst home environments
Probability of being in the bottom decile of the HOME index
20% -
As the mother's IQ
goes from low to high
5% - As the mother's
- socioeconomic background
I goes from low to high
., ,.
I
I
I
I
Very low
Very high
(-2 SDs)
(+2 SDs)
Note: For computing the plot, age and e~ther SES (for the hlack curve) or IQ (for [he gray
curve) were set at them mean values. Addlt~onal Independent variables were used to control
for the test year and the age of the children.
Both factors play a significant role, but once again it is worse (at least
for the white NLSY population) to have a mother with a low IQ than
one from a low socioeconomic background. Given just an average IQ
for the mother, even a mother at the 2d centile on socioeconomic back-
ground had less than a 10 percent chance of providing one of the "worst
homes" for her children. Rut even with average socioeconomic back-
ground, a mother at the 2d centile of intelligence had almost a 17 per-
cent chance of providing one of these "worst homes."
The Role of Poverty and Welfare
Many of the problems experienced by poor children are usually attrib-
uted in both public dialogue and academic writings to poverty itself.64
The reasons for this widely assumed link between poverty and devel-
opmental problems are harder to spell out than you might think. To re-
peat a point that must always be kept in mind when thinking about
poverty: Most of the world's children throughout history have grown up
poor, with "poverty" meaning material deprivation far more severe than
the meaning of "below the poverty line" in today's America. Many of
the disadvantages today's children experience are not the poverty itself
but the contemporary correlates of poverty: being without a father, for
example, or living in high-crime neighborhoods. Today, high propor-
tions of poor children experience these correlates; fifty years ago, com-
paratively few poor children did.
But there are reasons to think that the HOME index might be influ-
enced by poverty. Reading to children is a good thing to do, for exam-
ple, and raises the HOME score, but children's books are expensive. It
is easier to have hooks in the house if you can afford to buy them than
if you have to trek to the library-perhaps
quite far from home-to
get
them. Similar comments apply to many of the indicators on the HOME
index that do not require wealth but could be affected by very low in-
come. We therefore explored how the HOME index was related to the
mother's poverty or welfare recipiency in the calendar year before the
HOME score was obtained.[651
Poverty proved to be important, with "being in a state of poverty"
raising the odds of being in the worst decile of the HOME index from
4 percent to 11 percent, given a mother of average IQ and socioeco-
nomic status.lM' But adding poverty to the equation did not diminish
the independent role of cognitive ability. For example, if the mother
Poverty, IQ, and Home Environments
- The text distinguishes between historical material deprivation and contemporary poverty correlates like fatherlessness and high crime.
- While poverty increases the likelihood of a poor home environment, it does not diminish the independent role of a mother's cognitive ability.
- Welfare recipiency is identified as a slightly more powerful predictor of a deficient home environment than poverty alone.
- Statistical analysis shows that a mother with very low intelligence who is also poor and on welfare has a 34 percent chance of providing a bottom-decile home environment.
- The authors argue that low income itself does not inherently prevent a nurturing environment, as evidenced by historical child-rearing and regression data.
- The findings suggest that poverty often serves as a proxy for other personality characteristics or social factors rather than being the sole causal agent.
What can be said unequivocally is that low income as such does not prevent children from being raised in a stimulating, nurturing environment.
222
Cognitive Classes and Social Behavior
Parenting
223
In the case of the HOME index, the percentages of white children of
mothers in the different cognitive classes who are growing up in homes
that scored at the bottom are displayed in the table. It was extremely
rare for children of women in the top cognitive classes to grow up in
these "worst homes" and quite uncommon for children of women
throughout the top three-fourths of the IQ distribution. Only in the bot-
tom cognitive classes did the proportion of such children grow, and then
the proportions rose rapidly. Nearly one out of four of the children of
the dullest mothers was growing up in a home that also ranked in the
bottom decile on the HOME index.I6"
The Role of Socioeconomic Background
The usual assumption about maternal behavior is that a woman's so-
cioeconomic status is crucial-that
she passes on to her children the
benefits or disadvantages of her own family background. The figure he-
low summarizes the standard analysis comparing SES and IQ.
A white mother's IQ is more important than her socioeconomic
background in predicting the worst home environments
Probability of being in the bottom decile of the HOME index
20% -
As the mother's IQ
goes from low to high
5% - As the mother's
- socioeconomic background
I goes from low to high
., ,.
I
I
I
I
Very low
Very high
(-2 SDs)
(+2 SDs)
Note: For computing the plot, age and e~ther SES (for the hlack curve) or IQ (for [he gray
curve) were set at them mean values. Addlt~onal Independent variables were used to control
for the test year and the age of the children.
Both factors play a significant role, but once again it is worse (at least
for the white NLSY population) to have a mother with a low IQ than
one from a low socioeconomic background. Given just an average IQ
for the mother, even a mother at the 2d centile on socioeconomic back-
ground had less than a 10 percent chance of providing one of the "worst
homes" for her children. Rut even with average socioeconomic back-
ground, a mother at the 2d centile of intelligence had almost a 17 per-
cent chance of providing one of these "worst homes."
The Role of Poverty and Welfare
Many of the problems experienced by poor children are usually attrib-
uted in both public dialogue and academic writings to poverty itself.64
The reasons for this widely assumed link between poverty and devel-
opmental problems are harder to spell out than you might think. To re-
peat a point that must always be kept in mind when thinking about
poverty: Most of the world's children throughout history have grown up
poor, with "poverty" meaning material deprivation far more severe than
the meaning of "below the poverty line" in today's America. Many of
the disadvantages today's children experience are not the poverty itself
but the contemporary correlates of poverty: being without a father, for
example, or living in high-crime neighborhoods. Today, high propor-
tions of poor children experience these correlates; fifty years ago, com-
paratively few poor children did.
But there are reasons to think that the HOME index might be influ-
enced by poverty. Reading to children is a good thing to do, for exam-
ple, and raises the HOME score, but children's books are expensive. It
is easier to have hooks in the house if you can afford to buy them than
if you have to trek to the library-perhaps
quite far from home-to
get
them. Similar comments apply to many of the indicators on the HOME
index that do not require wealth but could be affected by very low in-
come. We therefore explored how the HOME index was related to the
mother's poverty or welfare recipiency in the calendar year before the
HOME score was obtained.[651
Poverty proved to be important, with "being in a state of poverty"
raising the odds of being in the worst decile of the HOME index from
4 percent to 11 percent, given a mother of average IQ and socioeco-
nomic status.lM' But adding poverty to the equation did not diminish
the independent role of cognitive ability. For example, if the mother
224
Cognitive Classes and Social Behavior
had very low IQ (the 2d centile) and was in poverty, the odds of being
in the worst decile on the HOME index jumped from 11 percent to 26
percent. Generally, adding poverty to the analysis replaced the impact
of the mother's socioeconomic background, not of her intelligence.
Then we turn to welfare. The hypothesis is that going on welfare sig-
nifies personality characteristics other than IQ that are likely to make
the home environment deficient-irresponsibility,
immaturity, or lack
of initiative, for example. Therefore, the worst homes on the HOME
index will also tend to be welfare homes. This hypothesis too is borne
out by the data: Welfare recipiency was a slightly more powerful
predictor of being in a "worse home" than poverty-but
it had as little
effect on the independent role of IQ.
In trying to decide among competing explanations, the simplest thing
to do is to enter both poverty and welfare in the analysis and see which
wins out. We summarize the outcome by first considering a child whose
mother is of average intelligence and socioeconomic background. If his
mother is either poor or on welfare (but not both), the odds of having
a terrible home environment (bottom decile on the HOME index) are
8 or 9 percent. If the mother has an IQ of 70, the odds shoot up to 18
to 21 percent. If the mother has very low intelligence, is poor, and is
also on welfare, the odds rise further, to 34 percent. A table with some
of the basic permutations is given in the note.167'
Still, many of the causal issues remain unresolved. The task for schol-
ars is to specify what it is about poverty that leads to the outcomes as-
sociated with it. With the data at hand, we cannot go much further in
distinguishing between the effects of lack of money and the effects of
other things that "being in poverty" signifies. In particular, the way that
poverty and welfare interact in producing a poor home environment
provides many hints that need to be followed up.
What can be said unequivocally is that low income as such does not
prevent children from being raised in a stimulating, nurturing environ-
ment. Such is the story of the regression coefficients, and a conclusion
that accords with child rearing throughout history. By the same token,
it does not take a genius to provide a child with a stimulating, nurtur-
ing environment. The average differences in environment across the
cognitive classes are large and in many ways troubling, but, in percent-
age terms, they explain little of the variance. Abundant examples of ex-
cellent parents may be found through all but the very lowest range of
cognitive ability.
Parenting
2 2 5
The Role of Education
We conclude, as usual, by considering the role of education through the
high school graduate and college graduate subsamples. Holding mater-
nal age and the mother's socioeconomic background constant at their
means, college graduates tend to do well, no matter what their cogni-
tive ahility (within their restricted range), even though cognitive abil-
ity retains a statistically significant relationship. Within the high school
sample, the effects of cognitive ability are plain; the odds of being in the
bottom decile on the HOME index for the child of a mother of average
socioeconomic background drop from 15 percent for a high school grad-
uate at the 2d IQ centile to 5 percent for a comparable person at the
98th IQ centile. As in the earlier analyses, the most important impact
of cognitive ability within the high school graduates seems to be at the
low end. Socioeconomic background also continues to play an impor-
tant independent role, but less than 1Q.
DEVELOPMENTAL OUTCOMES
The NLSY also administered batteries of tests regarding the develop-
mental outcomes for the children of NLSY mothers. We review several
indicators briefly, then present a summary index showing the interrela-
tionships the mother's cognitive ability, socioeconomic background,
poverty, and welfare.
Some More Complications
The HOME inventory has two components-a
Cognitive Stimulation
score and an Emotional Support score-both
adapted to three separate age
groups (under 3 , 3 to 5, and over 5 years of age). We conducted a variety
of analyses to explore the subtests' roles for different age groups. Briefly,
the mother's IQ had the dominant role in determining the Emotional Sup-
port score for children through the age of 5, whereas its role in determin-
ing Cognitive Stimulation was roughly coequal with education and
socioeconomic background-the opposite of what one might predict. Ma-
ternal IQ was especially important for Emotional Support to the 3- to 5-
year-old group. It would be worthwhile for investigators to explore with
other data the NLSY's indications that parental IQ is especially important
for the home environment from ages 3 to 5, and the peculiar find~ng that
parental IQ is more important for Emotional Support than for Cognitive
Stimulation.
Cognitive Ability and Parenting
- While cognitive classes show differences in parenting quality, excellent parents are found across almost the entire range of cognitive ability.
- Education acts as a buffer, with college graduates generally providing high-quality home environments regardless of their specific IQ within that group.
- For high school graduates, lower cognitive ability significantly increases the risk of a child being in the bottom decile for home environment quality.
- Maternal IQ surprisingly plays a more dominant role in providing emotional support than it does in providing cognitive stimulation.
- Data suggests that toddlers of mothers with lower cognitive ability are more likely to be categorized as 'difficult' or 'less friendly.'
It would be worthwhile for investigators to explore with other data the NLSY's indications that parental IQ is especially important for the home environment from ages 3 to 5, and the peculiar finding that parental IQ is more important for Emotional Support than for Cognitive Stimulation.
224
Cognitive Classes and Social Behavior
had very low IQ (the 2d centile) and was in poverty, the odds of being
in the worst decile on the HOME index jumped from 11 percent to 26
percent. Generally, adding poverty to the analysis replaced the impact
of the mother's socioeconomic background, not of her intelligence.
Then we turn to welfare. The hypothesis is that going on welfare sig-
nifies personality characteristics other than IQ that are likely to make
the home environment deficient-irresponsibility,
immaturity, or lack
of initiative, for example. Therefore, the worst homes on the HOME
index will also tend to be welfare homes. This hypothesis too is borne
out by the data: Welfare recipiency was a slightly more powerful
predictor of being in a "worse home" than poverty-but
it had as little
effect on the independent role of IQ.
In trying to decide among competing explanations, the simplest thing
to do is to enter both poverty and welfare in the analysis and see which
wins out. We summarize the outcome by first considering a child whose
mother is of average intelligence and socioeconomic background. If his
mother is either poor or on welfare (but not both), the odds of having
a terrible home environment (bottom decile on the HOME index) are
8 or 9 percent. If the mother has an IQ of 70, the odds shoot up to 18
to 21 percent. If the mother has very low intelligence, is poor, and is
also on welfare, the odds rise further, to 34 percent. A table with some
of the basic permutations is given in the note.167'
Still, many of the causal issues remain unresolved. The task for schol-
ars is to specify what it is about poverty that leads to the outcomes as-
sociated with it. With the data at hand, we cannot go much further in
distinguishing between the effects of lack of money and the effects of
other things that "being in poverty" signifies. In particular, the way that
poverty and welfare interact in producing a poor home environment
provides many hints that need to be followed up.
What can be said unequivocally is that low income as such does not
prevent children from being raised in a stimulating, nurturing environ-
ment. Such is the story of the regression coefficients, and a conclusion
that accords with child rearing throughout history. By the same token,
it does not take a genius to provide a child with a stimulating, nurtur-
ing environment. The average differences in environment across the
cognitive classes are large and in many ways troubling, but, in percent-
age terms, they explain little of the variance. Abundant examples of ex-
cellent parents may be found through all but the very lowest range of
cognitive ability.
Parenting
2 2 5
The Role of Education
We conclude, as usual, by considering the role of education through the
high school graduate and college graduate subsamples. Holding mater-
nal age and the mother's socioeconomic background constant at their
means, college graduates tend to do well, no matter what their cogni-
tive ahility (within their restricted range), even though cognitive abil-
ity retains a statistically significant relationship. Within the high school
sample, the effects of cognitive ability are plain; the odds of being in the
bottom decile on the HOME index for the child of a mother of average
socioeconomic background drop from 15 percent for a high school grad-
uate at the 2d IQ centile to 5 percent for a comparable person at the
98th IQ centile. As in the earlier analyses, the most important impact
of cognitive ability within the high school graduates seems to be at the
low end. Socioeconomic background also continues to play an impor-
tant independent role, but less than 1Q.
DEVELOPMENTAL OUTCOMES
The NLSY also administered batteries of tests regarding the develop-
mental outcomes for the children of NLSY mothers. We review several
indicators briefly, then present a summary index showing the interrela-
tionships the mother's cognitive ability, socioeconomic background,
poverty, and welfare.
Some More Complications
The HOME inventory has two components-a
Cognitive Stimulation
score and an Emotional Support score-both
adapted to three separate age
groups (under 3 , 3 to 5, and over 5 years of age). We conducted a variety
of analyses to explore the subtests' roles for different age groups. Briefly,
the mother's IQ had the dominant role in determining the Emotional Sup-
port score for children through the age of 5, whereas its role in determin-
ing Cognitive Stimulation was roughly coequal with education and
socioeconomic background-the opposite of what one might predict. Ma-
ternal IQ was especially important for Emotional Support to the 3- to 5-
year-old group. It would be worthwhile for investigators to explore with
other data the NLSY's indications that parental IQ is especially important
for the home environment from ages 3 to 5, and the peculiar find~ng that
parental IQ is more important for Emotional Support than for Cognitive
Stimulation.
226
Cognitive Classes and Social Behavior
Parenting
2 2 7
Temperament in Very Young Children
The first of the measures applies to very young children (12 to 23
months), and consists of indexes of "difficulty" and "friendliness." Once
again we focus on children who exhibit the most conspicuous signs of
having problems-those
in the bottom decile-as
shown in the fol-
lowing table.[681
Generally, babies were more "difficultw-more irritable,
more fearful, and less sociable-for
mothers with lower cognitive abil-
ity, and they were also less friendly, as measured by this index.
Which White Toddlers Have the Worst Temperaments?
Percentage of
Percentage of
Children in the Most
Children in the Least
Difficult Decile on
Friendly Decile on
the Difficulty
Cognitive Class
the Friendliness
Index
of the Mother
Index
-
I Very bright
-
4
I1 Bright
3
8
I11 Normal
5
14
IV Dull
1 1
-
V Very dull
12
8
All whites
6
Motor and Social Development in lnfants and Toddkrs
Motor and social development is, in effect, a set of measures designed
to capture whether the child is progressing in the ways described as nor-
mal in the baby manuals by Spock, Brazelton, et al. The table below
shows the results for children through the age of 3. The results look like
a U-shaped curve, with a big jump in Class V. Since sample sizes in both
Class I and Class V are under 100 (75 and 81, respectively), this infor-
mation falls in the category of interesting but uncertain.
Behavioral Probkm in 0 & r Children
For older children, the NLSY employed an instrument that measured
behavioral problems, with subscales on antisocial behavior, depression,
Which White Children Are Behind in
Motor and Social Development?
Percentage of Children
in the Bottom Decile
Cognitive Class
of the Motor & Social
of the Mother
Development Index
I Very bright
10
I1 Bright
5
I11 Normal
6
i v Dull
10
V Very dull
3 2
All whites
7
headstrongness, hyperactivity, immature dependency, and peer con-
flictlsocial withdrawal. The table below shows the results for those who
had the most severe problems-those
in the worst 10 percent on these
measures.
Which White Children Have the
Worst Behavioral Problems?
Percentage of Children
Cognitive Class
in the Worst Decile of the
ofthe Mother
Behavioral Problems Index
I Very bright
11
I1 Bright
6
I11 Normal
10
IV Dull
12
V Very dull
2 1
All whites
10
Once again, there is the curious case of the elevated percentage for
children of mothers in Class I. The most prudent assumption is that it
is an artifact of small sample sizes, but the possibility remains that some-
thing else is going on worth investigating in greater detail, with larger
samples.
An l d x of Developmental Problem
Each of the developmental indexes we have reviewed is based on a num-
ber of individual items, which in turn lend themselves to a wide variety
of analyses that would take us far beyond the scope of this discussion.
Maternal IQ and Child Development
- Statistical data suggests a U-shaped curve where children of both the highest and lowest cognitive classes show elevated developmental risks.
- Children of mothers in the lowest cognitive class (Class V) are significantly more likely to fall into the bottom decile of motor and social development.
- A mother's IQ and socioeconomic background both show moderate relationships with a child's probability of experiencing developmental problems.
- Environmental factors such as poverty, welfare dependency, and illegitimacy significantly increase the likelihood of developmental issues.
- A child born to an unmarried mother on welfare in poverty faces nearly double the risk of developmental problems compared to a child in a stable, married household.
The results look like a U-shaped curve, with a big jump in Class V.
226
Cognitive Classes and Social Behavior
Parenting
2 2 7
Temperament in Very Young Children
The first of the measures applies to very young children (12 to 23
months), and consists of indexes of "difficulty" and "friendliness." Once
again we focus on children who exhibit the most conspicuous signs of
having problems-those
in the bottom decile-as
shown in the fol-
lowing table.[681
Generally, babies were more "difficultw-more irritable,
more fearful, and less sociable-for
mothers with lower cognitive abil-
ity, and they were also less friendly, as measured by this index.
Which White Toddlers Have the Worst Temperaments?
Percentage of
Percentage of
Children in the Most
Children in the Least
Difficult Decile on
Friendly Decile on
the Difficulty
Cognitive Class
the Friendliness
Index
of the Mother
Index
-
I Very bright
-
4
I1 Bright
3
8
I11 Normal
5
14
IV Dull
1 1
-
V Very dull
12
8
All whites
6
Motor and Social Development in lnfants and Toddkrs
Motor and social development is, in effect, a set of measures designed
to capture whether the child is progressing in the ways described as nor-
mal in the baby manuals by Spock, Brazelton, et al. The table below
shows the results for children through the age of 3. The results look like
a U-shaped curve, with a big jump in Class V. Since sample sizes in both
Class I and Class V are under 100 (75 and 81, respectively), this infor-
mation falls in the category of interesting but uncertain.
Behavioral Probkm in 0 & r Children
For older children, the NLSY employed an instrument that measured
behavioral problems, with subscales on antisocial behavior, depression,
Which White Children Are Behind in
Motor and Social Development?
Percentage of Children
in the Bottom Decile
Cognitive Class
of the Motor & Social
of the Mother
Development Index
I Very bright
10
I1 Bright
5
I11 Normal
6
i v Dull
10
V Very dull
3 2
All whites
7
headstrongness, hyperactivity, immature dependency, and peer con-
flictlsocial withdrawal. The table below shows the results for those who
had the most severe problems-those
in the worst 10 percent on these
measures.
Which White Children Have the
Worst Behavioral Problems?
Percentage of Children
Cognitive Class
in the Worst Decile of the
ofthe Mother
Behavioral Problems Index
I Very bright
11
I1 Bright
6
I11 Normal
10
IV Dull
12
V Very dull
2 1
All whites
10
Once again, there is the curious case of the elevated percentage for
children of mothers in Class I. The most prudent assumption is that it
is an artifact of small sample sizes, but the possibility remains that some-
thing else is going on worth investigating in greater detail, with larger
samples.
An l d x of Developmental Problem
Each of the developmental indexes we have reviewed is based on a num-
ber of individual items, which in turn lend themselves to a wide variety
of analyses that would take us far beyond the scope of this discussion.
228
Cognitive Classes and Social Behavior
Parenting
229
We conducted many analyses for the separate indexes, but the overall
patterns were similar. For our purposes in conveying to you the general
pattern of results, it is sufficient to summarize the results for a broad
question: What independent role, if any, does the mother's IQ h.1 ve on
the probability that her child experiences a substantial developmental
problem? We created a simple "developmental problem ~ndex," in
which the child scores Yes if he or she were in the bottom decile of any
of the four indicators in a given test year, and No if not. The results are
shown in the next figure.
Both a white mother's IQ and socioeconomic
background have moderate relationships with
the developmental problems in the child
Probability of having a child in the bottom decile
on one of the developmental indicators
208 -
As the mother's 1Q
As the mother's
socioeconomic background
goes from /OH* to high
The pattern shown in the figure generally applies to the four devel-
opment indicators separately: IQ has a somewhat larger independent ef-
fect than socioeconomic background, but of modest size and marginal
statistical significance.
The Role of Poverty, Welfare, and lllegi timacy
We repeated the analyses adding a poverty variable (Was the mother
living in poverty in the year the developmental measures were taken?),
a welfare variable (Was the mother on AFDC in the year the de-
velopmental measures were taken?), and legitimacy variable (Was
the child born outside marriage?) When entered separately or in
combination, each had a statistically significant independent role.'691
Consider the stark contrast between a child born to an unmarried
mother, on welfare and in poverty, and a child born to a married
mother, not on welfare and above the poverty line. Given a mother
with average IQ and socioeconomic background, the chances that the
first child had a substantial developmental pmhlem were almost twice
as high as those facing the second child-15
percent compared to 8
percent. Rut taking these factors into account did not wipe out the in-
dependent role of either IQ or the mother's socioeconomic back-
ground; in fact, the independent effects of IQ and socioeconomic
background after extracting the independent role of poverty, illegiti-
macy, and welfare, is visually almost indistinguishable from the one
shown above.
The Rok of Education
An;~lyses of the college graduate sample were provocative but no more
than that, because only 29 out of 470 children of white cclllege gradu-
ates who were tested (6 percent) showed up with a substantial devel-
opmental problem. The provocative finding was that among those 29,
5 were children of women in Class I ( 10 percent of the 50 such children
tested). Thus in the college sample, the statistical result of holding so-
cioeconomic background constant was that higher 1Q was associated
with a substantially higher probability of having developmental prob-
lems. Five out of 50 is of course not enough to make much of these num-
bers, but we commend the finding to our colleagues who specialize in
child development.
Within the high school sample, the independent roles of IQ and
socioeconomic background were almost identical, and of the same
order of magnitude indicated in the figure for the entire white
sample.
IQ and Intergenerational Outcomes
- Statistical analysis shows that maternal IQ and socioeconomic background remain independent predictors of child outcomes even after controlling for poverty and welfare status.
- A provocative but small-scale finding suggests that among college graduates, higher maternal IQ might correlate with a higher probability of child developmental problems.
- Children's cognitive ability, measured by the Peabody Picture Vocabulary Test (PPVT), tends to closely mirror the IQ of their mothers.
- The risk of a child falling into the bottom decile of IQ remains low for the top three-quarters of the maternal IQ distribution but rises precipitously for the bottom quarter.
- Maternal IQ is found to be significantly more influential than socioeconomic background in determining a child's IQ score.
- A one standard deviation increase in maternal IQ results in a 6.3 point gain for the child, compared to only a 1.7 point gain for a similar increase in socioeconomic status.
The provocative finding was that among those 29, 5 were children of women in Class I (10 percent of the 50 such children tested).
228
Cognitive Classes and Social Behavior
Parenting
229
We conducted many analyses for the separate indexes, but the overall
patterns were similar. For our purposes in conveying to you the general
pattern of results, it is sufficient to summarize the results for a broad
question: What independent role, if any, does the mother's IQ h.1 ve on
the probability that her child experiences a substantial developmental
problem? We created a simple "developmental problem ~ndex," in
which the child scores Yes if he or she were in the bottom decile of any
of the four indicators in a given test year, and No if not. The results are
shown in the next figure.
Both a white mother's IQ and socioeconomic
background have moderate relationships with
the developmental problems in the child
Probability of having a child in the bottom decile
on one of the developmental indicators
208 -
As the mother's 1Q
As the mother's
socioeconomic background
goes from /OH* to high
The pattern shown in the figure generally applies to the four devel-
opment indicators separately: IQ has a somewhat larger independent ef-
fect than socioeconomic background, but of modest size and marginal
statistical significance.
The Role of Poverty, Welfare, and lllegi timacy
We repeated the analyses adding a poverty variable (Was the mother
living in poverty in the year the developmental measures were taken?),
a welfare variable (Was the mother on AFDC in the year the de-
velopmental measures were taken?), and legitimacy variable (Was
the child born outside marriage?) When entered separately or in
combination, each had a statistically significant independent role.'691
Consider the stark contrast between a child born to an unmarried
mother, on welfare and in poverty, and a child born to a married
mother, not on welfare and above the poverty line. Given a mother
with average IQ and socioeconomic background, the chances that the
first child had a substantial developmental pmhlem were almost twice
as high as those facing the second child-15
percent compared to 8
percent. Rut taking these factors into account did not wipe out the in-
dependent role of either IQ or the mother's socioeconomic back-
ground; in fact, the independent effects of IQ and socioeconomic
background after extracting the independent role of poverty, illegiti-
macy, and welfare, is visually almost indistinguishable from the one
shown above.
The Rok of Education
An;~lyses of the college graduate sample were provocative but no more
than that, because only 29 out of 470 children of white cclllege gradu-
ates who were tested (6 percent) showed up with a substantial devel-
opmental problem. The provocative finding was that among those 29,
5 were children of women in Class I ( 10 percent of the 50 such children
tested). Thus in the college sample, the statistical result of holding so-
cioeconomic background constant was that higher 1Q was associated
with a substantially higher probability of having developmental prob-
lems. Five out of 50 is of course not enough to make much of these num-
bers, but we commend the finding to our colleagues who specialize in
child development.
Within the high school sample, the independent roles of IQ and
socioeconomic background were almost identical, and of the same
order of magnitude indicated in the figure for the entire white
sample.
230
Cognitive Classes and Social Behavior
Parenting
231
THE COGNITIVE OUTCOME
We finally come to the intelligence of the children of white NLSY
women. The measure of intelligence we shall be using is the Peahody
Picture Vocabulary Test (PPVT), a widely used measure of cognitive
ability in children that has the advantage of not requiring that the child
be able to read. The scores for the NLSY children are expressed in terms
of the national norms for the PPVT, which use a mean of 100 and a stan-
dard deviation of 15. Because IQ scores tend to be volatile for children
under the age of 6, we limit the sample to children who were at least 6
when they took the test.
The unsurprising news in the next table is that the children tend to
resemble their mothers in IQ.70 But by continuing to use the "worst
IQ in the Mother and the Child for Whites in the NLSY
Percentage of Their
Cognitive Class
Mean 1Q of
Children in the
of the Mothers
Their Children
Bottom Decile of IQ
I Very bright
-
-
11 Bright
107
7
111 Normal
100
6
IV Dull
95
17
V Very dull
8 1
39
All whites
99
10
decile" as a way of zeroing in on the children most at risk, the table
makes another point: White parents throughout the top three-quarters
of the IQ distribution have few children who fall into the bottom decile
of IQ.'~"
For mothers in the bottom quarter of the distribution, however,
the proportion of low IQ children rises precipitously. We return to this
issue in Chapter 15.
The Rok of Socioeconomic Background
Consistent with the conclusions drawn in a large technical literature,
the IQ of the NLSY mothers was much more important than their so-
cioeconomic background in determining their children's IQ.''" A white
child's IQ in the NLSY sample went up by 6.3 IQ points for each in-
crease of one standard deviation in the mother's IQ, compared to 1.7
points for each increase of one standard deviation in the mother's so-
cioeconomic background (in an analysis that also extracted the effects
of the mother's age, the test year, and the age of the child when tested).
When we examine the probability that the child will fall in the bottom
decile of IQ, we arrived at the results shown in the next figure.
A white mother's IQ dominates the importance of socioeconomic
background in determining the child's IQ
Probability of having a child in the bottom decile of IQ
30% -
As the mother's IQ
goes from low to high
208 -
10%-
As the mother's socioeconomic
background goes from low to high
0% ,
I
I
I
I
Note: For computmg the plot, age and either SES (for the hlack curve) or IQ (for the pay
curve) were set at their mean values. Add~tlonal independent var~ahles were used to control
tor the test year and the age of the children when they tcwk the test.
A mother at the 2d IQ centile but of average socioeconomic back-
ground had a 30 percent chance that her child would be in the bottom
decile of IQ, compared to only a 10 percent chance facing the woman
from an equivalently terrible socioeconomic background (2d centile on
the SES index) but with an average IQ.
The Rok of Poverty and the Home Environment
In discussions of IQ among disadvantaged groups, it seems plausible that
factors such as poverty and the aspects of the home environment would
have an effect on the child's IQ. Suppose, for example, we were to ig-
nore the mother's IQ, and look only at her socioeconomic background,
Cognitive Ability and Parenting
- A mother's IQ is a significantly stronger predictor of a child's low IQ risk than her socioeconomic background.
- When maternal IQ is accounted for, the effects of poverty and home environment on a child's cognitive outcome become statistically insignificant.
- Mothers who fail to complete high school show a higher risk of having children in the bottom IQ decile, even when controlling for their own IQ and SES.
- The data suggests a strong correlation between low cognitive ability and negative parenting outcomes, including neglect and developmental issues.
- While low IQ is linked to poor parenting, there is no evidence that the highest-IQ women necessarily make the 'best' mothers.
- Disadvantaged home environments are disproportionately associated with the low end of the intelligence distribution regardless of poverty status.
If the indicators that were used in the studies we have reported are indeed ones that you find valid in your own beliefs about what children need, then the conclusion follows: Over the long run and in the broad perspective, based on your best understanding of the realities of child rearing, smart parents tend to be better parents.
230
Cognitive Classes and Social Behavior
Parenting
231
THE COGNITIVE OUTCOME
We finally come to the intelligence of the children of white NLSY
women. The measure of intelligence we shall be using is the Peahody
Picture Vocabulary Test (PPVT), a widely used measure of cognitive
ability in children that has the advantage of not requiring that the child
be able to read. The scores for the NLSY children are expressed in terms
of the national norms for the PPVT, which use a mean of 100 and a stan-
dard deviation of 15. Because IQ scores tend to be volatile for children
under the age of 6, we limit the sample to children who were at least 6
when they took the test.
The unsurprising news in the next table is that the children tend to
resemble their mothers in IQ.70 But by continuing to use the "worst
IQ in the Mother and the Child for Whites in the NLSY
Percentage of Their
Cognitive Class
Mean 1Q of
Children in the
of the Mothers
Their Children
Bottom Decile of IQ
I Very bright
-
-
11 Bright
107
7
111 Normal
100
6
IV Dull
95
17
V Very dull
8 1
39
All whites
99
10
decile" as a way of zeroing in on the children most at risk, the table
makes another point: White parents throughout the top three-quarters
of the IQ distribution have few children who fall into the bottom decile
of IQ.'~"
For mothers in the bottom quarter of the distribution, however,
the proportion of low IQ children rises precipitously. We return to this
issue in Chapter 15.
The Rok of Socioeconomic Background
Consistent with the conclusions drawn in a large technical literature,
the IQ of the NLSY mothers was much more important than their so-
cioeconomic background in determining their children's IQ.''" A white
child's IQ in the NLSY sample went up by 6.3 IQ points for each in-
crease of one standard deviation in the mother's IQ, compared to 1.7
points for each increase of one standard deviation in the mother's so-
cioeconomic background (in an analysis that also extracted the effects
of the mother's age, the test year, and the age of the child when tested).
When we examine the probability that the child will fall in the bottom
decile of IQ, we arrived at the results shown in the next figure.
A white mother's IQ dominates the importance of socioeconomic
background in determining the child's IQ
Probability of having a child in the bottom decile of IQ
30% -
As the mother's IQ
goes from low to high
208 -
10%-
As the mother's socioeconomic
background goes from low to high
0% ,
I
I
I
I
Note: For computmg the plot, age and either SES (for the hlack curve) or IQ (for the pay
curve) were set at their mean values. Add~tlonal independent var~ahles were used to control
tor the test year and the age of the children when they tcwk the test.
A mother at the 2d IQ centile but of average socioeconomic back-
ground had a 30 percent chance that her child would be in the bottom
decile of IQ, compared to only a 10 percent chance facing the woman
from an equivalently terrible socioeconomic background (2d centile on
the SES index) but with an average IQ.
The Rok of Poverty and the Home Environment
In discussions of IQ among disadvantaged groups, it seems plausible that
factors such as poverty and the aspects of the home environment would
have an effect on the child's IQ. Suppose, for example, we were to ig-
nore the mother's IQ, and look only at her socioeconomic background,
232
Cognitive Classes and Social Behavior
Parenting
233
her poverty status in the year before her child was tested, and her HOME
index score. In that case, we could document the conventional wisdom:
both socioeconomic background and the home environment have large
effects on whether a child scores in the bottom IQ decile. Poverty has
a smaller and statistically marginal effect. But when we add the mother's
IQ, all of those other effects become both small in magnitude and sta-
tistically insignificant. After taking socioeconomic background, the
HOME index, and pretest poverty into account, the independent ef-
fect of IQ remains virtually identical to the one shown on the preced-
ing figure.
The Rok of Education
None of the children in the bottom decile of IQ had a mother with a
bachelor's degree. In the high school graduate sample, the independent
role of the mother's IQ remains large and the independent role of so-
cioeconomic background remains small. But in the process of exploring
this issue, we came upon an effect of education that is worth exploring:
Women who did not complete high school were at much higher risk of
producing children in the bottom decile of IQ than women in the high
school sample (meaning a high school diploma and exactly 12 years of
education), even after controlling for mother's IQ and socioeconomic
background. Additional analyses did not clarify what this finding might
mean; we commend it to our colleagues for a full-scale analysis.
THE ASYMMETRY OF GOOD AND BAD PARENTS
Granting the many exceptions at the individual level, the relationship
of cognitive ability to parenting is unmistakable. Some of these analy-
ses have involved measures that are arguable. Can we really be sure that
the indicators of what constitutes a stimulating and nurturing environ-
ment are not just reflections of the preferences of the upper middle class?
We hope our readers do not take this easy way out. If the indicators that
were used in the studies we have reported are indeed ones that you find
valid in your own beliefs about what children need, then the conclu-
sion follows: Over the long run and in the broad perspective, based on
your best understanding of the realities of child rearing, smart parents
tend to be better parents. People with low cognitive ability tend to be
worse parents. This conclusion holds for a wide range of parenting be-
haviors, from prenatal negligence that leads to low birth weight, to post-
natal treatment of the child associated with neglect and abuse, to de-
velopmental outcomes, to cognitive outcomes.
On the other hand, these data provide little or no evidence that the
smartest women make the best mothers. Children can flourish in a wide
variety of environments that are merely okay. Rut some environments
are so bad that no one can seriously dispute that they are bad, and even
the most resilient children have difficulty overcoming them. These truly
disadvantaged homes are disproportionately associated with women at
the low end of the intelligence distribution, even after other contribut-
ing factors such as poverty and socioeconomic status are taken into ac-
count.
Intelligence and Criminal Behavior
- Criminal offenders typically have an average IQ of 92, which is eight points below the general population mean.
- The correlation between low cognitive ability and criminality remains significant even when controlling for socioeconomic status.
- High intelligence acts as a protective factor, reducing the likelihood of criminal behavior in individuals from high-risk backgrounds.
- Data from the NLSY indicates that for white males, low IQ is a more significant risk factor for incarceration than socioeconomic upbringing.
- The rise in violent crime since the mid-1960s has fundamentally altered American society, forcing a shift from cooperation to coercion.
- Despite the well-documented link between IQ and crime, this relationship is often overlooked in public policy discussions.
The first casualty is not just freedom hut the honds that make community life attractive.
Chapter 11
Crime
Among the most firmly established facts about m'minal offenders is that their
dismbution of IQ scores differs from that of the population at large. Taking
the scientific literature as a whole, criminal offenders have average lQs of
about 92, eight points below the mean. More serious or chronic offenders gen-
erally have lower scores than more casual offenders. The relationship of IQ
to criminality is especially pronounced in the small fraction of the population,
p'marily young men, who constitute the chronic criminals that account for a
disproportionate amount of crime. Offenders who have been caught do not
score much lower, if at all, than those who are getting away with their crimes.
Holding socioeconomic status constant does littk to explain away the rela-
tionship between crime and cognitive ability.
High intelligence also provides some protection against lapsing into crimi-
nality for people who otherwise are at risk. Those who have flown up in tur-
bulent homes, have parents who were themselves criminal, or who have
exhibited the childhood traits that presage crime are less likely to become crim-
inab as adults if they have high IQ.
These findings from an extensive research literature are supported by the
evidence from white males in the NLSY. Low IQ was a risk factor for crimi-
nal behavior, whether criminality was measured by incarceration or by self-
acknowledged crimes. The socioeconomic background of the NLSY's white
males was a negligible risk factor once their cognitive ability was taken into
account.
C
rime can tear a free society apart, because free societies depend so
crucially on faith that the other person will behave decently. As
crime grows, society must substitute coercion for cooperation. The first
casualty is not just freedom hut the honds that make community life at-
236
Cognitive Chses and Social Behavior
Crime
237
tractive. Yes, it is always possible to buy better locks, stay off the streets
after dark, regard every stranger suspiciously, post security guards every-
where, but these are poor substitutes for living in a peaceful and safe
neighborhood.
Most Americans think that crime has gotten far too high. But in
the ruminations about how the nation has reached this state and what
might be done, too little attention has been given to one of the best-
documented relationships in the study of crime: As a group, criminals
are below average in intelligence.
As with so many of the other problems discussed in the previous six
chapters, things were not always so bad. Good crime statistics do not go
back very far in the United States, but we do not need statistics to re-
mind Americans alive in the 1990s of times when they felt secure walk-
ing late at night, alone, even in poor neighborhoods and even in the
nation's largest cities. In the mid-1960s, crime took a conspicuous turn
for the worse. The overall picture using the official statistics is shown in
the figure below, expressed as multiples of the violent crime rate in 1950.
The figure shows the kind of crime that worries most people most vis-
cerally: violent crime, which consists of robbery, murder, aggravated as-
sault, and rape. From 1950 through 1963, the rate for violent crime was
The boom in violent crime after the 1950s
Proportional change in number of violent
crimes reported to the police (1950=1)
1950
1960
1970
1980
1 9 0
Source: Uniform Crime Reports, annual, Federal Bureau of Investigation.
almost flat, followed by an extremely rapid rise from 1964 to 1971, fol-
lowed by continued increases until the 1980s. The early 1980s saw a n
interlude in which violent crime decreased noticeably. But the trend-
line for 1985-1992 is even steeper than the one for 1963-1980, mak-
ing it look as if the lull was just that-a
brief respite from an increase in
violent crime that is now thirty years old.["
There is still some argument among the experts about whether the
numbers in the graph, drawn from the FBI's Uniform Crime Reports,
mean what they seem to mean. But the disagreement has limits. Draw-
ing on sophisticated analyses of these numbers, the consensus con-
clusions are that victimization studies, based on interviews of crime
victims and therefore including crimes not reported to the police,
indicate that the increase in the total range of crimes since 1973
has not been as great as the official statistics suggest, but that the
increase reflected in the official statistics is also real, capturing changes
in crimes that people consider serious enough to warrant reporting to
the police.'2'
DEPRAVED OR DEPRIVED!
The juvenile delinquents in Leonard Bernstein's West Side Story tell Of-
ficer Krupke that they are "depraved on account of we're deprived,"
showing an astute grasp of the poles in criminological theory: the psy-
chological and the sociological.'" Are criminals psychologically dis-
tinct? Or are they ordinary people responding to social and economic
circumstances?
Theories of criminal behavior were mostly near the sociological pole
from the 1950s through the 1970s. Its leading scholars saw criminals as
much like the rest of us, except that society earmarks them for a life of
criminality. Some of these scholars went further, seeing criminals as free
of personal blame, evening up the score with a society that has victim-
ized them. The most radical theorists from the sociological pole argued
that the definition of crime was in itself ideological, creating "criminals"
of people who were doing nothing more than behaving in ways that the
power structure chose to define as deviant. In their more moderate
forms, sociological explanations continue to dominate public discourse.
Many people take it for granted, for example, that poverty and unem-
ployment cause crime-classic sociological arguments that are distin-
guished more by their popularity than by e ~ i d e n c e . ~
Theories of Criminal Behavior
- Official FBI crime statistics and victimization studies both confirm a real increase in serious crime since 1973, though the scales differ.
- Criminological theory has historically oscillated between sociological explanations (environmental deprivation) and psychological explanations (individual depravity).
- Sociological theories, which dominated from the 1950s to the 1970s, often view criminals as ordinary people responding to poverty or social labeling.
- Psychological theories focus on the offender's inherent characteristics, such as deficiencies in conscience, self-restraint, or biological predispositions.
- While public discourse remains largely focused on sociological causes like unemployment, expert consensus is shifting back toward psychological and biological factors.
- The authors propose that cognitive ability is a key personal characteristic that interacts with social and economic environments to influence criminal behavior.
The juvenile delinquents in Leonard Bernstein's West Side Story tell Officer Krupke that they are 'depraved on account of we're deprived,' showing an astute grasp of the poles in criminological theory.
236
Cognitive Chses and Social Behavior
Crime
237
tractive. Yes, it is always possible to buy better locks, stay off the streets
after dark, regard every stranger suspiciously, post security guards every-
where, but these are poor substitutes for living in a peaceful and safe
neighborhood.
Most Americans think that crime has gotten far too high. But in
the ruminations about how the nation has reached this state and what
might be done, too little attention has been given to one of the best-
documented relationships in the study of crime: As a group, criminals
are below average in intelligence.
As with so many of the other problems discussed in the previous six
chapters, things were not always so bad. Good crime statistics do not go
back very far in the United States, but we do not need statistics to re-
mind Americans alive in the 1990s of times when they felt secure walk-
ing late at night, alone, even in poor neighborhoods and even in the
nation's largest cities. In the mid-1960s, crime took a conspicuous turn
for the worse. The overall picture using the official statistics is shown in
the figure below, expressed as multiples of the violent crime rate in 1950.
The figure shows the kind of crime that worries most people most vis-
cerally: violent crime, which consists of robbery, murder, aggravated as-
sault, and rape. From 1950 through 1963, the rate for violent crime was
The boom in violent crime after the 1950s
Proportional change in number of violent
crimes reported to the police (1950=1)
1950
1960
1970
1980
1 9 0
Source: Uniform Crime Reports, annual, Federal Bureau of Investigation.
almost flat, followed by an extremely rapid rise from 1964 to 1971, fol-
lowed by continued increases until the 1980s. The early 1980s saw a n
interlude in which violent crime decreased noticeably. But the trend-
line for 1985-1992 is even steeper than the one for 1963-1980, mak-
ing it look as if the lull was just that-a
brief respite from an increase in
violent crime that is now thirty years old.["
There is still some argument among the experts about whether the
numbers in the graph, drawn from the FBI's Uniform Crime Reports,
mean what they seem to mean. But the disagreement has limits. Draw-
ing on sophisticated analyses of these numbers, the consensus con-
clusions are that victimization studies, based on interviews of crime
victims and therefore including crimes not reported to the police,
indicate that the increase in the total range of crimes since 1973
has not been as great as the official statistics suggest, but that the
increase reflected in the official statistics is also real, capturing changes
in crimes that people consider serious enough to warrant reporting to
the police.'2'
DEPRAVED OR DEPRIVED!
The juvenile delinquents in Leonard Bernstein's West Side Story tell Of-
ficer Krupke that they are "depraved on account of we're deprived,"
showing an astute grasp of the poles in criminological theory: the psy-
chological and the sociological.'" Are criminals psychologically dis-
tinct? Or are they ordinary people responding to social and economic
circumstances?
Theories of criminal behavior were mostly near the sociological pole
from the 1950s through the 1970s. Its leading scholars saw criminals as
much like the rest of us, except that society earmarks them for a life of
criminality. Some of these scholars went further, seeing criminals as free
of personal blame, evening up the score with a society that has victim-
ized them. The most radical theorists from the sociological pole argued
that the definition of crime was in itself ideological, creating "criminals"
of people who were doing nothing more than behaving in ways that the
power structure chose to define as deviant. In their more moderate
forms, sociological explanations continue to dominate public discourse.
Many people take it for granted, for example, that poverty and unem-
ployment cause crime-classic sociological arguments that are distin-
guished more by their popularity than by e ~ i d e n c e . ~
238
Cognitive Chses and Social Behavior
Crime
239
Theories nearer the psychological pole were more common earlier
in the history of criminology and have lately regained acceptance
among experts. Here, the emphasis shifts to the characteristics of the
offender rather than to his circumstances. The idea is that criminals
are distinctive in psychological (perhaps even biological) ways. They
are deficient, depending on the particular theory, in conscience or in
self-restraint. They lack normal attachment to the mores of their cul-
ture, or they are peculiarly indifferent to the feelings or the good opin-
ion of others. They are overendowed with restless energy or with a
hunger for adventure or danger. In a term that was in common use
throughout the nineteenth and early twentieth centuries, chronic of-
fenders may be suffering from "moral insanity."5 In other old-fashioned
vocabularies, they have been called inhumane, atavistic, demented,
monstrous, or bestial-all
words that depict certain individuals as
something less than human. In their most extreme form, psychologi-
cal theories say that some people are born criminal, destined by their
biological makeup to offend.
We are at neither of these theoretical poles. Like almost all other
students of crime, we expect to find explanations from both sociology
and psychology. The reason for calling attention to the contrast be-
tween the theories is that public discussion has lagged; it remains more
nearly stuck at the sociological pole in public discourse than it is among
experts. In this chapter, we are interested in the role that cognitive
ability plays in creating criminal offenders. This by no means requires
us to deny that sociology, economics, and puhlic policy might play an
important part in shaping crime rates. On the contrary, we assume that
changes in those domains are likely to interact with personal charac-
teristics.
Among the arguments often made against the claim that criminals
are psychologically distinctive, two are arguments in principle rather
than in fact. We will comment on these two first, because they do not
require any extensive review of the factual evidence.
Argument 1: Crime rates have changed in recent times more than
people's cognitive ability or personalities could have. We must there-
fore find the reason for the rising crime rates in people's changing cir-
cumstances.
When crime is changing quickly, it seems hard to blame changing
personal characteristics rather than changing social conditions. But
bear in mind that personal characteristics need not change everywhere
in society for crime's aggregate level in society to change. Consider age,
for example, since crime is mainly the business of young people between
15 and 24.' When the age distribution of the population shifts toward
more people in their peak years for crime, the average level of crime
may be expected to rise. Or crime may rise disproportionately if a large
bulge in the youthful sector of the population fosters a youth culture
that relishes unconventionality over traditional adult values. The ex-
ploding crime rate of the 1960s is, for example, partly explained by the
baby boomers' reaching adolescence.' Or suppose that a style of child
rearing sweeps the country, and it turns out that this style of child rear-
ing leads to less control over the behavior of rebellious adolescents. The
change in style of child rearing may predictably be followed, fifteen or
so years later, by a change in crime rates. If, in short, circumstances tip
toward crime, the change will show up most among those with the
strongest tendencies to break laws (or the weakest tendencies to obey
them)."' Understanding those tendencies is the business of theories at
the psychological pole.
Argument 2: Behavior is criminal only because society says so.
There cannot be psychological tendencies to engage in behavior de-
fined so arbitrarily.
This argument, made frequently during the 1960s and 1970s and al-
ways more popular among intellectuals than with the general public, is
heard most often opposing any suggestion that criminal behavior has
biological roots. How can something so arbitrary, say, as not paying one's
taxes or driving above a 55 mph speed limit be inherited? the critics ask.
Behavior regarding taxes and speed limits certainly cannot be coded in
our DNA; perhaps even more elemental behaviors such as robbery and
murder cannot either.
Our counterargument goes like this: Instead of crime, consider he-
havior that is less controversial and even more arbitrary, like playing the
violin. A violin is a cultural artifact, no less arbitrary than any other
man-made object, and so is the musical scale. Yet few people would ar-
Psychological Roots of Crime
- The authors address the argument that rapid shifts in crime rates must be caused by social circumstances rather than stable personal traits.
- They contend that aggregate crime levels can change due to demographic shifts, such as the 'baby boomer' bulge, or changes in child-rearing styles.
- The text refutes the idea that crime is too 'arbitrarily defined' by society to have psychological or biological roots.
- Using a violin-playing analogy, they argue that even culturally specific behaviors require individual talents and self-discipline rooted in psychology.
- Core crimes like murder and robbery are described as universal across human history rather than being arbitrary social constructs.
- The section concludes by introducing the potential link between low intelligence, school failure, and criminal tendencies.
A violin is a cultural artifact, no less arbitrary than any other man-made object, and so is the musical scale. Yet few people would argue that the first violinists in the nation's great orchestras are a random sample of the population.
238
Cognitive Chses and Social Behavior
Crime
239
Theories nearer the psychological pole were more common earlier
in the history of criminology and have lately regained acceptance
among experts. Here, the emphasis shifts to the characteristics of the
offender rather than to his circumstances. The idea is that criminals
are distinctive in psychological (perhaps even biological) ways. They
are deficient, depending on the particular theory, in conscience or in
self-restraint. They lack normal attachment to the mores of their cul-
ture, or they are peculiarly indifferent to the feelings or the good opin-
ion of others. They are overendowed with restless energy or with a
hunger for adventure or danger. In a term that was in common use
throughout the nineteenth and early twentieth centuries, chronic of-
fenders may be suffering from "moral insanity."5 In other old-fashioned
vocabularies, they have been called inhumane, atavistic, demented,
monstrous, or bestial-all
words that depict certain individuals as
something less than human. In their most extreme form, psychologi-
cal theories say that some people are born criminal, destined by their
biological makeup to offend.
We are at neither of these theoretical poles. Like almost all other
students of crime, we expect to find explanations from both sociology
and psychology. The reason for calling attention to the contrast be-
tween the theories is that public discussion has lagged; it remains more
nearly stuck at the sociological pole in public discourse than it is among
experts. In this chapter, we are interested in the role that cognitive
ability plays in creating criminal offenders. This by no means requires
us to deny that sociology, economics, and puhlic policy might play an
important part in shaping crime rates. On the contrary, we assume that
changes in those domains are likely to interact with personal charac-
teristics.
Among the arguments often made against the claim that criminals
are psychologically distinctive, two are arguments in principle rather
than in fact. We will comment on these two first, because they do not
require any extensive review of the factual evidence.
Argument 1: Crime rates have changed in recent times more than
people's cognitive ability or personalities could have. We must there-
fore find the reason for the rising crime rates in people's changing cir-
cumstances.
When crime is changing quickly, it seems hard to blame changing
personal characteristics rather than changing social conditions. But
bear in mind that personal characteristics need not change everywhere
in society for crime's aggregate level in society to change. Consider age,
for example, since crime is mainly the business of young people between
15 and 24.' When the age distribution of the population shifts toward
more people in their peak years for crime, the average level of crime
may be expected to rise. Or crime may rise disproportionately if a large
bulge in the youthful sector of the population fosters a youth culture
that relishes unconventionality over traditional adult values. The ex-
ploding crime rate of the 1960s is, for example, partly explained by the
baby boomers' reaching adolescence.' Or suppose that a style of child
rearing sweeps the country, and it turns out that this style of child rear-
ing leads to less control over the behavior of rebellious adolescents. The
change in style of child rearing may predictably be followed, fifteen or
so years later, by a change in crime rates. If, in short, circumstances tip
toward crime, the change will show up most among those with the
strongest tendencies to break laws (or the weakest tendencies to obey
them)."' Understanding those tendencies is the business of theories at
the psychological pole.
Argument 2: Behavior is criminal only because society says so.
There cannot be psychological tendencies to engage in behavior de-
fined so arbitrarily.
This argument, made frequently during the 1960s and 1970s and al-
ways more popular among intellectuals than with the general public, is
heard most often opposing any suggestion that criminal behavior has
biological roots. How can something so arbitrary, say, as not paying one's
taxes or driving above a 55 mph speed limit be inherited? the critics ask.
Behavior regarding taxes and speed limits certainly cannot be coded in
our DNA; perhaps even more elemental behaviors such as robbery and
murder cannot either.
Our counterargument goes like this: Instead of crime, consider he-
havior that is less controversial and even more arbitrary, like playing the
violin. A violin is a cultural artifact, no less arbitrary than any other
man-made object, and so is the musical scale. Yet few people would ar-
240
Cognitive Classes and Social Behavior
Crime
241
gue that the first violinists in the nation's great orchestras are a random
sample of the population. The interests, talents, self-discipline, and ded-
ication that it takes to reach their level of accomplishment have roots
in individual psychology~uite
possibly even in biology. The variation
across people in any behavior, however arbitrary, will have such roots.
To that we may add that the core crimes represented in the violent crime
and property crime indexes-murder,
robbery, and assault-are
really
not so arbitrary, unless the moral codes of human cultures throughout
the world may be said to be consistently arbitrary in pretty much the
same way throughout recorded human history.
But even if crime is admitted to be a psychological phenomenon, why
should intelligence be important? What is the logic that might lead us
to expect low intelligence to be more frequently linked with criminal
tendencies than high intelligence is?'
One chain of reasoning starts from the observation that low intelli-
gence often translates into failure and frustration in school and in the
job market. If, for example, people of low intelligence have a hard time
finding a job, they might have more reason to commit crimes as a way
of making a living. If people of low intelligence have a hard time ac-
quiring status through the ordinary ways, crime might seem like a good
alternative route. At the least, their failures in school and at work may
foster resentment toward society and its laws.
Perhaps the link between crime and low IQ is even more direct. A
lack of foresight, which is often associated with low IQ, raises the at-
tractions of the immediate gains from crime and lowers the strength of
the deterrents, which come later (if they come at all). To a person of
low intelligence, the threats of apprehension and prison may fade to
meaninglessness. They are too abstract, too far in the future, too un-
certain.
Low IQ may be part of a broader complex of factors. An appetite for
danger, a stronger-than-average hunger for the things that you can get
only by stealing if you cannot buy them, an antipathy toward conven-
tionality, an insensitivity to pain or to social ostracism, and a host of de-
rangements of various sorts, combined with low IQ, may set the stage
for a criminal career.
Finally, there are moral considerations. Perhaps the ethical princi-
ples for not committing crimes are less accessible (or less persuasive) to
people of low intelligence. They find it harder to understand why rob-
bing someone is wrong, find it harder to appreciate the values of civil
and cooperative social life, and are accordingly less inhibited from act-
ing in ways that are hurtful to other people and to the community at
large.
With these preliminaries in mind, let us explore the thesis that, what-
ever the underlying reasons might be, the people who lapse into crimi-
nal behavior are distinguishable from the population at large in their
distribution of intelligence.
THE LINK BETWEEN COGNITIVE ABILITY AND CRIMINAL
BEHAVIOR: AN OVERVIEW
The statistical association between crime and cognitive ability has been
known since intelligence testing began in earnest. The British physi-
cian Charles Goring mentioned a lack of intelligence as one of the dis-
tinguishing traits of the prison population that he described in a
landmark contribution to modem criminology early in the century.1° In
1914, H. H. Goddard, an early leader in both modem criminology and
the use of intelligence tests, concluded that a large fraction of convicts
were intellectually subnormal."
The subsequent history of the study of the link between IQ and crime
replays the larger story of intelligence testing, with the main difference
being that the attack on the IQJcrime
link began earlier than the
broader attempt to discredit IQ tests. Even in the 1920s, the link was
called into question, for example, by psychologist Carl Murchison, who
produced data showing that the prisoners of Leavenworth had a higher
mean IQ than that of enlisted men in World War 1.'''' Then in 1931,
Edwin Sutherland, America's most prominent criminologist, wrote
"Mental Deficiency and Crime," an article that effectively put an end
to the study of IQ and crime for half a century.I3 Observing (accurately)
that the ostensible IQ differences between criminals and the general
population were diminishing as testing procedures improved, Suther-
land leaped to the conclusion that the remaining differences would dis-
appear altogether as the state of the art improved.
The difference, in fact, did not disappear, but that did not stop crim-
inology from denying the importance of I Q as a predictor of criminal
behavior. For decades, criminologists who followed Sutherland argued
that the IQ numbers said nothing about a real difference in intelli-
gence between offenders and nonoffenders. They were skeptical about
whether the convicts in prisons were truly representative of offenders
Intelligence and Criminal Behavior
- Low intelligence may lead to crime as an alternative route to status and income when traditional job markets are inaccessible.
- Cognitive deficits like a lack of foresight can make the immediate gains of crime more attractive while rendering future punishments abstract and meaningless.
- Low IQ may be part of a broader complex of traits, including an appetite for danger and an insensitivity to social ostracism, that foster criminal careers.
- Ethical principles and the value of cooperative social life may be less accessible or persuasive to individuals with lower cognitive ability.
- Early 20th-century studies established a statistical link between crime and IQ, though this connection was later suppressed by influential criminologists like Edwin Sutherland.
- Despite decades of academic skepticism and claims that IQ differences would disappear with better testing, the statistical gap between offenders and non-offenders persisted.
To a person of low intelligence, the threats of apprehension and prison may fade to meaninglessness. They are too abstract, too far in the future, too uncertain.
240
Cognitive Classes and Social Behavior
Crime
241
gue that the first violinists in the nation's great orchestras are a random
sample of the population. The interests, talents, self-discipline, and ded-
ication that it takes to reach their level of accomplishment have roots
in individual psychology~uite
possibly even in biology. The variation
across people in any behavior, however arbitrary, will have such roots.
To that we may add that the core crimes represented in the violent crime
and property crime indexes-murder,
robbery, and assault-are
really
not so arbitrary, unless the moral codes of human cultures throughout
the world may be said to be consistently arbitrary in pretty much the
same way throughout recorded human history.
But even if crime is admitted to be a psychological phenomenon, why
should intelligence be important? What is the logic that might lead us
to expect low intelligence to be more frequently linked with criminal
tendencies than high intelligence is?'
One chain of reasoning starts from the observation that low intelli-
gence often translates into failure and frustration in school and in the
job market. If, for example, people of low intelligence have a hard time
finding a job, they might have more reason to commit crimes as a way
of making a living. If people of low intelligence have a hard time ac-
quiring status through the ordinary ways, crime might seem like a good
alternative route. At the least, their failures in school and at work may
foster resentment toward society and its laws.
Perhaps the link between crime and low IQ is even more direct. A
lack of foresight, which is often associated with low IQ, raises the at-
tractions of the immediate gains from crime and lowers the strength of
the deterrents, which come later (if they come at all). To a person of
low intelligence, the threats of apprehension and prison may fade to
meaninglessness. They are too abstract, too far in the future, too un-
certain.
Low IQ may be part of a broader complex of factors. An appetite for
danger, a stronger-than-average hunger for the things that you can get
only by stealing if you cannot buy them, an antipathy toward conven-
tionality, an insensitivity to pain or to social ostracism, and a host of de-
rangements of various sorts, combined with low IQ, may set the stage
for a criminal career.
Finally, there are moral considerations. Perhaps the ethical princi-
ples for not committing crimes are less accessible (or less persuasive) to
people of low intelligence. They find it harder to understand why rob-
bing someone is wrong, find it harder to appreciate the values of civil
and cooperative social life, and are accordingly less inhibited from act-
ing in ways that are hurtful to other people and to the community at
large.
With these preliminaries in mind, let us explore the thesis that, what-
ever the underlying reasons might be, the people who lapse into crimi-
nal behavior are distinguishable from the population at large in their
distribution of intelligence.
THE LINK BETWEEN COGNITIVE ABILITY AND CRIMINAL
BEHAVIOR: AN OVERVIEW
The statistical association between crime and cognitive ability has been
known since intelligence testing began in earnest. The British physi-
cian Charles Goring mentioned a lack of intelligence as one of the dis-
tinguishing traits of the prison population that he described in a
landmark contribution to modem criminology early in the century.1° In
1914, H. H. Goddard, an early leader in both modem criminology and
the use of intelligence tests, concluded that a large fraction of convicts
were intellectually subnormal."
The subsequent history of the study of the link between IQ and crime
replays the larger story of intelligence testing, with the main difference
being that the attack on the IQJcrime
link began earlier than the
broader attempt to discredit IQ tests. Even in the 1920s, the link was
called into question, for example, by psychologist Carl Murchison, who
produced data showing that the prisoners of Leavenworth had a higher
mean IQ than that of enlisted men in World War 1.'''' Then in 1931,
Edwin Sutherland, America's most prominent criminologist, wrote
"Mental Deficiency and Crime," an article that effectively put an end
to the study of IQ and crime for half a century.I3 Observing (accurately)
that the ostensible IQ differences between criminals and the general
population were diminishing as testing procedures improved, Suther-
land leaped to the conclusion that the remaining differences would dis-
appear altogether as the state of the art improved.
The difference, in fact, did not disappear, but that did not stop crim-
inology from denying the importance of I Q as a predictor of criminal
behavior. For decades, criminologists who followed Sutherland argued
that the IQ numbers said nothing about a real difference in intelli-
gence between offenders and nonoffenders. They were skeptical about
whether the convicts in prisons were truly representative of offenders
Intelligence and Criminality Reconsidered
- Criminology textbooks in the mid-20th century largely dismissed the link between low intelligence and crime, viewing IQ tests as biased measures of socioeconomic status.
- The 1977 work of Travis Hirschi and Michael Hindelang resurrected the study of IQ in criminology, proving a consistent correlation between lower test scores and delinquency.
- Current consensus among criminologists acknowledges an IQ gap of approximately 10 points between offenders and non-offenders.
- Data suggests that chronic and serious offenders typically possess lower IQ scores than casual offenders, with predictive patterns appearing as early as age four.
- A significant portion of crime is concentrated among those at the lower end of the intelligence scale, though extremely low IQs can actually hinder the competence required to commit crimes.
- While critics argue that smarter criminals simply avoid capture, the correlation between intelligence and arrest remains a central, if debated, topic in the field.
By the 1960s, the association between intelligence and crime was altogether dismissed in criminology textbooks, and so it remained until recently.
242
Cognitive Classes and Social Behavior
Crime
243
in general, and they disparaged the tests' validity. Weren't tests just mea-
suring socioeconomic status by other means, and weren't they biased
against the people from the lower socioeconomic classes or the minor-
ity groups who were most likely to break the law for other reasons? they
asked. By the 1960s, the association between intelligence and crime was
altogether dismissed in criminology textbooks, and so it remained un-
til recently. By the end of the 1970s, students taking introductory
courses in criminology could read in one widely used textbook that the
belief in a correlation between low intelligence and crime "has almost
disappeared in recent years as a consequence of more cogent research
findings,"14 or learn from another standard textbook of "the practical
abandonment of feeblemindedness as a cause of crime."15
It took two of the leading criminologists of another generation, Travis
Hirschi and Michael Hindelang, to resurrect the study of 1Q and crim-
inality that Sutherland had buried. In their 1977 article, "Intelligence
and Delinquency: A Revisionist View," they reviewed many studies that
included 1Q measures, took into account the potential artifacts, and
concluded that juvenile delinquents were in fact characterized by sub-
stantially below-average levels of tested intelligence.l6 Hirschi and Hin-
delang's work took a while to percolate through the academy (the author
of the 1982 edition of one of the textbooks quoted above continued to
make no mention whatever of IQ),'~
but by the end of the 1980s, most
criminologists accepted not just that an IQ gap separates offenders and
nonoffenders, but that the gap is genuinely a difference in average in-
tellectual level or, as it is sometimes euphemistically called, "academic
competence." Criminology textbooks now routinely report the correla-
tion between crime and intelligence, and although some questions of
interpretation are still open, they are narrower than they used to be be-
cause the correlation itself is no longer in dispute.[ln1
The Size of the lQ Gap
How big is the difference between criminals and the rest of us? Taking
the literature as a whole, incarcerated offenders average an IQ of about
92, 8 points below the mean. The population of nonoffenders averages
more than 100 points; an informed guess puts the gap between of-
fenders and nonoffenders at about 10 points."91 More serious or more
chronic offenders generally have lower scores than more casual of-
fender~.'~~'
The eventual relationship between IQ and repeat offend-
ing is already presaged in IQ scores taken when the children are 4
years old."
Not only is there a gap in IQ between offenders and nonoffenders,
hut a disproportionately large fraction of all crime is committed by peo-
ple toward the low end of the scale of intelligence. For example, in a
twenty-year longitudinal study of over 500 hundred boys in an uniden-
tified Swedish community, 30 percent of all arrests of the men by the
age of 30 were of the 6 percent with IQs below 77 (at the age of 10) and
80 percent were of those with IQs below 1 0 0 . ~ ~
However, it stands to
reason (and is supported by the data) that the population of offenders
is short of very low-scoring persons-people
whose scores are so low that
they have trouble mustering the competence to commit most crimes.23
A sufficiently low IQ is, in addition, usually enough to exempt a person
from criminal prose~ution.~~
Do the Unintelligent Ones Commit More Crimes--or Just Get Caught
More Often?
Some critics continue to argue that offenders whose IQs we know
are unrepresentative of the true criminal population; the smart ones
presumably slipped through the net. Surely this is correct to some
degree. If intelligence has anything to do with a person's general
competence, then it is not implausible that smart criminals get arrested
less often because they pick safer crimes or because they execute their
crimes more skillfully.'251
But how much of a bias does this introduce in-
to the data? Is there a population of uncaught offenders with high
IQs committing large numbers of crimes? The answer seems to he
no. The crimes we can trace to the millions of offenders who do pass
through the criminal justice system and whose IQs are known account
for much of the crime around us, particularly the serious crime. There
is no evidence for any other large population of offenders, and barely
enough crime left unaccounted for to permit such a population's exis-
tence.
In the small amount of data available, the IQs of uncaught offenders
are not measurably different from the ones who get caught.26 Among
those who have criminal records, there is still a significant negative cor-
relation between IQ and frequency of offending.27 Both of these kinds
of evidence imply that differential arrests of people with varying IQs,
assuming they exist, are a minor factor in the aggregate data.
Intelligence and Criminal Behavior
- The theory that high-IQ criminals simply avoid capture is unsupported by data, as uncaught offenders show no measurable IQ difference from those arrested.
- A significant negative correlation exists between cognitive ability and the frequency of offending among those with criminal records.
- High cognitive ability appears to act as a protective factor, preventing individuals from becoming criminals even when they have high-risk backgrounds.
- Longitudinal studies in Denmark and New Zealand show that high-risk children who avoid delinquency consistently score higher on IQ tests than their delinquent peers.
- Research in Hawaii indicates that even in impoverished or troubled families, higher intellectual ability is a primary factor in building psychological resilience.
- The relationship between IQ and crime remains a significant variable even when controlling for race, as evidenced by studies focusing specifically on white populations.
Among these high-risk sons, the ones who had no police record at all had IQ scores one standard deviation higher than the sons who had a police record.
242
Cognitive Classes and Social Behavior
Crime
243
in general, and they disparaged the tests' validity. Weren't tests just mea-
suring socioeconomic status by other means, and weren't they biased
against the people from the lower socioeconomic classes or the minor-
ity groups who were most likely to break the law for other reasons? they
asked. By the 1960s, the association between intelligence and crime was
altogether dismissed in criminology textbooks, and so it remained un-
til recently. By the end of the 1970s, students taking introductory
courses in criminology could read in one widely used textbook that the
belief in a correlation between low intelligence and crime "has almost
disappeared in recent years as a consequence of more cogent research
findings,"14 or learn from another standard textbook of "the practical
abandonment of feeblemindedness as a cause of crime."15
It took two of the leading criminologists of another generation, Travis
Hirschi and Michael Hindelang, to resurrect the study of 1Q and crim-
inality that Sutherland had buried. In their 1977 article, "Intelligence
and Delinquency: A Revisionist View," they reviewed many studies that
included 1Q measures, took into account the potential artifacts, and
concluded that juvenile delinquents were in fact characterized by sub-
stantially below-average levels of tested intelligence.l6 Hirschi and Hin-
delang's work took a while to percolate through the academy (the author
of the 1982 edition of one of the textbooks quoted above continued to
make no mention whatever of IQ),'~
but by the end of the 1980s, most
criminologists accepted not just that an IQ gap separates offenders and
nonoffenders, but that the gap is genuinely a difference in average in-
tellectual level or, as it is sometimes euphemistically called, "academic
competence." Criminology textbooks now routinely report the correla-
tion between crime and intelligence, and although some questions of
interpretation are still open, they are narrower than they used to be be-
cause the correlation itself is no longer in dispute.[ln1
The Size of the lQ Gap
How big is the difference between criminals and the rest of us? Taking
the literature as a whole, incarcerated offenders average an IQ of about
92, 8 points below the mean. The population of nonoffenders averages
more than 100 points; an informed guess puts the gap between of-
fenders and nonoffenders at about 10 points."91 More serious or more
chronic offenders generally have lower scores than more casual of-
fender~.'~~'
The eventual relationship between IQ and repeat offend-
ing is already presaged in IQ scores taken when the children are 4
years old."
Not only is there a gap in IQ between offenders and nonoffenders,
hut a disproportionately large fraction of all crime is committed by peo-
ple toward the low end of the scale of intelligence. For example, in a
twenty-year longitudinal study of over 500 hundred boys in an uniden-
tified Swedish community, 30 percent of all arrests of the men by the
age of 30 were of the 6 percent with IQs below 77 (at the age of 10) and
80 percent were of those with IQs below 1 0 0 . ~ ~
However, it stands to
reason (and is supported by the data) that the population of offenders
is short of very low-scoring persons-people
whose scores are so low that
they have trouble mustering the competence to commit most crimes.23
A sufficiently low IQ is, in addition, usually enough to exempt a person
from criminal prose~ution.~~
Do the Unintelligent Ones Commit More Crimes--or Just Get Caught
More Often?
Some critics continue to argue that offenders whose IQs we know
are unrepresentative of the true criminal population; the smart ones
presumably slipped through the net. Surely this is correct to some
degree. If intelligence has anything to do with a person's general
competence, then it is not implausible that smart criminals get arrested
less often because they pick safer crimes or because they execute their
crimes more skillfully.'251
But how much of a bias does this introduce in-
to the data? Is there a population of uncaught offenders with high
IQs committing large numbers of crimes? The answer seems to he
no. The crimes we can trace to the millions of offenders who do pass
through the criminal justice system and whose IQs are known account
for much of the crime around us, particularly the serious crime. There
is no evidence for any other large population of offenders, and barely
enough crime left unaccounted for to permit such a population's exis-
tence.
In the small amount of data available, the IQs of uncaught offenders
are not measurably different from the ones who get caught.26 Among
those who have criminal records, there is still a significant negative cor-
relation between IQ and frequency of offending.27 Both of these kinds
of evidence imply that differential arrests of people with varying IQs,
assuming they exist, are a minor factor in the aggregate data.
244
Cognitive Classes and Social Behavior
Crime
245
intelligence as a Preventative
r -
The Rest of the Story
Looking at the opposite side of the picture, those who do not commit
crimes, it appears that high cognitive ability protects a person from he-
coming a criminal even if the other precursors are present. One study
followed a sample of almost 1,500 boys horn in Copenhagen, Denmark,
between 1936 and 1938.~~
Sons whose fathers had a prison record were
almost six times as likely to have a prison record themselves (by the age
of 34-36) as the sons of men who had no police record of any sort.
Among these high-risk sons, the ones who had no police record at all
had IQ scores one standard deviation higher than the sons who had a
police re~ord.'~"
The protective power of elevated intelligence also shows up in a New
Zealand study. Boys and girls were divided on the basis of their hehav-
ior by the age of 5 into high and low risk for delinquency. High-risk chil-
dren were more than twice as likely to become delinquent by their
mid-teens as low-risk children. The high-risk boys or girls who did not
become delinquent were the ones with the higher IQs. This was also
true for the 1ow.risk boys and girls: The nondelinquents had higher 1Qs
than the delinquents."
Children growing up in troubled circumstances on Kauai in the
Hawaiian chain confirm the pattern. Several hundred children were fol-
lowed in a longitudinal study for several decade^.^' Some of the children
were identified by their second birthday as being statistically "vulnera-
ble" to behavioral disorders or delinquency. These were children suffer-
ing from two or more of the following circumstances: they were being
raised in troubled or impoverished families; had alcoholic, psychologi-
cally disturhecl, or unschooled (eight years or less of schooling) parents;
or had experienced prenatal or perinatal physiological stress. Two-thirds
of these children succumbed to delinquency or other psychological dis-
turbances. Rut how about the other third, the ones who grew up with-
out becoming delinquents or disturbed psychologically? Prominent
among the protective factors were higher intellectual ability scores than
the average for the vulnerable group.'2
THE LINK BETWEEN COGNITIVE ABILITY AND CRIMINAL
BEHAVIOR: WHITE MEN IN THE NLSY
In the United States, where crime and race have become so intertwined
in the public mind, it is especially instructive to focus on just whites. To
The statistically distinguishable personal characteristics of criminals go far
beyond IQ. There is, for example, the enormous difference between the
levels of male and female criminality, which cannot he explained by in-
tellectual differences between the sexes. Accounts of the rapidly expand-
ing literature on the psychological and biological correlates of criminality,
which has become highly informative about everything from genes to early
childhocd precursors, may he tracked in numerous scientific journals and
hooks." Probably as much could be learned about individual differences
heyond intelligence that characterize the chronically unemployed, un-
married mothers, neglectful parents, and others who have been the sub-
jects of the other chapters in Part 11. But that is just surmise at this point.
The necessary research has either not been done at all or has been done in
only the sketchiest
simplify matters, we also limit the NLSY sample to males. Crime is still
overwhelmingly a man's vice. Among whites in the sample, 83 percent
of all persons who admitted to a criminal conviction were male.
Interpreting Self-Report Data
In the 1980 interview wave, the members of the NLSY sample were
asked detailed questions about their criminal activity and their in-
volvement with the criminal justice system. These data are known as
self-report data, meaning that we have to go on what the respondent says.
One obvious advantage of self-reports is that they presumably include
information about the crimes of offenders whether or not they have been
caught. Another is that they circumvent any biases in the criminal jus-
tice system, which, some people argue, contaminate official criminal
statistics. Rut can self-report data be trusted? Criminologists have ex-
plored this question for many years, and the answer is yes, but only if
the data are treated gingerly. Different racial groups have different re-
sponse patterns, and these are compounded by differences between the
gender^."^' Other issues are discussed in the note."61
Our use of the NLSY self-report data sidesteps some of the problems
by limiting the analysis to one ethnic group and one gender: white
males. Given the remaining problems with self-report data, we will con-
Intelligence and Criminal Involvement
- The study focuses on white males to minimize demographic variables, noting that 83 percent of self-reported criminal convictions in the sample were from men.
- Self-report data is utilized to capture crimes that may have evaded official detection, though researchers acknowledge the need for cautious interpretation.
- The analysis prioritizes public record events like police stops and convictions, as these are considered reliable indicators of underlying criminal behavior.
- A small 'chronic' minority of the population—roughly 2 to 3 percent—is responsible for approximately half of all criminal charges and convictions.
- Initial data suggests a correlation between cognitive ability and the level of contact with the justice system, with non-offenders averaging higher IQs than those stopped by police.
Only 13 percent of white males had ever been convicted of anything, and 2 percent accounted for half of the convictions.
244
Cognitive Classes and Social Behavior
Crime
245
intelligence as a Preventative
r -
The Rest of the Story
Looking at the opposite side of the picture, those who do not commit
crimes, it appears that high cognitive ability protects a person from he-
coming a criminal even if the other precursors are present. One study
followed a sample of almost 1,500 boys horn in Copenhagen, Denmark,
between 1936 and 1938.~~
Sons whose fathers had a prison record were
almost six times as likely to have a prison record themselves (by the age
of 34-36) as the sons of men who had no police record of any sort.
Among these high-risk sons, the ones who had no police record at all
had IQ scores one standard deviation higher than the sons who had a
police re~ord.'~"
The protective power of elevated intelligence also shows up in a New
Zealand study. Boys and girls were divided on the basis of their hehav-
ior by the age of 5 into high and low risk for delinquency. High-risk chil-
dren were more than twice as likely to become delinquent by their
mid-teens as low-risk children. The high-risk boys or girls who did not
become delinquent were the ones with the higher IQs. This was also
true for the 1ow.risk boys and girls: The nondelinquents had higher 1Qs
than the delinquents."
Children growing up in troubled circumstances on Kauai in the
Hawaiian chain confirm the pattern. Several hundred children were fol-
lowed in a longitudinal study for several decade^.^' Some of the children
were identified by their second birthday as being statistically "vulnera-
ble" to behavioral disorders or delinquency. These were children suffer-
ing from two or more of the following circumstances: they were being
raised in troubled or impoverished families; had alcoholic, psychologi-
cally disturhecl, or unschooled (eight years or less of schooling) parents;
or had experienced prenatal or perinatal physiological stress. Two-thirds
of these children succumbed to delinquency or other psychological dis-
turbances. Rut how about the other third, the ones who grew up with-
out becoming delinquents or disturbed psychologically? Prominent
among the protective factors were higher intellectual ability scores than
the average for the vulnerable group.'2
THE LINK BETWEEN COGNITIVE ABILITY AND CRIMINAL
BEHAVIOR: WHITE MEN IN THE NLSY
In the United States, where crime and race have become so intertwined
in the public mind, it is especially instructive to focus on just whites. To
The statistically distinguishable personal characteristics of criminals go far
beyond IQ. There is, for example, the enormous difference between the
levels of male and female criminality, which cannot he explained by in-
tellectual differences between the sexes. Accounts of the rapidly expand-
ing literature on the psychological and biological correlates of criminality,
which has become highly informative about everything from genes to early
childhocd precursors, may he tracked in numerous scientific journals and
hooks." Probably as much could be learned about individual differences
heyond intelligence that characterize the chronically unemployed, un-
married mothers, neglectful parents, and others who have been the sub-
jects of the other chapters in Part 11. But that is just surmise at this point.
The necessary research has either not been done at all or has been done in
only the sketchiest
simplify matters, we also limit the NLSY sample to males. Crime is still
overwhelmingly a man's vice. Among whites in the sample, 83 percent
of all persons who admitted to a criminal conviction were male.
Interpreting Self-Report Data
In the 1980 interview wave, the members of the NLSY sample were
asked detailed questions about their criminal activity and their in-
volvement with the criminal justice system. These data are known as
self-report data, meaning that we have to go on what the respondent says.
One obvious advantage of self-reports is that they presumably include
information about the crimes of offenders whether or not they have been
caught. Another is that they circumvent any biases in the criminal jus-
tice system, which, some people argue, contaminate official criminal
statistics. Rut can self-report data be trusted? Criminologists have ex-
plored this question for many years, and the answer is yes, but only if
the data are treated gingerly. Different racial groups have different re-
sponse patterns, and these are compounded by differences between the
gender^."^' Other issues are discussed in the note."61
Our use of the NLSY self-report data sidesteps some of the problems
by limiting the analysis to one ethnic group and one gender: white
males. Given the remaining problems with self-report data, we will con-
246
Cognitive Classes and Social Behavior
Crime
247
centrate in this analysis on events that are on the public record (and
the respondent knows are on the public record): being stopped by the
police, formal charges, and convictions. In doing so, we are following a
broad finding in crime research that official contacts with the law en-
forcement and criminal justice system are usefully accurate reflections
of the underlying level of criminal activity.[37' At the end of the discus-
sion, we show briefly that using self-report data on undetected crimes
reinforces the conclusions drawn from the data on detected crimes.
IQ and Types of Criminal Involvement
The typical finding has been that between a third and a half of all ju-
veniles are stopped by police at some time or another (a proportion that
has grown over the last few decades) but that 5 to 7 percent of the pop-
ulation account for about half the total number of arrests.jqn the case
of white males in the NLSY, 34 percent admitted having been stopped
at some time by the police (for anything other than a minor traffic vi-
olation), but only 3 percent of all white males accounted for half of the
self-reported "stops."
Something similar applies as we move up the ladder of criminal sever-
ity. Only 18 percent of white males had ever formally been charged with
an offense, and a little less than 3 percent of them accounted for half
the charges. Only 13 percent of white males had ever been convicted
of anything, and 2 percent accounted for half of the convictions. Rased
on these self-reports, a very small minority of white males had serious
criminal records while they were in this 15 to 23 age range.
Like studies using all races, the NLSY results for white males show a
regular relationship between IQ and criminality. The table below pre-
sents the average 1Qs of white males who had penetrated to varying lev-
els of the criminal justice system as of the 1980 interview.['" l o s e who
Criminality and IQ Among White Males
Deepest Level of Contact with the
Criminal Justice System
Mean IQ
None
106
Stopped by the police but not booked
103
hoked but not convicted
101
Convicted hut not incarcerated
100
Sentenced to a correctional facility
93
reported they had never even been stopped by the police (for anything
other than a minor traffic violation) were above average in intelligence,
with a mean IQ of 106, and things went downhill from there. Close to
a standard deviation separated those who had never been stopped by
the police from those who went to prison.
A similar pattern emerges when the criminal involvements are sorted
by cognitive class, as shown in the next table. Involvement with the
criminal justice system rises as IQ falls from Classes I through IV. Then
The Odds of Getting Involved with the Police
and Courts for Young White Males
Percentage Who in 1980 Reported Ever Having Been:
Cognitive
Stopped by Booked for Convicted of
Sentenced to
Class
the Police
an Offense
an Offense
Incarceration
1 Very br~ght
18
5
3
0
I1 Bright
27
12
7
1
I11 Normal
37
20
15
3
IV L3ull
46
2 7
2 1
7
V Very dull
33
17
14
7
Overall
34
18
9
3
we reach Class V, with IQs under 75. If we take the responses at face
value, the Class Vs are stopped, charged, and convicted at lower rates
than the Class IVs but are sentenced to correctional facilities at rates
almost exactly the same rate. We noted earlier that people at the low-
est levels of intelligence are likely to be underrepresented in criminal
statistics, and so it is in the NLSY. It may be that the offenses of the
Class Vs are less frequent but more serious than those of the Class 1Vs
or that they are less competent in getting favorable treatment from the
criminal justice system. The data give us no way to tell.
In addition to self-reports, the NLSY provides data on criminal be-
havior by noting where the person was interviewed. In all the interviews
from 1979 to 1990, was the young man ever interviewed in a correc-
tional facility? The odds shown in the table below (computed from the
unrounded results) that a white male had ever been interviewed in jail
IQ and Criminal Justice Involvement
- Data from the NLSY shows a strong inverse correlation between cognitive class and the likelihood of being stopped, booked, or convicted.
- Individuals in the highest cognitive classes are significantly less likely to have any police contact compared to those in the 'Dull' or 'Very Dull' categories.
- While 'Very Dull' individuals (Class V) report fewer police stops than Class IV, they are incarcerated at much higher rates, suggesting more serious offenses or less legal competence.
- The odds of a white male being interviewed in a correctional facility are fourteen times higher for those in the bottom IQ quartile compared to the top quartile.
- The gap in intelligence between offenders and non-offenders widens at each progressive stage of the criminal justice process, from initial stop to incarceration.
- The study utilizes both self-reported criminal activity and actual incarceration status to account for both uncaught crimes and the severity of legal outcomes.
Close to a standard deviation separated those who had never been stopped by the police from those who went to prison.
246
Cognitive Classes and Social Behavior
Crime
247
centrate in this analysis on events that are on the public record (and
the respondent knows are on the public record): being stopped by the
police, formal charges, and convictions. In doing so, we are following a
broad finding in crime research that official contacts with the law en-
forcement and criminal justice system are usefully accurate reflections
of the underlying level of criminal activity.[37' At the end of the discus-
sion, we show briefly that using self-report data on undetected crimes
reinforces the conclusions drawn from the data on detected crimes.
IQ and Types of Criminal Involvement
The typical finding has been that between a third and a half of all ju-
veniles are stopped by police at some time or another (a proportion that
has grown over the last few decades) but that 5 to 7 percent of the pop-
ulation account for about half the total number of arrests.jqn the case
of white males in the NLSY, 34 percent admitted having been stopped
at some time by the police (for anything other than a minor traffic vi-
olation), but only 3 percent of all white males accounted for half of the
self-reported "stops."
Something similar applies as we move up the ladder of criminal sever-
ity. Only 18 percent of white males had ever formally been charged with
an offense, and a little less than 3 percent of them accounted for half
the charges. Only 13 percent of white males had ever been convicted
of anything, and 2 percent accounted for half of the convictions. Rased
on these self-reports, a very small minority of white males had serious
criminal records while they were in this 15 to 23 age range.
Like studies using all races, the NLSY results for white males show a
regular relationship between IQ and criminality. The table below pre-
sents the average 1Qs of white males who had penetrated to varying lev-
els of the criminal justice system as of the 1980 interview.['" l o s e who
Criminality and IQ Among White Males
Deepest Level of Contact with the
Criminal Justice System
Mean IQ
None
106
Stopped by the police but not booked
103
hoked but not convicted
101
Convicted hut not incarcerated
100
Sentenced to a correctional facility
93
reported they had never even been stopped by the police (for anything
other than a minor traffic violation) were above average in intelligence,
with a mean IQ of 106, and things went downhill from there. Close to
a standard deviation separated those who had never been stopped by
the police from those who went to prison.
A similar pattern emerges when the criminal involvements are sorted
by cognitive class, as shown in the next table. Involvement with the
criminal justice system rises as IQ falls from Classes I through IV. Then
The Odds of Getting Involved with the Police
and Courts for Young White Males
Percentage Who in 1980 Reported Ever Having Been:
Cognitive
Stopped by Booked for Convicted of
Sentenced to
Class
the Police
an Offense
an Offense
Incarceration
1 Very br~ght
18
5
3
0
I1 Bright
27
12
7
1
I11 Normal
37
20
15
3
IV L3ull
46
2 7
2 1
7
V Very dull
33
17
14
7
Overall
34
18
9
3
we reach Class V, with IQs under 75. If we take the responses at face
value, the Class Vs are stopped, charged, and convicted at lower rates
than the Class IVs but are sentenced to correctional facilities at rates
almost exactly the same rate. We noted earlier that people at the low-
est levels of intelligence are likely to be underrepresented in criminal
statistics, and so it is in the NLSY. It may be that the offenses of the
Class Vs are less frequent but more serious than those of the Class 1Vs
or that they are less competent in getting favorable treatment from the
criminal justice system. The data give us no way to tell.
In addition to self-reports, the NLSY provides data on criminal be-
havior by noting where the person was interviewed. In all the interviews
from 1979 to 1990, was the young man ever interviewed in a correc-
tional facility? The odds shown in the table below (computed from the
unrounded results) that a white male had ever been interviewed in jail
248
Cognitive Classes and Social Behavior
Crime
249
The Odds of Doing Time for Young White Males
Percentage Ever
Interviewed in a
Cognitive Class
Correctional Facility
I Very bright
1
I1 Rright
1
I11 Normal
3
IV Dull
7
V Very dull
12
Overall
3
were fourteen times greater for Class V than for white males anywhere
in the top quartile of IQ.
Being incarcerated at the time of the interview signifies not just
breaking the law and serving time but also something about the dura-
tion of the sentence, which may explain the large increase at the bot-
tom of the ability distribution. The NLSY sample of white males echoes
the scientific literature in general in showing a sizable IQ gap between
offenders and nonoffenders at each level of involvement with the crim-
inal justice system.
The Role of Socioeconomic Background
We will use both self-reports and whether the interviewee was incar-
cerated at the time of the interview as measures of criminal behavior.
The self-reports are from the NLSY men in 1980, when they were still
in their teens or just out of them. It combines reports of misdemeanors,
drug offenses, property offenses, and violent offenses. Our definition of
criminality here is that the man's description of his own behavior put
him in the top decile of frequency of self-reported criminal activity.''0'
The other measure is whether the man was ever interviewed while be-
ing confined in a correctional facility between 1979 and 1990. When
we run our standard analysis for these two different measures, we get the
results in the next figure.
Both measures of criminality have weaknesses but different weak-
nesses. One relies on self-reports but has the virtue of including un-
caught criminality; the other relies on the workings of the criminal
justice system but has the virtue of identifying people who almost cer-
tainly have committed serious offenses. For both measures, after con-
On two diverse measures of crime, the importance of IQ
dominates socioeconomic background for white men
The probability of meeting either of two criteria of criminality
20% -
Black lines: As IQ goesJrom low to high
Gray lines: As purental SES goes from lour to high
15%-
1070 -
In the top
decile of self-
reported crime
-
1 Ever interviewed
-
In a correctional
-
7,
1 ' .
facility
Very low
Very h~gh
Note: For computing the plot, age and e~ther SES (for the h l x k curves) or IQ (for the gray
curves) were set at their mean values.
trolling for IQ, the men's socioeconotnic background had little or noth-
ing to do with crime. In the case of the self-report data, higher socioe-
conomic status was associated with higher reported crime after
controlling for 1Q. In the case of incarceration, the role of socioeco-
nomic background was close to nil after controlling for IQ, and statis-
tically insignificant. By either measure of crime, a low 1Q was a
significant risk factor.
The Role of a Broken Home
When people think about the causes of crime, they usually think not
only of the role of juvenile delinquent's age and socioeconomic back-
ground but also of what used to be called "broken homes." It is now an
inadequate phrase, because many families do not even begin with a mar-
ried husband and wife, and many broken homes are reconstituted (in
some sense) through remarriage. But whatever the specific way in which
a home is not intact, the children of such families are usually more likely
to get in trouble with the law than children from intact families4' This
IQ, Socioeconomics, and Criminality
- Statistical analysis suggests that for white men, IQ is a more dominant predictor of criminal behavior and incarceration than socioeconomic background.
- When controlling for IQ, the influence of parental socioeconomic status on the likelihood of being in a correctional facility is statistically insignificant.
- Growing up in an intact family with both biological parents is associated with significantly lower rates of police contact, convictions, and sentencing.
- While family structure impacts crime rates, it does not negate the predictive power of IQ; low IQ remains a high-risk factor regardless of home environment.
- There is a massive correlation between lack of education and incarceration, with 74 percent of jailed subjects lacking a high school diploma.
- The relationship between school dropout and crime is complex, suggesting that the same behavioral traits leading to crime also lead to academic failure.
The youngster who commits assaults on the street probahly gets in fights on the school grounds; the youngster who is undeterred by the prospect of jail time probably is not much motivated by the prospect of getting a high school degree.
248
Cognitive Classes and Social Behavior
Crime
249
The Odds of Doing Time for Young White Males
Percentage Ever
Interviewed in a
Cognitive Class
Correctional Facility
I Very bright
1
I1 Rright
1
I11 Normal
3
IV Dull
7
V Very dull
12
Overall
3
were fourteen times greater for Class V than for white males anywhere
in the top quartile of IQ.
Being incarcerated at the time of the interview signifies not just
breaking the law and serving time but also something about the dura-
tion of the sentence, which may explain the large increase at the bot-
tom of the ability distribution. The NLSY sample of white males echoes
the scientific literature in general in showing a sizable IQ gap between
offenders and nonoffenders at each level of involvement with the crim-
inal justice system.
The Role of Socioeconomic Background
We will use both self-reports and whether the interviewee was incar-
cerated at the time of the interview as measures of criminal behavior.
The self-reports are from the NLSY men in 1980, when they were still
in their teens or just out of them. It combines reports of misdemeanors,
drug offenses, property offenses, and violent offenses. Our definition of
criminality here is that the man's description of his own behavior put
him in the top decile of frequency of self-reported criminal activity.''0'
The other measure is whether the man was ever interviewed while be-
ing confined in a correctional facility between 1979 and 1990. When
we run our standard analysis for these two different measures, we get the
results in the next figure.
Both measures of criminality have weaknesses but different weak-
nesses. One relies on self-reports but has the virtue of including un-
caught criminality; the other relies on the workings of the criminal
justice system but has the virtue of identifying people who almost cer-
tainly have committed serious offenses. For both measures, after con-
On two diverse measures of crime, the importance of IQ
dominates socioeconomic background for white men
The probability of meeting either of two criteria of criminality
20% -
Black lines: As IQ goesJrom low to high
Gray lines: As purental SES goes from lour to high
15%-
1070 -
In the top
decile of self-
reported crime
-
1 Ever interviewed
-
In a correctional
-
7,
1 ' .
facility
Very low
Very h~gh
Note: For computing the plot, age and e~ther SES (for the h l x k curves) or IQ (for the gray
curves) were set at their mean values.
trolling for IQ, the men's socioeconotnic background had little or noth-
ing to do with crime. In the case of the self-report data, higher socioe-
conomic status was associated with higher reported crime after
controlling for 1Q. In the case of incarceration, the role of socioeco-
nomic background was close to nil after controlling for IQ, and statis-
tically insignificant. By either measure of crime, a low 1Q was a
significant risk factor.
The Role of a Broken Home
When people think about the causes of crime, they usually think not
only of the role of juvenile delinquent's age and socioeconomic back-
ground but also of what used to be called "broken homes." It is now an
inadequate phrase, because many families do not even begin with a mar-
ried husband and wife, and many broken homes are reconstituted (in
some sense) through remarriage. But whatever the specific way in which
a home is not intact, the children of such families are usually more likely
to get in trouble with the law than children from intact families4' This
250
Cognitive Chqses and Social Behavior
Crime
251
was true for the NLSY white males. An intact family consisting of the
biological mother and father was associated with better outcomes for
their children than any of the other family arrangements. Was the young
man ever stopped by the police? Thirty-two percent of white males from
intact families compared to 46 percent of all others. Booked for an of-
fense? Fifteen percent compared to 29 percent. Convicted of an offense?
Eleven percent compared to 2 1 percent. Sentenced to a correctional fa-
cility? Two percent compared to 7 percent.
Although family setting had an impact on crime, it did not explain
away the predictive power of IQ. For example, a young man from a bro-
ken family and an average IQ and socioeconomic background had a 4
percent chance of having been interviewed in jail. Switch his IQ to the
2d centile, and the odds rise to 22 percent. (Switch his socioeconomic
background to the 26 centile instead, and the odds rise only from 4 to
5 percent .) The same conclusions apply to the measure of self-reported
crime.
The Role of Education
Scholars have been arguing about the relationship of education to crime
and delinquency for many years without settling the issue. The case of
the NLSY white males is a class~c example. Of those who were ever in-
terviewed in jail, 74 percent had not gotten a high school diploma. None
had a college degree. Clearly something about getting seriously lnvolved
in crime competes with staying in school. Low IQ is part of that "some-
thing" in many cases, but the relationship is so strong that other factors
are probably involved-for
example, the same youngster who is willing
to burglarize a house probably is not the most obedient of pup~ls; the
youngster who commits assaults on the street probahly gets in fights on
the school grounds; the youngster who is undeterred by the prospect of
jail time probably is not much motivated by the prospect of getting a
high school degree; and so forth.
Does high school dropout actually cause the subsequent crime? Many
people assumed so until Delbert Elliott and Harwin Voss published a
study in 1974 that concluded the opposite: Crime diminished after
school dropout.4' Since then, everyone has agreed that eventual
dropouts tend to have high levels of criminal activity while they are in
school, but disputes remain about whether the rates fall or rise after the
dropout occurs.[431
For our purposes, it makes little sense to examine the continuing role
of 1Q in our usual educational samples when the action is so conspicu-
ously concentrated among those who fall neither in the high school nor
the college graduate samples. Running our standard analysis on white
males who did not get a high school diploma did not shed much more
light on the matter.[441
Given the restriction of range in the sample (the
mean IQ of the white male dropout sample was 91, with a standard de-
viation of only 12.5), not much can be concluded from the fact that the
ones at the very bottom of the cognitive ahility distribution were less
likely to report high levels of criminal activity. For these school
dropouts, the likelihood of having been interviewed in jail rose as IQ
fell, hut the relationship was weaker than for the unrestricted sample of
white males.
CRIME, COGNITIVE ABILITY, AND CONSCIENCE
By now, you will already be anticipating the usual caution: Despite the
relationship of low IQ to criminality, the great majority of people with
low cognitive ability are law abiding. We will also take this opportunity
to reiterate that the increase in crime over the last thirty years (like the
increases in illegitimacy and welfare) cannot he attributed to changes
in intelligence hut rather must be blamed on other factors, which may
have put people of low cognitive ability at greater risk than before.
The caveats should not obscure the importance of the relationship
of cognitive ability to crime, however. Many people tend to think of
criminals as coming from the wrong side of the tracks. They are correct,
insofar as that is where people of low cognitive ability disproportion-
ately live. They are also correct insofar as people who live on the right
side of the tracks-whether
they are rich or just steadily employed work-
ing-class people-seldom
show up in the nation's prisons. But the as-
sumption that too glibly follows from these observations is that the
economic and social disadvantage is in itself the cause of criminal be-
havior. That is not what the data say, however. In trying to understand
how to deal with the crime problem, much of the attention now given
to problems of poverty and unemployment should be shifted to another
question altogether: coping with cognitive disadvantage. We will return
to this question in the final chapter, when we consider policy changes
that might make it easier for everyone to live within the law.
Cognitive Ability and Civic Life
- Research indicates a significant relationship between low cognitive ability and criminal behavior, though most individuals with low IQ remain law-abiding.
- The increase in crime over recent decades is attributed to environmental factors that put those with lower cognitive ability at greater risk rather than shifts in intelligence itself.
- Data suggests that cognitive disadvantage, rather than socioeconomic status alone, is a primary driver of criminal activity and social dysfunction.
- A free society relies on 'civility'—the willing participation in civic life—to maintain order without resorting to state coercion.
- Studies of children show that higher cognitive ability correlates with faster political learning and greater civic engagement regardless of socioeconomic background.
- The gap in political development between brighter and duller children tends to widen as they age, unlike gaps based on social class.
Lacking this quality--civility, in its core meaning--a society must replace freedom with coercion if it is to maintain order.
250
Cognitive Chqses and Social Behavior
Crime
251
was true for the NLSY white males. An intact family consisting of the
biological mother and father was associated with better outcomes for
their children than any of the other family arrangements. Was the young
man ever stopped by the police? Thirty-two percent of white males from
intact families compared to 46 percent of all others. Booked for an of-
fense? Fifteen percent compared to 29 percent. Convicted of an offense?
Eleven percent compared to 2 1 percent. Sentenced to a correctional fa-
cility? Two percent compared to 7 percent.
Although family setting had an impact on crime, it did not explain
away the predictive power of IQ. For example, a young man from a bro-
ken family and an average IQ and socioeconomic background had a 4
percent chance of having been interviewed in jail. Switch his IQ to the
2d centile, and the odds rise to 22 percent. (Switch his socioeconomic
background to the 26 centile instead, and the odds rise only from 4 to
5 percent .) The same conclusions apply to the measure of self-reported
crime.
The Role of Education
Scholars have been arguing about the relationship of education to crime
and delinquency for many years without settling the issue. The case of
the NLSY white males is a class~c example. Of those who were ever in-
terviewed in jail, 74 percent had not gotten a high school diploma. None
had a college degree. Clearly something about getting seriously lnvolved
in crime competes with staying in school. Low IQ is part of that "some-
thing" in many cases, but the relationship is so strong that other factors
are probably involved-for
example, the same youngster who is willing
to burglarize a house probably is not the most obedient of pup~ls; the
youngster who commits assaults on the street probahly gets in fights on
the school grounds; the youngster who is undeterred by the prospect of
jail time probably is not much motivated by the prospect of getting a
high school degree; and so forth.
Does high school dropout actually cause the subsequent crime? Many
people assumed so until Delbert Elliott and Harwin Voss published a
study in 1974 that concluded the opposite: Crime diminished after
school dropout.4' Since then, everyone has agreed that eventual
dropouts tend to have high levels of criminal activity while they are in
school, but disputes remain about whether the rates fall or rise after the
dropout occurs.[431
For our purposes, it makes little sense to examine the continuing role
of 1Q in our usual educational samples when the action is so conspicu-
ously concentrated among those who fall neither in the high school nor
the college graduate samples. Running our standard analysis on white
males who did not get a high school diploma did not shed much more
light on the matter.[441
Given the restriction of range in the sample (the
mean IQ of the white male dropout sample was 91, with a standard de-
viation of only 12.5), not much can be concluded from the fact that the
ones at the very bottom of the cognitive ahility distribution were less
likely to report high levels of criminal activity. For these school
dropouts, the likelihood of having been interviewed in jail rose as IQ
fell, hut the relationship was weaker than for the unrestricted sample of
white males.
CRIME, COGNITIVE ABILITY, AND CONSCIENCE
By now, you will already be anticipating the usual caution: Despite the
relationship of low IQ to criminality, the great majority of people with
low cognitive ability are law abiding. We will also take this opportunity
to reiterate that the increase in crime over the last thirty years (like the
increases in illegitimacy and welfare) cannot he attributed to changes
in intelligence hut rather must be blamed on other factors, which may
have put people of low cognitive ability at greater risk than before.
The caveats should not obscure the importance of the relationship
of cognitive ability to crime, however. Many people tend to think of
criminals as coming from the wrong side of the tracks. They are correct,
insofar as that is where people of low cognitive ability disproportion-
ately live. They are also correct insofar as people who live on the right
side of the tracks-whether
they are rich or just steadily employed work-
ing-class people-seldom
show up in the nation's prisons. But the as-
sumption that too glibly follows from these observations is that the
economic and social disadvantage is in itself the cause of criminal be-
havior. That is not what the data say, however. In trying to understand
how to deal with the crime problem, much of the attention now given
to problems of poverty and unemployment should be shifted to another
question altogether: coping with cognitive disadvantage. We will return
to this question in the final chapter, when we consider policy changes
that might make it easier for everyone to live within the law.
Chapter 12
Civility and Citizenship
A free society demands a citizenry that willingly participates in the civic en-
terprise, in matters as grand as national elections and as commonplace as
neighborliness. Lacking this quality--civility , in its core meaning-+ society
must rephce fieedom with coercion if it is to maintain order. This chapter ex-
amines the contibution of cognitive ability to the capacity for civility and cit-
izenship.
Most manifestations of civility are too fketing to be measured and studied.
One realm of activity that does leave measurable traces is political involve-
ment, which includes both participation in political activities and some knowl-
edge and sophistication about them.
For assessing any relationship between political involvement and lQ, the
best data, surprisingly, are from studies ofchildren, and the results are con-
sistent: Brighter children of all socioeconomic classes, including the poorest,
learn more rapidly about politics and how government works, and are more
likely than duller children to read about, discuss, and participate in political
activities. The gap between brighter and duller children in political develop-
ment widens with age, unlike the static gap across socioeconomic classes.
For adults, the standard theory of political involvement for many years has
assumed that socioeconomic status is the vital link. People at higher-status lev-
els vote more, and they know and care more about political matters than do
people at h e r levels of status. But the available research offers ample evi-
dence that the key element for predicting political involvement is educational
level. The people who vote least and who care the least about political issues
are not so much the poor as rhe uneducated, whatever their income or occu-
pation. Why does education matter so much? The fragmentary stdes avail-
able indicate that education predicts political invoivement in America because
it is primarily a proxy for cognitive ability.
The NLSY does not have the data for pursuing this manifestation ofcivil-
ity, but it permits us to explore another aspect of it: To what extent is high in-
Intelligence and Civil Society
- Educational level, rather than socioeconomic status or income, is the primary predictor of political involvement and voting behavior.
- Research suggests that education serves as a proxy for cognitive ability in determining a citizen's engagement with political matters.
- High intelligence is strongly associated with 'middle-class values,' such as educational persistence, workforce stability, and marital loyalty.
- Civility is defined not as mere politeness, but as an allegiance to the social order that allows a free society to function without heavy state constraint.
- The Founders' vision of a free society relied on 'virtue' or civility to ensure that citizens remain both considered and considerate in their communal lives.
- While many acts of civility are too fleeting to quantify, they represent a necessary social engagement that stands in contrast to criminal behavior.
Civility is not obedience but rather 'allegiance' and 'deference'—words with old and honorable meanings that are now largely lost.
Chapter 12
Civility and Citizenship
A free society demands a citizenry that willingly participates in the civic en-
terprise, in matters as grand as national elections and as commonplace as
neighborliness. Lacking this quality--civility , in its core meaning-+ society
must rephce fieedom with coercion if it is to maintain order. This chapter ex-
amines the contibution of cognitive ability to the capacity for civility and cit-
izenship.
Most manifestations of civility are too fketing to be measured and studied.
One realm of activity that does leave measurable traces is political involve-
ment, which includes both participation in political activities and some knowl-
edge and sophistication about them.
For assessing any relationship between political involvement and lQ, the
best data, surprisingly, are from studies ofchildren, and the results are con-
sistent: Brighter children of all socioeconomic classes, including the poorest,
learn more rapidly about politics and how government works, and are more
likely than duller children to read about, discuss, and participate in political
activities. The gap between brighter and duller children in political develop-
ment widens with age, unlike the static gap across socioeconomic classes.
For adults, the standard theory of political involvement for many years has
assumed that socioeconomic status is the vital link. People at higher-status lev-
els vote more, and they know and care more about political matters than do
people at h e r levels of status. But the available research offers ample evi-
dence that the key element for predicting political involvement is educational
level. The people who vote least and who care the least about political issues
are not so much the poor as rhe uneducated, whatever their income or occu-
pation. Why does education matter so much? The fragmentary stdes avail-
able indicate that education predicts political invoivement in America because
it is primarily a proxy for cognitive ability.
The NLSY does not have the data for pursuing this manifestation ofcivil-
ity, but it permits us to explore another aspect of it: To what extent is high in-
254
Cognitive Classes and Social Behavim
Civility and Citizenship
255
telligence associated with the behaviors associated with "middle-class values"?
The answer is that the brighter young people of the NLSY are also the ones
whose lives most resemble a sometimes disdained stereotype: They stick with
school, are plugging away in the workforce, and are loyal to their spouse. In-
sofar a$ intelligence helps lead people to behave in these ways, it is also a force
for maintaining a civil society.
A
merica's political system relies on the civility of its citizens-"ci-
vilityn not in the contemporary sense of mere politeness but ac-
cording to an older meaning which a dictionary close at hand defines
as "deference or allegiance to the social order befitting a citizen.""' The
wording of the definition is particularly apt in the American case. Ci-
vility is not obedience but rather "allegiance" and "deferencev-words
with old and honorable meanings that are now largely lost. The object
of these sentiments is not the government but a social order. And these
things are required not of a subject hut of a citizen. Taken together, the
elements of civility imply behavior that is both considered and consid-
erate-precisely
the kind of behavior that the Founders relied upon to
sustain their creation, though they would have been more likely to use
the word virtue than civility.'"
The point is that, given such civility, a free society as envisioned by
the Founders is possible. "Civil-ized" people do not need to be tightly
constrained by laws or closely monitored by the organs of state. Lack-
ing such civility, they do, and society must over time become much less
free. That is why civility was relevant to the Founders' vision of a free
society and also why it remains relevant today. In Part IV, we consider
further the link between intelligence and the polity. At this point, we
ask what the differences are between people that explain whether they
are civil. Specifically, what is the role of intelligence?
Much of what could go under the heading of civility is not readily
quantified. Mowing the lawn in the summer or keeping the sidewalks
shoveled in the winter, maintaining a tolerable level of personal hygiene
and grooming, returning a lost wallet, or visiting a sick friend are not
entirely dictated by fear of lawsuits or of retaliation from outraged neigh-
bors. They likely have an element of social engagement, of caring a b u t
one's neighbors and community, of what we are calling civility. Most
such everyday acts of civility are too fleeting to he caught in the net of
observation that social science requires.
Fortunately, the behaviors that go into civility tend to be of a piece,
and some acts leave clear traces that can be aggregated and studied. In
the preceding chapter, we examined one set of such behaviors, crime.
Crime is important in itself, of course, but it also captures the negative
pole of disassociation from society at large and the community in par-
ticular. Everything we know about the lives of most criminals suggests
that in their off-duty hours they are not commonly shoveling the side-
walk, visiting sick friends, or returning lost wallets--or doing the myr-
iad other things that signify good neighbors and good citizens. In that
light, the chapter on crime may be seen as a discussion of a growing in-
civility in American life and the contribution that low cognitive abil-
ity makes to it.
POLITICAL PARTICIPATION AS AN OUTCROPPING OF
CIVILITY
Political participation is not the thing-in-itself of civility. Most of us can
recall acquaintances who show up reliably at town council meetings and
are hectoring, opinionated, and generally destructive of community life.
Rut, as always, we are talking about statistical tendencies, and for that
purpose political participation is not a bad indirect measure.
Consider the act of voting. We have friends, conscientious in many
ways, who do not vote and who even look at us, registering and voting,
often at some inconvenience, with bemused superiority. They point out
with indisputable accuracy that our ballots account for less than a mil-
lionth of the overall outcome of most statewide elections, not to men-
tion national ones, and that no major political contest in United States
history has ever been decided by a single vote.''' Are we behaving irra-
tionally by voting?14'
Not if we value civility. In thinking about what it means to vote, a
passage in Aristotle's Politics comes to mind. "Man is by nature a polit-
ical animal,'' Aristotle wrote, "and he who by nature and not by mere
accident is without a state, is either a bad man or above humanity; he
is like the 'tribeless, lawless, hearthless one,' whom ~ o m e r
denounce^."^
The polling place is a sort of civic hearth. In the aggregate (though not
always in every instance) those who do not vote, or who vote less con-
sistently, are weaker in this manifestation of civility than those who do
vote consistently. Think inwardly about why you try to keep up with is-
sues that affect your neighborhood or at least try to do some cramming
Civility and Cognitive Ability
- The text suggests that criminal behavior is often an extension of a broader lack of civility and neighborly duty in American life.
- Political participation, specifically the act of voting, is presented as an indirect measure of a person's commitment to civic life.
- While voting may seem mathematically irrational, the author argues it is a manifestation of being a 'political animal' and a good citizen.
- The polling place is described as a 'civic hearth' where individuals fulfill the duties of being a neighbor and a member of the state.
- Research indicates a historical link between cognitive ability and the development of political awareness and civility in children.
- The authors claim that simple democratic acts betoken larger attitudes of civility that are influenced by cognitive classes.
The polling place is a sort of civic hearth.
254
Cognitive Classes and Social Behavim
Civility and Citizenship
255
telligence associated with the behaviors associated with "middle-class values"?
The answer is that the brighter young people of the NLSY are also the ones
whose lives most resemble a sometimes disdained stereotype: They stick with
school, are plugging away in the workforce, and are loyal to their spouse. In-
sofar a$ intelligence helps lead people to behave in these ways, it is also a force
for maintaining a civil society.
A
merica's political system relies on the civility of its citizens-"ci-
vilityn not in the contemporary sense of mere politeness but ac-
cording to an older meaning which a dictionary close at hand defines
as "deference or allegiance to the social order befitting a citizen.""' The
wording of the definition is particularly apt in the American case. Ci-
vility is not obedience but rather "allegiance" and "deferencev-words
with old and honorable meanings that are now largely lost. The object
of these sentiments is not the government but a social order. And these
things are required not of a subject hut of a citizen. Taken together, the
elements of civility imply behavior that is both considered and consid-
erate-precisely
the kind of behavior that the Founders relied upon to
sustain their creation, though they would have been more likely to use
the word virtue than civility.'"
The point is that, given such civility, a free society as envisioned by
the Founders is possible. "Civil-ized" people do not need to be tightly
constrained by laws or closely monitored by the organs of state. Lack-
ing such civility, they do, and society must over time become much less
free. That is why civility was relevant to the Founders' vision of a free
society and also why it remains relevant today. In Part IV, we consider
further the link between intelligence and the polity. At this point, we
ask what the differences are between people that explain whether they
are civil. Specifically, what is the role of intelligence?
Much of what could go under the heading of civility is not readily
quantified. Mowing the lawn in the summer or keeping the sidewalks
shoveled in the winter, maintaining a tolerable level of personal hygiene
and grooming, returning a lost wallet, or visiting a sick friend are not
entirely dictated by fear of lawsuits or of retaliation from outraged neigh-
bors. They likely have an element of social engagement, of caring a b u t
one's neighbors and community, of what we are calling civility. Most
such everyday acts of civility are too fleeting to he caught in the net of
observation that social science requires.
Fortunately, the behaviors that go into civility tend to be of a piece,
and some acts leave clear traces that can be aggregated and studied. In
the preceding chapter, we examined one set of such behaviors, crime.
Crime is important in itself, of course, but it also captures the negative
pole of disassociation from society at large and the community in par-
ticular. Everything we know about the lives of most criminals suggests
that in their off-duty hours they are not commonly shoveling the side-
walk, visiting sick friends, or returning lost wallets--or doing the myr-
iad other things that signify good neighbors and good citizens. In that
light, the chapter on crime may be seen as a discussion of a growing in-
civility in American life and the contribution that low cognitive abil-
ity makes to it.
POLITICAL PARTICIPATION AS AN OUTCROPPING OF
CIVILITY
Political participation is not the thing-in-itself of civility. Most of us can
recall acquaintances who show up reliably at town council meetings and
are hectoring, opinionated, and generally destructive of community life.
Rut, as always, we are talking about statistical tendencies, and for that
purpose political participation is not a bad indirect measure.
Consider the act of voting. We have friends, conscientious in many
ways, who do not vote and who even look at us, registering and voting,
often at some inconvenience, with bemused superiority. They point out
with indisputable accuracy that our ballots account for less than a mil-
lionth of the overall outcome of most statewide elections, not to men-
tion national ones, and that no major political contest in United States
history has ever been decided by a single vote.''' Are we behaving irra-
tionally by voting?14'
Not if we value civility. In thinking about what it means to vote, a
passage in Aristotle's Politics comes to mind. "Man is by nature a polit-
ical animal,'' Aristotle wrote, "and he who by nature and not by mere
accident is without a state, is either a bad man or above humanity; he
is like the 'tribeless, lawless, hearthless one,' whom ~ o m e r
denounce^."^
The polling place is a sort of civic hearth. In the aggregate (though not
always in every instance) those who do not vote, or who vote less con-
sistently, are weaker in this manifestation of civility than those who do
vote consistently. Think inwardly about why you try to keep up with is-
sues that affect your neighborhood or at least try to do some cramming
256
Cognitive Classes and Social Behavior
Civility and Citizenship
25 7
as an election approaches, and why you usually manage to get to the
polling place when the election arrives (or feel guilty when you do not).
Are we wrong to assume that the reasons have something to do with a
consciousness of the duties of being a citizen and good neighbor?
Therein lies the modest claim we make here. There is nothing particu-
larly virtuous or civil about being a political activist, but the simpler
ways in which we carry on the basic political business of a democracy
betoken the larger attitudes that make up civility.
DEVELOPING CIVILITY IN CHILDREN
The connection between intelligence and political involvement has
been more thoroughly studied for children than for adults. In part, this
is because until recently schools routinely gave IQ tests to children.
With the children's intelligence test scores as a baseline, social scien-
tists could then study whatever variables they were interested in, such
as political awareness or interest. Resides being relatively easy to do,
studies of childhood political development circumvented some of the
questions that arise with adults; children, for example, have no vested
political or economic interests (beyond the approval of parents or oth-
ers) to complicate the analysis of their responses.
One major study assembled a sample of 12,000 children in grades 2
through 8, from schools in middle- or working-class neighborhoods in
both large and small cities in various regions of the country in the early
1960s.lh' The children provided information about their fathers' occu-
pations and interest in politics. School records included IQ scores for
about 85 percent of the children. The heart of the study was a series of
questions about the children's level and range of political develop.
merit."' They were, for example, asked whether they knew which branch
of government enacted laws, whether they understood the duties of the
president and the courts, whether they ever read about politics in the
newspapers or talked about it to their parents or friends, whether they
felt that they were protected by the govemment or whether individu-
als could exert any political influence on their own, whether they had
ever worn campaign buttons or handed out leaflets for a candidate.
Their attitudes about voting, about the duties of a citizen, about polit-
ical change, about legal punishment, among other things, were probed.
The results were predictable in many ways. Younger children tended
to see the government in terms of individuals (government = the cur-
rent president) and as a fixed and absolute entity; older children were
better informed, were more likely to think in terms of institutions in-
stead of individuals, and had a clearer sense of the duties of citizenship.
The higher a child's socioeconomic background, the more rapidly his
political socialization proceeded. Among the dimensions most affected
by socioeconomic status-again,
no surprise-was
a child's sense of po-
litical efficacy.lH1
The big surprise in the study was the impact of IQ, which was larger
than that of socioeconomic status. Brighter children from even the
poorest households and with uneducated parents learned rapidly about
politics, about how the govemment works, and about the possibilities
for change. They were more likely to discuss, read about, and partici-
pate in political activities than intellectually slower children were. Not
only was the gap in political development across cognitive classes larger
than the gap across socioeconomic classes, it tended to widen with age,
while the gap due to socioeconomic class did not-an
important dis-
tinction in trying to understand the comparative roles of intelligence
and socioeconomic status. IQ differences tend to be dynamic; socio-
economic differences, static. The more important distinction from our
perspective, however, is that cognitive ability had more impact, and so-
cioeconomic status virtually none, on a child's perception of the duties
of citizenship. If this be civility, then it is most purely a result of intel-
ligence, at least among the variables examined.
A study of older children-approximately
400 high school students-
set out to determine the importance of intelligence, contrasted with so-
cioeconomic status, as a factor in political devel~prnent.~
The survey
questions tapped a wide range of political behaviors and attitudes. From
the responses, scales were constructed for fourteen political dimensions.
The youngsters were characterized by a n overall measure of socioeco-
nomic background, plus separate measures of parental education, family
wealth, media exposure, and a measure of verbal intelligence made avail-
able from school records. To a remarkable degree and with only a few ex-
ceptions, each of the political dimensions was most strongly correlated
with inte~ligence."~'
This was true of scales that measured political
knowledge, as would be expected."" But the bright youngsters were also
much more aware of the potentialities of government and the duties of
citizenship-civility again. A multivariate analysis of the results indi-
Intelligence and Political Socialization
- Researchers examined how children develop political awareness, including their understanding of government branches and the duties of citizenship.
- While socioeconomic status influences political efficacy, the study found that IQ is a more powerful predictor of political development.
- Brighter children from poor backgrounds learned about government more rapidly and were more likely to engage in political activities than their peers.
- The gap in political development across cognitive classes tends to widen with age, whereas socioeconomic gaps remain relatively static.
- A study of high school students confirmed that verbal intelligence, rather than family wealth or parental education, is the primary driver of political knowledge and civility.
- Multivariate analysis suggests that when socioeconomic status appears to influence political involvement, it is often acting through its relationship with intelligence.
If this be civility, then it is most purely a result of intelligence, at least among the variables examined.
256
Cognitive Classes and Social Behavior
Civility and Citizenship
25 7
as an election approaches, and why you usually manage to get to the
polling place when the election arrives (or feel guilty when you do not).
Are we wrong to assume that the reasons have something to do with a
consciousness of the duties of being a citizen and good neighbor?
Therein lies the modest claim we make here. There is nothing particu-
larly virtuous or civil about being a political activist, but the simpler
ways in which we carry on the basic political business of a democracy
betoken the larger attitudes that make up civility.
DEVELOPING CIVILITY IN CHILDREN
The connection between intelligence and political involvement has
been more thoroughly studied for children than for adults. In part, this
is because until recently schools routinely gave IQ tests to children.
With the children's intelligence test scores as a baseline, social scien-
tists could then study whatever variables they were interested in, such
as political awareness or interest. Resides being relatively easy to do,
studies of childhood political development circumvented some of the
questions that arise with adults; children, for example, have no vested
political or economic interests (beyond the approval of parents or oth-
ers) to complicate the analysis of their responses.
One major study assembled a sample of 12,000 children in grades 2
through 8, from schools in middle- or working-class neighborhoods in
both large and small cities in various regions of the country in the early
1960s.lh' The children provided information about their fathers' occu-
pations and interest in politics. School records included IQ scores for
about 85 percent of the children. The heart of the study was a series of
questions about the children's level and range of political develop.
merit."' They were, for example, asked whether they knew which branch
of government enacted laws, whether they understood the duties of the
president and the courts, whether they ever read about politics in the
newspapers or talked about it to their parents or friends, whether they
felt that they were protected by the govemment or whether individu-
als could exert any political influence on their own, whether they had
ever worn campaign buttons or handed out leaflets for a candidate.
Their attitudes about voting, about the duties of a citizen, about polit-
ical change, about legal punishment, among other things, were probed.
The results were predictable in many ways. Younger children tended
to see the government in terms of individuals (government = the cur-
rent president) and as a fixed and absolute entity; older children were
better informed, were more likely to think in terms of institutions in-
stead of individuals, and had a clearer sense of the duties of citizenship.
The higher a child's socioeconomic background, the more rapidly his
political socialization proceeded. Among the dimensions most affected
by socioeconomic status-again,
no surprise-was
a child's sense of po-
litical efficacy.lH1
The big surprise in the study was the impact of IQ, which was larger
than that of socioeconomic status. Brighter children from even the
poorest households and with uneducated parents learned rapidly about
politics, about how the govemment works, and about the possibilities
for change. They were more likely to discuss, read about, and partici-
pate in political activities than intellectually slower children were. Not
only was the gap in political development across cognitive classes larger
than the gap across socioeconomic classes, it tended to widen with age,
while the gap due to socioeconomic class did not-an
important dis-
tinction in trying to understand the comparative roles of intelligence
and socioeconomic status. IQ differences tend to be dynamic; socio-
economic differences, static. The more important distinction from our
perspective, however, is that cognitive ability had more impact, and so-
cioeconomic status virtually none, on a child's perception of the duties
of citizenship. If this be civility, then it is most purely a result of intel-
ligence, at least among the variables examined.
A study of older children-approximately
400 high school students-
set out to determine the importance of intelligence, contrasted with so-
cioeconomic status, as a factor in political devel~prnent.~
The survey
questions tapped a wide range of political behaviors and attitudes. From
the responses, scales were constructed for fourteen political dimensions.
The youngsters were characterized by a n overall measure of socioeco-
nomic background, plus separate measures of parental education, family
wealth, media exposure, and a measure of verbal intelligence made avail-
able from school records. To a remarkable degree and with only a few ex-
ceptions, each of the political dimensions was most strongly correlated
with inte~ligence."~'
This was true of scales that measured political
knowledge, as would be expected."" But the bright youngsters were also
much more aware of the potentialities of government and the duties of
citizenship-civility again. A multivariate analysis of the results indi-
258
Cognitive Classes and Social Behavior
Civility and Citizenship
259
cated that intelligence per se, rather than socioeconomic status, was
driving the relationships, and that when socioeconomic status was
significantly correlated with a dimension of political involvement, it
was via its effects on intelligence. It is possible that the importance of
intelligence was somewhat inflated in this study because the youngsters
were disproportionately from working-class backgrounds, hence under-
estimating the impact of socioeconomic status in more representative
samples. However, the qualitative outcome leaves no doubt that intelli-
gence, apart from the usual socioeconomic variables, has a potent effect
on political behavior for teenagers, as well as for preteens.''2'
VOTING BEHAVIOR AMONG ADULTS
Social scientists do not find it easy to dragoon large samples of adult
Americans and make them sit still for the kinds of assessments of polit-
ical involvement that can be conducted with children. But they try
nonetheless, and they have had some success, mostly centering on vot-
ing.
Depending on the election and the historical period, the turnout in
elections for federal officeholders ranges from about 25 to 70 percent,
with the recent level in presidential elections in the 45 to 60 percent
range. It may or may not be a pity that so many of our fellow citizens
fail to vote, but it is a boon to social scientists. With the deep split he-
tween voters and nonvoters, voting has been an invaluable resource for
gaining a glimpse into the nature of this manifestation of civility.'"'
Voting and Socioeconomic Class
The literature on voting repeats the familiar story: Most of the analysis
has focused on socioeconomic class, not cognitive ability. The standard
model of political participation, including voting, is that it is highly de-
pendent on socioeconomic tatu us.'^ "College graduates vote more than
high school graduates; white-collar workers vote more than blue-collar
workers; and the rich vote more than the poor," as Wolfinger summa.
rized it.15 The connection between political participation and social sta-
tus is so strong that almost any measure of it, no matter how casual, will
pick up some part of the relationship. The impression we all have that
elections are settled mostly by the votes of the middle and upper classes
broadly construed is confirmed by careful scrutiny, if socioeconomic
status is the only measure taken of potential voters.
When we are able to look behind the isolated vote to broader kinds
of political behavior, the same relationship prevails. The landmark study
on this topic was conducted by Sidney Verba and Norman Nie, who
polled several thousand people representing the national population in
1967 not only about their voting but also about other political activi-
ties-campaigning, demonstrating, contacting officials, and so on.16
Verba and Nie identified six categories of political activity, from "to-
tally inactive" at one end to the "totally active" at the other, with four
gradations in between. Almost without exception, however political
participation was defined, socioeconomic status was not only a signifi-
cant predictor in a statistical sense, but the differences across classes
were large.'17' Among the totally inactive (the lowest category), people
were almost six times as likely to be from the bottom third in socio-
economic status as from the top third; among the totally active (the
highest category), more than four times as many were from the top third
as from the bottom third. In between the extremes of political partici-
pation, the trends were unbroken and smooth: The higher the level of
participation, the more likely the person was from a high#status back-
ground; the lower the level of participation, the more likely the person
was from a low-status background.
Voting and Education
What is it about socioeconomic status that leads people to behave so
differently? Verba and Nie did not present the breakdowns that permit
an answer to that question.''81 For that, we turn to another study, by
Raymond Wolfinger and Steven Rosenstone, that used the Current
Population Surveys (CPS), conducted by the Census Bureau, to an-
swer questions about voting.'"] The authors asked which of the three
components of socioeconomic status-education, income, and occupa-
tional status-primarily
influences voting. The clear answer was edu-
cation. A college education raised a person's probability of voting almost
40 percentage points over what it would be if the person had less than
five years of education, independent of income or occupational status;
postgraduate education raised it even more. Even for people in the top
income category (more than $75,C00 per year in 1990 dollars) a college
education added 34 percentage points to a person's probability of vot-
ing. Occupational status per se had an even smaller overall effect than
income, and it was ambiguous to boot. For example, with education held
Intelligence and Political Participation
- Intelligence has a potent effect on political behavior for teenagers and preteens, independent of socioeconomic variables.
- Voter turnout in federal elections typically ranges from 25 to 70 percent, creating a significant divide between voters and nonvoters.
- Traditional social science models emphasize that political participation is highly dependent on socioeconomic status (SES).
- Research by Verba and Nie shows a linear relationship where higher SES correlates with increased levels of political activity and campaigning.
- When breaking down the components of socioeconomic status, education emerges as the primary driver influencing the probability of voting.
- The study of voting behavior serves as a vital window into the nature of civility and civic engagement in American life.
Social scientists do not find it easy to dragoon large samples of adult Americans and make them sit still for the kinds of assessments of political involvement that can be conducted with children.
258
Cognitive Classes and Social Behavior
Civility and Citizenship
259
cated that intelligence per se, rather than socioeconomic status, was
driving the relationships, and that when socioeconomic status was
significantly correlated with a dimension of political involvement, it
was via its effects on intelligence. It is possible that the importance of
intelligence was somewhat inflated in this study because the youngsters
were disproportionately from working-class backgrounds, hence under-
estimating the impact of socioeconomic status in more representative
samples. However, the qualitative outcome leaves no doubt that intelli-
gence, apart from the usual socioeconomic variables, has a potent effect
on political behavior for teenagers, as well as for preteens.''2'
VOTING BEHAVIOR AMONG ADULTS
Social scientists do not find it easy to dragoon large samples of adult
Americans and make them sit still for the kinds of assessments of polit-
ical involvement that can be conducted with children. But they try
nonetheless, and they have had some success, mostly centering on vot-
ing.
Depending on the election and the historical period, the turnout in
elections for federal officeholders ranges from about 25 to 70 percent,
with the recent level in presidential elections in the 45 to 60 percent
range. It may or may not be a pity that so many of our fellow citizens
fail to vote, but it is a boon to social scientists. With the deep split he-
tween voters and nonvoters, voting has been an invaluable resource for
gaining a glimpse into the nature of this manifestation of civility.'"'
Voting and Socioeconomic Class
The literature on voting repeats the familiar story: Most of the analysis
has focused on socioeconomic class, not cognitive ability. The standard
model of political participation, including voting, is that it is highly de-
pendent on socioeconomic tatu us.'^ "College graduates vote more than
high school graduates; white-collar workers vote more than blue-collar
workers; and the rich vote more than the poor," as Wolfinger summa.
rized it.15 The connection between political participation and social sta-
tus is so strong that almost any measure of it, no matter how casual, will
pick up some part of the relationship. The impression we all have that
elections are settled mostly by the votes of the middle and upper classes
broadly construed is confirmed by careful scrutiny, if socioeconomic
status is the only measure taken of potential voters.
When we are able to look behind the isolated vote to broader kinds
of political behavior, the same relationship prevails. The landmark study
on this topic was conducted by Sidney Verba and Norman Nie, who
polled several thousand people representing the national population in
1967 not only about their voting but also about other political activi-
ties-campaigning, demonstrating, contacting officials, and so on.16
Verba and Nie identified six categories of political activity, from "to-
tally inactive" at one end to the "totally active" at the other, with four
gradations in between. Almost without exception, however political
participation was defined, socioeconomic status was not only a signifi-
cant predictor in a statistical sense, but the differences across classes
were large.'17' Among the totally inactive (the lowest category), people
were almost six times as likely to be from the bottom third in socio-
economic status as from the top third; among the totally active (the
highest category), more than four times as many were from the top third
as from the bottom third. In between the extremes of political partici-
pation, the trends were unbroken and smooth: The higher the level of
participation, the more likely the person was from a high#status back-
ground; the lower the level of participation, the more likely the person
was from a low-status background.
Voting and Education
What is it about socioeconomic status that leads people to behave so
differently? Verba and Nie did not present the breakdowns that permit
an answer to that question.''81 For that, we turn to another study, by
Raymond Wolfinger and Steven Rosenstone, that used the Current
Population Surveys (CPS), conducted by the Census Bureau, to an-
swer questions about voting.'"] The authors asked which of the three
components of socioeconomic status-education, income, and occupa-
tional status-primarily
influences voting. The clear answer was edu-
cation. A college education raised a person's probability of voting almost
40 percentage points over what it would be if the person had less than
five years of education, independent of income or occupational status;
postgraduate education raised it even more. Even for people in the top
income category (more than $75,C00 per year in 1990 dollars) a college
education added 34 percentage points to a person's probability of vot-
ing. Occupational status per se had an even smaller overall effect than
income, and it was ambiguous to boot. For example, with education held
Education and Political Participation
- Educational attainment is the primary predictor of voting behavior, outweighing both income and occupational status.
- College education significantly increases the probability of voting even among the highest income earners.
- Educated individuals demonstrate higher political sophistication, consuming more news and engaging with issues at an abstract level.
- The correlation between socioeconomic status and voting is largely a byproduct of education rather than wealth or professional rank.
- Political participation is driven more by a sense of 'civility' and civic duty than by the pursuit of direct personal or economic benefit.
- The data challenges cynical views of disenfranchisement by showing that an educated clerk is more likely to vote than a less-educated wealthy businessman.
What is the cynic to make of the fact that an underpaid but well-educated shop clerk is more likely to vote than a less educated, rich businessman?
258
Cognitive Classes and Social Behavior
Civility and Citizenship
259
cated that intelligence per se, rather than socioeconomic status, was
driving the relationships, and that when socioeconomic status was
significantly correlated with a dimension of political involvement, it
was via its effects on intelligence. It is possible that the importance of
intelligence was somewhat inflated in this study because the youngsters
were disproportionately from working-class backgrounds, hence under-
estimating the impact of socioeconomic status in more representative
samples. However, the qualitative outcome leaves no doubt that intelli-
gence, apart from the usual socioeconomic variables, has a potent effect
on political behavior for teenagers, as well as for preteens.''2'
VOTING BEHAVIOR AMONG ADULTS
Social scientists do not find it easy to dragoon large samples of adult
Americans and make them sit still for the kinds of assessments of polit-
ical involvement that can be conducted with children. But they try
nonetheless, and they have had some success, mostly centering on vot-
ing.
Depending on the election and the historical period, the turnout in
elections for federal officeholders ranges from about 25 to 70 percent,
with the recent level in presidential elections in the 45 to 60 percent
range. It may or may not be a pity that so many of our fellow citizens
fail to vote, but it is a boon to social scientists. With the deep split he-
tween voters and nonvoters, voting has been an invaluable resource for
gaining a glimpse into the nature of this manifestation of civility.'"'
Voting and Socioeconomic Class
The literature on voting repeats the familiar story: Most of the analysis
has focused on socioeconomic class, not cognitive ability. The standard
model of political participation, including voting, is that it is highly de-
pendent on socioeconomic tatu us.'^ "College graduates vote more than
high school graduates; white-collar workers vote more than blue-collar
workers; and the rich vote more than the poor," as Wolfinger summa.
rized it.15 The connection between political participation and social sta-
tus is so strong that almost any measure of it, no matter how casual, will
pick up some part of the relationship. The impression we all have that
elections are settled mostly by the votes of the middle and upper classes
broadly construed is confirmed by careful scrutiny, if socioeconomic
status is the only measure taken of potential voters.
When we are able to look behind the isolated vote to broader kinds
of political behavior, the same relationship prevails. The landmark study
on this topic was conducted by Sidney Verba and Norman Nie, who
polled several thousand people representing the national population in
1967 not only about their voting but also about other political activi-
ties-campaigning, demonstrating, contacting officials, and so on.16
Verba and Nie identified six categories of political activity, from "to-
tally inactive" at one end to the "totally active" at the other, with four
gradations in between. Almost without exception, however political
participation was defined, socioeconomic status was not only a signifi-
cant predictor in a statistical sense, but the differences across classes
were large.'17' Among the totally inactive (the lowest category), people
were almost six times as likely to be from the bottom third in socio-
economic status as from the top third; among the totally active (the
highest category), more than four times as many were from the top third
as from the bottom third. In between the extremes of political partici-
pation, the trends were unbroken and smooth: The higher the level of
participation, the more likely the person was from a high#status back-
ground; the lower the level of participation, the more likely the person
was from a low-status background.
Voting and Education
What is it about socioeconomic status that leads people to behave so
differently? Verba and Nie did not present the breakdowns that permit
an answer to that question.''81 For that, we turn to another study, by
Raymond Wolfinger and Steven Rosenstone, that used the Current
Population Surveys (CPS), conducted by the Census Bureau, to an-
swer questions about voting.'"] The authors asked which of the three
components of socioeconomic status-education, income, and occupa-
tional status-primarily
influences voting. The clear answer was edu-
cation. A college education raised a person's probability of voting almost
40 percentage points over what it would be if the person had less than
five years of education, independent of income or occupational status;
postgraduate education raised it even more. Even for people in the top
income category (more than $75,C00 per year in 1990 dollars) a college
education added 34 percentage points to a person's probability of vot-
ing. Occupational status per se had an even smaller overall effect than
income, and it was ambiguous to boot. For example, with education held
260
Cognitive Classes and Social Behavior
Civility and Citizenship
261
constant, sales and clerical workers voted at slightly higher rates than
professionals or managers.
Educational attainment correlates not just with voting itself but with
political knowledge, interest, and attitudes-in
short, with political so-
phisti~ation.~~
Political sophistication, in turn, correlates with voting.''"
Educated people read more about political issues, and they keep their
television sets and radios tuned to the news and public issues programs
more than do people with less education. They think about political is-
sues at more abstract levels than do less educated people, and less in
terms of concrete, ~ersonal benefit. They are more likely to disagree
with statements like, "So many people vote in the national election that
it doesn't matter much to me whether I vote or not." Or, "It isn't so im-
portant to vote when you know your party doesn't have a chance to
win."22 By disagreeing, educated people seem to be saying that they par-
ticipate in an election even when the only payoff is a sense of having
done the right thing, which we see as a mark of civility.
Other scholars who have examined this issue have come to the same
conclusion that Wolfinger and Rosenstone demonstrated most deci-
sively: it is predominantly education, rather than income or occupa-
tional status, that links voting and socioeconomic status." Some
scholars go so far as to conclude that, aside from the major effect of ed-
ucation, voting and socioeconomic status have little to do with each
other.lZ4' This rums the standard theory on its head: Rather than ex-
plaining the correlation between education and voting as an effect of
socioeconomic status, the evidence says that the correlation between
socioeconomic status and voting would more properly be attr~buted to
education.
Turning the explanation on its head may solve a puzzle that Verba
and Nie noted." Having shown that political leaders respond to pres-
sure from their constituencies, they wondered why the upper socioeco-
nomic classes participated more in political matters, when those at the
bottom were more dependent on the government to solve their prob-
lems. If the people who have the most to gain or lose participated the
most, then the lower classes would vote more than the middle or upper.
Why don't they? The answer is that participation is less a matter of di-
rect benefit than of civility in the sense we are using the word here, and
civility is higher among more educated people than among less educated
ones.'2h'
Some of the more cynical dismissals of American political life are
similarly answered. Poor and humble workers, it is sometimes argued,
are disenfranchised whether they vote or not, because the government
~loes the bidding of the rich and well placed. It is small wonder, then,
that they do not vote, this argument continues. But the evidence shows
it is not so much the poor and humble who fail to vote; it is the uned-
ucated. It may be easy to believe that the poor are disenfranchised, but
it is less obvious why it should be the uneducated (poor or not). What
is the cynic to make of the fact that an underpaid but well-educated
shop clerk is more likely to vote than a less educated, rich businessman?
Voting and Cognitive Ability
The link between education and voting is clear. Does it really signify a
link between cognitive ability and voting? There is an indirect argu-
ment that says yes, described in the notes,'271
hut we have been able to
find only two studies that tackle the question directly.
The first did not have an actual measure of IQ, only ratings of in-
telligence by interviewers, based on their impressions after some train-
ing. T h ~ s 1s a legitimate procedure-rated
intelligence is known to
correlate with tested intelligence-but
the results must be treated as
approximate. With that in mind, a multivariate analysis of a national
sample in the American National Election study in 1976 showed that,
of ;all the variables, by far the most significant in determining a person's
political sophistication were rated intelligence and expressed inter-
est. Interest, however, was itself most tellingly affected by intelli-
gence.''" The more familiar independent variables-education, in-
come, occupational status, exposure to the media, parental interest
in politics-had
small or no effects, after rated intelligence was taken
into account.
The one study of political involvement that included a test of intel-
ligence was conducted in the San Francisco area in the 1970s. The
intelligence test was a truncated one, based on a dozen vocabulary
items."' About 150 people were interviewed in depth and assessed on
political sophistication, which is known to correlate with political par-
ticipation.'"he
usual background variables-income
and education,
for example-were
also obtained. Educational attainment was, as ex-
pected, correlated with the test score. But even this rudimentary intel-
ligence test score predicted political sophistication as well as education
did. To Russell Neuman, the study's author, "the evidence supports the
Intelligence and Political Participation
- Research suggests a direct link between cognitive ability and political sophistication, often independent of socioeconomic status.
- A 1976 study found that rated intelligence and personal interest were the most significant predictors of political engagement.
- Traditional variables like income and education show smaller effects on political involvement once intelligence is accounted for.
- A San Francisco study demonstrated that even a rudimentary vocabulary test could predict political sophistication as effectively as educational attainment.
- While factors like age, sex, and civic duty influence voting, cognitive ability remains a powerful and often overlooked explanatory variable.
- The correlation between intelligence and the sentiment of civic duty was found to be significantly higher than the correlation with socioeconomic background.
The more familiar independent variables-education, income, occupational status, exposure to the media, parental interest in politics-had small or no effects, after rated intelligence was taken into account.
260
Cognitive Classes and Social Behavior
Civility and Citizenship
261
constant, sales and clerical workers voted at slightly higher rates than
professionals or managers.
Educational attainment correlates not just with voting itself but with
political knowledge, interest, and attitudes-in
short, with political so-
phisti~ation.~~
Political sophistication, in turn, correlates with voting.''"
Educated people read more about political issues, and they keep their
television sets and radios tuned to the news and public issues programs
more than do people with less education. They think about political is-
sues at more abstract levels than do less educated people, and less in
terms of concrete, ~ersonal benefit. They are more likely to disagree
with statements like, "So many people vote in the national election that
it doesn't matter much to me whether I vote or not." Or, "It isn't so im-
portant to vote when you know your party doesn't have a chance to
win."22 By disagreeing, educated people seem to be saying that they par-
ticipate in an election even when the only payoff is a sense of having
done the right thing, which we see as a mark of civility.
Other scholars who have examined this issue have come to the same
conclusion that Wolfinger and Rosenstone demonstrated most deci-
sively: it is predominantly education, rather than income or occupa-
tional status, that links voting and socioeconomic status." Some
scholars go so far as to conclude that, aside from the major effect of ed-
ucation, voting and socioeconomic status have little to do with each
other.lZ4' This rums the standard theory on its head: Rather than ex-
plaining the correlation between education and voting as an effect of
socioeconomic status, the evidence says that the correlation between
socioeconomic status and voting would more properly be attr~buted to
education.
Turning the explanation on its head may solve a puzzle that Verba
and Nie noted." Having shown that political leaders respond to pres-
sure from their constituencies, they wondered why the upper socioeco-
nomic classes participated more in political matters, when those at the
bottom were more dependent on the government to solve their prob-
lems. If the people who have the most to gain or lose participated the
most, then the lower classes would vote more than the middle or upper.
Why don't they? The answer is that participation is less a matter of di-
rect benefit than of civility in the sense we are using the word here, and
civility is higher among more educated people than among less educated
ones.'2h'
Some of the more cynical dismissals of American political life are
similarly answered. Poor and humble workers, it is sometimes argued,
are disenfranchised whether they vote or not, because the government
~loes the bidding of the rich and well placed. It is small wonder, then,
that they do not vote, this argument continues. But the evidence shows
it is not so much the poor and humble who fail to vote; it is the uned-
ucated. It may be easy to believe that the poor are disenfranchised, but
it is less obvious why it should be the uneducated (poor or not). What
is the cynic to make of the fact that an underpaid but well-educated
shop clerk is more likely to vote than a less educated, rich businessman?
Voting and Cognitive Ability
The link between education and voting is clear. Does it really signify a
link between cognitive ability and voting? There is an indirect argu-
ment that says yes, described in the notes,'271
hut we have been able to
find only two studies that tackle the question directly.
The first did not have an actual measure of IQ, only ratings of in-
telligence by interviewers, based on their impressions after some train-
ing. T h ~ s 1s a legitimate procedure-rated
intelligence is known to
correlate with tested intelligence-but
the results must be treated as
approximate. With that in mind, a multivariate analysis of a national
sample in the American National Election study in 1976 showed that,
of ;all the variables, by far the most significant in determining a person's
political sophistication were rated intelligence and expressed inter-
est. Interest, however, was itself most tellingly affected by intelli-
gence.''" The more familiar independent variables-education, in-
come, occupational status, exposure to the media, parental interest
in politics-had
small or no effects, after rated intelligence was taken
into account.
The one study of political involvement that included a test of intel-
ligence was conducted in the San Francisco area in the 1970s. The
intelligence test was a truncated one, based on a dozen vocabulary
items."' About 150 people were interviewed in depth and assessed on
political sophistication, which is known to correlate with political par-
ticipation.'"he
usual background variables-income
and education,
for example-were
also obtained. Educational attainment was, as ex-
pected, correlated with the test score. But even this rudimentary intel-
ligence test score predicted political sophistication as well as education
did. To Russell Neuman, the study's author, "the evidence supports the
262
Cognitive CClses and Social Behavior
Civility and Citizenship
263
idea of an independent cognitive-ability effect" as part of the proved
link between socioeconomic status and political participation."
We do not imagine that we have told the entire story of political par-
ticipation. Age, sex, and ethnic identity are among the individual fac-
tors that we have omitted but that political scientists routinely examine
against the background of voting laws, regional variations, historical
events, and the general political climate of the country. In various pe-
riods and to varying degrees, these other factors have been shown to be
associated with either the sheer level of political involvement or its
character. Older people, for example, are more likely to vote than
younger people, up to the age at which the debilities of age intervene;
women in the past participated less than men, but the gap has narrowed
to the vanishing point (especially for educated men and women); dif-
ferent ethnic groups resonate to different political causes."
Our focus on education and intelligence similarly gives insufficient
attention to other personal traits that influence political participation.'7
People vary in their sense of civic duty and in the strength of their party
affiliations, apart from their educational or intellectual level; their per-
sonal values color their political allegiances and how intensely they are
felt. Their personalities are expressed not just in personal life but also
in their political actions (or inactions).
The bottom line, then, is not that political participation is simple to
describe hut that, despite its complexity, so narrow a range of individ-
ual factors carries so large a burden of explanation. For example, the
zero-order correlations between intelligence and the fourteen political
dimensions in the study of high school students described above ranged
from .O1 to .53, with an average of .22; the average correlation with the
youngsters' socioeconomic background was .09.j4 For the sentiment of
civic duty-the
closest approximation to civility in this particular set
of dimensions-the
correlation with intelligence was .4. As we cau-
tioned above, this may be an overestimate, but perhaps not by much:
The zero-order correlation between scores on a brief vocabulary test and
the political sophistication of a sample of adults was .33.35 The coeffi-
cients for rated intelligence in a multivariate analysis of political so-
phistication were more than twice as large as for any of the other
variables examined, which included education, occupation, age, and
parental interest in politics.36
The coherence of the evidence linking IQ and political participation
as a whole cannot be neglected. The continuity of the relationship over
the life span gives it a plausibility that no single study can command.
The other chapters in Part I1 have shown that cognitive ability often
accounts for the importance of socioeconomic class and underlies much
of the variation that is usually attributed to education. It appears that
the same holds for political participation.
MIDDLE-CLASS VALUES: DATA FROM THE NLSY
The NLSY does not permit us to extend this discussion directly. None
of the questions in the study asks about political participation or knowl-
edge. Rut as we draw to the close of this long sequence of chapters about
IQ and social behavior, we may use the NLSY to take another tack.
For many years, "middle-class values" has been a topic of debate in
American public life. Many academic intellecti~als hold middle-class
values in contempt. They have a better reputation among the public at
large, however, where they are seen-rightly,
in our view-as
ways of
behaving that produce social cohesion and order. To use the language
of this chapter, middle-class values are related to civility.
Throughout Part 11, we have been examining departures from mid-
dle-class values: adolescents' dropping out of school, babies born out of
wedlock, men dropping out of the labor force or ending up in jail, women
going on welfare. Let us now look at the glass as half full instead of half
empty, concentrating on the people who are doing everything right by
conventional standards. And so, to conclude Part 11, we present the
Middle Class Values (MCV) Index. It has scores of "Yes" and "No." A
man in the NLSY got a "Yes" if by 1990 he had obtained a high school
degree (or more), been in the labor force throughout 1989, never been
interviewed in jail, and was still married to his first wife. A woman in
the NLSY got a "Yes" if she had obtained a high school degree, had never
given birth to a baby out of wedlock, had never been interviewed in jail,
and was still married to her first husband. People who failed any one of
the conditions were scored "No." Never-married people who met all the
other conditions except the marital one were excluded from the analy-
sis. We also excluded men who were not eligible for the labor force in
1989 or 1990 because they were physically unable to work or in school.
Note that the index does not demand economic success. A man can
earn a "Yes" despite being unemployed if he stays in the labor force. A
woman can be on welfare and still earn a "Yes" if she bore her children
IQ and Middle-Class Values
- Research indicates a strong correlation between cognitive ability and political sophistication, often outweighing factors like education or occupation.
- The relationship between IQ and political participation remains consistent across an individual's lifespan, suggesting a foundational link.
- The authors introduce the Middle Class Values (MCV) Index to measure social cohesion through behaviors like educational attainment and marital stability.
- The MCV Index defines 'doing everything right' as staying in the labor force, avoiding crime, and confining childbearing to marriage.
- Unlike economic metrics, the MCV Index focuses on behavioral standards rather than wealth, allowing for those below the poverty line to qualify.
- The text argues that these middle-class behaviors are essential components of 'civility' and social order within American life.
Many academic intellectuals hold middle-class values in contempt.
262
Cognitive CClses and Social Behavior
Civility and Citizenship
263
idea of an independent cognitive-ability effect" as part of the proved
link between socioeconomic status and political participation."
We do not imagine that we have told the entire story of political par-
ticipation. Age, sex, and ethnic identity are among the individual fac-
tors that we have omitted but that political scientists routinely examine
against the background of voting laws, regional variations, historical
events, and the general political climate of the country. In various pe-
riods and to varying degrees, these other factors have been shown to be
associated with either the sheer level of political involvement or its
character. Older people, for example, are more likely to vote than
younger people, up to the age at which the debilities of age intervene;
women in the past participated less than men, but the gap has narrowed
to the vanishing point (especially for educated men and women); dif-
ferent ethnic groups resonate to different political causes."
Our focus on education and intelligence similarly gives insufficient
attention to other personal traits that influence political participation.'7
People vary in their sense of civic duty and in the strength of their party
affiliations, apart from their educational or intellectual level; their per-
sonal values color their political allegiances and how intensely they are
felt. Their personalities are expressed not just in personal life but also
in their political actions (or inactions).
The bottom line, then, is not that political participation is simple to
describe hut that, despite its complexity, so narrow a range of individ-
ual factors carries so large a burden of explanation. For example, the
zero-order correlations between intelligence and the fourteen political
dimensions in the study of high school students described above ranged
from .O1 to .53, with an average of .22; the average correlation with the
youngsters' socioeconomic background was .09.j4 For the sentiment of
civic duty-the
closest approximation to civility in this particular set
of dimensions-the
correlation with intelligence was .4. As we cau-
tioned above, this may be an overestimate, but perhaps not by much:
The zero-order correlation between scores on a brief vocabulary test and
the political sophistication of a sample of adults was .33.35 The coeffi-
cients for rated intelligence in a multivariate analysis of political so-
phistication were more than twice as large as for any of the other
variables examined, which included education, occupation, age, and
parental interest in politics.36
The coherence of the evidence linking IQ and political participation
as a whole cannot be neglected. The continuity of the relationship over
the life span gives it a plausibility that no single study can command.
The other chapters in Part I1 have shown that cognitive ability often
accounts for the importance of socioeconomic class and underlies much
of the variation that is usually attributed to education. It appears that
the same holds for political participation.
MIDDLE-CLASS VALUES: DATA FROM THE NLSY
The NLSY does not permit us to extend this discussion directly. None
of the questions in the study asks about political participation or knowl-
edge. Rut as we draw to the close of this long sequence of chapters about
IQ and social behavior, we may use the NLSY to take another tack.
For many years, "middle-class values" has been a topic of debate in
American public life. Many academic intellecti~als hold middle-class
values in contempt. They have a better reputation among the public at
large, however, where they are seen-rightly,
in our view-as
ways of
behaving that produce social cohesion and order. To use the language
of this chapter, middle-class values are related to civility.
Throughout Part 11, we have been examining departures from mid-
dle-class values: adolescents' dropping out of school, babies born out of
wedlock, men dropping out of the labor force or ending up in jail, women
going on welfare. Let us now look at the glass as half full instead of half
empty, concentrating on the people who are doing everything right by
conventional standards. And so, to conclude Part 11, we present the
Middle Class Values (MCV) Index. It has scores of "Yes" and "No." A
man in the NLSY got a "Yes" if by 1990 he had obtained a high school
degree (or more), been in the labor force throughout 1989, never been
interviewed in jail, and was still married to his first wife. A woman in
the NLSY got a "Yes" if she had obtained a high school degree, had never
given birth to a baby out of wedlock, had never been interviewed in jail,
and was still married to her first husband. People who failed any one of
the conditions were scored "No." Never-married people who met all the
other conditions except the marital one were excluded from the analy-
sis. We also excluded men who were not eligible for the labor force in
1989 or 1990 because they were physically unable to work or in school.
Note that the index does not demand economic success. A man can
earn a "Yes" despite being unemployed if he stays in the labor force. A
woman can be on welfare and still earn a "Yes" if she bore her children
264
Cognitive Classes and Social Behavior
within marriage. Men and women alike can have incomes below the
poverty line and still qualify. We do not require that the couple have
children or that the wife forgo a career. The purpose of the MCV Index
is to identify among the NLSY population, in their young adulthood
when the index was scored, those people who are getting on with their
lives in ways that fit the middle-class stereotype: They stuck with school,
got married, the man is working or trying to work, the woman has con-
fined her childbearing to marriage, and there is no criminal record (as
far as we can tell).
What does this have to do withcivility? We propose that even though
many others in the sample who did not score "Yes" are also fine citizens,
it is this population that forms the spine of the typical American com-
munity, filling the seats at the PTA meetings and the pews at church,
organizing the Rotary Club fund-raiser, coaching the Little League
team, or circulating a petition to put a stop light at a dangerous inter-
section-and
shoveling sidewalks and returning lost wallets. What
might IQ have to do with qualifying for this group? As the table shows,
about half of the sample earned "Yes" scores. They are markedly con-
Whites and the Middle-Class Values Index
Percentage Who
Cognitive Class
Scored "Yes" as of 1990
I Very bright
74
I1 Bright
67
111 Normal
50
IV Dull
30
V Very dull
16
Overall
5 1
centrated among the brighter people, with progressively smaller pro-
portions on down through the cognitive classes, to an extremely small
16 percent of the Class Vs qualifying.
Furthermore, as in so many other analyses throughout Part 11, cogni-
tive ability, independent of socioeconomic background, has an impor-
tant causal role to play. Below is the final version of the graphic you
have seen so often.
Civility and Citirenship
265
Cognitive Ability and the Middle Class Values Index
Probability of scoring "Yes" on the MCV Index
80% -
As parental SES
Note: For computing the plot, age and e~ther SES (for the black curve) or IQ (for the gray
curve) were set at their mean values.
As intuition might suggest, "upbringing" in the form of socioeco-
nomic background makes a significant difference. But for the NLSY
sample, it was not as significant as intelligence. Even when we conduct
our usual analyses with the education subsamples-thereby
guarantee-
ing that everyone meets one of the criteria (finishing high school)-a
significant independent role for IQ remains. Its magnitude is diminished
for the high school sample but not, curiously, for the college sample.
The independent role of socioeconomic background becomes insignif-
icant in these analyses and, in the case of the high-school-only sample,
goes the "wrong" way after cognitive ability is taken into account.
Much as we have enjoyed preparing the Middle Class Values Index,
we do not intend it to become a new social science benchmark. Its mod-
est goals are to provide a vantage point on correlates of civility in a pop-
ulation of young adults and then to serve as a reminder that the
old-fashioned virtues represented through the index are associated with
intelligence.
Intelligence and Middle Class Values
- The Middle Class Values (MCV) Index identifies the 'spine' of American communities—those who volunteer, coach, and participate in civic life.
- Data shows a strong correlation between cognitive class and civic behavior, with 74% of the 'Very Bright' scoring high on the index compared to only 16% of the 'Very Dull'.
- Statistical analysis suggests that cognitive ability is a more significant predictor of civic virtue than socioeconomic background or upbringing.
- While education level plays a role, IQ remains a significant independent factor in determining the likelihood of a person exhibiting 'middle-class' virtues.
- Intelligence is described as a 'raw material' for civility, enabling individuals to better understand complex trade-offs and diverse points of view.
- The authors acknowledge that high intelligence does not guarantee moral behavior, noting that many smart people are conspicuously uncivil.
It is this population that forms the spine of the typical American community, filling the seats at the PTA meetings and the pews at church, organizing the Rotary Club fund-raiser, coaching the Little League team, or circulating a petition to put a stop light at a dangerous intersection.
264
Cognitive Classes and Social Behavior
within marriage. Men and women alike can have incomes below the
poverty line and still qualify. We do not require that the couple have
children or that the wife forgo a career. The purpose of the MCV Index
is to identify among the NLSY population, in their young adulthood
when the index was scored, those people who are getting on with their
lives in ways that fit the middle-class stereotype: They stuck with school,
got married, the man is working or trying to work, the woman has con-
fined her childbearing to marriage, and there is no criminal record (as
far as we can tell).
What does this have to do withcivility? We propose that even though
many others in the sample who did not score "Yes" are also fine citizens,
it is this population that forms the spine of the typical American com-
munity, filling the seats at the PTA meetings and the pews at church,
organizing the Rotary Club fund-raiser, coaching the Little League
team, or circulating a petition to put a stop light at a dangerous inter-
section-and
shoveling sidewalks and returning lost wallets. What
might IQ have to do with qualifying for this group? As the table shows,
about half of the sample earned "Yes" scores. They are markedly con-
Whites and the Middle-Class Values Index
Percentage Who
Cognitive Class
Scored "Yes" as of 1990
I Very bright
74
I1 Bright
67
111 Normal
50
IV Dull
30
V Very dull
16
Overall
5 1
centrated among the brighter people, with progressively smaller pro-
portions on down through the cognitive classes, to an extremely small
16 percent of the Class Vs qualifying.
Furthermore, as in so many other analyses throughout Part 11, cogni-
tive ability, independent of socioeconomic background, has an impor-
tant causal role to play. Below is the final version of the graphic you
have seen so often.
Civility and Citirenship
265
Cognitive Ability and the Middle Class Values Index
Probability of scoring "Yes" on the MCV Index
80% -
As parental SES
Note: For computing the plot, age and e~ther SES (for the black curve) or IQ (for the gray
curve) were set at their mean values.
As intuition might suggest, "upbringing" in the form of socioeco-
nomic background makes a significant difference. But for the NLSY
sample, it was not as significant as intelligence. Even when we conduct
our usual analyses with the education subsamples-thereby
guarantee-
ing that everyone meets one of the criteria (finishing high school)-a
significant independent role for IQ remains. Its magnitude is diminished
for the high school sample but not, curiously, for the college sample.
The independent role of socioeconomic background becomes insignif-
icant in these analyses and, in the case of the high-school-only sample,
goes the "wrong" way after cognitive ability is taken into account.
Much as we have enjoyed preparing the Middle Class Values Index,
we do not intend it to become a new social science benchmark. Its mod-
est goals are to provide a vantage point on correlates of civility in a pop-
ulation of young adults and then to serve as a reminder that the
old-fashioned virtues represented through the index are associated with
intelligence.
266
Cognitive Chses and Social Behim
THE DIFFERENCE BETWEEN BEING SMART AND BEING CIVIL
Cognitive ability is a raw material for civility, not the thing itself. Sup-
pose that the task facing a citizen is to vote on an initiative proposing
some environmental policy involving (as environmental issues usually
do) complex and subtle trade-offs between costs and henefits. Above-
average intelligence means that a person is likely to be better read and
better able to think through (in a purely technical sense) those trade-
offs. On the average, smarter people are more able to understand points
of view other than their own. Rut beyond these contributions of intel-
ligence to citizenship, high intelligence also seems to be associated with
an interest in issues of civil concern. It is associated, perhaps surpris-
ingly to some, with the behaviors that we identify with middle-class
values.
We should emphasize that vast quantities of this raw material called
intelligence are not needed for many of the most fundamental forms
of civility and moral behavior. All of us might well pause at th~s point
to think of the abundant examples of smart people who have been
conspicuously uncivil. Yet these qualifications notwithstanding, the sta-
tistical tendencies remain. A smarter population is more likely to he,
and more capable of being made into, a civil citizenry. For a nation pre-
dicated on a high level of individual autonomy, this is a fact worth
knowing.
PART I11
The National Context
Part I1 was circumscribed, taking on social behaviors one at a time, fo-
cusing on causal roles, with the analysis restricted to whites wherever
the data permitted. We now turn to the national scene. This means con-
sidering all races and ethnic groups, which leads to the most contro-
versial issues we will discuss: ethnic differences in cognitive ability and
social behavior, the effects of fertility patterns on the distribution of in-
telligence, and the overall relationship of low cognitive ability to what
has become known as the underclass. As we begin, perhaps a pact is ap-
propriate. The facts about these topics are not only controversial but
exceedingly complex. For our part, we will undertake to confront all the
tough questions squarely. We ask that you read carefully.
Ethnic Differences in Cognitive Ability
- The authors transition from individual social behaviors to a national context involving all races and ethnic groups.
- Data suggests that East Asians typically score higher on intelligence tests than white Americans, particularly in nonverbal intelligence.
- A consistent gap of approximately one standard deviation in IQ scores has been observed between African-Americans and European-Americans for several decades.
- The black-white IQ gap persists across all socioeconomic levels and is actually wider at higher levels of status.
- While the gap narrowed slightly in recent decades due to fewer very low scores, the debate over genetic versus environmental causes remains unresolved.
- The authors argue that these differences are real and have social consequences, though they claim the facts are not as alarming as feared.
Despite the forbidding air that envelops the topic, ethnic differences in cognitive ability are neither surprising nor in doubt.
266
Cognitive Chses and Social Behim
THE DIFFERENCE BETWEEN BEING SMART AND BEING CIVIL
Cognitive ability is a raw material for civility, not the thing itself. Sup-
pose that the task facing a citizen is to vote on an initiative proposing
some environmental policy involving (as environmental issues usually
do) complex and subtle trade-offs between costs and henefits. Above-
average intelligence means that a person is likely to be better read and
better able to think through (in a purely technical sense) those trade-
offs. On the average, smarter people are more able to understand points
of view other than their own. Rut beyond these contributions of intel-
ligence to citizenship, high intelligence also seems to be associated with
an interest in issues of civil concern. It is associated, perhaps surpris-
ingly to some, with the behaviors that we identify with middle-class
values.
We should emphasize that vast quantities of this raw material called
intelligence are not needed for many of the most fundamental forms
of civility and moral behavior. All of us might well pause at th~s point
to think of the abundant examples of smart people who have been
conspicuously uncivil. Yet these qualifications notwithstanding, the sta-
tistical tendencies remain. A smarter population is more likely to he,
and more capable of being made into, a civil citizenry. For a nation pre-
dicated on a high level of individual autonomy, this is a fact worth
knowing.
PART I11
The National Context
Part I1 was circumscribed, taking on social behaviors one at a time, fo-
cusing on causal roles, with the analysis restricted to whites wherever
the data permitted. We now turn to the national scene. This means con-
sidering all races and ethnic groups, which leads to the most contro-
versial issues we will discuss: ethnic differences in cognitive ability and
social behavior, the effects of fertility patterns on the distribution of in-
telligence, and the overall relationship of low cognitive ability to what
has become known as the underclass. As we begin, perhaps a pact is ap-
propriate. The facts about these topics are not only controversial but
exceedingly complex. For our part, we will undertake to confront all the
tough questions squarely. We ask that you read carefully.
Chapter 13
Ethnic Differences in
Cognitive Ability
Despite the forbidding air that envelops the topic, ethnic differences in cogni-
tive ability are neither surprising nor in doubt. Large human populations dif-
fer in many ways, both cultural and biological. It is not surprising that they
might differ at kart slightly in their cognitive characteristics. That they do is
confirmed by the data on ethnic differences in cognitive ability from around
the world. One message of this chapter is that such differences are real and
have consequences. Another is that the facts are not as alarming as many peo-
pk seem to fear.
East Asians (e .g. , Chinese, Japanese) , whether in America or in Asia,
typically earn higher scores on intelligence and achievement tests than white
Americans. The precise size of their advantage is unckar; estimates range
from just a few to ten points. A mme certain difference between the races is
that East Asians have higher nonverbal intelligence than whites while being
equal, or perhaps slightly lower, in verbal intelligence.
The difference in test scores between African-Americans and European-
Americans as measured in dozens of reputable studies has converged on ap-
proximately a one standard deviation difference for several decades. Translated
into centiles, this means that the average white person tests higher than about
84 percent of the population of blacks and that the average black person tests
higher than about 16 percent of the population of whites.
The average black and white differ in IQ at every level of socioeconomic
status (SES) , but they differ more at high levels of SES than at low levels. At-
tempts to explain the difference in terms of test bins have failed. The tests have
approximately equal predictive force for whites and blacks.
In the past few decades, the gap between blacks and whites narrowed by
perhaps three IQ points. The narrowing appears to have been mainly caused
by a shrinking number of very low scores in the black population rather than
270
The National Context
Ethnic Differences in Coffnitive Ability
27 1
an increasing number of high scores. Improvements in the economic circum-
stances of blacks, in the quality of the schools they attend, in better public
health, and perhags also diminishing racism may be narrowing the gap.
The debate about whether and how much gnes and environment have to
do with ethnic differences remains unresolved. The universality of the con-
trast in nonverbal and verbal skills between East Asians and European whites
suggests, without quite proving, genetic roots. Another line of evidence point-
ing toward a genetic factor in cognitive ethnic differences is that blacks and
whites differ most on the tests that are the best measures of g, or general in-
telligence. On the other hand, the scores on even highly g-loaded tests can be
influenced to some extent by changing environmental factors over the course
of a decade or less. Beyond that, some social scientists have challenged the
premise that intelligence tests have the same meaning for people who live in
different cultural settings or whose forebears had very different histories.
Nothing seems more fearsome to many commentators than the possibility
that ethnic and race differences have any genetic component at all. This be-
liefis a fundamental ewm. Even if the differences between races were entirely
genetic (which they surely are not), it should make no practical difference in
how individuals deal with each other. The real danger is that the elite wisdom
on ethnic differences-that
such differences cannot exist--will shift to oppo-
site and equally unjustified extremes. Open and informed discussion is the one
certain way to protect society from the dangers of one extreme view or the
other.
E
thnic differences in measured cognitive ability have been found
since intelligence tests were invented. The battle over the meaning
of these differences is largely responsible for today's controversy over in-
telligence testing itself. That many readers have turned first to this chap-
ter indicates how sensitive the issue has become.
Our primary purpose is to lay out a set of statements, as precise as the
state of knowledge permits, ahout what is currently known about the
size, nature, validity, and persistence of ethnic differences on measures
of cognitive ability. A secondary purpose is to try to induce clarity in
ways of thinking about ethnic differences, for discussions about such dif-
ferences tend to run away with themselves, blending issues of fact, the-
ory, ethics, and public policy that need to be separated.
The first thing to remember is that the differences among individu-
als are far greater than the differences between groups. If all the ethnic
differences in intelligence evaporated overnight, most of the intellec-
tual variation in America would endure. The remaining inequality
would still strain the political process, because differences in cognitive
ability are problematic even in ethnically homogeneous societies. The
chapters in Part 11, looking only at whites, should have made that clear.
But the politics of cognitive inequality get hotter-sometimes
too hot
to handle-when
they are attached to the politics of ethnicity. We be-
lieve that the best way to keep the temperature down is to work through
the main facts carefully and methodically. This chapter first reviews the
evidence bearing on ethnic differences in cognitive ability, then turns
to whether the differences originate in genes or in environments. At
the chapter's end, we summarize what this knowledge about ethnic dif-
ferences means in practical terms.
We frequently use the word ethnic rather than race, because race is
such a difficult concept to employ in the American context."' What
does it mean to be "black" in America, in racial terms, when the word
black (or African-American) can be used for people whose ancestry is
more European than African? How are we to classify a person whose
parents hail from Panama but whose ancestry is predominantly African?
Is he a Latino? A black? The rule we follow here is to classify people ac-
cording to the way they classify themselves. The studies of "blacks" or
"Latinos" or "Asians" who live in America generally denote people who
say they are black, Latino, or Asian-no
more, no less.
Ethnic Nomenclature
We want to call people whatever they prefer to be called, including their
preferences for ethnic labels. As we write, however, there are no hard-and-
fast rules. People from Latin America wish to he known according to their
national origin: Cuban-American, Mexican-American, Puerto Rican, and
so forth. Hispanic is still the U.S. government's official label, hut Latino has
gained favor in recent years. We use Latino. Opting for common usage and
simplicity, we usually use black instead of Afican-American and white
(which always refers to non-Latino whites) instead of European-American
or Anglo. Americans of Asian descent are called Asian when the context
leaves no possibility of confusion with Asians living in Asia. We shift to
the hyphenated versions for everyone when it would avoid such confusions
or when, for stylistic reasons, the hyphenated versions seem appropriate.
Ethnic Differences and Cognitive Ability
- Social scientists challenge the universal meaning of intelligence tests across different cultural settings and historical backgrounds.
- The authors argue that even if genetic components existed in ethnic differences, it should not affect how individuals treat one another.
- Individual differences in intelligence are significantly greater than the average differences found between ethnic groups.
- The text emphasizes that intellectual inequality would persist and strain political processes even in a completely ethnically homogeneous society.
- The authors adopt a self-identification approach to ethnic classification, acknowledging the complexity of racial labels in the American context.
- Open and informed discussion is presented as the only way to prevent the public from swinging between dangerous ideological extremes.
If all the ethnic differences in intelligence evaporated overnight, most of the intellectual variation in America would endure.
270
The National Context
Ethnic Differences in Coffnitive Ability
27 1
an increasing number of high scores. Improvements in the economic circum-
stances of blacks, in the quality of the schools they attend, in better public
health, and perhags also diminishing racism may be narrowing the gap.
The debate about whether and how much gnes and environment have to
do with ethnic differences remains unresolved. The universality of the con-
trast in nonverbal and verbal skills between East Asians and European whites
suggests, without quite proving, genetic roots. Another line of evidence point-
ing toward a genetic factor in cognitive ethnic differences is that blacks and
whites differ most on the tests that are the best measures of g, or general in-
telligence. On the other hand, the scores on even highly g-loaded tests can be
influenced to some extent by changing environmental factors over the course
of a decade or less. Beyond that, some social scientists have challenged the
premise that intelligence tests have the same meaning for people who live in
different cultural settings or whose forebears had very different histories.
Nothing seems more fearsome to many commentators than the possibility
that ethnic and race differences have any genetic component at all. This be-
liefis a fundamental ewm. Even if the differences between races were entirely
genetic (which they surely are not), it should make no practical difference in
how individuals deal with each other. The real danger is that the elite wisdom
on ethnic differences-that
such differences cannot exist--will shift to oppo-
site and equally unjustified extremes. Open and informed discussion is the one
certain way to protect society from the dangers of one extreme view or the
other.
E
thnic differences in measured cognitive ability have been found
since intelligence tests were invented. The battle over the meaning
of these differences is largely responsible for today's controversy over in-
telligence testing itself. That many readers have turned first to this chap-
ter indicates how sensitive the issue has become.
Our primary purpose is to lay out a set of statements, as precise as the
state of knowledge permits, ahout what is currently known about the
size, nature, validity, and persistence of ethnic differences on measures
of cognitive ability. A secondary purpose is to try to induce clarity in
ways of thinking about ethnic differences, for discussions about such dif-
ferences tend to run away with themselves, blending issues of fact, the-
ory, ethics, and public policy that need to be separated.
The first thing to remember is that the differences among individu-
als are far greater than the differences between groups. If all the ethnic
differences in intelligence evaporated overnight, most of the intellec-
tual variation in America would endure. The remaining inequality
would still strain the political process, because differences in cognitive
ability are problematic even in ethnically homogeneous societies. The
chapters in Part 11, looking only at whites, should have made that clear.
But the politics of cognitive inequality get hotter-sometimes
too hot
to handle-when
they are attached to the politics of ethnicity. We be-
lieve that the best way to keep the temperature down is to work through
the main facts carefully and methodically. This chapter first reviews the
evidence bearing on ethnic differences in cognitive ability, then turns
to whether the differences originate in genes or in environments. At
the chapter's end, we summarize what this knowledge about ethnic dif-
ferences means in practical terms.
We frequently use the word ethnic rather than race, because race is
such a difficult concept to employ in the American context."' What
does it mean to be "black" in America, in racial terms, when the word
black (or African-American) can be used for people whose ancestry is
more European than African? How are we to classify a person whose
parents hail from Panama but whose ancestry is predominantly African?
Is he a Latino? A black? The rule we follow here is to classify people ac-
cording to the way they classify themselves. The studies of "blacks" or
"Latinos" or "Asians" who live in America generally denote people who
say they are black, Latino, or Asian-no
more, no less.
Ethnic Nomenclature
We want to call people whatever they prefer to be called, including their
preferences for ethnic labels. As we write, however, there are no hard-and-
fast rules. People from Latin America wish to he known according to their
national origin: Cuban-American, Mexican-American, Puerto Rican, and
so forth. Hispanic is still the U.S. government's official label, hut Latino has
gained favor in recent years. We use Latino. Opting for common usage and
simplicity, we usually use black instead of Afican-American and white
(which always refers to non-Latino whites) instead of European-American
or Anglo. Americans of Asian descent are called Asian when the context
leaves no possibility of confusion with Asians living in Asia. We shift to
the hyphenated versions for everyone when it would avoid such confusions
or when, for stylistic reasons, the hyphenated versions seem appropriate.
Ethnic Differences in Cognitive Ability
- The authors establish a terminological framework for discussing racial groups, using 'white' for non-Latino whites and 'East Asian' for Japanese, Chinese, and Korean populations.
- The text asserts that biological differences between races are a natural rule rather than an exception, challenging the 'intellectual fashion' that denies all differences except physical appearance.
- A significant focus is placed on the 'black-white difference' due to its social ramifications, though the text notes a rising public interest in Asian cognitive performance.
- Data from researcher Richard Lynn suggests that East Asians in both Asia and North America typically score higher on IQ tests than white Americans.
- Studies of Chinese students in Hong Kong and South Korean children indicate IQ medians ranging from 103 to 110, compared to a white American mean of 101 to 102.
- The authors argue that racial differences are complex and contribute to the adaptability and interest of the human species.
Intellectual fashion has dictated that all differences must be denied except the absolutely undeniable differences in appearance, but nothing in biology says this should be so.
270
The National Context
Ethnic Differences in Coffnitive Ability
27 1
an increasing number of high scores. Improvements in the economic circum-
stances of blacks, in the quality of the schools they attend, in better public
health, and perhags also diminishing racism may be narrowing the gap.
The debate about whether and how much gnes and environment have to
do with ethnic differences remains unresolved. The universality of the con-
trast in nonverbal and verbal skills between East Asians and European whites
suggests, without quite proving, genetic roots. Another line of evidence point-
ing toward a genetic factor in cognitive ethnic differences is that blacks and
whites differ most on the tests that are the best measures of g, or general in-
telligence. On the other hand, the scores on even highly g-loaded tests can be
influenced to some extent by changing environmental factors over the course
of a decade or less. Beyond that, some social scientists have challenged the
premise that intelligence tests have the same meaning for people who live in
different cultural settings or whose forebears had very different histories.
Nothing seems more fearsome to many commentators than the possibility
that ethnic and race differences have any genetic component at all. This be-
liefis a fundamental ewm. Even if the differences between races were entirely
genetic (which they surely are not), it should make no practical difference in
how individuals deal with each other. The real danger is that the elite wisdom
on ethnic differences-that
such differences cannot exist--will shift to oppo-
site and equally unjustified extremes. Open and informed discussion is the one
certain way to protect society from the dangers of one extreme view or the
other.
E
thnic differences in measured cognitive ability have been found
since intelligence tests were invented. The battle over the meaning
of these differences is largely responsible for today's controversy over in-
telligence testing itself. That many readers have turned first to this chap-
ter indicates how sensitive the issue has become.
Our primary purpose is to lay out a set of statements, as precise as the
state of knowledge permits, ahout what is currently known about the
size, nature, validity, and persistence of ethnic differences on measures
of cognitive ability. A secondary purpose is to try to induce clarity in
ways of thinking about ethnic differences, for discussions about such dif-
ferences tend to run away with themselves, blending issues of fact, the-
ory, ethics, and public policy that need to be separated.
The first thing to remember is that the differences among individu-
als are far greater than the differences between groups. If all the ethnic
differences in intelligence evaporated overnight, most of the intellec-
tual variation in America would endure. The remaining inequality
would still strain the political process, because differences in cognitive
ability are problematic even in ethnically homogeneous societies. The
chapters in Part 11, looking only at whites, should have made that clear.
But the politics of cognitive inequality get hotter-sometimes
too hot
to handle-when
they are attached to the politics of ethnicity. We be-
lieve that the best way to keep the temperature down is to work through
the main facts carefully and methodically. This chapter first reviews the
evidence bearing on ethnic differences in cognitive ability, then turns
to whether the differences originate in genes or in environments. At
the chapter's end, we summarize what this knowledge about ethnic dif-
ferences means in practical terms.
We frequently use the word ethnic rather than race, because race is
such a difficult concept to employ in the American context."' What
does it mean to be "black" in America, in racial terms, when the word
black (or African-American) can be used for people whose ancestry is
more European than African? How are we to classify a person whose
parents hail from Panama but whose ancestry is predominantly African?
Is he a Latino? A black? The rule we follow here is to classify people ac-
cording to the way they classify themselves. The studies of "blacks" or
"Latinos" or "Asians" who live in America generally denote people who
say they are black, Latino, or Asian-no
more, no less.
Ethnic Nomenclature
We want to call people whatever they prefer to be called, including their
preferences for ethnic labels. As we write, however, there are no hard-and-
fast rules. People from Latin America wish to he known according to their
national origin: Cuban-American, Mexican-American, Puerto Rican, and
so forth. Hispanic is still the U.S. government's official label, hut Latino has
gained favor in recent years. We use Latino. Opting for common usage and
simplicity, we usually use black instead of Afican-American and white
(which always refers to non-Latino whites) instead of European-American
or Anglo. Americans of Asian descent are called Asian when the context
leaves no possibility of confusion with Asians living in Asia. We shift to
the hyphenated versions for everyone when it would avoid such confusions
or when, for stylistic reasons, the hyphenated versions seem appropriate.
2 7 2
The National Context
Ethnic Differences in Cognitive Ability
273
It would be disingenuous to leave the racial issue at that, however,
for race is often on people's minds when they think about IQ. Thus we
will eventually comment on cognitive differences among races as they
might derive from genetic differences, telling a story that is interesting
but still riddled with more questions than answers. This prompts a sec-
ond point to be understood at the outset: There are differences between
races, and they are the rule, not the exception. That assertion may seem
controversial to some readers, but it verges on tautology: Races are by
definition groups of people who differ in characteristic ways. Intellec-
tual fashion has dictated that all differences must be denied except the
absolutely undeniable differences in appearance, but nothing in biology
says this should be so. On the contrary, race differences are varied and
complex-and
they make the human species more adaptable and more
interesting.
THE TESTED INTELLIGENCE OF ASIANS, BLACKS, AND
WHITES
So much for preliminaries. Answers to commonly asked questions about
the ethnic groups in America follow, beginning with the basics and
moving into successively more complicated issues. The black-white dif-
ference receives by far the most detailed examination because it is the
most controversial and has the widest social ramifications. But the most
common question we have been asked in recent years has not been ahout
blacks hut about Asians, as Americans have watched the spectacular
economic success of the Pacific rim nations at a distance and, closer to
home, become accustomed to seeing Asian immigrant children col-
lecting top academic honors in America's schools.
Do Asians Have Higher 1Qs Than Whites?
Probably yes, if Asian refers to the Japanese and Chinese (and perhaps
also Koreans), whom we will refer to here as East Asians. How much
higher is still unclear. Richard Lynn, a leading scholar of racial and eth-
nic differences, has reviewed the assembled data on overall Asian IQ in
two major articles. In his 1991 review of the literature, he put the me-
dian IQ for the studies of Chinese living in Hong Kong, Singapore, Tai-
wan, and China proper at l 10; the median IQ for the studies of Japanese
living in Japan at 103; and the median for studies of East Asians living
in North America at 103.' But as Lynn acknowledges, these compar-
isons are imprecise because the IQs were not corrected for the changes
that have been observed over time in national IQ averages. In Lynn's
1987 compilation, where such corrections were made, the medians for
both Chinese and Japanese were 103.3 Mean white American IQ is typ-
ically estimated as 101 to 102.~
Additional studies of Chinese in Hong
Kong, conducted by J. W. C. Chan using the Ravens Standard Progres-
sive Matrices, a nonverbal test that is a n especially good measure of g,
found IQ equivalents in the region of 110 for both elementary and sec-
ondary students, compared to about 100 for whites in Hong Kong.' An-
other study postdating Lynn's review compared representative samples
of South Korean and British 9-year-olds and found an IQ difference of
nine points.6
The most extensive compilation of East Asian cognitive performance
in North America, by Philip Vemon, included no attempt to strike an
overall estimate for the current gap between the races, but he did draw
conclusions about East Asian-white differences in verbal and nonver-
ha1 abilities, which we will describe later in the chapter.' In addition to
studies of abilities, Vemon compiled extensive data on the schoolwork
of East Asians, documenting their superior performance by a variety of
measures ranging from grades to the acquisition of the Ph.D. Is this su-
perior performance caused by superior IQ? James Flynn has argued that
the real explanation for the success of Asian-Americans is that they are
overachievers.%e also says that Asian-Americans actually have the
same nonverbal intelligence as whites and a fractionally lower verbal
intelligence.' Richard Lynn disagrees and concludes from the same data
used by Flynn that there is an ethnic difference in overall IQ as well."
The NLSY is not much help on this issue. The sample contained only
forty-two East Asians (Chinese, Japanese, and Koreans). Their mean
IQ was 106, compared to the European-American white mean of 103,
consistent with the evidence that East Asians have a higher IQ than
whites but based on such a small sample that not much can be made
of it.
The indeterminancy of the debate is predictable. The smaller the IQ
difference, the more questionable its reality, and this has proved to be
the case with the East Asian-white difference. It is difficult enough to
find two sets of subjects within a single city who can be compared with-
out problems of interpretation. Can one compare test scores obtained
in different years with different tests for students of different ages in dif-
ferent cultural settings, drawn from possibly different socioeconomic
East Asian Cognitive Performance Debates
- Researchers like Vernon and Lynn document superior academic and IQ performance among East Asians compared to whites.
- James Flynn challenges the IQ-based explanation, suggesting Asian-American success is driven by overachievement rather than higher innate intelligence.
- The National Longitudinal Survey of Youth (NLSY) data on East Asians is inconclusive due to a very small sample size of only forty-two individuals.
- Cross-national comparisons are complicated by differences in testing years, cultural settings, and socioeconomic status among subjects.
- Specific studies using identical tests show mixed results, with some finding large gaps in spatial reasoning and others finding no significant difference when socioeconomic variables are matched.
- The debate remains unsettled as experts continue to disagree on whether observed differences are due to ethnic IQ variations or environmental factors.
The smaller the IQ difference, the more questionable its reality, and this has proved to be the case with the East Asian-white difference.
2 7 2
The National Context
Ethnic Differences in Cognitive Ability
273
It would be disingenuous to leave the racial issue at that, however,
for race is often on people's minds when they think about IQ. Thus we
will eventually comment on cognitive differences among races as they
might derive from genetic differences, telling a story that is interesting
but still riddled with more questions than answers. This prompts a sec-
ond point to be understood at the outset: There are differences between
races, and they are the rule, not the exception. That assertion may seem
controversial to some readers, but it verges on tautology: Races are by
definition groups of people who differ in characteristic ways. Intellec-
tual fashion has dictated that all differences must be denied except the
absolutely undeniable differences in appearance, but nothing in biology
says this should be so. On the contrary, race differences are varied and
complex-and
they make the human species more adaptable and more
interesting.
THE TESTED INTELLIGENCE OF ASIANS, BLACKS, AND
WHITES
So much for preliminaries. Answers to commonly asked questions about
the ethnic groups in America follow, beginning with the basics and
moving into successively more complicated issues. The black-white dif-
ference receives by far the most detailed examination because it is the
most controversial and has the widest social ramifications. But the most
common question we have been asked in recent years has not been ahout
blacks hut about Asians, as Americans have watched the spectacular
economic success of the Pacific rim nations at a distance and, closer to
home, become accustomed to seeing Asian immigrant children col-
lecting top academic honors in America's schools.
Do Asians Have Higher 1Qs Than Whites?
Probably yes, if Asian refers to the Japanese and Chinese (and perhaps
also Koreans), whom we will refer to here as East Asians. How much
higher is still unclear. Richard Lynn, a leading scholar of racial and eth-
nic differences, has reviewed the assembled data on overall Asian IQ in
two major articles. In his 1991 review of the literature, he put the me-
dian IQ for the studies of Chinese living in Hong Kong, Singapore, Tai-
wan, and China proper at l 10; the median IQ for the studies of Japanese
living in Japan at 103; and the median for studies of East Asians living
in North America at 103.' But as Lynn acknowledges, these compar-
isons are imprecise because the IQs were not corrected for the changes
that have been observed over time in national IQ averages. In Lynn's
1987 compilation, where such corrections were made, the medians for
both Chinese and Japanese were 103.3 Mean white American IQ is typ-
ically estimated as 101 to 102.~
Additional studies of Chinese in Hong
Kong, conducted by J. W. C. Chan using the Ravens Standard Progres-
sive Matrices, a nonverbal test that is a n especially good measure of g,
found IQ equivalents in the region of 110 for both elementary and sec-
ondary students, compared to about 100 for whites in Hong Kong.' An-
other study postdating Lynn's review compared representative samples
of South Korean and British 9-year-olds and found an IQ difference of
nine points.6
The most extensive compilation of East Asian cognitive performance
in North America, by Philip Vemon, included no attempt to strike an
overall estimate for the current gap between the races, but he did draw
conclusions about East Asian-white differences in verbal and nonver-
ha1 abilities, which we will describe later in the chapter.' In addition to
studies of abilities, Vemon compiled extensive data on the schoolwork
of East Asians, documenting their superior performance by a variety of
measures ranging from grades to the acquisition of the Ph.D. Is this su-
perior performance caused by superior IQ? James Flynn has argued that
the real explanation for the success of Asian-Americans is that they are
overachievers.%e also says that Asian-Americans actually have the
same nonverbal intelligence as whites and a fractionally lower verbal
intelligence.' Richard Lynn disagrees and concludes from the same data
used by Flynn that there is an ethnic difference in overall IQ as well."
The NLSY is not much help on this issue. The sample contained only
forty-two East Asians (Chinese, Japanese, and Koreans). Their mean
IQ was 106, compared to the European-American white mean of 103,
consistent with the evidence that East Asians have a higher IQ than
whites but based on such a small sample that not much can be made
of it.
The indeterminancy of the debate is predictable. The smaller the IQ
difference, the more questionable its reality, and this has proved to be
the case with the East Asian-white difference. It is difficult enough to
find two sets of subjects within a single city who can be compared with-
out problems of interpretation. Can one compare test scores obtained
in different years with different tests for students of different ages in dif-
ferent cultural settings, drawn from possibly different socioeconomic
274
The National Context
Ethnic Differences in Cognitive Ability
275
1
populations? One answer is that it can be done through techniques that
take advantage of patterns observed over many studies. Lynn in partic-
ular has responded to each new critique, in some cases providing new
data, in others refining earlier estimates, and always pointing to the
striking similarity of the results despite the disparity of the tests and set-
tings.'' But given the complexities of crossnational comparisons, the is-
sue must eventually be settled by a sufficient body of data obtained from
identical tests administered to populations that are comparable except
for race.
We have been able to identify three such efforts. In one, samples of
American, British, and Japanese students ages 13 to 15 were adminis-
tered a test of abstract reasoning and spatial relations. The American
and British samples had scores within a point of the standardized mean
of 100 on both the abstract and spatial relations components of the test;
the Japanese adolescents scored 104.5 on the test for abstract reasoning
and 114 on the test for spatial relations-a
large difference, amounting
to a gap similar to the one found by Vernon for Asians in America.12
In a second set of studies, 9-year-olds in Japan, Hong Kong, and
Britain, drawn from comparable socioeconomic populations, were ad-
ministered the Ravens Standard Progressive Matrices. The children
from Hong Kong averaged 113; from Japan, 110; and from Britain,
100-a
gap of well over half a standard deviation between both the
Japanese and Hong Kong samples and a British one equated for age and
socioeconomic status. 13
The third set of studies, directed by Harold Stevenson, administered
a battery of mental tests to elementary school children in Japan, Tai-
wan, and Minneapolis, Minnesota. The key difference between this
study and the other two was that Stevenson and his colleagues carefully
matched the children on socioeconomic and demographic variables.14
No significant difference in overall IQ was found, and Stevenson and
colleagues concluded that "this study offers no support for the argument
that there are differences in the general cognitive functioning of Chi-
nese, Japanese, and American children."[15'
Where does this leave us? The parties in the debate are often indi-
vidually confident, and you will find in their articles many flat state-
ments that an overall East Asian-white IQ difference does, or does not,
exist. We will continue to hedge. Harold Stevenson and his colleagues
have convinced us that matching subjects by socioeconomic status can
reduce the difference to near zero, but he has not convinced us that
Jews, Latinos, and Gender
In the text we focus on three major racial-ethnic groupings-whites, East
Asians, and black-because
they have dominated both the research and
contentions regarding intelligence. But whenever the subject of group dif-
ferences in IQ comes up, three other questions are sure to be asked: Are
Jews really smarter than everyone else? Where do Latinos fit In, compared
to whites and blacks? What about women versus men?
Jews-specifically,
Ashkenazi Jews of European origins-test
higher
than any other ethnic group.16A fair estimate seems to be that Jews in
America and Britain have an overall IQ mean somewhere between a half
and a full standard deviation above the mean, with the source of the dif.
ference concentrated in the verbal component. In the NLSY, ninety-eight
whites with IQ scores identified themselves as Jews. The NLSY did not try
to ensure representativeness within ethnic groups other than blacks and
Latinos, so we cannot be sure that the ninety-eight Jews in the sample are
nationally representative. But it is at least worth noting that their mean
IQ was .97 standard deviation above the mean of the rest of the popula-
tion and .84 standard deviation above the mean of whites who identified
themselves as Christian. These tests results are matched by analyses of oc-
cupational and scientific attainment by Jews, which consistently show
their disproportionate level of success, usually by orders of magnitude, in
various inventories of scientific and artistic achievement.17
The term Latino embraces people with highly disparate cultural her-
itages and a wide range of racial stocks. Many of these groups are known
to differ markedly in their social and economic profiles. Add to that the
problem of possible language difficulties with the tests, and generalizations
about IQ become especially imprecise for Latinos. With that in mmd, it
may be said that their test results generally fall about half to one standard
deviation below the national mean. In the NLSY, the disparity with whites
was .93 standard deviation. This may be compared to an overall average
difference of .84 standard deviation between whites and Mexican-Ameri-
cans found in the 1960s on the tests used in the famous Coleman report
(described in Chapter 17).18 We will have more to say about the interpre-
tation of Latino scores with regard to possible language bias in Chapter 14.
When it comes to gender, the consistent story has been that men and
women have nearly identical mean IQs but that men have a broader distri-
bution. In the NLSY, for example, women had a mean on the Armed Forces
Qualification Test (AFQT) that was -06 standard deviation lower than the
male mean and a standard deviation that was .ll narrower. For the Wech-
sler Intelligence Scale for Children, the average boy tests 1.8 IQ points
higher than the average girl, and boys have a standard deviation that is .8
point larger than girls.'9 The larger variation among men means that there
are more men than women at either extreme of the IQ distribution.
Group Differences in Cognitive Ability
- The authors conclude that East Asian populations likely possess a mean IQ approximately three points higher than the white mean.
- Ashkenazi Jews of European origin demonstrate the highest mean IQ of any ethnic group, particularly in verbal components, scoring nearly a full standard deviation above the general population.
- Jewish success in scientific and artistic fields is noted as being disproportionately high, often by orders of magnitude compared to other groups.
- Latino IQ scores generally fall between a half and one standard deviation below the national mean, though results are complicated by diverse cultural heritages and potential language biases.
- Gender comparisons reveal nearly identical mean IQs, but men exhibit a broader distribution, resulting in more men at the extreme high and low ends of the spectrum.
These tests results are matched by analyses of occupational and scientific attainment by Jews, which consistently show their disproportionate level of success, usually by orders of magnitude, in various inventories of scientific and artistic achievement.
274
The National Context
Ethnic Differences in Cognitive Ability
275
1
populations? One answer is that it can be done through techniques that
take advantage of patterns observed over many studies. Lynn in partic-
ular has responded to each new critique, in some cases providing new
data, in others refining earlier estimates, and always pointing to the
striking similarity of the results despite the disparity of the tests and set-
tings.'' But given the complexities of crossnational comparisons, the is-
sue must eventually be settled by a sufficient body of data obtained from
identical tests administered to populations that are comparable except
for race.
We have been able to identify three such efforts. In one, samples of
American, British, and Japanese students ages 13 to 15 were adminis-
tered a test of abstract reasoning and spatial relations. The American
and British samples had scores within a point of the standardized mean
of 100 on both the abstract and spatial relations components of the test;
the Japanese adolescents scored 104.5 on the test for abstract reasoning
and 114 on the test for spatial relations-a
large difference, amounting
to a gap similar to the one found by Vernon for Asians in America.12
In a second set of studies, 9-year-olds in Japan, Hong Kong, and
Britain, drawn from comparable socioeconomic populations, were ad-
ministered the Ravens Standard Progressive Matrices. The children
from Hong Kong averaged 113; from Japan, 110; and from Britain,
100-a
gap of well over half a standard deviation between both the
Japanese and Hong Kong samples and a British one equated for age and
socioeconomic status. 13
The third set of studies, directed by Harold Stevenson, administered
a battery of mental tests to elementary school children in Japan, Tai-
wan, and Minneapolis, Minnesota. The key difference between this
study and the other two was that Stevenson and his colleagues carefully
matched the children on socioeconomic and demographic variables.14
No significant difference in overall IQ was found, and Stevenson and
colleagues concluded that "this study offers no support for the argument
that there are differences in the general cognitive functioning of Chi-
nese, Japanese, and American children."[15'
Where does this leave us? The parties in the debate are often indi-
vidually confident, and you will find in their articles many flat state-
ments that an overall East Asian-white IQ difference does, or does not,
exist. We will continue to hedge. Harold Stevenson and his colleagues
have convinced us that matching subjects by socioeconomic status can
reduce the difference to near zero, but he has not convinced us that
Jews, Latinos, and Gender
In the text we focus on three major racial-ethnic groupings-whites, East
Asians, and black-because
they have dominated both the research and
contentions regarding intelligence. But whenever the subject of group dif-
ferences in IQ comes up, three other questions are sure to be asked: Are
Jews really smarter than everyone else? Where do Latinos fit In, compared
to whites and blacks? What about women versus men?
Jews-specifically,
Ashkenazi Jews of European origins-test
higher
than any other ethnic group.16A fair estimate seems to be that Jews in
America and Britain have an overall IQ mean somewhere between a half
and a full standard deviation above the mean, with the source of the dif.
ference concentrated in the verbal component. In the NLSY, ninety-eight
whites with IQ scores identified themselves as Jews. The NLSY did not try
to ensure representativeness within ethnic groups other than blacks and
Latinos, so we cannot be sure that the ninety-eight Jews in the sample are
nationally representative. But it is at least worth noting that their mean
IQ was .97 standard deviation above the mean of the rest of the popula-
tion and .84 standard deviation above the mean of whites who identified
themselves as Christian. These tests results are matched by analyses of oc-
cupational and scientific attainment by Jews, which consistently show
their disproportionate level of success, usually by orders of magnitude, in
various inventories of scientific and artistic achievement.17
The term Latino embraces people with highly disparate cultural her-
itages and a wide range of racial stocks. Many of these groups are known
to differ markedly in their social and economic profiles. Add to that the
problem of possible language difficulties with the tests, and generalizations
about IQ become especially imprecise for Latinos. With that in mmd, it
may be said that their test results generally fall about half to one standard
deviation below the national mean. In the NLSY, the disparity with whites
was .93 standard deviation. This may be compared to an overall average
difference of .84 standard deviation between whites and Mexican-Ameri-
cans found in the 1960s on the tests used in the famous Coleman report
(described in Chapter 17).18 We will have more to say about the interpre-
tation of Latino scores with regard to possible language bias in Chapter 14.
When it comes to gender, the consistent story has been that men and
women have nearly identical mean IQs but that men have a broader distri-
bution. In the NLSY, for example, women had a mean on the Armed Forces
Qualification Test (AFQT) that was -06 standard deviation lower than the
male mean and a standard deviation that was .ll narrower. For the Wech-
sler Intelligence Scale for Children, the average boy tests 1.8 IQ points
higher than the average girl, and boys have a standard deviation that is .8
point larger than girls.'9 The larger variation among men means that there
are more men than women at either extreme of the IQ distribution.
276
The National Context
Ethnic Differences in Cognitive Ability
277
matching by socioeconomic status is a good idea if one wants to know
an estimate of the overall difference between East Asians and whites
(we will return to the question of matching by socioeconomic status
when we discuss comparisons between blacks and whites). In our judg-
ment, the balance of the evidence supports the proposition that the
overall East Asian mean is higher than the white mean. If we had to put
a number on it, three IQ points currently most resembles a consensus,
tentative though it still is. East Asians have a greater advantage than
that in a particular kind of nonverbal intelligence, described later in the
chapter.
Do Blacks Score Differently from Whites on Standardized Tests of
Cognitive Ability?
If the samples are chosen to be representative of the American popula-
tion, the answer has been yes for every known test of cognitive ability
that meets hasic psychometric standards of reliability and ~alidit~.'~'The
answer is also yes for almost all of the studies in which the black and
white samples are matched on some special characteristics-samples
of
juvenile delinquents, for example, or of graduate students-but
there
are exceptions. The implication of this effect of selecting the groups to
be compared is discussed later in the chapter. Since hlack-white differ-
ences are the ones that strain discourse most severely, we will probe
deeply into the evidence and its meaning.
How Large 1s the Black-White Difference?
The usual answer to this question is one standard deviation." In dis-
cussing IQ tests, for example, the black mean is commonly given as 85,
the white mean as 100, and the standard deviation as 15. But the dif-
ferences observed in any given study seldom conform exactly to one
standard deviation. The figure below shows the distribution of the
black-white difference (subsequently abbreviated as the "R/W differ-
ence") expressed in standard deviations, in the American studies con-
ducted in this century that have reported the IQ means of a black sample
and a white sample and meet basic requirements of interpretability as
described in the note.12" A total of 156 studies are represented in the
plot, and the mean B/W difference is 1.08 standard deviations, or about
sixteen IQ
The spread of results is substantial, however, re-
flecting the diversity of the age of the subjects, their geographic loca-
Overview of studies of reporting black-white differences in
cognitive test scores, 1 9 18-1990
Number of studies
20 -
0.0
0.5
1 .O
1.5
2.0
Magnitude of the black-white difference in test scores,
in standard deviations
Sour~~s:
Shuey 1966; Oshorrle and McGurk 1982; Sattler 1988; Vincent 1991; Jensen 1985,
1993h.
tion, their background characteristics, the tests themselves, and sam-
pling error.
When we focus on the studies that meet stricter criteria, the range of
values for the R/W difference narrows accord~ngly. The range of results
is considerably reduced, for example, for studies that have taken place
since 1940 (after testing's most formative period), outside the South
(where the largest B/W differences are found), with subjects older than
age 6 (after scores have become more stable), using full test batteries
from one of the major IQ tests, and with standard deviations reported
for that specific test administration. Of the forty-five studies meeting
these criteria, all but nine of the B/W differences are clustered between
.5 and 1.5 standard deviations. The mean difference was 1.06 standard
deviations, and all but eight of the thirty-one reported a R/W difference
greater than .8 standard deviation.
Still more rigorous selection criteria do not diminish the size of the
gap. For example, with tests given outside the South only after 1960,
when people were increasingly sensitized to racial issues, the number of
studies is reduced to twenty-four, but the mean difference is 1.10 stan-
dard deviations. The NLSY, administered in 1980 to by far the largest
Black-White Cognitive Test Differences
- The text examines historical data regarding standardized cognitive test score gaps between black and white populations in America.
- A meta-analysis of 156 studies conducted between 1918 and 1990 shows a mean difference of approximately 1.08 standard deviations, or 16 IQ points.
- The authors note that while results vary based on geography and age, the gap persists even when samples are matched for specific characteristics like graduate student status.
- Applying stricter criteria—such as excluding Southern states or focusing on post-1960 data—does not significantly diminish the observed statistical gap.
- The 1980 NLSY study, featuring a large national sample, reported a difference of 1.21 standard deviations on the Armed Forces Qualification Test.
Since hlack-white differences are the ones that strain discourse most severely, we will probe deeply into the evidence and its meaning.
276
The National Context
Ethnic Differences in Cognitive Ability
277
matching by socioeconomic status is a good idea if one wants to know
an estimate of the overall difference between East Asians and whites
(we will return to the question of matching by socioeconomic status
when we discuss comparisons between blacks and whites). In our judg-
ment, the balance of the evidence supports the proposition that the
overall East Asian mean is higher than the white mean. If we had to put
a number on it, three IQ points currently most resembles a consensus,
tentative though it still is. East Asians have a greater advantage than
that in a particular kind of nonverbal intelligence, described later in the
chapter.
Do Blacks Score Differently from Whites on Standardized Tests of
Cognitive Ability?
If the samples are chosen to be representative of the American popula-
tion, the answer has been yes for every known test of cognitive ability
that meets hasic psychometric standards of reliability and ~alidit~.'~'The
answer is also yes for almost all of the studies in which the black and
white samples are matched on some special characteristics-samples
of
juvenile delinquents, for example, or of graduate students-but
there
are exceptions. The implication of this effect of selecting the groups to
be compared is discussed later in the chapter. Since hlack-white differ-
ences are the ones that strain discourse most severely, we will probe
deeply into the evidence and its meaning.
How Large 1s the Black-White Difference?
The usual answer to this question is one standard deviation." In dis-
cussing IQ tests, for example, the black mean is commonly given as 85,
the white mean as 100, and the standard deviation as 15. But the dif-
ferences observed in any given study seldom conform exactly to one
standard deviation. The figure below shows the distribution of the
black-white difference (subsequently abbreviated as the "R/W differ-
ence") expressed in standard deviations, in the American studies con-
ducted in this century that have reported the IQ means of a black sample
and a white sample and meet basic requirements of interpretability as
described in the note.12" A total of 156 studies are represented in the
plot, and the mean B/W difference is 1.08 standard deviations, or about
sixteen IQ
The spread of results is substantial, however, re-
flecting the diversity of the age of the subjects, their geographic loca-
Overview of studies of reporting black-white differences in
cognitive test scores, 1 9 18-1990
Number of studies
20 -
0.0
0.5
1 .O
1.5
2.0
Magnitude of the black-white difference in test scores,
in standard deviations
Sour~~s:
Shuey 1966; Oshorrle and McGurk 1982; Sattler 1988; Vincent 1991; Jensen 1985,
1993h.
tion, their background characteristics, the tests themselves, and sam-
pling error.
When we focus on the studies that meet stricter criteria, the range of
values for the R/W difference narrows accord~ngly. The range of results
is considerably reduced, for example, for studies that have taken place
since 1940 (after testing's most formative period), outside the South
(where the largest B/W differences are found), with subjects older than
age 6 (after scores have become more stable), using full test batteries
from one of the major IQ tests, and with standard deviations reported
for that specific test administration. Of the forty-five studies meeting
these criteria, all but nine of the B/W differences are clustered between
.5 and 1.5 standard deviations. The mean difference was 1.06 standard
deviations, and all but eight of the thirty-one reported a R/W difference
greater than .8 standard deviation.
Still more rigorous selection criteria do not diminish the size of the
gap. For example, with tests given outside the South only after 1960,
when people were increasingly sensitized to racial issues, the number of
studies is reduced to twenty-four, but the mean difference is 1.10 stan-
dard deviations. The NLSY, administered in 1980 to by far the largest
278
The Nationul Context
sample (6,502 whites, 3,022 blacks) in a national study, found a differ-
ence of 1.2 1 standard deviations on the AFQT.14
Computing the B/W Difference
The simplest way to compute the B/W difference when limited informa-
tion is available is to take the two means and to compare them uslng the
standard deviation for the reference population, defined in this case as
whites. This is how the differences in the figure on page 277 showing the
results of 156 studies were computed. When all the data are available, how-
ever, as in the case of the NLSY, a more accurate method is available, wh~ch
takes into account the standard deviations within each population and the
relative size of the samples. The equation is given in the note.1251
Unless
otherwise specified, all of the subsequent expressions of the B/W' cliffer-
ences are based on this method. (For more about the scoring of IQs in the
NLSY, see Appendix 2.)
Answering the question "How large is the difference!" in terms of
standard deviations does not convey an intuitive sense of the size of the
gap. A rough-and-ready way of thinking about the size of the gap is to
recall that one standard deviation above and below the mean cuts off
the 84th and 16th percentiles of a normal distribution. In the case of
the B/W difference of 1.2 standard deviations found in the NLSY, a
person with the black mean was at the 11 th percentile of the white dis-
tribution, and a person with the white mean was at the 91st percentile
of the black distribution.
A difference of this magnitude should be thought of in several differ-
ent ways, each with its own important implications. Recall first that the
American black population numbers more than 30 million people. If the
resutts from the NLSY apply to the total black population as of the 1990s,
around 100,000 blacks fall into Class 1 of our five cognitive classes, with
IQs of 125 or higher.2Qne hundred thousand people is a lot of people.
It should be no surprise to see (as one does every day) blacks function-
ing at high levels in every intellectually challenging field.
It is important to understand as well that a difference of 1.2 standard
deviations means considerable overlap in the cognitive ability distrib-
ution for blacks and whites, as shown for the NLSY population in the
figure below. For any equal number of blacks and whites, a large pro-
Ethnic Differences in Cognitive Ability
279
The black and white IQ distributions in the NLSY, Version I
Frequency distributions for populations of equal size
portion have IQs that can be matched up. This is the distribution to
keep in mind whenever thinking about individuals.
Rut an additional complication has to be taken into account: In the
United States, there are about six whites for every black. This means
that the 1Q overlap of the two populations as they actually exist in the
United States looks very different from the overlap in the figure just
above. The next figure presents the same data from the NLSY when the
distributions are shown in proportion to the actual population of young
The black and white IQ distributions in the NLSY, Version I1
Frequency distributions proportional to the
ethnic composition of the U.S. population
Quantifying Ethnic IQ Differences
- The text utilizes data from the National Longitudinal Survey of Youth (NLSY) to calculate a black/white IQ gap of 1.2 standard deviations.
- This statistical gap places the mean black score at the 11th percentile of the white distribution and the mean white score at the 91st percentile of the black distribution.
- Despite the gap, the author notes that approximately 100,000 black Americans possess IQs of 125 or higher, explaining their presence in high-level intellectual fields.
- The text emphasizes that while distributions overlap significantly, the 6-to-1 ratio of whites to blacks in the U.S. population creates massive disproportions at the higher end of the IQ scale.
- The author raises the question of whether these observed differences are authentic or the result of cultural bias and artifacts within the testing process.
To the extent that the difference represents an authentic difference in cognitive functioning, the social consequences are potentially huge as well.
278
The Nationul Context
sample (6,502 whites, 3,022 blacks) in a national study, found a differ-
ence of 1.2 1 standard deviations on the AFQT.14
Computing the B/W Difference
The simplest way to compute the B/W difference when limited informa-
tion is available is to take the two means and to compare them uslng the
standard deviation for the reference population, defined in this case as
whites. This is how the differences in the figure on page 277 showing the
results of 156 studies were computed. When all the data are available, how-
ever, as in the case of the NLSY, a more accurate method is available, wh~ch
takes into account the standard deviations within each population and the
relative size of the samples. The equation is given in the note.1251
Unless
otherwise specified, all of the subsequent expressions of the B/W' cliffer-
ences are based on this method. (For more about the scoring of IQs in the
NLSY, see Appendix 2.)
Answering the question "How large is the difference!" in terms of
standard deviations does not convey an intuitive sense of the size of the
gap. A rough-and-ready way of thinking about the size of the gap is to
recall that one standard deviation above and below the mean cuts off
the 84th and 16th percentiles of a normal distribution. In the case of
the B/W difference of 1.2 standard deviations found in the NLSY, a
person with the black mean was at the 11 th percentile of the white dis-
tribution, and a person with the white mean was at the 91st percentile
of the black distribution.
A difference of this magnitude should be thought of in several differ-
ent ways, each with its own important implications. Recall first that the
American black population numbers more than 30 million people. If the
resutts from the NLSY apply to the total black population as of the 1990s,
around 100,000 blacks fall into Class 1 of our five cognitive classes, with
IQs of 125 or higher.2Qne hundred thousand people is a lot of people.
It should be no surprise to see (as one does every day) blacks function-
ing at high levels in every intellectually challenging field.
It is important to understand as well that a difference of 1.2 standard
deviations means considerable overlap in the cognitive ability distrib-
ution for blacks and whites, as shown for the NLSY population in the
figure below. For any equal number of blacks and whites, a large pro-
Ethnic Differences in Cognitive Ability
279
The black and white IQ distributions in the NLSY, Version I
Frequency distributions for populations of equal size
portion have IQs that can be matched up. This is the distribution to
keep in mind whenever thinking about individuals.
Rut an additional complication has to be taken into account: In the
United States, there are about six whites for every black. This means
that the 1Q overlap of the two populations as they actually exist in the
United States looks very different from the overlap in the figure just
above. The next figure presents the same data from the NLSY when the
distributions are shown in proportion to the actual population of young
The black and white IQ distributions in the NLSY, Version I1
Frequency distributions proportional to the
ethnic composition of the U.S. population
280
The National Context
Ethnic Differences in Cognitive Ability
28 1
people represented in the NLSY. This figure shows why a B/W differ-
ence can be problematic to American society as a whole. At the lower
end of the IQ range, there are approximately equal numbers of blacks
and whites. But throughout the upper half of the range, the dispropor-
tions between the number of whites and blacks at any given IQ level
are huge. To the extent that the difference represents an authentic dif-
ference in cognitive functioning, the social consequences are poten-
tially huge as well. But is the difference authentic?
Are the Differences in Black and White Scores Attributable to Cultural
Bias or Other Artifacts of the Test?
Appendix 5 contains a discussion of the state of knowledge regarding
test bias. Here, we shall quickly review the basic findings regarding
blacks, without repeating the citations in Appendix 5, which we urge
you to read.
EXTERNAL EVIDENCE
OF BIAS. Tests are used to predict things-most
commonly, to predict performance in school or on the job. Chapter 3
discussed this issue in detail. You will recall that the ability of a test to
predict is known as its validity. A test with high validity predicts ac-
curately; a test with poor validity makes many mistakes. Now suppose
that a test's validity differs for the members of two groups. To use a con-
crete example: The SAT is used as a tool in college admissions because
it has a certain validity in predicting college performance. If the SAT is
biased against blacks, it will underpredict their college performance. If
tests were biased in this way, blacks as a group would do better in col-
lege than the admissions office expected based just on their SATs. It
would be as if the test underestimated the "true" SAT score of the blacks,
so the natural remedy for this kind of bias would be to compensate the
black applicants by, for example, adding the appropriate number of
points onto their scores.
Predictive bias can work in another way, as when the test is simply
less reliable-that
is, less accurate-for
blacks than for whites. Suppose
a test used to select police sergeants is more accurate in predicting the
performance of white candidates who become sergeants than in pre-
dicting the performance of black sergeants. It doesn't underpredict for
blacks, but rather fails to predict at all (or predicts less accurately). In
these cases, the natural remedy would be to give less weight to the test
scores of blacks than to those of whites.
The key concept for both types of bias is the same: A test biased against
blacks does not predict black performance in the real world in the same way
that it predicts white performance in the real world. The evidence of bias is
external in the sense that it shows up in differing validities for blacks and
whites. External evidence of bias has been sought in hundreds of stud-
ies. It has been evaluated relative to performance in elementary school,
in secondary school, in the university, in the armed forces, in unskilled
and skilled jobs, in the professions. Overwhelmingly, the evidence is
that the major standardized tests used to help make school and job de-
c i s i o n ~ ' ~ ~ ~
do not underpredict black performance, nor does the expert
community find any other general or systematic difference in the pre-
dictive accuracy of tests for blacks and whites.'2H1
INTERNAL
EVIL~ENCE
OF BIAS. Predictive validity is the ultimate crite-
rion for bias, because it involves the proof of the pudding for any test.
Rut although predictive validity is in a technical sense the decisive is-
sue, our impression from talking about this issue with colleagues and
friends is that other types of potential bias loom larger in their imagi-
nations: the many things that are put under the umbrella label of "cul-
tural bias."
The most common charges of cultural bias involve the putative cul-
tural loading of items in a test. Here is an SAT analogy item that has
become famous as an example of cultural bias:
RUNNER:MARATHON
(A) envoy:embassy
(B) martyr:massacre
(C) 0arsman:regatta
(D) referee:toumament
(E) horse:stable
The answer is "oarsman:regattaW-fairly
easy if you know what both a
marathon and a regatta are, a matter of guesswork otherwise. How would
a black youngster from the inner city ever have heard of a regatta? Many
view such items as proof that the tests must be biased against people
from disadvantaged backgrounds. "Clearly," writes a critic of testing,
citing this example, "this item does not measure students' 'aptitude' or
logical reasoning ability, but knowledge of upper-middle-class recrea-
tional activity."'2" In the language of psychometrics, this is called internal
Predictive and Internal Bias
- Test validity is defined by its ability to accurately predict real-world performance, such as college grades or job success.
- Predictive bias occurs if a test systematically underpredicts the performance of one group or is less accurate for that group than another.
- Extensive research across schools, the military, and various professions suggests that major standardized tests do not systematically underpredict black performance.
- Internal bias, often called cultural bias, refers to specific test items that require knowledge of specific upper-middle-class cultural activities.
- The 'oarsman:regatta' analogy is a famous example used by critics to argue that tests measure cultural exposure rather than innate aptitude.
- Psychometricians distinguish between external evidence of bias (predictive accuracy) and internal evidence (item content).
How would a black youngster from the inner city ever have heard of a regatta?
280
The National Context
Ethnic Differences in Cognitive Ability
28 1
people represented in the NLSY. This figure shows why a B/W differ-
ence can be problematic to American society as a whole. At the lower
end of the IQ range, there are approximately equal numbers of blacks
and whites. But throughout the upper half of the range, the dispropor-
tions between the number of whites and blacks at any given IQ level
are huge. To the extent that the difference represents an authentic dif-
ference in cognitive functioning, the social consequences are poten-
tially huge as well. But is the difference authentic?
Are the Differences in Black and White Scores Attributable to Cultural
Bias or Other Artifacts of the Test?
Appendix 5 contains a discussion of the state of knowledge regarding
test bias. Here, we shall quickly review the basic findings regarding
blacks, without repeating the citations in Appendix 5, which we urge
you to read.
EXTERNAL EVIDENCE
OF BIAS. Tests are used to predict things-most
commonly, to predict performance in school or on the job. Chapter 3
discussed this issue in detail. You will recall that the ability of a test to
predict is known as its validity. A test with high validity predicts ac-
curately; a test with poor validity makes many mistakes. Now suppose
that a test's validity differs for the members of two groups. To use a con-
crete example: The SAT is used as a tool in college admissions because
it has a certain validity in predicting college performance. If the SAT is
biased against blacks, it will underpredict their college performance. If
tests were biased in this way, blacks as a group would do better in col-
lege than the admissions office expected based just on their SATs. It
would be as if the test underestimated the "true" SAT score of the blacks,
so the natural remedy for this kind of bias would be to compensate the
black applicants by, for example, adding the appropriate number of
points onto their scores.
Predictive bias can work in another way, as when the test is simply
less reliable-that
is, less accurate-for
blacks than for whites. Suppose
a test used to select police sergeants is more accurate in predicting the
performance of white candidates who become sergeants than in pre-
dicting the performance of black sergeants. It doesn't underpredict for
blacks, but rather fails to predict at all (or predicts less accurately). In
these cases, the natural remedy would be to give less weight to the test
scores of blacks than to those of whites.
The key concept for both types of bias is the same: A test biased against
blacks does not predict black performance in the real world in the same way
that it predicts white performance in the real world. The evidence of bias is
external in the sense that it shows up in differing validities for blacks and
whites. External evidence of bias has been sought in hundreds of stud-
ies. It has been evaluated relative to performance in elementary school,
in secondary school, in the university, in the armed forces, in unskilled
and skilled jobs, in the professions. Overwhelmingly, the evidence is
that the major standardized tests used to help make school and job de-
c i s i o n ~ ' ~ ~ ~
do not underpredict black performance, nor does the expert
community find any other general or systematic difference in the pre-
dictive accuracy of tests for blacks and whites.'2H1
INTERNAL
EVIL~ENCE
OF BIAS. Predictive validity is the ultimate crite-
rion for bias, because it involves the proof of the pudding for any test.
Rut although predictive validity is in a technical sense the decisive is-
sue, our impression from talking about this issue with colleagues and
friends is that other types of potential bias loom larger in their imagi-
nations: the many things that are put under the umbrella label of "cul-
tural bias."
The most common charges of cultural bias involve the putative cul-
tural loading of items in a test. Here is an SAT analogy item that has
become famous as an example of cultural bias:
RUNNER:MARATHON
(A) envoy:embassy
(B) martyr:massacre
(C) 0arsman:regatta
(D) referee:toumament
(E) horse:stable
The answer is "oarsman:regattaW-fairly
easy if you know what both a
marathon and a regatta are, a matter of guesswork otherwise. How would
a black youngster from the inner city ever have heard of a regatta? Many
view such items as proof that the tests must be biased against people
from disadvantaged backgrounds. "Clearly," writes a critic of testing,
citing this example, "this item does not measure students' 'aptitude' or
logical reasoning ability, but knowledge of upper-middle-class recrea-
tional activity."'2" In the language of psychometrics, this is called internal
282
The National Context
Ethnic Differences in Cognitive Ability
283
evidence of bias, as contrasted with the external evidence of differen-
tial prediction.
The hypothesis of bias again lends itself to direct examination. In ef-
fect, the SAT critic is saying that culturally loaded items are producing
at least some of the B/W difference. Get rid of such items, and the gap
will narrow. Is he correct? When we look at the results for items that
have answers such as "oarsman:regatta" and the results for items that
seem to be empty of any cultural information (repeating a sequence of
numbers, for example), are there any differences?"" Are differences in
group test scores concentrated among certain items?
The technical literature is again clear. In study after study of the lead-
ing tests, the hypothesis that the B/W difference is caused by questions
with cultural content has been contradicted by the facts." Items that
the average white test taker finds easy relative to other items, the aver-
age black test taker does too; the same is true for items that the average
white and black find difficult. Inasmuch as whites and blacks have dif-
ferent overall scores on the average, it follows that a smaller proportion
of blacks get right answers for either easy or hard items, but the order of
difficulty is virtually the same in each racial group. For groups that have
special language considerations-Latinos and American Indians, for ex-
ample-some
internal evidence of bias has been found, unless English
is their native language.3z
Studies comparing blacks and whites on various kinds of IQ tests find
that the B/W difference is not created by items that ask about regattas
or who wrote Hamlet, or any of the other similar examples cited in crit-
icisms of tests. How can this be? The explanation is complicated and
goes deep into the reasons why a test item is "good" or "bad" in mea-
suring intelligence. Here, we restrict ourselves to the conclusion: The
RIW difference is wider on items that appear to be culturally neunal than on
items that appear to he culturally loaded. We italicize this point because it
is both so well established empirically yet comes as such a surprise to
most people who are new to this topic. We will elaborate on this find-
ing later in the chapter. In any case, there is no longer an important
technical debate over the conclusion that the cultural content of test
items is not the cause of group differences in scores.
"MOTIVATION TO TRY." Suppose that the nature of cultural bias does not
lie in predictive validity or in the content of the items but in what might
be called "test willingness." A typical black youngster, it is hypothesized,
comes to such tests with a mindset different from the white subject's. He
is less attuned to testing situations (from one point of view), or less in-
clined to put up with such nonsense (from another). Perhaps he just
doesn't give a damn, since he has no hopes of going to college or other-
wise benefiting from a good test score. Perhaps he figures that the test is
biased against him anyway, so what's the point. Perhaps he consciously
refuses to put out his best effort because of the peer pressures against "act-
ing white" in some inner-city schools.
The studies that have attempted to measure motivation in such sit-
uations have generally found that blacks are at least as motivated as
wh1tes.j' Rut these are not wholly convincing, for why shouldn't the
measures of motivation he just as inaccurate as the measures of cogni-
tive ability are alleged to be? Analysis of internal characteristics of the
tests once again offers the best leverage in examining this broad hy-
pothesis. Two sets of data seem especially pertinent.
The first involves the digit span subtest, part of the widely used Wech-
sler intelligence tests. It has two forms: forward digit span, in which the
subject tries to repeat a sequence of numbers in the order read to him,
and backward digit span, in which the subject tries to repeat the sequence
of numbers hackward. The test is simple in concept, uses numbers that
are familiar to everyone, and calls on no cultural information besides
knowing numhers. The digit span is especially informative regarding test
motivation not just because of the low cultural loading of the items but
because the backward form is twice as g-loaded as the forward form, ~t is
a much better measure of general intelligence. The reason is that revers-
ing the numbers is mentally more demanding than repeating them in
the heard order, as readers can determine for themselves by a little self-
testing.
The two parts of the subtest have identical content. They occur
at the same time during the test. Each subject does both. Rut in most
studies the black-white difference is about twice as great on backward
digits as on forward digit^."^' The question arises: How can lack of
motivation (or test willingness or any other explanation of that type)
explain the difference in performance on the two parts of the same sub-
test?j5
A similar question arises from work o n reaction time. Several psy-
chometricians, led by Arthur Jensen, have been exploring the underly-
ing nature of g by hypothesizing that neurologic processing speed is
implicated, akin to the speed of the microprocessor in a computer.
Cultural Content and Test Bias
- The hypothesis that racial score gaps are caused by culturally specific questions, such as those referencing 'regattas,' is contradicted by empirical data.
- Black and white test-takers generally find the same items easy or difficult, suggesting a consistent order of difficulty across racial groups.
- Counterintuitively, the gap between black and white scores is often wider on culturally neutral items than on culturally loaded ones.
- While language barriers affect scores for Latinos and American Indians, cultural content does not explain the black/white score differential.
- Researchers have investigated 'test willingness' or motivation as a factor, but studies generally find that black subjects are as motivated as white subjects.
- Internal test data, such as the digit span subtest, provide a way to analyze cognitive ability while minimizing cultural and motivational variables.
The B/W difference is wider on items that appear to be culturally neutral than on items that appear to be culturally loaded.
282
The National Context
Ethnic Differences in Cognitive Ability
283
evidence of bias, as contrasted with the external evidence of differen-
tial prediction.
The hypothesis of bias again lends itself to direct examination. In ef-
fect, the SAT critic is saying that culturally loaded items are producing
at least some of the B/W difference. Get rid of such items, and the gap
will narrow. Is he correct? When we look at the results for items that
have answers such as "oarsman:regatta" and the results for items that
seem to be empty of any cultural information (repeating a sequence of
numbers, for example), are there any differences?"" Are differences in
group test scores concentrated among certain items?
The technical literature is again clear. In study after study of the lead-
ing tests, the hypothesis that the B/W difference is caused by questions
with cultural content has been contradicted by the facts." Items that
the average white test taker finds easy relative to other items, the aver-
age black test taker does too; the same is true for items that the average
white and black find difficult. Inasmuch as whites and blacks have dif-
ferent overall scores on the average, it follows that a smaller proportion
of blacks get right answers for either easy or hard items, but the order of
difficulty is virtually the same in each racial group. For groups that have
special language considerations-Latinos and American Indians, for ex-
ample-some
internal evidence of bias has been found, unless English
is their native language.3z
Studies comparing blacks and whites on various kinds of IQ tests find
that the B/W difference is not created by items that ask about regattas
or who wrote Hamlet, or any of the other similar examples cited in crit-
icisms of tests. How can this be? The explanation is complicated and
goes deep into the reasons why a test item is "good" or "bad" in mea-
suring intelligence. Here, we restrict ourselves to the conclusion: The
RIW difference is wider on items that appear to be culturally neunal than on
items that appear to he culturally loaded. We italicize this point because it
is both so well established empirically yet comes as such a surprise to
most people who are new to this topic. We will elaborate on this find-
ing later in the chapter. In any case, there is no longer an important
technical debate over the conclusion that the cultural content of test
items is not the cause of group differences in scores.
"MOTIVATION TO TRY." Suppose that the nature of cultural bias does not
lie in predictive validity or in the content of the items but in what might
be called "test willingness." A typical black youngster, it is hypothesized,
comes to such tests with a mindset different from the white subject's. He
is less attuned to testing situations (from one point of view), or less in-
clined to put up with such nonsense (from another). Perhaps he just
doesn't give a damn, since he has no hopes of going to college or other-
wise benefiting from a good test score. Perhaps he figures that the test is
biased against him anyway, so what's the point. Perhaps he consciously
refuses to put out his best effort because of the peer pressures against "act-
ing white" in some inner-city schools.
The studies that have attempted to measure motivation in such sit-
uations have generally found that blacks are at least as motivated as
wh1tes.j' Rut these are not wholly convincing, for why shouldn't the
measures of motivation he just as inaccurate as the measures of cogni-
tive ability are alleged to be? Analysis of internal characteristics of the
tests once again offers the best leverage in examining this broad hy-
pothesis. Two sets of data seem especially pertinent.
The first involves the digit span subtest, part of the widely used Wech-
sler intelligence tests. It has two forms: forward digit span, in which the
subject tries to repeat a sequence of numbers in the order read to him,
and backward digit span, in which the subject tries to repeat the sequence
of numbers hackward. The test is simple in concept, uses numbers that
are familiar to everyone, and calls on no cultural information besides
knowing numhers. The digit span is especially informative regarding test
motivation not just because of the low cultural loading of the items but
because the backward form is twice as g-loaded as the forward form, ~t is
a much better measure of general intelligence. The reason is that revers-
ing the numbers is mentally more demanding than repeating them in
the heard order, as readers can determine for themselves by a little self-
testing.
The two parts of the subtest have identical content. They occur
at the same time during the test. Each subject does both. Rut in most
studies the black-white difference is about twice as great on backward
digits as on forward digit^."^' The question arises: How can lack of
motivation (or test willingness or any other explanation of that type)
explain the difference in performance on the two parts of the same sub-
test?j5
A similar question arises from work o n reaction time. Several psy-
chometricians, led by Arthur Jensen, have been exploring the underly-
ing nature of g by hypothesizing that neurologic processing speed is
implicated, akin to the speed of the microprocessor in a computer.
Cognitive Processing and Motivation
- The 'backward digit' test is twice as g-loaded as the 'forward digit' test because reversing numbers requires significantly more mental demand.
- Racial performance gaps are twice as large on backward digits compared to forward digits, despite identical test content and timing.
- Reaction time (RT) correlates strongly with general intelligence (g), whereas movement time (MT) relates primarily to motor skills.
- Studies show that while white subjects often have faster reaction times, black subjects often have faster movement times.
- The split-second nature of RT and MT measurements makes it difficult to attribute performance differences to a lack of motivation.
- These findings suggest that cognitive differences are rooted in neurological processing speed rather than cultural loading or test-taking effort.
How can one be unmotivated to do well during one split-second of a test but apparently motivated during the next split-second?
282
The National Context
Ethnic Differences in Cognitive Ability
283
evidence of bias, as contrasted with the external evidence of differen-
tial prediction.
The hypothesis of bias again lends itself to direct examination. In ef-
fect, the SAT critic is saying that culturally loaded items are producing
at least some of the B/W difference. Get rid of such items, and the gap
will narrow. Is he correct? When we look at the results for items that
have answers such as "oarsman:regatta" and the results for items that
seem to be empty of any cultural information (repeating a sequence of
numbers, for example), are there any differences?"" Are differences in
group test scores concentrated among certain items?
The technical literature is again clear. In study after study of the lead-
ing tests, the hypothesis that the B/W difference is caused by questions
with cultural content has been contradicted by the facts." Items that
the average white test taker finds easy relative to other items, the aver-
age black test taker does too; the same is true for items that the average
white and black find difficult. Inasmuch as whites and blacks have dif-
ferent overall scores on the average, it follows that a smaller proportion
of blacks get right answers for either easy or hard items, but the order of
difficulty is virtually the same in each racial group. For groups that have
special language considerations-Latinos and American Indians, for ex-
ample-some
internal evidence of bias has been found, unless English
is their native language.3z
Studies comparing blacks and whites on various kinds of IQ tests find
that the B/W difference is not created by items that ask about regattas
or who wrote Hamlet, or any of the other similar examples cited in crit-
icisms of tests. How can this be? The explanation is complicated and
goes deep into the reasons why a test item is "good" or "bad" in mea-
suring intelligence. Here, we restrict ourselves to the conclusion: The
RIW difference is wider on items that appear to be culturally neunal than on
items that appear to he culturally loaded. We italicize this point because it
is both so well established empirically yet comes as such a surprise to
most people who are new to this topic. We will elaborate on this find-
ing later in the chapter. In any case, there is no longer an important
technical debate over the conclusion that the cultural content of test
items is not the cause of group differences in scores.
"MOTIVATION TO TRY." Suppose that the nature of cultural bias does not
lie in predictive validity or in the content of the items but in what might
be called "test willingness." A typical black youngster, it is hypothesized,
comes to such tests with a mindset different from the white subject's. He
is less attuned to testing situations (from one point of view), or less in-
clined to put up with such nonsense (from another). Perhaps he just
doesn't give a damn, since he has no hopes of going to college or other-
wise benefiting from a good test score. Perhaps he figures that the test is
biased against him anyway, so what's the point. Perhaps he consciously
refuses to put out his best effort because of the peer pressures against "act-
ing white" in some inner-city schools.
The studies that have attempted to measure motivation in such sit-
uations have generally found that blacks are at least as motivated as
wh1tes.j' Rut these are not wholly convincing, for why shouldn't the
measures of motivation he just as inaccurate as the measures of cogni-
tive ability are alleged to be? Analysis of internal characteristics of the
tests once again offers the best leverage in examining this broad hy-
pothesis. Two sets of data seem especially pertinent.
The first involves the digit span subtest, part of the widely used Wech-
sler intelligence tests. It has two forms: forward digit span, in which the
subject tries to repeat a sequence of numbers in the order read to him,
and backward digit span, in which the subject tries to repeat the sequence
of numbers hackward. The test is simple in concept, uses numbers that
are familiar to everyone, and calls on no cultural information besides
knowing numhers. The digit span is especially informative regarding test
motivation not just because of the low cultural loading of the items but
because the backward form is twice as g-loaded as the forward form, ~t is
a much better measure of general intelligence. The reason is that revers-
ing the numbers is mentally more demanding than repeating them in
the heard order, as readers can determine for themselves by a little self-
testing.
The two parts of the subtest have identical content. They occur
at the same time during the test. Each subject does both. Rut in most
studies the black-white difference is about twice as great on backward
digits as on forward digit^."^' The question arises: How can lack of
motivation (or test willingness or any other explanation of that type)
explain the difference in performance on the two parts of the same sub-
test?j5
A similar question arises from work o n reaction time. Several psy-
chometricians, led by Arthur Jensen, have been exploring the underly-
ing nature of g by hypothesizing that neurologic processing speed is
implicated, akin to the speed of the microprocessor in a computer.
284
The National Context
Ethnic Differences in Cognitive Ability
285
Smarter people process faster than less smart people. The strategy for
testing the hypothesis is to give people extremely simple cogn~tive
tasks-so
simple that no conscious thought is involved-and
to use pre-
cise timing methods to determine how fast different people perform
these simple tasks. One commonly used apparatus involves a console
with a semicircle of eight lights, each with a button next to it. In the mid-
dle of the console is the "home" button. At the beginning of each trial,
the subject is depressing the home button with his finger. One of the
lights in the semicircle goes on. The subject moves his finger to the hut-
ton closest to the light, which turns it off. There are more complicated
versions of the task (three lights go on, and the subject moves to the one
that is farthest from the other two, for example), but none requires much
thought, and everybody gets every trial "right." The subject's response
speed is broken into two measurements: reaction time (RT), the time it
takes the subject to lift his finger from the home button after a target light
goes on, and movement time (MT), the time it takes to move the finger
from just above the home button to the target button.'"'
Francis Galton in the nineteenth century believed that reaction time
is associated with intelligence but could not prove it. He was on the
right track after all. In modem studies, reaction time is correlated with
the results from full-scale IQ tests; even more specifically, it is correlated
with the g factor in IQ tests-in
some studies, only with the g factor."
Movement time is much less correlated with IQ or with g.'This makes
sense: Most of the cognitive processing has been completed by the time
the finger leaves the home button; the rest is mostly a function of small
motor skills.
Research on reaction time is doing much to advance our under-
standing of the biological basis of g. For our purposes here, however, it
also offers a test of the motivation hypothesis: The consistent result of
many studies is that white reaction time is faster than black reaction
time, but black movement time is faster than white movement time."
One can imagine an unmotivated subject who thinks the reaction time
test is a waste of time and does not try very hard. But the level of moti-
vation, whatever it may be, seems likely to be the same for the measures
of RT and MT. The question arises: How can one be unmotivated to do
well during one split-second of a test but apparently motivated during
the next split-second? Results of this sort argue against easy explana-
tions that appeal to differences in motivation as explanatory of the B/W
difference.
UNIFORM BACKGROUND BIAS. Other kinds of bias discussed in
Appendix 5 include the possibility that blacks have less access to
coaching than whites, less experience with tests (less "testwiseness"),
poorer understanding of standard English, and that their performance
is affected by white examiners. Each of these hypotheses has been
investigated, for many tests, under many conditions. None has been
sustained. In short, the testable hypotheses have led toward the
conclusion that cognitive ability tests are not biased against blacks.
This leaves one final hypothesis regarding cultural bias that does not
lend itself to empirical evaluation, at least not directly.
Suppose our society is so steeped in the conditions that produce test
bins that people in disadvantaged groups underscore their cognitive abil-
ties on all the Items on tests, thereby hiding the internal evidence of
has. At the same time and for the same reasons, they underperform in
school and on the job in relation to their true abilities, thereby hiding
the external evidence. In other words, the tests may be biased against
disadvantaged groups, but the traces of bias are invisible because the
blas permeates all areas of the group's performance. Accordingly, it
would be as useless to look for evidence of test bias as it would be for
Einstein's imag~nary person traveling near the speed of light to try to de-
termine whether time has slowed. Einstein's traveler has no clock that
exists independent of his space-time context. In assessing test bias, we
would have no test or criterion measure that exists independent of this
culture and its history. This form of bias would pervade everything.
To some readers, the hypothesis will seem so plausible that it is self-
evidently correct. Before deciding that this must be the explanation for
group differences in test scores, however, a few problems must be over-
come. First, the comments about the digit span and reaction time re-
sults apply here as well. How can this uniform background bias suppress
black reaction time but not the movement time? How can it suppress
performance on backward digit span more than forward digit span? Sec-
ond, the hypothesis implies that many of the ~erformance yardsticks in
the society at large are not only biased, they are all so similar in the de-
gree to which they distort the truth-in
every occupation, every type
of educational institution, every achievement measure, every perfor-
mance measure-that
no differential distortion is picked up by the data.
Is this plausible?
It is not good enough to accept without question that a general "back-
ground radiation" of bias, uniform and ubiquitous, explains away black
The Limits of Test Bias
- Empirical investigations into specific factors like coaching, testwiseness, and examiner race have failed to sustain the hypothesis of test bias against blacks.
- A theoretical 'invisible bias' hypothesis suggests that cultural disadvantage permeates all aspects of life, masking bias in both tests and real-world performance.
- The author compares this pervasive bias to Einstein's traveler near the speed of light, who lacks an independent clock to measure time dilation.
- Critics of the invisible bias theory point to specific cognitive anomalies, such as why bias would affect backward digit span more than forward digit span.
- The text argues that assuming a uniform 'background radiation' of bias across all occupations and institutions requires a significant leap of faith.
- The discussion transitions to whether socioeconomic status (SES) can fully account for the observed differences in test scores between racial groups.
In assessing test bias, we would have no test or criterion measure that exists independent of this culture and its history.
284
The National Context
Ethnic Differences in Cognitive Ability
285
Smarter people process faster than less smart people. The strategy for
testing the hypothesis is to give people extremely simple cogn~tive
tasks-so
simple that no conscious thought is involved-and
to use pre-
cise timing methods to determine how fast different people perform
these simple tasks. One commonly used apparatus involves a console
with a semicircle of eight lights, each with a button next to it. In the mid-
dle of the console is the "home" button. At the beginning of each trial,
the subject is depressing the home button with his finger. One of the
lights in the semicircle goes on. The subject moves his finger to the hut-
ton closest to the light, which turns it off. There are more complicated
versions of the task (three lights go on, and the subject moves to the one
that is farthest from the other two, for example), but none requires much
thought, and everybody gets every trial "right." The subject's response
speed is broken into two measurements: reaction time (RT), the time it
takes the subject to lift his finger from the home button after a target light
goes on, and movement time (MT), the time it takes to move the finger
from just above the home button to the target button.'"'
Francis Galton in the nineteenth century believed that reaction time
is associated with intelligence but could not prove it. He was on the
right track after all. In modem studies, reaction time is correlated with
the results from full-scale IQ tests; even more specifically, it is correlated
with the g factor in IQ tests-in
some studies, only with the g factor."
Movement time is much less correlated with IQ or with g.'This makes
sense: Most of the cognitive processing has been completed by the time
the finger leaves the home button; the rest is mostly a function of small
motor skills.
Research on reaction time is doing much to advance our under-
standing of the biological basis of g. For our purposes here, however, it
also offers a test of the motivation hypothesis: The consistent result of
many studies is that white reaction time is faster than black reaction
time, but black movement time is faster than white movement time."
One can imagine an unmotivated subject who thinks the reaction time
test is a waste of time and does not try very hard. But the level of moti-
vation, whatever it may be, seems likely to be the same for the measures
of RT and MT. The question arises: How can one be unmotivated to do
well during one split-second of a test but apparently motivated during
the next split-second? Results of this sort argue against easy explana-
tions that appeal to differences in motivation as explanatory of the B/W
difference.
UNIFORM BACKGROUND BIAS. Other kinds of bias discussed in
Appendix 5 include the possibility that blacks have less access to
coaching than whites, less experience with tests (less "testwiseness"),
poorer understanding of standard English, and that their performance
is affected by white examiners. Each of these hypotheses has been
investigated, for many tests, under many conditions. None has been
sustained. In short, the testable hypotheses have led toward the
conclusion that cognitive ability tests are not biased against blacks.
This leaves one final hypothesis regarding cultural bias that does not
lend itself to empirical evaluation, at least not directly.
Suppose our society is so steeped in the conditions that produce test
bins that people in disadvantaged groups underscore their cognitive abil-
ties on all the Items on tests, thereby hiding the internal evidence of
has. At the same time and for the same reasons, they underperform in
school and on the job in relation to their true abilities, thereby hiding
the external evidence. In other words, the tests may be biased against
disadvantaged groups, but the traces of bias are invisible because the
blas permeates all areas of the group's performance. Accordingly, it
would be as useless to look for evidence of test bias as it would be for
Einstein's imag~nary person traveling near the speed of light to try to de-
termine whether time has slowed. Einstein's traveler has no clock that
exists independent of his space-time context. In assessing test bias, we
would have no test or criterion measure that exists independent of this
culture and its history. This form of bias would pervade everything.
To some readers, the hypothesis will seem so plausible that it is self-
evidently correct. Before deciding that this must be the explanation for
group differences in test scores, however, a few problems must be over-
come. First, the comments about the digit span and reaction time re-
sults apply here as well. How can this uniform background bias suppress
black reaction time but not the movement time? How can it suppress
performance on backward digit span more than forward digit span? Sec-
ond, the hypothesis implies that many of the ~erformance yardsticks in
the society at large are not only biased, they are all so similar in the de-
gree to which they distort the truth-in
every occupation, every type
of educational institution, every achievement measure, every perfor-
mance measure-that
no differential distortion is picked up by the data.
Is this plausible?
It is not good enough to accept without question that a general "back-
ground radiation" of bias, uniform and ubiquitous, explains away black
286
The National Context
Ethnic Differences in Cognitive Ability
287
and white differences in test scores and performance measures. The hy-
pothesis might, in theory, be true. But given the degree to which every-
day experience suggests that the environment confronting blacks in
different sectors of American life is not uniformly hostile and given the
consistency in results from a wide variety of cognitive measures, assum-
ing that the hypothesis is true represents a considerably longer leap of
faith than the much more limited assumption that race prejudice is still
a factor in American life. In the matter of test bias, this brings us to the
frontier of knowledge.
Are the Differences in Overall Black and White Test Scores Attributable
to Difieerences in Socioeconomic Status?
This question has two different answers depending on how the question
is understood, and confusion is rampant. We will take up the two an-
swers and their associated rationales separately:
First version: If you extract the effecn of socioeconomic clars, what hap-
pens to the overall magnitude of the BIW difference? Blacks are dispropor-
tionately in the lower socioeconomic classes, and socioeconomic class
is known to be associated with IQ. Therefore, many people suggest, part
of what appears to be an ethnic difference in IQ scores is actually a so-
cioeconomic difference.
The answer to this version of the question is that the size of the gap
shrinks when socioeconomic status is statistically extracted. The NLSY
gives a result typical of such analyses. The B/W difference in the NLSY
is 1.21. In a regression equation in which both race and socioeconomic
background are entered, the difference between whites and blacks
shrinks to .76 standard deviation.lW1 Socioeconomic status explains 37
percent of the original B/W difference. This relationship is in line with
the results from many other ~tudies.'~"
The difficulty comes in interpreting what it means to "control" for
socioeconomic status. Matching the status of the groups is usually jus-
tified on the grounds that the scores people earn are caused to some ex-
tent by their socioeconomic status, so if we want to see the "real" or
"authentic" difference between them, the contribution of status must
be
The trouble is that socioeconomic status is also a result
of cognitive ability, as people of high and low cognitive ability move to
correspondingly high and low places in the socioeconomic continuum.
The reason that parents have high or low socioeconomic status is in part
a function of their intelligence, and their intelligence also affects the
IQ of the children via both genes and environment.
Because of these relationships, "controlling" for socioeconomic sta-
tus in racial comparisons is guaranteed to reduce IQ differences in the
same way that choosing black and white samples from a school for the
intellectnally glfted is guaranteed to reduce IQ differences (assuming
race-hlind admissions standards). But the remainmg difference is not
necessarily more real or authentic than the one we start with. This seems
to he a hard point to grasp, judging from the pervasiveness of control-
ling for socioeconomic status in the sociological literature on ethnic dif-
ferences. Rut suppose we were asking whether blacks and whites differed
in sprinting speed, and controlled for "varsity status" by examining only
athletes on the track teams in Division I colleges. Blacks would proba-
bly still sprint faster than whites on the average, but it would be a smaller
difference than in the population at large. Is there any sense in which
this smaller difference would be a more accurate measure of the racial
difference in sprinting ability than the larger difference in the general
population? We pose that as an interesting theoretical issue. In terms of
numhers, a reasonable rule of thumb is that controlling for socioeco-
nomic status reduces the overall B/W difference hy about a third.
Second version: As blacks move up the socioecnnomic ladder, do the dif-
ferences with whites of similar socioeconomic status diminish? The first ver-
sion of the SESIIQ question referred to the overall score of a population
of blacks and whites. The second version concentrates on the B/W dif-
ference within socioeconomic classes. The rationale goes like this:
Blacks score lower on average because they are socioeconomically at a
disadvantage in our society. This disadvantage should most seriously
handicap the children of blacks in the lower socioeconomic classes, who
suffer from greater barriers to education and occupational advancement
than do the children of blacks in the middle and upper classes. As blacks
advance up the socioeconomic ladder, their children, less exposed to
these environmental deficits, will do better and, by extension, close the
gap with white children of their class.
This expectation is not borne out by the data. A good way to illus-
trate this is by using our parental SES index and matching it against the
mean IQ score, as shown in the figure below. 1Q scores increase with
economic status for both races. But as the figure shows, the magnitude
of the B/W difference in standard deviations does not decrease. Indeed,
it gets larger as people move up from the very bottom of the socioeco-
Socioeconomic Status and IQ Gaps
- Statistical analysis shows that controlling for socioeconomic status (SES) reduces the black/white IQ gap by approximately 37 percent.
- The authors argue that 'controlling' for SES is problematic because SES is partially a result of cognitive ability rather than just a cause of it.
- Using a sports analogy, the text suggests that narrowing a sample to specific status levels artificially shrinks differences found in the general population.
- A common hypothesis suggests that the IQ gap should diminish as black families move up the socioeconomic ladder and face fewer environmental deficits.
- Empirical data contradicts this hypothesis, showing that the IQ gap between races does not decrease even as socioeconomic status increases.
- The relationship between parental intelligence, child intelligence, and social standing creates a complex feedback loop that resists simple statistical isolation.
The trouble is that socioeconomic status is also a result of cognitive ability, as people of high and low cognitive ability move to correspondingly high and low places in the socioeconomic continuum.
286
The National Context
Ethnic Differences in Cognitive Ability
287
and white differences in test scores and performance measures. The hy-
pothesis might, in theory, be true. But given the degree to which every-
day experience suggests that the environment confronting blacks in
different sectors of American life is not uniformly hostile and given the
consistency in results from a wide variety of cognitive measures, assum-
ing that the hypothesis is true represents a considerably longer leap of
faith than the much more limited assumption that race prejudice is still
a factor in American life. In the matter of test bias, this brings us to the
frontier of knowledge.
Are the Differences in Overall Black and White Test Scores Attributable
to Difieerences in Socioeconomic Status?
This question has two different answers depending on how the question
is understood, and confusion is rampant. We will take up the two an-
swers and their associated rationales separately:
First version: If you extract the effecn of socioeconomic clars, what hap-
pens to the overall magnitude of the BIW difference? Blacks are dispropor-
tionately in the lower socioeconomic classes, and socioeconomic class
is known to be associated with IQ. Therefore, many people suggest, part
of what appears to be an ethnic difference in IQ scores is actually a so-
cioeconomic difference.
The answer to this version of the question is that the size of the gap
shrinks when socioeconomic status is statistically extracted. The NLSY
gives a result typical of such analyses. The B/W difference in the NLSY
is 1.21. In a regression equation in which both race and socioeconomic
background are entered, the difference between whites and blacks
shrinks to .76 standard deviation.lW1 Socioeconomic status explains 37
percent of the original B/W difference. This relationship is in line with
the results from many other ~tudies.'~"
The difficulty comes in interpreting what it means to "control" for
socioeconomic status. Matching the status of the groups is usually jus-
tified on the grounds that the scores people earn are caused to some ex-
tent by their socioeconomic status, so if we want to see the "real" or
"authentic" difference between them, the contribution of status must
be
The trouble is that socioeconomic status is also a result
of cognitive ability, as people of high and low cognitive ability move to
correspondingly high and low places in the socioeconomic continuum.
The reason that parents have high or low socioeconomic status is in part
a function of their intelligence, and their intelligence also affects the
IQ of the children via both genes and environment.
Because of these relationships, "controlling" for socioeconomic sta-
tus in racial comparisons is guaranteed to reduce IQ differences in the
same way that choosing black and white samples from a school for the
intellectnally glfted is guaranteed to reduce IQ differences (assuming
race-hlind admissions standards). But the remainmg difference is not
necessarily more real or authentic than the one we start with. This seems
to he a hard point to grasp, judging from the pervasiveness of control-
ling for socioeconomic status in the sociological literature on ethnic dif-
ferences. Rut suppose we were asking whether blacks and whites differed
in sprinting speed, and controlled for "varsity status" by examining only
athletes on the track teams in Division I colleges. Blacks would proba-
bly still sprint faster than whites on the average, but it would be a smaller
difference than in the population at large. Is there any sense in which
this smaller difference would be a more accurate measure of the racial
difference in sprinting ability than the larger difference in the general
population? We pose that as an interesting theoretical issue. In terms of
numhers, a reasonable rule of thumb is that controlling for socioeco-
nomic status reduces the overall B/W difference hy about a third.
Second version: As blacks move up the socioecnnomic ladder, do the dif-
ferences with whites of similar socioeconomic status diminish? The first ver-
sion of the SESIIQ question referred to the overall score of a population
of blacks and whites. The second version concentrates on the B/W dif-
ference within socioeconomic classes. The rationale goes like this:
Blacks score lower on average because they are socioeconomically at a
disadvantage in our society. This disadvantage should most seriously
handicap the children of blacks in the lower socioeconomic classes, who
suffer from greater barriers to education and occupational advancement
than do the children of blacks in the middle and upper classes. As blacks
advance up the socioeconomic ladder, their children, less exposed to
these environmental deficits, will do better and, by extension, close the
gap with white children of their class.
This expectation is not borne out by the data. A good way to illus-
trate this is by using our parental SES index and matching it against the
mean IQ score, as shown in the figure below. 1Q scores increase with
economic status for both races. But as the figure shows, the magnitude
of the B/W difference in standard deviations does not decrease. Indeed,
it gets larger as people move up from the very bottom of the socioeco-
Ethnic Differences in Cognitive Ability
- Black IQ scores increase as socioeconomic status (SES) rises, but the gap between Black and White scores does not shrink and may even widen at higher SES levels.
- Studies of African populations show that standardized tests have similar psychometric properties and predictive validity for academic and job performance as they do in the United States.
- Research estimates the median IQ of Black Africans to be approximately 75, which is lower than the average for American Blacks.
- The data from Africa suggests that the historical legacy of American slavery and discrimination is not the primary factor depressing test scores, as African populations without that history score lower.
- While some data suggests the Black-White test score gap may be diminishing, recent large-scale studies like the NLSY still show differences at the high end of the range.
One reason for this reluctance to discuss averages is that blacks in Africa, including urbanized blacks with secondary educations, have obtained extremely low scores.
288
The National Context
Ethnic Differences in Cognitive Ability
289
Black IQ scores go up with socioeconomic status, but the black*
white difference does not shrink
BlackJwhite IQ difference,
in standard deviations
1.2-
Black mean IQ,
in IQ points
- 120
BIW difference
(left-hand scale)
- -
Black mean IQ
(right-hand scale)
0.0 ,
1
70
1st
2d
3d
4th
5th
6th
7th
8th
9th
10th
Parental SES, by decile
nomic ladder. The pattern shown in the figure is consistent with many
other major studies, except that the gap flattens out. In other studies,
the gap has continued to increase throughout the range of socioeco-
nomic ~tatus.'~"
How Do Ahcan-Americans Compare with Black in Afnca on
Cognitive Tests?
This question often arises in the context of black-white comparisons in
America, the thought being that the African black population has not
been subjected to the historical legacy of American black slavery and
discrimination and might therefore have higher scores. Many studies of
African students in primary and secondary schools, in both urban and
rural areas, have included cognitive ability tests. As in the United
States, it has been demonstrated in Africa that the same test items that
discriminate best among blacks discriminate best among whites and that
the same factors that depress white scores (for example, coming from a
rural area) depress black scores. The predictive validity of tests for aca-
demic and job performance seems to be about the same. In general, the
psychometric properties of the standardized tests are the same for blacks
living in Africa as for American blacks.44
It has been more difficult to assemble data on the score of the aver-
age African black than one would expect, given the extensiveness of
the test experience in Africa. In the same review of the literature that
permitted the above generalizations, for example-a
thirty-page article
followed by a bibliography of more than 200 titles-not
a single aver-
age is rep~rted.~'
One reason for this reluctance to discuss averages is
that blacks in Africa, including urbanized blacks with secondary edu-
cations, have obtained extremely low scores. Richard Lynn was able to
assemble eleven studies in his 1991 review of the literature. He esti-
mated the median black African IQ to be 75, approximately 1.7 stan-
dard deviations below the U.S. overall population average, about ten
points lower than the current figure for American black~.~Where
other
data are available, the estimates of the black African IQ fall at least that
low and, in some instances, even lower.47 T h e IQ of "coloured" students
in South Africa--of mixed racial background-has
been found to be
similar to that of American blacks.4R
In summary: African blacks are, on average, substantially below
African-Americans in intelligence test scores. Psychometrically, there
is little reason to think that these results mean anything different about
cognitive functioning than they mean in non-African populations. For
our purposes, the main point is that the hypothesis about the special cir-
cumstances of American blacks depressing their test scores is not sub-
stantiated by the African data.
Is the Difference in Black and White Test Scores Diminishing?
The answer is yes with (as usual) some qualifications.
IQ TEST DATA. The most straightforward way to answer the question
would be to examine the repeated administrations of the same IQ tests
to comparable populations, but large, nationally representative IQ data
are not produced every year (or even every decade). The NLSY data are
among the most recent for a young adult population, and they have a
B/W difference toward the high end of the range. The only post-1980
study reporting black and white adult averages that we have found is
the renorming of the Wechsler Adult Intelligence Scale (WAIS-R) in
1981 in which the difference between blacks and a sample of whites
Black-White Cognitive Gap Trends
- Recent normative studies of children show a reduced black-white IQ gap, with some tests reporting differences as low as seven to twelve points.
- Critics argue that some of these diminished gaps may be the result of psychometric and statistical artifacts rather than genuine cognitive convergence.
- Data from the National Longitudinal Survey of Youth (NLSY) presents a conflicting view, suggesting the gap may actually be widening in the newest generation.
- Longitudinal data from academic achievement tests like the NAEP and SAT provide the most extensive evidence of a narrowing gap over the last two decades.
- Between 1969 and 1990, the average black-white difference across science, math, and reading for various age groups decreased by approximately 0.28 standard deviations.
In contrast to Vincent's optimistic conclusions, the NLSY shows a growing rather than a shrinking gap in the next generation of blacks and whites.
290
The National Context
(that apparently did not try to discriminate between Latino and Anglo
whites) was 1.0 standard deviation.49
Recent data on children tell opposite stories. In a review of IQ tests
of children conducted since 1980, Ken Vincent of the University
of Houston reports results for four normative studies that showed
a B/W difference of only seven IQ points for the Ravens Standard Pro-
gressive Matrices (SPM) and the Kaufman Assessment Battery for Chil-
dren (K-ABC).50 Two other studies involving the Stanford-Binet IV
found B/W differences of ten points for children ages 7 to 1 1 and twelve
points for children ages 2 to 6.15" Qualifications must be attached to
these findings. The B/W difference on the K-ABC normative sample
has in particular been subjected to reexamination suggesting that the
diminished gap largely reflected psychometric and statistical artifacts.15"
Nonetheless, the data on children that Vincent reviews may he read as
encouraging. The most impressive of the findings is the comparatively
small B/W difference of only seven 1Q points on the Ravens SPM ad-
ministered to 12-year-olds. This finding corresponds to Jensen's 1992
study of black and white children in an upper-middle-class setting in
which the difference on the Ravens SPM was s~milarly below the norm
(a deficit corresponding to ten 1Q point^).^'
In contrast to Vincent's optimistic conclusions, the NLSY shows a
growing rather than a shrinking gap in the next generation of blacks
and whites. As discussed in Chapter 15, the B/W difference hetween
NLSY children is currently wider than the B/W difference separating
their mothers.
ACADEMIC
AITITUDE
AND ACHIEVEMENT
TESTS.
The most extensive ev-
idence of a narrowing black-white gap can be found in longitudinal data
from the National Assessment of Educational Progress (NAEP), the
American College Testing (ACT) examination, the SAT, a comparison
of the 1972 and 1980 national high school surveys, and some state-level
achievement test data. We review the NAEP and the SAT here, and oth-
ers (which tell the same story) in Appendix 5.
The National Assessment of Educational Progress is an ongoing pro-
gram sponsored by the federal government to monitor the academic
achievement of the nation's youth. It began in 1969, periodically test-
ing 9-, 13-, and 17-year-olds in science, mathematics, reading, and writ-
ing in nationally representative samples. The table below shows the
changes from the first round of testing in 1969-1973 to the data for
Ethnic Differences in Cognitive Ability
29 1
Reductions in the Black-White Difference on the
National Assessment of Educational Progress
White-Black Difference, in
Change
Standard Deviations"
1969-1973
1990
9-year-olds
Science
1.14
.84
-.30
Math
.70
.54
-.I6
Reacllng
.88
.70
-.I8
Average
.91
.69
-.21
13-year-olds
Sclence
.96
.76
-.20
Math
.92
.54
-38
Reading
.78
.40
-.38
Average
.89
.57
-.32
17-year-olds
Sc~ence
1.08
.96
-.I2
Math
.80
.42
-.38
Reading
1.04
-60
-.44
Average
.97
.66
-.31
Overall average
.92
.64
-. 28
Source Natlonal Center for Education Stat~st~cs.
1991h.
T h e computations assume a standard dev~atlon of 50.
1990, expressed in standard deviations. The "Change" column gives the
earlier B/W difference minus the later B/W difference, which is nega-
tive if the gap is closing. The fourth component of the NAEP, a writing
test, was introduced only in 1984, with replications in 1988 and 1990.
Unlike all the others, it does not show a narrowing of the white-black
gap (.46 SD in both 1984 and 1990) and is not included in the table.
As the table indicates, black progress in narrowing the test score dis-
crepancy with whites has been substantial on all three tests and across
all of the age groups. The overall average gap of .92 standard deviation
in the 1969-1973 tests had shrunk to .64 standard deviation by 1990.
The gap narrowed because black scores rose, not because white scores
fell. Altogether, the NAEP provides an encouraging picture.
Narrowing the Cognitive Gap
- Data from the NAEP and SAT show a significant narrowing of the black-white test score gap between the 1960s and early 1990s.
- The convergence is primarily driven by rising black scores rather than a decline in white performance.
- Researchers estimate the narrowing of the gap to be approximately 0.15 to 0.25 standard deviation units, or two to three IQ points.
- Environmental factors are cited as the primary cause for this shift, as genetic changes do not occur within a twenty-year timeframe.
- Improvements in living conditions, including better access to education, public health, and nutrition, have disproportionately benefited African-Americans.
- The rise of modern media and increased mobility have acted as leveling forces, bringing educational benefits to those previously isolated by poverty.
In a period as short as twenty years, environmental changes are likely to provide the main reason for the narrowing racial gap in scores.
290
The National Context
(that apparently did not try to discriminate between Latino and Anglo
whites) was 1.0 standard deviation.49
Recent data on children tell opposite stories. In a review of IQ tests
of children conducted since 1980, Ken Vincent of the University
of Houston reports results for four normative studies that showed
a B/W difference of only seven IQ points for the Ravens Standard Pro-
gressive Matrices (SPM) and the Kaufman Assessment Battery for Chil-
dren (K-ABC).50 Two other studies involving the Stanford-Binet IV
found B/W differences of ten points for children ages 7 to 1 1 and twelve
points for children ages 2 to 6.15" Qualifications must be attached to
these findings. The B/W difference on the K-ABC normative sample
has in particular been subjected to reexamination suggesting that the
diminished gap largely reflected psychometric and statistical artifacts.15"
Nonetheless, the data on children that Vincent reviews may he read as
encouraging. The most impressive of the findings is the comparatively
small B/W difference of only seven 1Q points on the Ravens SPM ad-
ministered to 12-year-olds. This finding corresponds to Jensen's 1992
study of black and white children in an upper-middle-class setting in
which the difference on the Ravens SPM was s~milarly below the norm
(a deficit corresponding to ten 1Q point^).^'
In contrast to Vincent's optimistic conclusions, the NLSY shows a
growing rather than a shrinking gap in the next generation of blacks
and whites. As discussed in Chapter 15, the B/W difference hetween
NLSY children is currently wider than the B/W difference separating
their mothers.
ACADEMIC
AITITUDE
AND ACHIEVEMENT
TESTS.
The most extensive ev-
idence of a narrowing black-white gap can be found in longitudinal data
from the National Assessment of Educational Progress (NAEP), the
American College Testing (ACT) examination, the SAT, a comparison
of the 1972 and 1980 national high school surveys, and some state-level
achievement test data. We review the NAEP and the SAT here, and oth-
ers (which tell the same story) in Appendix 5.
The National Assessment of Educational Progress is an ongoing pro-
gram sponsored by the federal government to monitor the academic
achievement of the nation's youth. It began in 1969, periodically test-
ing 9-, 13-, and 17-year-olds in science, mathematics, reading, and writ-
ing in nationally representative samples. The table below shows the
changes from the first round of testing in 1969-1973 to the data for
Ethnic Differences in Cognitive Ability
29 1
Reductions in the Black-White Difference on the
National Assessment of Educational Progress
White-Black Difference, in
Change
Standard Deviations"
1969-1973
1990
9-year-olds
Science
1.14
.84
-.30
Math
.70
.54
-.I6
Reacllng
.88
.70
-.I8
Average
.91
.69
-.21
13-year-olds
Sclence
.96
.76
-.20
Math
.92
.54
-38
Reading
.78
.40
-.38
Average
.89
.57
-.32
17-year-olds
Sc~ence
1.08
.96
-.I2
Math
.80
.42
-.38
Reading
1.04
-60
-.44
Average
.97
.66
-.31
Overall average
.92
.64
-. 28
Source Natlonal Center for Education Stat~st~cs.
1991h.
T h e computations assume a standard dev~atlon of 50.
1990, expressed in standard deviations. The "Change" column gives the
earlier B/W difference minus the later B/W difference, which is nega-
tive if the gap is closing. The fourth component of the NAEP, a writing
test, was introduced only in 1984, with replications in 1988 and 1990.
Unlike all the others, it does not show a narrowing of the white-black
gap (.46 SD in both 1984 and 1990) and is not included in the table.
As the table indicates, black progress in narrowing the test score dis-
crepancy with whites has been substantial on all three tests and across
all of the age groups. The overall average gap of .92 standard deviation
in the 1969-1973 tests had shrunk to .64 standard deviation by 1990.
The gap narrowed because black scores rose, not because white scores
fell. Altogether, the NAEP provides an encouraging picture.
292
The National Context
Ethnic Differences in Cognitive Ability
293
The first published breakdowns of SAT scores by ethnicity appear for
1976, when the downward trend in SAT scores nationwide after 1963
was nearing its bottom (see Chapter 18). From 1976 to 1993, the white-
black gap in SAT scores narrowed from 1.16 to .88 standard deviation
in the verbal portion of the test and from 1.27 to .92 standard deviation
in the mathematics portion of the test.f541
Comparable narrowing has
also brought black and white achievement test scores closer, as pre-
sented in Appendix 5. Because the ethnic self-identification of SAT test
takers contains some anomalies55 and because the SAT pool is unrep-
resentative of the general population, the numbers should he interpreted
with caution. But even so, the SAT data indicate a narrowing gap. Black
SAT test takers improved substantially more in scores than white SAT
test takers, and neither the changes in the pool of test takers nor the
well-advertised national decline in SAT scores was responsihle, for rea-
sons explained in the notes.'56'
EX~LAINING
THE CONVERGENCE.
Let us assume that during the past two
decades black and white cognitive ability as measured hy IQ has in fact
converged by an amount that is consistent with the convergence in ed-
ucational aptitude measures such as the SAT or NAEP-a
narrowing of
approximately .l5 to .25 standard deviation units, or the equivalent of
two to three IQ points
Why have the scores converged? The
answer calls for speculation.
We take for granted that individual variations in cognitive ability de-
pend on both genes and environment (see Chapter 4). In ;I pertod
as short as twenty years, environmental changes are likely to provide
the main reason for the narrowing racial gap in scores.15" Real and im-
portant though the problems of the underclass are, and acknowledging
that the underclass is disproportionately black, living conditions have
improved for most African-Americans since the 1950s-socially,
eco-
nomically, and educationally.
Consider the schools that blacks attend, for example. Some schools
in the inner cities are worse than they were thirty years ago, hut pro-
portionately few blacks live in these worst-of-the-worst areas.59
Throughout the South and in much of the rest of the country, many
black children as recently as the 1950s attended ramshackle schools
with undertrained teachers and meager teaching materials. Any com-
parison between the schools that most blacks attend now and the ones
they attended in the 1950s favors contemporary schools. Assuming that
eclucat~on affects cognitive capacity, the rising investment in education
disproportionately benefits the cognitive levels at the lower end of the
socioeconomic spectrum.
The argument can be repeated for public health. If nutrition, shelter,
and health care affect intellectual development, then rising standards
of living are disproportionately going to show up in rising scores for the
economically disadvantaged rather than for the upper classes. For travel
and its educational henefits, the argument also applies. Not so long ago,
many less advantaged people spent their lives within a few miles of their
b~rthplaces. Today, Americans of nearly all walks of life crowd the in-
terstate roads and the airports. Finally, for that most contemporary form
of vicarious travel-the
popular media-the
leveling is still more dra-
matic. The modern media can bring the world to everyone in ways that
were once open only to the rich.
Because blacks are shifted toward the lower end of the socioeconomic
range, such improvements benef~t them, o n average, more than whites.
If the improvements affect cognitive development, the black-white gap
should have contracted. Beyond this socioeconomic leveling, there
might also have been a leveling due to diminishing racism. The legacy
of historic racism may still be taking its toll on cognitive development,
hut we must allow the possibility that it has lessened, at least for new
generations. This too might account for some narrowing of the black-
white gap.
LCXIKINC;
TO THE FUTURE.
The question that remains is whether black
and white test scores will continue to converge. If all that separates
blacks from whites are environmental differences and if fertility
patterns for different socioeconomic groups are comparable, there is
no reason why they shouldn't. The process would be very slow,
however. If it continues at the pace observed over the last twenty
years, then we could expect black and white SAT scores to reach
equality sometime in the middle of the twenty-first century, hut linear
extrapolations over such long periods are not worth much.'w1
If black fertility is loaded more heavily than white fertility toward
low-IQ segments of the population, then at some point convergence
may be expected to stop, and the gap could even hegin to widen again.
We take up the fertility issue in Chapter 15. A brief summary statement
concerning fertility patterns is that the news is not good. For now, the
test score data leave open the possibility that convergence has already
The Stalled Convergence Gap
- Socioeconomic leveling and diminishing racism are proposed as primary drivers for the historical narrowing of the black-white cognitive test score gap.
- Linear projections suggest score equality by the mid-twenty-first century, though recent data indicates this convergence may have already stalled.
- Differential fertility patterns between demographic groups are cited as a potential factor that could eventually widen the gap again.
- Recent gains in black SAT scores were primarily driven by a reduction in the number of students scoring at the lowest end of the spectrum rather than gains at the top.
- A pessimistic theory suggests that narrowing gaps may reflect an educational system that has slowed to the 'speed of the slowest ship in the convoy' to favor less capable students.
On the contrary, pessimists can develop a case that the convergence of black and white SAT scores in the last two decades is symptomatic of what happens when education slows down toward the speed of the slowest ship in the convoy.
292
The National Context
Ethnic Differences in Cognitive Ability
293
The first published breakdowns of SAT scores by ethnicity appear for
1976, when the downward trend in SAT scores nationwide after 1963
was nearing its bottom (see Chapter 18). From 1976 to 1993, the white-
black gap in SAT scores narrowed from 1.16 to .88 standard deviation
in the verbal portion of the test and from 1.27 to .92 standard deviation
in the mathematics portion of the test.f541
Comparable narrowing has
also brought black and white achievement test scores closer, as pre-
sented in Appendix 5. Because the ethnic self-identification of SAT test
takers contains some anomalies55 and because the SAT pool is unrep-
resentative of the general population, the numbers should he interpreted
with caution. But even so, the SAT data indicate a narrowing gap. Black
SAT test takers improved substantially more in scores than white SAT
test takers, and neither the changes in the pool of test takers nor the
well-advertised national decline in SAT scores was responsihle, for rea-
sons explained in the notes.'56'
EX~LAINING
THE CONVERGENCE.
Let us assume that during the past two
decades black and white cognitive ability as measured hy IQ has in fact
converged by an amount that is consistent with the convergence in ed-
ucational aptitude measures such as the SAT or NAEP-a
narrowing of
approximately .l5 to .25 standard deviation units, or the equivalent of
two to three IQ points
Why have the scores converged? The
answer calls for speculation.
We take for granted that individual variations in cognitive ability de-
pend on both genes and environment (see Chapter 4). In ;I pertod
as short as twenty years, environmental changes are likely to provide
the main reason for the narrowing racial gap in scores.15" Real and im-
portant though the problems of the underclass are, and acknowledging
that the underclass is disproportionately black, living conditions have
improved for most African-Americans since the 1950s-socially,
eco-
nomically, and educationally.
Consider the schools that blacks attend, for example. Some schools
in the inner cities are worse than they were thirty years ago, hut pro-
portionately few blacks live in these worst-of-the-worst areas.59
Throughout the South and in much of the rest of the country, many
black children as recently as the 1950s attended ramshackle schools
with undertrained teachers and meager teaching materials. Any com-
parison between the schools that most blacks attend now and the ones
they attended in the 1950s favors contemporary schools. Assuming that
eclucat~on affects cognitive capacity, the rising investment in education
disproportionately benefits the cognitive levels at the lower end of the
socioeconomic spectrum.
The argument can be repeated for public health. If nutrition, shelter,
and health care affect intellectual development, then rising standards
of living are disproportionately going to show up in rising scores for the
economically disadvantaged rather than for the upper classes. For travel
and its educational henefits, the argument also applies. Not so long ago,
many less advantaged people spent their lives within a few miles of their
b~rthplaces. Today, Americans of nearly all walks of life crowd the in-
terstate roads and the airports. Finally, for that most contemporary form
of vicarious travel-the
popular media-the
leveling is still more dra-
matic. The modern media can bring the world to everyone in ways that
were once open only to the rich.
Because blacks are shifted toward the lower end of the socioeconomic
range, such improvements benef~t them, o n average, more than whites.
If the improvements affect cognitive development, the black-white gap
should have contracted. Beyond this socioeconomic leveling, there
might also have been a leveling due to diminishing racism. The legacy
of historic racism may still be taking its toll on cognitive development,
hut we must allow the possibility that it has lessened, at least for new
generations. This too might account for some narrowing of the black-
white gap.
LCXIKINC;
TO THE FUTURE.
The question that remains is whether black
and white test scores will continue to converge. If all that separates
blacks from whites are environmental differences and if fertility
patterns for different socioeconomic groups are comparable, there is
no reason why they shouldn't. The process would be very slow,
however. If it continues at the pace observed over the last twenty
years, then we could expect black and white SAT scores to reach
equality sometime in the middle of the twenty-first century, hut linear
extrapolations over such long periods are not worth much.'w1
If black fertility is loaded more heavily than white fertility toward
low-IQ segments of the population, then at some point convergence
may be expected to stop, and the gap could even hegin to widen again.
We take up the fertility issue in Chapter 15. A brief summary statement
concerning fertility patterns is that the news is not good. For now, the
test score data leave open the possibility that convergence has already
294
The Naticmal Context
Ethnic Differences in Cognitive Ability
295
stalled. For most of the tests we mentioned, black scores stopped rising
in the mid-1980s. On the NAEP, the B/W gap actually increased from
1986 to 1990 in all but one test group (the math test for 17-year-olds).
On the SAT, black scores on both verbal and math parts were nearly
flat for the five years ending in 1993, after substantial gains in the pre-
ceding decade. On the ACT, however, black scores continued to rise af-
ter 1986, albeit modestly.'611
One explanation for the stalled convergence on the NAEP and SAT
is that American education stopped improving for everyone, blacks in-
cluded. This is consistent with the white experience on the SAT, where
white scores have also been nearly flat since the mid.1980~. But the logic
is suspect. Just because a group at a higher mean stops improving does
not imply that a group with a lower mean should also stop improving.
On the contrary, pessimists can develop a case that the convergence of
black and white SAT scores in the last two decades is symptomatic of
what happens when education slows down toward the speed of the slow-
est ship in the convoy. It may well be that education improves for stu-
dents at the low end of the distribution but gets worse (or, more
optimistically, improves less) for students at the top end.'"I If that is the
case, the gap between people at the low and high end of the distribution
should narrow, but the narrowing will stop once the educational system
completes its readjustment favoring less capable students.
The narrowing black-white gap on the SAT lcwks consistent with
some such exp1anation.lm' Seen from one perspective, there is good news
all along the spectrum of test scores. From 1980 to 1993, the proportion
of black test takers who scored in the 700s on the SAT-Verbal increased
by 27 percent, for example.l"' But such changes at the high end of the
range of test scores mean little, because so smalk8 proportion of all black
students were inv01ved.l~~'
The real source of the black increase of
twenty-three points in the average verbal test score from 1980 to 1993
was a rise in the scores at the low end of the range. More than half (5 1
percent) of the gain occurred because the proportion of black students
scoring in the 200s dropped From 42 percent to 30
In con-
trast, less than 1 percent (0.4 percent) of the gain occurred because of
the change in the proportion of black students scoring in the 700s. For
the math test, 22 percent of the gain from 1980 to 1993 was accounted
for by a drop in students scoring in the 200s; 4 percent of it was ac-
counted for by an increase in students scoring in the 700s.
Pessimists reading these data may think of an analogy with the in-
creases in height that follow from better nutrition: Better nutrition helps
raise the height of children whose diets would otherwise have been in-
adequate, but it does not add anything to the height of those who have
been receiving a good diet already.lh7' Optimists may use the opposite
sort of nutritional analogy: the experience of trying to lose weight. Even
a successful diet has its plateaus, when the weight stubbornly stops corn-
ing off for a while. A plateau is all that we are seeing in recent test data.
Perhaps convergence will resume or even accelerate in the near future.
At the least, the optimists may say that it is too soon to pass judgment,
and that seems the safest conclusion. As we reach the end of this dis-
cussion of convergence, we can imagine the responses of readers of vary-
ing persuasions. Many of you will be wondering why we have felt it
necessary to qualify the good news. A smaller number of readers who
specialize in mental testing may be wondering why we have given so
much prominence to educational achievement trends and a scattering
of 1Q results that may be psychometrically ephemeral. The answer for
everyone is that predicting the future on this issue is little more than
guesswork at this point. We urge upon our readers a similar suspension
of judgment.
GENETICS, IQ, AND RACE
This brings us to the flashpoint of intelligence as a public topic: the
question of genetic differences between the races. Expert opinion, when
it is expressed at all, diverges widely. In the 1980s, Mark Snyderman and
Stanley Rothman, a psychologist and a political scientist, respectively,
sent a questionnaire to a broad sample of 1,020 scholars, mostly acade-
micians, whose specialties give them reason to be knowledgeable about
IQ.I6"' Among the other questions, they asked, "Which of the following
best characterizes your opinion of the heritability of the black-white dif-
ference in IQ?" (emphasis in the questionnaire item). The answers were
divided as follows:
The difference is entirely due to environmental variation: 15 per-
cent.
The difference is entirely due to genetic variation: 1 percent.
The difference is a product of both genetic and environmental
variation: 45 percent.
The Debate on Racial IQ
- Statistical analysis shows that recent gains in test scores are primarily driven by improvements at the bottom of the distribution rather than the top.
- Interpretations of these trends vary between 'pessimists' who see a biological ceiling and 'optimists' who believe we are merely on a temporary plateau.
- A survey of over 1,000 experts reveals a lack of consensus on the heritability of IQ differences, with 45 percent attributing differences to both genetics and environment.
- Despite the scientific uncertainty, many educational textbooks and public intellectuals assert that there is no evidence for genetic racial differences.
- The authors argue that predicting the future of cognitive convergence is currently guesswork and urge a suspension of definitive judgment.
We have considered leaving the genetics issue at that, on grounds that no useful purpose is served by talking about a subject that is so inflammatory, so painful, and so far from resolution.
294
The Naticmal Context
Ethnic Differences in Cognitive Ability
295
stalled. For most of the tests we mentioned, black scores stopped rising
in the mid-1980s. On the NAEP, the B/W gap actually increased from
1986 to 1990 in all but one test group (the math test for 17-year-olds).
On the SAT, black scores on both verbal and math parts were nearly
flat for the five years ending in 1993, after substantial gains in the pre-
ceding decade. On the ACT, however, black scores continued to rise af-
ter 1986, albeit modestly.'611
One explanation for the stalled convergence on the NAEP and SAT
is that American education stopped improving for everyone, blacks in-
cluded. This is consistent with the white experience on the SAT, where
white scores have also been nearly flat since the mid.1980~. But the logic
is suspect. Just because a group at a higher mean stops improving does
not imply that a group with a lower mean should also stop improving.
On the contrary, pessimists can develop a case that the convergence of
black and white SAT scores in the last two decades is symptomatic of
what happens when education slows down toward the speed of the slow-
est ship in the convoy. It may well be that education improves for stu-
dents at the low end of the distribution but gets worse (or, more
optimistically, improves less) for students at the top end.'"I If that is the
case, the gap between people at the low and high end of the distribution
should narrow, but the narrowing will stop once the educational system
completes its readjustment favoring less capable students.
The narrowing black-white gap on the SAT lcwks consistent with
some such exp1anation.lm' Seen from one perspective, there is good news
all along the spectrum of test scores. From 1980 to 1993, the proportion
of black test takers who scored in the 700s on the SAT-Verbal increased
by 27 percent, for example.l"' But such changes at the high end of the
range of test scores mean little, because so smalk8 proportion of all black
students were inv01ved.l~~'
The real source of the black increase of
twenty-three points in the average verbal test score from 1980 to 1993
was a rise in the scores at the low end of the range. More than half (5 1
percent) of the gain occurred because the proportion of black students
scoring in the 200s dropped From 42 percent to 30
In con-
trast, less than 1 percent (0.4 percent) of the gain occurred because of
the change in the proportion of black students scoring in the 700s. For
the math test, 22 percent of the gain from 1980 to 1993 was accounted
for by a drop in students scoring in the 200s; 4 percent of it was ac-
counted for by an increase in students scoring in the 700s.
Pessimists reading these data may think of an analogy with the in-
creases in height that follow from better nutrition: Better nutrition helps
raise the height of children whose diets would otherwise have been in-
adequate, but it does not add anything to the height of those who have
been receiving a good diet already.lh7' Optimists may use the opposite
sort of nutritional analogy: the experience of trying to lose weight. Even
a successful diet has its plateaus, when the weight stubbornly stops corn-
ing off for a while. A plateau is all that we are seeing in recent test data.
Perhaps convergence will resume or even accelerate in the near future.
At the least, the optimists may say that it is too soon to pass judgment,
and that seems the safest conclusion. As we reach the end of this dis-
cussion of convergence, we can imagine the responses of readers of vary-
ing persuasions. Many of you will be wondering why we have felt it
necessary to qualify the good news. A smaller number of readers who
specialize in mental testing may be wondering why we have given so
much prominence to educational achievement trends and a scattering
of 1Q results that may be psychometrically ephemeral. The answer for
everyone is that predicting the future on this issue is little more than
guesswork at this point. We urge upon our readers a similar suspension
of judgment.
GENETICS, IQ, AND RACE
This brings us to the flashpoint of intelligence as a public topic: the
question of genetic differences between the races. Expert opinion, when
it is expressed at all, diverges widely. In the 1980s, Mark Snyderman and
Stanley Rothman, a psychologist and a political scientist, respectively,
sent a questionnaire to a broad sample of 1,020 scholars, mostly acade-
micians, whose specialties give them reason to be knowledgeable about
IQ.I6"' Among the other questions, they asked, "Which of the following
best characterizes your opinion of the heritability of the black-white dif-
ference in IQ?" (emphasis in the questionnaire item). The answers were
divided as follows:
The difference is entirely due to environmental variation: 15 per-
cent.
The difference is entirely due to genetic variation: 1 percent.
The difference is a product of both genetic and environmental
variation: 45 percent.
296
The National Context
Ethnic Differences in Cognitive Ability
297
The data are insufficient to support any reasonable opinion: 24
percent.
e No response: 14 percent.
The responses reveal the degree of uncertainty within the scientific com-
munity about where the truth lies. We have considered leaving the ge-
netics issue at that, on grounds that no useful purpose is served by talking
about a subject that is so inflammatory, so painful, and so far from reso-
lution. We could have cited any number of expert reassurances that ge-
netic differences among ethnic groups are not worth worrying about. For
example, a recently published textbook from which college students
around the country are learning about intelligence states unequivocally
that "there is no convincing direct or indirect evidence in favor of a ge-
netic hypothesis of racial differences in IQ."" Stephen J. Gould, whose
Mismeasure of Man so successfully cemented the received wisdom about
IQ in the media, expresses this view as confidently and more eloquently.
"Equality [of the races] is not given a priori," he once wrote in his col-
umn for Natural History magazine. "It is neither an ethical principle
(though equal treatment may be) nor a statement about norms of social
action. It just worked out that way. A hundred different and plausihle
scenarios for human history would have yielded other results (and moral
dilemmas) of enormous magnitude. They just didn't happen."'" He goes
on to make three arguments. First, the very concept of race is illegiti-
mate, given the extensiveness of interbreeding and the imprecise nature
of most of the traits that people think of as being "racial." Second, the
division of races is recent, occurring only in the last tens or perhaps hun-
dreds of thousands of years, limiting the amount of time that groups of
humans could have taken separate evolutionary paths. Third, develop-
ments in genetics demonstrate that the genetic differences among hu-
man beings are minor. "We now know that our usual metaphor of
superficiality-skin deep-is
literally accurate," Gould write^.^' He con-
cludes: "Say it five times before breakfast tomorrow; more important, un-
derstand it as the center of a network of implication: 'Human equality
[i.e., equality among the races] is a contingent fact of history.' "7'
Our difficulty with this position is not that Gould (or others who
make similar arguments) is wrong about the blurred lines between the
races, or about how long the races have been separated, or ahout the
number of genes that are racially distinctive. All his facts can be true,
and yet people who call themselves Japanese or Xhosa or Caucasians or
Maori can still differ intellectually for genetic reasons. We may call them
"ethnic groups" tnstead of races if we wish-we
too are more comfort-
able with ethnic, because of the blurred lines-but
some ethnic groups
nonetheless differ genetically for sure, otherwise they would not have
d~ffering skin colors or hair textures or muscle mass. They also differ in-
tellectually on the average. The question remaining is whether the in-
tellectual differences overlap the genetic differences to any extent.
O u r reason for confronting the issue of genetic cognitive differences
is not to quarrel with those who deny them. If the question of genetic
differences in cognitive ability were something that only professors
argued about among themselves, we would happily ignore it here. We
cannot do so, first because in the public discussion of genes and intelli-
gence, no burden of proof at all is placed on the innumerable public
commentators who claim that racial differences in intelligence are
purely environmental. This sometimes leads ti? a next statement: that
the differences are therefore inauthentic and that public policy must be
measured against the assumption that there are no genuine cognitive
differences between the race^.^' The assumption of genetic cognitive
equality among the races has practical consequences that require us to
confront the assumption directly.
Second, we have become convinced that the topic of genes, intelli-
gence, and race in the late twentieth century is like the topic of sex in
Victorian England. Publicly, there seems to be nothing to talk about.
Privately, people are fascinated by it. As the gulf widens between pub-
lic discussion and private opinion, confusion and error flourish. As it
was true of sex then, so it is true of ethnic differences in intelligence
now: Taboos breed not only ignorance but misinformation.
The dangers of the misinformation are compounded by the nature
of the contemporary discussion of race. just heneath the surface of
American life, people talk about race in ways that bear little resem-
blance to the politically correct public discussron. Conducted in the
workplace, dorm rooms, taverns, and country clubs, by people in every
ethnic group, this dialogue is troubled and often accusatory. The un-
derground conversation is not limited to a racist minority. It goes on
everywhere, and we believe is increasingly shaped hy privately held be-
liefs about the implications of genetic differences that could not stand
open inspection.
The evidence about ethnic differences can be misused, as many peo-
ple say to us. Some readers may feel that this danger places a moral pro-
Genetics, Race, and Public Taboos
- Stephen Jay Gould argues that human racial equality is a contingent fact of history based on recent evolutionary divergence and minor genetic differences.
- The authors contend that even if racial categories are blurred, distinct ethnic groups possess genetic differences that manifest in physical and potentially intellectual traits.
- The text challenges the prevailing public assumption that racial differences in intelligence are purely environmental, arguing this stance lacks a burden of proof.
- The authors compare the modern discourse on race and intelligence to Victorian attitudes toward sex, where public silence masks intense private fascination.
- A widening gulf between 'politically correct' public discussion and private beliefs is seen as a breeding ground for misinformation and social friction.
- The authors argue that confronting the possibility of genetic cognitive differences is necessary because the assumption of equality has significant practical policy consequences.
Second, we have become convinced that the topic of genes, intelligence, and race in the late twentieth century is like the topic of sex in Victorian England.
296
The National Context
Ethnic Differences in Cognitive Ability
297
The data are insufficient to support any reasonable opinion: 24
percent.
e No response: 14 percent.
The responses reveal the degree of uncertainty within the scientific com-
munity about where the truth lies. We have considered leaving the ge-
netics issue at that, on grounds that no useful purpose is served by talking
about a subject that is so inflammatory, so painful, and so far from reso-
lution. We could have cited any number of expert reassurances that ge-
netic differences among ethnic groups are not worth worrying about. For
example, a recently published textbook from which college students
around the country are learning about intelligence states unequivocally
that "there is no convincing direct or indirect evidence in favor of a ge-
netic hypothesis of racial differences in IQ."" Stephen J. Gould, whose
Mismeasure of Man so successfully cemented the received wisdom about
IQ in the media, expresses this view as confidently and more eloquently.
"Equality [of the races] is not given a priori," he once wrote in his col-
umn for Natural History magazine. "It is neither an ethical principle
(though equal treatment may be) nor a statement about norms of social
action. It just worked out that way. A hundred different and plausihle
scenarios for human history would have yielded other results (and moral
dilemmas) of enormous magnitude. They just didn't happen."'" He goes
on to make three arguments. First, the very concept of race is illegiti-
mate, given the extensiveness of interbreeding and the imprecise nature
of most of the traits that people think of as being "racial." Second, the
division of races is recent, occurring only in the last tens or perhaps hun-
dreds of thousands of years, limiting the amount of time that groups of
humans could have taken separate evolutionary paths. Third, develop-
ments in genetics demonstrate that the genetic differences among hu-
man beings are minor. "We now know that our usual metaphor of
superficiality-skin deep-is
literally accurate," Gould write^.^' He con-
cludes: "Say it five times before breakfast tomorrow; more important, un-
derstand it as the center of a network of implication: 'Human equality
[i.e., equality among the races] is a contingent fact of history.' "7'
Our difficulty with this position is not that Gould (or others who
make similar arguments) is wrong about the blurred lines between the
races, or about how long the races have been separated, or ahout the
number of genes that are racially distinctive. All his facts can be true,
and yet people who call themselves Japanese or Xhosa or Caucasians or
Maori can still differ intellectually for genetic reasons. We may call them
"ethnic groups" tnstead of races if we wish-we
too are more comfort-
able with ethnic, because of the blurred lines-but
some ethnic groups
nonetheless differ genetically for sure, otherwise they would not have
d~ffering skin colors or hair textures or muscle mass. They also differ in-
tellectually on the average. The question remaining is whether the in-
tellectual differences overlap the genetic differences to any extent.
O u r reason for confronting the issue of genetic cognitive differences
is not to quarrel with those who deny them. If the question of genetic
differences in cognitive ability were something that only professors
argued about among themselves, we would happily ignore it here. We
cannot do so, first because in the public discussion of genes and intelli-
gence, no burden of proof at all is placed on the innumerable public
commentators who claim that racial differences in intelligence are
purely environmental. This sometimes leads ti? a next statement: that
the differences are therefore inauthentic and that public policy must be
measured against the assumption that there are no genuine cognitive
differences between the race^.^' The assumption of genetic cognitive
equality among the races has practical consequences that require us to
confront the assumption directly.
Second, we have become convinced that the topic of genes, intelli-
gence, and race in the late twentieth century is like the topic of sex in
Victorian England. Publicly, there seems to be nothing to talk about.
Privately, people are fascinated by it. As the gulf widens between pub-
lic discussion and private opinion, confusion and error flourish. As it
was true of sex then, so it is true of ethnic differences in intelligence
now: Taboos breed not only ignorance but misinformation.
The dangers of the misinformation are compounded by the nature
of the contemporary discussion of race. just heneath the surface of
American life, people talk about race in ways that bear little resem-
blance to the politically correct public discussron. Conducted in the
workplace, dorm rooms, taverns, and country clubs, by people in every
ethnic group, this dialogue is troubled and often accusatory. The un-
derground conversation is not limited to a racist minority. It goes on
everywhere, and we believe is increasingly shaped hy privately held be-
liefs about the implications of genetic differences that could not stand
open inspection.
The evidence about ethnic differences can be misused, as many peo-
ple say to us. Some readers may feel that this danger places a moral pro-
Genes, Environment, and Ethnic Differences
- The authors argue that the danger of suppressing private beliefs about genetic factors in cognitive ability is greater than the risk of publicizing the evidence.
- A critical distinction is made: high heritability of a trait within individuals does not automatically prove that differences between groups are genetic.
- Using a seed corn analogy, the text illustrates how identical genetic potential can yield vastly different outcomes based on environmental quality.
- Statistical modeling suggests that for IQ differences to be purely environmental, the average black environment would need to be at the 6th percentile of the white distribution.
- The authors contend that such extreme environmental disparities are implausible, especially since the black/white IQ gap actually widens at higher socioeconomic levels.
- The text questions why racism and discrimination have not suppressed the high cognitive scores of other historically marginalized groups like Jews or Chinese Americans.
Anyone who douhts this assertion may take two handfuls of genetically identical seed corn and plant one handful in Iowa, the other in the Mojave Desert, and let nature (i.e., the environment) take its course.
296
The National Context
Ethnic Differences in Cognitive Ability
297
The data are insufficient to support any reasonable opinion: 24
percent.
e No response: 14 percent.
The responses reveal the degree of uncertainty within the scientific com-
munity about where the truth lies. We have considered leaving the ge-
netics issue at that, on grounds that no useful purpose is served by talking
about a subject that is so inflammatory, so painful, and so far from reso-
lution. We could have cited any number of expert reassurances that ge-
netic differences among ethnic groups are not worth worrying about. For
example, a recently published textbook from which college students
around the country are learning about intelligence states unequivocally
that "there is no convincing direct or indirect evidence in favor of a ge-
netic hypothesis of racial differences in IQ."" Stephen J. Gould, whose
Mismeasure of Man so successfully cemented the received wisdom about
IQ in the media, expresses this view as confidently and more eloquently.
"Equality [of the races] is not given a priori," he once wrote in his col-
umn for Natural History magazine. "It is neither an ethical principle
(though equal treatment may be) nor a statement about norms of social
action. It just worked out that way. A hundred different and plausihle
scenarios for human history would have yielded other results (and moral
dilemmas) of enormous magnitude. They just didn't happen."'" He goes
on to make three arguments. First, the very concept of race is illegiti-
mate, given the extensiveness of interbreeding and the imprecise nature
of most of the traits that people think of as being "racial." Second, the
division of races is recent, occurring only in the last tens or perhaps hun-
dreds of thousands of years, limiting the amount of time that groups of
humans could have taken separate evolutionary paths. Third, develop-
ments in genetics demonstrate that the genetic differences among hu-
man beings are minor. "We now know that our usual metaphor of
superficiality-skin deep-is
literally accurate," Gould write^.^' He con-
cludes: "Say it five times before breakfast tomorrow; more important, un-
derstand it as the center of a network of implication: 'Human equality
[i.e., equality among the races] is a contingent fact of history.' "7'
Our difficulty with this position is not that Gould (or others who
make similar arguments) is wrong about the blurred lines between the
races, or about how long the races have been separated, or ahout the
number of genes that are racially distinctive. All his facts can be true,
and yet people who call themselves Japanese or Xhosa or Caucasians or
Maori can still differ intellectually for genetic reasons. We may call them
"ethnic groups" tnstead of races if we wish-we
too are more comfort-
able with ethnic, because of the blurred lines-but
some ethnic groups
nonetheless differ genetically for sure, otherwise they would not have
d~ffering skin colors or hair textures or muscle mass. They also differ in-
tellectually on the average. The question remaining is whether the in-
tellectual differences overlap the genetic differences to any extent.
O u r reason for confronting the issue of genetic cognitive differences
is not to quarrel with those who deny them. If the question of genetic
differences in cognitive ability were something that only professors
argued about among themselves, we would happily ignore it here. We
cannot do so, first because in the public discussion of genes and intelli-
gence, no burden of proof at all is placed on the innumerable public
commentators who claim that racial differences in intelligence are
purely environmental. This sometimes leads ti? a next statement: that
the differences are therefore inauthentic and that public policy must be
measured against the assumption that there are no genuine cognitive
differences between the race^.^' The assumption of genetic cognitive
equality among the races has practical consequences that require us to
confront the assumption directly.
Second, we have become convinced that the topic of genes, intelli-
gence, and race in the late twentieth century is like the topic of sex in
Victorian England. Publicly, there seems to be nothing to talk about.
Privately, people are fascinated by it. As the gulf widens between pub-
lic discussion and private opinion, confusion and error flourish. As it
was true of sex then, so it is true of ethnic differences in intelligence
now: Taboos breed not only ignorance but misinformation.
The dangers of the misinformation are compounded by the nature
of the contemporary discussion of race. just heneath the surface of
American life, people talk about race in ways that bear little resem-
blance to the politically correct public discussron. Conducted in the
workplace, dorm rooms, taverns, and country clubs, by people in every
ethnic group, this dialogue is troubled and often accusatory. The un-
derground conversation is not limited to a racist minority. It goes on
everywhere, and we believe is increasingly shaped hy privately held be-
liefs about the implications of genetic differences that could not stand
open inspection.
The evidence about ethnic differences can be misused, as many peo-
ple say to us. Some readers may feel that this danger places a moral pro-
298
The National Context
Ethnic Differences in Comitive Ability
299
hibition against examining the evidence for genetic factors in public.
We disagree, in part because we see even greater dangers in the current
gulf between public pronouncements and private heliefs. And so, for
better or worse, here are the major strands of current thinking about the
role of genes in cognitive differences between races.1741
Heritability and Group Differences
A good lace to start is by correcting a common confusion about the
role of genes in individuals and in groups. As we discussed in Chapter
4, scholars accept that IQ is substantially heritable, somewhere between
40 and 80 percent, meaning that much of the observed variation in IQ
is genetic. And yet this information tells us nothing for sure about the
origin of the differences between races in measured intelligence. This
point is so basic, and so commonly misunderstood, that it deserves em-
phasis: That a trait is genetically transmitted in individuals does not mean that
group differences in that trait are also genetic in m@n. Anyone who douhts
this assertion may take two handfuls of genetically identical seed corn
and plant one handful in Iowa, the other in the Mojave Desert, and let
nature (i.e., the environment) take its course.75 The seeds will grow in
Iowa, not in the Mojave, and the result will have nothing to do with
genetic differences.
The environment for American hlacks has been closer to the Mojave
and the environment for American whites has been closer to Iowa. We
may apply this general observation to the availahle data and see where
the results lead. Suppose that all the observed ethnic differences in
tested intelligence originate in some mysterious environmental differ-
ences-mysterious,
because we know from material already presented
that socioeconomic factors cannot be much of the explanation. We fur-
ther stipulate that one standard deviation (fifteen IQ points) separates
American blacks and whites and that a fifth of a standard deviation
(three IQ points) separates East Asians and whites. Finally, we assume
that IQ is 60 percent heritable (a middle-ground estimate). Given these
parameters, how different would the environments for the three groups
have to be in order to explain the observed difference in these scores?
The observed ethnic differences in IQ could be explained solely hy
the environment if the mean environment of whites is 1.58 standard
deviations better than the mean environment of blacks and .32 stan-
dard deviation worse than the mean environment for East Asians, when
environments are measured along the continuum of their capacity to
nurture intelligence.[761
Let's state these conclusions in percentile terms:
The average environment of blacks would have to be at the 6th per-
centile of the distribution of environments among whites, and the av-
erage environment ofEast Asians would have to be at the 63rd percentile
of environments among whites, for the racial differences to be entirely
environmental.
Environmental differences of this magnitude and pattern are im-
plausihle. Recall further that the B/W difference (in standardized units)
is smallest at the lowest socioeconomic levels. Why, if the B/W differ-
ence is entirely environmental, should the advantage of the "white" en-
vironment compared to the "black" he greater among the hetter-off and
better-educated blacks and whites? We have not been ahle to think of
a plausible reason. An appeal to the effects of racism to explain ethnic
differences also requires explaining why environments poisoned by dis-
crimination and racism for some other groups-against
the Chinese or
the Jews in some regions of America, for example-have
left them with
higher scores than the national average.
Environmental explanations may successfully circumvent these
problems, but the explanations have to be formulated rather than
simply assumed. Our initial objective is to warn readers who come to
the discussion with firmly held opinions on either side. The herit-
ability of individual differences in IQ does not necessarily mean that
ethnic differences are also heritable. But those who think that ethnic
differences are readily explained by environmental differences haven't
been tough-minded enough about their own argument. At this
complex intersection of complex factors, the easy answers are un-
satisfactory ones.
Reasons for Thinking that Genetic Differences Might Be Involved
Now we turn to some of the more technical arguments, beginning with
those that argue for some genetic component in group differences.
PROFILE DIFFERENCES
BETWEEN WHITES AND EAST ASIANS. Races
differ not just in average scores but in the profile of intellectual
capacities. A full-scale IQ score is the aggregate of many subtests.
There are thirteen of them in the Wechsler Intelligence Scale for
Children (WISC-R), for example. The most basic division of the
subtests is into a verbal IQ and a performance 1Q. In white samples,
Ethnic Differences in Cognitive Profiles
- The authors caution that neither genetic nor environmental explanations for ethnic IQ differences should be assumed without rigorous evidence.
- While individual IQ heritability is established, it does not automatically prove that differences between ethnic groups are also heritable.
- East Asian populations consistently demonstrate a distinct cognitive profile characterized by higher visuospatial scores compared to verbal scores.
- This specific cognitive imbalance persists across different cultures, including East Asians in Asia, overseas, and even infants adopted into Western families.
- The prevalence of Asian-Americans in STEM fields versus humanities may reflect these underlying cognitive profiles rather than just language barriers.
- Similar patterns of higher visuospatial than verbal performance are also observed in American Indian and Inuit populations.
At this complex intersection of complex factors, the easy answers are unsatisfactory ones.
298
The National Context
Ethnic Differences in Comitive Ability
299
hibition against examining the evidence for genetic factors in public.
We disagree, in part because we see even greater dangers in the current
gulf between public pronouncements and private heliefs. And so, for
better or worse, here are the major strands of current thinking about the
role of genes in cognitive differences between races.1741
Heritability and Group Differences
A good lace to start is by correcting a common confusion about the
role of genes in individuals and in groups. As we discussed in Chapter
4, scholars accept that IQ is substantially heritable, somewhere between
40 and 80 percent, meaning that much of the observed variation in IQ
is genetic. And yet this information tells us nothing for sure about the
origin of the differences between races in measured intelligence. This
point is so basic, and so commonly misunderstood, that it deserves em-
phasis: That a trait is genetically transmitted in individuals does not mean that
group differences in that trait are also genetic in m@n. Anyone who douhts
this assertion may take two handfuls of genetically identical seed corn
and plant one handful in Iowa, the other in the Mojave Desert, and let
nature (i.e., the environment) take its course.75 The seeds will grow in
Iowa, not in the Mojave, and the result will have nothing to do with
genetic differences.
The environment for American hlacks has been closer to the Mojave
and the environment for American whites has been closer to Iowa. We
may apply this general observation to the availahle data and see where
the results lead. Suppose that all the observed ethnic differences in
tested intelligence originate in some mysterious environmental differ-
ences-mysterious,
because we know from material already presented
that socioeconomic factors cannot be much of the explanation. We fur-
ther stipulate that one standard deviation (fifteen IQ points) separates
American blacks and whites and that a fifth of a standard deviation
(three IQ points) separates East Asians and whites. Finally, we assume
that IQ is 60 percent heritable (a middle-ground estimate). Given these
parameters, how different would the environments for the three groups
have to be in order to explain the observed difference in these scores?
The observed ethnic differences in IQ could be explained solely hy
the environment if the mean environment of whites is 1.58 standard
deviations better than the mean environment of blacks and .32 stan-
dard deviation worse than the mean environment for East Asians, when
environments are measured along the continuum of their capacity to
nurture intelligence.[761
Let's state these conclusions in percentile terms:
The average environment of blacks would have to be at the 6th per-
centile of the distribution of environments among whites, and the av-
erage environment ofEast Asians would have to be at the 63rd percentile
of environments among whites, for the racial differences to be entirely
environmental.
Environmental differences of this magnitude and pattern are im-
plausihle. Recall further that the B/W difference (in standardized units)
is smallest at the lowest socioeconomic levels. Why, if the B/W differ-
ence is entirely environmental, should the advantage of the "white" en-
vironment compared to the "black" he greater among the hetter-off and
better-educated blacks and whites? We have not been ahle to think of
a plausible reason. An appeal to the effects of racism to explain ethnic
differences also requires explaining why environments poisoned by dis-
crimination and racism for some other groups-against
the Chinese or
the Jews in some regions of America, for example-have
left them with
higher scores than the national average.
Environmental explanations may successfully circumvent these
problems, but the explanations have to be formulated rather than
simply assumed. Our initial objective is to warn readers who come to
the discussion with firmly held opinions on either side. The herit-
ability of individual differences in IQ does not necessarily mean that
ethnic differences are also heritable. But those who think that ethnic
differences are readily explained by environmental differences haven't
been tough-minded enough about their own argument. At this
complex intersection of complex factors, the easy answers are un-
satisfactory ones.
Reasons for Thinking that Genetic Differences Might Be Involved
Now we turn to some of the more technical arguments, beginning with
those that argue for some genetic component in group differences.
PROFILE DIFFERENCES
BETWEEN WHITES AND EAST ASIANS. Races
differ not just in average scores but in the profile of intellectual
capacities. A full-scale IQ score is the aggregate of many subtests.
There are thirteen of them in the Wechsler Intelligence Scale for
Children (WISC-R), for example. The most basic division of the
subtests is into a verbal IQ and a performance 1Q. In white samples,
300
The National Context
Ethnic Differences in Cognitive Ability
301
the verbal and performance IQ subscores tend to have about the same
mean, because IQ tests have been standardized on predominantly
white populations. But individuals can have imbalances between
these two 1Qs. People with high verbal abilities are likely to do well
with words and logic. In school they excel in history and literature; in
choosing a career to draw on those talents, they tend to choose law or
journalism or advertising or politics. In contrast, people with high
performance IQs--or, using a more descriptive phrase, "visuospatial
abilitiesv-are
likely to do well in the physical and biological
sciences, mathematics, engineering, or other suhjects that demand
mental manipulation in the three physical dimensions or the more
numerous dimensions of mathematics.
East Asians living overseas score about the same or slightly lower than
whites on verbal 1Q and substantially higher on visuospatial 1Q. Even
in the rare studies that have found overall Japanese or Chinese IQs no
higher than white lQs (e.g., the Stevenson study of Japanese, Taiwanese,
and Minnesotans mentioned earlier),77 the discrepancy between verbal
and visuospatial IQ persists. For Japanese living in Asia, a 1987 review
of the literature demonstrated without much question that the verbal-
visuospatial difference persists even in examinations that have been
thoroughly adapted to the Japanese language and, indeed, in tests de-
veloped by the Japanese them~elves.~'
A study of a small sample of Ko-
rean infants adopted into white families in Belgium found the familiar
elevated visuospatial scores.79
This finding has an echo in the United States, where Asian-Ameri-
can students abound in engineering, in medical schools, and in gradu-
ate programs in the sciences, but are scarce in law schools and graduate
programs in the humanities and social sciences. Most people reflexively
assume that this can be explained by language differences. People who
did not speak English as their first language or who grew up in house-
holds where English was not the language of choice choose professions
that are not so dependent on fluent English, we often hear. Rut the ex-
planation becomes less credible with every passing year. Philip Vernon,
after reviewing the evidence on Asian-Americans, concluded that un-
familiarity with the English language and American culture is a plausi-
ble explanation only for the results of the early studies. Contemporary
studies of Asian-Americans who are thoroughly acculturated also show
the typical discrepancy in verbal and visuospatial abilities. American
Indians and Inuit similarly score higher visuospatially than verbally;
their ancestors migrated to the Americas from East Asia hundreds of
centuries ago.Ho The verbal-visuospatial discrepancy goes deeper than
linguistic background.
Vernon's overall appraisal was that the mean Asian-American IQ is
about 97 on verbal tests and about 110 on visuospatial tests.lH" Lynn's
1987 review of the IQ literature on East Asians found a median verbal
IQ of 98 and a median visuospatial IQ of 106.1H21
AS of 1993, for Asian-
American students who reported that English was the first language they
learned (alone or with another language), the Asian-American SAT
mean was .2 1 standard deviation above the national mean on the ver-
ha1 test and .43 standard deviation above the national mean on the math
test. Converted to an IQ metric, this amounts to a 3.3 point elevation
of mathematical scores over verbal scores for the high IQ Asian-Amer-
ican population that takes the SAT.'"^
Why do visuospatial abilities develop more than verbal abilities in
people of East Asian ancestry in Japan, Hong Kong, Taiwan, mainland
China, and other Asian countries and in the United States and else-
where, despite the differences among the cultures and languages in all
those countries? Any simple socioeconomic, cultural, or linguistic ex-
planation is out of the question, given the diversity of living conditions,
native languages, educational resources, and cultural practices experi-
enced by Hong Kong Chinese, Japanese in Japan or the United States,
Koreans in Korea or Belgium, and Inuit or American Indians. We are
not so rash as to assert that the environment or the culture is wholly ir-
relevant to the development of verbal and visuospatial abilities, but the
common genetic history of racial East Asians and their North Ameri-
can or European descendants on the one hand, and the racial Europeans
and their North American descendants, on the other, cannot plausibly
be dismissed as irrelevant.
PROFILE DIFFERENCES
BETWEEN WHITES
AND BLACKS. Turning now t o
blacks and whites (using these terms to refer exclusively to Americans),
ability profiles have also been important in understanding the nature,
and possible genetic component, of group differences. The argument has
been developing around what is known as Spearman's hypothesis.'H41 This
hypothesis says that if the B/W difference on test scores reflects a real un-
derlying difference in the general mental ability, g, then the size of the
B/W difference will be related to the degree to which the test is saturated
withg.IH5' In other words, the better a test measuresg, the larger the black-
Cognitive Profiles and Ethnic Differences
- Research indicates a consistent verbal-visuospatial discrepancy in East Asian populations, with visuospatial scores typically outperforming verbal scores.
- This cognitive pattern persists across diverse geographic locations and socioeconomic conditions, including East Asia, North America, and Europe.
- The authors argue that simple cultural or linguistic explanations are insufficient to explain these global patterns, suggesting a role for common genetic history.
- Spearman's hypothesis is introduced to examine Black-White cognitive differences, suggesting gaps are largest on tests most saturated with general mental ability (g).
- A comparison of subtest patterns shows that while low-SES and high-SES whites with identical IQs share the same subtest profiles, Black and White individuals with identical IQs do not.
Any simple socioeconomic, cultural, or linguistic explanation is out of the question, given the diversity of living conditions, native languages, educational resources, and cultural practices.
300
The National Context
Ethnic Differences in Cognitive Ability
301
the verbal and performance IQ subscores tend to have about the same
mean, because IQ tests have been standardized on predominantly
white populations. But individuals can have imbalances between
these two 1Qs. People with high verbal abilities are likely to do well
with words and logic. In school they excel in history and literature; in
choosing a career to draw on those talents, they tend to choose law or
journalism or advertising or politics. In contrast, people with high
performance IQs--or, using a more descriptive phrase, "visuospatial
abilitiesv-are
likely to do well in the physical and biological
sciences, mathematics, engineering, or other suhjects that demand
mental manipulation in the three physical dimensions or the more
numerous dimensions of mathematics.
East Asians living overseas score about the same or slightly lower than
whites on verbal 1Q and substantially higher on visuospatial 1Q. Even
in the rare studies that have found overall Japanese or Chinese IQs no
higher than white lQs (e.g., the Stevenson study of Japanese, Taiwanese,
and Minnesotans mentioned earlier),77 the discrepancy between verbal
and visuospatial IQ persists. For Japanese living in Asia, a 1987 review
of the literature demonstrated without much question that the verbal-
visuospatial difference persists even in examinations that have been
thoroughly adapted to the Japanese language and, indeed, in tests de-
veloped by the Japanese them~elves.~'
A study of a small sample of Ko-
rean infants adopted into white families in Belgium found the familiar
elevated visuospatial scores.79
This finding has an echo in the United States, where Asian-Ameri-
can students abound in engineering, in medical schools, and in gradu-
ate programs in the sciences, but are scarce in law schools and graduate
programs in the humanities and social sciences. Most people reflexively
assume that this can be explained by language differences. People who
did not speak English as their first language or who grew up in house-
holds where English was not the language of choice choose professions
that are not so dependent on fluent English, we often hear. Rut the ex-
planation becomes less credible with every passing year. Philip Vernon,
after reviewing the evidence on Asian-Americans, concluded that un-
familiarity with the English language and American culture is a plausi-
ble explanation only for the results of the early studies. Contemporary
studies of Asian-Americans who are thoroughly acculturated also show
the typical discrepancy in verbal and visuospatial abilities. American
Indians and Inuit similarly score higher visuospatially than verbally;
their ancestors migrated to the Americas from East Asia hundreds of
centuries ago.Ho The verbal-visuospatial discrepancy goes deeper than
linguistic background.
Vernon's overall appraisal was that the mean Asian-American IQ is
about 97 on verbal tests and about 110 on visuospatial tests.lH" Lynn's
1987 review of the IQ literature on East Asians found a median verbal
IQ of 98 and a median visuospatial IQ of 106.1H21
AS of 1993, for Asian-
American students who reported that English was the first language they
learned (alone or with another language), the Asian-American SAT
mean was .2 1 standard deviation above the national mean on the ver-
ha1 test and .43 standard deviation above the national mean on the math
test. Converted to an IQ metric, this amounts to a 3.3 point elevation
of mathematical scores over verbal scores for the high IQ Asian-Amer-
ican population that takes the SAT.'"^
Why do visuospatial abilities develop more than verbal abilities in
people of East Asian ancestry in Japan, Hong Kong, Taiwan, mainland
China, and other Asian countries and in the United States and else-
where, despite the differences among the cultures and languages in all
those countries? Any simple socioeconomic, cultural, or linguistic ex-
planation is out of the question, given the diversity of living conditions,
native languages, educational resources, and cultural practices experi-
enced by Hong Kong Chinese, Japanese in Japan or the United States,
Koreans in Korea or Belgium, and Inuit or American Indians. We are
not so rash as to assert that the environment or the culture is wholly ir-
relevant to the development of verbal and visuospatial abilities, but the
common genetic history of racial East Asians and their North Ameri-
can or European descendants on the one hand, and the racial Europeans
and their North American descendants, on the other, cannot plausibly
be dismissed as irrelevant.
PROFILE DIFFERENCES
BETWEEN WHITES
AND BLACKS. Turning now t o
blacks and whites (using these terms to refer exclusively to Americans),
ability profiles have also been important in understanding the nature,
and possible genetic component, of group differences. The argument has
been developing around what is known as Spearman's hypothesis.'H41 This
hypothesis says that if the B/W difference on test scores reflects a real un-
derlying difference in the general mental ability, g, then the size of the
B/W difference will be related to the degree to which the test is saturated
withg.IH5' In other words, the better a test measuresg, the larger the black-
302
The National Context
Ethnic Differences in Cognitive Ability
303
white difference will be. Arthur Jensen began to explore this possibility
when he looked at the pattern of subtest scores on the WISC-R, taking
advantage of the fact that the WISC-R has thirteen subtests, each mea-
suring a somewhat different skill. Converting their statistical procedures
into a more easily understood form, here is the logic of what Arthur
Jensen and his coauthor, Cyril Reynolds, did.'"
O n average, low-SES whites get lower test scores than high-SES
whites. But suppose you were to go through a large set of white test scores
from a low-SES and a high-SES group and pull out everyone with an
overall lQ score of, say, 105. Now you have identical scores but very dif-
ferent SES groups. The question becomes, What does the pattern of sub-
test scores look like? The answer is, The same. Once you equalize the
overall IQ scores, low-SES and high-SES whites also had close-to-iden-
tical mean scores on the individual subtests.
Now do the same exercise with blacks and whites. Again, let us say
that you pull all the tests with a full-scale IQ score of exactly 105. Again,
you examine the scores on the subtests. But this time the pattern of sub-
test scores is not the same for blacks and whites, even though the suh-
tests add up to the identical overall score.'"' Despite identical overall
scores, whites are characteristically stronger than blacks on the suhtests
involving spatial-perceptual ability, and blacks are characteristically
stronger than whites in subtests such as arithmetic and immediate mem-
ory, both of which involve retention and retrieval of information." As
Jensen and Reynolds note, the pattern of subtest differences between
whites and blacks differs sharply from the "no differences" result
associated with SES. This directly contradicts the hypothesis that the
R/W difference reflects primarily SES differences." What accounts for
the different subtest profiles? Jensen and Reynolds proceeded to demon-
strate that the results are consistent with Spearman's hypothesis. Whites
and blacks differ more on the subtests most highly correlated with g, less
on those least correlated with g.
Since that initial study using the WISC-R, Jensen has been assem-
bling studies that permit further tests of Spearman's hypothesis. He con-
cluded from over a dozen large and representative samples of blacks and
whitesw that "Spearman's hypothesis has been borne out significantly
by every study (i.e., 13 out of 13) and no appropriate data set has yet
been found that contradicts Spearman's hypothesis."" l e r e appears to
be no dispute with his summary of the facts. It should be noted that not
all group differences behave similarly. For example, deaf children often
get lower test scores than hearing children, but the size of the difference
is not positively correlated with the test's loading on g.YZ The phenom-
enon seems peculiarly concentrated in comparisons of ethnic groups.
Jensen's most recent work on Spearman's hypothesis uses reaction
time tests instead of traditional mental tests, bypassing many of the usual
objections to intelligence test questions. Once again, the more g-loaded
the activity is, the larger the B/W difference is, on average.'j Critics can
argue that the entire enterprise is meaningless hecause g is meaning-
less, hut the hypothesis of a correlation between the magnitude of the
g-loading of a test and the magnitude of the black-white difference on
that test has been
How does the confirmation of Spearman's hypothesis bear on the ge-
netic explanation of ethnic differences? In plain though somewhat im-
precise language: The hroadest conception of intelligence is embodied
in g. Anything other than g is either a narrower cognitive capacity or
measurement error. Spearman's hypothesis says in effect that as mental
measurement focuses most specifically and reliably on g, the observed
black-white mean difference in cognitive ability gets larger.'"' At the
same time, g or other broad measures of intelligence typically have rel-
atively high levels of heritability.''" This does not in itself demand a ge-
netic explanation of the ethnic difference, but by asserting that "the
better the test, the greater the ethnic difference," Spearman's hypothe-
sis undercuts many of the environmental explanations of the difference
that rely on the proposition (again, simplifying) that the apparent hlack-
white difference is the result of bad tests, not good ones.
Arguments Against a Genetic Explanation
The ubiquitous Arthur Jensen has also published the clearest evidence
that the disadvantaged environment of some blacks has depressed their
test scores. He found that in black families in rural Georgia, the elder
sibling typically has a lower IQ than the younger.97 The larger the age
difference is between the siblings, the larger is the difference in IQ. The
implication is that something in the rural Georg~a environment was de-
pressing the scores of hlack children as they grew older.lgX' In neither the
white families of Georgia, nor white or black families in Berkeley,
California, are there comparable signs of a depressive effect of the
environment.
But demonstrating that environment can depress cognitive develop-
Spearman's Hypothesis and Ethnic Differences
- Research indicates that black and white test-takers show distinct subtest profiles, with whites scoring higher on spatial-perceptual tasks and blacks scoring higher on arithmetic and memory.
- The pattern of differences between ethnic groups contradicts the hypothesis that socioeconomic status (SES) is the primary driver of the IQ gap.
- Spearman's hypothesis suggests that the magnitude of the black-white difference is positively correlated with a test's 'g' loading, or its measure of general intelligence.
- This phenomenon appears specific to ethnic comparisons, as other groups like deaf children do not show the same correlation between g-loading and score deficits.
- The confirmation of Spearman's hypothesis challenges environmentalist critiques by suggesting that the more 'accurate' a mental test is, the larger the observed ethnic gap becomes.
- Despite findings on g-loading, evidence from rural Georgia suggests that specific disadvantaged environments can progressively depress the IQ scores of black children over time.
Spearman's hypothesis says in effect that as mental measurement focuses most specifically and reliably on g, the observed black-white mean difference in cognitive ability gets larger.
302
The National Context
Ethnic Differences in Cognitive Ability
303
white difference will be. Arthur Jensen began to explore this possibility
when he looked at the pattern of subtest scores on the WISC-R, taking
advantage of the fact that the WISC-R has thirteen subtests, each mea-
suring a somewhat different skill. Converting their statistical procedures
into a more easily understood form, here is the logic of what Arthur
Jensen and his coauthor, Cyril Reynolds, did.'"
O n average, low-SES whites get lower test scores than high-SES
whites. But suppose you were to go through a large set of white test scores
from a low-SES and a high-SES group and pull out everyone with an
overall lQ score of, say, 105. Now you have identical scores but very dif-
ferent SES groups. The question becomes, What does the pattern of sub-
test scores look like? The answer is, The same. Once you equalize the
overall IQ scores, low-SES and high-SES whites also had close-to-iden-
tical mean scores on the individual subtests.
Now do the same exercise with blacks and whites. Again, let us say
that you pull all the tests with a full-scale IQ score of exactly 105. Again,
you examine the scores on the subtests. But this time the pattern of sub-
test scores is not the same for blacks and whites, even though the suh-
tests add up to the identical overall score.'"' Despite identical overall
scores, whites are characteristically stronger than blacks on the suhtests
involving spatial-perceptual ability, and blacks are characteristically
stronger than whites in subtests such as arithmetic and immediate mem-
ory, both of which involve retention and retrieval of information." As
Jensen and Reynolds note, the pattern of subtest differences between
whites and blacks differs sharply from the "no differences" result
associated with SES. This directly contradicts the hypothesis that the
R/W difference reflects primarily SES differences." What accounts for
the different subtest profiles? Jensen and Reynolds proceeded to demon-
strate that the results are consistent with Spearman's hypothesis. Whites
and blacks differ more on the subtests most highly correlated with g, less
on those least correlated with g.
Since that initial study using the WISC-R, Jensen has been assem-
bling studies that permit further tests of Spearman's hypothesis. He con-
cluded from over a dozen large and representative samples of blacks and
whitesw that "Spearman's hypothesis has been borne out significantly
by every study (i.e., 13 out of 13) and no appropriate data set has yet
been found that contradicts Spearman's hypothesis."" l e r e appears to
be no dispute with his summary of the facts. It should be noted that not
all group differences behave similarly. For example, deaf children often
get lower test scores than hearing children, but the size of the difference
is not positively correlated with the test's loading on g.YZ The phenom-
enon seems peculiarly concentrated in comparisons of ethnic groups.
Jensen's most recent work on Spearman's hypothesis uses reaction
time tests instead of traditional mental tests, bypassing many of the usual
objections to intelligence test questions. Once again, the more g-loaded
the activity is, the larger the B/W difference is, on average.'j Critics can
argue that the entire enterprise is meaningless hecause g is meaning-
less, hut the hypothesis of a correlation between the magnitude of the
g-loading of a test and the magnitude of the black-white difference on
that test has been
How does the confirmation of Spearman's hypothesis bear on the ge-
netic explanation of ethnic differences? In plain though somewhat im-
precise language: The hroadest conception of intelligence is embodied
in g. Anything other than g is either a narrower cognitive capacity or
measurement error. Spearman's hypothesis says in effect that as mental
measurement focuses most specifically and reliably on g, the observed
black-white mean difference in cognitive ability gets larger.'"' At the
same time, g or other broad measures of intelligence typically have rel-
atively high levels of heritability.''" This does not in itself demand a ge-
netic explanation of the ethnic difference, but by asserting that "the
better the test, the greater the ethnic difference," Spearman's hypothe-
sis undercuts many of the environmental explanations of the difference
that rely on the proposition (again, simplifying) that the apparent hlack-
white difference is the result of bad tests, not good ones.
Arguments Against a Genetic Explanation
The ubiquitous Arthur Jensen has also published the clearest evidence
that the disadvantaged environment of some blacks has depressed their
test scores. He found that in black families in rural Georgia, the elder
sibling typically has a lower IQ than the younger.97 The larger the age
difference is between the siblings, the larger is the difference in IQ. The
implication is that something in the rural Georg~a environment was de-
pressing the scores of hlack children as they grew older.lgX' In neither the
white families of Georgia, nor white or black families in Berkeley,
California, are there comparable signs of a depressive effect of the
environment.
But demonstrating that environment can depress cognitive develop-
Debating Cognitive Ability Differences
- The authors highlight an asymmetry in the debate: genetic proponents allow for environmental factors, while opponents often deny any genetic role entirely.
- Spearman's hypothesis suggests that the racial gap in test scores is largest on tasks that most heavily require general intelligence (g).
- A scholarly review of Jensen's evidence showed that while critics raised philosophical and technical objections, few could dispute the empirical data regarding the 'g' loading gap.
- Sociologist Jane Mercer argues that IQ tests are cultural artifacts and that subcultures vary in ways that inevitably affect performance.
- Mercer's 'uniform background radiation' theory suggests cultural influence is diffuse and affects even seemingly culture-free test items.
- The text concludes that Spearman's hypothesis remains a significant challenge to purely environmental explanations of cognitive differences.
Those who argue that genes might be implicated in group differences do not try to argue that genes explain everything.
304
The National Context
Ethnic Differences in Cognitive Ability
305
ment does not prove that the entire B/W difference is environmental,
and in this lies an asymmetry between the contending parties in the de-
bate. Those who argue that genes might be implicated in group differ-
ences do not try to argue that genes explain everything. Those who
argue against them-Leon
Kamin and Richard Lewontin are the most
prominent-typically
deny that genes have anything to do with group
differences, a much more ambitious proposition.
CONFRONTING
SPEARMAN'S
HYPOTHESIS.
If one is to make this case
against a genetic factor on psychometric grounds, the data supporting
Spearman's hypothesis must be confronted. There are two ways to do
so: dispute the fact itself or grant the fact but argue that it does not
mean what Jensen says it does.
The most searching debate about Spearman's hypothesis was con-
ducted in a journal that publishes both original scholarly works and com-
mentaries on them, Behavioral and Brain Sciences, where, in two separate
issues in the latter 1980s, thirty-six experts in the relevant fields com-
mented on Jensen's e v i d e n ~ e . ~
A number of comments were favorable
and provided further support for Jensen's conclusion. Others were criti-
cal, for reasons that varied from the philosophical (research into such
hurtful issues is not useful) to the highly technical (were Jensen's results
the result of varying reliabilities among the tests?). We summarize them
in the notes, but the striking feature was that no commentator was able
to dispute the empirical claim that the racial gap in cognitive performance
scores tends to be larger on tests or activities that draw most on R.l'w'
Several years after the exchange on Spearman's hypothesis in Be-
havioral and Brain Sciences, Jan-Eric Gustafsson presented some data
finding a considerably smaller correlation than Jensen and others do be-
tween g loading and B/W differences on a group of subtests.'" It is not
clear why Gustafsson obtained these atypical results, but, as of this writ-
ing, they are still atypical. We have found no others for representative
groups of blacks and whites. Our own appraisal of the situation is that
Jensen's main contentions regarding Spearman's hypothesis are intact
and constitute a major challenge to purely environmental explanations
of the B/W difference.
CULTURAL EXPLANATIONS.
Another approach has been taken by Jane
Mercer, a sociologist and the developer of the System of Multicultural
Pluralistic Assessment (SOMPA). Tests are artifacts of a culture, she
argues, and a culture may not diffuse equally into every household and
community. In a heterogeneous society, subcultures vary in ways that
inevitably affect scores on IQ tests. Fewer books in the home means
less exposure to the material that a vocabulary subtest measures; the
varying ways of socializing children may influence whether a child
acquires the skills, or a desire for the skills, that tests test; the
"common knowledge" that tests supposedly draw on may not be
common in certain households and neighborhoods.
So far, this sounds like a standard argument about cultural bias, and
yet Mercer accepts the generalizations that we discussed earlier about
internal evidence of bias.lo2 She is not claiming that less exposure to
books means that blacks score lower on vocabulary questions but do as
well as whites on culture-free items. Rather, she argues, the effects of
culture are more diffuse. Her argument may be seen as a variant of the
"uniform background radiation" hypothesis that we discussed earlier.
Furthermore, she points out, strong correlations between home or
community life and IQ scores are readily found. In a study of 180 Latino
and 180 non-Latino white elementary school children in Riverside,
California, Mercer examined eight sociocultural variables: (1) mother's
participation in formal organizations, (2) living in a segregated neigh-
borhood, (3) home language level, (4) socioeconomic status based on
occupation and education of head of household, (5) urbanization, (6)
mother's achievement values, (7) home ownership, and (8) intact bio-
logical family. She then showed that once these sociocultural variables
were taken into account, the remaining correlation between ethnic
group and IQ among the children fell to near zero.lO'
The problem with this procedure lies in determining what, in fact,
these eight variables control for: cultural diffusion, or genetic sources of
variation in intelligence as ordinarily understood? Recall that we
pointed out earlier that controlling for socioeconomic status typically
reduces the BrJCI difference by about a third. To the extent that parental
socioeconomic status is produced by parental IQ, controlling for so-
cioeconomic status controls for parental IQ. One obvious criticism of
SOMPA is that it broadens the scope of the control variables to such
an extent that the procedure becomes meaningless. After the correla-
tions between the eight sociocultural variables and IQ are, in effect, set
to zero, little difference in IQ remains among her ethnic samples. But
what does this mean? The obvious possibility is that Mercer has demon-
strated only that parents matched on IQ will produce children with sim-
ilar IQs-not
a startling finding.
The Debate Over Sociocultural Variables
- Jane Mercer's SOMPA system uses eight sociocultural variables to argue that ethnic IQ differences disappear when environmental factors are controlled.
- Critics argue that controlling for variables like socioeconomic status and home ownership effectively controls for parental IQ, making the results circular.
- The authors contend that Mercer fails to prove sociocultural characteristics are independent of genetic intelligence factors.
- The text highlights that sociocultural theories fail to explain why the black-white IQ gap is most pronounced on tests with high 'g' loading.
- Alternative theories, such as Wade Boykin's, suggest a distinctive black culture with dimensions like spirituality that conflict with Eurocentric testing models.
- The authors note that cultural diffusion theories do not explain why certain groups, like Asians, excel despite not being part of the dominant European white culture.
One obvious criticism of SOMPA is that it broadens the scope of the control variables to such an extent that the procedure becomes meaningless.
304
The National Context
Ethnic Differences in Cognitive Ability
305
ment does not prove that the entire B/W difference is environmental,
and in this lies an asymmetry between the contending parties in the de-
bate. Those who argue that genes might be implicated in group differ-
ences do not try to argue that genes explain everything. Those who
argue against them-Leon
Kamin and Richard Lewontin are the most
prominent-typically
deny that genes have anything to do with group
differences, a much more ambitious proposition.
CONFRONTING
SPEARMAN'S
HYPOTHESIS.
If one is to make this case
against a genetic factor on psychometric grounds, the data supporting
Spearman's hypothesis must be confronted. There are two ways to do
so: dispute the fact itself or grant the fact but argue that it does not
mean what Jensen says it does.
The most searching debate about Spearman's hypothesis was con-
ducted in a journal that publishes both original scholarly works and com-
mentaries on them, Behavioral and Brain Sciences, where, in two separate
issues in the latter 1980s, thirty-six experts in the relevant fields com-
mented on Jensen's e v i d e n ~ e . ~
A number of comments were favorable
and provided further support for Jensen's conclusion. Others were criti-
cal, for reasons that varied from the philosophical (research into such
hurtful issues is not useful) to the highly technical (were Jensen's results
the result of varying reliabilities among the tests?). We summarize them
in the notes, but the striking feature was that no commentator was able
to dispute the empirical claim that the racial gap in cognitive performance
scores tends to be larger on tests or activities that draw most on R.l'w'
Several years after the exchange on Spearman's hypothesis in Be-
havioral and Brain Sciences, Jan-Eric Gustafsson presented some data
finding a considerably smaller correlation than Jensen and others do be-
tween g loading and B/W differences on a group of subtests.'" It is not
clear why Gustafsson obtained these atypical results, but, as of this writ-
ing, they are still atypical. We have found no others for representative
groups of blacks and whites. Our own appraisal of the situation is that
Jensen's main contentions regarding Spearman's hypothesis are intact
and constitute a major challenge to purely environmental explanations
of the B/W difference.
CULTURAL EXPLANATIONS.
Another approach has been taken by Jane
Mercer, a sociologist and the developer of the System of Multicultural
Pluralistic Assessment (SOMPA). Tests are artifacts of a culture, she
argues, and a culture may not diffuse equally into every household and
community. In a heterogeneous society, subcultures vary in ways that
inevitably affect scores on IQ tests. Fewer books in the home means
less exposure to the material that a vocabulary subtest measures; the
varying ways of socializing children may influence whether a child
acquires the skills, or a desire for the skills, that tests test; the
"common knowledge" that tests supposedly draw on may not be
common in certain households and neighborhoods.
So far, this sounds like a standard argument about cultural bias, and
yet Mercer accepts the generalizations that we discussed earlier about
internal evidence of bias.lo2 She is not claiming that less exposure to
books means that blacks score lower on vocabulary questions but do as
well as whites on culture-free items. Rather, she argues, the effects of
culture are more diffuse. Her argument may be seen as a variant of the
"uniform background radiation" hypothesis that we discussed earlier.
Furthermore, she points out, strong correlations between home or
community life and IQ scores are readily found. In a study of 180 Latino
and 180 non-Latino white elementary school children in Riverside,
California, Mercer examined eight sociocultural variables: (1) mother's
participation in formal organizations, (2) living in a segregated neigh-
borhood, (3) home language level, (4) socioeconomic status based on
occupation and education of head of household, (5) urbanization, (6)
mother's achievement values, (7) home ownership, and (8) intact bio-
logical family. She then showed that once these sociocultural variables
were taken into account, the remaining correlation between ethnic
group and IQ among the children fell to near zero.lO'
The problem with this procedure lies in determining what, in fact,
these eight variables control for: cultural diffusion, or genetic sources of
variation in intelligence as ordinarily understood? Recall that we
pointed out earlier that controlling for socioeconomic status typically
reduces the BrJCI difference by about a third. To the extent that parental
socioeconomic status is produced by parental IQ, controlling for so-
cioeconomic status controls for parental IQ. One obvious criticism of
SOMPA is that it broadens the scope of the control variables to such
an extent that the procedure becomes meaningless. After the correla-
tions between the eight sociocultural variables and IQ are, in effect, set
to zero, little difference in IQ remains among her ethnic samples. But
what does this mean? The obvious possibility is that Mercer has demon-
strated only that parents matched on IQ will produce children with sim-
ilar IQs-not
a startling finding.
306
The National Context
Ethnic Differences in Cognitive Ability
307
Mercer points out that the samples differ on the sociocultural vari-
ables even after controlling for IQ. The substantial remaining correla-
tions indicate that "important amounts of the variance in sociocultural
characteristics [are] unexplained by IQ,"'~~
evidence, she says, that they
may be treated as substantially independent of IQ."~~'
But they are, in
fact, not independent of IQ. They remain correlated. Her basic con-
clusion that "there is no justification for ignoring sociocultural factors
when interpreting between-group differences in IQ" seems to us un-
challengeable.lo6 In the next chapter, we will present other examples of
ethnic differences in social behavior that persist after controlling for IQ.
But to conclude that genetic differences are ruled out by her analysis is
unwarranted, because she cannot demonstrate that a family's sociocul-
tural characteristics are independent of their IQ.Io7
Scholars of Jensen's school point to a number of other difficulties with
Mercer's interpretation. When she concludes that cultural diffusion ex-
plains the black-white difference, the data she uses show the familiar
pattern of Spearman's hypothesis: The more a test loads on g, the greater
is the B/W difference.''' Why should cultural diffusion manifest itself
in such a patterned way? Her appeal to sociocultural factors does not ex-
plain why blacks score lower on backward digit span than forward; why
in chronometric tests, black movement time is faster, but reaction time
slower, than among whites; or why the B/W difference persists on non-
verbal tests such as the Ravens Standard Progressive Matrices. It is also
not explained why, if the role of European white cultural diffusion (or
the lack of it) is so important in depressing black test performance, it
has been so unimportant for Asians.
A number of authors besides Mercer have advanced theories of cul-
tural difference, often treated as part of the "cultural bias" argument but
asserting in more sweeping fashion that cultures differ in ways that will
be reflected in test scores. In the American context, Wade Boykin is
one of the most prominent academic advocates of a distinctive black
culture, arguing that nine interrelated dimensions put blacks at odds
with the prevailing Eurocentric model. Among them are spirituality
(blacks approach life as "essentially vitalistic rather than mechanistic,
with the conviction that non-material forces influence people's every-
day lives"); a belief in the harmony between humankind and nature; an
emphasis on the importance of movement, rhythm, music, and dance
"which are taken as central to psychological health"; personal styles that
he characterizes as "verve" (high levels of stimulation and energy) and
"affect" (emphasis on emotions and expressiveness); and "social time
perspective," which he defines as "an orientation in which time is
treated as passing through a social space rather than a material one."'@
The notes reference a variety of other authors who have made similar
arg~rnents."~
All, in different ways, purport to explain how large B/W
differences in test scores could coexist with equal predictive validity of
the test for such things as academic and job performance and yet still
not be based on differences in "intelligence," broadly defined, let alone
genetic differences.
John Ogbu, a Berkeley anthropologist, has proposed a more specific
version of this argument. He suggests that we look at the history of var-
ious minority groups to understand the sources of differing levels of in-
tellectual attainment in America. He distinguishes three types of
minorities: "autonomous minorities" such as the Amish, Jews, and Mor-
mons, who, while they may be victims of discrimination, are still within
the cultural mainstream; "immigrant minorities," such as the Chinese,
Filipinos, Japanese, and Koreans within the United States, who moved
voluntarily to their new societies and, while they may begin in menial
jobs, compare themselves favorably with their peers back in the home
country; and, finally, "castelike minorities," such as black Americans,
who were involuntary immigrants or otherwise are consigned from birth
to a distinctively lower place on the social ladder."' Ogbu argues that
the differences in test scores are an outcome of this historical distinc-
tion, pointing to a number of castes around the world-the
untouch-
ables in India, the Buraku in Japan, and Oriental Jews in Israel-that
have exhibited comparable problems in educational achievement de-
spite being of the same racial group as the majority.
THE FLYNN EFFECT. Indirect support for the proposition that the observed
B/W difference could be the result of environmental factors is provided
by the worldwide phenomenon of rising test sc~res."~
We call it "the
Flynn effect" because of psychologist James Flynn's pivotal role in focus-
ing attention on it, but the phenomenon itself was identified in the
1930s when testers began to notice that IQ scores often rose with every
successive year after a test was first standardized. For example, when the
Stanford-Binet IQ was restandardized in the mid-1930s, it was observed
that individuals earned lower IQs on the new tests than they got on the
Stanford-Binet that had been standardized in the mid-1910s; in other
words, getting a score of 100 (the population average) was harder to do
Cultural and Environmental IQ Factors
- Alternative theories suggest that non-material forces, such as rhythm, affect, and social time perspectives, influence cognitive styles beyond traditional testing metrics.
- Anthropologist John Ogbu categorizes minorities into autonomous, immigrant, and castelike groups to explain differences in intellectual attainment.
- Castelike minorities, such as black Americans or the Buraku in Japan, often face systemic social barriers that impact educational achievement regardless of race.
- The 'Flynn effect' describes a worldwide phenomenon where IQ scores consistently rise over time, necessitating more difficult restandardization of tests.
- The magnitude of the Flynn effect's upward drift is comparable to the current IQ point gap observed between different racial groups in America.
- These environmental and historical arguments challenge the notion that test score differences are rooted in innate or genetic intelligence.
Ogbu argues that the differences in test scores are an outcome of this historical distinction, pointing to a number of castes around the world—the untouchables in India, the Buraku in Japan, and Oriental Jews in Israel—that have exhibited comparable problems in educational achievement despite being of the same racial group as the majority.
306
The National Context
Ethnic Differences in Cognitive Ability
307
Mercer points out that the samples differ on the sociocultural vari-
ables even after controlling for IQ. The substantial remaining correla-
tions indicate that "important amounts of the variance in sociocultural
characteristics [are] unexplained by IQ,"'~~
evidence, she says, that they
may be treated as substantially independent of IQ."~~'
But they are, in
fact, not independent of IQ. They remain correlated. Her basic con-
clusion that "there is no justification for ignoring sociocultural factors
when interpreting between-group differences in IQ" seems to us un-
challengeable.lo6 In the next chapter, we will present other examples of
ethnic differences in social behavior that persist after controlling for IQ.
But to conclude that genetic differences are ruled out by her analysis is
unwarranted, because she cannot demonstrate that a family's sociocul-
tural characteristics are independent of their IQ.Io7
Scholars of Jensen's school point to a number of other difficulties with
Mercer's interpretation. When she concludes that cultural diffusion ex-
plains the black-white difference, the data she uses show the familiar
pattern of Spearman's hypothesis: The more a test loads on g, the greater
is the B/W difference.''' Why should cultural diffusion manifest itself
in such a patterned way? Her appeal to sociocultural factors does not ex-
plain why blacks score lower on backward digit span than forward; why
in chronometric tests, black movement time is faster, but reaction time
slower, than among whites; or why the B/W difference persists on non-
verbal tests such as the Ravens Standard Progressive Matrices. It is also
not explained why, if the role of European white cultural diffusion (or
the lack of it) is so important in depressing black test performance, it
has been so unimportant for Asians.
A number of authors besides Mercer have advanced theories of cul-
tural difference, often treated as part of the "cultural bias" argument but
asserting in more sweeping fashion that cultures differ in ways that will
be reflected in test scores. In the American context, Wade Boykin is
one of the most prominent academic advocates of a distinctive black
culture, arguing that nine interrelated dimensions put blacks at odds
with the prevailing Eurocentric model. Among them are spirituality
(blacks approach life as "essentially vitalistic rather than mechanistic,
with the conviction that non-material forces influence people's every-
day lives"); a belief in the harmony between humankind and nature; an
emphasis on the importance of movement, rhythm, music, and dance
"which are taken as central to psychological health"; personal styles that
he characterizes as "verve" (high levels of stimulation and energy) and
"affect" (emphasis on emotions and expressiveness); and "social time
perspective," which he defines as "an orientation in which time is
treated as passing through a social space rather than a material one."'@
The notes reference a variety of other authors who have made similar
arg~rnents."~
All, in different ways, purport to explain how large B/W
differences in test scores could coexist with equal predictive validity of
the test for such things as academic and job performance and yet still
not be based on differences in "intelligence," broadly defined, let alone
genetic differences.
John Ogbu, a Berkeley anthropologist, has proposed a more specific
version of this argument. He suggests that we look at the history of var-
ious minority groups to understand the sources of differing levels of in-
tellectual attainment in America. He distinguishes three types of
minorities: "autonomous minorities" such as the Amish, Jews, and Mor-
mons, who, while they may be victims of discrimination, are still within
the cultural mainstream; "immigrant minorities," such as the Chinese,
Filipinos, Japanese, and Koreans within the United States, who moved
voluntarily to their new societies and, while they may begin in menial
jobs, compare themselves favorably with their peers back in the home
country; and, finally, "castelike minorities," such as black Americans,
who were involuntary immigrants or otherwise are consigned from birth
to a distinctively lower place on the social ladder."' Ogbu argues that
the differences in test scores are an outcome of this historical distinc-
tion, pointing to a number of castes around the world-the
untouch-
ables in India, the Buraku in Japan, and Oriental Jews in Israel-that
have exhibited comparable problems in educational achievement de-
spite being of the same racial group as the majority.
THE FLYNN EFFECT. Indirect support for the proposition that the observed
B/W difference could be the result of environmental factors is provided
by the worldwide phenomenon of rising test sc~res."~
We call it "the
Flynn effect" because of psychologist James Flynn's pivotal role in focus-
ing attention on it, but the phenomenon itself was identified in the
1930s when testers began to notice that IQ scores often rose with every
successive year after a test was first standardized. For example, when the
Stanford-Binet IQ was restandardized in the mid-1930s, it was observed
that individuals earned lower IQs on the new tests than they got on the
Stanford-Binet that had been standardized in the mid-1910s; in other
words, getting a score of 100 (the population average) was harder to do
308
The National Context
Ethnic Differences in Cognitive Ability
309
on the later test.'I3 This meant that the average person could answer
more items on the old test than the new test. Most of the change has been
concentrated in the nonverbal portions of the tests.
The tendency for IQ scores to drift upward as a function of years since
standardization has now been substantiated, primarily by Flynn, in many
countries and on many IQ tests besides the Stanford-Binet.lI4 In some
countries, the upward drift since World War I1 has been as much as a
point a year for some spans of years. The national averages have In fact
changed by amounts that are comparable to the fifteen or so IQ points
separating whites and blacks in America. To put it another way, on the
average, whites today may differ in 1Q from whites, say, two generations
ago as much as whites today differ from blacks today. Given their size
and speed, the shifts in time necessarily have been due more to changes
in the environment than to changes in the genes.
The question then arises: Coirldn't the mean of blacks move 15 polnts
as well through environmental changes? There seems no reason why
not-but
also no reason to helieve that white and Asian means can he
made to stand still while the Flynn effect works its magic.
There is a further question to answer: Does a 15-point IQ dtfference
hetween grandparents and their grandchildren mean that the grand-
children are 15 points smarter? Some experts do not helieve that the
rise is wholly, perhaps not even partly, a rise in intelligence but in the
narrower skills involved in intelligence test taking per se;Il5 others
helieve that at least some of rise is in genuine intelligence, perhaps
owing to the improvements in public education (by the schools and the
media), health care, and nutrition. There is evidence that the rise in
scores may be due to a contraction in the distribution of test scores
in the population at large, with most of the shrinkage in the bottom half
of the distribution."' In large-scale studies of the Danish population,
virtually all of the upward drift in intelligence test scores is accounted
for by the rising performances of the lower half of the distribution."'
The data we presented earlier on the rise in SAT scores by American
blacks are consistent with this story. In general, egalitarian modern
societies draw the lower tail of the distribution closer to the mean and
thereby raise the average.'"" These findings accord wlth everyday
experience as well. Whether one looks at the worlds of science, litera-
ture, politics, or the arts, one does not get the impression that the top
of the IQ distribution is filled with more subtle, insightful, or powerful
intellects than it was in our grandparents' day.
Whatever we discover about the reasons for the upward drift in the
mean of the distribution of test scores, two points are clear. First, a rapid
rise in intelligence does not plausibly stretch far into either the past or
the future. No one is suggesting, for example, that the IQ of the aver.
age American in 1776 was 30 or that it will be 150 a century from
now.'"" The rising trend in test scores may already be leveling off in
some countries.'1° Second, at any point in time, it is one's position in
the distribution that has the most significant implications for social and
economic life as we know it and also for the position of one's children.'12''
Flynn suggests that the intergenerational change in 1Q has more to
do with a shifting link between IQ scores and the underlying trait of in-
telligence than with a change in intelligence per se.''L21
Even so, the in-
stability of test scores across generations should caution against taking
the current ethnic differences as etched in stone. There are things we
do not yet understand about the relation between IQ and intelligence,
which may be relevant for comparisons not just across times but also
across cultures and races.
RACIAL ANCESTRY.
Just over 100 families with adopted children of
white, black, and mixed racial ancestry are being studied in an ongoing
analysis of the effects of being raised by white adopting parents of mid-
dle or higher social status.12' This famous transracial adoption study by
psychologists Sandra Scarr and Richard Weinberg is the most compre-
hensive attempt yet to separate the effects of genes and of family envi-
ronment on the cognitive development of American blacks and whites.
The first reports (when the children were about 7 years old) indicated
that the black and interracial children had 1Qs of about 106, well above
the national black average or the black average in Minnesota, where the
samples were drawn. This result pointed to a considerable impact of the
home setting on intelligence. However, a racial and adoptive ordering
on IQ existed even in the first follow-up: The mean IQs were 117 for the
biological children of white parents, 1 12 for the white adoptive children,
109 for the adopted children with one black and one white or Asian par-
ent, and 97 for the adopted children with two black
Alto-
gether, the data were important and interesting but not decisive
regarding the source of the B/W difference. They could most easily have
been squared with a theory that the B/W difference has both genetic and
environmental elements in it, but, with considerable straining, could
perhaps have been stretched to argue for no genetic influence at all.
The Flynn Effect and IQ
- Rapid historical shifts in IQ scores are likely driven by environmental changes rather than genetic evolution.
- The 'Flynn effect' suggests that while black IQ means could rise, white and Asian means are also likely to continue shifting simultaneously.
- Experts debate whether rising scores reflect genuine intelligence or merely improved test-taking skills and better nutrition.
- Evidence suggests the upward drift in scores is primarily due to the lower half of the population catching up to the mean.
- Despite rising averages, there is little evidence that the top tier of human intellect is more insightful today than in previous generations.
- The instability of test scores across generations suggests that current ethnic differences should not be viewed as permanent or 'etched in stone'.
Whether one looks at the worlds of science, literature, politics, or the arts, one does not get the impression that the top of the IQ distribution is filled with more subtle, insightful, or powerful intellects than it was in our grandparents' day.
308
The National Context
Ethnic Differences in Cognitive Ability
309
on the later test.'I3 This meant that the average person could answer
more items on the old test than the new test. Most of the change has been
concentrated in the nonverbal portions of the tests.
The tendency for IQ scores to drift upward as a function of years since
standardization has now been substantiated, primarily by Flynn, in many
countries and on many IQ tests besides the Stanford-Binet.lI4 In some
countries, the upward drift since World War I1 has been as much as a
point a year for some spans of years. The national averages have In fact
changed by amounts that are comparable to the fifteen or so IQ points
separating whites and blacks in America. To put it another way, on the
average, whites today may differ in 1Q from whites, say, two generations
ago as much as whites today differ from blacks today. Given their size
and speed, the shifts in time necessarily have been due more to changes
in the environment than to changes in the genes.
The question then arises: Coirldn't the mean of blacks move 15 polnts
as well through environmental changes? There seems no reason why
not-but
also no reason to helieve that white and Asian means can he
made to stand still while the Flynn effect works its magic.
There is a further question to answer: Does a 15-point IQ dtfference
hetween grandparents and their grandchildren mean that the grand-
children are 15 points smarter? Some experts do not helieve that the
rise is wholly, perhaps not even partly, a rise in intelligence but in the
narrower skills involved in intelligence test taking per se;Il5 others
helieve that at least some of rise is in genuine intelligence, perhaps
owing to the improvements in public education (by the schools and the
media), health care, and nutrition. There is evidence that the rise in
scores may be due to a contraction in the distribution of test scores
in the population at large, with most of the shrinkage in the bottom half
of the distribution."' In large-scale studies of the Danish population,
virtually all of the upward drift in intelligence test scores is accounted
for by the rising performances of the lower half of the distribution."'
The data we presented earlier on the rise in SAT scores by American
blacks are consistent with this story. In general, egalitarian modern
societies draw the lower tail of the distribution closer to the mean and
thereby raise the average.'"" These findings accord wlth everyday
experience as well. Whether one looks at the worlds of science, litera-
ture, politics, or the arts, one does not get the impression that the top
of the IQ distribution is filled with more subtle, insightful, or powerful
intellects than it was in our grandparents' day.
Whatever we discover about the reasons for the upward drift in the
mean of the distribution of test scores, two points are clear. First, a rapid
rise in intelligence does not plausibly stretch far into either the past or
the future. No one is suggesting, for example, that the IQ of the aver.
age American in 1776 was 30 or that it will be 150 a century from
now.'"" The rising trend in test scores may already be leveling off in
some countries.'1° Second, at any point in time, it is one's position in
the distribution that has the most significant implications for social and
economic life as we know it and also for the position of one's children.'12''
Flynn suggests that the intergenerational change in 1Q has more to
do with a shifting link between IQ scores and the underlying trait of in-
telligence than with a change in intelligence per se.''L21
Even so, the in-
stability of test scores across generations should caution against taking
the current ethnic differences as etched in stone. There are things we
do not yet understand about the relation between IQ and intelligence,
which may be relevant for comparisons not just across times but also
across cultures and races.
RACIAL ANCESTRY.
Just over 100 families with adopted children of
white, black, and mixed racial ancestry are being studied in an ongoing
analysis of the effects of being raised by white adopting parents of mid-
dle or higher social status.12' This famous transracial adoption study by
psychologists Sandra Scarr and Richard Weinberg is the most compre-
hensive attempt yet to separate the effects of genes and of family envi-
ronment on the cognitive development of American blacks and whites.
The first reports (when the children were about 7 years old) indicated
that the black and interracial children had 1Qs of about 106, well above
the national black average or the black average in Minnesota, where the
samples were drawn. This result pointed to a considerable impact of the
home setting on intelligence. However, a racial and adoptive ordering
on IQ existed even in the first follow-up: The mean IQs were 117 for the
biological children of white parents, 1 12 for the white adoptive children,
109 for the adopted children with one black and one white or Asian par-
ent, and 97 for the adopted children with two black
Alto-
gether, the data were important and interesting but not decisive
regarding the source of the B/W difference. They could most easily have
been squared with a theory that the B/W difference has both genetic and
environmental elements in it, but, with considerable straining, could
perhaps have been stretched to argue for no genetic influence at all.
Racial IQ and Adoption Studies
- The Minnesota transracial adoption study showed that IQ scores for adopted children followed a racial ordering, with children of two black parents scoring lower than those with mixed or white parentage.
- A ten-year follow-up during the children's adolescence revealed that the IQ gap between adopted black and white children remained at seventeen points, mirroring national averages.
- Researchers Scarr and Weinberg suggest the data supports a mixed model of both genetic and environmental influences rather than a purely environmental explanation.
- A contrasting study of illegitimate children born to German women and Allied servicemen found no IQ difference between offspring of black and white fathers, though father IQs were unknown.
- The academic debate has shifted from whether environment explains all of the racial IQ gap to whether it explains more than a trivial portion.
- Critics like Lewontin, Rose, and Kamin argue against genetic interpretations by highlighting environmental correlations such as parental education and home setting.
The bottom line is that the gap between the adopted children with two black parents and the adopted children with two white parents was seventeen points, in line with the B/W difference customarily observed.
308
The National Context
Ethnic Differences in Cognitive Ability
309
on the later test.'I3 This meant that the average person could answer
more items on the old test than the new test. Most of the change has been
concentrated in the nonverbal portions of the tests.
The tendency for IQ scores to drift upward as a function of years since
standardization has now been substantiated, primarily by Flynn, in many
countries and on many IQ tests besides the Stanford-Binet.lI4 In some
countries, the upward drift since World War I1 has been as much as a
point a year for some spans of years. The national averages have In fact
changed by amounts that are comparable to the fifteen or so IQ points
separating whites and blacks in America. To put it another way, on the
average, whites today may differ in 1Q from whites, say, two generations
ago as much as whites today differ from blacks today. Given their size
and speed, the shifts in time necessarily have been due more to changes
in the environment than to changes in the genes.
The question then arises: Coirldn't the mean of blacks move 15 polnts
as well through environmental changes? There seems no reason why
not-but
also no reason to helieve that white and Asian means can he
made to stand still while the Flynn effect works its magic.
There is a further question to answer: Does a 15-point IQ dtfference
hetween grandparents and their grandchildren mean that the grand-
children are 15 points smarter? Some experts do not helieve that the
rise is wholly, perhaps not even partly, a rise in intelligence but in the
narrower skills involved in intelligence test taking per se;Il5 others
helieve that at least some of rise is in genuine intelligence, perhaps
owing to the improvements in public education (by the schools and the
media), health care, and nutrition. There is evidence that the rise in
scores may be due to a contraction in the distribution of test scores
in the population at large, with most of the shrinkage in the bottom half
of the distribution."' In large-scale studies of the Danish population,
virtually all of the upward drift in intelligence test scores is accounted
for by the rising performances of the lower half of the distribution."'
The data we presented earlier on the rise in SAT scores by American
blacks are consistent with this story. In general, egalitarian modern
societies draw the lower tail of the distribution closer to the mean and
thereby raise the average.'"" These findings accord wlth everyday
experience as well. Whether one looks at the worlds of science, litera-
ture, politics, or the arts, one does not get the impression that the top
of the IQ distribution is filled with more subtle, insightful, or powerful
intellects than it was in our grandparents' day.
Whatever we discover about the reasons for the upward drift in the
mean of the distribution of test scores, two points are clear. First, a rapid
rise in intelligence does not plausibly stretch far into either the past or
the future. No one is suggesting, for example, that the IQ of the aver.
age American in 1776 was 30 or that it will be 150 a century from
now.'"" The rising trend in test scores may already be leveling off in
some countries.'1° Second, at any point in time, it is one's position in
the distribution that has the most significant implications for social and
economic life as we know it and also for the position of one's children.'12''
Flynn suggests that the intergenerational change in 1Q has more to
do with a shifting link between IQ scores and the underlying trait of in-
telligence than with a change in intelligence per se.''L21
Even so, the in-
stability of test scores across generations should caution against taking
the current ethnic differences as etched in stone. There are things we
do not yet understand about the relation between IQ and intelligence,
which may be relevant for comparisons not just across times but also
across cultures and races.
RACIAL ANCESTRY.
Just over 100 families with adopted children of
white, black, and mixed racial ancestry are being studied in an ongoing
analysis of the effects of being raised by white adopting parents of mid-
dle or higher social status.12' This famous transracial adoption study by
psychologists Sandra Scarr and Richard Weinberg is the most compre-
hensive attempt yet to separate the effects of genes and of family envi-
ronment on the cognitive development of American blacks and whites.
The first reports (when the children were about 7 years old) indicated
that the black and interracial children had 1Qs of about 106, well above
the national black average or the black average in Minnesota, where the
samples were drawn. This result pointed to a considerable impact of the
home setting on intelligence. However, a racial and adoptive ordering
on IQ existed even in the first follow-up: The mean IQs were 117 for the
biological children of white parents, 1 12 for the white adoptive children,
109 for the adopted children with one black and one white or Asian par-
ent, and 97 for the adopted children with two black
Alto-
gether, the data were important and interesting but not decisive
regarding the source of the B/W difference. They could most easily have
been squared with a theory that the B/W difference has both genetic and
environmental elements in it, but, with considerable straining, could
perhaps have been stretched to argue for no genetic influence at all.
3 10
The National Context
Ethnic Differences in Cognitive Ability
3 11
A follow-up a decade later, with the children in adolescence, does
not favor the no-genetics case."5 The new ordering of IQ means was
109 for the biological children of white parents, 106 for the white adop-
tive children, 99 for the adopted children with one black parent, and
89 for the adopted children with two black parents."261 The mean of 89
for adopted children with two black parents was slightly above the na-
tional black mean but not above the black mean for the North Central
United States. The bottom line is that the gap between the adopted
children with two black parents and the adopted children with two
white parents was seventeen points, in line with the B/W difference cus-
tomarily observed. Whatever the environmental impact may have been,
it cannot have been large.
Scarr and Weinberg continue to argue that the results are consistent
with some form of mixed gene and environmental source of the B/W
difference, which seems to us the most plausible concl~sion.'~~
But
whatever the final consensus about the data may be, the debate over the
Minnesota transracial adoption study has shifted from an argument
about whether the environment explains all or just some of the B/W
difference to an argument about whether it explains more than a triv-
ial part of the difference.
Several smaller studies bearing on racial ancestry and IQ were well
summarized almost two decades ago by Loehlin, Lindzey, and Spuhler.L2y
They found the balance of evidence tipped toward some sort of mixed
gene-environment explanation of the B/W difference without saying
how much of the difference is genetic and how much en~ironmental."~"'
This also echoes the results of Snyderman and Rothman's survey of con-
temporary specialists.
The German Story
One of the intriguing studies arguing against a large genetic component to
IQ differences came about thanks to the Allied occupation of Germany
following World War 11, when about 4,000 illegitimate children of mixed
racial origin were born to German women. A German researcher tracked
down 264 children of black servicemen and constructed a comparison
group of 83 illegitimate offspring of white occupation troops. The results
showed no overall difference in average IQ.'" The actual IQs of the fa-
thers were unknown, and therefore a variety of selection factors cannot he
ruled out. The study is inconclusive but certainly consistent with the sug-
gestion that the B/W difference is largely environmental.
But dissenting voices can be heard in the academic world. For ex-
ample, a well-known book, Not in Our Genes, by geneticist Richard
Lewontin and psychologists Steven Rose and Leon Kamin, criticizes
anyone who even suggests that there may be a genetic component to
the B/W difference or who reads the data as we do, as tipping toward a
mixture of genetic and environmental influences.I3' How can they do
this? Mostly by emphasizing those aspects of the data that suggest envi-
ronmental influences, such as the correlations between the adopting
parents' IQs or educational levels and the IQs of their black adopted
children in the Minnesota study from the first follow-up (the book was
published before the second follow-up). But they have nothing to say
about the aspects that are consistent with genetic influence, such as the
even larger correlations between the educational level of either the bi-
ological mothers or fathers and the IQs of their adopted-away black chil-
dren."' Although Lewontin, Rose, and Kamin do not say it in so many
words, their argument makes sense if it is directed at the claim that the
B/W difference is entirely genetic. It does little to elucidate the ongoing
scientific inquiry into whether the difference has a genetic component.
We have touched on only the highlights of the arguments on both sides
of the genetic issue. One main topic we have left untouched involves
the malleability of intelligence, with two extremes of thought: that in-
telligence is remarkably unmalleable, which undercuts environmental
arguments in general and cultural ones in particular, and that intelli-
gence is highly malleable, supporting those same arguments. Because
the malleability of intelligence is so critical a policy issue, it deserves a
chapter of its own (Chapter 17).
RETHINKING ETHNIC DIFFERENCES
If the reader is now convinced that either the genetic or environmen-
tal explanation has won out to the exclusion of the other, we have not
done a sufficiently good job of presenting one side or the other. It seems
highly likely to us that both genes and the environment have something
to do with racial differences. What might the mix be? We are resolutely
agnostic on that issue; as far as we can determine, the evidence does not
yet justify an estimate.
We are not so naive to think that making such statements will do
much good. People find it next to impossible to treat ethnic differences
The Genetic-Environmental Debate
- The authors argue that existing research often fails to distinguish between entirely genetic causes and those with a partial genetic component.
- Evidence suggests correlations between the IQs of adopted children and their biological parents, pointing toward genetic influence.
- The authors maintain a position of agnosticism regarding the exact mix of nature and nurture, stating that current evidence is insufficient for a precise estimate.
- Public discourse often treats the issue as a binary between 'dreadful' genetic consequences and 'temporary' environmental bias.
- The text posits that the specific origin of cognitive differences—whether genetic or environmental—should not fundamentally change how society approaches the issue.
It is as if people assumed that we are faced with two alternatives: either ( I ) the cognitive difference between blacks and whites is genetic, which entails unspoken but dreadful consequences, or (2) the cognitive difference between blacks and whites is environmental, fuzzily equated with some sort of cultural bias in IQ tests, and the difference is therefore temporary and unimportant.
3 10
The National Context
Ethnic Differences in Cognitive Ability
3 11
A follow-up a decade later, with the children in adolescence, does
not favor the no-genetics case."5 The new ordering of IQ means was
109 for the biological children of white parents, 106 for the white adop-
tive children, 99 for the adopted children with one black parent, and
89 for the adopted children with two black parents."261 The mean of 89
for adopted children with two black parents was slightly above the na-
tional black mean but not above the black mean for the North Central
United States. The bottom line is that the gap between the adopted
children with two black parents and the adopted children with two
white parents was seventeen points, in line with the B/W difference cus-
tomarily observed. Whatever the environmental impact may have been,
it cannot have been large.
Scarr and Weinberg continue to argue that the results are consistent
with some form of mixed gene and environmental source of the B/W
difference, which seems to us the most plausible concl~sion.'~~
But
whatever the final consensus about the data may be, the debate over the
Minnesota transracial adoption study has shifted from an argument
about whether the environment explains all or just some of the B/W
difference to an argument about whether it explains more than a triv-
ial part of the difference.
Several smaller studies bearing on racial ancestry and IQ were well
summarized almost two decades ago by Loehlin, Lindzey, and Spuhler.L2y
They found the balance of evidence tipped toward some sort of mixed
gene-environment explanation of the B/W difference without saying
how much of the difference is genetic and how much en~ironmental."~"'
This also echoes the results of Snyderman and Rothman's survey of con-
temporary specialists.
The German Story
One of the intriguing studies arguing against a large genetic component to
IQ differences came about thanks to the Allied occupation of Germany
following World War 11, when about 4,000 illegitimate children of mixed
racial origin were born to German women. A German researcher tracked
down 264 children of black servicemen and constructed a comparison
group of 83 illegitimate offspring of white occupation troops. The results
showed no overall difference in average IQ.'" The actual IQs of the fa-
thers were unknown, and therefore a variety of selection factors cannot he
ruled out. The study is inconclusive but certainly consistent with the sug-
gestion that the B/W difference is largely environmental.
But dissenting voices can be heard in the academic world. For ex-
ample, a well-known book, Not in Our Genes, by geneticist Richard
Lewontin and psychologists Steven Rose and Leon Kamin, criticizes
anyone who even suggests that there may be a genetic component to
the B/W difference or who reads the data as we do, as tipping toward a
mixture of genetic and environmental influences.I3' How can they do
this? Mostly by emphasizing those aspects of the data that suggest envi-
ronmental influences, such as the correlations between the adopting
parents' IQs or educational levels and the IQs of their black adopted
children in the Minnesota study from the first follow-up (the book was
published before the second follow-up). But they have nothing to say
about the aspects that are consistent with genetic influence, such as the
even larger correlations between the educational level of either the bi-
ological mothers or fathers and the IQs of their adopted-away black chil-
dren."' Although Lewontin, Rose, and Kamin do not say it in so many
words, their argument makes sense if it is directed at the claim that the
B/W difference is entirely genetic. It does little to elucidate the ongoing
scientific inquiry into whether the difference has a genetic component.
We have touched on only the highlights of the arguments on both sides
of the genetic issue. One main topic we have left untouched involves
the malleability of intelligence, with two extremes of thought: that in-
telligence is remarkably unmalleable, which undercuts environmental
arguments in general and cultural ones in particular, and that intelli-
gence is highly malleable, supporting those same arguments. Because
the malleability of intelligence is so critical a policy issue, it deserves a
chapter of its own (Chapter 17).
RETHINKING ETHNIC DIFFERENCES
If the reader is now convinced that either the genetic or environmen-
tal explanation has won out to the exclusion of the other, we have not
done a sufficiently good job of presenting one side or the other. It seems
highly likely to us that both genes and the environment have something
to do with racial differences. What might the mix be? We are resolutely
agnostic on that issue; as far as we can determine, the evidence does not
yet justify an estimate.
We are not so naive to think that making such statements will do
much good. People find it next to impossible to treat ethnic differences
3 12
The National Context
Ethnic Differences in Cognitive Ability
3 13
with detachment. That there are understandable reasons for this only
increases the need for thinking clearly and with precision about what is
and is not important. In ~articular, we have found that the genetic as-
pect of ethnic differences has assumed an overwhelming importance.
One symptom of this is that while this book was in preparation and re-
gardless of how we described it to anyone who asked, it was assumed
that the book's real subject had to be not only ethnic differences in cog-
nitive ability but the genetic source of those differences. It is as if peo-
ple assumed that we are faced with two alternatives: either ( I ) the
cognitive difference between blacks and whites is genetic, which entails
unspoken but dreadful consequences, or (2) the cognitive difference be-
tween blacks and whites is environmental, fuzzily equated with some
sort of cultural bias in IQ tests, and the difference is therefore tempo-
rary and unimportant.
But those are not the only alternatives. They are not even alterna-
tives at all. The major ethnic differences in the United States are not
the result of biased tests in the ordinary sense of the term. They may
well include some (as yet unknown) genetic component, but nothing
suggests that they are entirely genetic. And, most important, it matters
little whether the genes are involved at all.
We have already explained why the bias argument does not readily
explain the ethnic differences and also why we say that genes may be
part of the story. To show why we believe that it makes next to no dif-
ference whether genes are part of the reason for the observed differences,
a thought experiment may help. Imagine that tomorrow it is discovered
that the B/W difference in measured intelligence is entirely genetic in
origin. The worst case has come to pass. What difference would this
news make in the way that you approach the question of ethnic differ-
ences in intelligence? Not someone else but you. What has changed for
the worse in knowing that the difference is genetic? Here are some hy-
pothetical possibilities.
I f it were known that the B/W difference is genetic, would I treat individ-
ual blacks differently from the way I would neat them if the differences were
environmental? Probably, human nature being what it is, some people
would interpret the news as a license for treating all whites as intellec-
tually superior to all blacks. But we hope that putting this possibility
down in words makes it obvious how illogical-besides
utterly un-
founded-such
reactions would be. Many blacks would continue to be
smarter than many whites. Ethnic differences would continue to be dif-
ferences in means and distributions; they would continue to be useless,
for all practical purposes, when assessing individuals. If you were an em-
ployer looking for intellectual talent, an IQ of 120 is an 1Q of 120,
whether the face is black or white, let alone whether the mean differ-
ence in ethnic groups were genetic or environmental. If you were a
teacher looking at a classroom of black and white faces, you would have
exactly the same information you have now about the probabilities that
they would do well or poorly.
If you were a gclvernment official in charge of educational expendi-
tures and programs, you would continue to try to improve the educa-
tion of inner-city blacks, partly out of a belief that everyone should he
educated to the limits of his ability, partly out of fairness to the indi-
viduals of every degree of ability within that population-but
also, let
it be emphasized, out of a hardheaded calculation that the net social
and economic return of a dollar spent on the elementary and secondary
education of a student does not depend on the heritability of a group
difference in IQ. More generally: We cannot think of a legitimate argument
why any encounter between individual ec~hites and blacks need be affected by
the knowledge that an agqregate ethnic difference in measured intelligence is
genetic instead of environmental.
It is true that employers might under some circumstances find it eco-
nomically advantageous to use ethnicity as a crude but inexpensive
screen to cut down hiring costs (assuming it were not illegal to do so).
Rut this incentive exists already, by virtue of the existence of a differ-
ence in observed intelligence regardless of whether the difference is ge-
netic. The existence of the difference has many intersections with policy
issues. The source of the difference has none that we can think of, at
least in the short term. Whether it does or not in the long term, we dis-
cuss below.
I f the differences are genetic, aren't they harder to change than if they are
environmental? Another common reaction, this one relies on false as-
sumptions about intelligence. The underlying error is to assume that an
environmentally caused deficit is somehow less hard-wired, that it has
less impact on "real" capabilities, than does a genetically caused deficit.
We have made this point before, but it bears repeating. Some kinds of
environmentally induced conditions can be changed (lack of familiar-
ity with television shows for a person without a television set will proh-
ably be reduced by purchasing him a television set), but there is nc-,
reason to think that intelligence is one of them. To preview a conclu-
Genetic Differences and Social Policy
- The authors argue that knowing if ethnic IQ differences are genetic should not logically change how individuals are treated, as group means do not predict individual ability.
- For employers and educators, an individual's measured IQ remains the primary metric of talent regardless of the underlying cause of group-level distributions.
- Government investment in education is justified by the goal of maximizing individual potential and social return, independent of the heritability of group differences.
- The text suggests that the source of a cognitive deficit—whether genetic or environmental—does not necessarily determine how 'hard-wired' or difficult it is to change.
- Historical evidence indicates that environmental interventions have found it extraordinarily difficult to permanently raise realized intelligence levels.
- The authors conclude that the practical intersections with policy depend on the existence of differences, not their specific biological or environmental origins.
The underlying error is to assume that an environmentally caused deficit is somehow less hard-wired, that it has less impact on 'real' capabilities, than does a genetically caused deficit.
3 12
The National Context
Ethnic Differences in Cognitive Ability
3 13
with detachment. That there are understandable reasons for this only
increases the need for thinking clearly and with precision about what is
and is not important. In ~articular, we have found that the genetic as-
pect of ethnic differences has assumed an overwhelming importance.
One symptom of this is that while this book was in preparation and re-
gardless of how we described it to anyone who asked, it was assumed
that the book's real subject had to be not only ethnic differences in cog-
nitive ability but the genetic source of those differences. It is as if peo-
ple assumed that we are faced with two alternatives: either ( I ) the
cognitive difference between blacks and whites is genetic, which entails
unspoken but dreadful consequences, or (2) the cognitive difference be-
tween blacks and whites is environmental, fuzzily equated with some
sort of cultural bias in IQ tests, and the difference is therefore tempo-
rary and unimportant.
But those are not the only alternatives. They are not even alterna-
tives at all. The major ethnic differences in the United States are not
the result of biased tests in the ordinary sense of the term. They may
well include some (as yet unknown) genetic component, but nothing
suggests that they are entirely genetic. And, most important, it matters
little whether the genes are involved at all.
We have already explained why the bias argument does not readily
explain the ethnic differences and also why we say that genes may be
part of the story. To show why we believe that it makes next to no dif-
ference whether genes are part of the reason for the observed differences,
a thought experiment may help. Imagine that tomorrow it is discovered
that the B/W difference in measured intelligence is entirely genetic in
origin. The worst case has come to pass. What difference would this
news make in the way that you approach the question of ethnic differ-
ences in intelligence? Not someone else but you. What has changed for
the worse in knowing that the difference is genetic? Here are some hy-
pothetical possibilities.
I f it were known that the B/W difference is genetic, would I treat individ-
ual blacks differently from the way I would neat them if the differences were
environmental? Probably, human nature being what it is, some people
would interpret the news as a license for treating all whites as intellec-
tually superior to all blacks. But we hope that putting this possibility
down in words makes it obvious how illogical-besides
utterly un-
founded-such
reactions would be. Many blacks would continue to be
smarter than many whites. Ethnic differences would continue to be dif-
ferences in means and distributions; they would continue to be useless,
for all practical purposes, when assessing individuals. If you were an em-
ployer looking for intellectual talent, an IQ of 120 is an 1Q of 120,
whether the face is black or white, let alone whether the mean differ-
ence in ethnic groups were genetic or environmental. If you were a
teacher looking at a classroom of black and white faces, you would have
exactly the same information you have now about the probabilities that
they would do well or poorly.
If you were a gclvernment official in charge of educational expendi-
tures and programs, you would continue to try to improve the educa-
tion of inner-city blacks, partly out of a belief that everyone should he
educated to the limits of his ability, partly out of fairness to the indi-
viduals of every degree of ability within that population-but
also, let
it be emphasized, out of a hardheaded calculation that the net social
and economic return of a dollar spent on the elementary and secondary
education of a student does not depend on the heritability of a group
difference in IQ. More generally: We cannot think of a legitimate argument
why any encounter between individual ec~hites and blacks need be affected by
the knowledge that an agqregate ethnic difference in measured intelligence is
genetic instead of environmental.
It is true that employers might under some circumstances find it eco-
nomically advantageous to use ethnicity as a crude but inexpensive
screen to cut down hiring costs (assuming it were not illegal to do so).
Rut this incentive exists already, by virtue of the existence of a differ-
ence in observed intelligence regardless of whether the difference is ge-
netic. The existence of the difference has many intersections with policy
issues. The source of the difference has none that we can think of, at
least in the short term. Whether it does or not in the long term, we dis-
cuss below.
I f the differences are genetic, aren't they harder to change than if they are
environmental? Another common reaction, this one relies on false as-
sumptions about intelligence. The underlying error is to assume that an
environmentally caused deficit is somehow less hard-wired, that it has
less impact on "real" capabilities, than does a genetically caused deficit.
We have made this point before, but it bears repeating. Some kinds of
environmentally induced conditions can be changed (lack of familiar-
ity with television shows for a person without a television set will proh-
ably be reduced by purchasing him a television set), but there is nc-,
reason to think that intelligence is one of them. To preview a conclu-
3 1 4
The National Context
Ethnic Differences in Cognitive Ability
3 15
sion we will document at length in Chapter 17, an individual's realized
intelligence, no matter whether realized through genes or the environ-
ment, is not very malleable.
Changing cognitive ability through environmental interventions has
proved to be extraordinarily difficult. At best, the examples of special
programs that have permanently raised cognitive ability are rare. Per-
haps as time goes on we will learn so much about the environment, or
so much about how intelligence develops, that effective interventions
can be designed. But this is only a hope. Until such advances in social
interventions come about, which is unlikely to happen any time soon,
it is essential to grasp the point made earlier in the book: A short per-
son who could have been taller had he eaten better as a child is nonethe-
less really short. The corn planted in the Mojave Desert that could have
flourished if it had been planted in Iowa, wasn't planted in Iowa, and
there's no way to rescue it when it reaches maturity. Saying that a dif-
ference is caused by the environment says nothing about how real it is.
Aren't genetic diflerences passed down through the generations, while en-
vironmental differences are not? Yes and no. Environmentally caused char-
acteristics are by definition not heritable in the narrow technical sense
that they do not involve genetic transmission. But nongenetic charac-
teristics can nonetheless run in families. For practical purposes, envi-
ronments are heritable too. The child who grows up in a punishing
environment and thereby is intellectually stunted takes that deficit to
the parenting of his children. The learning environment he encoun-
tered and the learning environment he provides for his children tend
to be similar. The correlation between parents and children is just that:
a statistical tendency for these things to be passed down, despite soci-
ety's attempts to change them, without any necessary genetic compo-
nent. In trying to break these intergenerational links, even adoption at
birth has its limits. Poor prenatal nutrition can stunt cognitive poten-
tial in ways that cannot be remedied after birth. Prenatal drug and al-
cohol abuse can stunt cognitive potential. These traits also run in
families and communities and persist for generations, for reasons that
have proved difficult to affect.
In sum: If tomorrow you knew beyond a shadow of a doubt that all
the cognitive differences between races were 100 percent genetic in ori-
gin, nothing of any significance should change. The knowledge would
give you no reason to treat individuals differently than if ethnic differ-
ences were 100 percent environmental. By the same token, knowing
that the differences are 100 percent environmental in origin would not
suggest a single program or policy that is not already being tried. It would
justify no optimism about the time it will take to narrow the existing
gaps. It would not even justify confidence that genetically based differ-
ences will not be upon us within a few generations. The impulse to think
that environmental sources of difference are less threatening than
genetic ones is natural but illusory.
HOW ETHNIC DIFFERENCES FIT INTO THE STORY
In any case, you are not going to learn tomorrow that all the cognitive
differences between races are 100 percent genetic in origin, because the
scientific state of knowledge, unfinished as it is, already gives ample ev-
idence that environment is part of the story. But the evidence eventu-
ally may become unequivocal that genes are also part of the story. We
are worried that the elite wisdom on this issue, for years almost hyster-
ically in denial about that possibility, will snap too far in the other di-
rection. It is possible to face all the facts on ethnic and race differences
in intelligence and not run screaming from the room: That is the es-
sential message.
This chapter is also central to the larger themes of the book, which is
why we ask readers who have started with Part 111 to turn back to the In-
troduction and begin the long trek. In Part I, we described the formation
of a cognitive elite. Given the cognitive differences among ethnic and
racial groups, the cognitive elite cannot represent all groups equally, a
statement with implications that we will develop in Part IV. In Part 11,
we described how intelligence is important for understanding the social
problems ofour time. We limited the discussion to whites to make it eas-
ier to think about the evidence without constantly having to worry
about racism, cultural bias in the tests, or other extraneous issues.
The material in this chapter lets us proceed. As far as anyone has
been able to determine, IQ scores on a properly administered test mean
about the same thing for all ethnic groups. A substantial difference in
cognitive ability distributions separates whites from blacks, and a
smaller one separates East Asians from whites. These differences play
out in public and private life. In the rest of Part 111, we may now exam-
ine the relationship between social problems and I Q on a national scale.
The Reality of Environmental Impact
- Environmental deficits, such as stunted growth or cognitive impairment, are as physically real and irreversible as genetic ones once a person reaches maturity.
- Environments are effectively heritable because social and economic conditions tend to be passed down through generations regardless of genetic transmission.
- Intergenerational links are difficult to break because factors like prenatal nutrition and substance abuse affect cognitive potential before a child is even born.
- The origin of cognitive differences—whether 100 percent genetic or 100 percent environmental—should not change how individuals are treated or which policies are pursued.
- The belief that environmental causes are less 'threatening' or more easily fixed than genetic ones is a natural but dangerous illusion.
- The authors argue for a balanced perspective that acknowledges both environmental and genetic factors without succumbing to denial or hysteria.
The corn planted in the Mojave Desert that could have flourished if it had been planted in Iowa, wasn't planted in Iowa, and there's no way to rescue it when it reaches maturity.
3 1 4
The National Context
Ethnic Differences in Cognitive Ability
3 15
sion we will document at length in Chapter 17, an individual's realized
intelligence, no matter whether realized through genes or the environ-
ment, is not very malleable.
Changing cognitive ability through environmental interventions has
proved to be extraordinarily difficult. At best, the examples of special
programs that have permanently raised cognitive ability are rare. Per-
haps as time goes on we will learn so much about the environment, or
so much about how intelligence develops, that effective interventions
can be designed. But this is only a hope. Until such advances in social
interventions come about, which is unlikely to happen any time soon,
it is essential to grasp the point made earlier in the book: A short per-
son who could have been taller had he eaten better as a child is nonethe-
less really short. The corn planted in the Mojave Desert that could have
flourished if it had been planted in Iowa, wasn't planted in Iowa, and
there's no way to rescue it when it reaches maturity. Saying that a dif-
ference is caused by the environment says nothing about how real it is.
Aren't genetic diflerences passed down through the generations, while en-
vironmental differences are not? Yes and no. Environmentally caused char-
acteristics are by definition not heritable in the narrow technical sense
that they do not involve genetic transmission. But nongenetic charac-
teristics can nonetheless run in families. For practical purposes, envi-
ronments are heritable too. The child who grows up in a punishing
environment and thereby is intellectually stunted takes that deficit to
the parenting of his children. The learning environment he encoun-
tered and the learning environment he provides for his children tend
to be similar. The correlation between parents and children is just that:
a statistical tendency for these things to be passed down, despite soci-
ety's attempts to change them, without any necessary genetic compo-
nent. In trying to break these intergenerational links, even adoption at
birth has its limits. Poor prenatal nutrition can stunt cognitive poten-
tial in ways that cannot be remedied after birth. Prenatal drug and al-
cohol abuse can stunt cognitive potential. These traits also run in
families and communities and persist for generations, for reasons that
have proved difficult to affect.
In sum: If tomorrow you knew beyond a shadow of a doubt that all
the cognitive differences between races were 100 percent genetic in ori-
gin, nothing of any significance should change. The knowledge would
give you no reason to treat individuals differently than if ethnic differ-
ences were 100 percent environmental. By the same token, knowing
that the differences are 100 percent environmental in origin would not
suggest a single program or policy that is not already being tried. It would
justify no optimism about the time it will take to narrow the existing
gaps. It would not even justify confidence that genetically based differ-
ences will not be upon us within a few generations. The impulse to think
that environmental sources of difference are less threatening than
genetic ones is natural but illusory.
HOW ETHNIC DIFFERENCES FIT INTO THE STORY
In any case, you are not going to learn tomorrow that all the cognitive
differences between races are 100 percent genetic in origin, because the
scientific state of knowledge, unfinished as it is, already gives ample ev-
idence that environment is part of the story. But the evidence eventu-
ally may become unequivocal that genes are also part of the story. We
are worried that the elite wisdom on this issue, for years almost hyster-
ically in denial about that possibility, will snap too far in the other di-
rection. It is possible to face all the facts on ethnic and race differences
in intelligence and not run screaming from the room: That is the es-
sential message.
This chapter is also central to the larger themes of the book, which is
why we ask readers who have started with Part 111 to turn back to the In-
troduction and begin the long trek. In Part I, we described the formation
of a cognitive elite. Given the cognitive differences among ethnic and
racial groups, the cognitive elite cannot represent all groups equally, a
statement with implications that we will develop in Part IV. In Part 11,
we described how intelligence is important for understanding the social
problems ofour time. We limited the discussion to whites to make it eas-
ier to think about the evidence without constantly having to worry
about racism, cultural bias in the tests, or other extraneous issues.
The material in this chapter lets us proceed. As far as anyone has
been able to determine, IQ scores on a properly administered test mean
about the same thing for all ethnic groups. A substantial difference in
cognitive ability distributions separates whites from blacks, and a
smaller one separates East Asians from whites. These differences play
out in public and private life. In the rest of Part 111, we may now exam-
ine the relationship between social problems and I Q on a national scale.
Ethnic Inequalities and IQ
- The text asserts that IQ tests are valid across different ethnic groups and that cognitive ability distributions vary among whites, blacks, and East Asians.
- When controlling for IQ, Latinos and whites exhibit similar social behaviors and economic outcomes, suggesting cognitive ability is a primary driver of their parity.
- For black Americans, controlling for IQ reverses some success indicators; higher numbers of blacks than whites graduate college and enter professions when cognitive ability is equalized.
- Despite IQ adjustments, significant gaps remain between blacks and whites in areas like annual family income, poverty rates, and illegitimacy.
- The authors argue that while IQ explains much, other factors like history, racism, and cultural heritage must still be investigated to understand remaining disparities.
- The chapter suggests that incorporating cognitive ability into social research is indispensable for identifying the actual causes of troubling national inequalities.
On two vitul indicators of success--educational attainment and entry into prestigious occupations-the black-white discrepancy reverses.
3 1 4
The National Context
Ethnic Differences in Cognitive Ability
3 15
sion we will document at length in Chapter 17, an individual's realized
intelligence, no matter whether realized through genes or the environ-
ment, is not very malleable.
Changing cognitive ability through environmental interventions has
proved to be extraordinarily difficult. At best, the examples of special
programs that have permanently raised cognitive ability are rare. Per-
haps as time goes on we will learn so much about the environment, or
so much about how intelligence develops, that effective interventions
can be designed. But this is only a hope. Until such advances in social
interventions come about, which is unlikely to happen any time soon,
it is essential to grasp the point made earlier in the book: A short per-
son who could have been taller had he eaten better as a child is nonethe-
less really short. The corn planted in the Mojave Desert that could have
flourished if it had been planted in Iowa, wasn't planted in Iowa, and
there's no way to rescue it when it reaches maturity. Saying that a dif-
ference is caused by the environment says nothing about how real it is.
Aren't genetic diflerences passed down through the generations, while en-
vironmental differences are not? Yes and no. Environmentally caused char-
acteristics are by definition not heritable in the narrow technical sense
that they do not involve genetic transmission. But nongenetic charac-
teristics can nonetheless run in families. For practical purposes, envi-
ronments are heritable too. The child who grows up in a punishing
environment and thereby is intellectually stunted takes that deficit to
the parenting of his children. The learning environment he encoun-
tered and the learning environment he provides for his children tend
to be similar. The correlation between parents and children is just that:
a statistical tendency for these things to be passed down, despite soci-
ety's attempts to change them, without any necessary genetic compo-
nent. In trying to break these intergenerational links, even adoption at
birth has its limits. Poor prenatal nutrition can stunt cognitive poten-
tial in ways that cannot be remedied after birth. Prenatal drug and al-
cohol abuse can stunt cognitive potential. These traits also run in
families and communities and persist for generations, for reasons that
have proved difficult to affect.
In sum: If tomorrow you knew beyond a shadow of a doubt that all
the cognitive differences between races were 100 percent genetic in ori-
gin, nothing of any significance should change. The knowledge would
give you no reason to treat individuals differently than if ethnic differ-
ences were 100 percent environmental. By the same token, knowing
that the differences are 100 percent environmental in origin would not
suggest a single program or policy that is not already being tried. It would
justify no optimism about the time it will take to narrow the existing
gaps. It would not even justify confidence that genetically based differ-
ences will not be upon us within a few generations. The impulse to think
that environmental sources of difference are less threatening than
genetic ones is natural but illusory.
HOW ETHNIC DIFFERENCES FIT INTO THE STORY
In any case, you are not going to learn tomorrow that all the cognitive
differences between races are 100 percent genetic in origin, because the
scientific state of knowledge, unfinished as it is, already gives ample ev-
idence that environment is part of the story. But the evidence eventu-
ally may become unequivocal that genes are also part of the story. We
are worried that the elite wisdom on this issue, for years almost hyster-
ically in denial about that possibility, will snap too far in the other di-
rection. It is possible to face all the facts on ethnic and race differences
in intelligence and not run screaming from the room: That is the es-
sential message.
This chapter is also central to the larger themes of the book, which is
why we ask readers who have started with Part 111 to turn back to the In-
troduction and begin the long trek. In Part I, we described the formation
of a cognitive elite. Given the cognitive differences among ethnic and
racial groups, the cognitive elite cannot represent all groups equally, a
statement with implications that we will develop in Part IV. In Part 11,
we described how intelligence is important for understanding the social
problems ofour time. We limited the discussion to whites to make it eas-
ier to think about the evidence without constantly having to worry
about racism, cultural bias in the tests, or other extraneous issues.
The material in this chapter lets us proceed. As far as anyone has
been able to determine, IQ scores on a properly administered test mean
about the same thing for all ethnic groups. A substantial difference in
cognitive ability distributions separates whites from blacks, and a
smaller one separates East Asians from whites. These differences play
out in public and private life. In the rest of Part 111, we may now exam-
ine the relationship between social problems and I Q on a national scale.
Chapter 14
Ethnic Inequalities in
Relation to I Q
Ethnic differences in education, occupations, poverty, unemployment, iUe-
gitimacy , crime , and other signs of inequality preoccupy scholars and thought-
ful citizens. In this chapter, we examine these differences after cognitive ability
is taken into account.
We find that Latinos and whites of similar cognitive ability have similar so-
cial behavior and economic outcomes. Some differences remain, and a few
are substantial, but the overall p a t m is similarity. For blacks and whites, the
story is more complicated. On two vitul indicators of success--educational
attainment and entry into prestigious occupations-the
black-white discrep-
ancy reverses. After controlling for IQ , h e r numbers of blacks than whites
graduate from college and enter the professions. On a third important indica-
tor of success, wages, the black-white difference for year-round workers
shrinks from several thousand to a few hundred doUars.
In contrast, the B/W gap in annual family income or in persons below the
poverty line narrows after controlling for IQ but still remains sizable. Simi-
larly, differences in unemployment, labor force participation, marriage, and
illegitimacy get smaller but remain significant after extracting the effect of IQ.
These inequalities must be explained by other factors in American life. Schol-
ars have advanced many such explanations; we will not try to adjudtcate
among them here, except to suggest that in nying to understand the cultural,
social, and economic sources of these differences, understanding how cogni-
tive ability plays into the mix of factors seems indispensable. The role of cog-
nitive ability has seldom been constdered in the p a t . Doing so in future
research could clarify issues and focw attention on the factors that are actu-
ally producing the more noubling inequalities.
3 18
The National Context
Ethnic lnequalities in Relation to IQ
3 19
A
merica's pressing social problems are often portrayed in ethnic
terms. Does the nation have an unemployment problem? It de-
pends. Among whites in the recession year of 1992, unemployment was
under seven percent, but it was fourteen percent among blacks.'
Poverty? The poverty rate in 1992 for whites was less than twelve per-
cent but thirty-three percent for black^.^ Such numbers, and the debate
over what they should mean for policy, have been at the center of Amer-
ican social policy since the early 1960s. As Latinos have become a larger
portion of the population, the debate has begun to include similar dis-
parities between Latinos and whites.
Such disparities are indisputable. The question is why. Surely history
plays a role. Open racism and institutional discrimination of less obvi-
ous sorts have been an important part of the historical story for blacks
and are relevant to the historical experience of Latinos and Asian-
Americans as well. Cultural differences may also be involved. An eth-
nic group with a strong Roman Catholic heritage, such as Latinos, may
behave differently regarding birth control and illegitimacy than one
without that background. The tradition of filial respect in the Confu-
cian countries may bear on the behavior of American teenagers of East
Asian ancestry when one looks at, for example, delinquency.
Part I1 showed the impact ofcognitive ability on poverty, illegitimacy,
crime, and other social problems in America among whites. Chapter 13
showed that the major ethnic groups in America differ, on the average,
in cognitive ability. There is accordingly reason to ask what happens to
ethnic differences in economic and social behavior when intelligence
is held constant. This chapter examines that question.
The NLSY, with its large samples of blacks and Latinos (though not
Asians), permits us to address the question directly and in detail. We
will show what happens to the ethnic gap on a variety of indicators when
IQ is taken into account. To anticipate: In some cases, large ethnic dif-
ferences disappear altogether, or even reverse, with whites having the
disadvantageous outcome compared to blacks and Latinos. In other
cases, substantial differences remain, even after the groups are equated
not only for cognitive ability but for parental SES and education as well.
We do not try to press the analysis further, to find the other reasons why
groups may differ socially. The goal of this chapter is to broaden the
search for answers after three decades during which scholars have ig.
nored the contribution of IQ to ethnic differences in the main social
outcomes of everyday life.
First, we look at the indicators of success that were the focus of Part
I, then the indicators of problems that were the f c ~ u s
of Part 11.
ETHNIC DIFFERENCES IN EDUCATIONAL AND
OCCUPATIONAL SUCCESS
We begin with what should be hailed as a great American success story.
Ethnic differences in higher education, occupations, and wages are strik-
ingly diminished after controlling for IQ. Often they vanish. In this
sense, America has equalized these central indicators of social success.
Educational Attainment
The conventional view of ethnic differences in education holds that
blacks and Latinos still lag far behind, based on comparisons of the per-
centage of minorities who finish high school, enter college, and earn col-
lege degrees. Consider, for example, graduation from high school. As of
1990, 84 percent of whites in the NLSY had gotten a high school
diploma, compared to only 73 percent of blacks and 65 percent of Latinos,
echoing natlonal statistics."' But these percentages are based on every-
bocly, at all levelsof intelligence. What were the odds that a blackor Latino
with an IQ of 103-the
average IQ of all high school graduates-com-
pleted high school? The answer is that a youngster from either minority
group had a higher probability of graduating from high school than a white,
if all of them had IQs of 103: The odds were 93 percent and 91 percent for
blacks and Latinos respectively, compared to 89 percent for whites.14'
College has similarly opened up to blacks and Latinos. Once again,
the raw differentials are large. In national statistics or in the NLSY sam-
ple, whites are more than twice as likely to earn college degrees than ei-
ther blacks or ~atinos.'~'
The average IQ of all college graduates was,
however, about 114. What were the odds that a black or Latino with an
IQ of 1 14 graduated from college? The figure below shows the answers.
All the graphics in this chapter follow the pattern of this one. The
top three bars show the probabilities of a particular outcome--college
graduation in this case-by
ethnic group in the NLSY, given the aver-
age age of the sample, which was 29 as of the 1990 interview. In this fig-
ure, the top three bars show that a white adult had a 27 percent chance
of holding a bachelor's degree, compared to the lower odds for blacks
( 1 1 percent) and Latinos (10 percent). The probabilities were computed
through a logistic regression analysis.
Ethnic Differences and Cognitive Ability
- The text investigates how ethnic gaps in social and economic outcomes change when cognitive ability (IQ) is held constant.
- Using NLSY data, the authors find that many traditional ethnic disparities in success indicators diminish or disappear when IQ is factored in.
- In certain instances, controlling for IQ reveals that minority groups may actually have better outcomes than whites with the same cognitive scores.
- High school graduation rates for blacks and Latinos are statistically higher than for whites when comparing individuals with an average IQ of 103.
- The authors argue that scholars have ignored the contribution of IQ to ethnic differences in social outcomes for three decades.
- While some gaps vanish with IQ adjustments, other substantial differences remain even after accounting for both cognitive ability and socioeconomic status.
In some cases, large ethnic differences disappear altogether, or even reverse, with whites having the disadvantageous outcome compared to blacks and Latinos.
3 18
The National Context
Ethnic lnequalities in Relation to IQ
3 19
A
merica's pressing social problems are often portrayed in ethnic
terms. Does the nation have an unemployment problem? It de-
pends. Among whites in the recession year of 1992, unemployment was
under seven percent, but it was fourteen percent among blacks.'
Poverty? The poverty rate in 1992 for whites was less than twelve per-
cent but thirty-three percent for black^.^ Such numbers, and the debate
over what they should mean for policy, have been at the center of Amer-
ican social policy since the early 1960s. As Latinos have become a larger
portion of the population, the debate has begun to include similar dis-
parities between Latinos and whites.
Such disparities are indisputable. The question is why. Surely history
plays a role. Open racism and institutional discrimination of less obvi-
ous sorts have been an important part of the historical story for blacks
and are relevant to the historical experience of Latinos and Asian-
Americans as well. Cultural differences may also be involved. An eth-
nic group with a strong Roman Catholic heritage, such as Latinos, may
behave differently regarding birth control and illegitimacy than one
without that background. The tradition of filial respect in the Confu-
cian countries may bear on the behavior of American teenagers of East
Asian ancestry when one looks at, for example, delinquency.
Part I1 showed the impact ofcognitive ability on poverty, illegitimacy,
crime, and other social problems in America among whites. Chapter 13
showed that the major ethnic groups in America differ, on the average,
in cognitive ability. There is accordingly reason to ask what happens to
ethnic differences in economic and social behavior when intelligence
is held constant. This chapter examines that question.
The NLSY, with its large samples of blacks and Latinos (though not
Asians), permits us to address the question directly and in detail. We
will show what happens to the ethnic gap on a variety of indicators when
IQ is taken into account. To anticipate: In some cases, large ethnic dif-
ferences disappear altogether, or even reverse, with whites having the
disadvantageous outcome compared to blacks and Latinos. In other
cases, substantial differences remain, even after the groups are equated
not only for cognitive ability but for parental SES and education as well.
We do not try to press the analysis further, to find the other reasons why
groups may differ socially. The goal of this chapter is to broaden the
search for answers after three decades during which scholars have ig.
nored the contribution of IQ to ethnic differences in the main social
outcomes of everyday life.
First, we look at the indicators of success that were the focus of Part
I, then the indicators of problems that were the f c ~ u s
of Part 11.
ETHNIC DIFFERENCES IN EDUCATIONAL AND
OCCUPATIONAL SUCCESS
We begin with what should be hailed as a great American success story.
Ethnic differences in higher education, occupations, and wages are strik-
ingly diminished after controlling for IQ. Often they vanish. In this
sense, America has equalized these central indicators of social success.
Educational Attainment
The conventional view of ethnic differences in education holds that
blacks and Latinos still lag far behind, based on comparisons of the per-
centage of minorities who finish high school, enter college, and earn col-
lege degrees. Consider, for example, graduation from high school. As of
1990, 84 percent of whites in the NLSY had gotten a high school
diploma, compared to only 73 percent of blacks and 65 percent of Latinos,
echoing natlonal statistics."' But these percentages are based on every-
bocly, at all levelsof intelligence. What were the odds that a blackor Latino
with an IQ of 103-the
average IQ of all high school graduates-com-
pleted high school? The answer is that a youngster from either minority
group had a higher probability of graduating from high school than a white,
if all of them had IQs of 103: The odds were 93 percent and 91 percent for
blacks and Latinos respectively, compared to 89 percent for whites.14'
College has similarly opened up to blacks and Latinos. Once again,
the raw differentials are large. In national statistics or in the NLSY sam-
ple, whites are more than twice as likely to earn college degrees than ei-
ther blacks or ~atinos.'~'
The average IQ of all college graduates was,
however, about 114. What were the odds that a black or Latino with an
IQ of 1 14 graduated from college? The figure below shows the answers.
All the graphics in this chapter follow the pattern of this one. The
top three bars show the probabilities of a particular outcome--college
graduation in this case-by
ethnic group in the NLSY, given the aver-
age age of the sample, which was 29 as of the 1990 interview. In this fig-
ure, the top three bars show that a white adult had a 27 percent chance
of holding a bachelor's degree, compared to the lower odds for blacks
( 1 1 percent) and Latinos (10 percent). The probabilities were computed
through a logistic regression analysis.
320
The National Context
Ethnic inequalities in Relation to JQ
321
After controlling for IQ, the probability of graduating from college
is about the same for whites and Latinos, higher for blacks
The probability of holding a bachelor's degree
For a person of average age (29) before controlling,for IQ
White
27%
4
Black 11% 1
Latino l0%N
For a person of avercrge age and average IQ
for college graduates ( 1 14)
White
5046
I
Black
68%
I
Latino
49%
I
I
I
I
I
0%
20%
40%
60%
The lower set of bars also presents the probabilities by ethnic group,
but with one big difference: Now, the equation used to compute the
probability assumes that each of these young adults has a certain IQ
level. In this case, the computation assumes that everybody has the av-
erage IQ of all college graduates in the NLSY-a
little over 114. We
find that a 29-year-old (in 1990) with an IQ of 114 had a 50 percent
chance of having graduated from college if white, 68 percent if black,
and 49 percent if Latino. After taking IQ into account, blacks have a
better record of earning college degrees than either whites or Latinos.
We discuss this black advantage in Chapter 19, when we turn to the ef-
fects of affirmative action.
Occupational Statw
One of the positive findings about ethnic differences has been that ed-
ucation pays off in occupational status for minorities roughly the same
as it does for whites6 This was reflected in the NLSY as well: Holding
education constant, similar proportions of blacks, Latinos, and whites
are found in the various occupational categories.17'
To what extent does controlling for IQ produce the same result? We
know from Chapter 2 that occupations draw from different segments of
the cognitive ability distribution. Physicians cotne from the upper part
of the distribution, unskilled laborers from the lower part, and so forth.
If one ethnic group has a lower average I Q than another ethnic group,
this will be reflected in their occupations, other things equal. What
would the occupational distributions of different ethnic groups be after
taking cognitive ability into account?
Sociologist Linda Gottfredson has examined this question for blacks
and whites.' If, for example, black and white males were recruited with-
out discrimination into careers as physicians above a cutoff of an IQ of
112 (which she estimates is a fair approximation to the lower bound for
the actual population of physicians), the difference in the qualifying
population pools would place the blackewhite ratio at about .05-about
one black doctor for every twenty white ones. According to census data,
the actual per capita ratio of black to white male physicians was ahout
.3 in 1980, which is about six black doctors for every twenty white ones.
Another example is secondary school teaching, for which a similar cal-
culation implies one black high school teacher for every ten white ones.
The actual per capita ratio in 1980 was instead about six black teach-
ers for every ten white ones. In both examples, there are about six times
as many blacks in the occupation as there would be if selection by cog-
nitive ability scores were strictly race blind. Gottfredson made these cal-
culations for occupations spanning most of the range of skilled jobs, from
physician and engineer at the top end to truck driver and meat cutter
at the low end. She concluded that blacks are overrepresented in almost
every occupation, but most of all for the high-status occupations like
medicine, engineering, and teaching,I9'
We confirm Gottfredson's conclusions with data from the NLSY by
going back to the high-IQ occupations we discussed in Chapter 2:
lawyers, physicians, dentists, engineers, college teachers, accountants,
architects, chemists, computer scientists, mathematicians, natural sci-
entists, and social scientists. Grouping all of these occupations together,
what chance did whites, blacks, and Latinos in the NLSY have of en-
tering them? The figure below shows the results.
Before controlling for IQ and using unrounded figures, whites were
almost twice as likely to be in high-IQ occupations as blacks and more
than half again as likely as ~atinos."" But after controlling for IQ, the
picture reverses. The chance of entering a high-1Q occupation for a
IQ and Ethnic Educational Attainment
- Raw data shows that 27% of whites hold bachelor's degrees compared to 11% of blacks and 10% of Latinos.
- When controlling for an average college graduate IQ of 114, the probability of having a degree rises to 68% for blacks, significantly higher than whites (50%) and Latinos (49%).
- Research suggests that education provides a similar payoff in occupational status across different ethnic groups when education levels are held constant.
- Sociologist Linda Gottfredson's analysis indicates that blacks are represented in high-status professions like medicine and teaching at rates higher than their cognitive test score pools would predict.
- In professions such as medicine, the actual ratio of black to white doctors is roughly six times higher than it would be if selection were based strictly on race-blind cognitive ability scores.
- The text attributes these disparities in educational and occupational outcomes to the effects of affirmative action policies.
After taking IQ into account, blacks have a better record of earning college degrees than either whites or Latinos.
320
The National Context
Ethnic inequalities in Relation to JQ
321
After controlling for IQ, the probability of graduating from college
is about the same for whites and Latinos, higher for blacks
The probability of holding a bachelor's degree
For a person of average age (29) before controlling,for IQ
White
27%
4
Black 11% 1
Latino l0%N
For a person of avercrge age and average IQ
for college graduates ( 1 14)
White
5046
I
Black
68%
I
Latino
49%
I
I
I
I
I
0%
20%
40%
60%
The lower set of bars also presents the probabilities by ethnic group,
but with one big difference: Now, the equation used to compute the
probability assumes that each of these young adults has a certain IQ
level. In this case, the computation assumes that everybody has the av-
erage IQ of all college graduates in the NLSY-a
little over 114. We
find that a 29-year-old (in 1990) with an IQ of 114 had a 50 percent
chance of having graduated from college if white, 68 percent if black,
and 49 percent if Latino. After taking IQ into account, blacks have a
better record of earning college degrees than either whites or Latinos.
We discuss this black advantage in Chapter 19, when we turn to the ef-
fects of affirmative action.
Occupational Statw
One of the positive findings about ethnic differences has been that ed-
ucation pays off in occupational status for minorities roughly the same
as it does for whites6 This was reflected in the NLSY as well: Holding
education constant, similar proportions of blacks, Latinos, and whites
are found in the various occupational categories.17'
To what extent does controlling for IQ produce the same result? We
know from Chapter 2 that occupations draw from different segments of
the cognitive ability distribution. Physicians cotne from the upper part
of the distribution, unskilled laborers from the lower part, and so forth.
If one ethnic group has a lower average I Q than another ethnic group,
this will be reflected in their occupations, other things equal. What
would the occupational distributions of different ethnic groups be after
taking cognitive ability into account?
Sociologist Linda Gottfredson has examined this question for blacks
and whites.' If, for example, black and white males were recruited with-
out discrimination into careers as physicians above a cutoff of an IQ of
112 (which she estimates is a fair approximation to the lower bound for
the actual population of physicians), the difference in the qualifying
population pools would place the blackewhite ratio at about .05-about
one black doctor for every twenty white ones. According to census data,
the actual per capita ratio of black to white male physicians was ahout
.3 in 1980, which is about six black doctors for every twenty white ones.
Another example is secondary school teaching, for which a similar cal-
culation implies one black high school teacher for every ten white ones.
The actual per capita ratio in 1980 was instead about six black teach-
ers for every ten white ones. In both examples, there are about six times
as many blacks in the occupation as there would be if selection by cog-
nitive ability scores were strictly race blind. Gottfredson made these cal-
culations for occupations spanning most of the range of skilled jobs, from
physician and engineer at the top end to truck driver and meat cutter
at the low end. She concluded that blacks are overrepresented in almost
every occupation, but most of all for the high-status occupations like
medicine, engineering, and teaching,I9'
We confirm Gottfredson's conclusions with data from the NLSY by
going back to the high-IQ occupations we discussed in Chapter 2:
lawyers, physicians, dentists, engineers, college teachers, accountants,
architects, chemists, computer scientists, mathematicians, natural sci-
entists, and social scientists. Grouping all of these occupations together,
what chance did whites, blacks, and Latinos in the NLSY have of en-
tering them? The figure below shows the results.
Before controlling for IQ and using unrounded figures, whites were
almost twice as likely to be in high-IQ occupations as blacks and more
than half again as likely as ~atinos."" But after controlling for IQ, the
picture reverses. The chance of entering a high-1Q occupation for a
IQ and Ethnic Economic Disparities
- Initial data shows whites are significantly more likely to hold high-IQ occupations than blacks or Latinos.
- When controlling for IQ, the trend reverses: blacks and Latinos with an IQ of 117 are substantially more likely than whites of the same IQ to enter high-IQ professions.
- Raw wage data indicates a multi-thousand dollar gap between white workers and their black and Latino counterparts.
- After adjusting for IQ, the wage gap nearly disappears, with blacks and Latinos earning approximately 98 percent of what whites with the same IQ earn.
- The analysis suggests that 90 to 91 percent of the ethnic wage differential is statistically explained by differences in measured IQ.
- These findings challenge the common public assumption that significant wage disparities persist between ethnicities when cognitive ability is held constant.
After controlling for IQ, the average black made 98 percent of the white wage.
320
The National Context
Ethnic inequalities in Relation to JQ
321
After controlling for IQ, the probability of graduating from college
is about the same for whites and Latinos, higher for blacks
The probability of holding a bachelor's degree
For a person of average age (29) before controlling,for IQ
White
27%
4
Black 11% 1
Latino l0%N
For a person of avercrge age and average IQ
for college graduates ( 1 14)
White
5046
I
Black
68%
I
Latino
49%
I
I
I
I
I
0%
20%
40%
60%
The lower set of bars also presents the probabilities by ethnic group,
but with one big difference: Now, the equation used to compute the
probability assumes that each of these young adults has a certain IQ
level. In this case, the computation assumes that everybody has the av-
erage IQ of all college graduates in the NLSY-a
little over 114. We
find that a 29-year-old (in 1990) with an IQ of 114 had a 50 percent
chance of having graduated from college if white, 68 percent if black,
and 49 percent if Latino. After taking IQ into account, blacks have a
better record of earning college degrees than either whites or Latinos.
We discuss this black advantage in Chapter 19, when we turn to the ef-
fects of affirmative action.
Occupational Statw
One of the positive findings about ethnic differences has been that ed-
ucation pays off in occupational status for minorities roughly the same
as it does for whites6 This was reflected in the NLSY as well: Holding
education constant, similar proportions of blacks, Latinos, and whites
are found in the various occupational categories.17'
To what extent does controlling for IQ produce the same result? We
know from Chapter 2 that occupations draw from different segments of
the cognitive ability distribution. Physicians cotne from the upper part
of the distribution, unskilled laborers from the lower part, and so forth.
If one ethnic group has a lower average I Q than another ethnic group,
this will be reflected in their occupations, other things equal. What
would the occupational distributions of different ethnic groups be after
taking cognitive ability into account?
Sociologist Linda Gottfredson has examined this question for blacks
and whites.' If, for example, black and white males were recruited with-
out discrimination into careers as physicians above a cutoff of an IQ of
112 (which she estimates is a fair approximation to the lower bound for
the actual population of physicians), the difference in the qualifying
population pools would place the blackewhite ratio at about .05-about
one black doctor for every twenty white ones. According to census data,
the actual per capita ratio of black to white male physicians was ahout
.3 in 1980, which is about six black doctors for every twenty white ones.
Another example is secondary school teaching, for which a similar cal-
culation implies one black high school teacher for every ten white ones.
The actual per capita ratio in 1980 was instead about six black teach-
ers for every ten white ones. In both examples, there are about six times
as many blacks in the occupation as there would be if selection by cog-
nitive ability scores were strictly race blind. Gottfredson made these cal-
culations for occupations spanning most of the range of skilled jobs, from
physician and engineer at the top end to truck driver and meat cutter
at the low end. She concluded that blacks are overrepresented in almost
every occupation, but most of all for the high-status occupations like
medicine, engineering, and teaching,I9'
We confirm Gottfredson's conclusions with data from the NLSY by
going back to the high-IQ occupations we discussed in Chapter 2:
lawyers, physicians, dentists, engineers, college teachers, accountants,
architects, chemists, computer scientists, mathematicians, natural sci-
entists, and social scientists. Grouping all of these occupations together,
what chance did whites, blacks, and Latinos in the NLSY have of en-
tering them? The figure below shows the results.
Before controlling for IQ and using unrounded figures, whites were
almost twice as likely to be in high-IQ occupations as blacks and more
than half again as likely as ~atinos."" But after controlling for IQ, the
picture reverses. The chance of entering a high-1Q occupation for a
322
The National Context
Ethnic inequalities in Relation to 1Q
323
After controlling for IQ, blacks and Latinos have substantially
higher probabilities than whites of being in a high-IQ occupation
The probability of being in a high-IQ occupation
For a person of average age (29) before controlling for IQ
White
5% )
Black a
Latino a
For a person of average age and average lQ
.for people in high-lQ occupations (1 17)
White
10% ,
Black
Latino
16%
I
I
I
I
I
I
I
0%
5%
10%
15%
20%
25%
black with an IQ of 11 7 (which was the average IQ of all the people in
these occupations in the NLSY sample) was over twice the proportion
of whites with the same IQ. Latinos with an IQ of 117 had more than
a 50 percent higher chance of entering a high-1Q occupation than
whites with the same 1Q.I"' This phenomenon applies across a wide
range of occupations, as discussed in more detail in Chapter 20.
Wages
We come now to what many people consider the true test of economic
equality, dollar income. Two measures of income need to be separated
because they speak to different issues. Wages provides a direct measure of
how much a person gets per unit of time spent on the job. Annual family
income reflects many other factors as well, being affected by marital sta-
tus (does the family have two incomes?), nonwage income (from stock
dividends to welfare), and the amount of time spent earning wages (did
the person have a job for all fifty-two weeks of the year?). We begin with
wages, the measure that most directly reflects the current workplace.
As of 1989, white year-round workers (of average age) in the NLSY
sample (men and women) made an average of $6,378 more than blacks
and $3,963 more than ~atinos."~'
The figure below shows what happens
controlling for intelligence, this time presenting the results for a year-
After controlling for IQ, ethnic wage differentials shrink
from thousands to a few hundred dollars
Annual wages for a year-round worker, 1989
For a person of average age (29) before controlling for IQ
White
$27,372
I
Black
$20.994 1
$232404
Latino
I
For a person of average age and average IQ (100)
White
"
, '. "" .+$*'?r;3&
" ' " "
Black 'I
Latino
round worker with an IQ of 100. The average black who worked year-
round was making less than 77 percent of the wage of the average em-
ployed white.l13' After controlling for IQ, the average black made 98
percent of the white wage. For Latinos, the ratio after controlling for IQ
was also 98 percent of the white wage. Another way to summarize the
outcome is that 91 percent of the raw black-white differential in wages
and 90 percent of the raw Latino-white differential disappear after con-
trolling for IQ.
These results say that only minor earnings differences separate
whites, blacks, and Latinos of equal IQ in the NLSY.I4 Because this find-
ing is so far from what the public commentary assumes, we explore it
further. We focus on the situation facing blacks, because the black-white
disparities have been at the center of the political debate. Parallel analy-
ses for Latinos and whites generally showed smaller initial income dis-
parities and similar patterns of convergence after controlling for IQ.
3 24
The National Context
Ethnic Inequalities in Relation to IQ
325
Our finding that wage differentials nearly disappear may be a surprise
especially in light of the familiar conclusion that wage disparities per-
sist even for blacks and whites with the same education. For example,
in the 1992 national data collected by the Bureau of the Census, me-
dian earnings of year-round, full-time workers in 1992 were $41,005 for
white male graduates with a bachelor'sdegree and only $3 1,001 for black
males with the same degree.I5 Similar disparities occur all along the ed-
ucational range. The same pattern is found in the NLSY data. Even af-
ter controlling for education, blacks in the NLSY still earned only 80
percent of the white wage, which seems to make a prima facie case for
persistent discrimination in the labor market.
Blacks and whites who grow up in similar economic and social cir-
cumstances likewise continue to differ in their earning power as adults.
This too is true of the NLSY data. Suppose we control for three fac-
tors-age,
education, and socioeconomic background-that
are gener-
ally assumed to influence people's wages. The result is that black wages
are still only 84 percent of white wages, again suggesting continuing
racial discrimination.
And yet controlling just for IQ, ignoring both education and socioe-
conomic background, raises the average black wage to 98 percent of the
white wage and reduces the dollar gap in annual earnings from wages
for year-round workers to less than $600. A similar result is given as the
bottom row in the following table, this time extracting as well the ef-
Black Wages as a Percentage of White Wages, 1989
Occupation
Control-
Control-
Control-
Control-
ling Only
ling for
ling for Age,
ling Only
for Age
Age and Education, and for Age
Education Parental SES
and IQ
Professional/technical
87
92
95
102
Managersladministrators
73
7 2
74
82
Clerical workers
99
97
101
119
Sales workers
74
74
77
89
Craft and kindred workers
81
80
83
96
Transport operatives
88
87
90
1 08
Other operatives
80
80
84
100
Service workers
92
96
102
119
Unskilled laborers
67
69
72
84
All employed persons
80
82
86
98
fects of different occupational distributions between whites and blacks.
The rows above it show what happens when separate wages are com-
puted for different occupational groupings.
The tahle contains a number of noteworthy particulars, but the most
interesting result, which generalizes to every occupational category, is
how little difference education makes. A common complaint about
wages 1s that they are artificially affected by credentialism. If credentials
are important, then educational differences between blacks and whites
should account for much of their income differences. The table, how-
ever, shows that knowing the educational level ofblacks and whitesdoes
little to explain the difference in their wages. Socioeconomic back-
ground also fails to explain much of the wage gaps in one occupation
after another. That brings us to the final column, in which IQs are con-
trolled while education and socioeconclmic background are left to vary
as they will. The black-white income differences in most of the occu-
pations shrink constderahly. Altogether, the table says that an IQ score
is more important-in
most cases, much more important-in
explain-
ing black-white wage differences than are education and socioeconomic
background for every occupational category in it.
Analyzing the results in detail would require much finer hreakdowns
than the ones presented in the table. Why is there still a meaningful dif-
ferentlal in the managersladministrators category after controlling for
IQ? Why do blacks earn a large wage premium over whites of equiva-
lent age and IQ in clerical and service johs? The explanations could
have something to do with ethnic factors, but the varieties of jobs within
these categories are so wide that the differentials could reflect nothing
more than different ethnic distributions in specific jobs (for example,
the managersladministrators category includes jobs as different as a top
executive at GM and the shift manager of a McDonalds; the service
workers category includes both police and busboys). We will not try to
conduct those analyses, though we hope others will. At the level rep-
resented in the table, it looks as if the job market rewards blacks and
whites of equivalent cognitive ability nearly equally in almost every job
category.
Although we do not attempt the many analyses that might enrich
this basic conclusion, one other factor-gender-
IS so obv~ous that we
must mention it. When gender is added to the analysis, the black-white
differences narrow by one or two additional percentage points for each
of the comparisons. In the case of IQ, this means that the racial differ-
IQ and Wage Disparities
- Initial data from the NLSY shows that black workers earn significantly less than white workers even when controlling for education and socioeconomic background.
- Traditional factors like age, education, and parental status only account for a small portion of the racial wage gap, leaving a prima facie case for discrimination.
- When IQ is introduced as a control variable, the black-white wage gap shrinks dramatically, with black wages rising to 98 percent of white wages on average.
- In specific sectors like clerical and service work, controlling for IQ actually results in a wage premium for black workers over their white counterparts.
- The data suggests that IQ scores are more predictive of earnings across various occupational categories than formal educational credentials or social background.
- Discrepancies remain in certain fields like management, which the authors suggest may be due to the broad variety of job types within those specific census categories.
And yet controlling just for IQ, ignoring both education and socioeconomic background, raises the average black wage to 98 percent of the white wage and reduces the dollar gap in annual earnings from wages for year-round workers to less than $600.
3 24
The National Context
Ethnic Inequalities in Relation to IQ
325
Our finding that wage differentials nearly disappear may be a surprise
especially in light of the familiar conclusion that wage disparities per-
sist even for blacks and whites with the same education. For example,
in the 1992 national data collected by the Bureau of the Census, me-
dian earnings of year-round, full-time workers in 1992 were $41,005 for
white male graduates with a bachelor'sdegree and only $3 1,001 for black
males with the same degree.I5 Similar disparities occur all along the ed-
ucational range. The same pattern is found in the NLSY data. Even af-
ter controlling for education, blacks in the NLSY still earned only 80
percent of the white wage, which seems to make a prima facie case for
persistent discrimination in the labor market.
Blacks and whites who grow up in similar economic and social cir-
cumstances likewise continue to differ in their earning power as adults.
This too is true of the NLSY data. Suppose we control for three fac-
tors-age,
education, and socioeconomic background-that
are gener-
ally assumed to influence people's wages. The result is that black wages
are still only 84 percent of white wages, again suggesting continuing
racial discrimination.
And yet controlling just for IQ, ignoring both education and socioe-
conomic background, raises the average black wage to 98 percent of the
white wage and reduces the dollar gap in annual earnings from wages
for year-round workers to less than $600. A similar result is given as the
bottom row in the following table, this time extracting as well the ef-
Black Wages as a Percentage of White Wages, 1989
Occupation
Control-
Control-
Control-
Control-
ling Only
ling for
ling for Age,
ling Only
for Age
Age and Education, and for Age
Education Parental SES
and IQ
Professional/technical
87
92
95
102
Managersladministrators
73
7 2
74
82
Clerical workers
99
97
101
119
Sales workers
74
74
77
89
Craft and kindred workers
81
80
83
96
Transport operatives
88
87
90
1 08
Other operatives
80
80
84
100
Service workers
92
96
102
119
Unskilled laborers
67
69
72
84
All employed persons
80
82
86
98
fects of different occupational distributions between whites and blacks.
The rows above it show what happens when separate wages are com-
puted for different occupational groupings.
The tahle contains a number of noteworthy particulars, but the most
interesting result, which generalizes to every occupational category, is
how little difference education makes. A common complaint about
wages 1s that they are artificially affected by credentialism. If credentials
are important, then educational differences between blacks and whites
should account for much of their income differences. The table, how-
ever, shows that knowing the educational level ofblacks and whitesdoes
little to explain the difference in their wages. Socioeconomic back-
ground also fails to explain much of the wage gaps in one occupation
after another. That brings us to the final column, in which IQs are con-
trolled while education and socioeconclmic background are left to vary
as they will. The black-white income differences in most of the occu-
pations shrink constderahly. Altogether, the table says that an IQ score
is more important-in
most cases, much more important-in
explain-
ing black-white wage differences than are education and socioeconomic
background for every occupational category in it.
Analyzing the results in detail would require much finer hreakdowns
than the ones presented in the table. Why is there still a meaningful dif-
ferentlal in the managersladministrators category after controlling for
IQ? Why do blacks earn a large wage premium over whites of equiva-
lent age and IQ in clerical and service johs? The explanations could
have something to do with ethnic factors, but the varieties of jobs within
these categories are so wide that the differentials could reflect nothing
more than different ethnic distributions in specific jobs (for example,
the managersladministrators category includes jobs as different as a top
executive at GM and the shift manager of a McDonalds; the service
workers category includes both police and busboys). We will not try to
conduct those analyses, though we hope others will. At the level rep-
resented in the table, it looks as if the job market rewards blacks and
whites of equivalent cognitive ability nearly equally in almost every job
category.
Although we do not attempt the many analyses that might enrich
this basic conclusion, one other factor-gender-
IS so obv~ous that we
must mention it. When gender is added to the analysis, the black-white
differences narrow by one or two additional percentage points for each
of the comparisons. In the case of IQ, this means that the racial differ-
IQ and Ethnic Economic Disparities
- When controlling for cognitive ability, age, and gender, the wage gap between black and white workers in the NLSY sample virtually disappears.
- Adjusting for IQ significantly reduces the family income gap between blacks and whites, though a 7 percent difference remains compared to Latinos who slightly exceed white income levels.
- The poverty rate differential between ethnic groups is cut by over 70 percent when IQ is held constant, though the black poverty rate remains nearly double that of whites.
- While educational and wage gaps close when IQ is considered, disparities in total family income and poverty suggest other underlying social factors are at play.
- Black unemployment rates remain historically higher than white rates, but controlling for cognitive ability begins to reduce these observed differences.
Controlling for age, IQ, and gender (ignoring education and parental SES), the average wage for year-round black workers in the NLSY sample was 101 percent of the average white wage.
3 24
The National Context
Ethnic Inequalities in Relation to IQ
325
Our finding that wage differentials nearly disappear may be a surprise
especially in light of the familiar conclusion that wage disparities per-
sist even for blacks and whites with the same education. For example,
in the 1992 national data collected by the Bureau of the Census, me-
dian earnings of year-round, full-time workers in 1992 were $41,005 for
white male graduates with a bachelor'sdegree and only $3 1,001 for black
males with the same degree.I5 Similar disparities occur all along the ed-
ucational range. The same pattern is found in the NLSY data. Even af-
ter controlling for education, blacks in the NLSY still earned only 80
percent of the white wage, which seems to make a prima facie case for
persistent discrimination in the labor market.
Blacks and whites who grow up in similar economic and social cir-
cumstances likewise continue to differ in their earning power as adults.
This too is true of the NLSY data. Suppose we control for three fac-
tors-age,
education, and socioeconomic background-that
are gener-
ally assumed to influence people's wages. The result is that black wages
are still only 84 percent of white wages, again suggesting continuing
racial discrimination.
And yet controlling just for IQ, ignoring both education and socioe-
conomic background, raises the average black wage to 98 percent of the
white wage and reduces the dollar gap in annual earnings from wages
for year-round workers to less than $600. A similar result is given as the
bottom row in the following table, this time extracting as well the ef-
Black Wages as a Percentage of White Wages, 1989
Occupation
Control-
Control-
Control-
Control-
ling Only
ling for
ling for Age,
ling Only
for Age
Age and Education, and for Age
Education Parental SES
and IQ
Professional/technical
87
92
95
102
Managersladministrators
73
7 2
74
82
Clerical workers
99
97
101
119
Sales workers
74
74
77
89
Craft and kindred workers
81
80
83
96
Transport operatives
88
87
90
1 08
Other operatives
80
80
84
100
Service workers
92
96
102
119
Unskilled laborers
67
69
72
84
All employed persons
80
82
86
98
fects of different occupational distributions between whites and blacks.
The rows above it show what happens when separate wages are com-
puted for different occupational groupings.
The tahle contains a number of noteworthy particulars, but the most
interesting result, which generalizes to every occupational category, is
how little difference education makes. A common complaint about
wages 1s that they are artificially affected by credentialism. If credentials
are important, then educational differences between blacks and whites
should account for much of their income differences. The table, how-
ever, shows that knowing the educational level ofblacks and whitesdoes
little to explain the difference in their wages. Socioeconomic back-
ground also fails to explain much of the wage gaps in one occupation
after another. That brings us to the final column, in which IQs are con-
trolled while education and socioeconclmic background are left to vary
as they will. The black-white income differences in most of the occu-
pations shrink constderahly. Altogether, the table says that an IQ score
is more important-in
most cases, much more important-in
explain-
ing black-white wage differences than are education and socioeconomic
background for every occupational category in it.
Analyzing the results in detail would require much finer hreakdowns
than the ones presented in the table. Why is there still a meaningful dif-
ferentlal in the managersladministrators category after controlling for
IQ? Why do blacks earn a large wage premium over whites of equiva-
lent age and IQ in clerical and service johs? The explanations could
have something to do with ethnic factors, but the varieties of jobs within
these categories are so wide that the differentials could reflect nothing
more than different ethnic distributions in specific jobs (for example,
the managersladministrators category includes jobs as different as a top
executive at GM and the shift manager of a McDonalds; the service
workers category includes both police and busboys). We will not try to
conduct those analyses, though we hope others will. At the level rep-
resented in the table, it looks as if the job market rewards blacks and
whites of equivalent cognitive ability nearly equally in almost every job
category.
Although we do not attempt the many analyses that might enrich
this basic conclusion, one other factor-gender-
IS so obv~ous that we
must mention it. When gender is added to the analysis, the black-white
differences narrow by one or two additional percentage points for each
of the comparisons. In the case of IQ, this means that the racial differ-
3 26
The National Context
Ethnic Inequalities in Relation to IQ
327
ence disappears altogether. Controlling for age, IQ, and gender (ignor-
ing education and parental SES), the average wage for year-round black
workers in the NLSY sample was 101 percent of the average white wage.
Annual Income and Poverty
We turn from wages to the broader question of annual family income.
The overall family income of a 29-year-old in the NLSY (who was not
still in school) was $41,558 for whites, compared to only $29,880 for
blacks and $35,5 14 for Latinos. Controlling for cognitive ability shrinks
the black-white difference in family income from $1 1,678 to $2,793, a
notable reduction, but not as large as for the wages discussed above:
black family income amounted to 93 percent of white family income af-
ter controlling for IQ. Meanwhile, mean Latino family income after
controlling for IQ was slightly higher than white income (101 percent
of the white mean). The persisting gap in family income between blacks
and whites is reflected in the poverty data, as the figure below shows.
Controlling for IQ shrinks the difference between whites and other eth-
nic groups substantially but not completely.
Controlling for IQ cuts the poverty differential by
77 percent for blacks and 74 percent for Latinos
The probability of being in poverty
For a person of average age (29) before controlling for IQ
Whites
796 I
26%' '
Blacks
I
Latinos
18%
I
For a person of average age and average IQ (100)
Whites
6% 1
Blacks
11%
Latinos
9%
If commentators and public policy specialists were looking at a 6 per-
cent poverty rate for whites against 11 percent for blacks-the
rates for
whites and blacks with IQs of 100 in the lower portion of the graphic-
their conclusions might differ from what they are when they see the un-
adjusted rates of 7 percent and 26 percent in the upper portion. At the
least, the ethnic disparities would look less grave. But even after con-
trolling for IQ, the black poverty rate remains almost twice as high as
the white rate-still
a significant differen~e."~'
Why does this gap per-
sist, like the gap in total family income, while the gaps in educational
attainment, occupations, and wages did not? The search for an answer
takes us successively further from the things that IQ can explain into
ethnic differences with less well understood roots.17
ETHNIC DIFFERENCES ON INDICATORS OF SOCIAL
PROBLEMS
Ethnic differences in poverty persist, albeit somewhat reduced, after
controlling for IQ. Let us continue with some of the other signs of so-
cial maladjustment that Part I1 assessed for whites alone, adding ethnic
differences to the analysis. We will not try to cover each of the indica-
tors in those eight chapters (Appendix 6 provides much of that detail),
but it may be instructive to look at a few of the most important ones,
seeing where IQ does, and does not, explain what is happening behind
the scenes.
Unemployment and Labor Force Participation
Black unemployment has been higher than white unemployment for as
long as records have been kept-more
than twice as high in 1992, typ-
ical of the last twenty
Once again the NLSY tracks with the na-
tional statistics. Restricting the analysis to men who were not enrolled
in school, 21 percent of blacks spent a month or more unemployed in
1989, more than twice the rate of whites (10 percent). The figure for
Latinos was 14 percent. Controlling for cognitive ability reduces these
percentages, but differently for blacks and Latinos. The difference be-
tween whites and Latinos disappears altogether, as the figure below
shows; that between whites and blacks narrows but does not disappear.
Black males with an IQ of 100 could expect a 15 percent chance of be-
ing unemployed for a month or more as of 1989, compared with an l l
percent chance for whites. Dropping out of the labor force is similarly
IQ and Ethnic Labor Disparities
- Statistical analysis shows that controlling for IQ significantly reduces the unemployment gap between white and black males and eliminates it for Latinos.
- The probability of a black male with an average IQ being unemployed for a month is 15 percent, compared to 11 percent for whites with the same IQ.
- While IQ explains a large portion of labor force participation disparities, it does not account for the persistent gap in marriage rates between races.
- Controlling for cognitive ability only reduces the black-white marriage gap by 8 percent, leaving a 21-point percentage difference at age 30.
- The authors suggest that while historical factors like racism are often cited for job outcomes, they do not explain why some economic sectors equalize under IQ controls while others do not.
- The text highlights a debate regarding whether structural unemployment or other personal attributes beyond IQ contribute to the lower marriage rates among black populations.
With the facts in hand, we cannot distinguish between the role of the usual historical factors that people discuss and the possibility of ethnic differences in whatever other personal attributes besides IQ determine a person's ability to do well in the job market.
3 26
The National Context
Ethnic Inequalities in Relation to IQ
327
ence disappears altogether. Controlling for age, IQ, and gender (ignor-
ing education and parental SES), the average wage for year-round black
workers in the NLSY sample was 101 percent of the average white wage.
Annual Income and Poverty
We turn from wages to the broader question of annual family income.
The overall family income of a 29-year-old in the NLSY (who was not
still in school) was $41,558 for whites, compared to only $29,880 for
blacks and $35,5 14 for Latinos. Controlling for cognitive ability shrinks
the black-white difference in family income from $1 1,678 to $2,793, a
notable reduction, but not as large as for the wages discussed above:
black family income amounted to 93 percent of white family income af-
ter controlling for IQ. Meanwhile, mean Latino family income after
controlling for IQ was slightly higher than white income (101 percent
of the white mean). The persisting gap in family income between blacks
and whites is reflected in the poverty data, as the figure below shows.
Controlling for IQ shrinks the difference between whites and other eth-
nic groups substantially but not completely.
Controlling for IQ cuts the poverty differential by
77 percent for blacks and 74 percent for Latinos
The probability of being in poverty
For a person of average age (29) before controlling for IQ
Whites
796 I
26%' '
Blacks
I
Latinos
18%
I
For a person of average age and average IQ (100)
Whites
6% 1
Blacks
11%
Latinos
9%
If commentators and public policy specialists were looking at a 6 per-
cent poverty rate for whites against 11 percent for blacks-the
rates for
whites and blacks with IQs of 100 in the lower portion of the graphic-
their conclusions might differ from what they are when they see the un-
adjusted rates of 7 percent and 26 percent in the upper portion. At the
least, the ethnic disparities would look less grave. But even after con-
trolling for IQ, the black poverty rate remains almost twice as high as
the white rate-still
a significant differen~e."~'
Why does this gap per-
sist, like the gap in total family income, while the gaps in educational
attainment, occupations, and wages did not? The search for an answer
takes us successively further from the things that IQ can explain into
ethnic differences with less well understood roots.17
ETHNIC DIFFERENCES ON INDICATORS OF SOCIAL
PROBLEMS
Ethnic differences in poverty persist, albeit somewhat reduced, after
controlling for IQ. Let us continue with some of the other signs of so-
cial maladjustment that Part I1 assessed for whites alone, adding ethnic
differences to the analysis. We will not try to cover each of the indica-
tors in those eight chapters (Appendix 6 provides much of that detail),
but it may be instructive to look at a few of the most important ones,
seeing where IQ does, and does not, explain what is happening behind
the scenes.
Unemployment and Labor Force Participation
Black unemployment has been higher than white unemployment for as
long as records have been kept-more
than twice as high in 1992, typ-
ical of the last twenty
Once again the NLSY tracks with the na-
tional statistics. Restricting the analysis to men who were not enrolled
in school, 21 percent of blacks spent a month or more unemployed in
1989, more than twice the rate of whites (10 percent). The figure for
Latinos was 14 percent. Controlling for cognitive ability reduces these
percentages, but differently for blacks and Latinos. The difference be-
tween whites and Latinos disappears altogether, as the figure below
shows; that between whites and blacks narrows but does not disappear.
Black males with an IQ of 100 could expect a 15 percent chance of be-
ing unemployed for a month or more as of 1989, compared with an l l
percent chance for whites. Dropping out of the labor force is similarly
328
The National Context
Ethnic lneqtlalities in Relation to IQ
329
After controlling for IQ, the ethnic discrepancy in
male unemployment shrinks by more than half for
blacks and disappears for Latinos
The probability of being unemployed for a month or more
For a person of average age (29) before controlling for IQ
White .
-- .I
Black
!I%
I
Latino
14%
I
For a person of average age and average lQ (100)
White
11%
I
Blac
I
Latin,
, ,
I
I
I
0%
10%
20%
related to IQ. Controlling for IQ shrinks the disparity between blacks
and whites by 65 percent and the disparity between Latinos and whites
by 73 percent.'19'
Scholars are discussing many possible explanations of the poorer job
outcomes for black males, some of which draw on the historical experi-
ence of slavery, others on the nature of the urbanizing process follow-
ing slavery, and sltill others on the structural shifts in the economy in
the 1970s, but ethnic differences in IQ are not often included among
the pos~ibitities.~~
Racism and other historical legacies may explain why
controlIing for IQ does not eliminate differences in unemployment and
dropping out of the lahor force, but, if so, we would be left with no ev-
ident explanation of why such factors are not similarly impeding the
equalization of education, occupational selection, or wages, once IQ is
taken into account. With the facts in hand, we cannot distinguish be-
tween the role of the usual historical factors that people discuss and the
possibility of ethnic differences in whatever other personal attributes
besides IQ determine a person's ability to do well in the job market. We
do not know whether ethnic groups differ on the average in these other
ways, let alone why they do so if they do. But to the extent that there
are such differences, controlling for IQ will not completely wash out the
disparities in unemployment and labor force participation. We will not
speculate further along these lines here.
Marriage
Historically, the black-white difference in marriage rates was small un-
til the early 1960s and then widened. By 1991, only 38 percent of black
women ages 15 to 44 were married, compared to 58 percent of white
women.12" In using the NLSY, we will limit the analysis to people who
had turned 30 by the time of the 1990 interview. Among this group, 78
percent of whites had married before turning 30 compared to only 54
percent of blacks. The white and Latino marriage rates were only a few
percentage points apart. When we add cognitive ability to the picture,
not much changes. According to the figure below, only 8 percent of the
black-white gap disappears after controlling for IQ, leaving a black with
an IQ of 100 with a 58 percent chance of having married by his or her
thirtieth birthday, compared to a 79 percent chance for a white with the
same IQ.
The reasons for this large difference in black and white marriage have
been the subject of intense debate that continues as we write. One
Controlling for IQ explains little of the large
black-white difference in marriage rates
The probability of having mamed by age 30
For persons age 30 and above before controlling for IQ
Whites
78%,
1
Blacks
54a6
I
Latinos -
Forper.sons age 30 and above with average IQ (100)
Whites "
'
' 79Bb
I
Blacks
' 58%
I
Latinos
75%
I
330
The National Context
Ethnic lnequalities in Relation to 1Q
33 1
school of thought argues that structural unemployment has reduced the
number of marriageable men for black women, but a growing body of
information indicates that neither a shortage of black males nor so-
cioeconomic deprivation explains the bulk of the black-white disparity
in marriage.1221
As we have just demonstrated, neither does 1Q explain
much. For reasons that are yet to be fully understood, black America
has taken a markedly different stance toward marriage than white and
Latino America.
A significant difference between blacks and whites in illegitimate births
goes back at least to the early part of this century. As with marriage,
however, the ethnic gap has changed in the last three decades. In 1960,
24 percent of black children were illegitimate, compared to only 2 per-
cent of white children-a
huge proportional difference. But birth
within marriage remained the norm for both races. By 1991, the figures
on illegitimate births were 68 percent of all births for blacks compared
to 39 percent for Latinos and 18 percent for non-Latino whites." The
proportional difference had shrunk, but the widening numerical differ-
ence between hlacks and whites had led to a situation in which births
within marriage were no longer the norm for blacks, while they re-
mained the norm (though a deteriorating one) for whites.
The black-white disparity in the NLSY is consistent with the na-
tional statistics (although somewhat lower than the latest figures, be-
cause it encompasses births from the mid- 1970s to 1990). As of the 1990
interview wave, the probabilities that a child of an NLSY woman would
he born out of wedlock (controlling for age) were 62 percent for blacks,
23 percent for Latinos, and 12 percent for non-Latino whites. As far as
we are able to determine, this disparity cannot be explained away, no
maltter what variables are entered into the equation. The figure below
shows the usual first step, controlling for cognitive ability.
Controlling for IQ reduced the Latino-white difference by 44 per-
cent but the black-white difference by only 20 percent. Nor does it
change much when we add the other factors discussed in Chapter 8:
socioeconomic background, poverty, coming from a broken home, or
education. No matter how the data are sliced, black women in the NLSY
(and in every other representative database that we know of) have a
much higher proportion of children out of wedlock than either whites
or Latinos. As we write, the debate over the ethnic disparity in illegit-
Controlling for IQ narrows the Latino-white difference in
illegitimacy but leaves a large gap between blacks and whites
The probability that women bear their children out of wedlock
For a mother of average age (29) before conrrolling for IQ
Whites 12% 1
Blacks
62%
I
Latinos
23% 1
For (J mother of average age and average IQ (100)
Whites 10%)
Blacks
51%
I
Latinos
17% 1
imacy remains as intense and as far from resolution as ever.24 We can
only add that ethnic differences in cognitive ability do not explain much
of it either.
Welfare
As of 199 1, about 2 1 percent of hlack women ages 15 to 44 were on
AFDC nationwide, compared to 12 percent of Latino women and 4 per-
cent of white women (including all women, mothers and nonmoth-
e r ~ ) . ' ~
The NLSY permits us to ask a related question that extends back
through time: How many of the NLSY women, ages 26 to 33 as of 1990,
had ever been on welfare?The answer is that 49 percent of black women
and 30 percent of all Latino women had been on welfare at one time or
another, compared to 13 percent of white women.12b1
The figure shows
the effects of controlling for IQ.
Adding cognitive ability explains away much of the disparity in wel-
fare recipiency among blacks, whites, and Latinos. In the case of Lati-
nos, where 84 percent of the difference disappears, the remaining
disparity with whites is about three percentage points. The disparity be-
tween blacks and whites-30
percent of black women receiving wel-
Ethnic Disparities in Family Structure
- Research indicates that socioeconomic deprivation and male shortages do not fully explain the significant black-white disparity in marriage rates.
- While birth within marriage was the norm for all races in 1960, by 1991, 68 percent of black births occurred out of wedlock.
- Controlling for cognitive ability (IQ) reduces the Latino-white gap in illegitimacy significantly but only narrows the black-white gap by 20 percent.
- The disparity in out-of-wedlock births persists regardless of variables like poverty, education, or coming from a broken home.
- In contrast to illegitimacy, controlling for IQ explains away a much larger portion of the ethnic disparity in welfare recipiency.
- The debate over the causes of ethnic disparities in family structure remains intense and unresolved by current data models.
For reasons that are yet to be fully understood, black America has taken a markedly different stance toward marriage than white and Latino America.
330
The National Context
Ethnic lnequalities in Relation to 1Q
33 1
school of thought argues that structural unemployment has reduced the
number of marriageable men for black women, but a growing body of
information indicates that neither a shortage of black males nor so-
cioeconomic deprivation explains the bulk of the black-white disparity
in marriage.1221
As we have just demonstrated, neither does 1Q explain
much. For reasons that are yet to be fully understood, black America
has taken a markedly different stance toward marriage than white and
Latino America.
A significant difference between blacks and whites in illegitimate births
goes back at least to the early part of this century. As with marriage,
however, the ethnic gap has changed in the last three decades. In 1960,
24 percent of black children were illegitimate, compared to only 2 per-
cent of white children-a
huge proportional difference. But birth
within marriage remained the norm for both races. By 1991, the figures
on illegitimate births were 68 percent of all births for blacks compared
to 39 percent for Latinos and 18 percent for non-Latino whites." The
proportional difference had shrunk, but the widening numerical differ-
ence between hlacks and whites had led to a situation in which births
within marriage were no longer the norm for blacks, while they re-
mained the norm (though a deteriorating one) for whites.
The black-white disparity in the NLSY is consistent with the na-
tional statistics (although somewhat lower than the latest figures, be-
cause it encompasses births from the mid- 1970s to 1990). As of the 1990
interview wave, the probabilities that a child of an NLSY woman would
he born out of wedlock (controlling for age) were 62 percent for blacks,
23 percent for Latinos, and 12 percent for non-Latino whites. As far as
we are able to determine, this disparity cannot be explained away, no
maltter what variables are entered into the equation. The figure below
shows the usual first step, controlling for cognitive ability.
Controlling for IQ reduced the Latino-white difference by 44 per-
cent but the black-white difference by only 20 percent. Nor does it
change much when we add the other factors discussed in Chapter 8:
socioeconomic background, poverty, coming from a broken home, or
education. No matter how the data are sliced, black women in the NLSY
(and in every other representative database that we know of) have a
much higher proportion of children out of wedlock than either whites
or Latinos. As we write, the debate over the ethnic disparity in illegit-
Controlling for IQ narrows the Latino-white difference in
illegitimacy but leaves a large gap between blacks and whites
The probability that women bear their children out of wedlock
For a mother of average age (29) before conrrolling for IQ
Whites 12% 1
Blacks
62%
I
Latinos
23% 1
For (J mother of average age and average IQ (100)
Whites 10%)
Blacks
51%
I
Latinos
17% 1
imacy remains as intense and as far from resolution as ever.24 We can
only add that ethnic differences in cognitive ability do not explain much
of it either.
Welfare
As of 199 1, about 2 1 percent of hlack women ages 15 to 44 were on
AFDC nationwide, compared to 12 percent of Latino women and 4 per-
cent of white women (including all women, mothers and nonmoth-
e r ~ ) . ' ~
The NLSY permits us to ask a related question that extends back
through time: How many of the NLSY women, ages 26 to 33 as of 1990,
had ever been on welfare?The answer is that 49 percent of black women
and 30 percent of all Latino women had been on welfare at one time or
another, compared to 13 percent of white women.12b1
The figure shows
the effects of controlling for IQ.
Adding cognitive ability explains away much of the disparity in wel-
fare recipiency among blacks, whites, and Latinos. In the case of Lati-
nos, where 84 percent of the difference disappears, the remaining
disparity with whites is about three percentage points. The disparity be-
tween blacks and whites-30
percent of black women receiving wel-
IQ and Ethnic Welfare Disparities
- Statistical analysis shows that controlling for IQ significantly reduces the gap in welfare participation rates between white, black, and Latino populations.
- Adjusting for IQ reduces the black-white welfare gap by half and the Latino-white gap by 84 percent among the general female population.
- Among women who were already below the poverty line prior to giving birth, controlling for IQ does not diminish the racial disparity in welfare usage.
- The data suggests that differences in welfare dependency between ethnic groups may be influenced by factors that transcend both poverty and cognitive ability.
- In the context of infant health, adjusting for maternal IQ reduces the black-white disparity in low-birth-weight babies by approximately 50 percent.
- Despite these adjustments, black children remain significantly more likely to live in poverty compared to white and Latino children.
These data, like those on illegitimacy and marriage, lend support to the suggestion that blacks differ from whites or Latinos in their likelihood of being on welfare for reasons that transcend both poverty and IQ.
332
The National Context
Ethnic Inequalities in Relation to IQ
333
Controlling for IQ cuts the gap in black-white welfare
rates by half and the Latino-white gap by 84 percent
The probability that a woman has ever been on welfare
(all women, mothers and non-mothers)
For a woman of average age (29) before controlling,fir IQ
Whites
13% 1
Blacks
49%
I
Latinos
30%
I
For a woman of average age and average IQ (100)
Whites
12% 1
Blacks
30%
I
Latinos
15% I
fare, compared to about 12 percent for whites-is
still large but only half
as large as the difference not adjusted for IQ.
This is as much as we are able to explain away. When we probe fur-
ther, 1Q does not do more to explain the black-white difference. For ex-
ample, we know that poverty is a crucial factor in determining whether
women go on welfare. We therefore explored whether IQ could explain
the black-white difference in a particular group of women: those who
had had children and had been below the poverty line in the year prior
to birth. The results of the analysis are shown in the figure below.
Among women who were poor in the year prior to birth, the black-white
difference is slightly larger after controlling for IQ, not smaller. These
data, like those on illegitimacy and marriage, lend support to the sug-
gestion that blacks differ from whites or Latinos in their likelihood of
being on welfare for reasons that transcend both poverty and IQ, for rea-
sons that are another subject of continuing debate in the 1iterat~re.l'~'
Low-Birth- Weight Babies
Low hirth weight, defined as infants weighing less than 5.5 pounds at
hirth, is predictive of many subsequent difficulties in the physical, so-
Even among poor mothers, controlling for 1Q does not
diminish the black.white disparity in welfare recipiency
The probability that a poor mother has ever been on welfare
For a poor mother of average age (29) heji~rr c*ontrolling,for IQ
White
62%
I
Black
78%
I
Latino
64%
4
For N poor nlother ofaveruge age i~nd averclge 1Q (100)
White
56%
I
Black
74%
I
Latino
54%
I
cial, and cognitive development of children. Historically, hlacks have
had much higher rates of low hirth weight than either Latinos or whites.
In the nlost recent reporting year (1991) for national data, almost four-
teen percent of all black babies were low birth weight, compared to five
percent of white babies and six percent of Latino babies.ZH
In our analy-
ses of the NLSY data, we focus on babies who were low hirth weight rel-
ative to the length of gestation, excluding premature babies who were
less than 5.5 pounds but were appropriate for gestational age using the
standard pediatric definition." Using unrounded data, the rate of low-
birth-weight births for blacks (10 percent) was 2.9 times as high as for
whites. The Latino rate was 1.5 times the white rate. The figure shows
what happens after controlling for IQ. The black rate, given an IQ of
100, drops from 10 percent to 6 percent, substantially closing the gap
with whites.13"l The Latino-white gap remains effectively unchanged.
Children Living in Poverty
In 1992, 47 percent of black children under the age of 18 were living
under the poverty line. This extraordinarily high figure was nearly as
bad for Latino children, with 40 percent under the poverty line. For
334
The National Context
Ethnic Inequalities in Relation to IQ
335
Controlling for IQ cuts the black-white disparity
in low-birth-weight babies by half
The probability of giving birth to a low-birth-weight baby
For a mother of average age (29) before controlling for IQ
Whites
3%
Blacks
10%
I
Latinos
For a mother of average age and average IQ (100)
Whites
3% I
Blacks
6%
I
Latinos
5%
I
I
I
I
I
I
I
0%
2%
4%
6%
8%
10%
non-Latino whites, the proportion was about 14 percent.'"' In ap-
proaching this issue through the NLSY, we concentrated on very young
children, identifying those who had lived in families with incomes be-
low the poverty line throughout their first three years of life. The re-
sults, before and after controlling for IQ, are shown in the upper figure
on the next page. Given a mother with average IQ and average age, the
probability that a black child in the NLSY lived in poverty throughout
his first three years was only 14 percent, compared to an uncorrected
black average of 54 percent. The reduction for Latinos, from 30 percent
to 10 percent, was also large. The proportional difference between mi-
norities and whites remains large.32
The Child's Home Environment
We now turn to the measure of the home environment, the HOME in-
dex, described in Chapter 10. For this and the several other indexes used
in the assessment of NLSY children, we follow our practice in Chapter
10, focusing on children at the bottom of each scale, with bottom op-
erationally defined as being in the bottom 10 percent.
The disparities in low HOME index scores between whites and
minorities were large (see the lower figure on the next page). It was
Controlling for IQ reduces the discrepancy between minority and
white children living in poverty by more than 80 percent
The probability of a child living in poverty for the first three years
Born to n mother average age (29) before controlling,for IQ
Whites 9% 1
Blacks
54%
I
Latinos
30?6
I
Born to a nlother cfaveragu use urld avercrge IQ ( 100)
Whites 9
Blacks
14% )
Latinos 10% 1
I
I
'
I
1
'
1
'
1
I
0% 10% 20% 30% 40% 50% 60%
Controlling for IQ cuts the ethnic disparity in home environments
bv half for blacks and more than 60 percent for Latinos
The probability of being in the bottom decile on the HOME index
Born to a person cfaverage age (29) before controlling for IQ
White\
7% (
Blacks
2aa
4
-
Latinos
21% -
Born to N pers(lt1 [$crverage age and average IQ (100)
Whites 6% (
Blacks
16%
h
Latinos
11%
&
I
I
I
I
0%
10%
20%
30%
IQ and Ethnic Disparities
- The text examines how controlling for maternal IQ significantly reduces the statistical gap in poverty rates between white, black, and Latino children.
- When maternal IQ and age are held constant, the probability of a black child living in poverty for their first three years drops from 54 percent to 14 percent.
- Disparities in the HOME index, which measures the quality of a child's home environment, are cut by half or more when IQ is factored into the analysis.
- Ethnic differences in child development indexes nearly disappear or even reverse after controlling for maternal IQ, with minority children sometimes scoring better than white children.
- The authors suggest that developmental index results might be influenced by mothers using different ethnic reference points when self-reporting their children's progress.
The ethnic disparities were not great even before controlling for IQ, and they more than disappeared after controlling for IQ.
334
The National Context
Ethnic Inequalities in Relation to IQ
335
Controlling for IQ cuts the black-white disparity
in low-birth-weight babies by half
The probability of giving birth to a low-birth-weight baby
For a mother of average age (29) before controlling for IQ
Whites
3%
Blacks
10%
I
Latinos
For a mother of average age and average IQ (100)
Whites
3% I
Blacks
6%
I
Latinos
5%
I
I
I
I
I
I
I
0%
2%
4%
6%
8%
10%
non-Latino whites, the proportion was about 14 percent.'"' In ap-
proaching this issue through the NLSY, we concentrated on very young
children, identifying those who had lived in families with incomes be-
low the poverty line throughout their first three years of life. The re-
sults, before and after controlling for IQ, are shown in the upper figure
on the next page. Given a mother with average IQ and average age, the
probability that a black child in the NLSY lived in poverty throughout
his first three years was only 14 percent, compared to an uncorrected
black average of 54 percent. The reduction for Latinos, from 30 percent
to 10 percent, was also large. The proportional difference between mi-
norities and whites remains large.32
The Child's Home Environment
We now turn to the measure of the home environment, the HOME in-
dex, described in Chapter 10. For this and the several other indexes used
in the assessment of NLSY children, we follow our practice in Chapter
10, focusing on children at the bottom of each scale, with bottom op-
erationally defined as being in the bottom 10 percent.
The disparities in low HOME index scores between whites and
minorities were large (see the lower figure on the next page). It was
Controlling for IQ reduces the discrepancy between minority and
white children living in poverty by more than 80 percent
The probability of a child living in poverty for the first three years
Born to n mother average age (29) before controlling,for IQ
Whites 9% 1
Blacks
54%
I
Latinos
30?6
I
Born to a nlother cfaveragu use urld avercrge IQ ( 100)
Whites 9
Blacks
14% )
Latinos 10% 1
I
I
'
I
1
'
1
'
1
I
0% 10% 20% 30% 40% 50% 60%
Controlling for IQ cuts the ethnic disparity in home environments
bv half for blacks and more than 60 percent for Latinos
The probability of being in the bottom decile on the HOME index
Born to a person cfaverage age (29) before controlling for IQ
White\
7% (
Blacks
2aa
4
-
Latinos
21% -
Born to N pers(lt1 [$crverage age and average IQ (100)
Whites 6% (
Blacks
16%
h
Latinos
11%
&
I
I
I
I
0%
10%
20%
30%
336
The National Context
Ethnic Inequalities in Relation to IQ
337
substantially reduced, by 52 percent for blacks and 64 percent for Lati-
nos, but the black rate remained well over twice the white rate and the
Latino rate close to twice the white rate.j3
lndicators of the Child's Development
Details on the several indexes of ch~ld development presented in Chap-
ter 10 may be found in Appendix 6. We summarize them here by show-
ing the proportion of children who showed up in the bottom decile of
any of the indexes.
As the figure below shows, the ethnic disparities were not great even
before controlling for IQ, and they more than disappeared after con-
trolling for IQ. We leave this finding as it stands, but it obviously raises
Controlling for IQ more than eliminates overall
ethnic differences in the developmental indexes
The probability that a child was in the bottom decile of
one or more of the developmental indexes
Born to a mother of average age (29) before controlling for IQ
Whites
1096
I
Blacks
13%
I
Latinos
"
13%
h
Born to a mother of average age and average 1Q (100)
Whites
10%
I
Blacks
7% )
Latinos
8%
I
a number of issues. Since these indexes are based primarily on the moth-
ers' assessments, it is possible that women of different ethnic groups use
different reference points (as has been found on ethnic differences in
other self-report measures).j4 It is also possible that the results may be
taken at face value and that minority children with mothers of similar
age and IQ do better on developmental measures than white children,
which could have important implications. Filling out this story lies be-
yond the scope of our work, but we hope it will be taken up by others.35
Intellectual Development
We will discuss this topic in more detail in Chapter 15 as we present the
effects of differential fertility across ethnic groups. The figure below
shows the children of NLSY mothers who scored in the bottom decile
on the Peabody Picture Vocabulary Test (PPVT) basedon national norms,
not the bottom decile of children within the NLSY sample. Control-
Based on national norms, high percentages of minority children
remain in the bottom decile of IQ after controlling for the
mother's IQ
The probability that a child is in the bottom decile of the PPVT
(based on national norms)
Born to a person of averczge age (29) before controlling for IQ
Whites 9
Blacks
55%
I
Latinos
Born to o person of average age and average IQ (100)
Whites 10% 1
Blacks
33%
I
Latinos
30%
I
I
I
I
1
'
1
'
1
I
0%
10% 2010 30% 40% 50% 60%
ling for the mother's IQ reduces ethnic disparities considerably while
once again leaving a broad gap with whites-in
this case, roughly an
equal gap between whites and both blacks and Latinos. The point that
stands out, however, is the extremely large proportion of minority NLSY
children who were in the bottom decile of the PPVT-in
effect, mean-
IQ and Ethnic Disparities
- The text examines how controlling for maternal IQ reduces, but does not eliminate, the high percentage of minority children in the bottom decile of national IQ norms.
- Data suggests that black children are significantly more likely to score in the bottom decile of the PPVT (IQ of 80 or lower) compared to white children, even when mothers have average IQs.
- The authors cite research suggesting that IQ differences may explain a large portion of the disparity in juvenile delinquency rates between black and white populations.
- Incarceration rates for black men are over five times higher than for white men in the sample, but this gap shrinks by nearly three-quarters when cognitive ability is controlled.
- The Middle Class Values (MCV) Index is introduced as a metric for 'solid citizenship,' tracking marriage stability, labor force participation, and legal status.
- The findings are presented as a source of concern regarding national fertility trends and the creation of peaceful, prosperous communities.
This large black-white difference was reduced by almost three-quarters when IQ was taken into account.
336
The National Context
Ethnic Inequalities in Relation to IQ
337
substantially reduced, by 52 percent for blacks and 64 percent for Lati-
nos, but the black rate remained well over twice the white rate and the
Latino rate close to twice the white rate.j3
lndicators of the Child's Development
Details on the several indexes of ch~ld development presented in Chap-
ter 10 may be found in Appendix 6. We summarize them here by show-
ing the proportion of children who showed up in the bottom decile of
any of the indexes.
As the figure below shows, the ethnic disparities were not great even
before controlling for IQ, and they more than disappeared after con-
trolling for IQ. We leave this finding as it stands, but it obviously raises
Controlling for IQ more than eliminates overall
ethnic differences in the developmental indexes
The probability that a child was in the bottom decile of
one or more of the developmental indexes
Born to a mother of average age (29) before controlling for IQ
Whites
1096
I
Blacks
13%
I
Latinos
"
13%
h
Born to a mother of average age and average 1Q (100)
Whites
10%
I
Blacks
7% )
Latinos
8%
I
a number of issues. Since these indexes are based primarily on the moth-
ers' assessments, it is possible that women of different ethnic groups use
different reference points (as has been found on ethnic differences in
other self-report measures).j4 It is also possible that the results may be
taken at face value and that minority children with mothers of similar
age and IQ do better on developmental measures than white children,
which could have important implications. Filling out this story lies be-
yond the scope of our work, but we hope it will be taken up by others.35
Intellectual Development
We will discuss this topic in more detail in Chapter 15 as we present the
effects of differential fertility across ethnic groups. The figure below
shows the children of NLSY mothers who scored in the bottom decile
on the Peabody Picture Vocabulary Test (PPVT) basedon national norms,
not the bottom decile of children within the NLSY sample. Control-
Based on national norms, high percentages of minority children
remain in the bottom decile of IQ after controlling for the
mother's IQ
The probability that a child is in the bottom decile of the PPVT
(based on national norms)
Born to a person of averczge age (29) before controlling for IQ
Whites 9
Blacks
55%
I
Latinos
Born to o person of average age and average IQ (100)
Whites 10% 1
Blacks
33%
I
Latinos
30%
I
I
I
I
1
'
1
'
1
I
0%
10% 2010 30% 40% 50% 60%
ling for the mother's IQ reduces ethnic disparities considerably while
once again leaving a broad gap with whites-in
this case, roughly an
equal gap between whites and both blacks and Latinos. The point that
stands out, however, is the extremely large proportion of minority NLSY
children who were in the bottom decile of the PPVT-in
effect, mean-
338
The National Context
Ethnic Inequalities in Relation to IQ
339
ing an IQ of 80 or lower-when
national norms are applied. This is one
of the reasons for concern about fertility that we discuss in Chapter 15.
Crime
In the national data, blacks are about 3.8 times more likely to be ar-
rested relative to their numbers in the general population than whites
(Latino and non-Latino whites are combined in this comparison).'"
Blacks are also disproportionately the victims of crime, especially vio-
lent crime. The ratio of black homicide victims to white as of 1990 was
7.7 to 1 for men and 4.8 to 1 for women.j7
Sociologist Robert Gordon has analyzed black-white differences in
crime and concluded that virtually all of the difference in the preva-
lence of black and white juvenile delinquents is explained by the IQ dif-
ference, independent of the effect of socioeconomic s t a t ~ s . ~
The only
reliable indicator from the NLSY that lets us compare criminal behav-
ior across ethnic groups is the percentage of young men who were ever
interviewed while in~arcerated."~'
The figure below shows the standard
comparison, before and after controlling for cognitive ability. Among
white men, the proportion interviewed in a correctional facility after
Controlling for IQ cuts the black-white difference
in incarceration by almost three-quarters
The probability of ever having been interviewed
in a correctional facility
For a man of average age (29) before controlling for IQ
Whites 2% 1
Blacks
" *"" *1'3%
" ,
a ,
Latinos
6%
4
For a man of average age and average 1Q (100)
Whites 9
Blacks,
5%
Latinos
3% )
I
I
I
0%
I
5 %
10%
15%
controlling for age was 2.4 percent; among black men, it was 13.1 per-
cent. This large black-white difference was reduced by almost three-
quarters when IQ was taken into account. The relationship of cognitive
ability to criminal behavior among whites and blacks appears to be sim-
ilar.40 As in the case of other indicators, we are left with a nontrivial
black-white difference even after controlling for IQ, but the magnitude
of the difference shrinks dramatically.
The Middle Class Values Index
We concluded Part 11 with the Middle Class Values (MCV) Index,
which scores a "yes" for those young adults in the NLSY who were still
married to their first spouse, in the labor force if they were men, bear-
ing their children within marriage if they were women, and staying out
of jail, and scores a "no" for those who failed any of those criteria. Never-
married people who met all the other criteria were excluded. The MCV
Index, as unsophisticated as it is, has a serious purpose: It captures a set
of behaviors that together typify (though obviously do not define) "solid
citizens." Having many such citizens is important for the creation of
peaceful and prosperous communities. The figure below shows what
The MCV Index, before and after controlling for IQ
The probability of scoring "yes" on the
Middle Class Values Index
For a person of average age (29) before controlling for IQ
, "
" c ", ,
Whites
Blacks
20% 1
Latinos
3 1%
I
For a person of average age and average IQ (100)
46% "
Whites
h
Blacks
32%
I
Latinos
45%
I
I
I
I
0%
20%
40%
60%
Cognitive Ability and Ethnic Disparities
- The MCV Index reveals that ethnic disparities in social and economic behaviors shrink significantly when controlling for IQ, particularly between Latinos and whites.
- Black individuals with similar cognitive ability to whites or Latinos often have a higher probability of obtaining degrees and white-collar employment.
- Despite these findings, some ethnic differences in social indicators remain unexplained even after accounting for intelligence and other variables.
- The text argues that understanding the role of cognitive ability is an essential prerequisite for addressing ethnic inequality and constructing an equitable society.
- Demographic trends in the West suggest a 'dysgenic' pressure on national intelligence as birth rates fall faster among more educated women.
- There is concern that these demographic shifts are more pronounced among minority groups, potentially leading to further divergence in future generations.
Racial and ethnic differences in this country are seen in a new light when cognitive ability is added to the picture.
338
The National Context
Ethnic Inequalities in Relation to IQ
339
ing an IQ of 80 or lower-when
national norms are applied. This is one
of the reasons for concern about fertility that we discuss in Chapter 15.
Crime
In the national data, blacks are about 3.8 times more likely to be ar-
rested relative to their numbers in the general population than whites
(Latino and non-Latino whites are combined in this comparison).'"
Blacks are also disproportionately the victims of crime, especially vio-
lent crime. The ratio of black homicide victims to white as of 1990 was
7.7 to 1 for men and 4.8 to 1 for women.j7
Sociologist Robert Gordon has analyzed black-white differences in
crime and concluded that virtually all of the difference in the preva-
lence of black and white juvenile delinquents is explained by the IQ dif-
ference, independent of the effect of socioeconomic s t a t ~ s . ~
The only
reliable indicator from the NLSY that lets us compare criminal behav-
ior across ethnic groups is the percentage of young men who were ever
interviewed while in~arcerated."~'
The figure below shows the standard
comparison, before and after controlling for cognitive ability. Among
white men, the proportion interviewed in a correctional facility after
Controlling for IQ cuts the black-white difference
in incarceration by almost three-quarters
The probability of ever having been interviewed
in a correctional facility
For a man of average age (29) before controlling for IQ
Whites 2% 1
Blacks
" *"" *1'3%
" ,
a ,
Latinos
6%
4
For a man of average age and average 1Q (100)
Whites 9
Blacks,
5%
Latinos
3% )
I
I
I
0%
I
5 %
10%
15%
controlling for age was 2.4 percent; among black men, it was 13.1 per-
cent. This large black-white difference was reduced by almost three-
quarters when IQ was taken into account. The relationship of cognitive
ability to criminal behavior among whites and blacks appears to be sim-
ilar.40 As in the case of other indicators, we are left with a nontrivial
black-white difference even after controlling for IQ, but the magnitude
of the difference shrinks dramatically.
The Middle Class Values Index
We concluded Part 11 with the Middle Class Values (MCV) Index,
which scores a "yes" for those young adults in the NLSY who were still
married to their first spouse, in the labor force if they were men, bear-
ing their children within marriage if they were women, and staying out
of jail, and scores a "no" for those who failed any of those criteria. Never-
married people who met all the other criteria were excluded. The MCV
Index, as unsophisticated as it is, has a serious purpose: It captures a set
of behaviors that together typify (though obviously do not define) "solid
citizens." Having many such citizens is important for the creation of
peaceful and prosperous communities. The figure below shows what
The MCV Index, before and after controlling for IQ
The probability of scoring "yes" on the
Middle Class Values Index
For a person of average age (29) before controlling for IQ
, "
" c ", ,
Whites
Blacks
20% 1
Latinos
3 1%
I
For a person of average age and average IQ (100)
46% "
Whites
h
Blacks
32%
I
Latinos
45%
I
I
I
I
0%
20%
40%
60%
340
The National Context
happens when the MCV Index is applied to different ethnic groups, first
adjusting only for age and then controlling for IQ as well. (In inter-
preting these data, bear in mind that large numbers of people of all eth-
nicities who did not score "yes" are leading virtuous and productive
lives.) The ethnic disparities remain instructive. Before controlling for
IQ, large disparities separate both Latinos and blacks from whites. Rut
given average IQ, the Latino-white difference shrank to three percent-
age points. The difference between blacks and whites and Latinos re-
mains substantial, though only about half as large as it was before
controlling for IQ. This outcome is not surprising, given what we have
already shown about ethnic differences on the indicators that go into
the MCV Index, but it nonetheless points in a summary fashion to a
continuing divergence between blacks and the rest of the American
population in some basic social and economic behaviors.
A MORE REALISTIC VIEW OF ETHNIC DISPARITIES IN
SOCIAL AND ECONOMIC INDICATORS
If one of America's goals is to rid itself of racism and inst~tutional d ~ s -
crim~nation, then we should welcome the finding that a Latino and
white of similar cognitive ability have the same chances of getting il
bachelor's degree and working in a white-collar job. A black with the
same cognitive ability has an even higher chance than either the Latino
or white of having those good things happen. A Latino, black, and wh~te
of similar cognitive ability earn annual wages within a few hundred dol-
lars of one another.
Some ethnic differences are not washed away by controlling either
for intelligence or for any other variables that we examined. We leave
those remaining differences unexplained and look forward to learning
from our colleagues where the explanations lie. We urge only that they
explore those explanations after they have extracted the role-often
the large role-that
cognitive ability plays.
Similarly, the evidence presented here should give everyone who
writes and talks about ethnic inequalities reason to avoid flamboyant
rhetoric about ethnic oppression. Racial and ethnic differences in this
country are seen in a new light when cognitive ability is added to the
picture. Awareness of these relat~onships is an essential first step in try-
ing to construct an equitable America.
Chapter 15
The Demography of Intelligence
When people die, they are not replaced one for one by babies who will develop
identical IQs. If the new babies grow up to have systematically higher or lower
IQs than the people who die, the national discrihtion of intelligence changes.
Mounting evidence indicates that demographic trends are exerting downward
pressure on the distribution of cognitive ability in the United States and that
the pressures are strong enough to have social consequences.
Throughout the West, modernization has brought falling birth rates. The
rates fall faster for educated women than the uneducated. Because education
is so closely linked with cognitive ability, this tends to produce a dysgenic ef-
fect, m a downward shift in the ability distribution. Furthermore, education
leads women to have their babies later--which alone also produces additional
dysgenic pressures.
The professional consensus is that the United States has experienced dys-
genic pressures throughout either most of the century (the optimists) or dl of
the century (the pessimists). Women of all races and ethnic groups follow this
pattern in similar fashion. There is some evidence that blacks and Latinos are
experiencingeven more severe dysgnic pressures than whites, which could lead
to further divergence between whites and other groups in future generations.
The ruks that currently govern immigration provide the other major source
of dysgenic pressure. It appears that the mean IQ of immigrants in the 1980s
works out to about 95. The low IQ may not be a problem; in the past, im-
migrants have sometimes shown large increases on such measures. But other
evidence indicates that the self-selection process that used to attract the clas-
sic American immigrant-brave,
hard working, imaginative, self-starting,
and often of high IQ-has
been changing, and with it the nature of some of
the immigrant population.
Putting the pieces together, something worth uloying about is happening
to the cognitive capital of the country, lmproved health, education, and child-
hood interventions may hide the demographic effects, but that does not reduce
The Demography of Intelligence
- Current immigration rules and shifting self-selection processes may be contributing to a decline in the average cognitive ability of new arrivals.
- The concept of 'dysgenesis' is used to describe the downward pressure on the national distribution of IQ scores due to demographic shifts.
- Differential birth rates, where women with lower IQ scores reproduce more rapidly than those with higher scores, are identified as a primary driver of this trend.
- The authors argue that the impact of these demographic trends is significant enough to have measurable social consequences regardless of the nature-nurture debate.
- Historical concerns about dysgenesis date back to the late nineteenth century, noting that fertility often declines most sharply among higher social classes.
- Environmental improvements in health and education may be masking these underlying demographic effects, creating a 'demographic head wind' for social progress.
Whatever good things we can accomplish with changes in the environment would be that much more effective if they did not have to fight a demographic head wind.
340
The National Context
happens when the MCV Index is applied to different ethnic groups, first
adjusting only for age and then controlling for IQ as well. (In inter-
preting these data, bear in mind that large numbers of people of all eth-
nicities who did not score "yes" are leading virtuous and productive
lives.) The ethnic disparities remain instructive. Before controlling for
IQ, large disparities separate both Latinos and blacks from whites. Rut
given average IQ, the Latino-white difference shrank to three percent-
age points. The difference between blacks and whites and Latinos re-
mains substantial, though only about half as large as it was before
controlling for IQ. This outcome is not surprising, given what we have
already shown about ethnic differences on the indicators that go into
the MCV Index, but it nonetheless points in a summary fashion to a
continuing divergence between blacks and the rest of the American
population in some basic social and economic behaviors.
A MORE REALISTIC VIEW OF ETHNIC DISPARITIES IN
SOCIAL AND ECONOMIC INDICATORS
If one of America's goals is to rid itself of racism and inst~tutional d ~ s -
crim~nation, then we should welcome the finding that a Latino and
white of similar cognitive ability have the same chances of getting il
bachelor's degree and working in a white-collar job. A black with the
same cognitive ability has an even higher chance than either the Latino
or white of having those good things happen. A Latino, black, and wh~te
of similar cognitive ability earn annual wages within a few hundred dol-
lars of one another.
Some ethnic differences are not washed away by controlling either
for intelligence or for any other variables that we examined. We leave
those remaining differences unexplained and look forward to learning
from our colleagues where the explanations lie. We urge only that they
explore those explanations after they have extracted the role-often
the large role-that
cognitive ability plays.
Similarly, the evidence presented here should give everyone who
writes and talks about ethnic inequalities reason to avoid flamboyant
rhetoric about ethnic oppression. Racial and ethnic differences in this
country are seen in a new light when cognitive ability is added to the
picture. Awareness of these relat~onships is an essential first step in try-
ing to construct an equitable America.
Chapter 15
The Demography of Intelligence
When people die, they are not replaced one for one by babies who will develop
identical IQs. If the new babies grow up to have systematically higher or lower
IQs than the people who die, the national discrihtion of intelligence changes.
Mounting evidence indicates that demographic trends are exerting downward
pressure on the distribution of cognitive ability in the United States and that
the pressures are strong enough to have social consequences.
Throughout the West, modernization has brought falling birth rates. The
rates fall faster for educated women than the uneducated. Because education
is so closely linked with cognitive ability, this tends to produce a dysgenic ef-
fect, m a downward shift in the ability distribution. Furthermore, education
leads women to have their babies later--which alone also produces additional
dysgenic pressures.
The professional consensus is that the United States has experienced dys-
genic pressures throughout either most of the century (the optimists) or dl of
the century (the pessimists). Women of all races and ethnic groups follow this
pattern in similar fashion. There is some evidence that blacks and Latinos are
experiencingeven more severe dysgnic pressures than whites, which could lead
to further divergence between whites and other groups in future generations.
The ruks that currently govern immigration provide the other major source
of dysgenic pressure. It appears that the mean IQ of immigrants in the 1980s
works out to about 95. The low IQ may not be a problem; in the past, im-
migrants have sometimes shown large increases on such measures. But other
evidence indicates that the self-selection process that used to attract the clas-
sic American immigrant-brave,
hard working, imaginative, self-starting,
and often of high IQ-has
been changing, and with it the nature of some of
the immigrant population.
Putting the pieces together, something worth uloying about is happening
to the cognitive capital of the country, lmproved health, education, and child-
hood interventions may hide the demographic effects, but that does not reduce
342
The National Context
The Demography of Intelligence
343
their importance. Whatever good things we can accomplish with changes in
the environment would be that much more effective if they did not have to fight
a demographic head wind.
S
o far, we have been treating the distribution of intelligence as a fixed
entity. But as the population replenishes itself from generation to
generation by birth and immigration, the people who pass from the
scene are not going to be replaced, one for one, by other people with
the same IQ scores. This is what we mean by the demography of intel-
ligence. The question is not whether demographic processes in and of
themselves can have an impact on the distribution of scores-that
much
is certain-but
what and how big the impact is, compared to all the
other forces pushing the distribution around. Mounting evidence indi-
cates that demographic trends are exerting downward pressures on the
distribution of cognitive ability in the United States and that the pres-
sures are strong enough to have social consequences.
We will refer to this downward pressure as dysgenesis, borrowing a
term from population biology. However, it is important once again not
to be sidetracked by the role of genes versus the role of environment.
Children resemble their parents in IQ, for whatever reason, and im-
migrants and their descendants may not duplicate the distribution of
America's resident cognitive ability distribution. If women with low
scores are reproducing more rapidly than women with high scores, the
distribution of scores will, other things equal, decline, no matter
whether the women with the low scores came by them through nature
or nurture.''' More generally, if population growth varies across the range
of IQ scores, the next generation will have a different distribution of
scores.' In trying to foresee changes in American life, what matters is
how the distribution of intelligence is changing, more than why.
Our exploration of this issue will proceed in three stages. First, we
will describe the state of knowledge about when and why dysgenesis oc-
curs. Next, we will look at the present state of affairs regarding differ-
ential birth rates, differential age of childbearing, and immigration.
Finally, we wilt summarize the shape of the future as best we can discern
it and describe the magnitude of the stakes involved.
THE EVOLVING UNDERSTANDING OF DYSGENESIS
The understanding of dysgenesis has been a contest between pessimists
and optimists. For many decades when people first began to think sys-
tematically about intelligence and reproduction in the late nineteenth
century, all was pessimism. The fertility rate in England began to fall in
the 1870s, and it did not take long for early students of demography to
notice that fertility was declining most markedly at the upper levels of
social status, where the people were presumed to be smarter.' The larger
families were turning up disproportionately in the lower classes. Darwin
himself had noted that even within the lower classes, the smaller fam-
ilies had the brighter, the more "prudent," people in them.
All that was needed to conclude that this pattern of reproduction was
bad news for the genetic legacy was arithmetic, argued the British schol-
ars around the turn of the twentieth century who wanted to raise the
intelligence of the population through a new science that they called
eugenic^.'^' Their influence crossed the ocean to the United States,
where the flood of immigrants from Russia, eastern Europe, and the
Mediterranean raised a similar concern. Were those huddled masses
bringing to our shores a biological inheritance inconsistent with the
American way of life? Some American eugenicists thought so, and they
said as much to the Congress when it enacted the Immigration Act of
1924, as we described in the 1ntroduction.15' Then came scientific en-
lightenment-the
immigrants did not seem to be harming America's
genetic legacy a bit-followed
by the terrors of nazism and its perver-
sion of eugenics that effectively wiped the idea from public discourse in
the West. But at bottom, the Victorian eugenic~sts and their successors
had detected a demographic pattern that seems to arise with great
(though not universal) consistency around the world.
For this story, let us turn first to a phenomenon about which there
is no serious controversy, the demographic transition. Throughout the
world, the premodern period is characterized by a balance between high
death rates and high birth rates in which the population remains more
or less constant. Then modernization brings better hygiene, nutrition,
and medicine, and death rates begin to fall. In the early phases of mod-
ernization, birth rates remain at their traditional levels, sustained by
deeply embedded cultural and social traditions that encourage big fam-
The Demography of Intelligence
- Early twentieth-century eugenicists feared that differential reproduction rates between social classes would degrade the national genetic legacy.
- The demographic transition describes a shift from high birth and death rates to a state of low growth as modernization improves hygiene and medicine.
- In modern Western societies, declines in fertility occur disproportionately among educated and high-status women.
- Privileged women in premodern times had a reproductive advantage due to better health, but modernization has narrowed these biological gaps.
- Modern social structures create opportunity costs for educated women, who often defer motherhood for schooling and professional careers.
- The negative correlation between fertility and educational status is a consistent demographic pattern observed across various modern cultures.
Were those huddled masses bringing to our shores a biological inheritance inconsistent with the American way of life?
342
The National Context
The Demography of Intelligence
343
their importance. Whatever good things we can accomplish with changes in
the environment would be that much more effective if they did not have to fight
a demographic head wind.
S
o far, we have been treating the distribution of intelligence as a fixed
entity. But as the population replenishes itself from generation to
generation by birth and immigration, the people who pass from the
scene are not going to be replaced, one for one, by other people with
the same IQ scores. This is what we mean by the demography of intel-
ligence. The question is not whether demographic processes in and of
themselves can have an impact on the distribution of scores-that
much
is certain-but
what and how big the impact is, compared to all the
other forces pushing the distribution around. Mounting evidence indi-
cates that demographic trends are exerting downward pressures on the
distribution of cognitive ability in the United States and that the pres-
sures are strong enough to have social consequences.
We will refer to this downward pressure as dysgenesis, borrowing a
term from population biology. However, it is important once again not
to be sidetracked by the role of genes versus the role of environment.
Children resemble their parents in IQ, for whatever reason, and im-
migrants and their descendants may not duplicate the distribution of
America's resident cognitive ability distribution. If women with low
scores are reproducing more rapidly than women with high scores, the
distribution of scores will, other things equal, decline, no matter
whether the women with the low scores came by them through nature
or nurture.''' More generally, if population growth varies across the range
of IQ scores, the next generation will have a different distribution of
scores.' In trying to foresee changes in American life, what matters is
how the distribution of intelligence is changing, more than why.
Our exploration of this issue will proceed in three stages. First, we
will describe the state of knowledge about when and why dysgenesis oc-
curs. Next, we will look at the present state of affairs regarding differ-
ential birth rates, differential age of childbearing, and immigration.
Finally, we wilt summarize the shape of the future as best we can discern
it and describe the magnitude of the stakes involved.
THE EVOLVING UNDERSTANDING OF DYSGENESIS
The understanding of dysgenesis has been a contest between pessimists
and optimists. For many decades when people first began to think sys-
tematically about intelligence and reproduction in the late nineteenth
century, all was pessimism. The fertility rate in England began to fall in
the 1870s, and it did not take long for early students of demography to
notice that fertility was declining most markedly at the upper levels of
social status, where the people were presumed to be smarter.' The larger
families were turning up disproportionately in the lower classes. Darwin
himself had noted that even within the lower classes, the smaller fam-
ilies had the brighter, the more "prudent," people in them.
All that was needed to conclude that this pattern of reproduction was
bad news for the genetic legacy was arithmetic, argued the British schol-
ars around the turn of the twentieth century who wanted to raise the
intelligence of the population through a new science that they called
eugenic^.'^' Their influence crossed the ocean to the United States,
where the flood of immigrants from Russia, eastern Europe, and the
Mediterranean raised a similar concern. Were those huddled masses
bringing to our shores a biological inheritance inconsistent with the
American way of life? Some American eugenicists thought so, and they
said as much to the Congress when it enacted the Immigration Act of
1924, as we described in the 1ntroduction.15' Then came scientific en-
lightenment-the
immigrants did not seem to be harming America's
genetic legacy a bit-followed
by the terrors of nazism and its perver-
sion of eugenics that effectively wiped the idea from public discourse in
the West. But at bottom, the Victorian eugenic~sts and their successors
had detected a demographic pattern that seems to arise with great
(though not universal) consistency around the world.
For this story, let us turn first to a phenomenon about which there
is no serious controversy, the demographic transition. Throughout the
world, the premodern period is characterized by a balance between high
death rates and high birth rates in which the population remains more
or less constant. Then modernization brings better hygiene, nutrition,
and medicine, and death rates begin to fall. In the early phases of mod-
ernization, birth rates remain at their traditional levels, sustained by
deeply embedded cultural and social traditions that encourage big fam-
344
The National Context
The Demography of intelligence
345
ilies, and population grows swiftly. But culture and tradition eventually
give way to the attractions of smaller families and the practical fact that
when fewer children die, fewer children need to be born to achieve the
same eventual state of affairs. Intrinsic birth rates begin to decline, and
eventually the population reaches a slow- or no-growth state.I6'
The falling birth rate is a well known and widely studied feature of
the demographic transition. What is less well known, but seems to be
true among Western cultures that have passed through the demographic
transition, is that declines in lifetime fertility occur disproportionately
among educated women and women of higher social status (we will re-
fer to such women as "privileged"), just as the Victorians thought.'
Why? One reason is that privileged women lose their reproductive
advantage. In premodern times, privileged young women were better
nourished, better rested, and had better medical care than the unprivi-
leged. They married earlier and suffered fewer marital d i s r ~ ~ t i o n s . ~
The
net result was that, on average, they ended up with more surviving chil-
dren than did unprivileged women. As modernization proceeds, these
advantages narrow. Another reason is that modem societies provide
greater opportunities for privileged women to be something other than
full-time mothers. Marriage and reproduction are often deferred for ed-
ucation, for those women who have access to it. On the average, they
spend more of their reproductive years in school because they do well
in school, because their families support their schooling, or both. Neg-
ative correlations between fertility and educational status are likely to
be the result.
Even after the school years, motherhood imposes greater cost in lost
opportunities on a privileged woman than on an unprivileged one in
the contemporary W e ~ t . ~
A child complicates having a career, and may
make a career impossible. Ironically, even monetary costs work against
motherhood among privileged women. By our definition, privileged
women have more money than deprived women, but for the privileged
woman, a child entails expenses that can strain even a high income-
from child care for the infant to the cost of moving to an expensive sub-
urb that has a good school system when the child gets older. In planning
for a baby-and
privileged women tend to plan their babies carefully-
such costs are not considered optional but what must be spent to raise
a child properly. The cost of children is one more reason that privileged
women bear few children and postpone the ones they do bear.''
Meanwhile, children are likely to impose few opportunity costs on a
very poor woman; a "career" is not usually seen as a realistic option.
Children continue to have the same attractions that have always led
young women to find motherhood intrinsically rewarding. And for
women near the poverty line in most countries in the contemporary
West, a baby is either free or even ~rofitable, depending on the specific
terms of the welfare system in her country.
The Demographic Transition Elsewhere
The generalizations in the text may he stated with confidence about most
communities in the West. Elsewhere, there is still much to be learned.
Japan has passed through the demographic transition in that overall fer-
tility has dropped, but reproduction has not shifted as markedly toward the
lower end of the scale of privilege as in the Western democracies." The
reason may be that in Japan, as in other East Asian societies, social oblig-
ations that encourage childbearing among the educated may take prece-
dence over the individualistic motives that might otherwise compete with
parenthood. Similar considerations may apply to Islamic communities as
well, where the demographic transition has been weak. The Mormons of-
fer an American example of a weak demographic transition.'' A n account
of the patterns of reproduction must consider cultural, personal, religious,
and familial factors, as well as the more obvious social variahles, such as
the rising levels of education, women's employment, and public health."
Whatever the reasons and whatever the variations from community
to community, the reality of the demographic transition in the modern
West is indisputable and so, it would seem, is the implication. If repro-
ductive rates are correlated with income and educational levels, which
are themselves correlated with intelligence, people with lower intelli-
gence would presumably be outreproducing people with higher intelli-
gence and thereby producing a dysgenic effect.'l4' Can we find evidence
that dysgenesis is actually happening?
The early studies from the United States, England, France, and
Greece all seemed to confirm the reality of dysgenesis.I5 In the 1930s,
the eminent psychometrician Raymond Cattell was predicting a loss of
1.0 to 1.5 IQ points per decade,'%hile others were publishing estimated
losses of 2 to 4 IQ points per generation.'7 In 1951, another scholar
gloomily predicted that "if this trend continues for less than a century,
Intelligence and Demographic Trends
- Privileged women often delay or limit childbearing due to high perceived costs of raising children to elite standards.
- For women in poverty, children may impose fewer opportunity costs and can be viewed as intrinsically rewarding or financially neutral.
- Cultural and religious factors in Japan, Islamic communities, and Mormonism can override the typical Western demographic transition.
- The correlation between lower educational levels and higher reproductive rates has led to long-standing fears of a 'dysgenic effect' on national IQ.
- Early 20th-century psychometricians predicted significant declines in average intelligence based on the larger size of lower-IQ families.
- Later studies, such as those in Scotland, challenged these pessimistic forecasts by showing rising IQ scores despite family size trends.
In 1951, another scholar gloomily predicted that 'if this trend continues for less than a century, England and America will be well on the way to becoming nations of near half-wits.'
344
The National Context
The Demography of intelligence
345
ilies, and population grows swiftly. But culture and tradition eventually
give way to the attractions of smaller families and the practical fact that
when fewer children die, fewer children need to be born to achieve the
same eventual state of affairs. Intrinsic birth rates begin to decline, and
eventually the population reaches a slow- or no-growth state.I6'
The falling birth rate is a well known and widely studied feature of
the demographic transition. What is less well known, but seems to be
true among Western cultures that have passed through the demographic
transition, is that declines in lifetime fertility occur disproportionately
among educated women and women of higher social status (we will re-
fer to such women as "privileged"), just as the Victorians thought.'
Why? One reason is that privileged women lose their reproductive
advantage. In premodern times, privileged young women were better
nourished, better rested, and had better medical care than the unprivi-
leged. They married earlier and suffered fewer marital d i s r ~ ~ t i o n s . ~
The
net result was that, on average, they ended up with more surviving chil-
dren than did unprivileged women. As modernization proceeds, these
advantages narrow. Another reason is that modem societies provide
greater opportunities for privileged women to be something other than
full-time mothers. Marriage and reproduction are often deferred for ed-
ucation, for those women who have access to it. On the average, they
spend more of their reproductive years in school because they do well
in school, because their families support their schooling, or both. Neg-
ative correlations between fertility and educational status are likely to
be the result.
Even after the school years, motherhood imposes greater cost in lost
opportunities on a privileged woman than on an unprivileged one in
the contemporary W e ~ t . ~
A child complicates having a career, and may
make a career impossible. Ironically, even monetary costs work against
motherhood among privileged women. By our definition, privileged
women have more money than deprived women, but for the privileged
woman, a child entails expenses that can strain even a high income-
from child care for the infant to the cost of moving to an expensive sub-
urb that has a good school system when the child gets older. In planning
for a baby-and
privileged women tend to plan their babies carefully-
such costs are not considered optional but what must be spent to raise
a child properly. The cost of children is one more reason that privileged
women bear few children and postpone the ones they do bear.''
Meanwhile, children are likely to impose few opportunity costs on a
very poor woman; a "career" is not usually seen as a realistic option.
Children continue to have the same attractions that have always led
young women to find motherhood intrinsically rewarding. And for
women near the poverty line in most countries in the contemporary
West, a baby is either free or even ~rofitable, depending on the specific
terms of the welfare system in her country.
The Demographic Transition Elsewhere
The generalizations in the text may he stated with confidence about most
communities in the West. Elsewhere, there is still much to be learned.
Japan has passed through the demographic transition in that overall fer-
tility has dropped, but reproduction has not shifted as markedly toward the
lower end of the scale of privilege as in the Western democracies." The
reason may be that in Japan, as in other East Asian societies, social oblig-
ations that encourage childbearing among the educated may take prece-
dence over the individualistic motives that might otherwise compete with
parenthood. Similar considerations may apply to Islamic communities as
well, where the demographic transition has been weak. The Mormons of-
fer an American example of a weak demographic transition.'' A n account
of the patterns of reproduction must consider cultural, personal, religious,
and familial factors, as well as the more obvious social variahles, such as
the rising levels of education, women's employment, and public health."
Whatever the reasons and whatever the variations from community
to community, the reality of the demographic transition in the modern
West is indisputable and so, it would seem, is the implication. If repro-
ductive rates are correlated with income and educational levels, which
are themselves correlated with intelligence, people with lower intelli-
gence would presumably be outreproducing people with higher intelli-
gence and thereby producing a dysgenic effect.'l4' Can we find evidence
that dysgenesis is actually happening?
The early studies from the United States, England, France, and
Greece all seemed to confirm the reality of dysgenesis.I5 In the 1930s,
the eminent psychometrician Raymond Cattell was predicting a loss of
1.0 to 1.5 IQ points per decade,'%hile others were publishing estimated
losses of 2 to 4 IQ points per generation.'7 In 1951, another scholar
gloomily predicted that "if this trend continues for less than a century,
346
The National Context
The Demography of Intelligence
347
England and America will be well on the way to becoming nations of
near half-wits.'"' The main source of their pessimism was that the av-
erage IQ in large families was lower than in smaller famil~es.
Then came a period of optimism. Its harbinger was Frederick Osbom's
Eugenic Hypothesis, first stated in 1940, which foresaw a eugenic effect
arising from greater equality of social and economic goods and wider
availability of birth control."" In the late 1940s, data began to come in
that seemed to confirm this more sanguine view. Surveys in Scotland
found that Scottish school children were getting higher IQs, not lower
ones, despite the familiar negative relationship between family size and
1Q.l' Examining this and other new studies, Cattell reconsidered his po-
sition, concluding that past estimates might not have adequately in-
vestigated the relationship between intelligence and marriage rates,
which could have skewed their result^.^'
The new optimism got a boost in 1962 with the publication of "In-
telligence and Family Size: A Paradox Resolved," in which the authors,
using a large Minnesota sample, showed how it was possible to have both
a negative relationship between IQ and family size and, at the same time,
to find no dysgenic pattern for IQ."
The people who had no children,
and whose fertilities were thus omitted from the earlier statistics, the
authors suggested, came disproportionately from the lower IQ portion
of the population. From the early 1960s through 1980, a series of stud-
ies were published showing the same radically changed picture: slowly
rising or almost stable intelligence from generation to generation, de-
spite the lower average IQs in the larger families.lZ3'
The optimism proved to be ephemeral. As scholars examined new
data and reexamined the original analyses, they found that the opti-
mistic results turned on factors that were ill understood or Ignored at
the time the studies were published. First, comparisons between sue-
cessive generations tested with the same instrument (as in the Scottish
studies) were contaminated by the Flynn effect, whereby IQ scores
(though not necessarily cognitive ability itself) rise secularly over time
(see Chapter 13). Second, the samples used in the most-cited opti-
mistic studies published in the 1960s and 1970s were unrepresentative
of the national population. Most of them came from nearly all-white
populations of states in the upper Mid~est.'~
Two of the important stud-
ies published during this period were difficult to interpret because they
were based not only on whites hut on males (estimating fertility among
males poses numerous problems, and male fertility can be quite differ-
ent from female fertility) and on samples that were restricted to the up-
per half of the ability distribution, thereby missing what was going on
in the lower half.25
Apart from these technical problems, however, another feature of the
studies yielding optimistic results in the 1960s and 1970s limited their
applicability: They were based on the parents of the baby boomers, the
children born between 1945 and about 1960. In 1982, demographer
Daniel Vining, Jr., opened a new phase of the debate with the publica-
tion of his cautiously titled article, "On the Possibility of the Reemer-
gence of a Dysgenic Trend with Respect to Intelligence in American
Fertility differential^."'^ Vining presented data from the National Lon-
gitudinal Survey cohorts selected in 1966 and 1968 (the predecessors of
the much larger 1979 NLSY sample that we have used so extensively)
supporting his hypothesis that people with higher intelligence tend to
have fertil~ty rates as high as or higher than anyone else's in periods of
risingfertility but that in periods of falling birth rates, they tend to have
lower fertility rates. The American fertility rate had been falling with-
out a break since the late 1950s, as the baby boom subsided, and Vin-
ing suspected that dysgenesis was again underway.
Then two researchers from the University of Texas, Marian Van
Court and Frank Bean, finding no evidence for any respite during the
baby boom in a nationally representative sample, determined that the
childless members of the sample were not disproportionately low IQ at
all; on the contrary, they had slightly higher IQs than people with chil-
dren. Van Court and Bean concluded that the United States had been
experiencing an unbroken dysgenic effect since the early years of the
century.
2 7
Since then, all the news has been bad. Another study of the upper
Midwest looked at the fertilities in the mid-1980s of a nearly all-white
sample of people in Wisconsin who had been high school seniors as of
1957 and found a dysgenic effect corresponding to about 0.8 IQ point
per generation.*' A 1991 study based on a wholly different approach and
using the NLSY suggests that 0.8 per generation may be an underesti-
mate.29 This study estimated the shifting ethnic makeup of the popula-
tion, given the differing intrinsic birth rates of the various ethnic groups.
Since the main ethnic groups differ in average IQ, a shift in America's
ethnic makeup implies a change in the overall average IQ. Even disre-
garding the impact of differential fertility within ethnic groups, the
shifting ethnic makeup by itself would lower the average American IQ
The Rise and Fall of Dysgenic Optimism
- A 1962 study briefly reversed the belief in dysgenic trends by suggesting that childless individuals often came from lower IQ brackets, balancing out larger low-IQ families.
- This period of optimism was later debunked due to methodological flaws, including the 'Flynn effect' and the use of unrepresentative, nearly all-white Midwestern samples.
- Researchers discovered that previous studies often ignored the lower half of the ability distribution or relied on problematic male fertility data.
- Demographer Daniel Vining, Jr. proposed that high-IQ individuals only maintain high fertility during baby booms, with rates dropping significantly during periods of falling birth rates.
- Recent findings by Van Court and Bean suggest a continuous dysgenic effect in the United States since the early 20th century, with childless individuals actually possessing slightly higher IQs.
- Modern data from the mid-1980s indicates a measurable decline in average intelligence, estimated at approximately 0.8 IQ points per generation.
The optimism proved to be ephemeral. As scholars examined new data and reexamined the original analyses, they found that the optimistic results turned on factors that were ill understood or Ignored at the time the studies were published.
346
The National Context
The Demography of Intelligence
347
England and America will be well on the way to becoming nations of
near half-wits.'"' The main source of their pessimism was that the av-
erage IQ in large families was lower than in smaller famil~es.
Then came a period of optimism. Its harbinger was Frederick Osbom's
Eugenic Hypothesis, first stated in 1940, which foresaw a eugenic effect
arising from greater equality of social and economic goods and wider
availability of birth control."" In the late 1940s, data began to come in
that seemed to confirm this more sanguine view. Surveys in Scotland
found that Scottish school children were getting higher IQs, not lower
ones, despite the familiar negative relationship between family size and
1Q.l' Examining this and other new studies, Cattell reconsidered his po-
sition, concluding that past estimates might not have adequately in-
vestigated the relationship between intelligence and marriage rates,
which could have skewed their result^.^'
The new optimism got a boost in 1962 with the publication of "In-
telligence and Family Size: A Paradox Resolved," in which the authors,
using a large Minnesota sample, showed how it was possible to have both
a negative relationship between IQ and family size and, at the same time,
to find no dysgenic pattern for IQ."
The people who had no children,
and whose fertilities were thus omitted from the earlier statistics, the
authors suggested, came disproportionately from the lower IQ portion
of the population. From the early 1960s through 1980, a series of stud-
ies were published showing the same radically changed picture: slowly
rising or almost stable intelligence from generation to generation, de-
spite the lower average IQs in the larger families.lZ3'
The optimism proved to be ephemeral. As scholars examined new
data and reexamined the original analyses, they found that the opti-
mistic results turned on factors that were ill understood or Ignored at
the time the studies were published. First, comparisons between sue-
cessive generations tested with the same instrument (as in the Scottish
studies) were contaminated by the Flynn effect, whereby IQ scores
(though not necessarily cognitive ability itself) rise secularly over time
(see Chapter 13). Second, the samples used in the most-cited opti-
mistic studies published in the 1960s and 1970s were unrepresentative
of the national population. Most of them came from nearly all-white
populations of states in the upper Mid~est.'~
Two of the important stud-
ies published during this period were difficult to interpret because they
were based not only on whites hut on males (estimating fertility among
males poses numerous problems, and male fertility can be quite differ-
ent from female fertility) and on samples that were restricted to the up-
per half of the ability distribution, thereby missing what was going on
in the lower half.25
Apart from these technical problems, however, another feature of the
studies yielding optimistic results in the 1960s and 1970s limited their
applicability: They were based on the parents of the baby boomers, the
children born between 1945 and about 1960. In 1982, demographer
Daniel Vining, Jr., opened a new phase of the debate with the publica-
tion of his cautiously titled article, "On the Possibility of the Reemer-
gence of a Dysgenic Trend with Respect to Intelligence in American
Fertility differential^."'^ Vining presented data from the National Lon-
gitudinal Survey cohorts selected in 1966 and 1968 (the predecessors of
the much larger 1979 NLSY sample that we have used so extensively)
supporting his hypothesis that people with higher intelligence tend to
have fertil~ty rates as high as or higher than anyone else's in periods of
risingfertility but that in periods of falling birth rates, they tend to have
lower fertility rates. The American fertility rate had been falling with-
out a break since the late 1950s, as the baby boom subsided, and Vin-
ing suspected that dysgenesis was again underway.
Then two researchers from the University of Texas, Marian Van
Court and Frank Bean, finding no evidence for any respite during the
baby boom in a nationally representative sample, determined that the
childless members of the sample were not disproportionately low IQ at
all; on the contrary, they had slightly higher IQs than people with chil-
dren. Van Court and Bean concluded that the United States had been
experiencing an unbroken dysgenic effect since the early years of the
century.
2 7
Since then, all the news has been bad. Another study of the upper
Midwest looked at the fertilities in the mid-1980s of a nearly all-white
sample of people in Wisconsin who had been high school seniors as of
1957 and found a dysgenic effect corresponding to about 0.8 IQ point
per generation.*' A 1991 study based on a wholly different approach and
using the NLSY suggests that 0.8 per generation may be an underesti-
mate.29 This study estimated the shifting ethnic makeup of the popula-
tion, given the differing intrinsic birth rates of the various ethnic groups.
Since the main ethnic groups differ in average IQ, a shift in America's
ethnic makeup implies a change in the overall average IQ. Even disre-
garding the impact of differential fertility within ethnic groups, the
shifting ethnic makeup by itself would lower the average American IQ
The Demography of Intelligence
- Shifting ethnic demographics in America, driven by differing birth rates, are estimated to lower the national average IQ by at least 0.8 points per generation.
- The 'Flynn effect'—the observed rise in IQ scores over time—remains a point of contention regarding whether it represents true cognitive gains or mere test sophistication.
- Scholars generally agree that differential fertility is exerting downward pressure on cognitive ability, though the exact rate of decline is difficult to calibrate.
- Future cognitive trends are unpredictable due to variables like the expansion of career-oriented women, changes in family structures, and environmental factors.
- Current data shows a strong inverse correlation between a woman's educational attainment and the number of children she bears.
- The study identifies three primary factors currently influencing national IQ: fertility rates across IQ levels, the age of mothers at birth, and the cognitive ability of immigrants.
Foretelling the future about fertility is a hazardous business, and foretelling it in terms of IQ points per generation is more hazardous still.
346
The National Context
The Demography of Intelligence
347
England and America will be well on the way to becoming nations of
near half-wits.'"' The main source of their pessimism was that the av-
erage IQ in large families was lower than in smaller famil~es.
Then came a period of optimism. Its harbinger was Frederick Osbom's
Eugenic Hypothesis, first stated in 1940, which foresaw a eugenic effect
arising from greater equality of social and economic goods and wider
availability of birth control."" In the late 1940s, data began to come in
that seemed to confirm this more sanguine view. Surveys in Scotland
found that Scottish school children were getting higher IQs, not lower
ones, despite the familiar negative relationship between family size and
1Q.l' Examining this and other new studies, Cattell reconsidered his po-
sition, concluding that past estimates might not have adequately in-
vestigated the relationship between intelligence and marriage rates,
which could have skewed their result^.^'
The new optimism got a boost in 1962 with the publication of "In-
telligence and Family Size: A Paradox Resolved," in which the authors,
using a large Minnesota sample, showed how it was possible to have both
a negative relationship between IQ and family size and, at the same time,
to find no dysgenic pattern for IQ."
The people who had no children,
and whose fertilities were thus omitted from the earlier statistics, the
authors suggested, came disproportionately from the lower IQ portion
of the population. From the early 1960s through 1980, a series of stud-
ies were published showing the same radically changed picture: slowly
rising or almost stable intelligence from generation to generation, de-
spite the lower average IQs in the larger families.lZ3'
The optimism proved to be ephemeral. As scholars examined new
data and reexamined the original analyses, they found that the opti-
mistic results turned on factors that were ill understood or Ignored at
the time the studies were published. First, comparisons between sue-
cessive generations tested with the same instrument (as in the Scottish
studies) were contaminated by the Flynn effect, whereby IQ scores
(though not necessarily cognitive ability itself) rise secularly over time
(see Chapter 13). Second, the samples used in the most-cited opti-
mistic studies published in the 1960s and 1970s were unrepresentative
of the national population. Most of them came from nearly all-white
populations of states in the upper Mid~est.'~
Two of the important stud-
ies published during this period were difficult to interpret because they
were based not only on whites hut on males (estimating fertility among
males poses numerous problems, and male fertility can be quite differ-
ent from female fertility) and on samples that were restricted to the up-
per half of the ability distribution, thereby missing what was going on
in the lower half.25
Apart from these technical problems, however, another feature of the
studies yielding optimistic results in the 1960s and 1970s limited their
applicability: They were based on the parents of the baby boomers, the
children born between 1945 and about 1960. In 1982, demographer
Daniel Vining, Jr., opened a new phase of the debate with the publica-
tion of his cautiously titled article, "On the Possibility of the Reemer-
gence of a Dysgenic Trend with Respect to Intelligence in American
Fertility differential^."'^ Vining presented data from the National Lon-
gitudinal Survey cohorts selected in 1966 and 1968 (the predecessors of
the much larger 1979 NLSY sample that we have used so extensively)
supporting his hypothesis that people with higher intelligence tend to
have fertil~ty rates as high as or higher than anyone else's in periods of
risingfertility but that in periods of falling birth rates, they tend to have
lower fertility rates. The American fertility rate had been falling with-
out a break since the late 1950s, as the baby boom subsided, and Vin-
ing suspected that dysgenesis was again underway.
Then two researchers from the University of Texas, Marian Van
Court and Frank Bean, finding no evidence for any respite during the
baby boom in a nationally representative sample, determined that the
childless members of the sample were not disproportionately low IQ at
all; on the contrary, they had slightly higher IQs than people with chil-
dren. Van Court and Bean concluded that the United States had been
experiencing an unbroken dysgenic effect since the early years of the
century.
2 7
Since then, all the news has been bad. Another study of the upper
Midwest looked at the fertilities in the mid-1980s of a nearly all-white
sample of people in Wisconsin who had been high school seniors as of
1957 and found a dysgenic effect corresponding to about 0.8 IQ point
per generation.*' A 1991 study based on a wholly different approach and
using the NLSY suggests that 0.8 per generation may be an underesti-
mate.29 This study estimated the shifting ethnic makeup of the popula-
tion, given the differing intrinsic birth rates of the various ethnic groups.
Since the main ethnic groups differ in average IQ, a shift in America's
ethnic makeup implies a change in the overall average IQ. Even disre-
garding the impact of differential fertility within ethnic groups, the
shifting ethnic makeup by itself would lower the average American IQ
348
The National Context
The Demography of Intelligence
349
by 0.8 point per generation. Since the differential fertility within those
ethnic groups is lowering the average score for each group itself (as we
show later in the chapter), the 0.8 estimate is a lower bound of the over-
all population change.
To summarize, there is still uncertainty about whether the United
States experienced a brief eugenic interlude after World War 11. Van
Court and Bean conclude it has been all downhill since the early part
of the twentieth century; other researchers are ~nsure.''~'
There is also
uncertainty deriving from the Flynn effect. James Flynn has by now con-
vinced everyone that IQ scores rise over time, more or less everywhere
they are studied, but there remains little agreement about what that
means. For those who believe that the increase in scores represents au-
thentic gains in cognitive ability, the dysgenic effects may be largely
swamped by overall gains in the general environment. For those who
believe that the increases in scores are primarily due to increased test
sophistication without affecting g, the Flynn effect is merely a statisti-
cal complication that must be taken into account whenever comparing
IQ scores from different points in time or across different cultures.
But within the scholarly community, there is little doubt about dif-
ferential fertility or about whether it is exerting downward pressure on
cognitive ability. Further, the scholarly debate of the last fifty years has
progressed: The margin of error has narrowed. Scientific progress has
helped clarify the dysgenic effects without yet producing a precise cali-
bration of exactly how much the distribution of cognitive ability is de-
clining. This leads to our next topic, the current state of affairs.
DYSGENIC PRESSURES IN AMERICA IN THE EARLY 1990s
Foretelling the future about fertility is a hazardous business, and fore-
telling it in terms of IQ points per generation is more hazardous still.
The unknowns are too many. Will the ranks of career women continue
to expand? Or might our granddaughters lead a revival of the traditional
family? How will the environmental aspects of cognitive development
change (judging from what has happened to SAT scores, it could be for
worse as well as better)?'"' Will the Flynn effect continue? Even if it
does, what does it mean? No one has any idea how these countervail-
ing forces might play out.
For all these reasons, we do not put much confidence in any specific
predictions about what will happen to IQ scores decades from now. But
we can say with considerable confidence what is happening right now,
and the news is ~orrisome."~'
There are three major factors to take into
account: the number of children born to women at various IQ levels, the
age at which they have them, and the cognitive ability of immigrants.
Cognitive Ability and Number of Children
Demographers often take a lifetime fertility of about 2.1 births as the di-
viding line between having enough children to replenish the parent
generation and having too few.133' Bear that in mind while examining
the figure below showing the "completed fertilityn-all
the babies they
have ever had--of American women who had virtually completed their
childbearing years in 1992, broken down by their educational attain-
The higher the education, the fewer the babies
Average number of children ever born
to women ages 35-44 in 1992
3 -
I -
Less than High
Some
Associate Bachelor's MA or
high
school
college degree
degree
higher
school
Highest educational attainment
Source: Bachu 1993, Table 2.
ment. Overall, college graduates had 1.56 children, one child less than
the average for women without a high school diploma. Let us consider
the ratio of the two fertilities as a rough index of the degree to which
fertility is tipped one way or the other with regard to education. A ra-
tio greater than 1.0 says the tip is toward the lower educational levels.
The actual ratio is 1.71, which can be read as 71 percent more births
among high school dropouts than among women who graduated from
Education and Fertility Trends
- There is a significant inverse relationship between educational attainment and fertility rates, with high school dropouts having 71 percent more births than college graduates.
- Data suggests that the average IQ of American mothers is approximately 98, indicating a potential generational decline in cognitive ability of about 0.8 points.
- While the proportion of births to college-educated women rose slightly between 1982 and 1991, births to women without high school diplomas also increased.
- Differential fertility—where lower-IQ groups have more children—is exerting downward pressure on the national average IQ.
- The timing of childbirth also impacts population intelligence, as younger childbearing ages in lower-IQ groups accelerate dysgenic trends.
- Current NLSY data shows the mean IQ of mothers of young children is below 96, though this may rise as more educated women complete their families.
The conclusion in both cases is that differential fertility is exerting downward pressure on IQ.
348
The National Context
The Demography of Intelligence
349
by 0.8 point per generation. Since the differential fertility within those
ethnic groups is lowering the average score for each group itself (as we
show later in the chapter), the 0.8 estimate is a lower bound of the over-
all population change.
To summarize, there is still uncertainty about whether the United
States experienced a brief eugenic interlude after World War 11. Van
Court and Bean conclude it has been all downhill since the early part
of the twentieth century; other researchers are ~nsure.''~'
There is also
uncertainty deriving from the Flynn effect. James Flynn has by now con-
vinced everyone that IQ scores rise over time, more or less everywhere
they are studied, but there remains little agreement about what that
means. For those who believe that the increase in scores represents au-
thentic gains in cognitive ability, the dysgenic effects may be largely
swamped by overall gains in the general environment. For those who
believe that the increases in scores are primarily due to increased test
sophistication without affecting g, the Flynn effect is merely a statisti-
cal complication that must be taken into account whenever comparing
IQ scores from different points in time or across different cultures.
But within the scholarly community, there is little doubt about dif-
ferential fertility or about whether it is exerting downward pressure on
cognitive ability. Further, the scholarly debate of the last fifty years has
progressed: The margin of error has narrowed. Scientific progress has
helped clarify the dysgenic effects without yet producing a precise cali-
bration of exactly how much the distribution of cognitive ability is de-
clining. This leads to our next topic, the current state of affairs.
DYSGENIC PRESSURES IN AMERICA IN THE EARLY 1990s
Foretelling the future about fertility is a hazardous business, and fore-
telling it in terms of IQ points per generation is more hazardous still.
The unknowns are too many. Will the ranks of career women continue
to expand? Or might our granddaughters lead a revival of the traditional
family? How will the environmental aspects of cognitive development
change (judging from what has happened to SAT scores, it could be for
worse as well as better)?'"' Will the Flynn effect continue? Even if it
does, what does it mean? No one has any idea how these countervail-
ing forces might play out.
For all these reasons, we do not put much confidence in any specific
predictions about what will happen to IQ scores decades from now. But
we can say with considerable confidence what is happening right now,
and the news is ~orrisome."~'
There are three major factors to take into
account: the number of children born to women at various IQ levels, the
age at which they have them, and the cognitive ability of immigrants.
Cognitive Ability and Number of Children
Demographers often take a lifetime fertility of about 2.1 births as the di-
viding line between having enough children to replenish the parent
generation and having too few.133' Bear that in mind while examining
the figure below showing the "completed fertilityn-all
the babies they
have ever had--of American women who had virtually completed their
childbearing years in 1992, broken down by their educational attain-
The higher the education, the fewer the babies
Average number of children ever born
to women ages 35-44 in 1992
3 -
I -
Less than High
Some
Associate Bachelor's MA or
high
school
college degree
degree
higher
school
Highest educational attainment
Source: Bachu 1993, Table 2.
ment. Overall, college graduates had 1.56 children, one child less than
the average for women without a high school diploma. Let us consider
the ratio of the two fertilities as a rough index of the degree to which
fertility is tipped one way or the other with regard to education. A ra-
tio greater than 1.0 says the tip is toward the lower educational levels.
The actual ratio is 1.71, which can be read as 71 percent more births
among high school dropouts than among women who graduated from
350
The National Context
The Demoqaphy of Intelligence
35 1
college. At least since the 1950s, the ratio in the United States has been
between 1.5 and 1 .85.'j4]
What does this mean for IQ? We may compute an estimate by using
what we know about the mean IQs of the NLSY women who reached
various levels of education. Overall, these most recent data on Ameri-
can fertility (based on women ages 35 to 44 in 1992, when the survey
was taken) implies that the overall average IQ of American mothers was
a little less than 98.[j5I This is consistent with the analyses of American
fertility that suggest a decline of at least 0.8 point per generation.
This estimate is strengthened by using an altogether different slice of
the national picture, based on the birth statistics for virtually all babies
born in the United States in a given year, using the data compiled in
Vital Statistics by the National Center for Health Statistics (NCHS).
The most recent data available as we write, for 1991, provide modestly
good news: The proportions of children born to better-educated
women-and
therefore higher-IQ women, on average-have
been go-
ing up in the last decade. The proportion of babies born to women with
sixteen or more years of school (usually indicating a college degree or
better) rose from 4.8 percent in 1982 to 5.9 percent in 1991. The pro-
portion of babies horn to women with something more than a high
school diploma rose from 34.2 percent to 38.2 percent-small
changes
but in the right direction. The bad news is that the proportion of chil-
dren born to women with less than a high school education has risen
slightly over the last decade, from 22 percent to 24 percent, attributable
to an especially steep rise among white women since 1986.
In trying to use the educational information in Vital Statistics to esti-
mate the mean IQ of mothers in 1991, it is essential to anticipate the
eventual educational attainment of women who had babies while they
were still of school age. After doing so, as described in the note,'"' the es-
timated average IQ of women who gave birth in 1991 was 98. Consider-
ing that census data and the Vital Statistics data come from different
sources and take two different slices of the picture, the similarities are re-
markable. The conclusion in both cases is that differential fertility is ex-
erting downward pressure on IQ. At the end of the chapter, we show how
much impact changes of this size may have on American society.
What of evidence about dysgenesis in the NLSY itself? As of 1990,
the women of the NLSY, ages 25 to 33, still had many childbearing years
ahead. Presumably the new births will be weighted toward more highly
educated women with higher IQs. Therefore the current mean IQ of the
mothers of the NLSY children will rise. Currently, however, it stands at
less than 96.13"
Copitive Ability and Mother's Age
Pop~llation growth depends not just on the total number of children
women have hut on how old they are when they have them. The effect
is dysgenic when a low-IQ group has babies at a younger age than a high-
1Q group, even if the total number of children born in each group even-
tually is the same. Because this conclusion may not be intuitively
obvious, think of a simplified example. Suppose that over several gen-
erations Group A and Group R average exactly the same number of chil-
dren, but all the women in Group A always have their babies on their
twentieth birthclay and all the women in Group R have their children
on their thirtieth birthday. The women in group A will produce three
generations of children to every two produced by Group R. Something
like this has been happening in the United States, as women of lower
intell~gence have bah~es younger than women of higher intelligence.
The NLSY once again becomes the best source, because it provides age
and education along with IQ scores.
The oldest women in the NLSY had reached the age of 33 in 1990,
by which time the great majority of first births have taken pla~e.l'~l
We
can thus get a good idea of how age at first birth or average age at all
b~rths varies with cognitive ability, recognizing that a small minority of
women, mostly highly educated and at the upper portion of the IQ dis-
tribution, will eventually nudge those results
We will not try
to compensate for these missing data, because the brunt of our argument
is that the timing of births has a dysgenic effect. The biases in the data,
reported in the table below for women who were 30 or older, tend to
understate the true magnitude of age differences by IQ.'~"
The average age at first birth was a few months past the 23d birth-
day. This varied widely, however, by cognitive class. Combining all the
ethnic groups in the NLSY, women in the bottom 5 percent of intelli-
gence have their first baby more than seven years younger than women
in the top 5 percent. When these figures are computed for the average
age for all births (not just the first birth, as in the table), women in the
bottom 5 percent have their babies (or all of the ones they have had by
their early thirties) at an average of five and a half years earlier. This
gap will grow, not shrink, as the NLSY women complete their child-
The Demography of Intelligence
- The timing of childbearing significantly impacts population growth, as earlier births lead to more generations over the same period.
- Data from the NLSY indicates a seven-year gap in the age of first birth between women in the bottom and top 5 percent of the IQ distribution.
- The authors argue that this timing creates a 'dysgenic pressure,' where lower-IQ groups reproduce at a faster generational rate than higher-IQ groups.
- Fertility rates also vary by ethnicity, with black and Latino women historically showing higher average birth rates than white women.
- The text suggests that ethnic fertility differences largely stabilize or converge when educational levels are held constant.
- These demographic trends are presented as factors that could profoundly affect the future cognitive landscape of the United States.
A large and often ignored dysgenic pressure from differences in age at birth is at work.
350
The National Context
The Demoqaphy of Intelligence
35 1
college. At least since the 1950s, the ratio in the United States has been
between 1.5 and 1 .85.'j4]
What does this mean for IQ? We may compute an estimate by using
what we know about the mean IQs of the NLSY women who reached
various levels of education. Overall, these most recent data on Ameri-
can fertility (based on women ages 35 to 44 in 1992, when the survey
was taken) implies that the overall average IQ of American mothers was
a little less than 98.[j5I This is consistent with the analyses of American
fertility that suggest a decline of at least 0.8 point per generation.
This estimate is strengthened by using an altogether different slice of
the national picture, based on the birth statistics for virtually all babies
born in the United States in a given year, using the data compiled in
Vital Statistics by the National Center for Health Statistics (NCHS).
The most recent data available as we write, for 1991, provide modestly
good news: The proportions of children born to better-educated
women-and
therefore higher-IQ women, on average-have
been go-
ing up in the last decade. The proportion of babies born to women with
sixteen or more years of school (usually indicating a college degree or
better) rose from 4.8 percent in 1982 to 5.9 percent in 1991. The pro-
portion of babies horn to women with something more than a high
school diploma rose from 34.2 percent to 38.2 percent-small
changes
but in the right direction. The bad news is that the proportion of chil-
dren born to women with less than a high school education has risen
slightly over the last decade, from 22 percent to 24 percent, attributable
to an especially steep rise among white women since 1986.
In trying to use the educational information in Vital Statistics to esti-
mate the mean IQ of mothers in 1991, it is essential to anticipate the
eventual educational attainment of women who had babies while they
were still of school age. After doing so, as described in the note,'"' the es-
timated average IQ of women who gave birth in 1991 was 98. Consider-
ing that census data and the Vital Statistics data come from different
sources and take two different slices of the picture, the similarities are re-
markable. The conclusion in both cases is that differential fertility is ex-
erting downward pressure on IQ. At the end of the chapter, we show how
much impact changes of this size may have on American society.
What of evidence about dysgenesis in the NLSY itself? As of 1990,
the women of the NLSY, ages 25 to 33, still had many childbearing years
ahead. Presumably the new births will be weighted toward more highly
educated women with higher IQs. Therefore the current mean IQ of the
mothers of the NLSY children will rise. Currently, however, it stands at
less than 96.13"
Copitive Ability and Mother's Age
Pop~llation growth depends not just on the total number of children
women have hut on how old they are when they have them. The effect
is dysgenic when a low-IQ group has babies at a younger age than a high-
1Q group, even if the total number of children born in each group even-
tually is the same. Because this conclusion may not be intuitively
obvious, think of a simplified example. Suppose that over several gen-
erations Group A and Group R average exactly the same number of chil-
dren, but all the women in Group A always have their babies on their
twentieth birthclay and all the women in Group R have their children
on their thirtieth birthday. The women in group A will produce three
generations of children to every two produced by Group R. Something
like this has been happening in the United States, as women of lower
intell~gence have bah~es younger than women of higher intelligence.
The NLSY once again becomes the best source, because it provides age
and education along with IQ scores.
The oldest women in the NLSY had reached the age of 33 in 1990,
by which time the great majority of first births have taken pla~e.l'~l
We
can thus get a good idea of how age at first birth or average age at all
b~rths varies with cognitive ability, recognizing that a small minority of
women, mostly highly educated and at the upper portion of the IQ dis-
tribution, will eventually nudge those results
We will not try
to compensate for these missing data, because the brunt of our argument
is that the timing of births has a dysgenic effect. The biases in the data,
reported in the table below for women who were 30 or older, tend to
understate the true magnitude of age differences by IQ.'~"
The average age at first birth was a few months past the 23d birth-
day. This varied widely, however, by cognitive class. Combining all the
ethnic groups in the NLSY, women in the bottom 5 percent of intelli-
gence have their first baby more than seven years younger than women
in the top 5 percent. When these figures are computed for the average
age for all births (not just the first birth, as in the table), women in the
bottom 5 percent have their babies (or all of the ones they have had by
their early thirties) at an average of five and a half years earlier. This
gap will grow, not shrink, as the NLSY women complete their child-
The Demography of Intelligence
353
35 2
The National Context
Age at Childbearing
Cognitive Class
Mean Age at First Birth
I Very bright
27.2
I1 Bright
25.5
111 Normal
23.4
1V Dull
2 1 .O
V Very dull
19.8
Overall average
23.1
A
bearing years. Even using the current figures, women in the bottom 5
percent of the IQ distribution will have about five generations for every
four generations of the top 5 percent. A large and often ignored dys-
genic pressure from differences in age at birth is at work.
ETHNIC DIFFERENCES IN FERTILITY
Whatever the ethnic differences in cognitive ability are now, they may
change if ethnic groups differ in the extent to which their fertilities are
dysgenic or not. In the long run, the vector of demographic trends in
intelligence-converging or diverging across ethnic groups-could pro-
foundly affect America's future.
Fertility Rates by Ethnicity
In the 1992 analysis of American fertility using the Current Population
Survey (CPS) to which we referred for a national estimate of dysgene-
sis, women ages 35 to 44 had given birth to an average of 1.94 children:
1.89 for white women, 2.23 for black women, and 2.47 for Latino
women.41 Similar or larger ethnic differences have characterized fertil-
ity data for as long as such data have been available, and they have led
to a widespread belief that something in black and Latino culture leads
them to have larger numbers of children than whites do. We do not dis-
pute that culture can influence family size-the
Catholic tradition
among Latinos may foster high overall birth rates, for example-but
the
trends for the three groups are similar once the role of educational level
is held constant. Consider the figure below, based on the 1992 CPS study
of fertility, again using women in the 35 to 44 age group who have nearly
completed their childbearing years.
This figure represents almost total lifetime fertilities, and it tells a
simple story. In all three groups of women, more education means lower
Fertility falls as educational level rises in similar fashion for black,
white, and Latino women
Average number of children ever born
to women ages 35-44 in 1992
3-
\
Replacement
-
-
White
- - .
: -
Black
-- Latino
I -
Less than High
Some
Associate Bachelor's MA or
high
school
college degree
degree
higher
school
Highest educational attainment
Source: Rachu 1993, Table 2.
fertility. The two minority groups have higher overall fertility, but not
by much when education is taken into account. Given the known re-
lationship hetween IQ and educational attainment, fertility is also
falling with rising IQ for each ethnic group. Indeed, if one tries to look
into this relationship by assigning IQ equivalents based on the rela-
tionship of educational attainment and cognitive ability in the NLSY,
it appears that after equating for IQ, black women at a given IQ level
may have lower fertility rates than either white or Latino women.14"
May we then conclude that whites, blacks, and Latinos are on a
downhill slope together, neither converging nor diverging in IQ? No,
for two reasons. The first is that each ethnic group has different pro-
portions of women at different IQ levels. For example, black women
with IQs of 90 and below probably have a fertility rate no higher than
that of white women with the same IQs. But even so, only 15 percent
of white women in the NLSY fall in the 90-and-below range, compared
with 52 percent of black women. The relatively higher fertility rates of
women with low IQs therefore have a larger impact on the black pop-
ulation as a whole than on the white. Even if two ethnic groups have
Demography and Ethnic Fertility Gaps
- Fertility rates decline consistently across white, black, and Latino demographics as educational attainment and IQ levels increase.
- While minority groups show higher overall fertility, the rates are comparable to whites when adjusted for specific IQ and education levels.
- A significant demographic divergence exists because a much higher percentage of black and Latino women in the study fall into lower IQ cohorts compared to white women.
- Data from the NLSY indicates that 69% of children born to black women were from the sub-90 IQ group, compared to 19% for white women.
- The tendency of high-IQ, college-educated women to delay childbirth is most pronounced among whites, potentially widening the cognitive gap in future generations.
- The authors suggest that the large discrepancies in birth patterns make a further divergence in cognitive ability between ethnic groups highly probable.
On the face of it, the discrepancies are so dramatically large that the probability of further divergence seems substantial.
The Demography of Intelligence
353
35 2
The National Context
Age at Childbearing
Cognitive Class
Mean Age at First Birth
I Very bright
27.2
I1 Bright
25.5
111 Normal
23.4
1V Dull
2 1 .O
V Very dull
19.8
Overall average
23.1
A
bearing years. Even using the current figures, women in the bottom 5
percent of the IQ distribution will have about five generations for every
four generations of the top 5 percent. A large and often ignored dys-
genic pressure from differences in age at birth is at work.
ETHNIC DIFFERENCES IN FERTILITY
Whatever the ethnic differences in cognitive ability are now, they may
change if ethnic groups differ in the extent to which their fertilities are
dysgenic or not. In the long run, the vector of demographic trends in
intelligence-converging or diverging across ethnic groups-could pro-
foundly affect America's future.
Fertility Rates by Ethnicity
In the 1992 analysis of American fertility using the Current Population
Survey (CPS) to which we referred for a national estimate of dysgene-
sis, women ages 35 to 44 had given birth to an average of 1.94 children:
1.89 for white women, 2.23 for black women, and 2.47 for Latino
women.41 Similar or larger ethnic differences have characterized fertil-
ity data for as long as such data have been available, and they have led
to a widespread belief that something in black and Latino culture leads
them to have larger numbers of children than whites do. We do not dis-
pute that culture can influence family size-the
Catholic tradition
among Latinos may foster high overall birth rates, for example-but
the
trends for the three groups are similar once the role of educational level
is held constant. Consider the figure below, based on the 1992 CPS study
of fertility, again using women in the 35 to 44 age group who have nearly
completed their childbearing years.
This figure represents almost total lifetime fertilities, and it tells a
simple story. In all three groups of women, more education means lower
Fertility falls as educational level rises in similar fashion for black,
white, and Latino women
Average number of children ever born
to women ages 35-44 in 1992
3-
\
Replacement
-
-
White
- - .
: -
Black
-- Latino
I -
Less than High
Some
Associate Bachelor's MA or
high
school
college degree
degree
higher
school
Highest educational attainment
Source: Rachu 1993, Table 2.
fertility. The two minority groups have higher overall fertility, but not
by much when education is taken into account. Given the known re-
lationship hetween IQ and educational attainment, fertility is also
falling with rising IQ for each ethnic group. Indeed, if one tries to look
into this relationship by assigning IQ equivalents based on the rela-
tionship of educational attainment and cognitive ability in the NLSY,
it appears that after equating for IQ, black women at a given IQ level
may have lower fertility rates than either white or Latino women.14"
May we then conclude that whites, blacks, and Latinos are on a
downhill slope together, neither converging nor diverging in IQ? No,
for two reasons. The first is that each ethnic group has different pro-
portions of women at different IQ levels. For example, black women
with IQs of 90 and below probably have a fertility rate no higher than
that of white women with the same IQs. But even so, only 15 percent
of white women in the NLSY fall in the 90-and-below range, compared
with 52 percent of black women. The relatively higher fertility rates of
women with low IQs therefore have a larger impact on the black pop-
ulation as a whole than on the white. Even if two ethnic groups have
354
The National Context
The Demography of Intelligence
355
equal birth rates at a given IQ, one group may have a larger proportion
of its babies than the other at that IQ. This is illustrated by the next
table, which uses the NLSY to see what the next generation looks like
so far, when the women of the NLSY had reached the ages of 25 to 33.
The Next Generation So Far, for
Three Ethnic Groups in the NLSY
As of 1990, the Percentage of
Children Born to Women with:
1Qs Less
1Qs Higher
than 90
than 110
Whites
19
22
Blacks
69
2
Latinos
64
2
National population
3 3
15
Deciding whether the discrepancy between whites and both blacks
and Latinos implies an increasing gap in cognitive ability would require
extensive modeling involving many assumptions. On the face of it, the
discrepancies are so dramatically large that the probability of further
divergence seems substantial. Furthermore, insofar as whites have the
highest proportion of college-educated women who are delay~ng child-
birth, the gap between whites and the other minorities is more likely to
Delayed Childbearing Across Ethnic Groups
The ages of the women in the NLSY ranged from 25 to 33 as of our last
observation of them, meaning that more children remain to he horn, a dis-
proportionate number of whom will be born to women at the higher lev-
els of cognitive ability. This prevented us from using the NLSY to make
any estimate of the overall dysgenic effect. Rut the remaining childhear-
ing years are less of a problem when comparing differentials among ethnic
groups. The evidence suggests that better-educated women of all ethnic
groups postpone childbearing, to similar degree^.^' Based on this experi-
ence, the differentials as they exist among ethnic groups in the 25-33 age
cohort will probably remain about the same through the rest of the NLSY
women's childbearing years, though the means for each group will proba-
bly rise somewhat. Insofar as an artifact exists, it presumably acts to un-
derstate the eventual mean for whites, since whites have the largest
proportion of women with college and advanced degrees, and therefore
presumably the largest group of high-IQ women delaying childbirth.
increase than to diminish as the NLSY women complete their child-
bearing years.
Age at Birth by Ethnicity
The second potential source of divergence between ethnic groups lies
in the ages at which women are having their children. For NLSY moth-
ers, the average ages when they gave birth as of 1990 (when they were
ages 25 to 33) were 24.3 for whites, 23.2 for Latinos, and 22.3 for blacks.
Once again, these gaps may be expected to increase as the NLSY women
complete their childbearing years. If these age differentials persist over
time (and they have been found for as long as the statistics for the dif-
ferent groups have been available), they will produce increasing diver-
gence in the mean cognitive ability of successive generations for the
three groups. Evidence from other sources confirms the NLSY, finding
an increasing gap between white and nonwhite (primarily black)
women in when their reproductive lives begin, and also in their likeli-
hood of remaining ~hildless.~~
Mothers and Children in the NLSY
As we leave this topic, we may see how these various forces have played
out so far in the successive generations of the NLSY. The NLSY has
been testing the children of its original subjects, which should eventu-
ally provide one of the cleanest estimates of dysgenic trends within eth-
nic groups. The version of an IQ measure that the NLSY uses is the
Peabody Picture Vocabulary Test (PPVT), a highly reliable, g-loaded
test that does not require that the child be able to read. It was normed
in 1979 with a national sample of 4,200 children to a mean of 100 and
a standard deviation of 15.
If we take the NLSY results at face value, American intelligence is
plunging. The mean of the entire sample of NLSY children tested in
1986 and 1988 is only 92, more than half a standard deviation below
the national mean. We cannot take these results at face value, however.
The NLSY's sampling weights make the results "representative of the
children of a nationally representative sample of women" who were of
certain age ranges in the years the tests were given-which
is subtly but
importantly different from being a representative sample of American
children.45 But although it is not possible to interpret the overall chil-
dren's mean with any confidence, it is possible to compare the children
Ethnic Divergence and Birth Trends
- Ethnic groups show significant differences in the average age of childbirth, with white mothers generally being older than Latino and black mothers.
- These age differentials in reproduction are predicted to cause increasing divergence in mean cognitive ability across successive generations.
- Data from the NLSY indicates that the IQ gap between children of different ethnic groups is wider than the gap between their mothers.
- The Peabody Picture Vocabulary Test (PPVT) results for NLSY children showed an overall mean of 92, significantly lower than the national average of 100.
- The authors suggest that while current data is worrisome, more definitive conclusions on dysgenic trends will be possible as the NLSY cohort completes its childbearing years.
- The text identifies demographic pressures, including fertility rates and immigration, as primary drivers of potential national IQ shifts.
If we take the NLSY results at face value, American intelligence is plunging.
354
The National Context
The Demography of Intelligence
355
equal birth rates at a given IQ, one group may have a larger proportion
of its babies than the other at that IQ. This is illustrated by the next
table, which uses the NLSY to see what the next generation looks like
so far, when the women of the NLSY had reached the ages of 25 to 33.
The Next Generation So Far, for
Three Ethnic Groups in the NLSY
As of 1990, the Percentage of
Children Born to Women with:
1Qs Less
1Qs Higher
than 90
than 110
Whites
19
22
Blacks
69
2
Latinos
64
2
National population
3 3
15
Deciding whether the discrepancy between whites and both blacks
and Latinos implies an increasing gap in cognitive ability would require
extensive modeling involving many assumptions. On the face of it, the
discrepancies are so dramatically large that the probability of further
divergence seems substantial. Furthermore, insofar as whites have the
highest proportion of college-educated women who are delay~ng child-
birth, the gap between whites and the other minorities is more likely to
Delayed Childbearing Across Ethnic Groups
The ages of the women in the NLSY ranged from 25 to 33 as of our last
observation of them, meaning that more children remain to he horn, a dis-
proportionate number of whom will be born to women at the higher lev-
els of cognitive ability. This prevented us from using the NLSY to make
any estimate of the overall dysgenic effect. Rut the remaining childhear-
ing years are less of a problem when comparing differentials among ethnic
groups. The evidence suggests that better-educated women of all ethnic
groups postpone childbearing, to similar degree^.^' Based on this experi-
ence, the differentials as they exist among ethnic groups in the 25-33 age
cohort will probably remain about the same through the rest of the NLSY
women's childbearing years, though the means for each group will proba-
bly rise somewhat. Insofar as an artifact exists, it presumably acts to un-
derstate the eventual mean for whites, since whites have the largest
proportion of women with college and advanced degrees, and therefore
presumably the largest group of high-IQ women delaying childbirth.
increase than to diminish as the NLSY women complete their child-
bearing years.
Age at Birth by Ethnicity
The second potential source of divergence between ethnic groups lies
in the ages at which women are having their children. For NLSY moth-
ers, the average ages when they gave birth as of 1990 (when they were
ages 25 to 33) were 24.3 for whites, 23.2 for Latinos, and 22.3 for blacks.
Once again, these gaps may be expected to increase as the NLSY women
complete their childbearing years. If these age differentials persist over
time (and they have been found for as long as the statistics for the dif-
ferent groups have been available), they will produce increasing diver-
gence in the mean cognitive ability of successive generations for the
three groups. Evidence from other sources confirms the NLSY, finding
an increasing gap between white and nonwhite (primarily black)
women in when their reproductive lives begin, and also in their likeli-
hood of remaining ~hildless.~~
Mothers and Children in the NLSY
As we leave this topic, we may see how these various forces have played
out so far in the successive generations of the NLSY. The NLSY has
been testing the children of its original subjects, which should eventu-
ally provide one of the cleanest estimates of dysgenic trends within eth-
nic groups. The version of an IQ measure that the NLSY uses is the
Peabody Picture Vocabulary Test (PPVT), a highly reliable, g-loaded
test that does not require that the child be able to read. It was normed
in 1979 with a national sample of 4,200 children to a mean of 100 and
a standard deviation of 15.
If we take the NLSY results at face value, American intelligence is
plunging. The mean of the entire sample of NLSY children tested in
1986 and 1988 is only 92, more than half a standard deviation below
the national mean. We cannot take these results at face value, however.
The NLSY's sampling weights make the results "representative of the
children of a nationally representative sample of women" who were of
certain age ranges in the years the tests were given-which
is subtly but
importantly different from being a representative sample of American
children.45 But although it is not possible to interpret the overall chil-
dren's mean with any confidence, it is possible to compare the children
3 56
The National Conrext
of women in different ethnic groups. The results for chilcircn ;I( least six
years old and their mothers, shown in the tshle belc)w, indicate that thc.
gap between the children is larger than the gap sepnrilting the mothers,
Ethnic Differences in Test Scores in Two Generations
Gap Separating
Gap Separating
Ethnic
the Mothers
the Children
Comparison
in IQ Points
in IQ Points
White-black
13.2
17.5
White-Latino
12.2
14.1
by more than 4 points in thc case nt blacks and whites, by ;~lmost twu
points in the case of whites and Latinos. There :Ire technic:^! rcilsons 10
1461
hcdgc on any inore specific interpretation of these d i ~ r ; ~ . We nlay ; ~ t
least- say that the results point in ;I worrisome direction.
Pulling these differel~t views of thc situi~tion together, the d;lta revcbnl
demographic pressures for further ethnic divcrgencc in IQ. Wc will not
hazard a guess about the magnitude of ethnic divcrgencc or its spccd.
Within another decade, assuming that the NLSY continues its testing
program, guesses will not l7e necessary. W h e n I;lrgc numhcrs of the
NLSY women approach the end of their childbearing years and their
children have been tested after reaching a n age when IQ scorcs arc st;~-
ble, we not only will he able to answer whether and how much ethnic
groups diverged for that generation of Americans but he ahle to pin
down answcrs to many of the other qi~cstions about dysgenic effects nil-
tionwide.
IMMIGRATION
Immigration is a n even older American trip wire for impassioned de-
bate than differential fertility, and the disputes continue to the present
day.4q T h e reason is not hard to find: America has more people flowing
into it than any other country. Aboilt half of the world's migrants re-
settling in new countries are coming to Amcric;~ as we write.5" The pco.
ple already living here have alwaysviewed this influx of newcomers with
Regrcssion to the Mcan to the Rescue?
Those who dismiss thc i~npclrtnncc o f dysgcnic trcnds have ~nist;~ki~nly
I;~tched onto t l ~ c zc;~tistic;~l
ph~~nomenun
known as rcgrc,ssion to the mcan
;IS a ~uagic cure-:dl. The cditorii~l pi~gc o f the Nctcl York Titncs, no Icss, is on
record with an assurance to its readers tllat hrcause of regression to the
mean, each successive generation of children of hclow-ilverage 1Q wonlcn
will get closer to IIX ;Ivcl-;lge and thcrcforc black ;~ncl whitc scorcs will tend
t o convcrgc.'" Alas, it clc>esn1t work t h ; ~ t
wily. The results on the PI'VT pro-
vi~lc
;\ concrele illustr~~tion.
Suppow rrh;~t we rccalcul;~re rhc gap hetween t l i ~ a three ethnic groups in
~ w o
sllccessive gcnerlrtions, this tiruc expressing t h c ~ n in I orlns of standi~rd
~lcviations based on the noth hers' ilnd childrcns' c)wn st;~nd;rrd devii~tions,
IIC)I on thcir pl;~ce within tllc 1l;ltional J~stril>u~ion
(as in the preceding
t;~hle).
Regression to the Mean and Ethnic Differences
in Test Scores in Two Generations
Ethnic
Gap Separating
Gap Separating
Comparison
the Mothers
the Children
in SDs
in SDs
Wh~tt-black
1.17
1.17
Wh~tc-l.;~r~no
1.05
.93
(lalcul;lted in this wily i~ncl shown in the rnhlc ;above, thc fi;~li hctwecn
\vllilc% and 1,;ltino childre11 h;ls shrunk so~ncwhat cc>mparcti to thc gap
scy>;lr;tti~~g
tl~cir mothcrs. Thc g;\p bctwccn w l ~ i t ~
;lnJ hlack childrrn hils
at le;~st grown no larger."& Why can wcx ohtitin this result and still show ;I
growing gap in I(;!
points between the ethnic grvups! The answer is that
"me;lnV rcferre~l to in "regression to the mean" is thc ~x~pulution's
own melz11.
White childrcn ofdutl white wolncn will, on slaCragc, he closcr to the mean
for whites in their gc,t~er;~tion
than thcir mothers wcrc in their gcnercation.
A parnllcl st;lrement applies to hlack children of dull hlack women. Rut
this does not ncccss;~rily imply th;lt the I Q scores of hlack and whitc'
children must hc closer to each other than thcir rrtothers' IQ scures were.
It is a slippcry concept. Some pcvple find it is helpful t o rcrrlemlics rhar
regression to the mcan works both ways: If you stilrr with population of
clull children and then find the IQs of their parcnts, you will find that
rhc parents were closcr to the mean (on ;\vc.ragc) than their children.
Regression to the mcnn is ;I xti~tistic;~l
phenomenon, not ;I hiologicitl
one.
Regression and Immigration Trends
- The United States remains the primary destination for global migrants, receiving approximately half of the world's resettling population.
- Public debate over immigration is polarized between those who emphasize historical adaptability and those who fear social costs like crime and dependency.
- The statistical concept of 'regression to the mean' is often incorrectly cited as a biological guarantee that IQ gaps between groups will naturally vanish.
- Data on mothers and children shows that while individuals regress toward their own group's average, the gaps between ethnic groups can remain static.
- Regression to the mean is a mathematical phenomenon rather than a biological process, meaning it does not inherently force different population means to converge.
Regression to the mean is a statistical phenomenon, not a biological one.
3 56
The National Conrext
of women in different ethnic groups. The results for chilcircn ;I( least six
years old and their mothers, shown in the tshle belc)w, indicate that thc.
gap between the children is larger than the gap sepnrilting the mothers,
Ethnic Differences in Test Scores in Two Generations
Gap Separating
Gap Separating
Ethnic
the Mothers
the Children
Comparison
in IQ Points
in IQ Points
White-black
13.2
17.5
White-Latino
12.2
14.1
by more than 4 points in thc case nt blacks and whites, by ;~lmost twu
points in the case of whites and Latinos. There :Ire technic:^! rcilsons 10
1461
hcdgc on any inore specific interpretation of these d i ~ r ; ~ . We nlay ; ~ t
least- say that the results point in ;I worrisome direction.
Pulling these differel~t views of thc situi~tion together, the d;lta revcbnl
demographic pressures for further ethnic divcrgencc in IQ. Wc will not
hazard a guess about the magnitude of ethnic divcrgencc or its spccd.
Within another decade, assuming that the NLSY continues its testing
program, guesses will not l7e necessary. W h e n I;lrgc numhcrs of the
NLSY women approach the end of their childbearing years and their
children have been tested after reaching a n age when IQ scorcs arc st;~-
ble, we not only will he able to answer whether and how much ethnic
groups diverged for that generation of Americans but he ahle to pin
down answcrs to many of the other qi~cstions about dysgenic effects nil-
tionwide.
IMMIGRATION
Immigration is a n even older American trip wire for impassioned de-
bate than differential fertility, and the disputes continue to the present
day.4q T h e reason is not hard to find: America has more people flowing
into it than any other country. Aboilt half of the world's migrants re-
settling in new countries are coming to Amcric;~ as we write.5" The pco.
ple already living here have alwaysviewed this influx of newcomers with
Regrcssion to the Mcan to the Rescue?
Those who dismiss thc i~npclrtnncc o f dysgcnic trcnds have ~nist;~ki~nly
I;~tched onto t l ~ c zc;~tistic;~l
ph~~nomenun
known as rcgrc,ssion to the mcan
;IS a ~uagic cure-:dl. The cditorii~l pi~gc o f the Nctcl York Titncs, no Icss, is on
record with an assurance to its readers tllat hrcause of regression to the
mean, each successive generation of children of hclow-ilverage 1Q wonlcn
will get closer to IIX ;Ivcl-;lge and thcrcforc black ;~ncl whitc scorcs will tend
t o convcrgc.'" Alas, it clc>esn1t work t h ; ~ t
wily. The results on the PI'VT pro-
vi~lc
;\ concrele illustr~~tion.
Suppow rrh;~t we rccalcul;~re rhc gap hetween t l i ~ a three ethnic groups in
~ w o
sllccessive gcnerlrtions, this tiruc expressing t h c ~ n in I orlns of standi~rd
~lcviations based on the noth hers' ilnd childrcns' c)wn st;~nd;rrd devii~tions,
IIC)I on thcir pl;~ce within tllc 1l;ltional J~stril>u~ion
(as in the preceding
t;~hle).
Regression to the Mean and Ethnic Differences
in Test Scores in Two Generations
Ethnic
Gap Separating
Gap Separating
Comparison
the Mothers
the Children
in SDs
in SDs
Wh~tt-black
1.17
1.17
Wh~tc-l.;~r~no
1.05
.93
(lalcul;lted in this wily i~ncl shown in the rnhlc ;above, thc fi;~li hctwecn
\vllilc% and 1,;ltino childre11 h;ls shrunk so~ncwhat cc>mparcti to thc gap
scy>;lr;tti~~g
tl~cir mothcrs. Thc g;\p bctwccn w l ~ i t ~
;lnJ hlack childrrn hils
at le;~st grown no larger."& Why can wcx ohtitin this result and still show ;I
growing gap in I(;!
points between the ethnic grvups! The answer is that
"me;lnV rcferre~l to in "regression to the mean" is thc ~x~pulution's
own melz11.
White childrcn ofdutl white wolncn will, on slaCragc, he closcr to the mean
for whites in their gc,t~er;~tion
than thcir mothers wcrc in their gcnercation.
A parnllcl st;lrement applies to hlack children of dull hlack women. Rut
this does not ncccss;~rily imply th;lt the I Q scores of hlack and whitc'
children must hc closer to each other than thcir rrtothers' IQ scures were.
It is a slippcry concept. Some pcvple find it is helpful t o rcrrlemlics rhar
regression to the mcan works both ways: If you stilrr with population of
clull children and then find the IQs of their parcnts, you will find that
rhc parents were closcr to the mean (on ;\vc.ragc) than their children.
Regression to the mcnn is ;I xti~tistic;~l
phenomenon, not ;I hiologicitl
one.
3 58
The National Context
The Demography of lntelligence
359
complicated reactions ranging from pride to alarm. John Higham and
others have traced the crests and troughs of nativism and xenophobia,
often laced with open racism, in our hist01-y.~'
Recently the debate over immigration has intensified, as the large in-
flux of immigrants in the 1980s, legal and illegal, has reopened all the
old arguments. Those who favor open immigration policies point to the
adaptability of earlier immigrant populations and their contribution to
America's greatness, and remind us that the dire warnings of earlier anti-
immigrationists were usually unfounded.52 Anti-immigrationists instead
emphasize the concentration within some immigrant groups of people
who commit crimes, fail to work, drop out of school, and go on public
assistance. They see limits in the American capacity for assimilating
people from alien cultures and for finding productive work for them.?'
It seems apparent that there are costs and benefits to any immigra-
tion policy and that no extreme view, pro or con, is likely to be correct.
Beyond that truism, it is apparent that the normative "American" will
undergo at least as large a change in the twenty-first century as he has
since the original settlement. The nearly 100 percent of immigrants
from northern and western Europe in the original settlement gave way
to increasing fractions from Africa and from southern and eastern Eu-
rope throughout the nineteenth century, thence to a large majority from
Asia and Latin America today. America was remade several times over
by its immigrants before, and we trust the process will continue. By 2080,
according to a typical estimate, America's population will be less than
50 percent non-Latino white, 15 percent black, 25 percent Latino, and
over 10 percent Asian and other."41 Multiculturalism of some sort is cer-
tain. Whether it will be a functioning multiculturalism or an unravel-
ing one is the main question about immigration, and not one we can
answer.
Our first objective is simply to bring to people's attention that the
question is important. Legal immigration in the 1980s contributed 29
percent of the United States' net population increase, much more than
at any earlier period in the postwar era.1551
If illegal immigration could
be included, the figure would be significantly higher. Immigration does
indeed make a difference to the future of the national distribution of in-
telligence. It may not make as much difference as births in terms of raw
numbers, but there is also this consideration: Whereas policy can have
only long-term effects on the cognitive distribution of births, it can have
large immediate effects on the nature of the immigrant population.
There are few, if any, other domains where public policy could so di-
rectly mold the cognitive shape of things to come. Meanwhile, the na-
tion's political ground rules have yet to accept that the intelligence of
immigrants is a legitimate topic for policymakers to think about.
Ethnicity and IQ as They Apply to Immigration
In trying to estimate an envelope of what the effects on the cognitive
distribution might be, a useful first step is to assume that immigrants to
the United States have the mean IQ that has generally been found
among persons of that ethnic group, then apply those numbers to the
actual distribution of immigrants by ethnicity. Keeping in mind that we
are hoping to do no more than establish a range of possibilities, we will
begin by following Richard Lynn's computations based on a review of
the international data and assign means of 105 to East Asians, 91 to Pa-
cific populations, 84 to blacks, and 100 to whites5"e
assign 91 to Lati-
nos. We know of no data for Middle East or South Asian populations
that permit even a rough estimate. They and an unclassifiable "other"
component in the immigration statistics constitute about 11 percent of
immigrants and are omitted from the analysis. The ethnic ancestry of
legal immigrants in the 1980s breaks down as follows:'57'
Latino
41%
East and Southeast Asian
2 1 %
Non-Latino white
11%
Black
9%
Filipino
7%
Middle East, South Asian, other
11%
Applying the assigned IQ means to this breakdown, the mean IQ of
immigrants in the 1980s works out to about 95--essentially unchanged
from the 1960s and the 1970s (when the same procedure yields esti-
mates of 96 and 95 respectively). As the proportion of non-Latino
whites dropped from 46 percent of immigrants in the 1960s to 11 per-
cent in the 1990s, the percentage of East and Southeast Asians rose from
6 percent to 21 percent, two counterbalancing trends regarding IQ.
Modifying the estimates of ethnic IQs does not make much differ-
ence. Some would argue that the East Asian mean is too high. Suppose
we drop it to 100. Some would argue that the Latino mean is too low.
Suppose we increase it to 94. We could shift the black estimate up or
Immigration and Cognitive Demographics
- The ethnic composition of the United States is projected to shift significantly by 2080, with non-Latino whites becoming a minority of the population.
- Immigration accounted for nearly 30 percent of the U.S. population increase in the 1980s, representing a major lever for shaping national demographics.
- The authors argue that public policy can more directly and immediately influence the cognitive distribution of the nation through immigration rules than through birth rates.
- Using estimated mean IQ scores for different ethnic groups, the authors calculate that the average IQ of legal immigrants in the 1980s was approximately 95.
- The decline in white immigration has been statistically offset in these calculations by an increase in East and Southeast Asian immigration, keeping the estimated immigrant IQ mean stable since the 1960s.
- The text asserts that the intelligence of immigrants is a legitimate but currently ignored topic for national policymaking.
There are few, if any, other domains where public policy could so directly mold the cognitive shape of things to come.
3 58
The National Context
The Demography of lntelligence
359
complicated reactions ranging from pride to alarm. John Higham and
others have traced the crests and troughs of nativism and xenophobia,
often laced with open racism, in our hist01-y.~'
Recently the debate over immigration has intensified, as the large in-
flux of immigrants in the 1980s, legal and illegal, has reopened all the
old arguments. Those who favor open immigration policies point to the
adaptability of earlier immigrant populations and their contribution to
America's greatness, and remind us that the dire warnings of earlier anti-
immigrationists were usually unfounded.52 Anti-immigrationists instead
emphasize the concentration within some immigrant groups of people
who commit crimes, fail to work, drop out of school, and go on public
assistance. They see limits in the American capacity for assimilating
people from alien cultures and for finding productive work for them.?'
It seems apparent that there are costs and benefits to any immigra-
tion policy and that no extreme view, pro or con, is likely to be correct.
Beyond that truism, it is apparent that the normative "American" will
undergo at least as large a change in the twenty-first century as he has
since the original settlement. The nearly 100 percent of immigrants
from northern and western Europe in the original settlement gave way
to increasing fractions from Africa and from southern and eastern Eu-
rope throughout the nineteenth century, thence to a large majority from
Asia and Latin America today. America was remade several times over
by its immigrants before, and we trust the process will continue. By 2080,
according to a typical estimate, America's population will be less than
50 percent non-Latino white, 15 percent black, 25 percent Latino, and
over 10 percent Asian and other."41 Multiculturalism of some sort is cer-
tain. Whether it will be a functioning multiculturalism or an unravel-
ing one is the main question about immigration, and not one we can
answer.
Our first objective is simply to bring to people's attention that the
question is important. Legal immigration in the 1980s contributed 29
percent of the United States' net population increase, much more than
at any earlier period in the postwar era.1551
If illegal immigration could
be included, the figure would be significantly higher. Immigration does
indeed make a difference to the future of the national distribution of in-
telligence. It may not make as much difference as births in terms of raw
numbers, but there is also this consideration: Whereas policy can have
only long-term effects on the cognitive distribution of births, it can have
large immediate effects on the nature of the immigrant population.
There are few, if any, other domains where public policy could so di-
rectly mold the cognitive shape of things to come. Meanwhile, the na-
tion's political ground rules have yet to accept that the intelligence of
immigrants is a legitimate topic for policymakers to think about.
Ethnicity and IQ as They Apply to Immigration
In trying to estimate an envelope of what the effects on the cognitive
distribution might be, a useful first step is to assume that immigrants to
the United States have the mean IQ that has generally been found
among persons of that ethnic group, then apply those numbers to the
actual distribution of immigrants by ethnicity. Keeping in mind that we
are hoping to do no more than establish a range of possibilities, we will
begin by following Richard Lynn's computations based on a review of
the international data and assign means of 105 to East Asians, 91 to Pa-
cific populations, 84 to blacks, and 100 to whites5"e
assign 91 to Lati-
nos. We know of no data for Middle East or South Asian populations
that permit even a rough estimate. They and an unclassifiable "other"
component in the immigration statistics constitute about 11 percent of
immigrants and are omitted from the analysis. The ethnic ancestry of
legal immigrants in the 1980s breaks down as follows:'57'
Latino
41%
East and Southeast Asian
2 1 %
Non-Latino white
11%
Black
9%
Filipino
7%
Middle East, South Asian, other
11%
Applying the assigned IQ means to this breakdown, the mean IQ of
immigrants in the 1980s works out to about 95--essentially unchanged
from the 1960s and the 1970s (when the same procedure yields esti-
mates of 96 and 95 respectively). As the proportion of non-Latino
whites dropped from 46 percent of immigrants in the 1960s to 11 per-
cent in the 1990s, the percentage of East and Southeast Asians rose from
6 percent to 21 percent, two counterbalancing trends regarding IQ.
Modifying the estimates of ethnic IQs does not make much differ-
ence. Some would argue that the East Asian mean is too high. Suppose
we drop it to 100. Some would argue that the Latino mean is too low.
Suppose we increase it to 94. We could shift the black estimate up or
360
The National Context
The Demography of Intelligence
361
down by large amounts without affecting the overall mean very far. Fid-
dling with the numbers moves the overall estimated mean by only about
a point or two for defensible sets of values. The basic statement is that
about 57 percent of legal immigrants in the 1980s came from ethnic
groups that have scores significantly below the white average, and in
consequence the 1Q mean for all immigrants is likely to be below 100.
How about the idea that people who are willing to pack up and move
to a strange place in search of a better life are self-selected for desirable
qualities such as initiative, determination, energy, and perhaps intelli-
gence as well? Given this plausible expectation, why not assume that
the mean for immigrants is significantly higher than average for their
ethnic groups? Here, the NLSY provides a snapshot of the effects on the
distribution of intelligence of the people coming across our borders, in-
sofar as we may compare the IQs of those who were born abroad with
those who were born in the United States.
Overall, the IQ of NLSY members who were born abroad was .4 stan-
dard deviation lower than the mean of those who were born in the
United States, putting the average immigrant for this cohort at about
the 34th centile of the native-born population. A breakdown of these
resullts by ethnic groups reveals that different groups are making differ-
ent contributions to this result. White immigrants have scores that put
them a bit above the mean for the native-born American population
(though somewhat lower than the mean for native-born American
whites). Foreign-born blacks score about five IQ points higher than na-
tive-born blacks, for reasons we do not know. Latino immigrants have
mean scores more than seven points lower than native-born Latinos and
more than a standard deviation below the overall national native-born
mean. The NLSY gives no information on the large immigrant popula-
tion from the countries of East Asia and Vietnam, who might be signif-
icantly boosting the immigrant mean.
Even considered simply as cognitive test scores, these results must be
interpreted very cautiously. Immigrants typically earn higher scores on
tests as they become acculturated, even on tests designed to be "culture
fa~r."~%e extremely large gap between native-born and foreign-born
Latino students seems likely to reflect additional effects of poor English.
We do not know if this rise with acculturation is enough to counter-
balance the overall .4 standard deviation disadvantage of a sample born
elsewhere. Nonetheless, keeping all of these qualifications in mind, the
kernel of evidence that must also be acknowledged is that Latino and
black immigrants are, at least in the short run, putting some downward
pressure on the distribution of intelligence.
Self-selection Past and Present
Many readers will find these results counterintuitive-the
concept of
the high-achieving immigrant is deeply ingrained in Americans' view
of our country-but
a few moments reflection, plus some additional
data, may make the results more under~tandable.'~~'
Think hack to the immigrant at the turn of the century. America was
the Land of Opportunity-hut
that was all. There were no guarantees,
no safety nets. One way or another, an immigrant had to make it on his
own. Add to that the wrench of tearing himself and family away from a
place where his people might have lived for centuries, the terrors of hav-
ing to learn a new language and culture, often the prospect of working
at jobs he had never tried before, a dozen other reasons for apprehen-
sion, and the United States had going for it a crackerjack self-selection
mechanism for attracting immigrants who were brave, hard-working,
imaginative, self-starting-and
probably smart. Immigration can still
select for those qualities, but it does not have to. Someone who comes
here because his cousin offers him a job, a free airplane ticket, and a
place to stay is not necessarily self-selected for those qualities. O n the
contrary, immigrating to America can be for that person a much easier
option than staying where he is.
Economists have made considerable progress in understanding how
the different types of immigration (and all the ones in between) have
played out in practice. To begin with, it has been demonstrated beyond
much doubt that immigrants as a whole have more steeply rising earn-
ings than American natives of equal age and measured skills and that,
after a relatively short adaptation period of ten to fifteen years, immi-
grants of equal age and education earn as much as nativeSam Here is em-
pirical support for the proposition that immigrants taken as a whole are
indeed self-selected for qualities that lead to economic success, and one
might expect cognitive ability to be among them.
But the experience of different immigrants at different times has var-
ied drastically. Economist George Aorjas has systematized the conditions
under which immigrants will be self-selected from the upper and lower
tails of the ability distribution. Suppose, he says, that you are living in
a foreign country, considering whether to emigrate to America. Pre-
sumably a major consideration is your potential income in the United
Immigration and Cognitive Distributions
- Data from the NLSY suggests that the average IQ of immigrants in the 1980s was approximately 0.4 standard deviations lower than that of native-born Americans.
- The cognitive profiles of immigrants vary significantly by ethnicity, with white and black immigrants scoring higher than their native-born counterparts, while Latino immigrants score lower.
- Test scores for immigrants may be suppressed by language barriers and lack of acculturation, though it is unclear if these factors fully account for the observed gap.
- The historical 'self-selection' mechanism that attracted high-initiative immigrants may be weakening due to modern support networks and easier travel.
- The text argues that current immigration patterns are exerting a downward pressure on the national distribution of intelligence scores.
- The absence of data on East Asian and Vietnamese immigrants in the NLSY sample represents a significant gap in the overall statistical picture.
The United States had going for it a crackerjack self-selection mechanism for attracting immigrants who were brave, hard-working, imaginative, self-starting—and probably smart.
360
The National Context
The Demography of Intelligence
361
down by large amounts without affecting the overall mean very far. Fid-
dling with the numbers moves the overall estimated mean by only about
a point or two for defensible sets of values. The basic statement is that
about 57 percent of legal immigrants in the 1980s came from ethnic
groups that have scores significantly below the white average, and in
consequence the 1Q mean for all immigrants is likely to be below 100.
How about the idea that people who are willing to pack up and move
to a strange place in search of a better life are self-selected for desirable
qualities such as initiative, determination, energy, and perhaps intelli-
gence as well? Given this plausible expectation, why not assume that
the mean for immigrants is significantly higher than average for their
ethnic groups? Here, the NLSY provides a snapshot of the effects on the
distribution of intelligence of the people coming across our borders, in-
sofar as we may compare the IQs of those who were born abroad with
those who were born in the United States.
Overall, the IQ of NLSY members who were born abroad was .4 stan-
dard deviation lower than the mean of those who were born in the
United States, putting the average immigrant for this cohort at about
the 34th centile of the native-born population. A breakdown of these
resullts by ethnic groups reveals that different groups are making differ-
ent contributions to this result. White immigrants have scores that put
them a bit above the mean for the native-born American population
(though somewhat lower than the mean for native-born American
whites). Foreign-born blacks score about five IQ points higher than na-
tive-born blacks, for reasons we do not know. Latino immigrants have
mean scores more than seven points lower than native-born Latinos and
more than a standard deviation below the overall national native-born
mean. The NLSY gives no information on the large immigrant popula-
tion from the countries of East Asia and Vietnam, who might be signif-
icantly boosting the immigrant mean.
Even considered simply as cognitive test scores, these results must be
interpreted very cautiously. Immigrants typically earn higher scores on
tests as they become acculturated, even on tests designed to be "culture
fa~r."~%e extremely large gap between native-born and foreign-born
Latino students seems likely to reflect additional effects of poor English.
We do not know if this rise with acculturation is enough to counter-
balance the overall .4 standard deviation disadvantage of a sample born
elsewhere. Nonetheless, keeping all of these qualifications in mind, the
kernel of evidence that must also be acknowledged is that Latino and
black immigrants are, at least in the short run, putting some downward
pressure on the distribution of intelligence.
Self-selection Past and Present
Many readers will find these results counterintuitive-the
concept of
the high-achieving immigrant is deeply ingrained in Americans' view
of our country-but
a few moments reflection, plus some additional
data, may make the results more under~tandable.'~~'
Think hack to the immigrant at the turn of the century. America was
the Land of Opportunity-hut
that was all. There were no guarantees,
no safety nets. One way or another, an immigrant had to make it on his
own. Add to that the wrench of tearing himself and family away from a
place where his people might have lived for centuries, the terrors of hav-
ing to learn a new language and culture, often the prospect of working
at jobs he had never tried before, a dozen other reasons for apprehen-
sion, and the United States had going for it a crackerjack self-selection
mechanism for attracting immigrants who were brave, hard-working,
imaginative, self-starting-and
probably smart. Immigration can still
select for those qualities, but it does not have to. Someone who comes
here because his cousin offers him a job, a free airplane ticket, and a
place to stay is not necessarily self-selected for those qualities. O n the
contrary, immigrating to America can be for that person a much easier
option than staying where he is.
Economists have made considerable progress in understanding how
the different types of immigration (and all the ones in between) have
played out in practice. To begin with, it has been demonstrated beyond
much doubt that immigrants as a whole have more steeply rising earn-
ings than American natives of equal age and measured skills and that,
after a relatively short adaptation period of ten to fifteen years, immi-
grants of equal age and education earn as much as nativeSam Here is em-
pirical support for the proposition that immigrants taken as a whole are
indeed self-selected for qualities that lead to economic success, and one
might expect cognitive ability to be among them.
But the experience of different immigrants at different times has var-
ied drastically. Economist George Aorjas has systematized the conditions
under which immigrants will be self-selected from the upper and lower
tails of the ability distribution. Suppose, he says, that you are living in
a foreign country, considering whether to emigrate to America. Pre-
sumably a major consideration is your potential income in the United
The Economics of Immigration Selection
- Immigrants generally exhibit more steeply rising earnings than native-born Americans, often reaching parity within ten to fifteen years.
- Economist George Borjas suggests that immigration is a self-selection process based on how different countries reward or protect specific ability levels.
- High-ability individuals are drawn to the U.S. from countries with high income equality and extensive welfare states where their talents may be underrewarded.
- Low-ability individuals may be drawn to the U.S. from countries with high inequality if they perceive better labor market protections or welfare benefits.
- Census data from 1970 and 1980 indicates a decline in the earnings potential of certain immigrant groups, particularly from Latin American nations.
- The shift in immigrant profiles may be linked to the expansion of the American welfare state during the 1960s and 1970s.
It makes sense for high-ability people to emigrate when they can reasonably think that they are being underrewarded in their home country, relative to their ability, and that the United States rewards the same level of ability more generously.
360
The National Context
The Demography of Intelligence
361
down by large amounts without affecting the overall mean very far. Fid-
dling with the numbers moves the overall estimated mean by only about
a point or two for defensible sets of values. The basic statement is that
about 57 percent of legal immigrants in the 1980s came from ethnic
groups that have scores significantly below the white average, and in
consequence the 1Q mean for all immigrants is likely to be below 100.
How about the idea that people who are willing to pack up and move
to a strange place in search of a better life are self-selected for desirable
qualities such as initiative, determination, energy, and perhaps intelli-
gence as well? Given this plausible expectation, why not assume that
the mean for immigrants is significantly higher than average for their
ethnic groups? Here, the NLSY provides a snapshot of the effects on the
distribution of intelligence of the people coming across our borders, in-
sofar as we may compare the IQs of those who were born abroad with
those who were born in the United States.
Overall, the IQ of NLSY members who were born abroad was .4 stan-
dard deviation lower than the mean of those who were born in the
United States, putting the average immigrant for this cohort at about
the 34th centile of the native-born population. A breakdown of these
resullts by ethnic groups reveals that different groups are making differ-
ent contributions to this result. White immigrants have scores that put
them a bit above the mean for the native-born American population
(though somewhat lower than the mean for native-born American
whites). Foreign-born blacks score about five IQ points higher than na-
tive-born blacks, for reasons we do not know. Latino immigrants have
mean scores more than seven points lower than native-born Latinos and
more than a standard deviation below the overall national native-born
mean. The NLSY gives no information on the large immigrant popula-
tion from the countries of East Asia and Vietnam, who might be signif-
icantly boosting the immigrant mean.
Even considered simply as cognitive test scores, these results must be
interpreted very cautiously. Immigrants typically earn higher scores on
tests as they become acculturated, even on tests designed to be "culture
fa~r."~%e extremely large gap between native-born and foreign-born
Latino students seems likely to reflect additional effects of poor English.
We do not know if this rise with acculturation is enough to counter-
balance the overall .4 standard deviation disadvantage of a sample born
elsewhere. Nonetheless, keeping all of these qualifications in mind, the
kernel of evidence that must also be acknowledged is that Latino and
black immigrants are, at least in the short run, putting some downward
pressure on the distribution of intelligence.
Self-selection Past and Present
Many readers will find these results counterintuitive-the
concept of
the high-achieving immigrant is deeply ingrained in Americans' view
of our country-but
a few moments reflection, plus some additional
data, may make the results more under~tandable.'~~'
Think hack to the immigrant at the turn of the century. America was
the Land of Opportunity-hut
that was all. There were no guarantees,
no safety nets. One way or another, an immigrant had to make it on his
own. Add to that the wrench of tearing himself and family away from a
place where his people might have lived for centuries, the terrors of hav-
ing to learn a new language and culture, often the prospect of working
at jobs he had never tried before, a dozen other reasons for apprehen-
sion, and the United States had going for it a crackerjack self-selection
mechanism for attracting immigrants who were brave, hard-working,
imaginative, self-starting-and
probably smart. Immigration can still
select for those qualities, but it does not have to. Someone who comes
here because his cousin offers him a job, a free airplane ticket, and a
place to stay is not necessarily self-selected for those qualities. O n the
contrary, immigrating to America can be for that person a much easier
option than staying where he is.
Economists have made considerable progress in understanding how
the different types of immigration (and all the ones in between) have
played out in practice. To begin with, it has been demonstrated beyond
much doubt that immigrants as a whole have more steeply rising earn-
ings than American natives of equal age and measured skills and that,
after a relatively short adaptation period of ten to fifteen years, immi-
grants of equal age and education earn as much as nativeSam Here is em-
pirical support for the proposition that immigrants taken as a whole are
indeed self-selected for qualities that lead to economic success, and one
might expect cognitive ability to be among them.
But the experience of different immigrants at different times has var-
ied drastically. Economist George Aorjas has systematized the conditions
under which immigrants will be self-selected from the upper and lower
tails of the ability distribution. Suppose, he says, that you are living in
a foreign country, considering whether to emigrate to America. Pre-
sumably a major consideration is your potential income in the United
362
The Nanonal Context
Tlw Demography of Intelligence
363
States versus your income if you stay put. Borjas proposes that this cal-
culation interacts with a person's earning potential. It makes sense for
high-ability people to emigrate when they can reasonably think that
they are being underrewarded in their home country, relative to their
ability, and that the United States rewards the same level of ability more
generously. It makes sense for low-ability people to emigrate when they
can reasonably think that the United States not only pays better for the
same work but protects them against poor labor market outcomes (in
comparison to their birth country) with welfare payments and other en-
titlement~.~'
In other words, the United States may be expected to draw
high-ability workers from countries that have more extensive welfare
states and less income inequality than the United States (such as West-
em Europe), and will draw low-ability workers from countries that have
less extensive welfare states and higher income inequality (such as the
poorer countries of the Third World).
Borjas used census data from 1970 and 1980 to examine the experi-
ence of immigrants from forty-one countries. In his analysis, he holds
constant the individual immigrant's schooling, age, marital status,
health, and the metropolitan area where the immigrant settled. By hold-
ing completed schooling constant, Borjas also factored out some of the
influence of cognitive ability. But the educational systems in the non-
European countries of origin (where we will focus our attention) are
much less efficient at identifying talent than the American educational
system; many bright immigrants have little formal education. We may
think of the unmeasured residual that Borjas did not hold constant as a
cluster of personal and cultural qualities, among which is some role for
cognitive ability. With this in mind, the Borjas data reveal two impor-
tant findings.
In the 1960s and 1970s, America became much more of a welfare
state. Consistent with that, the eamings potential of the Latino immi-
grant group fell substantially from 1955 through 1980. Among the non-
European countries, three of the four steepest declines in earnings
potential were among immigrant groups from Colombia, the Domini-
can Republic, and Mexico, all large contributors to the Latin American
immigrant population. Many of the other countries were not included
in Borjas's forty-one countries, so we do not know whether they followed
the same pattern. Among the Latin American and Latino-Caribbean
nations, only the immigrant groups from Cuba, Brazil, and Panama had
improving potential by Borjas's measures. The 1980 Mexican wave of
immigrants had an earnings potential about 15 percent lower than the
wave that arrived in 1955. For the Dominican Republic and Colombia,
the earnings potential of the 1980 wave was more than 30 percent lower
than those who came in 1955, a decline that remains after holding ed-
ucation, marital status, age, and location constant.62
Similarly, the success of the early waves of West Indian blacks seems
unlikely to repeat itself. In his book Ethnic America, Thomas Sowell de-
scr~bed the successes of West Indian black immigrants, starting from
early in the twentieth century, noting among other things that, by 1969,
second-generation West Indian blacks had a higher mean income than
whites.h3 His account has since become widely cited as evidence for
everything from the inherent equality of black and white earning abil-
ity to the merits of unrestricted immigration. The Borjas data include
three of the major contributors of black immigrants from that region:
Jamaica, Haiti, and Trinidadpobago. The earnings potential of the im-
migrant cohorts from these countries in 1970 ranged from 3 1 to 34 per-
cent less than American natives (after holding education, marital status,
age, and location constant).64 In 1980, the eamings potential from the
most recent immigrant waves from these three countries ranged from
26 to 52 percent less than American natives. Immigrants from all three
countries are on an extremely slow route to income equality, with Ja-
maicans and Haitians lagging behind everyone except the lowest-rank-
ing Latin American countries. Borjas's study did not include immigrants
from any countries in sub-Saharan Africa.
The results for European immigrants were also consistent with the
theory. Borjas's overall appraisal of the data is worth quoting in full:
The empirical analysis of the eamings of immigrants from 4 1 differ-
ent countries using the 1970 and 1980 censuses shows that there are
strong country-specific fixed effects in the (labor market) quality of
foreign-born persons. In particular, persons from Western European
countries do quite well in the United States, and their cohorts have
exhibited a general increase in earnings (relative to their measured
skills) over the postwar period. O n the other hand, persons from less
developed countries do not perform well in the U.S. lahor market and
their cohorts have exhibited a general &crease in earnings (relative
to their measured skills) over the postwar periodah5
Shifting Immigrant Earnings Potential
- Recent immigrant cohorts from the Dominican Republic and Colombia show a 30 percent lower earnings potential compared to those who arrived in 1955.
- The historical economic success of West Indian black immigrants, once cited as a model of upward mobility, is not being replicated by more recent waves.
- Data suggests a widening gap in labor market quality between immigrants from Western European countries and those from less developed nations.
- The author argues that higher fertility among less intelligent citizens combined with lower-skilled immigration creates 'dysgenic pressure' on national cognitive capital.
- Statistical estimates suggest a potential decline in the national average IQ of one to two points per generation due to these demographic shifts.
- The text acknowledges a tension between statistical generalizations about immigrant groups and the visible energy and ability of individual immigrants in daily life.
The observations of everyday life and the statistical generalizations we have just presented can both be true at the same time, however.
362
The Nanonal Context
Tlw Demography of Intelligence
363
States versus your income if you stay put. Borjas proposes that this cal-
culation interacts with a person's earning potential. It makes sense for
high-ability people to emigrate when they can reasonably think that
they are being underrewarded in their home country, relative to their
ability, and that the United States rewards the same level of ability more
generously. It makes sense for low-ability people to emigrate when they
can reasonably think that the United States not only pays better for the
same work but protects them against poor labor market outcomes (in
comparison to their birth country) with welfare payments and other en-
titlement~.~'
In other words, the United States may be expected to draw
high-ability workers from countries that have more extensive welfare
states and less income inequality than the United States (such as West-
em Europe), and will draw low-ability workers from countries that have
less extensive welfare states and higher income inequality (such as the
poorer countries of the Third World).
Borjas used census data from 1970 and 1980 to examine the experi-
ence of immigrants from forty-one countries. In his analysis, he holds
constant the individual immigrant's schooling, age, marital status,
health, and the metropolitan area where the immigrant settled. By hold-
ing completed schooling constant, Borjas also factored out some of the
influence of cognitive ability. But the educational systems in the non-
European countries of origin (where we will focus our attention) are
much less efficient at identifying talent than the American educational
system; many bright immigrants have little formal education. We may
think of the unmeasured residual that Borjas did not hold constant as a
cluster of personal and cultural qualities, among which is some role for
cognitive ability. With this in mind, the Borjas data reveal two impor-
tant findings.
In the 1960s and 1970s, America became much more of a welfare
state. Consistent with that, the eamings potential of the Latino immi-
grant group fell substantially from 1955 through 1980. Among the non-
European countries, three of the four steepest declines in earnings
potential were among immigrant groups from Colombia, the Domini-
can Republic, and Mexico, all large contributors to the Latin American
immigrant population. Many of the other countries were not included
in Borjas's forty-one countries, so we do not know whether they followed
the same pattern. Among the Latin American and Latino-Caribbean
nations, only the immigrant groups from Cuba, Brazil, and Panama had
improving potential by Borjas's measures. The 1980 Mexican wave of
immigrants had an earnings potential about 15 percent lower than the
wave that arrived in 1955. For the Dominican Republic and Colombia,
the earnings potential of the 1980 wave was more than 30 percent lower
than those who came in 1955, a decline that remains after holding ed-
ucation, marital status, age, and location constant.62
Similarly, the success of the early waves of West Indian blacks seems
unlikely to repeat itself. In his book Ethnic America, Thomas Sowell de-
scr~bed the successes of West Indian black immigrants, starting from
early in the twentieth century, noting among other things that, by 1969,
second-generation West Indian blacks had a higher mean income than
whites.h3 His account has since become widely cited as evidence for
everything from the inherent equality of black and white earning abil-
ity to the merits of unrestricted immigration. The Borjas data include
three of the major contributors of black immigrants from that region:
Jamaica, Haiti, and Trinidadpobago. The earnings potential of the im-
migrant cohorts from these countries in 1970 ranged from 3 1 to 34 per-
cent less than American natives (after holding education, marital status,
age, and location constant).64 In 1980, the eamings potential from the
most recent immigrant waves from these three countries ranged from
26 to 52 percent less than American natives. Immigrants from all three
countries are on an extremely slow route to income equality, with Ja-
maicans and Haitians lagging behind everyone except the lowest-rank-
ing Latin American countries. Borjas's study did not include immigrants
from any countries in sub-Saharan Africa.
The results for European immigrants were also consistent with the
theory. Borjas's overall appraisal of the data is worth quoting in full:
The empirical analysis of the eamings of immigrants from 4 1 differ-
ent countries using the 1970 and 1980 censuses shows that there are
strong country-specific fixed effects in the (labor market) quality of
foreign-born persons. In particular, persons from Western European
countries do quite well in the United States, and their cohorts have
exhibited a general increase in earnings (relative to their measured
skills) over the postwar period. O n the other hand, persons from less
developed countries do not perform well in the U.S. lahor market and
their cohorts have exhibited a general &crease in earnings (relative
to their measured skills) over the postwar periodah5
364
The National Context
The Demography of intelligence
365
These analyses should not obscure the energy and ability that we of-
ten see among immigrants, whether they are staffing the checkout
counter at the comer convenience store or teaching classes in the na-
tion's most advanced research centers. The observations of everyday life
and the statistical generalizations we have just presented can both be
true at the same time, however.
HOW IMPORTANT IS DYSGENIC PRESSURE!
Putting the pieces together-higher
fertility and a faster generational
cycle among the Less intelligent and an immigrant population that is
probably somewhat below the native-born average-the
case is strong
that something worth worrying about is happening to the cognitive cap-
ital of the country. How big is the effect? If we were to try to put it in
terms of IQ points per generation, the usual metric for such analyses, it
would be nearly impossible to make the total come out to less than one
point per generation. It might be twice that. But we hope we have em-
phasized the complications enough to show why such estimates are only
marginally useful. Even if an estimate is realistic regarding the current
situation, it is impossihle to predict how long it may be correct or when
and how it may change. It may shrink or grow or remain stable. De-
mographers disagree about many things, but not that the further into
the future we try to look, the more likely our forecasts are to he wrong.
This leads to the last issue that must be considered before it is fruit-
ful to talk about specific demographic policies. So what if the mean 1Q
is dropping by a point or two per generation? One reason to worry is that
the drop may be enlarging ethnic differences in cognitive ability at a
time when the nation badly needs narrowing differences. Another
reason to worry is that when the mean shifts a little, the size of the tails
of the distribution changes a lot. For example, assuming a normal dis-
tribution, a three-point drop at the average would reduce the propor-
tion of the population with IQs above 120 (currently the top decile) by
31 percent and the proportion with 1Qs above 135 (currently the top 1
percent) hy 42 percent. The proportion of the population with 1Qs be-
low 80 (currently the bottom decile) would rise by 41 percent and the
proportion with 1Qs below 65 (currently the bottom 1 percent) would
rise by 68 percent. Given the predictive power of IQ scores, particularly
in the extremes of the distribution, changes this large would profoundly
alter many aspects of American life, none that we can think of to the
good.
Suppose we select a subsample of the NLSY, different in only one re-
spect from the complete sample: We randomly delete persons who have
a mean IQ of tnore than 97, until we reach a sample that has a mean IQ
of 97-a
mere three points below the mean of the full sample.'h"'
How different do the crucial social outcomes look? For some behav-
iors, not much changes. Marriage rates do not change. With a three-
point decline at the average, divorce, unemployment, and dropout from
the labor force rise only marginally. But the overall poverty rate rises by
1 1 percent and the proportion of children living in poverty throughout
the first three years of their lives rises by 13 percent. The proportion of
children born to single mothers rises by 8 percent. The proportion of
men interviewed in jail rises by 13 percent. The proportion of children
I ~ v ~ n g
with nonparental custodians, of women ever on welfare, and of
people dropping out of high school all rise by 14 percent. The propor-
tion of young men prevented from working by health problems increases
by 18 percent.
This exercise assumed that everything else but IQ remained constant.
In the real world, things would no doubt be more complicated. A cas-
cade of secondary effects may make social condit~ons
worse than we sug-
gest or perhaps not so bad. Rut the overall point is that an apparently
mlnor shift in IQ could produce important social outcomes. Three
points in lQ seem to he nothing (and indeed, they are nothing in terms
of understanding an individual's ability), hut a population with an IQ
mean that has slipped three points is likely to be importantly worse off.
Furthermore, a three-point slide in the near-term future is well within
the realm of possibility. The social phenomena that have been so wor-
risome for the past few decades may in some degree already reflect iln
ongoing dysgenic effect. It is worth worrying about, and worth trying to
do something about.
At the same time, it is not impossible to imagine more hopeful
prospects. After all, IQ scores are rising with the Flynn effect. The na-
tion can spend more money more effectively on childhood interven-
tions and improved education. Won't these tend to keep this
three-point fall and its consequences from actually happening? They
may, but whatever good things we can accomplish with changes in the
environment would be that much more effective if they did not have to
The Impact of Shifting IQ
- Small shifts in the mean IQ of a population result in disproportionately large changes in the size of the distribution's tails.
- A three-point drop in mean IQ could reduce the number of high-IQ individuals by over 40 percent while increasing the low-IQ population by nearly 70 percent.
- Simulations suggest that a minor IQ decline correlates with significant increases in poverty, incarceration, and high school dropout rates.
- While individual differences of three points are negligible, the societal consequences of such a shift are predicted to be profoundly negative.
- The authors suggest that current social problems may already be reflecting an ongoing dysgenic effect despite the countervailing Flynn effect.
- Environmental interventions like education might be more effective if they did not have to combat a downward pressure on cognitive ability.
Three points in lQ seem to he nothing (and indeed, they are nothing in terms of understanding an individual's ability), hut a population with an IQ mean that has slipped three points is likely to be importantly worse off.
364
The National Context
The Demography of intelligence
365
These analyses should not obscure the energy and ability that we of-
ten see among immigrants, whether they are staffing the checkout
counter at the comer convenience store or teaching classes in the na-
tion's most advanced research centers. The observations of everyday life
and the statistical generalizations we have just presented can both be
true at the same time, however.
HOW IMPORTANT IS DYSGENIC PRESSURE!
Putting the pieces together-higher
fertility and a faster generational
cycle among the Less intelligent and an immigrant population that is
probably somewhat below the native-born average-the
case is strong
that something worth worrying about is happening to the cognitive cap-
ital of the country. How big is the effect? If we were to try to put it in
terms of IQ points per generation, the usual metric for such analyses, it
would be nearly impossible to make the total come out to less than one
point per generation. It might be twice that. But we hope we have em-
phasized the complications enough to show why such estimates are only
marginally useful. Even if an estimate is realistic regarding the current
situation, it is impossihle to predict how long it may be correct or when
and how it may change. It may shrink or grow or remain stable. De-
mographers disagree about many things, but not that the further into
the future we try to look, the more likely our forecasts are to he wrong.
This leads to the last issue that must be considered before it is fruit-
ful to talk about specific demographic policies. So what if the mean 1Q
is dropping by a point or two per generation? One reason to worry is that
the drop may be enlarging ethnic differences in cognitive ability at a
time when the nation badly needs narrowing differences. Another
reason to worry is that when the mean shifts a little, the size of the tails
of the distribution changes a lot. For example, assuming a normal dis-
tribution, a three-point drop at the average would reduce the propor-
tion of the population with IQs above 120 (currently the top decile) by
31 percent and the proportion with 1Qs above 135 (currently the top 1
percent) hy 42 percent. The proportion of the population with 1Qs be-
low 80 (currently the bottom decile) would rise by 41 percent and the
proportion with 1Qs below 65 (currently the bottom 1 percent) would
rise by 68 percent. Given the predictive power of IQ scores, particularly
in the extremes of the distribution, changes this large would profoundly
alter many aspects of American life, none that we can think of to the
good.
Suppose we select a subsample of the NLSY, different in only one re-
spect from the complete sample: We randomly delete persons who have
a mean IQ of tnore than 97, until we reach a sample that has a mean IQ
of 97-a
mere three points below the mean of the full sample.'h"'
How different do the crucial social outcomes look? For some behav-
iors, not much changes. Marriage rates do not change. With a three-
point decline at the average, divorce, unemployment, and dropout from
the labor force rise only marginally. But the overall poverty rate rises by
1 1 percent and the proportion of children living in poverty throughout
the first three years of their lives rises by 13 percent. The proportion of
children born to single mothers rises by 8 percent. The proportion of
men interviewed in jail rises by 13 percent. The proportion of children
I ~ v ~ n g
with nonparental custodians, of women ever on welfare, and of
people dropping out of high school all rise by 14 percent. The propor-
tion of young men prevented from working by health problems increases
by 18 percent.
This exercise assumed that everything else but IQ remained constant.
In the real world, things would no doubt be more complicated. A cas-
cade of secondary effects may make social condit~ons
worse than we sug-
gest or perhaps not so bad. Rut the overall point is that an apparently
mlnor shift in IQ could produce important social outcomes. Three
points in lQ seem to he nothing (and indeed, they are nothing in terms
of understanding an individual's ability), hut a population with an IQ
mean that has slipped three points is likely to be importantly worse off.
Furthermore, a three-point slide in the near-term future is well within
the realm of possibility. The social phenomena that have been so wor-
risome for the past few decades may in some degree already reflect iln
ongoing dysgenic effect. It is worth worrying about, and worth trying to
do something about.
At the same time, it is not impossible to imagine more hopeful
prospects. After all, IQ scores are rising with the Flynn effect. The na-
tion can spend more money more effectively on childhood interven-
tions and improved education. Won't these tend to keep this
three-point fall and its consequences from actually happening? They
may, but whatever good things we can accomplish with changes in the
environment would be that much more effective if they did not have to
3 66
The National Context
The Demography of Intelligence
367
How Would We Know That IQ Has Been Falling?
Can the United States really have been experiencing falling IQ? Would
not we be able to see the consequences? Maybe we have. In 1938, Ray-
mond Cattell, one of most illustrious psychometricians of his age, wrote an
article for the BritishJouml of Psychology, "Some Changes in Social life in
a Community with a Falling lntelligence Q~otient."~'
The article was
eerily prescient.
In education, Cattell predicted that academic standards would fall and
the curriculum would shift toward less abstract subjects. He foresaw an in-
crease in "delinquency against societyv--crime and willful dependency (for
example, having a child without being able to care for it) would be in this
category. He was not sure whether this would lead to a slackening of moral
codes or attempts at tighter government control over individual behavior.
The response could go either way, he wrote.
He predicted that a complex modem society with a falling IQ wo~lld
have to compensate people at the low end of IQ by a "systematized relax-
ation of moral standards, permitting more direct instinctive satisfac-
tions."@'
In particular, he saw an expanding role for what he called "fantasy
compensations." He saw the novel and the cinema as the contemporary
means for satisfying it, but he added that "we have probably not seen the
end of its development or begun to appreciate its damaging effects on 're-
ality thinking' habits concerned in other spheres of lifen-a prediction hard
to fault as one watches the use of TV in today's world and imagines the use
of virtual reality helmets in tomor~owS.~~
Turning to political and social life, he expected to see "the development
of a larger 'social problem group' or at least of a group supported, super-
vised and patronized by extensive state social welfare work." This, he fore-
saw, would be "inimical to that human solidarity and potential equality of
prestige which is essential to democracy."'701
fight a demographic head wind. Perhaps, for example, making the en-
vironment better could keep the average IQ at 100, instead of falling to
97 because of the demographic pressures. But the same improved envi-
ronment could raise the average to 103, if the demographic pressures
would cease.
Suppose that downward pressure from demography stopped and
maybe modestly turned around in the other direction-nothing
dra-
matic, no eugenic surges in babies by high-IQ women or draconian mea-
sures to stop low-IQ women from having babies, just enough of a shift
so that the winds were at least heading in the right direction. Then im-
provements in education and childhood interventions need not strug-
gle to keep us from falling behind; they could bring real progress. Once
again, we cannot predict exactly what would happen if the mean IQ rose
to 103, for example, but we can describe what does happen to the sta-
tistics when the NLSY sample is altered so that its subjects have a mean
of 103.1711
For starters, the poverty rate falls by 25 percent. So does the propor-
tion of males ever interviewed in jail. High school dropouts fall by 28
percent. Children living without their parents fall hy 20 percent. Wel-
fare recipiency, both temporary and chronic, falls by 18 percent. Chil-
dren born out of wedlock drop by 15 percent. The incidence of
low-weight births drops by 12 percent. Children in the bottom decile
of home environments drop by 13 percent. Children who live in poverty
for the first three years of their lives drop by 20 percent.
The stories of falling and rising IQ are not mirror images of each other,
in part for technical reasons explained in the note and partly because
the effects of above- and below-average IQ are often asymmetrical.1721
Once again, we must note that the real world is more complex than in
our simplified exercise. Rut the basic implication is hard to dispute:
With a rising average, the changes are positive rather than negative.
Consider the poverty rate for people in the NLSY as of 1989, for ex-
ample. It stood at 1 1.0 per~ent.'~''
T h e same sample, depleted of above-
97 IQ people until the mean was 97, has a poverty rate of 12.2 percent.
The same sample, depleted of below-103 IQ people until the mean was
103, has a poverty rate of 8.3 percent. This represents a swing of almost
four percentage points-more
than a third of the actual 1989 poverty
problem as represented by the full NLSY sample. Suppose we cast this
discussion in terms of the "swing." T h e figure below contains the indi-
cators that show the biggest swing.
A swing from an average IQ of 97 to 103 in the NLSY reduces the
proportion of people who never get a high school education by 43 per-
cent, of persons below the poverty line by 36 percent, of children liv-
ing in foster care or with nonparental relatives by 38 percent, of women
ever on welfare by 31 percent. The list goes on, and shows substantial
reductions for other indicators discussed in Part I1 that we have not in-
cluded in the figure.
The nation is at a fork in the road. I t will be moving somewhere
within this range of possibilities in the decades to come. It is easy to un-
Consequences of Shifting IQ
- Raymond Cattell predicted that a decline in average IQ would lead to lower academic standards and a shift toward less abstract curricula.
- A falling IQ in a complex society may result in 'fantasy compensations' like cinema and television to satisfy instinctive desires at the expense of reality-based thinking.
- Cattell foresaw the growth of a 'social problem group' dependent on state welfare, which he believed would undermine the human solidarity necessary for democracy.
- Demographic pressures act as a 'head wind' against educational and social improvements, forcing interventions to work just to maintain the status quo.
- Statistical modeling suggests that raising the mean IQ by just three points could reduce poverty and incarceration rates by 25 percent.
- Improvements in average IQ are associated with significant reductions in high school dropouts, welfare dependency, and low-weight births.
He saw the novel and the cinema as the contemporary means for satisfying it, but he added that 'we have probably not seen the end of its development or begun to appreciate its damaging effects on "reality thinking" habits.'
3 66
The National Context
The Demography of Intelligence
367
How Would We Know That IQ Has Been Falling?
Can the United States really have been experiencing falling IQ? Would
not we be able to see the consequences? Maybe we have. In 1938, Ray-
mond Cattell, one of most illustrious psychometricians of his age, wrote an
article for the BritishJouml of Psychology, "Some Changes in Social life in
a Community with a Falling lntelligence Q~otient."~'
The article was
eerily prescient.
In education, Cattell predicted that academic standards would fall and
the curriculum would shift toward less abstract subjects. He foresaw an in-
crease in "delinquency against societyv--crime and willful dependency (for
example, having a child without being able to care for it) would be in this
category. He was not sure whether this would lead to a slackening of moral
codes or attempts at tighter government control over individual behavior.
The response could go either way, he wrote.
He predicted that a complex modem society with a falling IQ wo~lld
have to compensate people at the low end of IQ by a "systematized relax-
ation of moral standards, permitting more direct instinctive satisfac-
tions."@'
In particular, he saw an expanding role for what he called "fantasy
compensations." He saw the novel and the cinema as the contemporary
means for satisfying it, but he added that "we have probably not seen the
end of its development or begun to appreciate its damaging effects on 're-
ality thinking' habits concerned in other spheres of lifen-a prediction hard
to fault as one watches the use of TV in today's world and imagines the use
of virtual reality helmets in tomor~owS.~~
Turning to political and social life, he expected to see "the development
of a larger 'social problem group' or at least of a group supported, super-
vised and patronized by extensive state social welfare work." This, he fore-
saw, would be "inimical to that human solidarity and potential equality of
prestige which is essential to democracy."'701
fight a demographic head wind. Perhaps, for example, making the en-
vironment better could keep the average IQ at 100, instead of falling to
97 because of the demographic pressures. But the same improved envi-
ronment could raise the average to 103, if the demographic pressures
would cease.
Suppose that downward pressure from demography stopped and
maybe modestly turned around in the other direction-nothing
dra-
matic, no eugenic surges in babies by high-IQ women or draconian mea-
sures to stop low-IQ women from having babies, just enough of a shift
so that the winds were at least heading in the right direction. Then im-
provements in education and childhood interventions need not strug-
gle to keep us from falling behind; they could bring real progress. Once
again, we cannot predict exactly what would happen if the mean IQ rose
to 103, for example, but we can describe what does happen to the sta-
tistics when the NLSY sample is altered so that its subjects have a mean
of 103.1711
For starters, the poverty rate falls by 25 percent. So does the propor-
tion of males ever interviewed in jail. High school dropouts fall by 28
percent. Children living without their parents fall hy 20 percent. Wel-
fare recipiency, both temporary and chronic, falls by 18 percent. Chil-
dren born out of wedlock drop by 15 percent. The incidence of
low-weight births drops by 12 percent. Children in the bottom decile
of home environments drop by 13 percent. Children who live in poverty
for the first three years of their lives drop by 20 percent.
The stories of falling and rising IQ are not mirror images of each other,
in part for technical reasons explained in the note and partly because
the effects of above- and below-average IQ are often asymmetrical.1721
Once again, we must note that the real world is more complex than in
our simplified exercise. Rut the basic implication is hard to dispute:
With a rising average, the changes are positive rather than negative.
Consider the poverty rate for people in the NLSY as of 1989, for ex-
ample. It stood at 1 1.0 per~ent.'~''
T h e same sample, depleted of above-
97 IQ people until the mean was 97, has a poverty rate of 12.2 percent.
The same sample, depleted of below-103 IQ people until the mean was
103, has a poverty rate of 8.3 percent. This represents a swing of almost
four percentage points-more
than a third of the actual 1989 poverty
problem as represented by the full NLSY sample. Suppose we cast this
discussion in terms of the "swing." T h e figure below contains the indi-
cators that show the biggest swing.
A swing from an average IQ of 97 to 103 in the NLSY reduces the
proportion of people who never get a high school education by 43 per-
cent, of persons below the poverty line by 36 percent, of children liv-
ing in foster care or with nonparental relatives by 38 percent, of women
ever on welfare by 31 percent. The list goes on, and shows substantial
reductions for other indicators discussed in Part I1 that we have not in-
cluded in the figure.
The nation is at a fork in the road. I t will be moving somewhere
within this range of possibilities in the decades to come. It is easy to un-
The Demography of Intelligence
- Small shifts in the mean IQ of a population, such as a move from 97 to 103, correlate with significant swings in the prevalence of social problems.
- A higher mean IQ in the sample results in a 43 percent reduction in high school dropouts and a 36 percent reduction in poverty rates.
- The authors argue that social problems like welfare dependency and foster care placement are heavily concentrated in the lower portion of the cognitive ability distribution.
- A distinction is made between IQ as a causal risk factor and its prevalence among those already experiencing social afflictions.
- The text suggests that public policy must be specifically designed to succeed with individuals of lower cognitive ability to be effective.
- The authors claim that ignoring the demographic implications of intelligence is reckless and foolish given the high stakes for the nation's future.
Our purpose has been to point out that the stakes are large and that continuing to pretend that there's nothing worth thinking about is as reckless as it is foolish.
3 66
The National Context
The Demography of Intelligence
367
How Would We Know That IQ Has Been Falling?
Can the United States really have been experiencing falling IQ? Would
not we be able to see the consequences? Maybe we have. In 1938, Ray-
mond Cattell, one of most illustrious psychometricians of his age, wrote an
article for the BritishJouml of Psychology, "Some Changes in Social life in
a Community with a Falling lntelligence Q~otient."~'
The article was
eerily prescient.
In education, Cattell predicted that academic standards would fall and
the curriculum would shift toward less abstract subjects. He foresaw an in-
crease in "delinquency against societyv--crime and willful dependency (for
example, having a child without being able to care for it) would be in this
category. He was not sure whether this would lead to a slackening of moral
codes or attempts at tighter government control over individual behavior.
The response could go either way, he wrote.
He predicted that a complex modem society with a falling IQ wo~lld
have to compensate people at the low end of IQ by a "systematized relax-
ation of moral standards, permitting more direct instinctive satisfac-
tions."@'
In particular, he saw an expanding role for what he called "fantasy
compensations." He saw the novel and the cinema as the contemporary
means for satisfying it, but he added that "we have probably not seen the
end of its development or begun to appreciate its damaging effects on 're-
ality thinking' habits concerned in other spheres of lifen-a prediction hard
to fault as one watches the use of TV in today's world and imagines the use
of virtual reality helmets in tomor~owS.~~
Turning to political and social life, he expected to see "the development
of a larger 'social problem group' or at least of a group supported, super-
vised and patronized by extensive state social welfare work." This, he fore-
saw, would be "inimical to that human solidarity and potential equality of
prestige which is essential to democracy."'701
fight a demographic head wind. Perhaps, for example, making the en-
vironment better could keep the average IQ at 100, instead of falling to
97 because of the demographic pressures. But the same improved envi-
ronment could raise the average to 103, if the demographic pressures
would cease.
Suppose that downward pressure from demography stopped and
maybe modestly turned around in the other direction-nothing
dra-
matic, no eugenic surges in babies by high-IQ women or draconian mea-
sures to stop low-IQ women from having babies, just enough of a shift
so that the winds were at least heading in the right direction. Then im-
provements in education and childhood interventions need not strug-
gle to keep us from falling behind; they could bring real progress. Once
again, we cannot predict exactly what would happen if the mean IQ rose
to 103, for example, but we can describe what does happen to the sta-
tistics when the NLSY sample is altered so that its subjects have a mean
of 103.1711
For starters, the poverty rate falls by 25 percent. So does the propor-
tion of males ever interviewed in jail. High school dropouts fall by 28
percent. Children living without their parents fall hy 20 percent. Wel-
fare recipiency, both temporary and chronic, falls by 18 percent. Chil-
dren born out of wedlock drop by 15 percent. The incidence of
low-weight births drops by 12 percent. Children in the bottom decile
of home environments drop by 13 percent. Children who live in poverty
for the first three years of their lives drop by 20 percent.
The stories of falling and rising IQ are not mirror images of each other,
in part for technical reasons explained in the note and partly because
the effects of above- and below-average IQ are often asymmetrical.1721
Once again, we must note that the real world is more complex than in
our simplified exercise. Rut the basic implication is hard to dispute:
With a rising average, the changes are positive rather than negative.
Consider the poverty rate for people in the NLSY as of 1989, for ex-
ample. It stood at 1 1.0 per~ent.'~''
T h e same sample, depleted of above-
97 IQ people until the mean was 97, has a poverty rate of 12.2 percent.
The same sample, depleted of below-103 IQ people until the mean was
103, has a poverty rate of 8.3 percent. This represents a swing of almost
four percentage points-more
than a third of the actual 1989 poverty
problem as represented by the full NLSY sample. Suppose we cast this
discussion in terms of the "swing." T h e figure below contains the indi-
cators that show the biggest swing.
A swing from an average IQ of 97 to 103 in the NLSY reduces the
proportion of people who never get a high school education by 43 per-
cent, of persons below the poverty line by 36 percent, of children liv-
ing in foster care or with nonparental relatives by 38 percent, of women
ever on welfare by 31 percent. The list goes on, and shows substantial
reductions for other indicators discussed in Part I1 that we have not in-
cluded in the figure.
The nation is at a fork in the road. I t will be moving somewhere
within this range of possibilities in the decades to come. It is easy to un-
368
The National Context
The swing in social problems that can result
from small shifts in the mean IQ of a population
Change when the NLSY sample is
altered so that the mean IQ is ...
Chapter 16
103
97 -
Permanent high school dropouts
-
Men prevented from working by health problem,
ik: - I
[
Children not liv~ng with either parent
-
Males ever interviewed in jail
-
Persons below the poverty line
-
Children in poverty for the first 3 year, of life
.1 -
Women ever on welfare
Women who became chron~c welfare recip~ent\
--
Children born out of wedlock. of all live births
I
I
I
I
I
I
-30% -20% -10%
0% +lo% +208
derstand the historical and social reasons why nobody wants to talk
about the demography of intelligence. Our purpose has been to point
out that the stakes are large and that continuing to pretend that there's
nothing worth thinking about is as reckless as it is foolish. In Part IV,
we offer some policies to point the country toward a brighter demo-
graphic future.
Social Behavior and the
Prevalence of Low Cognitive
Ability
In this chapter, the question is not whether low cognitive ability causes social
problems but the prevalence of low cognitive ability among peopk who have
those problems . It is an important distinction. Causal relationships are com-
plex and hard to establish definitely. The measure of prevalence is more
straightforward. For most of the worst social problems of our time, the peo-
pk who have the problem are heavily concentrated in the lower portion of the
cognitive ability distribution. Any practical solution must therefore be capa-
ble of succeeding with such people.
Th
is chapter brings together the social behaviors we covered in Part
I1 from a new vantage point. The earlier chapters showed that low
cognitive ability raises the risk of living in conditions or behaving in
ways that society hopes to change. Now the question concerns preva-
lence: To what extent does low cognitive ability describe the people thus
afflicted? The distinction is more familiar in the medical context. High
cholesterol may be a risk factor for heart disease, but most people with
heart disease may or may not have high cholesterol. If most people who
have heart attacks do not have high cholesterol, then lowering the cho-
lesterol of those with high levels will not do much to reduce the fre-
quency of heart attacks in the population at large. Similarly, to the
extent that low cognitive ability is prevalent among people who have
the problems we hope to solve, policies that are effective for people with
low scores should be sought.
The entire NLSY sample, including the Asian-Americans, Ameri-
3 70
The National Context
Social Behavior and the Prevalence of Low Cognitive Ability
37 1
can Indians, and other ethnic groups that have hitherto been excluded,
are used here. The proportions presented in this chapter are represen-
tative of America's national population for an age cohort that was 26
to 33 as of 1990.
POVERTY
In 1989, the official national statistics revealed that 11 .I percent of per-
sons ages 25 to 34 years old were poor in that year, virtually identical
with the 10.9 percent below the poverty line in the NLSY sample ages
25 to 33. So while the NLSY cannot give us a precise figure for overall
national poverty, there is no reason to think that the results from it are
misleading for young adults. This is in preface to the sobering figure that
follows.
Forty-eight percent of the poor in 1989 came
from the bottom 20 percent in intelligence
Persons in poverty
(bars)
Cumulative
(line)
IQ Decile
This graph uses conventions that we follow throughout the chapter:
The headline gives the percentage of the population in question (in this
instance, the poor) in the bottom 20 percent of IQ, and the scale is the
same for each graph. The bars show the percentage of the poor popula-
tion who come from each decile, marked by the scale on the left. If cog-
nitive ability were irrelevant to poverty, the bars would be of equal
height, each at just 10 percent. Adding up the percentages in each bar
from left to right gives the cumulative percentage, shown by the black
line and the right-hand scale. For example, the first two deciles add up
to 48 percent; therefore the black line crosses the 48 percent mark at
the second bar. The cumulative scale is a way of showing what propor-
tion of poor people fall below any given decile. For example, in the case
of poverty, almost 80 percent of poor people are in or below the fourth
decile. If cognitive ability were irrelevant, the line would be a straight
diagonal from lower left to the upper right.
In terms of IQ points, the cognitive ability deciles in the figure above,
as in all the others in the chapter, correspond to the scores in the table
below. The bottom two deciles cut off IQ 87 and below and the top two
IQ Equivalents for the Deciles
Decile
Range
Median
1st
Under 81
74
2d
81-87
84
3d
87-92
90
4th
92-96
94
5th
96-100
98
6th
100- 104
102
7th
104- 108
106
8th
108-113
110
9th
113-1 19
116
10th
Above 1 19
126
deciles cut off IQ 1 13 and above. It may also be useful to recall that most
college graduates and almost everyone with a professional degree fall in
the ninth and tenth deciles.
The figure tells us forcefully that poverty is concentrated among those
with low cognitive ability. The mean I Q of people below the poverty
line was 88. A :hird of them came from the very bottom decile; they
had IQs under 81. Eighty-two percent had below-average IQs.
HIGH SCHOOL DROPOUTS
It will come as no surprise to find that most high school dropouts have
low intelligence. The figure below shows she results for persons who
Cognitive Ability and Poverty
- The National Longitudinal Survey of Youth (NLSY) data aligns closely with national statistics, showing roughly 11 percent of young adults live in poverty.
- Statistical analysis reveals a strong correlation between low IQ scores and poverty, with 48 percent of the poor originating from the bottom 20 percent of the intelligence distribution.
- Nearly 80 percent of individuals living in poverty fall within or below the fourth IQ decile, which corresponds to an IQ of 96 or lower.
- High school dropouts show an even more extreme cognitive skew, with 94 percent of permanent dropouts possessing below-average IQ scores.
- While those who obtain a GED later in life perform better than permanent dropouts, 69 percent still fall within the bottom half of the IQ distribution.
- In contrast to poverty and education, year-round employment for men shows only a minor association with cognitive ability.
The figure tells us forcefully that poverty is concentrated among those with low cognitive ability.
3 70
The National Context
Social Behavior and the Prevalence of Low Cognitive Ability
37 1
can Indians, and other ethnic groups that have hitherto been excluded,
are used here. The proportions presented in this chapter are represen-
tative of America's national population for an age cohort that was 26
to 33 as of 1990.
POVERTY
In 1989, the official national statistics revealed that 11 .I percent of per-
sons ages 25 to 34 years old were poor in that year, virtually identical
with the 10.9 percent below the poverty line in the NLSY sample ages
25 to 33. So while the NLSY cannot give us a precise figure for overall
national poverty, there is no reason to think that the results from it are
misleading for young adults. This is in preface to the sobering figure that
follows.
Forty-eight percent of the poor in 1989 came
from the bottom 20 percent in intelligence
Persons in poverty
(bars)
Cumulative
(line)
IQ Decile
This graph uses conventions that we follow throughout the chapter:
The headline gives the percentage of the population in question (in this
instance, the poor) in the bottom 20 percent of IQ, and the scale is the
same for each graph. The bars show the percentage of the poor popula-
tion who come from each decile, marked by the scale on the left. If cog-
nitive ability were irrelevant to poverty, the bars would be of equal
height, each at just 10 percent. Adding up the percentages in each bar
from left to right gives the cumulative percentage, shown by the black
line and the right-hand scale. For example, the first two deciles add up
to 48 percent; therefore the black line crosses the 48 percent mark at
the second bar. The cumulative scale is a way of showing what propor-
tion of poor people fall below any given decile. For example, in the case
of poverty, almost 80 percent of poor people are in or below the fourth
decile. If cognitive ability were irrelevant, the line would be a straight
diagonal from lower left to the upper right.
In terms of IQ points, the cognitive ability deciles in the figure above,
as in all the others in the chapter, correspond to the scores in the table
below. The bottom two deciles cut off IQ 87 and below and the top two
IQ Equivalents for the Deciles
Decile
Range
Median
1st
Under 81
74
2d
81-87
84
3d
87-92
90
4th
92-96
94
5th
96-100
98
6th
100- 104
102
7th
104- 108
106
8th
108-113
110
9th
113-1 19
116
10th
Above 1 19
126
deciles cut off IQ 1 13 and above. It may also be useful to recall that most
college graduates and almost everyone with a professional degree fall in
the ninth and tenth deciles.
The figure tells us forcefully that poverty is concentrated among those
with low cognitive ability. The mean I Q of people below the poverty
line was 88. A :hird of them came from the very bottom decile; they
had IQs under 81. Eighty-two percent had below-average IQs.
HIGH SCHOOL DROPOUTS
It will come as no surprise to find that most high school dropouts have
low intelligence. The figure below shows she results for persons who
372
The National Context
Social Behavior and the Prevalence of Low Cognitive Ability
373
Two-thirds of high school dropouts came
from the bottom 20 percent in intelligence
Permanent high school dropouts
Cumulative
(bars)
(line)
IQ Decile
dropped out of school and did not subsequently obtain a GED. Overall,
94 percent of those who permanently dropped out of scho~l
were below
average in IQ. As we noted in Chapter 6, this disproportion is not ma-
terially affected by analyses limited to persons who took the intelligence
test before they dropped out, so it cannot be explained by the effects of
a lack of schooling on their IQs.
Those who drop out of school and later return to get their GED are
markedly below the mean of those who finish high school in the nor-
mal way, but they are not as severely skewed toward the bottom end of
the distribution. Twenty-five percent are in the bottom two IQ deciles,
and 69 percent are in the bottom half of the distribution.
MEN AND WORK
The Employed
Year-round employment has only a minor association with cognitive ability.
The figure below, based on men who worked fifty-two weeks in 1989,
makes this point plainly. We italicize it because, although it is consis-
tent with the analysis presented for whites in Chapter 7, we want to
emphasize that the same result applies across ethnic groups.
Seventeen percent of the men who worked year round in 1989
were in the bottom 20 percent of intelligence
Men who worked 52 weeks in 1989
Cumulative
(bars)
(line)
1\t 2nd 3rd 4th 5th 6th 7th 8th 0th 10th
IQ
Decile
Ry and large, men who were employed throughout 1982 were spread
across the full range of IQs, with only a minor elevation for those in the
top four deciles. The mean IQ of year-round workers was 102. Those
with low 1Q have a statistically tougher time in many ways, hut they
contribute very nearly their full share to the population of men em-
ployed year round, an important fact to remember as a counterweight
to most of the other findings in this chapter.
Nonworkers
The prototypical member of the underclass in the public imagination is
a young male hanging out on the streets, never working. This amounted
to very few men. Only 2.2 percent of NLSY men not in school and not
prevented from working because of health problems failed to work at
least a week in 1989. But among these 2.2 percent, low cognitive abil-
Intelligence and Labor Participation
- Year-round workers are distributed across the full spectrum of IQ scores, with a mean IQ of 102, suggesting that low cognitive ability does not preclude steady employment.
- Long-term unemployment is strongly correlated with low cognitive ability, as 50 percent of men who did not work at all in 1989 were in the bottom IQ decile.
- Short-term unemployment shows a much weaker relationship to intelligence than chronic joblessness, indicating that temporary work gaps affect a broader range of the population.
- The data suggests a 'general principle' where the prevalence of low IQ increases in direct proportion to the duration of unemployment.
- Criminal justice involvement is heavily concentrated among those with lower cognitive ability, with 93 percent of interviewed inmates scoring in the bottom half of the IQ distribution.
Short-term unemployment is not conspicuously characterized by low IQ; long-term unemployment is.
372
The National Context
Social Behavior and the Prevalence of Low Cognitive Ability
373
Two-thirds of high school dropouts came
from the bottom 20 percent in intelligence
Permanent high school dropouts
Cumulative
(bars)
(line)
IQ Decile
dropped out of school and did not subsequently obtain a GED. Overall,
94 percent of those who permanently dropped out of scho~l
were below
average in IQ. As we noted in Chapter 6, this disproportion is not ma-
terially affected by analyses limited to persons who took the intelligence
test before they dropped out, so it cannot be explained by the effects of
a lack of schooling on their IQs.
Those who drop out of school and later return to get their GED are
markedly below the mean of those who finish high school in the nor-
mal way, but they are not as severely skewed toward the bottom end of
the distribution. Twenty-five percent are in the bottom two IQ deciles,
and 69 percent are in the bottom half of the distribution.
MEN AND WORK
The Employed
Year-round employment has only a minor association with cognitive ability.
The figure below, based on men who worked fifty-two weeks in 1989,
makes this point plainly. We italicize it because, although it is consis-
tent with the analysis presented for whites in Chapter 7, we want to
emphasize that the same result applies across ethnic groups.
Seventeen percent of the men who worked year round in 1989
were in the bottom 20 percent of intelligence
Men who worked 52 weeks in 1989
Cumulative
(bars)
(line)
1\t 2nd 3rd 4th 5th 6th 7th 8th 0th 10th
IQ
Decile
Ry and large, men who were employed throughout 1982 were spread
across the full range of IQs, with only a minor elevation for those in the
top four deciles. The mean IQ of year-round workers was 102. Those
with low 1Q have a statistically tougher time in many ways, hut they
contribute very nearly their full share to the population of men em-
ployed year round, an important fact to remember as a counterweight
to most of the other findings in this chapter.
Nonworkers
The prototypical member of the underclass in the public imagination is
a young male hanging out on the streets, never working. This amounted
to very few men. Only 2.2 percent of NLSY men not in school and not
prevented from working because of health problems failed to work at
least a week in 1989. But among these 2.2 percent, low cognitive abil-
374
The National Context
Social Behavior and the Prevalence of Low Cognitive Ability
375
ity predominated. The figure below, limited to civilian men out of school
and not physically prevented from working, combines those who said
they were unemployed and those who said they had dropped out of the
labor force; their common denominator is that they reported zero weeks
of working for 1989. The mean IQ of men who did not work at all was
84. Fifty percent were in the bottom decile. Eighty-four percent were
below average.
Sixty-four percent of able-bodied men who did not work in 1989
were in the bottom 20 percent of intelligence
Able-bodied men who did not work
Cumulative
(line)
100%
80%
60%
40%
20%
0%
IS^ 2nd 3rd 4th 5th 6th 7th 8th 9th '10th
IQ Decile
Unemp by men t
Now we turn to the men not represented in either of the two figures
above: men who worked at least some time during 1989 but were out of
work for more than four weeks. There was somewhat more unemploy-
ment among the lower deciles of IQ, as the figure below shows, but, as
the almost straight diagonal line shows, the relationship was not strong.
Twenty-nine percent of able-bodied men who were temporarily out
of work in 1989 were in the bottom 20 percent of intelligence
Men out of work 4 wks. or more
Cumulative
(bars)
(line)
1Q Decile
For these men, the mean IQ was 97, three points below average. If we
were to add another graph, for men who were out of work for six months
but not the full year, it would show a stronger relationship, about halfway
between the graph just above and the earlier graph for men who were
out of the labor force all year. The general principle is that the longer
the period of unemployment, the more prevalent is low IQ. Short-term
unemployment is not conspicuously characterized by low 1Q; long-term
unemployment is.
MEN AND CRIME
The next figure contains the breakdown of the IQs of men in the NLSY
who were interviewed in a correctional facility, showing that they had
committed at least one offense serious enough to get them locked up.
The mean 1Q of men who were ever interviewed in a correctional fa-
cility was 84. Forty-five percent were concentrated in the bottom decile
of cognitive ability. Ninety-three percent of the men were somewhere
in the bottom half of the cognitive ability distribution. This high preva-
lence of low IQ among offenders is consistent with other estimates in
the literature, as summarized in Chapter 1 1.
376
The National Context
Social Behavior and the Prevaknce of Low Cognitive Ability
37 7
Sixtytwo percent of men ever interviewed in jail or
prison came from the bottom 20 percent of intelligence
Men ever interviewed in jail
Cumulative
(bars)
(line)
Forty-five percent of women who ever received welfare
are in the bottom 20 percent of intelligence
Women ever on welfare
Cumulative
(bars)
(line)
30% -
100%
80%
60%
40%
20%
0%
I \ t
2nd 3rd 4th 5th 0th 7th 8th 9th 10t11
1Q Decile
Fiftyeseven percent of chronic welfare recipients
are in the bottom 20 percent of intelligence
IQ Decile
Women on welfare for five or more years
Cumulative
WOMEN AND WELFARE
We start with women who have ever received welfare. The data are
shown in the figure below. Overall, the mean IQ of women who ever
received welfare was 89. About 85 percent of them were below average
in IQ, and fewer than 4 percent had 1Qs in the top two deciles.
For chronic welfare recipients, defined as women who had received
welfare for at least five years by 1990, the cognitive distribution was
even lower."' As the figure shows ,57 percent of chronic welfare moth-
ers were in the bottom two deciles of IQ, 88 percent were in the bot-
tom half of the distribution, and their mean IQ was 86. Just as low IQ
was increasingly prevalent as the level of male unemployment increased,
so also is low IQ more prevalent among mothers as their dependency
on welfare rises.
IQ Decile
Intelligence and Welfare Dependency
- Statistical data indicates a strong correlation between low IQ scores and long-term welfare dependency among women.
- Chronic welfare recipients, defined as those receiving aid for five or more years, have a mean IQ of 86, with 57 percent scoring in the bottom two deciles.
- The average IQ of all mothers in the NLSY sample is 95.7, which is notably below the national average.
- Over half of children born out of wedlock are born to mothers in the bottom 20 percent of the intelligence distribution.
- For children born to poor, single, teenage girls, 95 percent of their mothers score in the bottom half of the cognitive ability distribution.
Just as low IQ was increasingly prevalent as the level of male unemployment increased, so also is low IQ more prevalent among mothers as their dependency on welfare rises.
376
The National Context
Social Behavior and the Prevaknce of Low Cognitive Ability
37 7
Sixtytwo percent of men ever interviewed in jail or
prison came from the bottom 20 percent of intelligence
Men ever interviewed in jail
Cumulative
(bars)
(line)
Forty-five percent of women who ever received welfare
are in the bottom 20 percent of intelligence
Women ever on welfare
Cumulative
(bars)
(line)
30% -
100%
80%
60%
40%
20%
0%
I \ t
2nd 3rd 4th 5th 0th 7th 8th 9th 10t11
1Q Decile
Fiftyeseven percent of chronic welfare recipients
are in the bottom 20 percent of intelligence
IQ Decile
Women on welfare for five or more years
Cumulative
WOMEN AND WELFARE
We start with women who have ever received welfare. The data are
shown in the figure below. Overall, the mean IQ of women who ever
received welfare was 89. About 85 percent of them were below average
in IQ, and fewer than 4 percent had 1Qs in the top two deciles.
For chronic welfare recipients, defined as women who had received
welfare for at least five years by 1990, the cognitive distribution was
even lower."' As the figure shows ,57 percent of chronic welfare moth-
ers were in the bottom two deciles of IQ, 88 percent were in the bot-
tom half of the distribution, and their mean IQ was 86. Just as low IQ
was increasingly prevalent as the level of male unemployment increased,
so also is low IQ more prevalent among mothers as their dependency
on welfare rises.
IQ Decile
378
The National Context
Social Behavior and the Prevaknce of Low Cognitive Ability
379
OUTCOMES FOR CHILDREN
In this section, we describe the prevalence of low IQ among the moth-
ers of children with various problems. That is, we are presenting an an-
swer to the question, "If I am trying to deal with a certain problem
regarding the children of young adults, what can I assume about the in-
telligence of their mothers!"
We begin with the overriding fact that, as of 1990, the NLSY moth-
ers as a group were markedly below average in IQ. Their mean IQ was
95.7. Fourteen percent of NLSY children were born to mothers in the
bottom decile of IQ; 27 percent to mothers in the bottom two deciles; 62
percent to mothers in the bottom half of the distribution. Thus, for ex-
ample, a problem involving NLSY children will "ordinarily" show that 62
percent of the children have mothers with below-average IQ. As will be
clear, the observed proportions of low-IQ mothers are often considerably
elevated above that expectation.12' But these benchmark figures must be
kept in mind when interpreting all the analyses involving children.
Illegitimacy
We start with the children who are born to unmarried women (see the
figure below). The mean IQ of mothers of children born out of wedlock
Fifty-two percent of illegitimate children were born
to mothers in the bottom 20 percent of intelligence
Children born out of wedlock
Cumulative
(bars)
(line)
was 87.I3l Of all illegitimate children in the NLSY sample, almost one
out of three was born to a mother in the bottom 10 percent of the in-
telligence distribution, with an IQ under 81, and 85 percent were born
to women in the bottom half of the cognitive ability distribution.
Restricting the analysis to those children who are most at risk, these
percentages, already extreme, become even more bunched at the lower
end of the distribution. Consider children who fit the archetype of the
child at risk: born to a poor, single, teenage girl (with poverty measured
in the year prior to giving birth). Almost two out of three (64 percent)
of such children were born to women in the bottom 20 percent of the
cognitive ability distribution. Ninety-five percent of them were born to
women in the bottom half.
Other Forms of Single Parenthood
The figure below shows the proportion of NLSY children born to a mar-
ried couple but living (in 1990) with just their mothers because of di-
vorce or separation. First, a caution: The profile we are about to present
Thirty-one percent of children living with divorced or separated mothers
had mothers with IQs in the bottom 20 percent of intelligence
Children of divorced or separated parents
Cumulative
(bars)
(line)
1st 2nd 3rd 4th 5th 6th 7th 8th 9th 10th
IQ Decile
IQ Decile
Cognitive Ability and Family Structure
- Statistical data from the NLSY suggests that divorce and separation are not equally distributed across cognitive levels, but are skewed toward the bottom half of the IQ distribution.
- The bottom 50 percent of the cognitive ability distribution accounts for 82 percent of all children living in single-parent homes as of 1990.
- Low-birth-weight babies are significantly more likely to be born to mothers with lower IQ scores, with 74 percent of such mothers falling in the bottom half of the distribution.
- Home environments characterized by low emotional support and cognitive stimulation are heavily concentrated among mothers in the bottom two IQ deciles.
- The correlation between low cognitive ability and poor home environments appears to strengthen as children grow older, particularly for those age six and above.
The prevailing notion that separation and divorce are so endemic that they affect everyone more or less equally is wrong as regards cognitive ability, at least in this age group.
380
The National Context
Social Behavior and the Prevalence of Low Cognitive Ability
381
may change in the future because so many of the expected divorces
among the NLSY sample have not yet occurred. For women who had
ever been married in the 25 to 33 age range as of 1990, we may, how-
ever, ask: Among their children who were living in mother-only fami-
lies as of 1990, what is the distribution of the mother's intelligence?
Divorced and separated mothers averaged an IQ of 93.14' More than
half of all children living with their divorced or separated mothers in
the NLSY were born to women in the bottom 30 percent of the IQ dis-
tribution. Seventy-six percent were born to women in the bottom half
of the distribution. Remember that there is no confounding with ille-
gitimacy; all children born out of wedlock are excluded from this sam-
ple. The prevailing notion that separation and divorce are so endemic
that they affect everyone more or less equally is wrong as regards cog-
nitive ability, at least in this age group.
Perhaps the differences will even out to some extent in the lung run.
Brighter women get married and have their children later. In the NLSY
sample, their marriages have had less time to break up than those for
women lower in the distribution. Only time will tell whether and how
much the distribution in the graph above will change in the years to
come. At this point, the skew is notable and clear.
Pulling together the data on illegitimacy and other forms of single
parenthood, here are a few key points:
Within the bottom two deciles of intelligence, illegitimacy is more
common than divorce or separation as the source of single
parenthood.
Beginning with the third decile, divorce and separation become
an equal or predominant source of single parenthood.
The bottom half of the cognitive ability distribution accounts for
82 percent of all children in single-parent homes (combining il-
legitimacy with divorce or separation) as of 1990.
Low-Birth-Weight Babies
Among whites, the chances of having a low-birth-weight baby were as-
sociated with IQ, not socioeconomic background, when both variables
were taken into account (Chapter 10). The prevalence of low-birth-
weight babies among women in the bottom half of the distribution per-
sists when the entire NLSY sample is considered (the figure below).
Forty-five percent of low-birth-weight babies had
mothers in the bottom 20 percent of intelligence
Low-birth-weight babies
(bars)
Cumulative
(line)
Isr 2nd 3rd 4th 5th 6th 7th 8th 9th 10th
IQ Decile
Mothers with low-birth-weight babies averaged an IQ of 89. Almost
three out of four (74 percent) mothers were in the bottom half of the
1Q distribution.
Deprived Home Environments
Chapter 10 discussed the HOME inventory, a measure combining many
indicators of both emotional support (for example, disciplinary style)
and cognitive stimulation (for example, reading to the child). Here, we
examine children whose HOME scores put them in the bottom 10 per-
cent of environments (using national norms for the HOME inventory).
The mean IQ of mothers of children in the worst home environments
was 86. Three out of eight had IQs below 81; 86 percent had IQs below
100. The figure below combines the results for children in all age groups.
There were some age differences, however: Generally, the concentra-
tion of the worst environments among mothers with low cognitive abil-
ity got worse as the children got older. For children ages 3 to 5 who were
in the worst home environments, 59 percent had mothers with IQs in
the bottom two deciles. For children 6 and older, the figure was 65 per-
cent.
382
The National Context
Social Behatior and the Prevaknce of Low Cognitive Ability
383
Fifty-six percent of all children from bottom decile in home environ-
ment were born to mothers in the bottom 20 percent of intelligence
Children in the worst home environments Cumulative
(bars)
(line)
IQ Decile
Children in Poverty
The proportion of children living in poverty is one of the most fre-
quently cited statistics in public policy debates and one of the most pow-
erful appeals to action. In considering what actions might be taken, and
what will and won't work, keep the following figure in mind. It shows
the distribution of maternal cognitive ability among children who spent
their first three years below the poverty line. Mothers whose children
lived in poverty throughout their first three years averaged an IQ of 84.
Forty-one percent had mothers in the very bottom decile in cognitive
ability. In all, 93 percent were born to women in the bottom half of the
IQ distribution. Of all the social problems examined in this chapter,
poverty among children is preeminently a problem associated with low
IQ-in
this case, low IQ among the mothers.
Developmental Problems Among Children
The prevalence of developmental problems among children is skewed
toward the lower half of the IQ distribution. Rather than present graphs
for each of them, the table below summarizes a consistent situation. See
Sixty-three percent of children who lived in poverty throughout the
first three years had mothers in the bottom 20 percent of intelligence
Children living in poverty for 1st 3 yrs.
Cumulative
(bars)
(line)
.
.
1st 2nd 3rd 4th 5th 6th 7th 8th 9th 10th
IQ Decile
Prevalence of Low IQ Among Mothers of
Children with Developmental Problems
Percentage of
These Children
Mean IQ
Children in the
with Mothers in
of
Worst Decile on:
Bottom:
Mothers
20%
50%
of IQ
of 1Q
Friendliness index,
12-23 mos.
49
82
88
Difficulty index,
12-23 mos.
40
7 1
91
Motor and social develop-
ment index, hirth-47 mos.
38
6 7
93
Behavioral problems index,
children ages 4-1 1 yrs.
42
7 8
90
Maternal Intelligence and Child Poverty
- The text argues that childhood poverty is fundamentally linked to low maternal cognitive ability, noting that mothers of children in long-term poverty averaged an IQ of 84.
- Data suggests that 93 percent of children living in poverty for their first three years were born to women in the bottom half of the IQ distribution.
- Developmental issues, including behavioral problems and motor development delays, are heavily concentrated among children whose mothers score in the lower IQ deciles.
- A child's own IQ is presented as the most significant indicator for future social adjustment, with 94 percent of low-IQ children having mothers with IQs under 100.
- The 'Middle Class Values Index' shows a different distribution, where those in the bottom half of cognitive ability contribute only 37 percent to the group meeting these social standards.
Of all the social problems examined in this chapter, poverty among children is preeminently a problem associated with low IQ-in this case, low IQ among the mothers.
382
The National Context
Social Behatior and the Prevaknce of Low Cognitive Ability
383
Fifty-six percent of all children from bottom decile in home environ-
ment were born to mothers in the bottom 20 percent of intelligence
Children in the worst home environments Cumulative
(bars)
(line)
IQ Decile
Children in Poverty
The proportion of children living in poverty is one of the most fre-
quently cited statistics in public policy debates and one of the most pow-
erful appeals to action. In considering what actions might be taken, and
what will and won't work, keep the following figure in mind. It shows
the distribution of maternal cognitive ability among children who spent
their first three years below the poverty line. Mothers whose children
lived in poverty throughout their first three years averaged an IQ of 84.
Forty-one percent had mothers in the very bottom decile in cognitive
ability. In all, 93 percent were born to women in the bottom half of the
IQ distribution. Of all the social problems examined in this chapter,
poverty among children is preeminently a problem associated with low
IQ-in
this case, low IQ among the mothers.
Developmental Problems Among Children
The prevalence of developmental problems among children is skewed
toward the lower half of the IQ distribution. Rather than present graphs
for each of them, the table below summarizes a consistent situation. See
Sixty-three percent of children who lived in poverty throughout the
first three years had mothers in the bottom 20 percent of intelligence
Children living in poverty for 1st 3 yrs.
Cumulative
(bars)
(line)
.
.
1st 2nd 3rd 4th 5th 6th 7th 8th 9th 10th
IQ Decile
Prevalence of Low IQ Among Mothers of
Children with Developmental Problems
Percentage of
These Children
Mean IQ
Children in the
with Mothers in
of
Worst Decile on:
Bottom:
Mothers
20%
50%
of IQ
of 1Q
Friendliness index,
12-23 mos.
49
82
88
Difficulty index,
12-23 mos.
40
7 1
91
Motor and social develop-
ment index, hirth-47 mos.
38
6 7
93
Behavioral problems index,
children ages 4-1 1 yrs.
42
7 8
90
384
The National Context
Social Behavior and the Prelvaknce of Low Co~itiue Ability
385
Chapter 10 for a description of the indexes. Low IQ is prevalent among
the mothers of children with each of these developmental problems, but
none shows as strong a concentration as the developmental indicator
we consider the most important for eventual social adjustment: the
child's own IQ. The figure helow is limited to the cognitive ability of
children ages 6 and older when they took the test.
Seventy-two percent of children in the bottom decile of IQ had
mothers in the bottom 20 percent of intelligence
CONCLUDING REMARKS
Let us conclude on a brighter note, after so unrelenting a tally of prob-
lems. You will recall from Chapter 12 that we developed a Middle Class
Values Index. To qualify for a score of "yes," an NLSY person had to be
married to his or her first spouse, in the labor force (if a man), bearing
children within wedlock (ifa woman), and never have been interviewed
in jail. How did the NLSY sample break down by IQ? The results are
set out in the figure.
Children in the bottom decile of IQ
Cumulative
(bars)
(line)
Ten percent of people scoring "yes" on the Middle Class Values
Index were in the bottom 20 percent of intelligence
IQ Decile
The mean IQ of mothers of children who scored in the bottom decile
of a childhood intelligence test was 81."' Overall, 94 percent of these
children had mothers with IQs under 100. The extreme concentration
of low IQ among the children of low-IQ mothers is no surprise. That it
is predictable does not make the future any brighter for these children.
People scoring "yes" on the MCV Index
Cumulative
(bars)
(line)
IQ Decile
The mean IQ of those who scored "yes" was 104. Those in the bot-
tom two deciles contributed only about 10 percent, half of their pro-
portional share. Those in the bottom half of the cognitive distrihution
contributed 37 percent. As in the case of year-round employment, the
skew toward those in the upper half of the cognitive ability distribution
is not extreme. This reminds us again more generally that most people
in the lower half of the cognitive distribution are employed, out of
poverty, not on welfare, married when they have their babies, provid-
ing a nurturing environment for their children, and obeying the law.
Cognitive Ability and Social Policy
- Most individuals in the lower half of the cognitive distribution are productive, law-abiding citizens who avoid poverty and welfare.
- Statistical analysis suggests that IQ often has a stronger independent impact on social outcomes than socioeconomic status does.
- A significant portion of the population involved in social policy issues, such as chronic unemployment or crime, possesses limited cognitive ability.
- Effective social solutions must be designed specifically for the target population's cognitive level, rather than relying on abstract calculations of self-interest.
- The authors argue that current educational and affirmative action policies must be re-evaluated through the lens of cognitive inequality.
- Future chapters will explore the 'spotty' record of environmental interventions and the potential costs of prioritizing group outcomes over individual equality.
Any program is going to fail unless it is designed for a target population half of which has IQs below 80.
384
The National Context
Social Behavior and the Prelvaknce of Low Co~itiue Ability
385
Chapter 10 for a description of the indexes. Low IQ is prevalent among
the mothers of children with each of these developmental problems, but
none shows as strong a concentration as the developmental indicator
we consider the most important for eventual social adjustment: the
child's own IQ. The figure helow is limited to the cognitive ability of
children ages 6 and older when they took the test.
Seventy-two percent of children in the bottom decile of IQ had
mothers in the bottom 20 percent of intelligence
CONCLUDING REMARKS
Let us conclude on a brighter note, after so unrelenting a tally of prob-
lems. You will recall from Chapter 12 that we developed a Middle Class
Values Index. To qualify for a score of "yes," an NLSY person had to be
married to his or her first spouse, in the labor force (if a man), bearing
children within wedlock (ifa woman), and never have been interviewed
in jail. How did the NLSY sample break down by IQ? The results are
set out in the figure.
Children in the bottom decile of IQ
Cumulative
(bars)
(line)
Ten percent of people scoring "yes" on the Middle Class Values
Index were in the bottom 20 percent of intelligence
IQ Decile
The mean IQ of mothers of children who scored in the bottom decile
of a childhood intelligence test was 81."' Overall, 94 percent of these
children had mothers with IQs under 100. The extreme concentration
of low IQ among the children of low-IQ mothers is no surprise. That it
is predictable does not make the future any brighter for these children.
People scoring "yes" on the MCV Index
Cumulative
(bars)
(line)
IQ Decile
The mean IQ of those who scored "yes" was 104. Those in the bot-
tom two deciles contributed only about 10 percent, half of their pro-
portional share. Those in the bottom half of the cognitive distrihution
contributed 37 percent. As in the case of year-round employment, the
skew toward those in the upper half of the cognitive ability distribution
is not extreme. This reminds us again more generally that most people
in the lower half of the cognitive distribution are employed, out of
poverty, not on welfare, married when they have their babies, provid-
ing a nurturing environment for their children, and obeying the law.
386
The National Context
We must add another reminder, however. There is a natural tendency
to review these figures and conclude that we are really looking at the
consequences of social and economic disadvantage, not intelligence.
But in Part 11, we showed that for virtually all of the indicators reviewed
in this chapter, controlling for socioeconomic status does not get rid of
the independent impact of IQ. On the contrary, controlling for IQ of-
ten gets rid of the independent impact of socioeconomic status. We have
not tried to present the replications of those analyses for all ethnic
groups combined, but they tell the same story.
The lesson of this chapter is that large proportions of the people who
exhibit the behaviors and problems that dominate the nation's social
policy agenda have limited cognitive ability. Often they are near the de-
finition for mental retardation (though the NLSY sample screened out
people who fit the clinical definition of retarded). When the nation
seeks to lower unemployment or lower the crime rate or induce welfare
mothers to get jobs, the solutions must be judged by their effectiveness
with the people most likely to exhibit the problem: the least intelligent
people. And with that, we reach the practical questions of policy that
will occupy us for the rest of the book.
PART IV
Living Together
Our analysis provides few clear and decisive solutions to the major do-
mestic issues of the day. But, at the same time, there is no major do-
mestic issue for which the news we bring is irrelevant.
Do we want to persuade poor single teenagers not to have babies? The
knowledge that 95 percent of poor teenage women who have babies are
also below average in intelligence should prompt skepticism about
strategies that rely on abstract and far-sighted calculations of self-inter-
est. Do we favor job training programs for chronically unemployed men?
Any program is going to fail unless it is designed for a target population
half of which has IQs below 80. Do we wish to reduce income inequal-
ity? If so, we need to understand how the market for cognitive ability
drives the process. Do we aspire to a "world class" educational system
for America? Before deciding what is wrong with the current system, we
had better think hard about how cognitive ability and education are
linked. Part IV tries to lay out some of these connections.
Chapter 17 summarizes what we know about direct efforts to increase
cognitive ability by altering the social and physical environment in
which people develop and live. Such efforts may succeed eventually, but
so far the record is spotty.
Chapter 18 reviews the American educational experience of the past
few decades. It has been more successful with the average and below-
average student than many people think, we conclude, but has ne-
glected the gifted minority who will greatly affect how well America
does in the twenty-first century.
In Chapters 19 and 20, the focus shifts to affirmative action policies
in education and in the workplace. Our society has dedicated itself to
coping with a particular sort of inequality, trying to equalize outcomes
for various groups. The country has retreated from older principles of
individual equality before the law and has adopted policies that treat
people as members of groups. Our contribution (we hope) is to calibrate
388
Living Together
the policy choices associated with affirmative action, to make costs and
benefits clearer than they usually are.
The final two chapters look to the future. In Chapter 2 1, we sound a
tocsin. Predictions are always chancy, and ours are especially glum, but
we think that cognitive stratification may be taking the country down
dangerous paths. Chapter 22 follows up with our conception of a liberal
and just society, in light of the story that the rest of the book has told.
The result is a personal statement of how we believe America can face
up to inequality in the 2 1st century and remain uniquely America.
Chapter 17
Raising Cognitive Ability
Kaising intelligence significantly, consistently, and affordably would circum-
vent many of the problems that we have described. Furthermore, the needed
environmental improvements-better nutrition, stimulating environments for
preschool children, good schools thereafter-seem obvious. But raising intel-
ligence is not easy.
Nutrition may offer one of the more promising approaches. Height and
weight have increased markedly with better nutrition. The rising IQs in many
countries suggest that better nutrition may be increasing intelligence too. Con-
trolled studies have made some progress in uncoveringa link between improved
nutrition and elevated cognitive ability a$ well, but it remains unproved and
not well understood.
Formal schooling offers little hope of narrowing cognitive inequality on a
large scale in developed countries, because so much of its potential contibu-
tion h a already been realized with the advent of universal twelve-year sys-
tems. Special program to improve intelligence within the school have had
minor and probably temporary effects on intelligence. There is more to be
gained from educational research to find new methods of instruction than from
more interventions of the type already tried.
Preschool ha.$ borne many of the recent hopes for improving intelligence.
However, Head Start, the largest popam, does not improve cognitive func-
tioning. More intensive, hence more costly, preschool programs may raise in-
telligence, but both the size and the reality of the improvements are in dispute.
The one intervention that works consistently is adoption at birthji-oma bad
family environment to a good one. The average gains in childhood IQ associ-
ated with adoption are in the region of six point.-not spectacular but not neg-
ligible either.
Taken together, the story of attempts to raise intelligence is one of high
hopes, jikmboyant claim, and disappointing results. For the foreseeable fu-
ture, the problems of low cognitive ability are not going to be solved by out-
s& interventions to make children smarter.
Raising Cognitive Ability
- The authors explore whether cognitive stratification can be mitigated by raising intelligence through environmental interventions.
- Nutrition shows promise as a factor in rising IQ scores, but the link remains unproven and poorly understood in controlled studies.
- Formal schooling and traditional interventions like Head Start have shown minor or temporary effects on cognitive functioning.
- Intensive preschool programs and adoption from poor to stable environments show some consistent gains, though results are often disputed or modest.
- Despite the theoretical potential for environmental influence, the history of raising intelligence is characterized by flamboyant claims and disappointing results.
- The text suggests that social problems are concentrated at the bottom of the cognitive distribution, making IQ increases a desirable but difficult goal.
Taken together, the story of attempts to raise intelligence is one of high hopes, flamboyant claims, and disappointing results.
388
Living Together
the policy choices associated with affirmative action, to make costs and
benefits clearer than they usually are.
The final two chapters look to the future. In Chapter 2 1, we sound a
tocsin. Predictions are always chancy, and ours are especially glum, but
we think that cognitive stratification may be taking the country down
dangerous paths. Chapter 22 follows up with our conception of a liberal
and just society, in light of the story that the rest of the book has told.
The result is a personal statement of how we believe America can face
up to inequality in the 2 1st century and remain uniquely America.
Chapter 17
Raising Cognitive Ability
Kaising intelligence significantly, consistently, and affordably would circum-
vent many of the problems that we have described. Furthermore, the needed
environmental improvements-better nutrition, stimulating environments for
preschool children, good schools thereafter-seem obvious. But raising intel-
ligence is not easy.
Nutrition may offer one of the more promising approaches. Height and
weight have increased markedly with better nutrition. The rising IQs in many
countries suggest that better nutrition may be increasing intelligence too. Con-
trolled studies have made some progress in uncoveringa link between improved
nutrition and elevated cognitive ability a$ well, but it remains unproved and
not well understood.
Formal schooling offers little hope of narrowing cognitive inequality on a
large scale in developed countries, because so much of its potential contibu-
tion h a already been realized with the advent of universal twelve-year sys-
tems. Special program to improve intelligence within the school have had
minor and probably temporary effects on intelligence. There is more to be
gained from educational research to find new methods of instruction than from
more interventions of the type already tried.
Preschool ha.$ borne many of the recent hopes for improving intelligence.
However, Head Start, the largest popam, does not improve cognitive func-
tioning. More intensive, hence more costly, preschool programs may raise in-
telligence, but both the size and the reality of the improvements are in dispute.
The one intervention that works consistently is adoption at birthji-oma bad
family environment to a good one. The average gains in childhood IQ associ-
ated with adoption are in the region of six point.-not spectacular but not neg-
ligible either.
Taken together, the story of attempts to raise intelligence is one of high
hopes, jikmboyant claim, and disappointing results. For the foreseeable fu-
ture, the problems of low cognitive ability are not going to be solved by out-
s& interventions to make children smarter.
390
Living Together
Raising Cognitive Ability
39 1
an people become smarter if they are given the right kind of help?
CI f raising intelligence is ~ossible, then the material in Parts I1 and
111 constitutes a clarion call for programs to do so. Social problems are
highly concentrated among people at the bottom of the cognitive dis-
tribution; those problems become much less prevalent as IQ increases
even modestly; and the history of increases in IQ suggests that they oc-
cur most readily at the bottom of the distribution. Why not mount a
major national effort to produce such increases? It does not appear on
its face to be an impossible task, Even the highest estimates of heri-
tability leave 20 to 30 percent of cognitive ability to be shaped by the
environment. Some researchers continue to argue that the right pro-
portion is 50 to 60 percent. In either case, eliminating the disadvan-
tages that afflict people in poor surroundings should increase their
cognitive functioning.ll'
Upon first consideration, the ways to eliminate those disadvantages
seem obvious. Many children of low-income parents grow up in terrible
home environments, with little stimulation or nurturing. Surely, it
would seem, intelligence would rise if these children were placed in day
care environments where professionals provided that stimulation and
nurturing. Schools in poor neighborhoods are often run down and
chaotic. Isn't it clear that increasing the investment in schools would
pay off in higher scores?
Limitless possibilities for improving intelligence environmentally
wait to be uncovered by science: improved educational methods, diets,
treatments for disease, prenatal care, educational media, and even med-
icines to make one smarter. In principle, intelligence can be raised en-
vironmentally to unknown limits.
Yet the more one knows about the evidence, the harder it is to be
optimistic about prospects in the near future for raising the scores of
the people who are most disadvantaged by their low scores. For one
thing, it is hard to find new ways to use existing resources that are not
already being done. The nurturing of the young-including
the cog-
nitive nurturing-is
one of the central purposes of human society.
That, after all, is what families mainly do. Very high proportions of
children already get prenatal care, nutrition, home environments, and
classroom environments that are good enough to leave little room for
measurable improvement. The grim stories about childhood depriva-
tion involve a small proportion of children. And when it comes to
helping that small proportion of children, the results seldom approach
expectations. We may be deeply and properly dissatisfied with the nur-
turing of American intelligence, but finding solutions that are afford-
able, politically tolerable, and not already being tried is another matter
altogether.
In this chapter, we move through a succession of topics. First we con-
sider the effects of nutrition. We then discuss a sequence of successively
more targeted, intense social interventions: education in general,
preschool interventions, intensive support for children at risk for retar-
dation, and the most extreme form of social intervention, adoption at
birth. We close with our thoughts on what society's experiences with
these interventions should mean for policy in the future.
NUTRITION
Most of us have been urged by a parent or grandparent to eat the "brain
food," which seemed invariably to be the most unpalatable thing on the
table. This idea of a connection between diet and intelligence has an
ancient history going back to mew sum in corpora sano.12' In the twen-
tieth century, the plausibility of a connection has been reinforced by the
fact that people in affluent countries are larger than their ancestors
were, presumably in part because they are eating better. IQ scores, too,
have been rising during approximately the same period-the
Flynn
effect described in Chapter 13. These coincident changes do not prove
that better eating makes for smarter people, but count as circumstantial
evidence.
For a while, however, scientific research seemed to have weakened
the case for any link between nutrition and IQ. The most damaging
blow was a study of over 100,000 Dutch men who were born around a
time of intense famine in several Dutch cities near the end of World
War I I . ~ Nineteen years later, the men took intelligence tests as part of
the qualification for national military service, and it occurred to schol-
ars to compare the ones who were born in the depths of the famine to
those born just before and just after it. Many pregnant women miscar-
ried during the famine, but their surviving sons scored no lower in in-
telligence than the men born to mothers who had little or no exposure
to famine. But as important as this study was, some scientists were not
entirely convinced by its negative findings. The Dutch famine was rel-
atively brief-three
months or so-and
limited to the pre- and perina-
tal period of the men's lives. And while the mothers were indeed
Raising Cognitive Ability
- Environmental factors like education, diet, and prenatal care offer theoretical possibilities for raising intelligence to unknown limits.
- Despite theoretical potential, existing social resources are already so well-utilized that finding new, effective interventions is difficult.
- Most children in affluent societies already receive nutrition and nurturing that leave little room for measurable cognitive improvement.
- The historical rise in both physical stature and IQ scores (the Flynn effect) provides circumstantial evidence for a link between nutrition and intelligence.
- A famous study of the Dutch famine suggested that brief prenatal starvation did not lower the IQ of surviving sons, though critics question its brevity.
- The text outlines a progression of interventions to be examined, ranging from nutrition and general education to intensive preschooling and adoption.
The nurturing of the young-including the cognitive nurturing-is one of the central purposes of human society. That, after all, is what families mainly do.
390
Living Together
Raising Cognitive Ability
39 1
an people become smarter if they are given the right kind of help?
CI f raising intelligence is ~ossible, then the material in Parts I1 and
111 constitutes a clarion call for programs to do so. Social problems are
highly concentrated among people at the bottom of the cognitive dis-
tribution; those problems become much less prevalent as IQ increases
even modestly; and the history of increases in IQ suggests that they oc-
cur most readily at the bottom of the distribution. Why not mount a
major national effort to produce such increases? It does not appear on
its face to be an impossible task, Even the highest estimates of heri-
tability leave 20 to 30 percent of cognitive ability to be shaped by the
environment. Some researchers continue to argue that the right pro-
portion is 50 to 60 percent. In either case, eliminating the disadvan-
tages that afflict people in poor surroundings should increase their
cognitive functioning.ll'
Upon first consideration, the ways to eliminate those disadvantages
seem obvious. Many children of low-income parents grow up in terrible
home environments, with little stimulation or nurturing. Surely, it
would seem, intelligence would rise if these children were placed in day
care environments where professionals provided that stimulation and
nurturing. Schools in poor neighborhoods are often run down and
chaotic. Isn't it clear that increasing the investment in schools would
pay off in higher scores?
Limitless possibilities for improving intelligence environmentally
wait to be uncovered by science: improved educational methods, diets,
treatments for disease, prenatal care, educational media, and even med-
icines to make one smarter. In principle, intelligence can be raised en-
vironmentally to unknown limits.
Yet the more one knows about the evidence, the harder it is to be
optimistic about prospects in the near future for raising the scores of
the people who are most disadvantaged by their low scores. For one
thing, it is hard to find new ways to use existing resources that are not
already being done. The nurturing of the young-including
the cog-
nitive nurturing-is
one of the central purposes of human society.
That, after all, is what families mainly do. Very high proportions of
children already get prenatal care, nutrition, home environments, and
classroom environments that are good enough to leave little room for
measurable improvement. The grim stories about childhood depriva-
tion involve a small proportion of children. And when it comes to
helping that small proportion of children, the results seldom approach
expectations. We may be deeply and properly dissatisfied with the nur-
turing of American intelligence, but finding solutions that are afford-
able, politically tolerable, and not already being tried is another matter
altogether.
In this chapter, we move through a succession of topics. First we con-
sider the effects of nutrition. We then discuss a sequence of successively
more targeted, intense social interventions: education in general,
preschool interventions, intensive support for children at risk for retar-
dation, and the most extreme form of social intervention, adoption at
birth. We close with our thoughts on what society's experiences with
these interventions should mean for policy in the future.
NUTRITION
Most of us have been urged by a parent or grandparent to eat the "brain
food," which seemed invariably to be the most unpalatable thing on the
table. This idea of a connection between diet and intelligence has an
ancient history going back to mew sum in corpora sano.12' In the twen-
tieth century, the plausibility of a connection has been reinforced by the
fact that people in affluent countries are larger than their ancestors
were, presumably in part because they are eating better. IQ scores, too,
have been rising during approximately the same period-the
Flynn
effect described in Chapter 13. These coincident changes do not prove
that better eating makes for smarter people, but count as circumstantial
evidence.
For a while, however, scientific research seemed to have weakened
the case for any link between nutrition and IQ. The most damaging
blow was a study of over 100,000 Dutch men who were born around a
time of intense famine in several Dutch cities near the end of World
War I I . ~ Nineteen years later, the men took intelligence tests as part of
the qualification for national military service, and it occurred to schol-
ars to compare the ones who were born in the depths of the famine to
those born just before and just after it. Many pregnant women miscar-
ried during the famine, but their surviving sons scored no lower in in-
telligence than the men born to mothers who had little or no exposure
to famine. But as important as this study was, some scientists were not
entirely convinced by its negative findings. The Dutch famine was rel-
atively brief-three
months or so-and
limited to the pre- and perina-
tal period of the men's lives. And while the mothers were indeed
392
Living Together
Raising Cognitive Ability
393
-- -
starving for calories, their deficiencies in vitamins, minerals, and other
dietary elements were perhaps too brief to take a toll.4
Another approach to the impact of nutrition on cognitive ability is
to see whether enriched diets can raise scores. A breakthrough study
done in Great Britain in the late 1980s concluded that the answer was
yes.5 David Benton and Gwilym Roberts gave a sample of thirty Welsh
12- to 13-year-old children vitamin and mineral supplements for eight
months and compared their test scores with an equal number of their
schoolmates getting nonnutritive placebos. The Welsh children were
not known to be malnourished, but those getting the supplement gained
eight points more in their nonverbal intelligence test scores than those
getting the placebo, a large and statistically significant improvement.
Verbal scores showed no differential improvement.'6'
A recent American confirmation of the Welsh results gave over 600
eighth and tenth graders in several California schools daily pills for thir-
teen weeks.7 The pills contained either half the recommended daily al-
lowances (RDA) of a wide assortment of vitamins and minerals,
precisely the RDA, twice the RDA, or a placebo. The vitamin and min-
eral supplement raised scores on most of the nonverbal subtests of a stan-
dard intelligence test.''' The verbal intelligence test scores again failed
to register any benefit, but that is consistent with the Flynn effect: The
rising average intelligence scores of nations seem primarily to be on non-
verbal tests.
The net average benefit for pills providing one RDA was about four
points in nonverbal intelligence in the California study. But this aver-
age gain comprised many youngsters who did not benefit at all, mixed
with some whose gains exceeded fifteen points. The children who did
not benefit were presumably already getting the vitamins and minerals
they needed for developing their nonverbal scores in their regular diets.
But this is just a hypothesis at present. It remains to be shown whether
the gain from vitamins or minerals can be associated with preexisting
food deficiencies, let alone which particular dietary ingredients, in what
amounts, produce the gains.19' Youngsters getting exactly the RDA had
the largest gain in scores; those taking either more or less of the sup-
plement benefited less, if at
This is not only puzzling but worri-
some. Could it mean that excessive dosages of vitamins and/or minerals
harm intellectual functioning? There is no evidence that it does, but at
the least, it reinforces the prudence of doing more research before go-
ing overboard for vitamin and mineral supplements.
Other Physiological Influences on IQ. Or Are They? Two Further
Examples
The physiological environment seems to be associated with IQ in other
ways. For example, some studies (hut not all) have found a small decline
in IQ of each successive child horn to a given woman, even after holding
overall family size constant.'121
Is this a matter of the social environment
within the family, which changes as new children enter it, or the physio-
logical environment in the uterus, which is both older on average and has
a longer history of childbirth with each successive pregnancy? The answer
is unclear, and hoth views have been advanced. Rut, whichever it is, this
would he a genuine environmental effect on intelligence, since the rolls of
the genetic dice for the successive offspring of a given mother and father
are independent as far as anyone knows.
Another environmental and possibly physiological influence on IQ is
suggested by data from twins. Among identical twins, the one with the
higher IQ is likely to have been heavier at birth." This is part of a more
general finding that higher weights at hirth are associated with higher IQs
in childhood, hut the iclentical twin data decisively prove that the corre-
lation hetween hirth weight and later intelligence has an environmental
element, since identical twins are genetic clone^.'^ It is less certain that
there are no social factors here: People may treat twin babies differently if
one is plumper than the other. Training mothers in how to be more atten-
tive to their low-birth-weight bahies seems, in fact, to raise later IQ, at least
up to the age of 7.'I5l
This caution is reinforced by the inconsistency of the nutritional ef-
fect on IQ. Many studies that seem to be well-conducted variations of
the successf~ll ones have failed to demonstrate any effect on IQ at all."
The reasonable middle ground at this point is to conclude that provid-
ing children with the recommended daily allowance of vitamins is a
good idea for many reasons and might also have a helpful effect on IQ.
RAISING IQ THROUGH BETTER EDUCATION
The almost reflexive reaction of most people when they hear about the
below-average test scores among children in the bottom of the socioe-
conomic distribution is that of course they have low scores because they
have gotten poor educations. Improve the schools, it is assumed, and
the scores will rise.
Physiological Impacts on Intelligence
- Studies in Wales and California indicate that vitamin and mineral supplements can significantly raise nonverbal intelligence scores in schoolchildren.
- The observed cognitive gains are consistent with the Flynn effect, which shows rising national intelligence averages primarily in nonverbal rather than verbal domains.
- The benefits of supplementation appear most pronounced in children who may have preexisting dietary deficiencies, with some gaining over fifteen points.
- Research suggests a 'Goldilocks' effect where exactly the recommended daily allowance (RDA) yields the highest gains, while excessive dosages may be less effective.
- Beyond nutrition, birth order and birth weight are identified as environmental or physiological factors that correlate with IQ scores among siblings and identical twins.
The children who did not benefit were presumably already getting the vitamins and minerals they needed for developing their nonverbal scores in their regular diets.
392
Living Together
Raising Cognitive Ability
393
-- -
starving for calories, their deficiencies in vitamins, minerals, and other
dietary elements were perhaps too brief to take a toll.4
Another approach to the impact of nutrition on cognitive ability is
to see whether enriched diets can raise scores. A breakthrough study
done in Great Britain in the late 1980s concluded that the answer was
yes.5 David Benton and Gwilym Roberts gave a sample of thirty Welsh
12- to 13-year-old children vitamin and mineral supplements for eight
months and compared their test scores with an equal number of their
schoolmates getting nonnutritive placebos. The Welsh children were
not known to be malnourished, but those getting the supplement gained
eight points more in their nonverbal intelligence test scores than those
getting the placebo, a large and statistically significant improvement.
Verbal scores showed no differential improvement.'6'
A recent American confirmation of the Welsh results gave over 600
eighth and tenth graders in several California schools daily pills for thir-
teen weeks.7 The pills contained either half the recommended daily al-
lowances (RDA) of a wide assortment of vitamins and minerals,
precisely the RDA, twice the RDA, or a placebo. The vitamin and min-
eral supplement raised scores on most of the nonverbal subtests of a stan-
dard intelligence test.''' The verbal intelligence test scores again failed
to register any benefit, but that is consistent with the Flynn effect: The
rising average intelligence scores of nations seem primarily to be on non-
verbal tests.
The net average benefit for pills providing one RDA was about four
points in nonverbal intelligence in the California study. But this aver-
age gain comprised many youngsters who did not benefit at all, mixed
with some whose gains exceeded fifteen points. The children who did
not benefit were presumably already getting the vitamins and minerals
they needed for developing their nonverbal scores in their regular diets.
But this is just a hypothesis at present. It remains to be shown whether
the gain from vitamins or minerals can be associated with preexisting
food deficiencies, let alone which particular dietary ingredients, in what
amounts, produce the gains.19' Youngsters getting exactly the RDA had
the largest gain in scores; those taking either more or less of the sup-
plement benefited less, if at
This is not only puzzling but worri-
some. Could it mean that excessive dosages of vitamins and/or minerals
harm intellectual functioning? There is no evidence that it does, but at
the least, it reinforces the prudence of doing more research before go-
ing overboard for vitamin and mineral supplements.
Other Physiological Influences on IQ. Or Are They? Two Further
Examples
The physiological environment seems to be associated with IQ in other
ways. For example, some studies (hut not all) have found a small decline
in IQ of each successive child horn to a given woman, even after holding
overall family size constant.'121
Is this a matter of the social environment
within the family, which changes as new children enter it, or the physio-
logical environment in the uterus, which is both older on average and has
a longer history of childbirth with each successive pregnancy? The answer
is unclear, and hoth views have been advanced. Rut, whichever it is, this
would he a genuine environmental effect on intelligence, since the rolls of
the genetic dice for the successive offspring of a given mother and father
are independent as far as anyone knows.
Another environmental and possibly physiological influence on IQ is
suggested by data from twins. Among identical twins, the one with the
higher IQ is likely to have been heavier at birth." This is part of a more
general finding that higher weights at hirth are associated with higher IQs
in childhood, hut the iclentical twin data decisively prove that the corre-
lation hetween hirth weight and later intelligence has an environmental
element, since identical twins are genetic clone^.'^ It is less certain that
there are no social factors here: People may treat twin babies differently if
one is plumper than the other. Training mothers in how to be more atten-
tive to their low-birth-weight bahies seems, in fact, to raise later IQ, at least
up to the age of 7.'I5l
This caution is reinforced by the inconsistency of the nutritional ef-
fect on IQ. Many studies that seem to be well-conducted variations of
the successf~ll ones have failed to demonstrate any effect on IQ at all."
The reasonable middle ground at this point is to conclude that provid-
ing children with the recommended daily allowance of vitamins is a
good idea for many reasons and might also have a helpful effect on IQ.
RAISING IQ THROUGH BETTER EDUCATION
The almost reflexive reaction of most people when they hear about the
below-average test scores among children in the bottom of the socioe-
conomic distribution is that of course they have low scores because they
have gotten poor educations. Improve the schools, it is assumed, and
the scores will rise.
Education and Cognitive Gaps
- Nutritional interventions show inconsistent effects on IQ, suggesting that while vitamins are beneficial, they are not a guaranteed cognitive fix.
- A common assumption is that improving school quality will automatically close the cognitive gap between socioeconomic classes.
- Educational improvements often inadvertently widen the gap between high and low performers through 'aptitude-treatment interactions.'
- Interventions like 'Sesame Street' and computer-assisted learning have been shown to benefit top students more than those at the bottom.
- Large-scale studies, including the Coleman Report, indicate that objective school quality variables have a smaller impact on IQ than popularly believed.
- While school quality matters for many life outcomes, its specific power to raise IQ scores is surprisingly limited.
The performance of those at the bottom might improve, but they could end up even further behind their brighter classmates.
392
Living Together
Raising Cognitive Ability
393
-- -
starving for calories, their deficiencies in vitamins, minerals, and other
dietary elements were perhaps too brief to take a toll.4
Another approach to the impact of nutrition on cognitive ability is
to see whether enriched diets can raise scores. A breakthrough study
done in Great Britain in the late 1980s concluded that the answer was
yes.5 David Benton and Gwilym Roberts gave a sample of thirty Welsh
12- to 13-year-old children vitamin and mineral supplements for eight
months and compared their test scores with an equal number of their
schoolmates getting nonnutritive placebos. The Welsh children were
not known to be malnourished, but those getting the supplement gained
eight points more in their nonverbal intelligence test scores than those
getting the placebo, a large and statistically significant improvement.
Verbal scores showed no differential improvement.'6'
A recent American confirmation of the Welsh results gave over 600
eighth and tenth graders in several California schools daily pills for thir-
teen weeks.7 The pills contained either half the recommended daily al-
lowances (RDA) of a wide assortment of vitamins and minerals,
precisely the RDA, twice the RDA, or a placebo. The vitamin and min-
eral supplement raised scores on most of the nonverbal subtests of a stan-
dard intelligence test.''' The verbal intelligence test scores again failed
to register any benefit, but that is consistent with the Flynn effect: The
rising average intelligence scores of nations seem primarily to be on non-
verbal tests.
The net average benefit for pills providing one RDA was about four
points in nonverbal intelligence in the California study. But this aver-
age gain comprised many youngsters who did not benefit at all, mixed
with some whose gains exceeded fifteen points. The children who did
not benefit were presumably already getting the vitamins and minerals
they needed for developing their nonverbal scores in their regular diets.
But this is just a hypothesis at present. It remains to be shown whether
the gain from vitamins or minerals can be associated with preexisting
food deficiencies, let alone which particular dietary ingredients, in what
amounts, produce the gains.19' Youngsters getting exactly the RDA had
the largest gain in scores; those taking either more or less of the sup-
plement benefited less, if at
This is not only puzzling but worri-
some. Could it mean that excessive dosages of vitamins and/or minerals
harm intellectual functioning? There is no evidence that it does, but at
the least, it reinforces the prudence of doing more research before go-
ing overboard for vitamin and mineral supplements.
Other Physiological Influences on IQ. Or Are They? Two Further
Examples
The physiological environment seems to be associated with IQ in other
ways. For example, some studies (hut not all) have found a small decline
in IQ of each successive child horn to a given woman, even after holding
overall family size constant.'121
Is this a matter of the social environment
within the family, which changes as new children enter it, or the physio-
logical environment in the uterus, which is both older on average and has
a longer history of childbirth with each successive pregnancy? The answer
is unclear, and hoth views have been advanced. Rut, whichever it is, this
would he a genuine environmental effect on intelligence, since the rolls of
the genetic dice for the successive offspring of a given mother and father
are independent as far as anyone knows.
Another environmental and possibly physiological influence on IQ is
suggested by data from twins. Among identical twins, the one with the
higher IQ is likely to have been heavier at birth." This is part of a more
general finding that higher weights at hirth are associated with higher IQs
in childhood, hut the iclentical twin data decisively prove that the corre-
lation hetween hirth weight and later intelligence has an environmental
element, since identical twins are genetic clone^.'^ It is less certain that
there are no social factors here: People may treat twin babies differently if
one is plumper than the other. Training mothers in how to be more atten-
tive to their low-birth-weight bahies seems, in fact, to raise later IQ, at least
up to the age of 7.'I5l
This caution is reinforced by the inconsistency of the nutritional ef-
fect on IQ. Many studies that seem to be well-conducted variations of
the successf~ll ones have failed to demonstrate any effect on IQ at all."
The reasonable middle ground at this point is to conclude that provid-
ing children with the recommended daily allowance of vitamins is a
good idea for many reasons and might also have a helpful effect on IQ.
RAISING IQ THROUGH BETTER EDUCATION
The almost reflexive reaction of most people when they hear about the
below-average test scores among children in the bottom of the socioe-
conomic distribution is that of course they have low scores because they
have gotten poor educations. Improve the schools, it is assumed, and
the scores will rise.
394
Living Together
Raising Cognitive Ability
395
There are a number of problems with this assumption. One basic er-
ror is to assume that new educational opportunities that successfully
raise the average will also reduce differences in cognitive ability. Con-
sider trying to raise the cognitive level by putting a public library in a
community that does not have one. Adding the library could increase
the average intellectual level, but it may also spread out the range of
scores by adding points to the IQs of the library users, who are likely to
have been at the upper end of the distribution to begin with. The liter-
ature on such "aptitude-treatment interactions" is large and complex.'"
For example, providing computer assistance to a group of elementary
school children learning arithmetic increased the gap between good and
bad students;" a similar effeclt was observed when computers were used
to teach reading;'' the educational television program, "Sesame Street"
increased the gap in academic performances between children from
high- and low-status homes.I9 These results do not mean that such in-
terventions are useless for the students at the bottom, but one must be
careful to understand what is and is not being improved: The perfor-
mance of those at the bottom might improve, but they could end up
even further behind their brighter classmates.
A second broad difficulty with relying on improvements in educa-
tion is that although they make some difference in IQ, the size of the
effect is small. This conclusion is supported by evidence from both nat-
ural variation in education and planned educational experiments.
Looking at Natural Variation
Parents buying new houses often pick the neighborhood according to
the reputation of the local schools. Affluent parents may spend tens of
thousands of dollars to put their children through private schools. Tell
parents that the quality of the schools doesn't matter, and they will
unanimously, and rightly, ignore you, for differences in schools do mat-
ter in many important ways. But in affecting IQ, they do not matter
nearly as much as most people think.
This conclusion was first and most famously reached by a study that
was expected to demonstrate just the opposite. The study arose out of a
mandate of the Civil Rights Act of 1964 to examine how minority
groups are affected by educational inequalities. The result was a huge
national survey, with a sample that eventually numbered 645,000 stu-
dents, led by the eminent sociologist James S. Coleman. His researchers
measured school quality by such objective variables as credentials of the
teachers, educational expenditures per pupil, and the age and quality of
school facilities.
Because the schools that most minority children attended were mea-
surably subpar in facilities and staff, it was assumed that the minority
children fortunate enough to attend better schools would also show im-
proved cognitive functioning. But the report, issued in July 1966, an-
nounced that it had failed to find any benefit to the cognitive abilities
of children in public primary or secondary schools that could be cred-
ited to better school
The usual ways in which schools tried to
improve their effectiveness were not likely to reduce the cognitive dif-
ferences among individual children or those between ethnic groups.
The Coleman report's gloomy conclusions were moderated in subse-
quent analyses that found some evidence for marginal benefits of school
quality on intellectual de~eloprnent.'~'~
Coleman himself later con-
cluded that parochial schools generally do a better job ofdeveloping the
cognitive abilities of their students than public schools, which pointed
to at least some factor in schooling that might be exploited to improve
intelligen~e.~'
Yet the basic conclusion of the report has stood the test
of time and criticism: Variations in teacher credentials, per pupil ex-
penditures, and the other objective factors in public schools do not ac-
count for much of the variation in the cognitive abilities of American
school children.12"
The several hundred thousand children assessed in the Coleman
study had not been subjects in educational experiments. They were just
students in several thousand local schools. The schools varied in qual-
ity, as they inevitably
Some schools, usually in prosperous urban
or suburban districts, got (and still get) more money, more teachers with
better qualifications, newer school buildings, and the like. Poorer or
rural districts usually made (and make) do with less. The Coleman re-
port, in other words, is one of a species of educational research that draws
on natural variation-variation
that is occurring spontaneously rather
than by design.
Looking at the effects of natural variation has advantages as a re-
search strategy, One is that this kind of research does not require new
investments of time and money to intervene in schools. The interven-
ing has already been done at someone else's expense. The disadvantage
of such studies is that the variation is often narrow-an
example of the
restriction of range problem that we described in Part I. If almost all
classes have, say, between twenty-five and thirty-five children in them,
The Coleman Report Findings
- The 1966 Coleman report found that objective factors like school funding and teacher credentials had little impact on cognitive differences.
- Subsequent analyses suggested that parochial schools might be more effective than public schools at developing student intelligence.
- The study relied on natural variation within the existing school system rather than controlled experimental interventions.
- Researchers argue that by 1964, American schools had achieved enough equalization that further 'bricks-and-mortar' improvements yielded diminishing returns.
- While formal schooling itself is essential for raising IQ scores, the variation in the amount of schooling in modern countries is often too narrow to explain cognitive gaps.
- The report implies that traditional educational reforms focused on expenditures are unlikely to reduce cognitive disparities between ethnic or socioeconomic groups.
The Coleman report did not prove that educational reform is always futile, but that, on the whole, America had already achieved enough objective equalization in its schools by 1964 so that it was hard to pick up any effects of unequal school quality.
394
Living Together
Raising Cognitive Ability
395
There are a number of problems with this assumption. One basic er-
ror is to assume that new educational opportunities that successfully
raise the average will also reduce differences in cognitive ability. Con-
sider trying to raise the cognitive level by putting a public library in a
community that does not have one. Adding the library could increase
the average intellectual level, but it may also spread out the range of
scores by adding points to the IQs of the library users, who are likely to
have been at the upper end of the distribution to begin with. The liter-
ature on such "aptitude-treatment interactions" is large and complex.'"
For example, providing computer assistance to a group of elementary
school children learning arithmetic increased the gap between good and
bad students;" a similar effeclt was observed when computers were used
to teach reading;'' the educational television program, "Sesame Street"
increased the gap in academic performances between children from
high- and low-status homes.I9 These results do not mean that such in-
terventions are useless for the students at the bottom, but one must be
careful to understand what is and is not being improved: The perfor-
mance of those at the bottom might improve, but they could end up
even further behind their brighter classmates.
A second broad difficulty with relying on improvements in educa-
tion is that although they make some difference in IQ, the size of the
effect is small. This conclusion is supported by evidence from both nat-
ural variation in education and planned educational experiments.
Looking at Natural Variation
Parents buying new houses often pick the neighborhood according to
the reputation of the local schools. Affluent parents may spend tens of
thousands of dollars to put their children through private schools. Tell
parents that the quality of the schools doesn't matter, and they will
unanimously, and rightly, ignore you, for differences in schools do mat-
ter in many important ways. But in affecting IQ, they do not matter
nearly as much as most people think.
This conclusion was first and most famously reached by a study that
was expected to demonstrate just the opposite. The study arose out of a
mandate of the Civil Rights Act of 1964 to examine how minority
groups are affected by educational inequalities. The result was a huge
national survey, with a sample that eventually numbered 645,000 stu-
dents, led by the eminent sociologist James S. Coleman. His researchers
measured school quality by such objective variables as credentials of the
teachers, educational expenditures per pupil, and the age and quality of
school facilities.
Because the schools that most minority children attended were mea-
surably subpar in facilities and staff, it was assumed that the minority
children fortunate enough to attend better schools would also show im-
proved cognitive functioning. But the report, issued in July 1966, an-
nounced that it had failed to find any benefit to the cognitive abilities
of children in public primary or secondary schools that could be cred-
ited to better school
The usual ways in which schools tried to
improve their effectiveness were not likely to reduce the cognitive dif-
ferences among individual children or those between ethnic groups.
The Coleman report's gloomy conclusions were moderated in subse-
quent analyses that found some evidence for marginal benefits of school
quality on intellectual de~eloprnent.'~'~
Coleman himself later con-
cluded that parochial schools generally do a better job ofdeveloping the
cognitive abilities of their students than public schools, which pointed
to at least some factor in schooling that might be exploited to improve
intelligen~e.~'
Yet the basic conclusion of the report has stood the test
of time and criticism: Variations in teacher credentials, per pupil ex-
penditures, and the other objective factors in public schools do not ac-
count for much of the variation in the cognitive abilities of American
school children.12"
The several hundred thousand children assessed in the Coleman
study had not been subjects in educational experiments. They were just
students in several thousand local schools. The schools varied in qual-
ity, as they inevitably
Some schools, usually in prosperous urban
or suburban districts, got (and still get) more money, more teachers with
better qualifications, newer school buildings, and the like. Poorer or
rural districts usually made (and make) do with less. The Coleman re-
port, in other words, is one of a species of educational research that draws
on natural variation-variation
that is occurring spontaneously rather
than by design.
Looking at the effects of natural variation has advantages as a re-
search strategy, One is that this kind of research does not require new
investments of time and money to intervene in schools. The interven-
ing has already been done at someone else's expense. The disadvantage
of such studies is that the variation is often narrow-an
example of the
restriction of range problem that we described in Part I. If almost all
classes have, say, between twenty-five and thirty-five children in them,
396
Living Together
Raising Copitive Ability
397
then looking at natural variation cannot reveal what would happen in
classes with five or ten children in them. The Coleman report did not
prove that educational reform is always futile, but that, on the whole,
America had already achieved enough objective equalization in its
schools by 1964 so that it was hard to pick up any effects of unequal
school quality. The Coleman report tells us that the cognitive ability
differences among individuals and groups alike on a national scale can-
not be reduced much by further attempts to equalize the kinds of bricks-
and-mortar factors and teacher credentials that school boards and
taxpayers most often concern themselves with.
Aside from the issue of school quality is the question of whether sim-
ply going to school makes any difference to one's intelligence. The an-
swer is self-evidently yes. Going to school and learning how to read and
write, manipulate numbers, find out about one's culture and about the
discoveries of science are going to raise scores on IQ tests compared to
not going to school. But although it is obvious that schooling itself fos-
ters intelligence, it is far less obvious how much of the intellectual varl-
ation around us can be attributed to differences in the amount of
schooling people get. If large numbers of people were getting no school-
ing at all, there would be cognitive disadvantages on a grand scale that
could be blamed on a lack of formal education. Rut In modern coun-
tries, natural variation does not span so wide a range.
An example of a study that had enough natural variation in it to find
an effect of schooling was done in Sweden a half-century
IQ tests
were given in 1938 to a representative sample of several hundrect 10-
year-old boys in public and private schools in a Swedish city. Ten years
later, the boys were tested again as part of an induction examination for
national military service. In addition to the two lQ scores, the boys1
home and family backgrounds and the total years of schooling were
available for analysis.
The average subject in the study had completed only eight years of
schooling, which means that many of them had completed fewer. Fewer
than 10 percent of them had finished high school, and still fewer had
gone on to university. Compared to present-day Sweden or America,
the men experienced a wide range of years in school. Even so, the main
determiner by far of IQ at the age of 20 was the IQ at the age of 10, by
a factor of more than five times as important as years of schc~,lin~."~'
O n the other hand, schooling evas a significant though much weaker
predictor, after holding IQ at age 10 and family background constant.
Since there was some beneficial effect of schooling, the results of the
study were properly used to argue that additional years of school would
pay off in higher scores.
We can infer from the Swedish study that some of the Flynn effect
around the world is explained by the upward equalization of schooling,
hut a by-product is that schooling in and of itself no longer predicts adult
intelligence as strongly, assuming it did so when many people were not
getting much ~choo1ing.l"~
The more uniform a country's schooling is,
the more correlated the adult IQ is with childhood IQ.
The average American now gets more than three extra years of
schooling compared to the time when the earliest intelligence tests were
given. To he sure, years spent in school still varies in America, and it is
presumably still contributing to variation in cognitive abilities.12" But
given how small the effect was in the Sweden of the 1930s and 1940s,
it is unlikely to he large in America today, given the enormous com-
pression of educational variation in America during the twentieth cen-
tury (see Chapters 1 and 6). Nevertheless, we accept the basic premise
that variation in the amount of schooling accounts for some portion of
the observed variation in cognitive ability. Resides not knowing how
large this remainingeffect is, it is hard to estimate how much more would
be gained on the average by further equalization of years of schooling.
Gains reaped at the bottom of the cognitive ability distribution may be
paid for by losses at the top, a process we discuss in the next chapter.
School differences can nonetheless be important. If a child is near
the top of the intelligence distribution to begin with, the school can
make a major difference in whether that intellectual talent is actually
realized, a topic we consider in the next chapter. Or if a child has spe-
cific leamingdisabilities, access to the latest pedagogical techniques and
technology may make a major difference. There doubtless are, in addi-
tion, pockets in America's vast educational realm where schools are un-
commonly good or uncommonly poor, in which the children are
benefiting or suffering cognitively. By definition, however, these are un-
usual cases, not likely to show up in national data on intelligence.
This discussion has not meant to imply that the fostering of cogni-
tive ability is the only result we want from schools. The civility, let alone
the safety, of the environment may vary widely from school to school.
Skillful teachers may make learning more interesting. They may infuse
children with a love of learning to some extent. These are effects worth
worrying about, but they do not alter the fundamental message that the
Schooling and Cognitive Ability
- A longitudinal Swedish study found that childhood IQ at age 10 is a far stronger predictor of adult IQ than the total years of schooling completed.
- While additional schooling does provide a measurable boost to cognitive scores, its predictive power diminishes as educational access becomes more uniform across a population.
- The Flynn effect may be partially explained by the historical equalization of schooling, but this trend also makes adult intelligence more dependent on innate childhood potential.
- In modern America, the compression of educational variation suggests that further equalizing years of school may yield diminishing returns for average cognitive gains.
- Despite the limited impact on raw IQ scores, schools remain vital for realizing the potential of high-ability students and supporting those with specific learning disabilities.
- The primary value of schooling extends beyond cognitive enhancement to include fostering civility, safety, and a genuine love of learning.
The more uniform a country's schooling is, the more correlated the adult IQ is with childhood IQ.
396
Living Together
Raising Copitive Ability
397
then looking at natural variation cannot reveal what would happen in
classes with five or ten children in them. The Coleman report did not
prove that educational reform is always futile, but that, on the whole,
America had already achieved enough objective equalization in its
schools by 1964 so that it was hard to pick up any effects of unequal
school quality. The Coleman report tells us that the cognitive ability
differences among individuals and groups alike on a national scale can-
not be reduced much by further attempts to equalize the kinds of bricks-
and-mortar factors and teacher credentials that school boards and
taxpayers most often concern themselves with.
Aside from the issue of school quality is the question of whether sim-
ply going to school makes any difference to one's intelligence. The an-
swer is self-evidently yes. Going to school and learning how to read and
write, manipulate numbers, find out about one's culture and about the
discoveries of science are going to raise scores on IQ tests compared to
not going to school. But although it is obvious that schooling itself fos-
ters intelligence, it is far less obvious how much of the intellectual varl-
ation around us can be attributed to differences in the amount of
schooling people get. If large numbers of people were getting no school-
ing at all, there would be cognitive disadvantages on a grand scale that
could be blamed on a lack of formal education. Rut In modern coun-
tries, natural variation does not span so wide a range.
An example of a study that had enough natural variation in it to find
an effect of schooling was done in Sweden a half-century
IQ tests
were given in 1938 to a representative sample of several hundrect 10-
year-old boys in public and private schools in a Swedish city. Ten years
later, the boys were tested again as part of an induction examination for
national military service. In addition to the two lQ scores, the boys1
home and family backgrounds and the total years of schooling were
available for analysis.
The average subject in the study had completed only eight years of
schooling, which means that many of them had completed fewer. Fewer
than 10 percent of them had finished high school, and still fewer had
gone on to university. Compared to present-day Sweden or America,
the men experienced a wide range of years in school. Even so, the main
determiner by far of IQ at the age of 20 was the IQ at the age of 10, by
a factor of more than five times as important as years of schc~,lin~."~'
O n the other hand, schooling evas a significant though much weaker
predictor, after holding IQ at age 10 and family background constant.
Since there was some beneficial effect of schooling, the results of the
study were properly used to argue that additional years of school would
pay off in higher scores.
We can infer from the Swedish study that some of the Flynn effect
around the world is explained by the upward equalization of schooling,
hut a by-product is that schooling in and of itself no longer predicts adult
intelligence as strongly, assuming it did so when many people were not
getting much ~choo1ing.l"~
The more uniform a country's schooling is,
the more correlated the adult IQ is with childhood IQ.
The average American now gets more than three extra years of
schooling compared to the time when the earliest intelligence tests were
given. To he sure, years spent in school still varies in America, and it is
presumably still contributing to variation in cognitive abilities.12" But
given how small the effect was in the Sweden of the 1930s and 1940s,
it is unlikely to he large in America today, given the enormous com-
pression of educational variation in America during the twentieth cen-
tury (see Chapters 1 and 6). Nevertheless, we accept the basic premise
that variation in the amount of schooling accounts for some portion of
the observed variation in cognitive ability. Resides not knowing how
large this remainingeffect is, it is hard to estimate how much more would
be gained on the average by further equalization of years of schooling.
Gains reaped at the bottom of the cognitive ability distribution may be
paid for by losses at the top, a process we discuss in the next chapter.
School differences can nonetheless be important. If a child is near
the top of the intelligence distribution to begin with, the school can
make a major difference in whether that intellectual talent is actually
realized, a topic we consider in the next chapter. Or if a child has spe-
cific leamingdisabilities, access to the latest pedagogical techniques and
technology may make a major difference. There doubtless are, in addi-
tion, pockets in America's vast educational realm where schools are un-
commonly good or uncommonly poor, in which the children are
benefiting or suffering cognitively. By definition, however, these are un-
usual cases, not likely to show up in national data on intelligence.
This discussion has not meant to imply that the fostering of cogni-
tive ability is the only result we want from schools. The civility, let alone
the safety, of the environment may vary widely from school to school.
Skillful teachers may make learning more interesting. They may infuse
children with a love of learning to some extent. These are effects worth
worrying about, but they do not alter the fundamental message that the
398
Living Together
Raising Cognitive Ability
399
data convey: Equalizing the amount or objective quality of schooling in
America cannot be counted on to equalize cognitive ability much.
Compensatory Education
Just a year prior to the Coleman report, the U.S. Congress passed the
Elementary and Secondary Education Act (ESEA) of 1965, thereby
opening a massive and continuing effort to improve the education of
disadvantaged students that continues to this day. In the first fiscal year,
grants for educationally deprived children under Title I of the ESEA
went from zero to $3 billion, rose to $4 billion in the next year, and have
remained there, or higher, ever since. Expenditures in fiscal 1992 were
at an all-time high of $5.6 billion (all figures are in 1990 dollars).'*
Sponsors of Title I assumed that these programs would narrow the gap
in cognitive functioning between disadvantaged children and other stu-
dents. To prove this, the act also funded an aggressive, ongoing evalua-
tion effort, resulting over the years in a mounting stack of reports. In the
mid+1970s, the National Institute of Education (NIE) commissioned a
synthesis of the results. Reviewing all the federal studies from 1965 to
1975, researchers found no evidence that students in compensatory ed-
ucation programs closed the gap with their more able peers. Some plau-
sible data suggested that "students in compensatory programs tend to fall
behind other students, but not as fast as if they had received no com-
pensatory instructions," an outcome that the institute treated as evi-
dence of success." The greatest support in the various studies was for a
simpler "no effect" conclusion: The gap was about as great after compen-
satory education as before.13" No evidence whatsoever supported a con-
clusion that compensatory education narrowed the achievement gap.
More optimistically, supporters of compensatory education can call
upon the evidence of converging black-white test scores that we de-
scribed in Chapter 13 as indirect evidence that something positive has
been happening in elementary and secondary education for minorities.
As we described, improvement has been the largest at the bottom of the
lQ distribution, which in turn points toward compensatory programs as
a possible cause. But direct evidence of the link remains elusive. In re-
cent years, compensatory programs have set more modest goals, for
themselves.13" Now, they focus on teaching specific academic skills or
problem solving, not expecting improvements in overall academic
achievement or general inte1ligence.j'
Stories Too Good to Be True
Accounts of phenomenal success stories in education-the
inner-city
school that suddenly excels as the result of a new program or a new
teacher-are
a perennial fixture of American journalism. Are they true? If
the question is whether an inspirational teacher or some new program has
the capacity to make an important difference in students' lives, then the
answer is surely yes. But claims for long-term academic improvement, let
alone increases in cognitive functioning, typically fade as soon as hard
questions begin to be asked. A case in point is Chicago's Marva Collins,
who gained national attention with claims that her shoestring-budget in-
ner-city school, launched in 1975, was turning out students who blew the
top off standardized tests and were heading to the best universities. Be-
tween the ages of 5 and 10, she claimed, her pupils, deemed "unteachable"
in regular schools, were reading Plato, Aristotle, Chaucer, Shakespeare,
and Tolstoy, according to stories in the popular media. According to other
newspaper reports, she was asked by both Presidents Reagan and Clinton
to become secretary of education. She continues to train large numbers of
teachers in her meth~ds.'~
Are her celebrated anecdotes borne out by data?
We do not know. Despite years of publicity about Marva Collins, we can
find no hard evidence.j5
More generally, the large test score increases in local schools that are
widely and routinely reported hy the media have been plagued by fraud. In
several schools in and around Washington, D.C., for example, the Wash-
ington Post reported that gains in test performance were found to be due to
improper coaching on the tests by school employees or by allowing extra
time for students to complete the tests.'"
story in the Los Angeles 'limes
told of various methods of cheating on standardized tests, including the re-
placing of wrong answers with right ones by teachers and staff, in at least
fifty elementary public schools ~tatewide.'~
The New York Times wrote
about a public school principal who had been caught tampering with stu-
dent test scores for years.'H These specific instances seem to he part of a
widespread problem."4
Raising IQ Among the School-Aged: Converging Results from Two
Divergent Tries
The question remains: Is there any evidence that cognitive ability as
measured by IQ tests can be increased by special interventions after chil-
dren reach school age? We have some reason for thinking the answer is
a highly qualified yes, and some basis for estimating how much, from
two sources of evidence drawn from strikingly different contexts.
The Limits of Compensatory Education
- The Elementary and Secondary Education Act of 1965 launched a massive, multi-billion dollar federal effort to close the cognitive gap for disadvantaged students.
- A decade of federal evaluations synthesized by the National Institute of Education found no evidence that compensatory programs narrowed the achievement gap.
- Some researchers argued that these programs merely slowed the rate at which disadvantaged students fell behind, rather than actually improving their relative standing.
- In response to poor results, compensatory programs have shifted focus toward teaching specific academic skills rather than attempting to raise general intelligence.
- Media-celebrated success stories of inner-city schools, such as Marva Collins's academy, often lack the hard data necessary to verify claims of long-term cognitive improvement.
The greatest support in the various studies was for a simpler 'no effect' conclusion: The gap was about as great after compensatory education as before.
398
Living Together
Raising Cognitive Ability
399
data convey: Equalizing the amount or objective quality of schooling in
America cannot be counted on to equalize cognitive ability much.
Compensatory Education
Just a year prior to the Coleman report, the U.S. Congress passed the
Elementary and Secondary Education Act (ESEA) of 1965, thereby
opening a massive and continuing effort to improve the education of
disadvantaged students that continues to this day. In the first fiscal year,
grants for educationally deprived children under Title I of the ESEA
went from zero to $3 billion, rose to $4 billion in the next year, and have
remained there, or higher, ever since. Expenditures in fiscal 1992 were
at an all-time high of $5.6 billion (all figures are in 1990 dollars).'*
Sponsors of Title I assumed that these programs would narrow the gap
in cognitive functioning between disadvantaged children and other stu-
dents. To prove this, the act also funded an aggressive, ongoing evalua-
tion effort, resulting over the years in a mounting stack of reports. In the
mid+1970s, the National Institute of Education (NIE) commissioned a
synthesis of the results. Reviewing all the federal studies from 1965 to
1975, researchers found no evidence that students in compensatory ed-
ucation programs closed the gap with their more able peers. Some plau-
sible data suggested that "students in compensatory programs tend to fall
behind other students, but not as fast as if they had received no com-
pensatory instructions," an outcome that the institute treated as evi-
dence of success." The greatest support in the various studies was for a
simpler "no effect" conclusion: The gap was about as great after compen-
satory education as before.13" No evidence whatsoever supported a con-
clusion that compensatory education narrowed the achievement gap.
More optimistically, supporters of compensatory education can call
upon the evidence of converging black-white test scores that we de-
scribed in Chapter 13 as indirect evidence that something positive has
been happening in elementary and secondary education for minorities.
As we described, improvement has been the largest at the bottom of the
lQ distribution, which in turn points toward compensatory programs as
a possible cause. But direct evidence of the link remains elusive. In re-
cent years, compensatory programs have set more modest goals, for
themselves.13" Now, they focus on teaching specific academic skills or
problem solving, not expecting improvements in overall academic
achievement or general inte1ligence.j'
Stories Too Good to Be True
Accounts of phenomenal success stories in education-the
inner-city
school that suddenly excels as the result of a new program or a new
teacher-are
a perennial fixture of American journalism. Are they true? If
the question is whether an inspirational teacher or some new program has
the capacity to make an important difference in students' lives, then the
answer is surely yes. But claims for long-term academic improvement, let
alone increases in cognitive functioning, typically fade as soon as hard
questions begin to be asked. A case in point is Chicago's Marva Collins,
who gained national attention with claims that her shoestring-budget in-
ner-city school, launched in 1975, was turning out students who blew the
top off standardized tests and were heading to the best universities. Be-
tween the ages of 5 and 10, she claimed, her pupils, deemed "unteachable"
in regular schools, were reading Plato, Aristotle, Chaucer, Shakespeare,
and Tolstoy, according to stories in the popular media. According to other
newspaper reports, she was asked by both Presidents Reagan and Clinton
to become secretary of education. She continues to train large numbers of
teachers in her meth~ds.'~
Are her celebrated anecdotes borne out by data?
We do not know. Despite years of publicity about Marva Collins, we can
find no hard evidence.j5
More generally, the large test score increases in local schools that are
widely and routinely reported hy the media have been plagued by fraud. In
several schools in and around Washington, D.C., for example, the Wash-
ington Post reported that gains in test performance were found to be due to
improper coaching on the tests by school employees or by allowing extra
time for students to complete the tests.'"
story in the Los Angeles 'limes
told of various methods of cheating on standardized tests, including the re-
placing of wrong answers with right ones by teachers and staff, in at least
fifty elementary public schools ~tatewide.'~
The New York Times wrote
about a public school principal who had been caught tampering with stu-
dent test scores for years.'H These specific instances seem to he part of a
widespread problem."4
Raising IQ Among the School-Aged: Converging Results from Two
Divergent Tries
The question remains: Is there any evidence that cognitive ability as
measured by IQ tests can be increased by special interventions after chil-
dren reach school age? We have some reason for thinking the answer is
a highly qualified yes, and some basis for estimating how much, from
two sources of evidence drawn from strikingly different contexts.
Raising Cognitive Ability
- Widespread fraud and cheating by school staff have been documented in major cities to artificially inflate standardized test scores.
- Project Intelligence in Venezuela attempted to raise the IQ of seventh graders through sixty specialized lessons in reasoning and vocabulary.
- The Venezuelan experiment yielded a modest net gain of 1.6 to 6.5 IQ points, though long-term retention of these gains remains unknown.
- Commercial SAT coaching services represent a massive, unsystematic attempt to raise cognitive ability as measured by standardized tests.
- While the SAT is often treated as a curriculum test, it functions significantly as an intelligence test that is difficult but possible to coach.
The new minister was convinced that a nation's average intellectual level was fundamental to its well-being, and he set out to see what could be done to raise the IQ of Venezuelan school children.
398
Living Together
Raising Cognitive Ability
399
data convey: Equalizing the amount or objective quality of schooling in
America cannot be counted on to equalize cognitive ability much.
Compensatory Education
Just a year prior to the Coleman report, the U.S. Congress passed the
Elementary and Secondary Education Act (ESEA) of 1965, thereby
opening a massive and continuing effort to improve the education of
disadvantaged students that continues to this day. In the first fiscal year,
grants for educationally deprived children under Title I of the ESEA
went from zero to $3 billion, rose to $4 billion in the next year, and have
remained there, or higher, ever since. Expenditures in fiscal 1992 were
at an all-time high of $5.6 billion (all figures are in 1990 dollars).'*
Sponsors of Title I assumed that these programs would narrow the gap
in cognitive functioning between disadvantaged children and other stu-
dents. To prove this, the act also funded an aggressive, ongoing evalua-
tion effort, resulting over the years in a mounting stack of reports. In the
mid+1970s, the National Institute of Education (NIE) commissioned a
synthesis of the results. Reviewing all the federal studies from 1965 to
1975, researchers found no evidence that students in compensatory ed-
ucation programs closed the gap with their more able peers. Some plau-
sible data suggested that "students in compensatory programs tend to fall
behind other students, but not as fast as if they had received no com-
pensatory instructions," an outcome that the institute treated as evi-
dence of success." The greatest support in the various studies was for a
simpler "no effect" conclusion: The gap was about as great after compen-
satory education as before.13" No evidence whatsoever supported a con-
clusion that compensatory education narrowed the achievement gap.
More optimistically, supporters of compensatory education can call
upon the evidence of converging black-white test scores that we de-
scribed in Chapter 13 as indirect evidence that something positive has
been happening in elementary and secondary education for minorities.
As we described, improvement has been the largest at the bottom of the
lQ distribution, which in turn points toward compensatory programs as
a possible cause. But direct evidence of the link remains elusive. In re-
cent years, compensatory programs have set more modest goals, for
themselves.13" Now, they focus on teaching specific academic skills or
problem solving, not expecting improvements in overall academic
achievement or general inte1ligence.j'
Stories Too Good to Be True
Accounts of phenomenal success stories in education-the
inner-city
school that suddenly excels as the result of a new program or a new
teacher-are
a perennial fixture of American journalism. Are they true? If
the question is whether an inspirational teacher or some new program has
the capacity to make an important difference in students' lives, then the
answer is surely yes. But claims for long-term academic improvement, let
alone increases in cognitive functioning, typically fade as soon as hard
questions begin to be asked. A case in point is Chicago's Marva Collins,
who gained national attention with claims that her shoestring-budget in-
ner-city school, launched in 1975, was turning out students who blew the
top off standardized tests and were heading to the best universities. Be-
tween the ages of 5 and 10, she claimed, her pupils, deemed "unteachable"
in regular schools, were reading Plato, Aristotle, Chaucer, Shakespeare,
and Tolstoy, according to stories in the popular media. According to other
newspaper reports, she was asked by both Presidents Reagan and Clinton
to become secretary of education. She continues to train large numbers of
teachers in her meth~ds.'~
Are her celebrated anecdotes borne out by data?
We do not know. Despite years of publicity about Marva Collins, we can
find no hard evidence.j5
More generally, the large test score increases in local schools that are
widely and routinely reported hy the media have been plagued by fraud. In
several schools in and around Washington, D.C., for example, the Wash-
ington Post reported that gains in test performance were found to be due to
improper coaching on the tests by school employees or by allowing extra
time for students to complete the tests.'"
story in the Los Angeles 'limes
told of various methods of cheating on standardized tests, including the re-
placing of wrong answers with right ones by teachers and staff, in at least
fifty elementary public schools ~tatewide.'~
The New York Times wrote
about a public school principal who had been caught tampering with stu-
dent test scores for years.'H These specific instances seem to he part of a
widespread problem."4
Raising IQ Among the School-Aged: Converging Results from Two
Divergent Tries
The question remains: Is there any evidence that cognitive ability as
measured by IQ tests can be increased by special interventions after chil-
dren reach school age? We have some reason for thinking the answer is
a highly qualified yes, and some basis for estimating how much, from
two sources of evidence drawn from strikingly different contexts.
400
Living Together
Raising Cognitive Ability
40 1
The first is one of the largest controlled experiments attempting ex-
plicitly to raise the intelligence of school-age children. It occurred in
Venezuela, where in 1979 the incoming president named to his cabinet
a Minister of State for the Development of Human ~ntelligence.~~"'
The
new minister was convinced that a nation's average intellectual level
was fundamental to its well-being, and he set out to see what could be
done to raise the IQ of Venezuelan school chi1dren;~he result was Pro-
ject Intelligence, designed over four years by a team of Venezuelan and
American psychologists, educators, and other specialists. In the fifth
year, 900 youngsters in seventh grade in a poor district of a Venezuelan
provincial city were randomly divided into experimental and control
Those in the experimental group were taught approximately
sixty forty-five-minute lessons in addition to their regular curriculum
during the year and were cognitively tested before, during, and after the
year. The students in the control group were tested at the same inter-
vals, without receiving any of the additional instruction. The special
lessons involved instruction in the kinds of intellectual activities that
turn up on intelligence tests-visuospatial
and verbal reasoning, vo-
cabulary and word analogies-in
addition to lessons in inventive think-
ing.'4Z1
At the end of the year, the youngsters in the experimental group,
compared to the controls, had gained a net of more than 0.4 standard
deviation on a conventional intelligence test and a net gain of just over
0.1 standard deviation on a culture-fair intelligence test-in
other
words, a net gain in the range between 1.6 and 6.5 IQ points. There was
no chance to see if the gain faded out or was reflected in the rest of the
students' academic performance, nor can we even guess how much a
second or third year of lessons would have accomplished.
The second source of evidence comes from the unsystematic but mas-
sive attempt to raise intelligence that goes on in the innumerable com-
mercial coaching services promising to raise SAT scores. Few people
think of the prep courses in that way. On the surface, it is all about get-
ting into the college of your choice. But raising an SAT is just ltke rais-
ing an IQ if the SAT is an intelligence test and, however adroitly the
current officials of the College Board and the admissions officers in unl-
versities try to avoid saying so, the SAT is partly an intelligence test.14"
Can the SAT be coached? Yes, but it is not easy. Everyone who looks
into this topic immediately hears about students who gained 100, 150,
or 200 points on the SAT after a few hours of coaching. The tales may
even be true, but they need to be averaged with the tales that don't get
told about the scores that improve by only a few points-and
the scores
that drop-after
spending a few dozen hours and hundreds of dollars on
a coaching course. Scholars have by now largely sorted out the reality
behind the sales pitches. After a furious debate about the issue in the
late 1970s and early 1980s, the best evidence indicates that the coach-
ing programs which can offer convincing scientific backing for their
claims consist not of a few hours of practice but of lengthy training, com-
parable to going to school full time.44 In the best of these analyses,
Samuel Messick and Ann Jungeblut reviewed the published studies on
coaching for the SAT, eliminated the ones that were methodologically
unsound, and estimated in a regression analysis the point gain for a given
number of hours spent studying for the test.45 Their estimate of the ef-
fect of spending thirty hours on either the verbal or math test in a coach-
ing course (including homework) was an average of sixteen points on
the verbal SAT and twenty-five points for the math SAT. Larger in-
vestments in time earn larger payoffs with diminishing returns. For ex-
ample, 100 hours of studying for either test earns an average twenty-four
points on the verbal SAT and thirty-nine points on the math SAT. The
next figure summarizes the results of their analysis.
Studying really does help, but consider what is involved. Sixty hours
The diminishing returns to coaching for the SAT
Average improvement in SAT points
60 -
50 -
SAT
0 ,
I
I
I
I
I
I
1
I
I
4
34
64
94
124
154
184
214
244
274
Hours of Studying
Source: Messick and Jungehlur 1981, Figs. 1, 3.
The Limits of SAT Coaching
- Scientific analysis reveals that the dramatic score increases promised by coaching programs are often outliers that ignore students whose scores remain flat or decline.
- Research by Messick and Jungeblut shows that 300 hours of intensive study yields only about 70 points on the combined SAT, demonstrating significant diminishing returns.
- The gains from SAT coaching are remarkably similar to those of large-scale cognitive programs like the Venezuelan project, suggesting a universal ceiling for such interventions.
- Improvements in test scores often represent temporary 'cramming' effects rather than authentic, long-term increases in cognitive ability.
- Evidence suggests that raising intelligence among school-age children consistently and affordably remains an unattainable goal with current methods.
The tales may even be true, but they need to be averaged with the tales that don't get told about the scores that improve by only a few points—and the scores that drop.
400
Living Together
Raising Cognitive Ability
40 1
The first is one of the largest controlled experiments attempting ex-
plicitly to raise the intelligence of school-age children. It occurred in
Venezuela, where in 1979 the incoming president named to his cabinet
a Minister of State for the Development of Human ~ntelligence.~~"'
The
new minister was convinced that a nation's average intellectual level
was fundamental to its well-being, and he set out to see what could be
done to raise the IQ of Venezuelan school chi1dren;~he result was Pro-
ject Intelligence, designed over four years by a team of Venezuelan and
American psychologists, educators, and other specialists. In the fifth
year, 900 youngsters in seventh grade in a poor district of a Venezuelan
provincial city were randomly divided into experimental and control
Those in the experimental group were taught approximately
sixty forty-five-minute lessons in addition to their regular curriculum
during the year and were cognitively tested before, during, and after the
year. The students in the control group were tested at the same inter-
vals, without receiving any of the additional instruction. The special
lessons involved instruction in the kinds of intellectual activities that
turn up on intelligence tests-visuospatial
and verbal reasoning, vo-
cabulary and word analogies-in
addition to lessons in inventive think-
ing.'4Z1
At the end of the year, the youngsters in the experimental group,
compared to the controls, had gained a net of more than 0.4 standard
deviation on a conventional intelligence test and a net gain of just over
0.1 standard deviation on a culture-fair intelligence test-in
other
words, a net gain in the range between 1.6 and 6.5 IQ points. There was
no chance to see if the gain faded out or was reflected in the rest of the
students' academic performance, nor can we even guess how much a
second or third year of lessons would have accomplished.
The second source of evidence comes from the unsystematic but mas-
sive attempt to raise intelligence that goes on in the innumerable com-
mercial coaching services promising to raise SAT scores. Few people
think of the prep courses in that way. On the surface, it is all about get-
ting into the college of your choice. But raising an SAT is just ltke rais-
ing an IQ if the SAT is an intelligence test and, however adroitly the
current officials of the College Board and the admissions officers in unl-
versities try to avoid saying so, the SAT is partly an intelligence test.14"
Can the SAT be coached? Yes, but it is not easy. Everyone who looks
into this topic immediately hears about students who gained 100, 150,
or 200 points on the SAT after a few hours of coaching. The tales may
even be true, but they need to be averaged with the tales that don't get
told about the scores that improve by only a few points-and
the scores
that drop-after
spending a few dozen hours and hundreds of dollars on
a coaching course. Scholars have by now largely sorted out the reality
behind the sales pitches. After a furious debate about the issue in the
late 1970s and early 1980s, the best evidence indicates that the coach-
ing programs which can offer convincing scientific backing for their
claims consist not of a few hours of practice but of lengthy training, com-
parable to going to school full time.44 In the best of these analyses,
Samuel Messick and Ann Jungeblut reviewed the published studies on
coaching for the SAT, eliminated the ones that were methodologically
unsound, and estimated in a regression analysis the point gain for a given
number of hours spent studying for the test.45 Their estimate of the ef-
fect of spending thirty hours on either the verbal or math test in a coach-
ing course (including homework) was an average of sixteen points on
the verbal SAT and twenty-five points for the math SAT. Larger in-
vestments in time earn larger payoffs with diminishing returns. For ex-
ample, 100 hours of studying for either test earns an average twenty-four
points on the verbal SAT and thirty-nine points on the math SAT. The
next figure summarizes the results of their analysis.
Studying really does help, but consider what is involved. Sixty hours
The diminishing returns to coaching for the SAT
Average improvement in SAT points
60 -
50 -
SAT
0 ,
I
I
I
I
I
I
1
I
I
4
34
64
94
124
154
184
214
244
274
Hours of Studying
Source: Messick and Jungehlur 1981, Figs. 1, 3.
402
Living Together
Raising Cognitive Ability
403
of work is not a trivial investment of time, but it buys (on average) only
forty-one points on the combined Verbal and Math SATs-typically
not
enough to make much difference if a student is trying to impress an ad-
missions committee. Even 300 hours-and
now we are talking about
two additional hours for 150 school days-can
be expected to reap only
seventy additional points on the combined score. And at 300 hours (150
for each test), the student is already at the flat part of the curve. Dou-
ble the investment to 600 hours, and the expected gain is only fifteen
more points.
Although intended for utterly different purposes, the benefits of the
Venezuelan program and of SAT coaching schools are remarkably sim-
ilar. The sixty lessons of the Venezuelan course, representing forty-five
hours of study, added between .1 and .4 standard deviation on various
intelligence tests. From the figure on SAT coaching, we estimate that
45 hours of studying adds about .16 standard deviation to the Verbal
score and about .23 standard deviation to the Math score.'461
These increases in test scores represent a mix of coaching effects-
"cramming" is the process, with a quite temporary effect, that you may
remember from school days-and
perhaps an authentic increase in in-
telligence. We also are looking at short-term results here and must keep
in mind that whenever test score follow-ups have been available (see
the next section), the gains fade out. The net result is that any plausi-
ble estimate of the long-term increase in real cognitive ability must be
small, and it is possible to make the case that it approaches zero.
Taken together, the negative findings about the effects of natural
variation in schools, the findings of no effect except maybe to slow the
falling-behind process in the evaluations of compensatory education,
and the results of the Venezuelan and SAT coaching efforts all point to
the same conclusion: As of now, the goal of raising intelligence among
school-age children more than modestly, and doing so consistently and
affordabl~, remains out of reach.
HEAD START AND ITS SOMETIMES DISTANT RELATIVES
During the 1970s when scholars were getting used to the disappointing
results of programs for school-age children, they were also coming to a
consensus that IQ becomes hard to budge at about the time children go
to school. Longitudinal studies found that individual differences in IQ
stabilized at approximately age 6.47 Meanwhile, developmental psy-
chologists found that the year-to-year correlations in mental test per-
formance were close to zero in the first few years of life and then rose to
asymptotic levels by age 6.48 These findings conformed with the intu-
itive notion that, in the poet's words, "as the twig is bent the tree's in-
~lined."'~~'
Any intervention designed to increase intelligence (or
change any other basic characteristics of the child) must start early, and
the earlier the better.50 Here, we will characterize the more notable at-
tempts to help children through preschool interventions and summa-
rize the expert consensus about them.
Preschool Programs for Disadvantaged Children in General
HEAD START. One of the oldest, largest, and most enduring of the con-
temporary programs designed to foster intellectual development came
about as the result of the Economic Opportunity Act of 1964, the open-
ing salvo of Lyndon Johnson's War on Poverty. A year later, the man-
dated executive agency, the Office of Economic Opportunity, launched
Project Head Start, a program intended to break the cycle of poverty by
targeting preschool children in poor families.[511 Designed initially as a
summer program, it was quickly converted into a year-long program pro-
viding classes for raising preschoolers' intelligence and communication
skills, giving their families medical, dental, and psychological services,
encouraging parental involvement and training, and enriching the chil-
dren's diets.[521 Very soon, thousands of Head Start centers employing
tens of thousands of workers were annually spending hundreds of mil-
lions of dollars at first, then billions, on hundreds of thousands of chil*
dren and their families.
The earliest returns on Head Start were exhilarating. A few months
spent by preschoolers in the first summer program seemed to be pro-
ducing incredible IQ gains-as
much as ten points.'531 The head of the
Office of Economic ortun tun it^'^^^ reported the gains to Congress in
the spring of 1966, and the program was expanded. By then, however,
experts were noticing the dreaded "fade-out," the gradual convergence
in test scores of the children who participated in the program with com-
parable children who had not. To shorten a long story, every serious at-
tempt to assess the impact of Head Start on intelligence has found
fade-out.[551 Cognitive benefits that can often be picked up in the first
grade of school are usually gone by the third grade. By sixth grade, they
have vanished entirely in aggregate statistics.
Head Start and IQ Fade-out
- Longitudinal studies in the 1970s suggested that individual IQ differences stabilize by age six, leading to a consensus that early intervention is critical.
- Project Head Start was launched in 1965 as a central component of the War on Poverty, aiming to break the poverty cycle through preschool education and family services.
- Initial reports of Head Start were exhilarating, showing immediate IQ gains of up to ten points in participating children.
- The 'fade-out' effect describes the consistent finding that cognitive gains from Head Start typically vanish by the third or sixth grade.
- While Head Start provides valuable health and social services, no lasting improvements in intelligence have been statistically validated across its various programs.
- Disappointment over IQ results has led advocates to shift focus toward 'sleeper effects,' such as reduced crime and improved employability in later life.
These findings conformed with the intuitive notion that, in the poet's words, 'as the twig is bent the tree's inclined.'
402
Living Together
Raising Cognitive Ability
403
of work is not a trivial investment of time, but it buys (on average) only
forty-one points on the combined Verbal and Math SATs-typically
not
enough to make much difference if a student is trying to impress an ad-
missions committee. Even 300 hours-and
now we are talking about
two additional hours for 150 school days-can
be expected to reap only
seventy additional points on the combined score. And at 300 hours (150
for each test), the student is already at the flat part of the curve. Dou-
ble the investment to 600 hours, and the expected gain is only fifteen
more points.
Although intended for utterly different purposes, the benefits of the
Venezuelan program and of SAT coaching schools are remarkably sim-
ilar. The sixty lessons of the Venezuelan course, representing forty-five
hours of study, added between .1 and .4 standard deviation on various
intelligence tests. From the figure on SAT coaching, we estimate that
45 hours of studying adds about .16 standard deviation to the Verbal
score and about .23 standard deviation to the Math score.'461
These increases in test scores represent a mix of coaching effects-
"cramming" is the process, with a quite temporary effect, that you may
remember from school days-and
perhaps an authentic increase in in-
telligence. We also are looking at short-term results here and must keep
in mind that whenever test score follow-ups have been available (see
the next section), the gains fade out. The net result is that any plausi-
ble estimate of the long-term increase in real cognitive ability must be
small, and it is possible to make the case that it approaches zero.
Taken together, the negative findings about the effects of natural
variation in schools, the findings of no effect except maybe to slow the
falling-behind process in the evaluations of compensatory education,
and the results of the Venezuelan and SAT coaching efforts all point to
the same conclusion: As of now, the goal of raising intelligence among
school-age children more than modestly, and doing so consistently and
affordabl~, remains out of reach.
HEAD START AND ITS SOMETIMES DISTANT RELATIVES
During the 1970s when scholars were getting used to the disappointing
results of programs for school-age children, they were also coming to a
consensus that IQ becomes hard to budge at about the time children go
to school. Longitudinal studies found that individual differences in IQ
stabilized at approximately age 6.47 Meanwhile, developmental psy-
chologists found that the year-to-year correlations in mental test per-
formance were close to zero in the first few years of life and then rose to
asymptotic levels by age 6.48 These findings conformed with the intu-
itive notion that, in the poet's words, "as the twig is bent the tree's in-
~lined."'~~'
Any intervention designed to increase intelligence (or
change any other basic characteristics of the child) must start early, and
the earlier the better.50 Here, we will characterize the more notable at-
tempts to help children through preschool interventions and summa-
rize the expert consensus about them.
Preschool Programs for Disadvantaged Children in General
HEAD START. One of the oldest, largest, and most enduring of the con-
temporary programs designed to foster intellectual development came
about as the result of the Economic Opportunity Act of 1964, the open-
ing salvo of Lyndon Johnson's War on Poverty. A year later, the man-
dated executive agency, the Office of Economic Opportunity, launched
Project Head Start, a program intended to break the cycle of poverty by
targeting preschool children in poor families.[511 Designed initially as a
summer program, it was quickly converted into a year-long program pro-
viding classes for raising preschoolers' intelligence and communication
skills, giving their families medical, dental, and psychological services,
encouraging parental involvement and training, and enriching the chil-
dren's diets.[521 Very soon, thousands of Head Start centers employing
tens of thousands of workers were annually spending hundreds of mil-
lions of dollars at first, then billions, on hundreds of thousands of chil*
dren and their families.
The earliest returns on Head Start were exhilarating. A few months
spent by preschoolers in the first summer program seemed to be pro-
ducing incredible IQ gains-as
much as ten points.'531 The head of the
Office of Economic ortun tun it^'^^^ reported the gains to Congress in
the spring of 1966, and the program was expanded. By then, however,
experts were noticing the dreaded "fade-out," the gradual convergence
in test scores of the children who participated in the program with com-
parable children who had not. To shorten a long story, every serious at-
tempt to assess the impact of Head Start on intelligence has found
fade-out.[551 Cognitive benefits that can often be picked up in the first
grade of school are usually gone by the third grade. By sixth grade, they
have vanished entirely in aggregate statistics.
$04
Living Together
Raising Cognitive Ability
405
Head Start programs, administered locally, vary greatly in quality.
Perhaps, some have suggested, the good programs are raising intelli-
gence, but their impact is diluted to invisibility in national statistic^.'^
That remains possible, but it becomes ever less probable as time passes
without any clear evidence for it emerging. To this point, no lasting
improvements in intelligence have ever been statistically validated with
any Head Start program. Many of the commentators who praise Head
Start value its family counseling and public health benefits, while grant-
ing that it does not raise the intelligence of the children."
One response to the disappointment of Head Start has been to rede-
fine its goals. Instead of raising intelligence, contemporary advocates
say it reduces long-term school failure, crime, and illegitimacy and im-
proves employability.'5H'
These delayed benefits are called sleeper effects,
and they are what presumably justify the frequent public assertions that
"a dollar spent on Head Start earns three dollars in the future," or words
to that effect.15'I But even these claims do not survive scrutiny. The ev-
idence for sleeper effects, such as it is, almost never comes from Head
Start programs themselves but from more intensive and expensive
preschool interventions.16"
PERRY
PRESCHOOL.
The study invoked most often as evidence that Head
Start works is known as the Perry Preschool Program. David Weikart
and his associates have drawn enormous media attention for their study
of 123 black children (divided into experimental and control groups)
from the inner city in Ypsilanti, Michigan, whose IQs measured between
70 and 85 when they were recruited in the early 1960s at the age of 3
or 4.l"' Fifty-eight children in the program received cognitive instruc-
tion five half-days16221
a week in a highly enriched preschool setting for
one or two years, and their homes were visited by teachers weekly for
further instruction of parents and children. The teacher-to-child ratio
was high (about one to five), and most of the teachers had a master's
degree in appropriate child development and social work fields. Perry
Preschool resembled the average Head Start program as a Ferrari re-
sembles the family sedan.
The fifty-eight children in the experimental group were compared
with another sixty-five who served as the control group. By the end of
their one or two years in the program, the children who went to
preschool were scoring eleven points higher in 1Q than the control
group. But by the end of the second grade, they were just marginally
ahead of the control group. By the end of the fourth grade, no signifi-
cant difference in IQ remained.''" Fadeout again.
Although this intensive attempt to raise intelligence failed to pro-
duce lasting IQ gains, the Ypsilanti group believes it has found evidence
for a higher likelihood of high school graduation and some post-high
school education, higher employment rates and literacy scores, lower
arrest rates and fewer years spent in special education classes as a result
of the year or two in preschool. The effects are small and some of them
fall short of statistical significance.'"' They hardly justify investing bil-
lions of dollars in run-of-the-mill Head Start programs.
OTHER LONGITUDINAL STUDIES
OF PRESCHOC~L
PROGRAMS.
One proh-
lem faced by anyone who tries to summarize this literature is just like
that faced by people trying to formulate public policy. With hundreds
of studies making thousands of claims, what can be concluded? We are
fortunate to have the benefit of the efforts of a group of social scientists
known as the Consortium for Longitudinal Studies. Initially conceived
by a Cornell professor, Irving Lazar, the consortium has pulled together
the results of eleven studies of preschool education (including the Perry
Preschool Project), chosen because they represent the best available sci-
entifically." None of them was a Head Start program, but a few were
elaborations of Head Start, upgraded and structured to lend themselves
to evaluation, as Head Start programs rarely do. The next figure sum-
marizes the cognitive outcomes in the preschool studies that the con-
sortium deemed suitable for follow-up IQ analysis. The reported changes
control for pretest IQ score, mother's education, sex, number of siblings,
and father presence.
Soon after completing one of these high-quality experimental
preschool programs, the average child registers a net gain in IQ of more
than seven IQ points, almost half a standard deviation. The gain shrinks
to four to five points in the first two years after the program, and t o about
three points in the third year.lh6'The consortium also collected later fol-
low-up data that led the researchers to conclude that "the effect of early
education on intelligence test scores was not permanent."'"21
Intensive Interventions for Children at Risk of Mentul Retardation
The preschool programs we have just described were targeted at disad-
vantaged children in general. Now we turn to two studies that are more
intensive than even the ones analyzed by the consortium and deal with
The Preschool Fadeout Effect
- Public claims regarding the high economic return of Head Start programs are often based on data from more intensive, expensive interventions rather than Head Start itself.
- The Perry Preschool Program, frequently cited as a success, utilized a high teacher-to-child ratio and master's-level staff that far exceeded standard program resources.
- Initial IQ gains from the Perry Preschool Program were significant but vanished by the end of the fourth grade, a phenomenon known as 'fadeout.'
- While some longitudinal data suggests improvements in social outcomes like graduation and employment, these effects are often small or statistically insignificant.
- A consortium of eleven high-quality preschool studies confirmed that while early education provides an immediate cognitive boost, the effect on intelligence is not permanent.
- The disparity between elite experimental programs and 'run-of-the-mill' Head Start programs makes the former a poor justification for funding the latter.
Perry Preschool resembled the average Head Start program as a Ferrari resembles the family sedan.
$04
Living Together
Raising Cognitive Ability
405
Head Start programs, administered locally, vary greatly in quality.
Perhaps, some have suggested, the good programs are raising intelli-
gence, but their impact is diluted to invisibility in national statistic^.'^
That remains possible, but it becomes ever less probable as time passes
without any clear evidence for it emerging. To this point, no lasting
improvements in intelligence have ever been statistically validated with
any Head Start program. Many of the commentators who praise Head
Start value its family counseling and public health benefits, while grant-
ing that it does not raise the intelligence of the children."
One response to the disappointment of Head Start has been to rede-
fine its goals. Instead of raising intelligence, contemporary advocates
say it reduces long-term school failure, crime, and illegitimacy and im-
proves employability.'5H'
These delayed benefits are called sleeper effects,
and they are what presumably justify the frequent public assertions that
"a dollar spent on Head Start earns three dollars in the future," or words
to that effect.15'I But even these claims do not survive scrutiny. The ev-
idence for sleeper effects, such as it is, almost never comes from Head
Start programs themselves but from more intensive and expensive
preschool interventions.16"
PERRY
PRESCHOOL.
The study invoked most often as evidence that Head
Start works is known as the Perry Preschool Program. David Weikart
and his associates have drawn enormous media attention for their study
of 123 black children (divided into experimental and control groups)
from the inner city in Ypsilanti, Michigan, whose IQs measured between
70 and 85 when they were recruited in the early 1960s at the age of 3
or 4.l"' Fifty-eight children in the program received cognitive instruc-
tion five half-days16221
a week in a highly enriched preschool setting for
one or two years, and their homes were visited by teachers weekly for
further instruction of parents and children. The teacher-to-child ratio
was high (about one to five), and most of the teachers had a master's
degree in appropriate child development and social work fields. Perry
Preschool resembled the average Head Start program as a Ferrari re-
sembles the family sedan.
The fifty-eight children in the experimental group were compared
with another sixty-five who served as the control group. By the end of
their one or two years in the program, the children who went to
preschool were scoring eleven points higher in 1Q than the control
group. But by the end of the second grade, they were just marginally
ahead of the control group. By the end of the fourth grade, no signifi-
cant difference in IQ remained.''" Fadeout again.
Although this intensive attempt to raise intelligence failed to pro-
duce lasting IQ gains, the Ypsilanti group believes it has found evidence
for a higher likelihood of high school graduation and some post-high
school education, higher employment rates and literacy scores, lower
arrest rates and fewer years spent in special education classes as a result
of the year or two in preschool. The effects are small and some of them
fall short of statistical significance.'"' They hardly justify investing bil-
lions of dollars in run-of-the-mill Head Start programs.
OTHER LONGITUDINAL STUDIES
OF PRESCHOC~L
PROGRAMS.
One proh-
lem faced by anyone who tries to summarize this literature is just like
that faced by people trying to formulate public policy. With hundreds
of studies making thousands of claims, what can be concluded? We are
fortunate to have the benefit of the efforts of a group of social scientists
known as the Consortium for Longitudinal Studies. Initially conceived
by a Cornell professor, Irving Lazar, the consortium has pulled together
the results of eleven studies of preschool education (including the Perry
Preschool Project), chosen because they represent the best available sci-
entifically." None of them was a Head Start program, but a few were
elaborations of Head Start, upgraded and structured to lend themselves
to evaluation, as Head Start programs rarely do. The next figure sum-
marizes the cognitive outcomes in the preschool studies that the con-
sortium deemed suitable for follow-up IQ analysis. The reported changes
control for pretest IQ score, mother's education, sex, number of siblings,
and father presence.
Soon after completing one of these high-quality experimental
preschool programs, the average child registers a net gain in IQ of more
than seven IQ points, almost half a standard deviation. The gain shrinks
to four to five points in the first two years after the program, and t o about
three points in the third year.lh6'The consortium also collected later fol-
low-up data that led the researchers to conclude that "the effect of early
education on intelligence test scores was not permanent."'"21
Intensive Interventions for Children at Risk of Mentul Retardation
The preschool programs we have just described were targeted at disad-
vantaged children in general. Now we turn to two studies that are more
intensive than even the ones analyzed by the consortium and deal with
Intensive Interventions and the Abecedarian Project
- Researchers targeted children at high risk for mental retardation due to maternal low IQ and socioeconomic deprivation, seeking to forestall cognitive decline.
- The Carolina Abecedarian Project represents the 'apotheosis' of the day care approach, providing intensive care from one month of age through age five.
- Experimental subjects received high teacher-to-child ratios, enriched nutrition, and medical services for fifty weeks a year.
- Results showed significant long-term benefits, including a 50% reduction in grade repetition and fewer children scoring below an IQ of 85.
- Methodological concerns persist because the experimental group outperformed the control group significantly by age one, before the bulk of the intervention occurred.
The Abecedarian Project is the apotheosis of the day care approach.
$04
Living Together
Raising Cognitive Ability
405
Head Start programs, administered locally, vary greatly in quality.
Perhaps, some have suggested, the good programs are raising intelli-
gence, but their impact is diluted to invisibility in national statistic^.'^
That remains possible, but it becomes ever less probable as time passes
without any clear evidence for it emerging. To this point, no lasting
improvements in intelligence have ever been statistically validated with
any Head Start program. Many of the commentators who praise Head
Start value its family counseling and public health benefits, while grant-
ing that it does not raise the intelligence of the children."
One response to the disappointment of Head Start has been to rede-
fine its goals. Instead of raising intelligence, contemporary advocates
say it reduces long-term school failure, crime, and illegitimacy and im-
proves employability.'5H'
These delayed benefits are called sleeper effects,
and they are what presumably justify the frequent public assertions that
"a dollar spent on Head Start earns three dollars in the future," or words
to that effect.15'I But even these claims do not survive scrutiny. The ev-
idence for sleeper effects, such as it is, almost never comes from Head
Start programs themselves but from more intensive and expensive
preschool interventions.16"
PERRY
PRESCHOOL.
The study invoked most often as evidence that Head
Start works is known as the Perry Preschool Program. David Weikart
and his associates have drawn enormous media attention for their study
of 123 black children (divided into experimental and control groups)
from the inner city in Ypsilanti, Michigan, whose IQs measured between
70 and 85 when they were recruited in the early 1960s at the age of 3
or 4.l"' Fifty-eight children in the program received cognitive instruc-
tion five half-days16221
a week in a highly enriched preschool setting for
one or two years, and their homes were visited by teachers weekly for
further instruction of parents and children. The teacher-to-child ratio
was high (about one to five), and most of the teachers had a master's
degree in appropriate child development and social work fields. Perry
Preschool resembled the average Head Start program as a Ferrari re-
sembles the family sedan.
The fifty-eight children in the experimental group were compared
with another sixty-five who served as the control group. By the end of
their one or two years in the program, the children who went to
preschool were scoring eleven points higher in 1Q than the control
group. But by the end of the second grade, they were just marginally
ahead of the control group. By the end of the fourth grade, no signifi-
cant difference in IQ remained.''" Fadeout again.
Although this intensive attempt to raise intelligence failed to pro-
duce lasting IQ gains, the Ypsilanti group believes it has found evidence
for a higher likelihood of high school graduation and some post-high
school education, higher employment rates and literacy scores, lower
arrest rates and fewer years spent in special education classes as a result
of the year or two in preschool. The effects are small and some of them
fall short of statistical significance.'"' They hardly justify investing bil-
lions of dollars in run-of-the-mill Head Start programs.
OTHER LONGITUDINAL STUDIES
OF PRESCHOC~L
PROGRAMS.
One proh-
lem faced by anyone who tries to summarize this literature is just like
that faced by people trying to formulate public policy. With hundreds
of studies making thousands of claims, what can be concluded? We are
fortunate to have the benefit of the efforts of a group of social scientists
known as the Consortium for Longitudinal Studies. Initially conceived
by a Cornell professor, Irving Lazar, the consortium has pulled together
the results of eleven studies of preschool education (including the Perry
Preschool Project), chosen because they represent the best available sci-
entifically." None of them was a Head Start program, but a few were
elaborations of Head Start, upgraded and structured to lend themselves
to evaluation, as Head Start programs rarely do. The next figure sum-
marizes the cognitive outcomes in the preschool studies that the con-
sortium deemed suitable for follow-up IQ analysis. The reported changes
control for pretest IQ score, mother's education, sex, number of siblings,
and father presence.
Soon after completing one of these high-quality experimental
preschool programs, the average child registers a net gain in IQ of more
than seven IQ points, almost half a standard deviation. The gain shrinks
to four to five points in the first two years after the program, and t o about
three points in the third year.lh6'The consortium also collected later fol-
low-up data that led the researchers to conclude that "the effect of early
education on intelligence test scores was not permanent."'"21
Intensive Interventions for Children at Risk of Mentul Retardation
The preschool programs we have just described were targeted at disad-
vantaged children in general. Now we turn to two studies that are more
intensive than even the ones analyzed by the consortium and deal with
406
Living to get he^
IQ gains attributable to the Consortium preschool projects
Median gain in IQ points
8 -
1 -
O
Exit test
1 year
2 years
3 years
Period After the End of the Program
Source: Lazar and Darlington 1982, Table 15.
children who are considered to be at high risk of mental retardation,
based on their mothers' low IQs and socioeconomic deprivation.
A case can be made for expecting interventions to be especially ef-
fective for these children, since their environments are so poor that they
are unlikely to have had any of the benefits that a good program would
provide. Moreover, if the studies have control groups and are reason-
ably well documented, there is at least a hope of deciding whether the
programs succeeded in forestalling the emergence of retardation. We
will briefly characterize the two studies approximating these conditions
that have received the most scientific and media attention.
THE ABECEDARIAN
PROJECT.
The Carolina Abecedarian Project started
in the early 1970s, under the guidance of Craig Ramey and his associ-
ates, then at the University of North C a r ~ l i n a . ~
Through various so-
cial agencies, they located pregnant women whose children would be at
high risk for retardation. As the babies were born, the ones with obvi-
ous neurologic disorders were excluded from the study, but the remain-
der were assigned to two groups, presumably randomly. In all, there were
four cohorts of experimental and control children. Both groups of ba-
bies and their families received a variety of medical and social work ser-
vices, but one group of babies (the "experimentals") went into a day care
Raising Cognitive Ability
407
program. The program started when the babies were just over a month
old, and it provided care for six to eight hours a day, five days a week,
fifty weeks a year, emphasizing cognitive enrichment activities with
teacher-to-child ratios of one to three for infants and one to four to one
to six in later years, until the children reached the age of 5. It also in-
cluded enriched nutrition and medical attention until the infants were
18 months old.69 he Abecedarian Project is the apotheosis of the day
care approach. This is extremely useful from a methodological perspec-
tive: Even if the nation cannot afford to supply the same services to the
entire national population of children who qualified for the Abecedar-
ian Project, it serves as a way of defining the outer limit of what day care
can accomplish given the current state of the art.
At the end of the fifth year, the children receiving the day care
outscored those who did not by half a standard deviation on an intelli-
gence test. At last report, the children were 12 years old and were still
doing better intellectually than the controls. Combining all the cohorts,
only 28 percent of the experimental children had repeated a grade, com-
pared to 55 percent of the control children. Only 13 percent of the ex-
perimental children had IQs of less than 85, compared to 44 percent of
the control ~hildren.~'
This would be unequivocal good news, except for charges that the
two groups were not comparable in their intellectual prospects at birth.
Ignoring the more technical issues, the major stumbling block to de-
ciding what the Abecedarian Project has accomplished is that the ex-
perimental children had already outscored the controls on cognitive
performance tests by at least as large a margin (in standard score units)
by the age of 1 or 2 years, and perhaps even by 6 months, as they had
after nearly five years of intensive day care.17" There are two main ex-
planations for this anomaly. Perhaps the intervention had achieved all
its effects in the first months or the first year of the project (which, if
true, would have important policy implications). Or perhaps the ex-
~erimental and control groups were different to begin with (the sample
sizes for any of the experimental or control groups was no larger than
fifteen and as small as nine, so random selection with such small num-
bers gives no guarantee that the experimental and control groups will
be equivalent). To make things still more uncertain, test scores for chil-
dren younger than 3 years are poor predictors of later intelligence test
scores, and test results for infants at the age of 3 or 6 months are ex-
The Limits of Early Intervention
- Small sample sizes in the Abecedarian Project created statistical uncertainty regarding the equivalence of experimental and control groups.
- The Milwaukee Project targeted high-risk infants with intensive, multi-year day care and comprehensive family support services.
- Initial reports of the Milwaukee Project claimed massive IQ gains of over 25 points, but these were not published for expert review for decades.
- Long-term data showed a 10-point IQ advantage for the Milwaukee Project participants that failed to translate into improved school performance or literacy.
- Critics argue the IQ gains may be the result of 'coaching' for tests rather than a genuine increase in general cognitive ability or 'g'.
- The divergence in results between the Abecedarian and Milwaukee projects leaves the future of such policy interventions unresolved.
Experimental and control groups were both one to two years retarded in reading and math skills by the time they reached fourth grade; their academic averages and their achievement scores were similar, and they were similarly rated by their teachers for academic competence.
406
Living to get he^
IQ gains attributable to the Consortium preschool projects
Median gain in IQ points
8 -
1 -
O
Exit test
1 year
2 years
3 years
Period After the End of the Program
Source: Lazar and Darlington 1982, Table 15.
children who are considered to be at high risk of mental retardation,
based on their mothers' low IQs and socioeconomic deprivation.
A case can be made for expecting interventions to be especially ef-
fective for these children, since their environments are so poor that they
are unlikely to have had any of the benefits that a good program would
provide. Moreover, if the studies have control groups and are reason-
ably well documented, there is at least a hope of deciding whether the
programs succeeded in forestalling the emergence of retardation. We
will briefly characterize the two studies approximating these conditions
that have received the most scientific and media attention.
THE ABECEDARIAN
PROJECT.
The Carolina Abecedarian Project started
in the early 1970s, under the guidance of Craig Ramey and his associ-
ates, then at the University of North C a r ~ l i n a . ~
Through various so-
cial agencies, they located pregnant women whose children would be at
high risk for retardation. As the babies were born, the ones with obvi-
ous neurologic disorders were excluded from the study, but the remain-
der were assigned to two groups, presumably randomly. In all, there were
four cohorts of experimental and control children. Both groups of ba-
bies and their families received a variety of medical and social work ser-
vices, but one group of babies (the "experimentals") went into a day care
Raising Cognitive Ability
407
program. The program started when the babies were just over a month
old, and it provided care for six to eight hours a day, five days a week,
fifty weeks a year, emphasizing cognitive enrichment activities with
teacher-to-child ratios of one to three for infants and one to four to one
to six in later years, until the children reached the age of 5. It also in-
cluded enriched nutrition and medical attention until the infants were
18 months old.69 he Abecedarian Project is the apotheosis of the day
care approach. This is extremely useful from a methodological perspec-
tive: Even if the nation cannot afford to supply the same services to the
entire national population of children who qualified for the Abecedar-
ian Project, it serves as a way of defining the outer limit of what day care
can accomplish given the current state of the art.
At the end of the fifth year, the children receiving the day care
outscored those who did not by half a standard deviation on an intelli-
gence test. At last report, the children were 12 years old and were still
doing better intellectually than the controls. Combining all the cohorts,
only 28 percent of the experimental children had repeated a grade, com-
pared to 55 percent of the control children. Only 13 percent of the ex-
perimental children had IQs of less than 85, compared to 44 percent of
the control ~hildren.~'
This would be unequivocal good news, except for charges that the
two groups were not comparable in their intellectual prospects at birth.
Ignoring the more technical issues, the major stumbling block to de-
ciding what the Abecedarian Project has accomplished is that the ex-
perimental children had already outscored the controls on cognitive
performance tests by at least as large a margin (in standard score units)
by the age of 1 or 2 years, and perhaps even by 6 months, as they had
after nearly five years of intensive day care.17" There are two main ex-
planations for this anomaly. Perhaps the intervention had achieved all
its effects in the first months or the first year of the project (which, if
true, would have important policy implications). Or perhaps the ex-
~erimental and control groups were different to begin with (the sample
sizes for any of the experimental or control groups was no larger than
fifteen and as small as nine, so random selection with such small num-
bers gives no guarantee that the experimental and control groups will
be equivalent). To make things still more uncertain, test scores for chil-
dren younger than 3 years are poor predictors of later intelligence test
scores, and test results for infants at the age of 3 or 6 months are ex-
408
Living Together
Raising Cognitive Ability
409
tremely unreliable. It would therefore be difficult in any case to assess
the random placement from early test scores. The debate over the re-
sults is ongoing and unresolved as we write.
THE MILWAUKEE
PROJECT. The Abecedarian Project was inspired by an
earlier attempt to forestall mental retardation in a population of
children who were at high risk. The famous Milwaukee Project started
in 1966 under the supervision of Richard Heber, a professor at the
University of Wisconsin (Madison) who had been research director of
President John E Kennedy's panel on mental retardation at the
beginning of the decade. Healthy babies of poor black mothers with
IQs below 75 were almost, but not quite, randomly assigned to no day
care at all or day care starting at 3 months and continuing until they
went to school. The day care lasted all day, five days a week, all year.
The families of the babies selected for day care received a variety of
additional services and health care. The mothers were paid for
participation, received training in parenting and job skills, and their
other young children received free child care. Only thirty-five
children are considered to have completed the study, seventeen
receiving the special attention and the remainder serving as controls.
Soon after the Milwaukee project began, reports of enormous net
gains in IQ (more than 25 points) started appearing in the popular me-
dia and in psychology textbooks.72 However, there was a dearth of pub-
lication that allowed experts to evaluate the project. The few technical
items that appeared raised more questions than they an~wered.~'
It was
not until 1988 that another Wisconsin professor associated with the
work, Howard Garber, published an interpretable analysis of what had
been done in the Milwaukee Project and what was found.1741
By the age of 12 to 14 years, the children who had been in the pro-
gram were scoring about ten points higher in IQ than the controls. Com-
pared to other early interventions, this is a notably large difference. But
this increase was not accompanied by increases in school performance
compared to the control group. Experimental and control groups were
both one to two years retarded in reading and math skills by the time
they reached fourth grade; their academic averages and their achieve-
ment scores were similar, and they were similarly rated by their teach-
ers for academic competence. From such findings, psychologists Charles
Locurto and Arthur Jensen have concluded that the program's substan-
tial and enduring gain in IQ has been produced by coaching the chil-
dren so well on taking intelligence tests that their scores no longer mea-
sure intelligence or g very
Time will tell whether a more hope-
ful conclusion can be drawn.
In summary, the two experiments contain some promising leads. But
it is not obvious where to go from here, for they differed in possibly im-
portant ways. The Abecedarian Project evaluated day care; the Mil-
waukee Project provided numerous interventions besides day care,
including parental payment and training. It is hard to tell whether the
former found enduring IQ benefits, given the very early divergence in
test scores for experimental and control groups, but some academic ben-
efits; the latter found an enduring IQ gain, but has not yet shown com-
parable intellectual gains in school work. I t may be relevant that the
Abecedarian mothers had higher IQs than the Milwaukee mothers, so
the children may not have been at equal risk for retardation.
Reading this history of interventions, you may have noticed a curious
parallelism: In the media, the good news is trumpeted as if there were
no ambiguity; in the technical journals, the good news is viewed with
deep suspicion and discounted. Are the scholars as excessively nitpick-
ing as the journalists are credulous? Here is the difficult-to-discuss prob-
lem that overhangs the interpretation of these results: The people who
run these programs want them to succeed. This is hardly a criticism.
People who are spending their lives trying to help disadvantaged chil-
dren ought to be passionately committed to their success. But it is hard
for them to turn around and be dispassionate about the question, "How
well are we doing!" Often the raw data from these programs are not eas-
ily accessible to outside scholars. Not infrequently, when such data fi-
nally are made available, they reveal a different and less positive way of
viewing the successful results than the one that had previously been
published.
Consensus has thus been hard to reach, but progress is being made.
In our account, we have avoided dwelling on technical problems that,
though ~erhaps valid, would modify the results only at the margin.
When we have alluded to uncertainties and methodological difficulties,
we have restricted ourselves to clear potential problems, which, if true,
seriously weaken the basis for claiming success. In other words, we have
tried to avoid nitpicking. The fact is that we and everyone else are far
from knowing whether, let alone how, any of these projects have in-
creased intelligence. We write this pessimistic conclusion knowing how
Interventions and Environmental Impact
- Early childhood intervention programs often show conflicting results between media reports and technical peer reviews.
- The passionate commitment of program directors can lead to biased interpretations and restricted access to raw data.
- Scholars remain uncertain about whether or how specific educational projects actually increase long-term intelligence.
- Adoption at birth represents the most significant environmental transformation possible for a child's cognitive development.
- Extreme cases of isolation, such as 'feral children,' prove that human contact is essential for intellectual development.
- Historical and social shifts in adoption practices make it difficult for modern researchers to find clean, experimental data.
In the media, the good news is trumpeted as if there were no ambiguity; in the technical journals, the good news is viewed with deep suspicion and discounted.
408
Living Together
Raising Cognitive Ability
409
tremely unreliable. It would therefore be difficult in any case to assess
the random placement from early test scores. The debate over the re-
sults is ongoing and unresolved as we write.
THE MILWAUKEE
PROJECT. The Abecedarian Project was inspired by an
earlier attempt to forestall mental retardation in a population of
children who were at high risk. The famous Milwaukee Project started
in 1966 under the supervision of Richard Heber, a professor at the
University of Wisconsin (Madison) who had been research director of
President John E Kennedy's panel on mental retardation at the
beginning of the decade. Healthy babies of poor black mothers with
IQs below 75 were almost, but not quite, randomly assigned to no day
care at all or day care starting at 3 months and continuing until they
went to school. The day care lasted all day, five days a week, all year.
The families of the babies selected for day care received a variety of
additional services and health care. The mothers were paid for
participation, received training in parenting and job skills, and their
other young children received free child care. Only thirty-five
children are considered to have completed the study, seventeen
receiving the special attention and the remainder serving as controls.
Soon after the Milwaukee project began, reports of enormous net
gains in IQ (more than 25 points) started appearing in the popular me-
dia and in psychology textbooks.72 However, there was a dearth of pub-
lication that allowed experts to evaluate the project. The few technical
items that appeared raised more questions than they an~wered.~'
It was
not until 1988 that another Wisconsin professor associated with the
work, Howard Garber, published an interpretable analysis of what had
been done in the Milwaukee Project and what was found.1741
By the age of 12 to 14 years, the children who had been in the pro-
gram were scoring about ten points higher in IQ than the controls. Com-
pared to other early interventions, this is a notably large difference. But
this increase was not accompanied by increases in school performance
compared to the control group. Experimental and control groups were
both one to two years retarded in reading and math skills by the time
they reached fourth grade; their academic averages and their achieve-
ment scores were similar, and they were similarly rated by their teach-
ers for academic competence. From such findings, psychologists Charles
Locurto and Arthur Jensen have concluded that the program's substan-
tial and enduring gain in IQ has been produced by coaching the chil-
dren so well on taking intelligence tests that their scores no longer mea-
sure intelligence or g very
Time will tell whether a more hope-
ful conclusion can be drawn.
In summary, the two experiments contain some promising leads. But
it is not obvious where to go from here, for they differed in possibly im-
portant ways. The Abecedarian Project evaluated day care; the Mil-
waukee Project provided numerous interventions besides day care,
including parental payment and training. It is hard to tell whether the
former found enduring IQ benefits, given the very early divergence in
test scores for experimental and control groups, but some academic ben-
efits; the latter found an enduring IQ gain, but has not yet shown com-
parable intellectual gains in school work. I t may be relevant that the
Abecedarian mothers had higher IQs than the Milwaukee mothers, so
the children may not have been at equal risk for retardation.
Reading this history of interventions, you may have noticed a curious
parallelism: In the media, the good news is trumpeted as if there were
no ambiguity; in the technical journals, the good news is viewed with
deep suspicion and discounted. Are the scholars as excessively nitpick-
ing as the journalists are credulous? Here is the difficult-to-discuss prob-
lem that overhangs the interpretation of these results: The people who
run these programs want them to succeed. This is hardly a criticism.
People who are spending their lives trying to help disadvantaged chil-
dren ought to be passionately committed to their success. But it is hard
for them to turn around and be dispassionate about the question, "How
well are we doing!" Often the raw data from these programs are not eas-
ily accessible to outside scholars. Not infrequently, when such data fi-
nally are made available, they reveal a different and less positive way of
viewing the successful results than the one that had previously been
published.
Consensus has thus been hard to reach, but progress is being made.
In our account, we have avoided dwelling on technical problems that,
though ~erhaps valid, would modify the results only at the margin.
When we have alluded to uncertainties and methodological difficulties,
we have restricted ourselves to clear potential problems, which, if true,
seriously weaken the basis for claiming success. In other words, we have
tried to avoid nitpicking. The fact is that we and everyone else are far
from knowing whether, let alone how, any of these projects have in-
creased intelligence. We write this pessimistic conclusion knowing how
4 10
Living Together
Raising Cognitive Ability
41 1
many ostensibly successful projects will be cited as plain and indis-
putable evidence that we are willfully refusing to see the light.
CHANGING THE ENVIRONMENT AT BIRTH
There is one sure way to transform a child's environment beneficially:
adoption out of a bad environment into a good one. If adoption occurs
at birth, it is at least possible that the potential effects of postnatal en-
vironmental disadvantage could be wiped out alt~gether."~'
The specific
question now is: How many points does being raised in a good adoptive
home add to an IQ score?
Children are not put up for adoption for the edification of social the-
orists. There are no controlled experiments on the effects of adoption.
Adoption usually means trouble in the biological family; trc~uble usu-
ally lands on families nonrandomly and unaccountably, making it hard
to extract clear, generalizable data. The most famous studies were mostly
done decades ago, when she social and financial incentives for adoption
were different from today's. Legalized contraception and abortion, too,
When Environment Is Decisive
Lest anyone doubt that environment matters in the development of intel-
ligence, consider the rare and bizarre cases in which a child is hidden away
in a locked room by a demented adult or breaks free of human contact al-
together and runs wild. From the even rarer cases that are investigated and
told with care and accuracy, we know that if the isolation from human so-
ciety lasts for years, rather than for just months, the children are intellec-
tually stunted for life." Such was, for example, the experience of the "Wild
Boy of Aveyron," discovered in southern France soon after the Revolution
and the establishment of the first French Republic, like an invitation to
confirm Rousseau's vision of the noble savage. The 12- or 13-year-old boy
had been found running naked in the woods, mute, wild, and evidently out
of contact with humanity for most of his life. But, as it turned out, neither
he, nor the others like him that we know about, resemble Rousseau's no-
ble savage in the least. Most of them never learn to speak properly or to
become independent adults. They rarely learn to meet even the lowest
standards of personal hygiene or conduct. They seem unable to hecome
fully human despite heroic efforts to restore them to society. From these
rare cases we can draw a hopeful conclusion: If the ordinary human envi-
ronment is so essential for bestowing human intelligence, we should be
able to create extraordinary environments to raise it further.""
have altered the pool of subjects for adoption studies. Both the envi-
ronmental and genetic legacies of children put up for adoption have
surely changed over the years, but it is impossible to know exactly in
what ways and how much. In short, although data are abundant and we
will draw some broad conclusions, this is a n area in which solid esti-
mates are unlikely to be found.
As a group, adopted children do not score as high as the biological
children of their adopting parents.'791
The deficit may be as large as seven
to ten IQ points. It's not completely clear what this deficit means. One
hypothesis is that the adopted children's genes hold them back; another
is that there is an intellectually depressing effect of adoption itself, or
that being placed in adopting homes not immediately after birth (as only
some of them are), but only after several months or years, loses the ben-
efit of the nurturing their adopting parents would have provided earlier
in their lives.
At the same time, researchers think it very likely that adopted chile
dren earn higher scores than they would have had if they been raised by
their biological parents, because the adopting home environment is
likely to be better than the one their biological parents would have pro-
vided. If so, this would be a genuine effect of the home environment.
How large is the effect? Charles Locurto, reviewing the evidence and
striking an average, concludes that it is about six points.Ro As a consen-
sus figure, that seems about right to us. However, a consensus figure is
not what we want, as Locurto recognizes. I t does not identify how wide
a gap separates the environments provided by adopting homes and the
homes in which the children would have been reared had they not been
adopted. We seek a comparison of the IQs of children growing up in
homes of a known low socioeconomic status and genetically compara-
ble children reared in homes of a known high socioeconomic status.
What would the increment in IQ look like then?
Two approximations to an ideal adoption study, albeit with very small
samples, have recently been done in France." In one, Michel Schiff and
his colleagues searched French records for children abandoned in in-
fancy, born to working-class (unskilled) parents, who were adopted into
upper-class homes. Only thirty-two children met the study's criteria. In
childhood, their average IQ was 107. To understand what this means,
two further comparisons are in order. First, the adopted children scored
eight points lower on average than their schoolmates, presumably from
comparable upper-class homes. This confirms the usual finding with
Environment and Adopted Intelligence
- Feral children who lack human contact fail to develop basic intelligence or social skills, suggesting that a standard human environment is essential for cognitive development.
- Adopted children generally score seven to ten IQ points lower than the biological children of their adoptive parents, though the cause remains debated between genetics and early-life trauma.
- Despite the gap with biological siblings, adoption into higher socioeconomic homes typically raises a child's IQ by an estimated average of six points compared to staying with biological parents.
- A French study of abandoned children found that those adopted into upper-class homes scored twelve points higher than their biological siblings raised in lower-class environments.
- The data suggests that while adoption provides a significant cognitive boost, it rarely closes the gap entirely between the adoptee and children born into high-SES families.
They seem unable to become fully human despite heroic efforts to restore them to society.
4 10
Living Together
Raising Cognitive Ability
41 1
many ostensibly successful projects will be cited as plain and indis-
putable evidence that we are willfully refusing to see the light.
CHANGING THE ENVIRONMENT AT BIRTH
There is one sure way to transform a child's environment beneficially:
adoption out of a bad environment into a good one. If adoption occurs
at birth, it is at least possible that the potential effects of postnatal en-
vironmental disadvantage could be wiped out alt~gether."~'
The specific
question now is: How many points does being raised in a good adoptive
home add to an IQ score?
Children are not put up for adoption for the edification of social the-
orists. There are no controlled experiments on the effects of adoption.
Adoption usually means trouble in the biological family; trc~uble usu-
ally lands on families nonrandomly and unaccountably, making it hard
to extract clear, generalizable data. The most famous studies were mostly
done decades ago, when she social and financial incentives for adoption
were different from today's. Legalized contraception and abortion, too,
When Environment Is Decisive
Lest anyone doubt that environment matters in the development of intel-
ligence, consider the rare and bizarre cases in which a child is hidden away
in a locked room by a demented adult or breaks free of human contact al-
together and runs wild. From the even rarer cases that are investigated and
told with care and accuracy, we know that if the isolation from human so-
ciety lasts for years, rather than for just months, the children are intellec-
tually stunted for life." Such was, for example, the experience of the "Wild
Boy of Aveyron," discovered in southern France soon after the Revolution
and the establishment of the first French Republic, like an invitation to
confirm Rousseau's vision of the noble savage. The 12- or 13-year-old boy
had been found running naked in the woods, mute, wild, and evidently out
of contact with humanity for most of his life. But, as it turned out, neither
he, nor the others like him that we know about, resemble Rousseau's no-
ble savage in the least. Most of them never learn to speak properly or to
become independent adults. They rarely learn to meet even the lowest
standards of personal hygiene or conduct. They seem unable to hecome
fully human despite heroic efforts to restore them to society. From these
rare cases we can draw a hopeful conclusion: If the ordinary human envi-
ronment is so essential for bestowing human intelligence, we should be
able to create extraordinary environments to raise it further.""
have altered the pool of subjects for adoption studies. Both the envi-
ronmental and genetic legacies of children put up for adoption have
surely changed over the years, but it is impossible to know exactly in
what ways and how much. In short, although data are abundant and we
will draw some broad conclusions, this is a n area in which solid esti-
mates are unlikely to be found.
As a group, adopted children do not score as high as the biological
children of their adopting parents.'791
The deficit may be as large as seven
to ten IQ points. It's not completely clear what this deficit means. One
hypothesis is that the adopted children's genes hold them back; another
is that there is an intellectually depressing effect of adoption itself, or
that being placed in adopting homes not immediately after birth (as only
some of them are), but only after several months or years, loses the ben-
efit of the nurturing their adopting parents would have provided earlier
in their lives.
At the same time, researchers think it very likely that adopted chile
dren earn higher scores than they would have had if they been raised by
their biological parents, because the adopting home environment is
likely to be better than the one their biological parents would have pro-
vided. If so, this would be a genuine effect of the home environment.
How large is the effect? Charles Locurto, reviewing the evidence and
striking an average, concludes that it is about six points.Ro As a consen-
sus figure, that seems about right to us. However, a consensus figure is
not what we want, as Locurto recognizes. I t does not identify how wide
a gap separates the environments provided by adopting homes and the
homes in which the children would have been reared had they not been
adopted. We seek a comparison of the IQs of children growing up in
homes of a known low socioeconomic status and genetically compara-
ble children reared in homes of a known high socioeconomic status.
What would the increment in IQ look like then?
Two approximations to an ideal adoption study, albeit with very small
samples, have recently been done in France." In one, Michel Schiff and
his colleagues searched French records for children abandoned in in-
fancy, born to working-class (unskilled) parents, who were adopted into
upper-class homes. Only thirty-two children met the study's criteria. In
childhood, their average IQ was 107. To understand what this means,
two further comparisons are in order. First, the adopted children scored
eight points lower on average than their schoolmates, presumably from
comparable upper-class homes. This confirms the usual finding with
4 1 2
Living Together
Raising Cognitive Ability
4 1 3
adopted children. But, second, they scored twelve points higher than
twenty of their full or half-siblings who were reared at least for a time
by a biological parent or grandparent in lower-class surroundings.ln2'
This study ~rovides a rare chance to estimate roughly where the
adoptees would have been had they remained in their original homes.
A second French study compared four small groups of adopted chil-
dren, reared in either high- or low-SES homes, and the biological off-
spring of high- or low-SES parents. Thus one could ask, albeit with only
a handful of children,lR3' what happens when children born to low-SES
parents are adopted into a high-SES home or when children horn to
high-SES parents are adopted into low-SES homes; and so on. In this
study as well, the switch from low to high status in the home environ-
ment produced a twelve-point benefit in IQ.I'~'SUC~
findings, of course,
implicate the home environment as a factor in the development of cog-
nitive ability. We cannot be sure how much, because we do not know
exactly how far down the SES ladder the children came from, or how
far up the ladder they were moved into their adoptive homes. If the
twelve-point shift is produced by a small shift in environment (e.g., a
child of a truck driver adopted by the family of a bank clerk), it gives a
great deal of hope for the effects of adoption; if it was produced only by
a huge shift in the environment (e.g., the child of a chronically unem-
ployed illiterate adopted by the Rothschilds), not so much hope. In gen-
eral, the more important the environment is inshaping cognitive ability,
the larger the impact a given change in environment has on IQ.
To see what the policy implications might be, let us suppose that low-
and high-SES homes in the French studies represented the 10th and
90th centiles in the quality of the home environment, respectively. If
that were the case, what might be accomplished by moving children
from very deprived homes (at the 2d centile, to make the example con-
crete) to very advantaged ones (98th centile)? The results of the French
study imply that such a shift in home environment would produce a hen-
efit of almost twenty IQ points.1R5'
A swing of twenty points is considerable and seems to open up the
possibility of large gains in intelligence to be had by equalizing homes
"upward," by appropriating for more families whatever nurturing things
go on in the homes of the top I or 2 percent in socioeconomic status.''61
The problem, obviously, is that no one knows how to equalize environ-
ments upward on so grand a scale, particularly since so much of what
goes on in the nurturing of children is associated with the personalitv
and behavior of the parent, not material wealth. This brings us to a va-
riety of policy issues that it is now time to discuss more explicitly.
A POLICY AGENDA
Research
Nothing is more predictable than that researchers will conclude that
what is most needed is more research. In this case, however, the ilsually
predictable is a little less so.
Certain kinds of research are not needed. Next to nothing is to be
learned ahout how to raise IQ by more evaluations of Head Start, or
even hy replicating much hetter programs such as Perry Preschool or
Ahecedarian. The main lesson to he learned from these better programs
has already been learned: It is tough to alter the environment for the
development of general intellectual ability by anything short of adop-
tion at birth. Ry now, researchers know enough to he confident that the
next demonstration program is not going to be the magic bullet, because
they have already demonstrated beyond dispute that the "environment"
is an unimaginably complex melange of influences and inputs for all the
child's waking hours (and perhaps some sleeping hours too). No mean-
ingful proportion of that melange can reasonably he expected to be
shaped by any outside intervention into the child's social environment,
even one that lasts eight hours a day, using the repertoire of techniques
now available. To have a large effect, we need new knowledge about
cognitive development.
New knowledge is likely to come from sharply focused investigations
into the development of cognitive ability, conducted in an atmosphere
that imposes no constraints on the researchers other than to seek and
find useful knowledge within commonly accepted ethical constraints.
The most promising leads may come from insights into the physiologi-
cal basis of intelligence rather than from the cultural or educational vari-
ables that have been customary in educational research. Long-term
funding, buffers against bureaucratic meddling, readiness to fund re-
search on the hardest questions, if they are brought forward by the in-
ner logic of the science, and not just the politically correct questions:
This is what is needed, and what today's research programs seldom pro-
vide. With that set of caveats on the table, more research is indeed at
the top of our policy agenda. Because intelligence is less than completely
Environment and Cognitive Development
- Studies of children adopted across socioeconomic lines show a twelve-point IQ benefit when moving from low-SES to high-SES homes.
- The magnitude of environmental impact depends on the scale of the shift, with extreme moves potentially yielding up to twenty IQ points.
- While adoption shows significant results, equalizing home environments upward on a societal scale remains an unsolved challenge.
- Traditional intervention programs like Head Start have proven insufficient for significantly altering general intellectual ability.
- The environment is described as an unimaginably complex melange of influences that cannot be easily replicated by outside social interventions.
- Future progress requires new knowledge about cognitive development rather than further evaluations of existing demonstration programs.
The main lesson to he learned from these better programs has already been learned: It is tough to alter the environment for the development of general intellectual ability by anything short of adoption at birth.
4 1 2
Living Together
Raising Cognitive Ability
4 1 3
adopted children. But, second, they scored twelve points higher than
twenty of their full or half-siblings who were reared at least for a time
by a biological parent or grandparent in lower-class surroundings.ln2'
This study ~rovides a rare chance to estimate roughly where the
adoptees would have been had they remained in their original homes.
A second French study compared four small groups of adopted chil-
dren, reared in either high- or low-SES homes, and the biological off-
spring of high- or low-SES parents. Thus one could ask, albeit with only
a handful of children,lR3' what happens when children born to low-SES
parents are adopted into a high-SES home or when children horn to
high-SES parents are adopted into low-SES homes; and so on. In this
study as well, the switch from low to high status in the home environ-
ment produced a twelve-point benefit in IQ.I'~'SUC~
findings, of course,
implicate the home environment as a factor in the development of cog-
nitive ability. We cannot be sure how much, because we do not know
exactly how far down the SES ladder the children came from, or how
far up the ladder they were moved into their adoptive homes. If the
twelve-point shift is produced by a small shift in environment (e.g., a
child of a truck driver adopted by the family of a bank clerk), it gives a
great deal of hope for the effects of adoption; if it was produced only by
a huge shift in the environment (e.g., the child of a chronically unem-
ployed illiterate adopted by the Rothschilds), not so much hope. In gen-
eral, the more important the environment is inshaping cognitive ability,
the larger the impact a given change in environment has on IQ.
To see what the policy implications might be, let us suppose that low-
and high-SES homes in the French studies represented the 10th and
90th centiles in the quality of the home environment, respectively. If
that were the case, what might be accomplished by moving children
from very deprived homes (at the 2d centile, to make the example con-
crete) to very advantaged ones (98th centile)? The results of the French
study imply that such a shift in home environment would produce a hen-
efit of almost twenty IQ points.1R5'
A swing of twenty points is considerable and seems to open up the
possibility of large gains in intelligence to be had by equalizing homes
"upward," by appropriating for more families whatever nurturing things
go on in the homes of the top I or 2 percent in socioeconomic status.''61
The problem, obviously, is that no one knows how to equalize environ-
ments upward on so grand a scale, particularly since so much of what
goes on in the nurturing of children is associated with the personalitv
and behavior of the parent, not material wealth. This brings us to a va-
riety of policy issues that it is now time to discuss more explicitly.
A POLICY AGENDA
Research
Nothing is more predictable than that researchers will conclude that
what is most needed is more research. In this case, however, the ilsually
predictable is a little less so.
Certain kinds of research are not needed. Next to nothing is to be
learned ahout how to raise IQ by more evaluations of Head Start, or
even hy replicating much hetter programs such as Perry Preschool or
Ahecedarian. The main lesson to he learned from these better programs
has already been learned: It is tough to alter the environment for the
development of general intellectual ability by anything short of adop-
tion at birth. Ry now, researchers know enough to he confident that the
next demonstration program is not going to be the magic bullet, because
they have already demonstrated beyond dispute that the "environment"
is an unimaginably complex melange of influences and inputs for all the
child's waking hours (and perhaps some sleeping hours too). No mean-
ingful proportion of that melange can reasonably he expected to be
shaped by any outside intervention into the child's social environment,
even one that lasts eight hours a day, using the repertoire of techniques
now available. To have a large effect, we need new knowledge about
cognitive development.
New knowledge is likely to come from sharply focused investigations
into the development of cognitive ability, conducted in an atmosphere
that imposes no constraints on the researchers other than to seek and
find useful knowledge within commonly accepted ethical constraints.
The most promising leads may come from insights into the physiologi-
cal basis of intelligence rather than from the cultural or educational vari-
ables that have been customary in educational research. Long-term
funding, buffers against bureaucratic meddling, readiness to fund re-
search on the hardest questions, if they are brought forward by the in-
ner logic of the science, and not just the politically correct questions:
This is what is needed, and what today's research programs seldom pro-
vide. With that set of caveats on the table, more research is indeed at
the top of our policy agenda. Because intelligence is less than completely
Limits of Cognitive Intervention
- Future breakthroughs in raising intelligence likely depend on physiological research rather than traditional cultural or educational variables.
- Current educational research is often hampered by bureaucratic meddling and a focus on politically correct questions rather than scientific logic.
- While basic nutrition and supplements show some promise, the United States has reached a point of diminishing returns regarding gains from additional schooling.
- Standard preschool programs like Head Start fail to significantly impact cognitive functioning, though they may serve as important social refuges.
- Highly intensive, successful intervention projects are impossible to scale nationally due to prohibitive costs and unsustainable staffing requirements.
- Intervention efforts should shift focus toward rescuing children from dangerous environments rather than making unsubstantiated claims about IQ gains.
The debate over Head Start should move away from frivolous claims about how many dollars it will save in the long run, none of which stands up to examination.
4 1 2
Living Together
Raising Cognitive Ability
4 1 3
adopted children. But, second, they scored twelve points higher than
twenty of their full or half-siblings who were reared at least for a time
by a biological parent or grandparent in lower-class surroundings.ln2'
This study ~rovides a rare chance to estimate roughly where the
adoptees would have been had they remained in their original homes.
A second French study compared four small groups of adopted chil-
dren, reared in either high- or low-SES homes, and the biological off-
spring of high- or low-SES parents. Thus one could ask, albeit with only
a handful of children,lR3' what happens when children born to low-SES
parents are adopted into a high-SES home or when children horn to
high-SES parents are adopted into low-SES homes; and so on. In this
study as well, the switch from low to high status in the home environ-
ment produced a twelve-point benefit in IQ.I'~'SUC~
findings, of course,
implicate the home environment as a factor in the development of cog-
nitive ability. We cannot be sure how much, because we do not know
exactly how far down the SES ladder the children came from, or how
far up the ladder they were moved into their adoptive homes. If the
twelve-point shift is produced by a small shift in environment (e.g., a
child of a truck driver adopted by the family of a bank clerk), it gives a
great deal of hope for the effects of adoption; if it was produced only by
a huge shift in the environment (e.g., the child of a chronically unem-
ployed illiterate adopted by the Rothschilds), not so much hope. In gen-
eral, the more important the environment is inshaping cognitive ability,
the larger the impact a given change in environment has on IQ.
To see what the policy implications might be, let us suppose that low-
and high-SES homes in the French studies represented the 10th and
90th centiles in the quality of the home environment, respectively. If
that were the case, what might be accomplished by moving children
from very deprived homes (at the 2d centile, to make the example con-
crete) to very advantaged ones (98th centile)? The results of the French
study imply that such a shift in home environment would produce a hen-
efit of almost twenty IQ points.1R5'
A swing of twenty points is considerable and seems to open up the
possibility of large gains in intelligence to be had by equalizing homes
"upward," by appropriating for more families whatever nurturing things
go on in the homes of the top I or 2 percent in socioeconomic status.''61
The problem, obviously, is that no one knows how to equalize environ-
ments upward on so grand a scale, particularly since so much of what
goes on in the nurturing of children is associated with the personalitv
and behavior of the parent, not material wealth. This brings us to a va-
riety of policy issues that it is now time to discuss more explicitly.
A POLICY AGENDA
Research
Nothing is more predictable than that researchers will conclude that
what is most needed is more research. In this case, however, the ilsually
predictable is a little less so.
Certain kinds of research are not needed. Next to nothing is to be
learned ahout how to raise IQ by more evaluations of Head Start, or
even hy replicating much hetter programs such as Perry Preschool or
Ahecedarian. The main lesson to he learned from these better programs
has already been learned: It is tough to alter the environment for the
development of general intellectual ability by anything short of adop-
tion at birth. Ry now, researchers know enough to he confident that the
next demonstration program is not going to be the magic bullet, because
they have already demonstrated beyond dispute that the "environment"
is an unimaginably complex melange of influences and inputs for all the
child's waking hours (and perhaps some sleeping hours too). No mean-
ingful proportion of that melange can reasonably he expected to be
shaped by any outside intervention into the child's social environment,
even one that lasts eight hours a day, using the repertoire of techniques
now available. To have a large effect, we need new knowledge about
cognitive development.
New knowledge is likely to come from sharply focused investigations
into the development of cognitive ability, conducted in an atmosphere
that imposes no constraints on the researchers other than to seek and
find useful knowledge within commonly accepted ethical constraints.
The most promising leads may come from insights into the physiologi-
cal basis of intelligence rather than from the cultural or educational vari-
ables that have been customary in educational research. Long-term
funding, buffers against bureaucratic meddling, readiness to fund re-
search on the hardest questions, if they are brought forward by the in-
ner logic of the science, and not just the politically correct questions:
This is what is needed, and what today's research programs seldom pro-
vide. With that set of caveats on the table, more research is indeed at
the top of our policy agenda. Because intelligence is less than completely
4 1 4
Living Together
Raising Cognitive Ability
41 5
heritable, we can assume that, some day, it will be possible to raise the
intelligence of children through environmental interventions. But new
knowledge is required. Scientific research is the only way to get it.
Advocating that all children receive good nutrition does not come un-
der the heading of daring new ideas. We advocate it nonetheless. Espe-
cially if the inconsistent but suggestive results about the effects of
vitamin and mineral supplements on cognitive functioning are home
out, it would be worth considering such supplements as part of school
and preschool lunch programs.
Investment in Schooling
When quantum changes are made in education-moving
from no ed-
ucation to an elementary education, or from 6 years of schooling to 12-
then broad gains can occur, but the United States has in most respects
passed this stage. Additional attempts to raise IQ through special ac-
celerated courses have modest effects: short-term gains of two to four
I Q points after extensive training. Long-term gains are less clear and
likely to be smaller. In short, the school is not a promising place to try
to raise intelligence or to reduce intellectual differences, given the con-
straints on school budgets and the state of educational science.
General Purgose Preschool Programs
Much is already known about what can be accomplished by ordinarily
good preschool interventions-"ordinarily
good" meaning that a few
modestly trained adults who enjoy being with children watch over a few
dozen children in a pleasant atmosphere. It is hard to know how many
Head Start programs reach this standard. But a vast amount of research
tells us that even ordinarily good Head Starts do not affect cognitive
functioning much if at all. There is no reason to think that any realis-
tically improved version of Head Start, with its thousands of centers and
millions of participants, can add much to cognitive functioning. Even
the claims for long-term benefits of Head Start on social behavior are
unsubstantiated.
Such findings do not invalidate Head Start's value as a few hours'
daily refuge for small children who need it. But the debate over Head
Start should move away from frivolous claims about how many dollars
it will save in the long run, none of which stands up to examination,
and focus instead on the degree to which it is actually serving the laud-
able and more fundamental function of rescuing small children from un-
suitable, joyless, and dangerous environments.
Highly Targeted Preschool Programs
The nation cannot conceivably implement a Milwaukee Project or
Abecedarian Project for all disadvantaged children. It is not just the dol-
lar costs that put such ambitions out of reach (though they do) but the
impossibility of staffing them. With teacher-to-child ratios ranging as
high as one to three and staff-to-child ratios even higher, these programs
come close to calling for a trained person per eligible child.
But should such programs be mounted for the extremes-the
chil-
dren far out in the left-hand tail of home environments? We are not
talking about children who are just poor or just living in bad neighbor-
hoods, but children who are at high risk of mental retardation in an aw-
ful environment, with parents who function at a very low cognitive
level. Should such children be enrolled, within a few weeks of birth, in
a full-time day care setting until they begin kindergarten?
The decision cannot be justified purely o n grounds of cognitive ben-
efits, judging from what has come out of the Milwaukee and Abecedar-
ian projects. On the other hand, the evidence about improvements in
social adjustment from the Perry Preschool Project may be relevant, if
they stand up to further critical scrutiny. If they do, then highly inten-
sive preschool programs have an important role to play in socializing
children from highly disadvantaged backgrounds. Such results are not
as hopeful as they are sometimes portrayed, but they may be substantial.
Earlier, we said that the cost-benefit claims for Head Start could not
withstand examination. For programs that achieve results comparable
to those claimed for Perry Preschool, perhaps they could.[R71
But even
this limited endorsement is applicable only to the small fraction of the
population that is both at substantial risk for mental retardation and liv-
ing in the worst conditions. Comparatively few children typically clas-
sified as "disadvantaged" fall in that category.
Adoption
Adoption at birth from bad environments into good environments
raises cognitive functioning, especially in childhood and by amounts
Interventions for Disadvantaged Children
- Intensive preschool programs like the Perry Preschool Project may offer social adjustment benefits, though cognitive gains remain questionable.
- The cost-benefit ratio of such programs is only favorable for a small fraction of the population living in the most extreme conditions.
- Adoption at birth from a poor environment to a stable one is identified as a highly effective and inexpensive way to improve cognitive and noncognitive outcomes.
- The supply of qualified adoptive parents is large, yet political and social barriers frequently restrict the matching of infants with new homes.
- The authors advocate for a return to social norms where adoption was a more common outcome for children born into high-risk situations.
- Current social interventions lack a reliable, inexpensive method for raising IQ scores on a national scale despite significant public spending.
But let it be said plainly: Anyone seeking an inexpensive way to do some good for an expandable number of the most disadvantaged infants should look at adoption.
4 1 4
Living Together
Raising Cognitive Ability
41 5
heritable, we can assume that, some day, it will be possible to raise the
intelligence of children through environmental interventions. But new
knowledge is required. Scientific research is the only way to get it.
Advocating that all children receive good nutrition does not come un-
der the heading of daring new ideas. We advocate it nonetheless. Espe-
cially if the inconsistent but suggestive results about the effects of
vitamin and mineral supplements on cognitive functioning are home
out, it would be worth considering such supplements as part of school
and preschool lunch programs.
Investment in Schooling
When quantum changes are made in education-moving
from no ed-
ucation to an elementary education, or from 6 years of schooling to 12-
then broad gains can occur, but the United States has in most respects
passed this stage. Additional attempts to raise IQ through special ac-
celerated courses have modest effects: short-term gains of two to four
I Q points after extensive training. Long-term gains are less clear and
likely to be smaller. In short, the school is not a promising place to try
to raise intelligence or to reduce intellectual differences, given the con-
straints on school budgets and the state of educational science.
General Purgose Preschool Programs
Much is already known about what can be accomplished by ordinarily
good preschool interventions-"ordinarily
good" meaning that a few
modestly trained adults who enjoy being with children watch over a few
dozen children in a pleasant atmosphere. It is hard to know how many
Head Start programs reach this standard. But a vast amount of research
tells us that even ordinarily good Head Starts do not affect cognitive
functioning much if at all. There is no reason to think that any realis-
tically improved version of Head Start, with its thousands of centers and
millions of participants, can add much to cognitive functioning. Even
the claims for long-term benefits of Head Start on social behavior are
unsubstantiated.
Such findings do not invalidate Head Start's value as a few hours'
daily refuge for small children who need it. But the debate over Head
Start should move away from frivolous claims about how many dollars
it will save in the long run, none of which stands up to examination,
and focus instead on the degree to which it is actually serving the laud-
able and more fundamental function of rescuing small children from un-
suitable, joyless, and dangerous environments.
Highly Targeted Preschool Programs
The nation cannot conceivably implement a Milwaukee Project or
Abecedarian Project for all disadvantaged children. It is not just the dol-
lar costs that put such ambitions out of reach (though they do) but the
impossibility of staffing them. With teacher-to-child ratios ranging as
high as one to three and staff-to-child ratios even higher, these programs
come close to calling for a trained person per eligible child.
But should such programs be mounted for the extremes-the
chil-
dren far out in the left-hand tail of home environments? We are not
talking about children who are just poor or just living in bad neighbor-
hoods, but children who are at high risk of mental retardation in an aw-
ful environment, with parents who function at a very low cognitive
level. Should such children be enrolled, within a few weeks of birth, in
a full-time day care setting until they begin kindergarten?
The decision cannot be justified purely o n grounds of cognitive ben-
efits, judging from what has come out of the Milwaukee and Abecedar-
ian projects. On the other hand, the evidence about improvements in
social adjustment from the Perry Preschool Project may be relevant, if
they stand up to further critical scrutiny. If they do, then highly inten-
sive preschool programs have an important role to play in socializing
children from highly disadvantaged backgrounds. Such results are not
as hopeful as they are sometimes portrayed, but they may be substantial.
Earlier, we said that the cost-benefit claims for Head Start could not
withstand examination. For programs that achieve results comparable
to those claimed for Perry Preschool, perhaps they could.[R71
But even
this limited endorsement is applicable only to the small fraction of the
population that is both at substantial risk for mental retardation and liv-
ing in the worst conditions. Comparatively few children typically clas-
sified as "disadvantaged" fall in that category.
Adoption
Adoption at birth from bad environments into good environments
raises cognitive functioning, especially in childhood and by amounts
4 1 6
Living Together
that are not well established. In general, the worse the home that would
have been provided by the biological parents and the better the adop-
tive home, the greater is the cognitive benefit of adoption. Adoption at
birth seems to produce positive noncognitive effects as well. In terms of
government budgets, adoption is cheap; the new parents hear all the
costs of twenty-four-hour-a-day care for eighteen years or so. The sup-
ply of eager and qualified adoptive parents for infants is large, even for
infants with special needs.
If adoption is one of the only affordable and successful ways known
to improve the life chances of disadvantaged children appreciably, why
has it been so ignored in congressional debate and presidential propos-
als? Why do current adoption practices make it so difficult for would-
be parents and needy infants to match up? Why are cross-racial
adoptions so often restricted or even banned? All these questions have
political and social answers that would take us far outside our territory.
But let it be said plainly: Anyone seeking an inexpensive way to do some
good for an expandable number of the most disadvantaged infants
should look at adoption.
The tough question about adoption involves the way the adoption
decision is made. Governments should not be able to force parents to
give up their children for any except the most compelling of reasons.
Right now, the government already has the power (varying by state),
based on evidence of neglect and abuse, which we do not advocate ex-
panding. Instead, we want to return to the state of affairs that prevailed
until the 1960s, when children born to single women-where
much of
the problem of child neglect and abuse originates-were
more likely to
be given up for adoption at birth. This was, in our view, a better state
of affairs than we have now. Some recommendations for turning hack
this particular clock are in Chapter 22.
Realism
A n inexpensive, reliable method of raising 1Q is not available. The wish
that it were is understandable, and to pursue the development of such
methods is worthwhile. But to think that the available repertoire of so-
cial interventions can do the job if only the nation spends more money
on them is illusory. No one yet knows how to raise low 1Qs substantially
on a national level. We need to look elsewhere for solutions to the prob-
lems that the earlier chapters have described.
Chapter 18
The Leveling of American
Education
Most people think that American public education is in terrible shape, and any
number of allegations seem to confirm. it. But a search of the data does not re-
veal that the typical American school child in the past would have done any
better on tests ofacademic skills. An American youth with average IQ is prob-
ably better prepared academically now than ever before. The problem with
American education is confined mainly to one group of students, the cogni-
tively gifted. Among the most gifted students, SAT scores started falling in the
mid- 1 960s, and the verbal scores have not recovered since.
One reason is that disadvantaged students have been "in" and gifted stu-
dents "out" for thirty years. Even in the 1990s, only one-tenth of 1 percent
of all the federal funds spent on elementary and secondary education go to
programs for the gifted. Because success was measured in terms of how well
the average and below-average children pe$ormed, American education was
dumbed down: Textbooks were made easier, and requirements for courses,
homework, and graduation were relaxed. These measures may have worked
as intended for the average and below-average students, but they let the gifted
get away without ever developing their potential.
In thinking about policy, the first step is to realize where we are. In a uni-
versal education system, many students will fall short of basic academic com-
petence. Most American parents say they are already satisfied with their local
school. The average student has little incentive to work hard in high school.
Getting into most colleges is easy, and achievement in high school does not
pay off in higher wages or better jobs for those who do not go to college . On
a brighter note, realism also leads one to expect that modest improvements in
the education of average students will continue as they have throughout the
century except for the aberrational period from the mid-1960s to mid-1 970s.
In trying to build on this natural improvement, the federal government
The Leveling of American Education
- Contrary to popular belief, the average American student is academically better prepared today than in the past, with the decline in education quality primarily affecting the cognitively gifted.
- Since the 1960s, educational policy has prioritized disadvantaged students, resulting in a 'dumbing down' of textbooks and graduation requirements to accommodate the average.
- The lack of incentives for high school achievement, such as easy college admissions and a lack of wage premiums for non-college graduates, discourages students from working hard.
- Federal funding is disproportionately skewed, with only 0.1 percent of elementary and secondary education funds allocated to programs for gifted students.
- The authors advocate for a 'change of heart' among educators to recognize that society's future depends on fostering wisdom and virtue in the most capable students.
- Current educational philosophy views the prioritization of high-capacity learners as 'dangerously elitist,' a shift from the historical goal of educating the gifted for the benefit of society.
For thirty years, IQ has been out of fashion among American educators, and the idea that people with the most capacity to be educated should become the most educated sounds dangerously elitest.
4 1 6
Living Together
that are not well established. In general, the worse the home that would
have been provided by the biological parents and the better the adop-
tive home, the greater is the cognitive benefit of adoption. Adoption at
birth seems to produce positive noncognitive effects as well. In terms of
government budgets, adoption is cheap; the new parents hear all the
costs of twenty-four-hour-a-day care for eighteen years or so. The sup-
ply of eager and qualified adoptive parents for infants is large, even for
infants with special needs.
If adoption is one of the only affordable and successful ways known
to improve the life chances of disadvantaged children appreciably, why
has it been so ignored in congressional debate and presidential propos-
als? Why do current adoption practices make it so difficult for would-
be parents and needy infants to match up? Why are cross-racial
adoptions so often restricted or even banned? All these questions have
political and social answers that would take us far outside our territory.
But let it be said plainly: Anyone seeking an inexpensive way to do some
good for an expandable number of the most disadvantaged infants
should look at adoption.
The tough question about adoption involves the way the adoption
decision is made. Governments should not be able to force parents to
give up their children for any except the most compelling of reasons.
Right now, the government already has the power (varying by state),
based on evidence of neglect and abuse, which we do not advocate ex-
panding. Instead, we want to return to the state of affairs that prevailed
until the 1960s, when children born to single women-where
much of
the problem of child neglect and abuse originates-were
more likely to
be given up for adoption at birth. This was, in our view, a better state
of affairs than we have now. Some recommendations for turning hack
this particular clock are in Chapter 22.
Realism
A n inexpensive, reliable method of raising 1Q is not available. The wish
that it were is understandable, and to pursue the development of such
methods is worthwhile. But to think that the available repertoire of so-
cial interventions can do the job if only the nation spends more money
on them is illusory. No one yet knows how to raise low 1Qs substantially
on a national level. We need to look elsewhere for solutions to the prob-
lems that the earlier chapters have described.
Chapter 18
The Leveling of American
Education
Most people think that American public education is in terrible shape, and any
number of allegations seem to confirm. it. But a search of the data does not re-
veal that the typical American school child in the past would have done any
better on tests ofacademic skills. An American youth with average IQ is prob-
ably better prepared academically now than ever before. The problem with
American education is confined mainly to one group of students, the cogni-
tively gifted. Among the most gifted students, SAT scores started falling in the
mid- 1 960s, and the verbal scores have not recovered since.
One reason is that disadvantaged students have been "in" and gifted stu-
dents "out" for thirty years. Even in the 1990s, only one-tenth of 1 percent
of all the federal funds spent on elementary and secondary education go to
programs for the gifted. Because success was measured in terms of how well
the average and below-average children pe$ormed, American education was
dumbed down: Textbooks were made easier, and requirements for courses,
homework, and graduation were relaxed. These measures may have worked
as intended for the average and below-average students, but they let the gifted
get away without ever developing their potential.
In thinking about policy, the first step is to realize where we are. In a uni-
versal education system, many students will fall short of basic academic com-
petence. Most American parents say they are already satisfied with their local
school. The average student has little incentive to work hard in high school.
Getting into most colleges is easy, and achievement in high school does not
pay off in higher wages or better jobs for those who do not go to college . On
a brighter note, realism also leads one to expect that modest improvements in
the education of average students will continue as they have throughout the
century except for the aberrational period from the mid-1960s to mid-1 970s.
In trying to build on this natural improvement, the federal government
4 18
Living Together
The Leveling of American Education
4 19
should support greater flexibility for parents to send their children to schools
of their choosing, whether through vouchers, tax credits, or choice within the
public schools. Federal scholarships should reward academic performance.
Some federal funds now so exclusively focused on the disadvanqed should
be reallocated to programs for the gifted.
We urge pn'marily not a set of new laws but a change of heart within the
ranks of educators. Until the latter half ofthis century, it was taken for granted
that one of the chief purposes of education was to educate the gifted-not
be-
came they deserved it through their own merit but because, for better or worse,
the future of society was so dependent on them. It was further understood that
this education must aim for more than technical facility. It must be an edu-
cation that fosters wisdom and virtue through the ideal of the "educated man. "
Little will change until educators once again embrace this aspect of their vo-
cation.
e education of the young is something that all human societies are
committed to do. They can do it well or poorly. Many billions of
T"
dollars are already available for education in America. Can we spend
them more wisely and produce better results? Our comer of the topic is
how cognitive ability fits into the picture.
It seems self-evident: Education is what intelligence is most obviously
good for. One ideal of American education is to educate everyone to his
or her potential. The students with the most capacity to absorb educa-
tion should get the most of it-most
in years, breadth, depth, and chal-
lenge. But what should be self-evident is not. For thirty years, IQ has
been out of fashion among American educators, and the idea that peo-
ple with the most capacity to be educated should become the most ed-
ucated sounds dangerously elitest.
It needs to be said openly: The people who run the United States-
create its jobs, expand its technologies, cure its sick, teach in its uni-
versities, administer its cultural and political and legal institutions-are
drawn mainly from a thin layer of cognitive ability at the top. (Re-
member-just
the top 1 percent of the American population consists of
2.5 million people.) It matters enormously not just that the people in
the top few centiles of ability get to college (almost all of them do, as
we described in Chapter 1) or even that many of them go to elite col-
leges but that they are educated well. One theme of this chapter is that
since the 1960s, while a cognitive elite has become increasingly segre-
gated from the rest of the country, the quality of the education they re-
ceive has been degraded. They continue to win positions, money,
prestige, and success in competition with their less gifted fellow citizens,
but they are less well educated in the ways that make smart children
into wise adults.
Letting people develop to their fullest potential is not the only im-
portant goal of public education. Since the founding of the republic,
thoughtful Americans have recognized that an educated citizenry is vi-
tal to its survival. This chapter therefore examines how well our coun-
try fares in educating the average student-not
the one who is likely to
occupy a place among the cognitive elite but the one most representa-
tive of the typical American. We find that the average American young-
ster is probably doing better on tests of academic skills than ever before.
We will try to understand why a sense of crisis nevertheless surrounds
American education despite this unexpected good news.
We begin with quantitative evidence that shows the general outline
of these trends and their connection to each other. Then we switch to
observations of the kind that do not lend themselves to survey results
or regression equations but that we believe to be justified by everyday
experience in our schools and colleges.
TRENDS IN EDUCATION I: THE AVERAGE STUDENT
A few years ago, the Wall Street Jouml devoted its op-ed page to a re-
production of an examination administered by Jersey City High School
in 1885.' It consisted of questions such as the following:
Find the product of 3 + 4x + 5x2 - 6x3 and 4 - 5x - 6x2.
Write a sentence containing a noun used as an attribute, a verb in
the perfect tense potential mood, and a proper adjective.
Name three events of 1777. Which was the most important and why?
The test was not for high school graduation (which would be impres-
sive enough) but for admission to Jersey City High School. Fifteen-year-
olds were supposed to know the answers to these questions. Of course,
not many people went to high school in 1885. But could even the cream
of the 15-year-olds in Jersey City's middle schools pass that exam today!
It seems unlikely.
The Leveling of American Education
- The United States is governed and operated by a thin layer of cognitive elite, representing roughly the top 1 percent of the population.
- While this elite group is increasingly segregated from the rest of society, the quality of their education has paradoxically degraded since the 1960s.
- The authors argue that while the elite still achieve professional success, they are no longer being educated in ways that transform intelligence into wisdom.
- Contrary to popular belief, the average American student is performing better on academic skill tests than in previous generations.
- Despite statistical improvements for the average student, a sense of educational crisis persists, fueled by comparisons to the rigorous standards of the past.
- Historical benchmarks, such as an 1885 high school entrance exam, suggest that the depth of knowledge expected of students has declined significantly.
They continue to win positions, money, prestige, and success in competition with their less gifted fellow citizens, but they are less well educated in the ways that make smart children into wise adults.
4 18
Living Together
The Leveling of American Education
4 19
should support greater flexibility for parents to send their children to schools
of their choosing, whether through vouchers, tax credits, or choice within the
public schools. Federal scholarships should reward academic performance.
Some federal funds now so exclusively focused on the disadvanqed should
be reallocated to programs for the gifted.
We urge pn'marily not a set of new laws but a change of heart within the
ranks of educators. Until the latter half ofthis century, it was taken for granted
that one of the chief purposes of education was to educate the gifted-not
be-
came they deserved it through their own merit but because, for better or worse,
the future of society was so dependent on them. It was further understood that
this education must aim for more than technical facility. It must be an edu-
cation that fosters wisdom and virtue through the ideal of the "educated man. "
Little will change until educators once again embrace this aspect of their vo-
cation.
e education of the young is something that all human societies are
committed to do. They can do it well or poorly. Many billions of
T"
dollars are already available for education in America. Can we spend
them more wisely and produce better results? Our comer of the topic is
how cognitive ability fits into the picture.
It seems self-evident: Education is what intelligence is most obviously
good for. One ideal of American education is to educate everyone to his
or her potential. The students with the most capacity to absorb educa-
tion should get the most of it-most
in years, breadth, depth, and chal-
lenge. But what should be self-evident is not. For thirty years, IQ has
been out of fashion among American educators, and the idea that peo-
ple with the most capacity to be educated should become the most ed-
ucated sounds dangerously elitest.
It needs to be said openly: The people who run the United States-
create its jobs, expand its technologies, cure its sick, teach in its uni-
versities, administer its cultural and political and legal institutions-are
drawn mainly from a thin layer of cognitive ability at the top. (Re-
member-just
the top 1 percent of the American population consists of
2.5 million people.) It matters enormously not just that the people in
the top few centiles of ability get to college (almost all of them do, as
we described in Chapter 1) or even that many of them go to elite col-
leges but that they are educated well. One theme of this chapter is that
since the 1960s, while a cognitive elite has become increasingly segre-
gated from the rest of the country, the quality of the education they re-
ceive has been degraded. They continue to win positions, money,
prestige, and success in competition with their less gifted fellow citizens,
but they are less well educated in the ways that make smart children
into wise adults.
Letting people develop to their fullest potential is not the only im-
portant goal of public education. Since the founding of the republic,
thoughtful Americans have recognized that an educated citizenry is vi-
tal to its survival. This chapter therefore examines how well our coun-
try fares in educating the average student-not
the one who is likely to
occupy a place among the cognitive elite but the one most representa-
tive of the typical American. We find that the average American young-
ster is probably doing better on tests of academic skills than ever before.
We will try to understand why a sense of crisis nevertheless surrounds
American education despite this unexpected good news.
We begin with quantitative evidence that shows the general outline
of these trends and their connection to each other. Then we switch to
observations of the kind that do not lend themselves to survey results
or regression equations but that we believe to be justified by everyday
experience in our schools and colleges.
TRENDS IN EDUCATION I: THE AVERAGE STUDENT
A few years ago, the Wall Street Jouml devoted its op-ed page to a re-
production of an examination administered by Jersey City High School
in 1885.' It consisted of questions such as the following:
Find the product of 3 + 4x + 5x2 - 6x3 and 4 - 5x - 6x2.
Write a sentence containing a noun used as an attribute, a verb in
the perfect tense potential mood, and a proper adjective.
Name three events of 1777. Which was the most important and why?
The test was not for high school graduation (which would be impres-
sive enough) but for admission to Jersey City High School. Fifteen-year-
olds were supposed to know the answers to these questions. Of course,
not many people went to high school in 1885. But could even the cream
of the 15-year-olds in Jersey City's middle schools pass that exam today!
It seems unlikely.
420
Living Together
The Leveling of American Education
42 1
Bits of national memorabilia like this reinforce an impression that is
nearly universal in this country: American elementary and secondary
education used to be better. The 1983 report by the Department of Ed-
ucation, A Nation at Risk, said so most famously, concluding that "we
have, in effect, been committing an act of unthinking, unilateral edu-
cational disarmament."' Its chairman concluded flatly that "for the first
time in the history of our country, the educational skills of one genera-
tion will not surpass, will not equal, will not even approach, those of
their parents."j
We begin by affirming the conventional wisdom in one respect: The
academic
of the average American student looks awful at
first glance. Consider illiteracy, for example. Some authorities claim
that a third of the population is functionally illiter~e.~
No one really
knows-when
does "literacy" begin?-but no matter where the precise
figure lies, the proportion is large. As of 1990,16 percent of the 17-year-
olds still in school were below the level called "intermediate" in the Na-
tional Assessment of Educational Progress (NAEP) reading test-in
effect, below the threshold for dealing with moderately complex writ-
ten material.5 Then one must consider that more than 20 percent of 17-
year-olds had already dropped out of school and were not part of the
sample,' bringing us somewhere above 20 percent of the population who
cannot use reading as a flexible tool of daily life.
There is a profusion of horror stories in other subjects. Fewer than
one in three American 17-year-olds in a nationally representative sam-
ple could place the Civil War within the correct half-century of its ac-
tual occurrence.' Fewer than 60 percent of American 17-year-olds could
correctly answer the item, "A hockey team won five of its 20 games.
What percent of the games did it win?"R More than 60 percent of adults
in their early twenties cannot synthesize the main argument of a news-
paper article."orty-four percent of adult Americans cannot understand
"help wanted" ads well enough to match their qualifications with the
job requirements. Twenty-two percent cannot address a letter well
enough to make sure the post office can deliver it.'"
Critics of American education also point to international compar-
isons. Between the early 1960s and the end of the 1980s, six major in-
ternational studies compared mathematical competence, science
knowledge, or both, across countries.[''' The National Center for Edu-
cation Statistics has conveniently assembled all of the results for the
first five studies in a series of twenty-two tables showing the United
States' ranking for each scale. The results for the industrialized coun-
tries are easily summarized: In seven of the twenty-two tables, the
United States is at the very bottom; in eight others, within two coun-
tries of the bottom; in four of the remaining seven, in the bottom half.''
The most recent study, conducted in 1991, found that the United States
continued to rank near the bottom on every test of every age group for
the math tests and near the middle on the science tests."
International comparisons need to be interpreted cautio~sl~.~'~'
But
the most common defense for America's poor showing is losing credi-
bility. For years, educators excused America's performance as the price
America pays for retaining such a high proportion of its students into
high school. Rut Japan has had as high a retention rate for years, and
recently many European nations, including some that continue to
outscore us on the international tests, have caught up as we11.I5
The picture is surely depressing. But as we look hack to the idealized
America of the earlier part of the century, can we catch sight of Amer-
ican school children who, on average, would have done any better on
such measures than the youngsters of today? A growing number of ed-
ucational researchers are arguing that the answer is no.16 With qualifi-
cations that the chapter will explain, we associate ourselves with their
findings. According to every longitudinal measure that we have been ahle to
find, there is no evidence that the preparation of the average American youth
is worse in the 1990s than it has ever been. Considerable evidence suggests
that, on the contrary, education for the average youth has improved
steadily throughout the twentieth century except for a period of decline
in the late 1960s and early 1970s (which justified to some degree the
alarming conclusions of the early 1980s) but from which the educational
system has already fully recovered. How can we get away with these
statements that seem so contrary to what everyone knows? We do it by
means of that innocuous word, "average."
During the first half of the twentieth century, education for the average
American young person improved steadily, partly because the average
American young person spent more time in school than previously
(Chapter 6). But much other evidence, marshaled convincingly by
economist John Bishop, indicates a steady, long-term improvement in
what Bishop calls "general intellectual achievement" that extended
from the earliest data at the turn of the century into the 1960s." Even
if we discount some of these results as reflections of the Flynn effect,[lR1
The Crisis of Average Education
- Statistical data reveals that over 20 percent of American 17-year-olds lack the reading proficiency required for daily life.
- Basic literacy and numeracy failures are widespread, with many adults unable to synthesize newspaper articles or calculate simple percentages.
- International comparisons consistently place the United States at or near the bottom of industrialized nations in math and science performance.
- The traditional defense that low scores are a byproduct of high student retention rates is failing as other nations achieve high retention with better results.
- Despite these 'horror stories,' longitudinal data suggests the average American student is actually better prepared today than in the early 20th century.
- The perceived decline in education is largely a result of a temporary dip in the 1960s and 1970s rather than a century-long decay.
Fewer than one in three American 17-year-olds in a nationally representative sample could place the Civil War within the correct half-century of its actual occurrence.
420
Living Together
The Leveling of American Education
42 1
Bits of national memorabilia like this reinforce an impression that is
nearly universal in this country: American elementary and secondary
education used to be better. The 1983 report by the Department of Ed-
ucation, A Nation at Risk, said so most famously, concluding that "we
have, in effect, been committing an act of unthinking, unilateral edu-
cational disarmament."' Its chairman concluded flatly that "for the first
time in the history of our country, the educational skills of one genera-
tion will not surpass, will not equal, will not even approach, those of
their parents."j
We begin by affirming the conventional wisdom in one respect: The
academic
of the average American student looks awful at
first glance. Consider illiteracy, for example. Some authorities claim
that a third of the population is functionally illiter~e.~
No one really
knows-when
does "literacy" begin?-but no matter where the precise
figure lies, the proportion is large. As of 1990,16 percent of the 17-year-
olds still in school were below the level called "intermediate" in the Na-
tional Assessment of Educational Progress (NAEP) reading test-in
effect, below the threshold for dealing with moderately complex writ-
ten material.5 Then one must consider that more than 20 percent of 17-
year-olds had already dropped out of school and were not part of the
sample,' bringing us somewhere above 20 percent of the population who
cannot use reading as a flexible tool of daily life.
There is a profusion of horror stories in other subjects. Fewer than
one in three American 17-year-olds in a nationally representative sam-
ple could place the Civil War within the correct half-century of its ac-
tual occurrence.' Fewer than 60 percent of American 17-year-olds could
correctly answer the item, "A hockey team won five of its 20 games.
What percent of the games did it win?"R More than 60 percent of adults
in their early twenties cannot synthesize the main argument of a news-
paper article."orty-four percent of adult Americans cannot understand
"help wanted" ads well enough to match their qualifications with the
job requirements. Twenty-two percent cannot address a letter well
enough to make sure the post office can deliver it.'"
Critics of American education also point to international compar-
isons. Between the early 1960s and the end of the 1980s, six major in-
ternational studies compared mathematical competence, science
knowledge, or both, across countries.[''' The National Center for Edu-
cation Statistics has conveniently assembled all of the results for the
first five studies in a series of twenty-two tables showing the United
States' ranking for each scale. The results for the industrialized coun-
tries are easily summarized: In seven of the twenty-two tables, the
United States is at the very bottom; in eight others, within two coun-
tries of the bottom; in four of the remaining seven, in the bottom half.''
The most recent study, conducted in 1991, found that the United States
continued to rank near the bottom on every test of every age group for
the math tests and near the middle on the science tests."
International comparisons need to be interpreted cautio~sl~.~'~'
But
the most common defense for America's poor showing is losing credi-
bility. For years, educators excused America's performance as the price
America pays for retaining such a high proportion of its students into
high school. Rut Japan has had as high a retention rate for years, and
recently many European nations, including some that continue to
outscore us on the international tests, have caught up as we11.I5
The picture is surely depressing. But as we look hack to the idealized
America of the earlier part of the century, can we catch sight of Amer-
ican school children who, on average, would have done any better on
such measures than the youngsters of today? A growing number of ed-
ucational researchers are arguing that the answer is no.16 With qualifi-
cations that the chapter will explain, we associate ourselves with their
findings. According to every longitudinal measure that we have been ahle to
find, there is no evidence that the preparation of the average American youth
is worse in the 1990s than it has ever been. Considerable evidence suggests
that, on the contrary, education for the average youth has improved
steadily throughout the twentieth century except for a period of decline
in the late 1960s and early 1970s (which justified to some degree the
alarming conclusions of the early 1980s) but from which the educational
system has already fully recovered. How can we get away with these
statements that seem so contrary to what everyone knows? We do it by
means of that innocuous word, "average."
During the first half of the twentieth century, education for the average
American young person improved steadily, partly because the average
American young person spent more time in school than previously
(Chapter 6). But much other evidence, marshaled convincingly by
economist John Bishop, indicates a steady, long-term improvement in
what Bishop calls "general intellectual achievement" that extended
from the earliest data at the turn of the century into the 1960s." Even
if we discount some of these results as reflections of the Flynn effect,[lR1
The Leveling of American Education
- Economist John Bishop identifies a long-term improvement in general intellectual achievement from 1900 through the 1960s.
- While SAT scores showed a notable decline starting in the mid-1960s, this trend primarily affected the upper end of the cognitive distribution rather than the general population.
- National Assessment of Educational Progress (NAEP) data suggests that for the average student, academic performance remained relatively flat or showed only modest fluctuations between 1969 and 1990.
- National norm studies using the PSAT indicate that by 1983, American high school juniors were roughly as well-prepared as they were during the 1963 peak.
- The perceived 'deep and permanent' decline in American education is challenged by data showing that recovery for the average student was relatively quick.
- Long-term data from the Iowa Test of Educational Development (ITED) provides a stable metric for educational outcomes due to its consistent administration over fifty years.
Many people are under the impression that the decline was deep and permanent for the entire population of students. In reality, the decline for the average student was modest and recovery was quick.
420
Living Together
The Leveling of American Education
42 1
Bits of national memorabilia like this reinforce an impression that is
nearly universal in this country: American elementary and secondary
education used to be better. The 1983 report by the Department of Ed-
ucation, A Nation at Risk, said so most famously, concluding that "we
have, in effect, been committing an act of unthinking, unilateral edu-
cational disarmament."' Its chairman concluded flatly that "for the first
time in the history of our country, the educational skills of one genera-
tion will not surpass, will not equal, will not even approach, those of
their parents."j
We begin by affirming the conventional wisdom in one respect: The
academic
of the average American student looks awful at
first glance. Consider illiteracy, for example. Some authorities claim
that a third of the population is functionally illiter~e.~
No one really
knows-when
does "literacy" begin?-but no matter where the precise
figure lies, the proportion is large. As of 1990,16 percent of the 17-year-
olds still in school were below the level called "intermediate" in the Na-
tional Assessment of Educational Progress (NAEP) reading test-in
effect, below the threshold for dealing with moderately complex writ-
ten material.5 Then one must consider that more than 20 percent of 17-
year-olds had already dropped out of school and were not part of the
sample,' bringing us somewhere above 20 percent of the population who
cannot use reading as a flexible tool of daily life.
There is a profusion of horror stories in other subjects. Fewer than
one in three American 17-year-olds in a nationally representative sam-
ple could place the Civil War within the correct half-century of its ac-
tual occurrence.' Fewer than 60 percent of American 17-year-olds could
correctly answer the item, "A hockey team won five of its 20 games.
What percent of the games did it win?"R More than 60 percent of adults
in their early twenties cannot synthesize the main argument of a news-
paper article."orty-four percent of adult Americans cannot understand
"help wanted" ads well enough to match their qualifications with the
job requirements. Twenty-two percent cannot address a letter well
enough to make sure the post office can deliver it.'"
Critics of American education also point to international compar-
isons. Between the early 1960s and the end of the 1980s, six major in-
ternational studies compared mathematical competence, science
knowledge, or both, across countries.[''' The National Center for Edu-
cation Statistics has conveniently assembled all of the results for the
first five studies in a series of twenty-two tables showing the United
States' ranking for each scale. The results for the industrialized coun-
tries are easily summarized: In seven of the twenty-two tables, the
United States is at the very bottom; in eight others, within two coun-
tries of the bottom; in four of the remaining seven, in the bottom half.''
The most recent study, conducted in 1991, found that the United States
continued to rank near the bottom on every test of every age group for
the math tests and near the middle on the science tests."
International comparisons need to be interpreted cautio~sl~.~'~'
But
the most common defense for America's poor showing is losing credi-
bility. For years, educators excused America's performance as the price
America pays for retaining such a high proportion of its students into
high school. Rut Japan has had as high a retention rate for years, and
recently many European nations, including some that continue to
outscore us on the international tests, have caught up as we11.I5
The picture is surely depressing. But as we look hack to the idealized
America of the earlier part of the century, can we catch sight of Amer-
ican school children who, on average, would have done any better on
such measures than the youngsters of today? A growing number of ed-
ucational researchers are arguing that the answer is no.16 With qualifi-
cations that the chapter will explain, we associate ourselves with their
findings. According to every longitudinal measure that we have been ahle to
find, there is no evidence that the preparation of the average American youth
is worse in the 1990s than it has ever been. Considerable evidence suggests
that, on the contrary, education for the average youth has improved
steadily throughout the twentieth century except for a period of decline
in the late 1960s and early 1970s (which justified to some degree the
alarming conclusions of the early 1980s) but from which the educational
system has already fully recovered. How can we get away with these
statements that seem so contrary to what everyone knows? We do it by
means of that innocuous word, "average."
During the first half of the twentieth century, education for the average
American young person improved steadily, partly because the average
American young person spent more time in school than previously
(Chapter 6). But much other evidence, marshaled convincingly by
economist John Bishop, indicates a steady, long-term improvement in
what Bishop calls "general intellectual achievement" that extended
from the earliest data at the turn of the century into the 1960s." Even
if we discount some of these results as reflections of the Flynn effect,[lR1
42 2
Living Together
The Leveling of American Education
423
it is impossible to interpret the data from 1900 to 1950 as showing any.
thing other than some improvement. Then in the mid-1960s began a
period of decline, as manifested most notably by the fall in SAT scores.
Many people are under the impression that the decline was deep and
permanent for the entire population of students. In reality, the decline
for the average student was modest and recovery was quick. We know
this first through the NAEP, begun in 1969, which we discussed with
regard to ethnic differences in Chapter 13."" When the first NAEP tests
were given, the SAT score decline was in its fifth year and would con-
tinue for most of the next decade. The SAT is generally for a popula-
tion concentrated at the upper end of the cognitive ability distribution,
whereas the NAEP is for a nationally representative sample. While the
scores for the population taking the SAT were still declining, the trend-
lines of the NAEP results were flat. The differences between the earli-
est NAEP scores in reading, science, and math (which date from 1969
to 1973, depending on the test) and the scores in 1990 are a matter of
a few points and small fractions of a standard deviation, and scores of-
ten went up rather than down over that
SAT scores had started declining in 1964, but the NAEP goes back
only to 1969. To reach back further for nationally representative data,
we turn first to five almost completely unpublicized studies, known col-
lectively as the national norm studies, conducted by the Educational
Testing Service (ETS) in 1955, 1960, 1966, 1974, and 1983. In these
tests, a short version of the SAT (the Preliminary Scholastic Aptitude
Test, or PSAT) was administered to a nationally representative sample
of American high school juniors. The results are summarized in the table
below, adjusted so as to represent the mean score that all American ju-
-
What SAT Scote Decline? The Results of the National
Norm Studies, 1955-1983
Year
Verbal Mean
Math Mean
1955
348
417
1960
374
410
1966
383
395
1974
368
402
1983
376
41 1
Sources: Cole 1955; Chandler and Schrader 1966; Kacz and others 1970;
Jackson and Schrader 1976; Braun, Centra, and King 1987.
niors would have received on the SAT had they stayed in school for
their senior years and had they taken the SAT.
These results say that American eleventh graders as of 1983 were, as
a whole, roughly as well prepared in both verbal and math skills as they
had been when the college-bound SAT scores were at their peak in
1963, and noticeably stronger in their verbal skills than they had been
in the first norm study in 1955. The decline in verbal scores between
the 1966 and 1974 tests was 15 points-nly
about .14 standard devia-
tion. About half of that had been recovered by the 1983 test.lz'I
A third source is the Iowa Test of Educational Development (ITED),
a well-validated test, equated for stability from year to year, that has
been administered to virtually a 100 percent sample of Iowa's high
school students for fifty years. What may one learn from rural, white
Iowa? For examining trends in educational outcomes over time, quite a
bit. Iowa's sample of students provides socioeconomic variance-even
Iowa has single-parent families and welfare recipients. Paradoxically,
Iowa's atypical racial homogeneity (the population was more than 97
percent non-Latino white throughout the period we are discussing) is
an advantage for a longitudinal analysis by sidestepping the difficulties
of analyzing trends for populations that are changing in their ethnic
composition. In examining Iowa's test scores over time, we may not be
able to make judgments about how the education of minorities has
changed but we have a good view of what happened over the last sev-
eral decades for the white population.
Test scores for high school students in Iowa increased from the early
1940s to the mid-1960s, dropped sharply from 1966 to 1978, but then
rebounded, as shown in the figure below. We show the ninth-grade
scores, which have been least affected by changes in dropout rates dur-
ing the last fifty years. They show a steep rise through 1965 and an
equally steep rise after 1977, reaching new heights from 1983 0 n ~ a r d . l ~ ~ '
The improvement has been substantial-n
the order of half a standard
deviation since the mid-1970s, and about .2 standard deviation above
the previous high in 1965. The increase of 5.3 points from 1942 to 1992
may be interpreted as approaching one standard deviation.
Evidence from other, independent sources is consistent with the story
told by the national norm studies and the Iowa data. Project TALENT,
the huge study of high school students undertaken in 1960, readminis-
tered its reading comprehension test in 1970 to another sample and
found that a nationally representative sample of eleventh graders had
Trends in American Educational Achievement
- Longitudinal data from Iowa suggests that student test scores have generally improved over the last fifty years, despite a notable slump between 1966 and 1978.
- The improvement in Iowa's ninth-grade scores since the mid-1970s is substantial, reaching levels higher than the previous peak in 1965.
- National data and independent studies like Project TALENT largely corroborate the Iowa findings, showing gains even during periods of SAT score decline.
- International assessments indicate that while the U.S. has historically lagged behind other nations, the performance gap has been shrinking as national averages rise.
- The author suggests that while average student preparation may be at an all-time high, there is evidence of a specific decline among the top tier of students.
- The discrepancy between rising general test scores and falling SAT scores points to a divergence in achievement between the general student body and the cognitive elite.
The improvement has been substantial—on the order of half a standard deviation since the mid-1970s, and about .2 standard deviation above the previous high in 1965.
42 2
Living Together
The Leveling of American Education
423
it is impossible to interpret the data from 1900 to 1950 as showing any.
thing other than some improvement. Then in the mid-1960s began a
period of decline, as manifested most notably by the fall in SAT scores.
Many people are under the impression that the decline was deep and
permanent for the entire population of students. In reality, the decline
for the average student was modest and recovery was quick. We know
this first through the NAEP, begun in 1969, which we discussed with
regard to ethnic differences in Chapter 13."" When the first NAEP tests
were given, the SAT score decline was in its fifth year and would con-
tinue for most of the next decade. The SAT is generally for a popula-
tion concentrated at the upper end of the cognitive ability distribution,
whereas the NAEP is for a nationally representative sample. While the
scores for the population taking the SAT were still declining, the trend-
lines of the NAEP results were flat. The differences between the earli-
est NAEP scores in reading, science, and math (which date from 1969
to 1973, depending on the test) and the scores in 1990 are a matter of
a few points and small fractions of a standard deviation, and scores of-
ten went up rather than down over that
SAT scores had started declining in 1964, but the NAEP goes back
only to 1969. To reach back further for nationally representative data,
we turn first to five almost completely unpublicized studies, known col-
lectively as the national norm studies, conducted by the Educational
Testing Service (ETS) in 1955, 1960, 1966, 1974, and 1983. In these
tests, a short version of the SAT (the Preliminary Scholastic Aptitude
Test, or PSAT) was administered to a nationally representative sample
of American high school juniors. The results are summarized in the table
below, adjusted so as to represent the mean score that all American ju-
-
What SAT Scote Decline? The Results of the National
Norm Studies, 1955-1983
Year
Verbal Mean
Math Mean
1955
348
417
1960
374
410
1966
383
395
1974
368
402
1983
376
41 1
Sources: Cole 1955; Chandler and Schrader 1966; Kacz and others 1970;
Jackson and Schrader 1976; Braun, Centra, and King 1987.
niors would have received on the SAT had they stayed in school for
their senior years and had they taken the SAT.
These results say that American eleventh graders as of 1983 were, as
a whole, roughly as well prepared in both verbal and math skills as they
had been when the college-bound SAT scores were at their peak in
1963, and noticeably stronger in their verbal skills than they had been
in the first norm study in 1955. The decline in verbal scores between
the 1966 and 1974 tests was 15 points-nly
about .14 standard devia-
tion. About half of that had been recovered by the 1983 test.lz'I
A third source is the Iowa Test of Educational Development (ITED),
a well-validated test, equated for stability from year to year, that has
been administered to virtually a 100 percent sample of Iowa's high
school students for fifty years. What may one learn from rural, white
Iowa? For examining trends in educational outcomes over time, quite a
bit. Iowa's sample of students provides socioeconomic variance-even
Iowa has single-parent families and welfare recipients. Paradoxically,
Iowa's atypical racial homogeneity (the population was more than 97
percent non-Latino white throughout the period we are discussing) is
an advantage for a longitudinal analysis by sidestepping the difficulties
of analyzing trends for populations that are changing in their ethnic
composition. In examining Iowa's test scores over time, we may not be
able to make judgments about how the education of minorities has
changed but we have a good view of what happened over the last sev-
eral decades for the white population.
Test scores for high school students in Iowa increased from the early
1940s to the mid-1960s, dropped sharply from 1966 to 1978, but then
rebounded, as shown in the figure below. We show the ninth-grade
scores, which have been least affected by changes in dropout rates dur-
ing the last fifty years. They show a steep rise through 1965 and an
equally steep rise after 1977, reaching new heights from 1983 0 n ~ a r d . l ~ ~ '
The improvement has been substantial-n
the order of half a standard
deviation since the mid-1970s, and about .2 standard deviation above
the previous high in 1965. The increase of 5.3 points from 1942 to 1992
may be interpreted as approaching one standard deviation.
Evidence from other, independent sources is consistent with the story
told by the national norm studies and the Iowa data. Project TALENT,
the huge study of high school students undertaken in 1960, readminis-
tered its reading comprehension test in 1970 to another sample and
found that a nationally representative sample of eleventh graders had
424
Living Together
The Leveling of American Education
425
A half-century of Iowa tests: Improvement as the norm,
the slump as a twelve-year aberration
Composite score of Iowa 9th-graders
on the Iowa Test of Basic Skills
16 -
Source: lowa Testing Program, University of lowa.
gained slightly over its counterpart of 1960, during the same decade that
saw the steepest decline in the SAT. Other data on state tests in Vir-
ginia, New York, Texas, and California, summarized by the Congres-
sional Budget Office in its study of trends in educational achievement,
cannot match the time range of the Iowa or SAT norm data, but, within
their limits, they are generally consistent with the picture we have
sket~hed.~'
Even the international assessments are consistent. The
United States had some of its worst results in the first international as-
sessment, conducted in the early to mid-1960s when American SAT
scores were near their peak.24 Since then, the national American aver-
ages have been, on balance, rising and the deficit in international com-
parisons shrinking.
Taken as a whole, the data from representative samples of high school
students describe an American educational system that was probably
improving from the beginning of the century into the mid-1960s, un-
derwent a decline into the mid-1970s-steep
or shallow, depending on
the study-and
rebounded thereafter. Conservatively, average high
school students seem to be as well prepared in math and verbal skills as
they were in the 1950s. They may be better prepared than they have
ever been. If U.S. academic skills are deficient in comparison with other
nations, they have been comparatively so for a long time and are prob-
ably better than they were.
TRENDS IN EDUCATION 11: COLLEGE STUDENTS
Having questioned the widespread belief that high school education to-
day is worse on average than it used to be, we now reverse course and
offer some reasons for thinking that it has gotten worse for one specific
group of students: the pool of youths in the top 10 to 20 percent of the
cognitive ability distribution who are prime college material. To make
this case, we will focus on the best-known educational trend, the de-
cline in SAT scores. Visually, the story is told by what must be the most
frequently published trendlines in American educational circles, as
shown below.'251
The steep drop from 1963 to 1980 is no minor statistical fluctuation.
Taken at face value, it tells of an extraordinarily large downward shift
in academic aptitude-almost
half a standard deviation on the Verbal,
Forty-one years of SAT scores
National mean SAT scores
525 -
The Great Decline.
Source: The College Board. Scores for 1952-1969 are based on all tests administered during
the year; 1970-1993 on the most recent test taken hy seniors.
The Great SAT Decline
- National SAT scores experienced a significant drop between 1963 and 1976, losing nearly half a standard deviation in Verbal and a third in Math.
- The standard explanation—that the test pool was 'democratized' by including more disadvantaged students—is challenged by the data.
- Analysis shows that during the period of sharpest decline, the pool of white test-takers was actually shrinking and likely becoming more socioeconomically exclusive.
- Even after controlling for variables like gender, parental income, and parental education, the substantial drop in scores remains largely unexplained by demographic shifts.
- The authors conclude that the decline represents a genuine erosion of intellectual resources and academic preparation among the nation's brightest students.
We are left with compelling evidence of a genuine decline in the intellectual resources of our brightest youngsters.
424
Living Together
The Leveling of American Education
425
A half-century of Iowa tests: Improvement as the norm,
the slump as a twelve-year aberration
Composite score of Iowa 9th-graders
on the Iowa Test of Basic Skills
16 -
Source: lowa Testing Program, University of lowa.
gained slightly over its counterpart of 1960, during the same decade that
saw the steepest decline in the SAT. Other data on state tests in Vir-
ginia, New York, Texas, and California, summarized by the Congres-
sional Budget Office in its study of trends in educational achievement,
cannot match the time range of the Iowa or SAT norm data, but, within
their limits, they are generally consistent with the picture we have
sket~hed.~'
Even the international assessments are consistent. The
United States had some of its worst results in the first international as-
sessment, conducted in the early to mid-1960s when American SAT
scores were near their peak.24 Since then, the national American aver-
ages have been, on balance, rising and the deficit in international com-
parisons shrinking.
Taken as a whole, the data from representative samples of high school
students describe an American educational system that was probably
improving from the beginning of the century into the mid-1960s, un-
derwent a decline into the mid-1970s-steep
or shallow, depending on
the study-and
rebounded thereafter. Conservatively, average high
school students seem to be as well prepared in math and verbal skills as
they were in the 1950s. They may be better prepared than they have
ever been. If U.S. academic skills are deficient in comparison with other
nations, they have been comparatively so for a long time and are prob-
ably better than they were.
TRENDS IN EDUCATION 11: COLLEGE STUDENTS
Having questioned the widespread belief that high school education to-
day is worse on average than it used to be, we now reverse course and
offer some reasons for thinking that it has gotten worse for one specific
group of students: the pool of youths in the top 10 to 20 percent of the
cognitive ability distribution who are prime college material. To make
this case, we will focus on the best-known educational trend, the de-
cline in SAT scores. Visually, the story is told by what must be the most
frequently published trendlines in American educational circles, as
shown below.'251
The steep drop from 1963 to 1980 is no minor statistical fluctuation.
Taken at face value, it tells of an extraordinarily large downward shift
in academic aptitude-almost
half a standard deviation on the Verbal,
Forty-one years of SAT scores
National mean SAT scores
525 -
The Great Decline.
Source: The College Board. Scores for 1952-1969 are based on all tests administered during
the year; 1970-1993 on the most recent test taken hy seniors.
426
Living Together
The Leveling of American Education
42 7
almost a third of a standard deviation on the ~ a t h . " ~ '
And yet we have
just finished demonstrating that this large change is not reflected in the
aggregate national data for high school students. Which students, then,
account for the SATdecline! We try to answer that question in the next
few paragraphs, as we work our way through the most common expla-
nation of the decline. To anticipate our conclusion, the standard ex-
planation does not stand up to the data. We are left with compelling
evidence of a genuine decline in the intellectual resources of our bright-
est youngsters.
The most familiar explanation of the great decline is that the SAT
was "democratized" during the 1960s and 1970s. The pool of people tak-
ing the test expanded dramatically, it is said, bringing in students from
disadvantaged backgrounds who never used to consider going to col-
lege. This was a good thing, people agree, but it also meant that test
scores went down-a
natural consequence of breaking down the old
elites. The real problem is not falling SAT scores but the inferior edu-
cation for the disadvantaged that leads them to have lower test scores,
according to the standard account.27
This common view is mistaken. To make this case requires delving
into the details of the SAT and its population.2H
To summarize a complex
story: During the 1950s and into the early 1960s) the SAT pool expanded
dramatically, but scores remained steady. In the mid-1960s, scores
started to decline, but, by then, many state universities had become less
selective in their admissions process, often dropping the requirement
that students take SATs, and, as a result, many of the students in the mid-
dle level of the pool who formerly took the SAT stopped doing so. Fo-
cusing on the whites taking the SAT (thereby putting aside the effects
of the changing ethnic composition of the pool), we find that throughout
most of the whire SAT score decline, the white SAT pool was shrinking, not
expanding. We surmise that the white population of test takers during
this period was probably getting more exclusive socioeconomically, not
less. It is virtually impossible that it was becoming more democratized in
any socioeconomic sense.
After 1976, when detailed background data on white test takers be-
come available, the evidence is quite explicit. Although the size of the
pool once again began to expand during the 1980s, neither parental in-
come nor parental education of the white test takers changed.'291 After
factoring in the effects of changes in the gender of the pool and changes
in the difficulty of the SAT, we conclude that the aggregate real decline
from 1963 to 1976 among whites taking the SAT was on the order of
thirty-four to forty-four points on the Verbal and fifteen to twenty-five
points on the Math. From 1976 to 1993, the real white losses were no
more than a few additional points on the Verbal. On the Math, white
scores improved about three or four points in real terms after changes
in the pool are taken into account. Or in other words, when everything
is considered, there is reason to conclude that the size of the drop in the
SAT as shown in that familiar, unsophisticated graphic with which we
opened the discussion is for practical purposes the same size and shape
as the real change in the academic preparation of white college-bound
SAT test takers. Neither race, class, parental education, composition of
the pool, nor gender can explain this decline of forty-odd points on the
Verbal score and twenty-odd points on the Math for the white SAT-tak-
ing population during the 1960s and 1970s. For whatever reasons, dur-
ing the 1960s America stopped doing as well intellectually by the core
of students who go to college.
Rather than democratization, the decline was more probably due to
leveling down, or mediocritization: adownward trend of the educational
skills of America's academically most promising youngsters toward those
of the average student. The net drop in verbal skills was especially large,
much larger than net drop in math skills. It affected even those students
with the highest levels of cognitive ability.
Does this drop represent a fall in realized intelligence as well as a drop
in the quality of academic training? We assume that it does to some ex-
tent but are unwilling to try to estimate how much of which. The SAT
score decline does underscore a frustrating, perverse reality: However
hard it may be to raise IQ among the less talented with discrete inter-
ventions, as described in Chapter 17, it may be within the capability of
an educational system-probably
with the complicity of broader social
trends-to
put a ceiling on, or actually dampen, the realized intelligence
of those with high potential.'0
TRENDS IN EDUCATION 111: THE BRIGHTEST OF THE
BRIGHTEST
One more piece of the puzzle needs to be put in place. The SAT popu-
lation constitutes a sort of broad elite, encompassing but not limited to
the upper quartile of the annual national pool of cognitive ability. What
has been happening to the scores of the narrow elite, the most gifted
The Leveling of American Education
- The decline in SAT scores during the 1960s and 1970s is attributed to 'mediocritization' rather than the democratization of the test-taking pool.
- Educational systems and social trends may be inadvertently placing a ceiling on the realized intelligence of high-potential students.
- The number of students achieving elite scores on the SAT-Verbal dropped by 41 percent between 1972 and 1993, despite a larger overall testing population.
- In contrast to the verbal decline, the proportion of students scoring over 700 on the SAT-Math rose by 143 percent between 1981 and 1993.
- The surge in high math scores cannot be explained by easier tests or the demographic influence of Asian-American students alone.
- The data suggests a diverging trend in American cognitive development where mathematical skills are improving while verbal skills among the elite are eroding.
It may be within the capability of an educational system—probably with the complicity of broader social trends—to put a ceiling on, or actually dampen, the realized intelligence of those with high potential.
426
Living Together
The Leveling of American Education
42 7
almost a third of a standard deviation on the ~ a t h . " ~ '
And yet we have
just finished demonstrating that this large change is not reflected in the
aggregate national data for high school students. Which students, then,
account for the SATdecline! We try to answer that question in the next
few paragraphs, as we work our way through the most common expla-
nation of the decline. To anticipate our conclusion, the standard ex-
planation does not stand up to the data. We are left with compelling
evidence of a genuine decline in the intellectual resources of our bright-
est youngsters.
The most familiar explanation of the great decline is that the SAT
was "democratized" during the 1960s and 1970s. The pool of people tak-
ing the test expanded dramatically, it is said, bringing in students from
disadvantaged backgrounds who never used to consider going to col-
lege. This was a good thing, people agree, but it also meant that test
scores went down-a
natural consequence of breaking down the old
elites. The real problem is not falling SAT scores but the inferior edu-
cation for the disadvantaged that leads them to have lower test scores,
according to the standard account.27
This common view is mistaken. To make this case requires delving
into the details of the SAT and its population.2H
To summarize a complex
story: During the 1950s and into the early 1960s) the SAT pool expanded
dramatically, but scores remained steady. In the mid-1960s, scores
started to decline, but, by then, many state universities had become less
selective in their admissions process, often dropping the requirement
that students take SATs, and, as a result, many of the students in the mid-
dle level of the pool who formerly took the SAT stopped doing so. Fo-
cusing on the whites taking the SAT (thereby putting aside the effects
of the changing ethnic composition of the pool), we find that throughout
most of the whire SAT score decline, the white SAT pool was shrinking, not
expanding. We surmise that the white population of test takers during
this period was probably getting more exclusive socioeconomically, not
less. It is virtually impossible that it was becoming more democratized in
any socioeconomic sense.
After 1976, when detailed background data on white test takers be-
come available, the evidence is quite explicit. Although the size of the
pool once again began to expand during the 1980s, neither parental in-
come nor parental education of the white test takers changed.'291 After
factoring in the effects of changes in the gender of the pool and changes
in the difficulty of the SAT, we conclude that the aggregate real decline
from 1963 to 1976 among whites taking the SAT was on the order of
thirty-four to forty-four points on the Verbal and fifteen to twenty-five
points on the Math. From 1976 to 1993, the real white losses were no
more than a few additional points on the Verbal. On the Math, white
scores improved about three or four points in real terms after changes
in the pool are taken into account. Or in other words, when everything
is considered, there is reason to conclude that the size of the drop in the
SAT as shown in that familiar, unsophisticated graphic with which we
opened the discussion is for practical purposes the same size and shape
as the real change in the academic preparation of white college-bound
SAT test takers. Neither race, class, parental education, composition of
the pool, nor gender can explain this decline of forty-odd points on the
Verbal score and twenty-odd points on the Math for the white SAT-tak-
ing population during the 1960s and 1970s. For whatever reasons, dur-
ing the 1960s America stopped doing as well intellectually by the core
of students who go to college.
Rather than democratization, the decline was more probably due to
leveling down, or mediocritization: adownward trend of the educational
skills of America's academically most promising youngsters toward those
of the average student. The net drop in verbal skills was especially large,
much larger than net drop in math skills. It affected even those students
with the highest levels of cognitive ability.
Does this drop represent a fall in realized intelligence as well as a drop
in the quality of academic training? We assume that it does to some ex-
tent but are unwilling to try to estimate how much of which. The SAT
score decline does underscore a frustrating, perverse reality: However
hard it may be to raise IQ among the less talented with discrete inter-
ventions, as described in Chapter 17, it may be within the capability of
an educational system-probably
with the complicity of broader social
trends-to
put a ceiling on, or actually dampen, the realized intelligence
of those with high potential.'0
TRENDS IN EDUCATION 111: THE BRIGHTEST OF THE
BRIGHTEST
One more piece of the puzzle needs to be put in place. The SAT popu-
lation constitutes a sort of broad elite, encompassing but not limited to
the upper quartile of the annual national pool of cognitive ability. What
has been happening to the scores of the narrow elite, the most gifted
428
Living Together
The hueling of American Education
429
students-roughly,
those with combined scores of 1400 and more-who
are most likely to fill the nation's best graduate and professional schools?
They have gone down in the Verbal test and up in the Math.
The case for a drop in the Verbal scores among the brightest can be
made without subtle analysis. In 1972, 17,560 college-bound seniors
scored 700 or higher on the SAT-Verbal. In 1993, only 10,407 scored
700 or higher on the Verbal-a
drop of 41 percent in the raw number
of students scoring 700 and over, despite the larger raw number of stu-
dents taking the test in 1993 compared to 1972." Dilution of the pool
(even if it were as real as legend has it) could not account for smaller
raw numbers of high-scoring students. Rut we may make the case more
systematically.
The higher the ability level, the higher the proportion of students
who take the SAT. At the 700 level and beyond, the proportion ap-
proaches 100 percent and has probably been so since the early 1960s
(see Chapter 1). That is, almost all 17-year-olds who would score ahove
700 if they took the SAT do in fact take the SAT at some point in their
high school career, either because of their own ambitions, their parents',
or the urging of their teachers and guidance counselors. It is therefore
possible to think about the students who score in the 700s on the SAT
as a proportion of all 17-year-olds, not just as a proportion of the SAT
pool. We cannot carry the story back further than 1967 but the results
are nonetheless provocative, as shown in the next figure.['21
The good news is that the mathematics score of the top echelon of
American students has risen steeply since hitting its low point in 1981.
Given all the attention devoted to problems in American education,
this finding is worth lingering over for a moment. In a period of just
twelve years, from 1981 to 1993, the proportion of 17-year-olds scoring
over 700 on the SAT-Math test increased by 143 percent. This dramatic
improvement during the 1980s is not explainable by any artifact that
we can identify, such as having easier Math SAT
Nor is it
due to the superior math performance of Asian-American students and
their increase as a proportion of the SAT population. Asian-Americans
are still such a small minority (only 8 percent of test takers in 1992) that
their accomplishments cannot account for much of the national im-
provement. The upward bounce in the Math SAT from 1981 through
1992 was a robust 104 percent among
Now let us turn to the less happy story about the SAT-Verbal. The
proportion of students attaining 700 or higher on the SAT fell sharply
Among the most gifted students, there is good
news about math, bad news about verbal
700+ scorers, as a percentage of 17-year-olds
Verbal
Source: The College Roarcl.
from 1967 to the mid- 1970s. Furthermore, SAT scores as of 1967 had
been dropping for four years before that, so we start from a situation in
which the verbal skills of America's most gifted students dropped pre-
cipitously from the early 1960s to the early 1970s. Unlike the Math
scores, however, the Verbal scores did not rebound significantly. Nor
may one take much comfort from the comparatively shallow slope of
the decline as it is depicted in the figure. The proportional size of the
drop was large, from about eight students per 1,000 17-year-olds in 1967
to three per 1,000 in 1993, a drop of about 60 percent.i351
The other ma-
jor source of data about highly talented students, the Graduate Record
Examination, parallels the story for the students scoring 700 or above
on the SAT.''^'
AN EXPLANATION: DUMBING DOWN
How might these disparate and sometimes contradictory trends be tied
together?
One important part of the story begins with the 1950s. Why didn't
the scores fall, though the proportion of students taking the SAT went
from a few percent to almost a third of the high school population in
The Dumbing Down of Education
- Math SAT scores for the most gifted students saw a robust 104 percent increase between 1981 and 1992.
- In contrast, Verbal SAT scores for high achievers dropped precipitously by 60 percent between 1967 and 1993.
- The initial expansion of the SAT pool in the 1950s did not lower scores because it tapped into a deep reservoir of previously overlooked academic talent.
- The 'Sputnik scare' of 1957 temporarily bolstered standards by emphasizing math, science, and academic rigor.
- Starting in the mid-1960s, a 'dumbing down' of education occurred, characterized by simplified textbooks and eased demands on gifted students.
The simple and no longer controversial truth is that educational standards declined, along with other momentous changes in American society during that decade.
428
Living Together
The hueling of American Education
429
students-roughly,
those with combined scores of 1400 and more-who
are most likely to fill the nation's best graduate and professional schools?
They have gone down in the Verbal test and up in the Math.
The case for a drop in the Verbal scores among the brightest can be
made without subtle analysis. In 1972, 17,560 college-bound seniors
scored 700 or higher on the SAT-Verbal. In 1993, only 10,407 scored
700 or higher on the Verbal-a
drop of 41 percent in the raw number
of students scoring 700 and over, despite the larger raw number of stu-
dents taking the test in 1993 compared to 1972." Dilution of the pool
(even if it were as real as legend has it) could not account for smaller
raw numbers of high-scoring students. Rut we may make the case more
systematically.
The higher the ability level, the higher the proportion of students
who take the SAT. At the 700 level and beyond, the proportion ap-
proaches 100 percent and has probably been so since the early 1960s
(see Chapter 1). That is, almost all 17-year-olds who would score ahove
700 if they took the SAT do in fact take the SAT at some point in their
high school career, either because of their own ambitions, their parents',
or the urging of their teachers and guidance counselors. It is therefore
possible to think about the students who score in the 700s on the SAT
as a proportion of all 17-year-olds, not just as a proportion of the SAT
pool. We cannot carry the story back further than 1967 but the results
are nonetheless provocative, as shown in the next figure.['21
The good news is that the mathematics score of the top echelon of
American students has risen steeply since hitting its low point in 1981.
Given all the attention devoted to problems in American education,
this finding is worth lingering over for a moment. In a period of just
twelve years, from 1981 to 1993, the proportion of 17-year-olds scoring
over 700 on the SAT-Math test increased by 143 percent. This dramatic
improvement during the 1980s is not explainable by any artifact that
we can identify, such as having easier Math SAT
Nor is it
due to the superior math performance of Asian-American students and
their increase as a proportion of the SAT population. Asian-Americans
are still such a small minority (only 8 percent of test takers in 1992) that
their accomplishments cannot account for much of the national im-
provement. The upward bounce in the Math SAT from 1981 through
1992 was a robust 104 percent among
Now let us turn to the less happy story about the SAT-Verbal. The
proportion of students attaining 700 or higher on the SAT fell sharply
Among the most gifted students, there is good
news about math, bad news about verbal
700+ scorers, as a percentage of 17-year-olds
Verbal
Source: The College Roarcl.
from 1967 to the mid- 1970s. Furthermore, SAT scores as of 1967 had
been dropping for four years before that, so we start from a situation in
which the verbal skills of America's most gifted students dropped pre-
cipitously from the early 1960s to the early 1970s. Unlike the Math
scores, however, the Verbal scores did not rebound significantly. Nor
may one take much comfort from the comparatively shallow slope of
the decline as it is depicted in the figure. The proportional size of the
drop was large, from about eight students per 1,000 17-year-olds in 1967
to three per 1,000 in 1993, a drop of about 60 percent.i351
The other ma-
jor source of data about highly talented students, the Graduate Record
Examination, parallels the story for the students scoring 700 or above
on the SAT.''^'
AN EXPLANATION: DUMBING DOWN
How might these disparate and sometimes contradictory trends be tied
together?
One important part of the story begins with the 1950s. Why didn't
the scores fall, though the proportion of students taking the SAT went
from a few percent to almost a third of the high school population in
430
Living Together
The Leveling of American Education
43 1
little more than a decade? The answer is that the growing numbers of
SAT takers were not students with progressively lower levels of acade-
mic ability but able students who formerly did not go on to college or
went to the state university (and didn't take the SAT) and now were
broadening their horizons. This was the post-World War I1 era that we
described in Chapter 1, when educational meritocracy was on the rise.
As the path to the better colleges began to open for youngsters outside
the traditional socioeconomic elites, the population of test takers grew
explosively. During this period, we can safely assume that the pool
opened up to new socioeconomic groups, but it occurred with no dilu-
tion of the pool's academic potential, because the reservoir of academic
ability was deep. Then, as the 1950s ended, another factor worked to
sustain performance: From the Sputnik scare in 1957 through the early
1960s, American education was gripped by a get-tough reform move-
ment in which math and the sciences were emphasized and high schools
were raising standards. Education for the college bound probably im-
proved during this period.
Softened Standards
Then came the mid- 1960s and a decade of decline. What happened to
education during this period has been described by many observers, and
we will not recount it here in detail or place blame.[371
The simple and
no longer controversial truth is that educational standards declined,
along with other momentous changes in American society during that
decade.
The educational change is epitomized by the title for this section.
"Dumbing down" has become a term of art for the process by which the
vocabulary in a textbook is deliberately simplified, We use it in a broader
sense. One of the chief effects of the educational reforms of the 1960s
was to dumb down elementary and secondary education as a whole,
making just about everything easier for the average student and easing
the demands on the gifted student.
The dumbing down of textbooks permeated the textbook market, as
publishers and authors strove to satisfy school boards, which routinely
applied "readabilityn formulas to the books they were considering.38
Thomas Sowell has described a typical example of this process, in which
the words spectacle and admired were deleted from a textbook because
they were deemed too difficult for high school students. Sowell com-
pares such timidity to the McGuffey's Readers, the staple text of nine-
teenth-century children in one-room schoolhouses, pointing out that
the Third Render used words such as species, dialogue, heath, and be-
nighted-intended
for 8-year-olds.39
Dumbing down also occurred in the high school's college track. More
electives were permitted, and the requirements for credits in science,
mathematics, and literature were relaxed. There were exceptions, such
as the high-quality Advanced Placement courses offered in a minority
of high schools, taken by about 1 percent of American student^.^' But
the broader result was that the number of courses in the core disciplines
declined. Educational specialists agree that grades inflated-it
took less
work, and less homework, to earn good grades41-and that less home-
work was done.[421
In this context, it comes as no surprise that SAT scores declined even
among the diminishing proportion of high school seniors who took the
SAT during the last half of the 1960s. Indeed, it was not just students
who took the SAT who suffered during that period. For a time, educa-
tional preparation got worse for everyone, as reflected in the Iowa data
and the SAT national norm studies, not just for the college-bound
tracks. But why was the size of the drop smaller and the rebound quicker
and more complete for the population as a whole than for the SAT pop-
ulation? And why, in the SAT population, do we observe such a large
difference between Math, where decline was small and the recovery sub-
stantial, and Verbal, where the decline was large with no apparent re-
covery at all? Why were these contradictory trends most pronounced
for the most gifred students?
Competing Agendas
Our explanation is consistent with the facts as we understand them, but
we should emphasize that our explanation is interpretive as well. It goes
like this:
Since the late 1970s, the public dissatisfaction about the state of
American elementary and secondary education has produced some
changes. From 1982 to 1987, for example, the proportion of high school
graduates who completed a solid program of four years of English, three
of social sciences, three of the hard sciences, and three of math more
than doubled.43 The average course loads in all the academic areas went
up, most dramatically in foreign languages but with sizable gains in sci-
ence and math as
Many people wanted higher standards in their
schools, and the schools tried to respond.
The Leveling of American Education
- Textbooks have been significantly simplified, with basic vocabulary like 'spectacle' removed while 19th-century readers for eight-year-olds used much more complex language.
- The relaxation of core requirements in science, math, and literature led to grade inflation and a decrease in the amount of homework assigned and completed.
- SAT scores declined across the board in the late 1960s, with a particularly sharp and unrecovered drop in verbal skills compared to mathematical skills.
- While public pressure in the 1980s led to increased course loads, the improvements were unevenly distributed across different academic disciplines.
- Mathematics standards are easier to maintain and measure because the subject requires specific analytic techniques that are difficult to 'fudge' or simplify.
- Unlike math, raising standards in humanities and verbal skills cannot be easily routinized, leading to a persistent gap in literacy and critical thinking.
Sowell compares such timidity to the McGuffey's Readers, the staple text of nineteenth-century children in one-room schoolhouses, pointing out that the Third Reader used words such as species, dialogue, heath, and benighted—intended for 8-year-olds.
430
Living Together
The Leveling of American Education
43 1
little more than a decade? The answer is that the growing numbers of
SAT takers were not students with progressively lower levels of acade-
mic ability but able students who formerly did not go on to college or
went to the state university (and didn't take the SAT) and now were
broadening their horizons. This was the post-World War I1 era that we
described in Chapter 1, when educational meritocracy was on the rise.
As the path to the better colleges began to open for youngsters outside
the traditional socioeconomic elites, the population of test takers grew
explosively. During this period, we can safely assume that the pool
opened up to new socioeconomic groups, but it occurred with no dilu-
tion of the pool's academic potential, because the reservoir of academic
ability was deep. Then, as the 1950s ended, another factor worked to
sustain performance: From the Sputnik scare in 1957 through the early
1960s, American education was gripped by a get-tough reform move-
ment in which math and the sciences were emphasized and high schools
were raising standards. Education for the college bound probably im-
proved during this period.
Softened Standards
Then came the mid- 1960s and a decade of decline. What happened to
education during this period has been described by many observers, and
we will not recount it here in detail or place blame.[371
The simple and
no longer controversial truth is that educational standards declined,
along with other momentous changes in American society during that
decade.
The educational change is epitomized by the title for this section.
"Dumbing down" has become a term of art for the process by which the
vocabulary in a textbook is deliberately simplified, We use it in a broader
sense. One of the chief effects of the educational reforms of the 1960s
was to dumb down elementary and secondary education as a whole,
making just about everything easier for the average student and easing
the demands on the gifted student.
The dumbing down of textbooks permeated the textbook market, as
publishers and authors strove to satisfy school boards, which routinely
applied "readabilityn formulas to the books they were considering.38
Thomas Sowell has described a typical example of this process, in which
the words spectacle and admired were deleted from a textbook because
they were deemed too difficult for high school students. Sowell com-
pares such timidity to the McGuffey's Readers, the staple text of nine-
teenth-century children in one-room schoolhouses, pointing out that
the Third Render used words such as species, dialogue, heath, and be-
nighted-intended
for 8-year-olds.39
Dumbing down also occurred in the high school's college track. More
electives were permitted, and the requirements for credits in science,
mathematics, and literature were relaxed. There were exceptions, such
as the high-quality Advanced Placement courses offered in a minority
of high schools, taken by about 1 percent of American student^.^' But
the broader result was that the number of courses in the core disciplines
declined. Educational specialists agree that grades inflated-it
took less
work, and less homework, to earn good grades41-and that less home-
work was done.[421
In this context, it comes as no surprise that SAT scores declined even
among the diminishing proportion of high school seniors who took the
SAT during the last half of the 1960s. Indeed, it was not just students
who took the SAT who suffered during that period. For a time, educa-
tional preparation got worse for everyone, as reflected in the Iowa data
and the SAT national norm studies, not just for the college-bound
tracks. But why was the size of the drop smaller and the rebound quicker
and more complete for the population as a whole than for the SAT pop-
ulation? And why, in the SAT population, do we observe such a large
difference between Math, where decline was small and the recovery sub-
stantial, and Verbal, where the decline was large with no apparent re-
covery at all? Why were these contradictory trends most pronounced
for the most gifred students?
Competing Agendas
Our explanation is consistent with the facts as we understand them, but
we should emphasize that our explanation is interpretive as well. It goes
like this:
Since the late 1970s, the public dissatisfaction about the state of
American elementary and secondary education has produced some
changes. From 1982 to 1987, for example, the proportion of high school
graduates who completed a solid program of four years of English, three
of social sciences, three of the hard sciences, and three of math more
than doubled.43 The average course loads in all the academic areas went
up, most dramatically in foreign languages but with sizable gains in sci-
ence and math as
Many people wanted higher standards in their
schools, and the schools tried to respond.
43 2
Living Together
The Leveling of American Education
433
But other pressures were (and are) put on the schools, and they
created a gulf between what happened to courses in mathematics and
to courses in every other academic field. Ifa school, trying to have higher
standards in math, began to require a basic calculus course for its
college prep students, there were limits to the amount of fudging that
could be done with the course content. Somehow a core of analytic
techniques in calculus had to be part of the course. There was no way
around it. Furthermore, there is a welleestablished standard for decid-
ing whether calculus has been learned: Can the student solve calculus
problems?
Another feature of math skills at the high school level is that they can
be increased independent of the student's development in other intel-
lectual skills. A student may learn to manipulate quadratic equations
even if he is given not a glimmer of how formal logic might relate to ex-
pository prose or to the use of evidence in civics class. It is good that math
scores have risen, but it remains true that raising math standards can be
routinized in ways that cannot be applied to the rest of the curriculum.
How, for example, does one decide that the standards for an English
literature course have been "raised"? In the old days, it wouldn't have
been seen as a difficult question. Standards would be raised if the stu-
dents were required to read a larger number of the Great Rooks (no one
would have had much quarrel about what they were) or if students were
required to write longer term papers, subject to stricter grading on ar-
gumentation and documentation. But since the late 1960s, such
straightforward ways of looking at standards in the humanities, social
sciences, and even the physical sciences were corrupted, in the sense
that the standards of each discipline were subordinated to other con-
siderations. Chief among these other considerations were multicultur-
alism in the curriculum, the need to minimize racial differences in
performance measures, and enthusiasm for fostering self-esteem inde-
pendent of performance.[45' We assume that a politically compromised
curriculum is less likely to sharpen the verbal skills of students than one
that hews to standards of intellectual rigor and quality. We make these
observations without belittling the issues that have been at center stage
in American secondary education. But if the question is why the down-
hill slide in verbal skills has not reversed, here is one possible explana-
tion: The agendas that have had the most influence on curricula are
generally antagonistic to traditional criteria of rigor and excellence.
These influences come together when textbooks are selected by large
school systems. A school board runs no risk whatsoever of angry histo-
rians picketing their offices. They run grave risks of pickets (and of be-
ing voted out of office) if a textbook offends one of the many interest
groups that scrutinize possible choices. Publishers know the market and
take steps to make sure that their products will sell.
There are doubtless other culprits that help explain the difference
between the recovery in math scores and the failure to recover in ver-
bal scores. Television, rather than the printed page, became the primary
medium for getting news and recreation at home after mid-century, and
that process was also reaching full flower in the 1960s. Telephones dis-
placed letter writing as the medium for long-range communication.
Such trends are hostile to traditional definitions of excellence in ver-
bal skills. The simple hypothesis of this story is that these pressures ex-
isted across the curriculum and in society at large but that math skills
were less susceptible to them. (Math skills may instead have been get-
ting a boost from the accessibility of computers, calculators, and other
high-tech gadgetry.) When parents demanded higher standards, their
schools introduced higher standards in the math curriculum that really
were higher, and higher standards in the humanities and social sciences
that really were not.
The same dynamics provide a hypothesis for explaining why the re-
bound was more complete for the nation's overall student population
than for the SAT population. A textbook that is dumbed down is in fact
helpful to the mediocre student. A recent study of six textbooks over a
twelve-year period demonstrated that they had indeed been simplified,
and students performed significantly better on the current, dumbed-
down texts.46 Subjects that were traditionally not included in the cur-
riculum for the lower end of the distribution-for
example, exposure to
serious literature-have
now been so simplified as to be accessible to al-
most all.
The same dumbed-down textbook can quite easily have a depressing
effect on the talented student's development. And while the textbooks
were being simplified, subjects that would push the best students to their
limits, such as the classical languages, were all but dropped. Offered this
diluted curriculum, talented students do not necessarily take the initia-
tive to stretch themselves. Plenty of students with high IQs will happily
choose to write about The Hobbit instead of Pride and Prejudice for their
term paper if that option is given to them. Few of even the most bril-
liant youngsters tackle the Aeneid on their own.
The Decline of Verbal Standards
- Traditional academic standards in the humanities have been subordinated to multiculturalism and the preservation of student self-esteem.
- Political agendas and interest group pressures have led school boards to prioritize non-offensive content over intellectual rigor.
- The rise of television and the decline of letter writing created a societal environment hostile to the development of high-level verbal skills.
- Unlike math, which benefited from technological tools, verbal curricula were 'dumbed down' to be accessible to the mediocre student.
- Simplified textbooks help lower-performing students improve but fail to challenge or develop the potential of talented students.
- The removal of demanding subjects like classical languages has left high-IQ students without the necessary incentives to stretch their abilities.
A school board runs no risk whatsoever of angry historians picketing their offices.
43 2
Living Together
The Leveling of American Education
433
But other pressures were (and are) put on the schools, and they
created a gulf between what happened to courses in mathematics and
to courses in every other academic field. Ifa school, trying to have higher
standards in math, began to require a basic calculus course for its
college prep students, there were limits to the amount of fudging that
could be done with the course content. Somehow a core of analytic
techniques in calculus had to be part of the course. There was no way
around it. Furthermore, there is a welleestablished standard for decid-
ing whether calculus has been learned: Can the student solve calculus
problems?
Another feature of math skills at the high school level is that they can
be increased independent of the student's development in other intel-
lectual skills. A student may learn to manipulate quadratic equations
even if he is given not a glimmer of how formal logic might relate to ex-
pository prose or to the use of evidence in civics class. It is good that math
scores have risen, but it remains true that raising math standards can be
routinized in ways that cannot be applied to the rest of the curriculum.
How, for example, does one decide that the standards for an English
literature course have been "raised"? In the old days, it wouldn't have
been seen as a difficult question. Standards would be raised if the stu-
dents were required to read a larger number of the Great Rooks (no one
would have had much quarrel about what they were) or if students were
required to write longer term papers, subject to stricter grading on ar-
gumentation and documentation. But since the late 1960s, such
straightforward ways of looking at standards in the humanities, social
sciences, and even the physical sciences were corrupted, in the sense
that the standards of each discipline were subordinated to other con-
siderations. Chief among these other considerations were multicultur-
alism in the curriculum, the need to minimize racial differences in
performance measures, and enthusiasm for fostering self-esteem inde-
pendent of performance.[45' We assume that a politically compromised
curriculum is less likely to sharpen the verbal skills of students than one
that hews to standards of intellectual rigor and quality. We make these
observations without belittling the issues that have been at center stage
in American secondary education. But if the question is why the down-
hill slide in verbal skills has not reversed, here is one possible explana-
tion: The agendas that have had the most influence on curricula are
generally antagonistic to traditional criteria of rigor and excellence.
These influences come together when textbooks are selected by large
school systems. A school board runs no risk whatsoever of angry histo-
rians picketing their offices. They run grave risks of pickets (and of be-
ing voted out of office) if a textbook offends one of the many interest
groups that scrutinize possible choices. Publishers know the market and
take steps to make sure that their products will sell.
There are doubtless other culprits that help explain the difference
between the recovery in math scores and the failure to recover in ver-
bal scores. Television, rather than the printed page, became the primary
medium for getting news and recreation at home after mid-century, and
that process was also reaching full flower in the 1960s. Telephones dis-
placed letter writing as the medium for long-range communication.
Such trends are hostile to traditional definitions of excellence in ver-
bal skills. The simple hypothesis of this story is that these pressures ex-
isted across the curriculum and in society at large but that math skills
were less susceptible to them. (Math skills may instead have been get-
ting a boost from the accessibility of computers, calculators, and other
high-tech gadgetry.) When parents demanded higher standards, their
schools introduced higher standards in the math curriculum that really
were higher, and higher standards in the humanities and social sciences
that really were not.
The same dynamics provide a hypothesis for explaining why the re-
bound was more complete for the nation's overall student population
than for the SAT population. A textbook that is dumbed down is in fact
helpful to the mediocre student. A recent study of six textbooks over a
twelve-year period demonstrated that they had indeed been simplified,
and students performed significantly better on the current, dumbed-
down texts.46 Subjects that were traditionally not included in the cur-
riculum for the lower end of the distribution-for
example, exposure to
serious literature-have
now been so simplified as to be accessible to al-
most all.
The same dumbed-down textbook can quite easily have a depressing
effect on the talented student's development. And while the textbooks
were being simplified, subjects that would push the best students to their
limits, such as the classical languages, were all but dropped. Offered this
diluted curriculum, talented students do not necessarily take the initia-
tive to stretch themselves. Plenty of students with high IQs will happily
choose to write about The Hobbit instead of Pride and Prejudice for their
term paper if that option is given to them. Few of even the most bril-
liant youngsters tackle the Aeneid on their own.
The Neglect of the Gifted
- Federal education policy shifted dramatically in 1965 from supporting high-achieving students to prioritizing disadvantaged students.
- By 1993, programs for the gifted received only 0.1% of the $8.6 billion ESEA budget, while 92.2% was allocated to the disadvantaged.
- The definition of 'disadvantaged' in policy circles has evolved to focus almost exclusively on students with learning problems rather than high-potential students from poor backgrounds.
- Efforts to create elite academic environments in urban areas, such as Banneker High School, often face political hostility and accusations of elitism.
- Despite success in college placement and safety, schools for gifted urban students are frequently underfunded and threatened with closure.
Banneker was 'elitest,' said an influential school board member, a luxury for parents who 'had their children in private school and can no longer afford it and bring them back to essentially a private school at the public expense.'
43 2
Living Together
The Leveling of American Education
433
But other pressures were (and are) put on the schools, and they
created a gulf between what happened to courses in mathematics and
to courses in every other academic field. Ifa school, trying to have higher
standards in math, began to require a basic calculus course for its
college prep students, there were limits to the amount of fudging that
could be done with the course content. Somehow a core of analytic
techniques in calculus had to be part of the course. There was no way
around it. Furthermore, there is a welleestablished standard for decid-
ing whether calculus has been learned: Can the student solve calculus
problems?
Another feature of math skills at the high school level is that they can
be increased independent of the student's development in other intel-
lectual skills. A student may learn to manipulate quadratic equations
even if he is given not a glimmer of how formal logic might relate to ex-
pository prose or to the use of evidence in civics class. It is good that math
scores have risen, but it remains true that raising math standards can be
routinized in ways that cannot be applied to the rest of the curriculum.
How, for example, does one decide that the standards for an English
literature course have been "raised"? In the old days, it wouldn't have
been seen as a difficult question. Standards would be raised if the stu-
dents were required to read a larger number of the Great Rooks (no one
would have had much quarrel about what they were) or if students were
required to write longer term papers, subject to stricter grading on ar-
gumentation and documentation. But since the late 1960s, such
straightforward ways of looking at standards in the humanities, social
sciences, and even the physical sciences were corrupted, in the sense
that the standards of each discipline were subordinated to other con-
siderations. Chief among these other considerations were multicultur-
alism in the curriculum, the need to minimize racial differences in
performance measures, and enthusiasm for fostering self-esteem inde-
pendent of performance.[45' We assume that a politically compromised
curriculum is less likely to sharpen the verbal skills of students than one
that hews to standards of intellectual rigor and quality. We make these
observations without belittling the issues that have been at center stage
in American secondary education. But if the question is why the down-
hill slide in verbal skills has not reversed, here is one possible explana-
tion: The agendas that have had the most influence on curricula are
generally antagonistic to traditional criteria of rigor and excellence.
These influences come together when textbooks are selected by large
school systems. A school board runs no risk whatsoever of angry histo-
rians picketing their offices. They run grave risks of pickets (and of be-
ing voted out of office) if a textbook offends one of the many interest
groups that scrutinize possible choices. Publishers know the market and
take steps to make sure that their products will sell.
There are doubtless other culprits that help explain the difference
between the recovery in math scores and the failure to recover in ver-
bal scores. Television, rather than the printed page, became the primary
medium for getting news and recreation at home after mid-century, and
that process was also reaching full flower in the 1960s. Telephones dis-
placed letter writing as the medium for long-range communication.
Such trends are hostile to traditional definitions of excellence in ver-
bal skills. The simple hypothesis of this story is that these pressures ex-
isted across the curriculum and in society at large but that math skills
were less susceptible to them. (Math skills may instead have been get-
ting a boost from the accessibility of computers, calculators, and other
high-tech gadgetry.) When parents demanded higher standards, their
schools introduced higher standards in the math curriculum that really
were higher, and higher standards in the humanities and social sciences
that really were not.
The same dynamics provide a hypothesis for explaining why the re-
bound was more complete for the nation's overall student population
than for the SAT population. A textbook that is dumbed down is in fact
helpful to the mediocre student. A recent study of six textbooks over a
twelve-year period demonstrated that they had indeed been simplified,
and students performed significantly better on the current, dumbed-
down texts.46 Subjects that were traditionally not included in the cur-
riculum for the lower end of the distribution-for
example, exposure to
serious literature-have
now been so simplified as to be accessible to al-
most all.
The same dumbed-down textbook can quite easily have a depressing
effect on the talented student's development. And while the textbooks
were being simplified, subjects that would push the best students to their
limits, such as the classical languages, were all but dropped. Offered this
diluted curriculum, talented students do not necessarily take the initia-
tive to stretch themselves. Plenty of students with high IQs will happily
choose to write about The Hobbit instead of Pride and Prejudice for their
term paper if that option is given to them. Few of even the most bril-
liant youngsters tackle the Aeneid on their own.
434
Living Together
The Leveling of American Education
435
The Neglect of the Gifted
Another factor in the declining capabilities of America's brightest stu-
dents is that the decline occurred when, in policy circles, disadvantaged
students were "in" and gifted students were "out." When the first sig-
nificant aid went to secondary education at the end of the Eisenhower
years, it was for the brightest students who might become scientists or
engineers. In 1965, with the passage of the Elementary and Secondary
Education Act of 1965 (ESEA), the funding priority turned 180 degrees,
and it has remained anchored in the new position ever since. As of 1993,
the ESEA authorized forty-six programs with budgets that added up to
$8.6 billion. Most of these programs are specifically designated for stu-
dents in low-income areas and students with special educational needs.
Even the programs that might apply to any sort of student (improve-
ments in science and mathematics education, for example) often are
worded in ways that give preference to students from low-income areas.
Another set of programs are for support services. And, finally, there are
programs designated for the gifted and talented. This is the way that the
$8.6 billion budget broke out for fiscal 1993:'~"
Programs for the disadvantaged
92.2%
Programs that might benefit any student
5.6%
Support and administration of ESEA programs
2.1 %
Programs for the gifted
0.1%
This breakdown omits other federal programs with large budgets aimed
at the education of the disadvantaged-more
than $2 billion for Head
Start (funded by the Department of Health and Human Services, not
the Department of Education), more than $3 billion for job training
programs, plus a scattering of others.48
Theoretically, programs targeted at disadvantaged students could also
be programs for the cognitively gifted among the socioeconomically dis-
advantaged. But that's not the way it has worked. Disadvantaged as used
by three decades of administrators and school boards using ESEA funds
has consistently meant not just students who are poor or living in an in-
ner-city neighborhood but students who exhibit learning problems. Pro-
grams for the intellectually gifted but otherwise disadvantaged attract
little support and, occasionally, hostility. A case in point is Banneker
High School in Washington, D.C., a special academic high school in
the middle of the black northeast section of the city, established by a
former superintendent of schools with the school board's reluctant per-
mission in 198 1.
The establishment of Banneker High followed a proud tradition in
Washington, where once-elite Dunbar High had turned out many of the
nation's black leaders. But throughout the 1980s, Banneker was under-
funded and repeatedly threatened with closure. Banneker was "elitest,"
said an influential school board member, a luxury for parents who "had
their children in private school and can no longer afford it and bring
them back to essentially a private school at the public expense."49 Ban-
neker's "elitest" admissions policy? Applicants had to write an essay, be
interviewed, be in the top 18 percent of their class, and read and com-
pute at grade level-a
broad conception of "elitist" indeed. Throughout
it all, teachers competed to teach at Banneker and students competed
to attend. Banneker placed large proportions of its graduates in college
and had no significant problems with discipline, drugs, crime, or the
other ills of contemporary urban schools.50 And yet, as we write, Ban-
neker continues to be barely tolerated by the school system. Banneker's
story has numerous counterparts in other urban centers. Funds for the
eccmomically and socially disadvantaged have meant, for practical pur-
poses, funds concentrated on the cognitively disadvantaged as well.
A POLICY AGENDA
What are the implications for policy? The pros and cons of the specific
reforms on the table-national
achievement tests, national curricula,
school choice, vouchers, tuition tax credits, apprenticeship programs,
restoration of the neighborhood school, minimum competency tests,
ability grouping, and a host of others-involve
nuts-and-bolts issues
that are better argued out in detail, on their merits, in works that are
specifically devoted to them. We also leave for other settings a discus-
sion of the enormous potential of new technologies, from the personal
computer to laser disks to the information superhighway, to enrich and
broaden educational resources. Here we concentrate on certain strate-
gic implications about educational reform that flow from our account-
first, regarding attempts to upgrade American education as a whole, and
then regarding the education of the gifted.
The Realities of Educational Reform
- Current educational funding and policy focus heavily on the cognitively and economically disadvantaged.
- American educational performance is low compared to other industrialized nations and basic standards of ordinary ability.
- Policymakers must acknowledge that in a universal system, a significant portion of students will likely never reach 'basic' levels due to cognitive distribution.
- The goal of universal secondary education is a relatively recent historical development, only seeing dropout rates fall below 30 percent in 1963.
- There is a growing tension between critics who blame failing school systems and those who blame a lack of student effort and 'couch potato' culture.
- Effective reform requires a realistic assessment of what constitutes success for students at different points of intellectual ability.
At about the same time, educators-and educational critics-stopped thinking hard or openly about variation in intellectual abilities. It is time to reopen the issue.
434
Living Together
The Leveling of American Education
435
The Neglect of the Gifted
Another factor in the declining capabilities of America's brightest stu-
dents is that the decline occurred when, in policy circles, disadvantaged
students were "in" and gifted students were "out." When the first sig-
nificant aid went to secondary education at the end of the Eisenhower
years, it was for the brightest students who might become scientists or
engineers. In 1965, with the passage of the Elementary and Secondary
Education Act of 1965 (ESEA), the funding priority turned 180 degrees,
and it has remained anchored in the new position ever since. As of 1993,
the ESEA authorized forty-six programs with budgets that added up to
$8.6 billion. Most of these programs are specifically designated for stu-
dents in low-income areas and students with special educational needs.
Even the programs that might apply to any sort of student (improve-
ments in science and mathematics education, for example) often are
worded in ways that give preference to students from low-income areas.
Another set of programs are for support services. And, finally, there are
programs designated for the gifted and talented. This is the way that the
$8.6 billion budget broke out for fiscal 1993:'~"
Programs for the disadvantaged
92.2%
Programs that might benefit any student
5.6%
Support and administration of ESEA programs
2.1 %
Programs for the gifted
0.1%
This breakdown omits other federal programs with large budgets aimed
at the education of the disadvantaged-more
than $2 billion for Head
Start (funded by the Department of Health and Human Services, not
the Department of Education), more than $3 billion for job training
programs, plus a scattering of others.48
Theoretically, programs targeted at disadvantaged students could also
be programs for the cognitively gifted among the socioeconomically dis-
advantaged. But that's not the way it has worked. Disadvantaged as used
by three decades of administrators and school boards using ESEA funds
has consistently meant not just students who are poor or living in an in-
ner-city neighborhood but students who exhibit learning problems. Pro-
grams for the intellectually gifted but otherwise disadvantaged attract
little support and, occasionally, hostility. A case in point is Banneker
High School in Washington, D.C., a special academic high school in
the middle of the black northeast section of the city, established by a
former superintendent of schools with the school board's reluctant per-
mission in 198 1.
The establishment of Banneker High followed a proud tradition in
Washington, where once-elite Dunbar High had turned out many of the
nation's black leaders. But throughout the 1980s, Banneker was under-
funded and repeatedly threatened with closure. Banneker was "elitest,"
said an influential school board member, a luxury for parents who "had
their children in private school and can no longer afford it and bring
them back to essentially a private school at the public expense."49 Ban-
neker's "elitest" admissions policy? Applicants had to write an essay, be
interviewed, be in the top 18 percent of their class, and read and com-
pute at grade level-a
broad conception of "elitist" indeed. Throughout
it all, teachers competed to teach at Banneker and students competed
to attend. Banneker placed large proportions of its graduates in college
and had no significant problems with discipline, drugs, crime, or the
other ills of contemporary urban schools.50 And yet, as we write, Ban-
neker continues to be barely tolerated by the school system. Banneker's
story has numerous counterparts in other urban centers. Funds for the
eccmomically and socially disadvantaged have meant, for practical pur-
poses, funds concentrated on the cognitively disadvantaged as well.
A POLICY AGENDA
What are the implications for policy? The pros and cons of the specific
reforms on the table-national
achievement tests, national curricula,
school choice, vouchers, tuition tax credits, apprenticeship programs,
restoration of the neighborhood school, minimum competency tests,
ability grouping, and a host of others-involve
nuts-and-bolts issues
that are better argued out in detail, on their merits, in works that are
specifically devoted to them. We also leave for other settings a discus-
sion of the enormous potential of new technologies, from the personal
computer to laser disks to the information superhighway, to enrich and
broaden educational resources. Here we concentrate on certain strate-
gic implications about educational reform that flow from our account-
first, regarding attempts to upgrade American education as a whole, and
then regarding the education of the gifted.
436
Living Together
The Leveling of American Education
43 7
Realism About the Limits of General Improvements in Education
We begin with the first and most widely accepted conclusion: The ex-
tent and quality of learning for American students in general is low-
lower than in most other industrialized countries but also (it would
seem) low by basic standards of what a person of ordinary ability ought
to learn. Before jumping into any particular set of solutions, however,
policymakers need to be more realistic about what can be done to im-
prove the education of students in a heterogeneous, nontotalitarian
country. Specifically, critics of American education must come to terms
with the reality that in a universal education system, many students will not
reach the level of education that most people view as basic. Consider again
the example of functional illiteracy mentioned earlier: that over 20 per-
cent of 17-year-olds are below the intermediate reading level on the
WAEP, meaning that they are marginal readers or worse. This is i~sually
considered a failure of American education, and perhaps it is. Rut most
of these nonreaders come from the bottom of the cognitive ability dis-
tribution. How well should they be able to read after a proper education,
given the economic, technological, and political constraints on any sys-
tem of mass education?
The United States has not yet completed the first half-century of
human history in which universal secondary education became a goal.
It was not until 1963 that the dropout rate fell below 30 percent of all
17-year-olds. Already we have seen improving performance in aci~de-
mic tests for the average student as educational opportunities have
spread across the population. At about the same time, educators-and
educational critics-stopped
thinking hard or openly about variation
in intellectual abilities. It is time to reopen the issue. What constitutes
educational success for persons at various points along the cognitive
ability distribution? The aspirations of educational reformers should
be accompanied by a realistic and systematic assessment of where
the room for improvement lies, taking the cognitive distribution into
account.
Some critics blame students who do not work hard enough, rather
than schools that fail to teach, for the shortcomings of American edu-
cation. One hears repeatedly about students as couch potatoes. The av-
erage American student, it is said, takes the easy way out compared not
only to the fabled Japanese but to children in countries such as Norway,
the Netherlands, Ireland, and Italyq5' The obvious policy implication is
to do something to make students work harder. Lengthen the school
year. Lengthen the school day. Require homework every night. Toughen
the grading.'52' The proposals fill the air. We think many of them are
good ideas. Rut the closer one looks at the reasons why students do not
work harder, the less it seems that they are to blame.
First, most American parents do not want drastic increases in the acade-
mic work load. Some of the evidence for this lies in quantitative survey
data. In Harold Stevenson's landmark cross-national study of Chinese,
Japanese, and American education, 9 1 percent of American parents said
their school is doing an "excellent or good job," compared to only half
that proportion of Taiwanese or Japanese parents.5' It has become a tru-
ism in survey research: Americans tell interviewers that American ed-
ucation in general is going to the dogs, then in the next breath give high
marks to their children's own school.'541 In surveys, many American par-
ents are either apathetic about school or hostile toward more homework
and tougher grading.55 In this climate, more demanding standards can-
not easily be imposed from above.
But if you live near a public school, you need not search the techni-
cal journals to verify the point. Visit the school and talk to any teacher
about the last half-dozen parents who have complained to him. For
every parent who visits the principal to tell him that Johnny isn't get-
ting enough homework are several who visit to complain Johnny is be-
ing overworked. Parents who are upset about inflated grades seldom
make a teacher's life miserable. Parents who are upset about their child's
low grade do.
Parents do want orderly classrooms, no weapons, no violence, no
drugs, and other safeguards for their children that many schools, espe-
cially in large cities, no longer provide. These urgent needs are fueling
much of the shift into private schools and political backing for the
"school choice" movement. But the average parent seems unprepared
to support genuinely stiffer academic standards.
A second point is that the average American student has little incentive
to work harder than he already does in high school. Economist John Bishop
has taken the lead in making this case, emphasizing two points.56 Bishop
first observes that a demanding high school curriculum is not necessary
for admission to most colleges. For most college-bound students, find-
ing the money is harder than amassing the necessary high school record.
And it's their parents who typically need to find the money. Why bother
to take tough courses? This is true even of talented students applying to
Barriers to Academic Rigor
- American parents generally express high satisfaction with their local schools despite a national narrative of educational decline.
- Teachers face more pressure from parents complaining about low grades or excessive homework than from those demanding higher standards.
- The primary concerns for many parents are safety and order rather than academic intensity, driving the school choice movement.
- Most colleges have low admission barriers, meaning students do not need a demanding high school curriculum to secure a spot.
- Economic data suggests that higher academic achievement in high school does not translate into immediate wage increases or better job prospects.
- The lack of incentive to work hard is reinforced by the difficulty employers face in obtaining and utilizing high school transcripts.
For every parent who visits the principal to tell him that Johnny isn't getting enough homework are several who visit to complain Johnny is being overworked.
436
Living Together
The Leveling of American Education
43 7
Realism About the Limits of General Improvements in Education
We begin with the first and most widely accepted conclusion: The ex-
tent and quality of learning for American students in general is low-
lower than in most other industrialized countries but also (it would
seem) low by basic standards of what a person of ordinary ability ought
to learn. Before jumping into any particular set of solutions, however,
policymakers need to be more realistic about what can be done to im-
prove the education of students in a heterogeneous, nontotalitarian
country. Specifically, critics of American education must come to terms
with the reality that in a universal education system, many students will not
reach the level of education that most people view as basic. Consider again
the example of functional illiteracy mentioned earlier: that over 20 per-
cent of 17-year-olds are below the intermediate reading level on the
WAEP, meaning that they are marginal readers or worse. This is i~sually
considered a failure of American education, and perhaps it is. Rut most
of these nonreaders come from the bottom of the cognitive ability dis-
tribution. How well should they be able to read after a proper education,
given the economic, technological, and political constraints on any sys-
tem of mass education?
The United States has not yet completed the first half-century of
human history in which universal secondary education became a goal.
It was not until 1963 that the dropout rate fell below 30 percent of all
17-year-olds. Already we have seen improving performance in aci~de-
mic tests for the average student as educational opportunities have
spread across the population. At about the same time, educators-and
educational critics-stopped
thinking hard or openly about variation
in intellectual abilities. It is time to reopen the issue. What constitutes
educational success for persons at various points along the cognitive
ability distribution? The aspirations of educational reformers should
be accompanied by a realistic and systematic assessment of where
the room for improvement lies, taking the cognitive distribution into
account.
Some critics blame students who do not work hard enough, rather
than schools that fail to teach, for the shortcomings of American edu-
cation. One hears repeatedly about students as couch potatoes. The av-
erage American student, it is said, takes the easy way out compared not
only to the fabled Japanese but to children in countries such as Norway,
the Netherlands, Ireland, and Italyq5' The obvious policy implication is
to do something to make students work harder. Lengthen the school
year. Lengthen the school day. Require homework every night. Toughen
the grading.'52' The proposals fill the air. We think many of them are
good ideas. Rut the closer one looks at the reasons why students do not
work harder, the less it seems that they are to blame.
First, most American parents do not want drastic increases in the acade-
mic work load. Some of the evidence for this lies in quantitative survey
data. In Harold Stevenson's landmark cross-national study of Chinese,
Japanese, and American education, 9 1 percent of American parents said
their school is doing an "excellent or good job," compared to only half
that proportion of Taiwanese or Japanese parents.5' It has become a tru-
ism in survey research: Americans tell interviewers that American ed-
ucation in general is going to the dogs, then in the next breath give high
marks to their children's own school.'541 In surveys, many American par-
ents are either apathetic about school or hostile toward more homework
and tougher grading.55 In this climate, more demanding standards can-
not easily be imposed from above.
But if you live near a public school, you need not search the techni-
cal journals to verify the point. Visit the school and talk to any teacher
about the last half-dozen parents who have complained to him. For
every parent who visits the principal to tell him that Johnny isn't get-
ting enough homework are several who visit to complain Johnny is be-
ing overworked. Parents who are upset about inflated grades seldom
make a teacher's life miserable. Parents who are upset about their child's
low grade do.
Parents do want orderly classrooms, no weapons, no violence, no
drugs, and other safeguards for their children that many schools, espe-
cially in large cities, no longer provide. These urgent needs are fueling
much of the shift into private schools and political backing for the
"school choice" movement. But the average parent seems unprepared
to support genuinely stiffer academic standards.
A second point is that the average American student has little incentive
to work harder than he already does in high school. Economist John Bishop
has taken the lead in making this case, emphasizing two points.56 Bishop
first observes that a demanding high school curriculum is not necessary
for admission to most colleges. For most college-bound students, find-
ing the money is harder than amassing the necessary high school record.
And it's their parents who typically need to find the money. Why bother
to take tough courses? This is true even of talented students applying to
43 8
Living Together
The Leveling of American Education
439
selective schools; only a handful of schools at the summit routinely turn
away students with SATs in the 1200s and up (see Chapter 1). A stu-
dent who tests reasonably well (he knows this by the time he gets to
high school) and doesn't have his sights set on the likes of Yale does not
have to be too careful about which courses to take as long as his grades
are decent. Only youngsters who aspire to colleges that usually take stu-
dents with higher scores than their own have a strong incentive to study
hard-and
however common this situation may seem at the school at-
tended by the children of most of our readers, it describes a minuscule
proportion of the national high school population.
Bishop also shows that achievement in high school does not pay off
in higher wages or better jobs. Many employers assume that the high
school diploma no longer means much more than that the student
warmed a seat for twelve years. Others are willing to look at high school
transcripts as part of the hiring process, but though schools are le~ally
obligated to respond to requests for transcripts, hardly any transcripts
ever reach the employer, and those that do usually arrive so late that
they are ~se1ess.l~~'
Using the NLSY, Bishop found that better test scores
in science, language arts, and math were associated with lower wages
and employment among young men in the first ten years after h~gh
school.58 Students, like everybody else, respond to what's in it for them.
There's close to nothing in it for them in working hard in high school.
Ergo, they do not work hard in high school.
How might policy changes reconnect high school performance with
payoffs after graduation? For students not continuing to college, Bishop
recommends a variety of measures to certify competencies, to make tran-
scripts understandable and available to employers, and to hu~ld up data
banks, national or regional (private, not federal), to enable youths to
send their "competency profile" to potential employers.5y
Such programs may work if employers of high school graduates had
a shortage of competent workers applying for jobs. Some pilot projects
are underway that should tell how much such data banks are needed and
used.h0 But in thinking about linking up performance in high school
with the job market, here is a dose of realism: When it comes to pre-
dicting job productivity in most common jobs, an employer who rou-
tinely trains new employees in specific job skills anyway hasn't much
reason to care about whether the applicant got an A or a C in high
school English or, for that matter, how well the applicant did in high
school vocational courses, except perhaps as a rough measure of how
bright and conscientious the applicant is. O n the average, and assum-
ing no legal restrictions on testing, an employer can get a better idea of
how well a job applicant will perform in job training by giving him an
inexpensive twelve-minute intelligence test than by anything that the
high school can tell the employer about the applicant's academic
record.16'l This puts sharp limits on how interested employers will be
high school performance.
As far as colleges are concerned, what incentive do they have to raise
admissions requirements if it means fewer students? During and just af-
ter the baby boom years, private colleges added many students to their
rosters and now face an oversupply of places for a shrinking market. Few
prefer to go out of business rather than take students with modest cre-
dentials. Public universities make their admissions policies in response
to political pressures that generally push them toward more inclusive-
ness, not less. When neither buyer nor seller profits from higher stan-
dards, why would standards rise!
Realism About How Federal Reforms Will Work in the American
Context
In ways that few people want to acknowledge, America does not want
its schools to take a large leap in what they demand of youngsters. Our
conclusion is that if parents, students, and employers do not broadly sup-
port a significantly more demanding educational system, it's not going
to happen. Nonetheless, a variety of sensible reforms are on the table-
more homework, a longer school year, and the like. Why don't we at
least recommend that the federal government mandate these good
things? On this question, the experience of the 1960s and 1970s serves
as an object lesson for today.
Educational reformers in the 1960s and 1970s were confident that
their ideas were good things to do. They were impatient with the con-
servatism of local school districts. They turned to a responsive White
House, Congress, and Supreme Court, achieved many of their objec-
tives, and thereby contributed to a historic shift in American education.
On balance, the turn was for the worse as far as academic excellence
was concerned, but that doesn't mean the ideas were bad in themselves.
Ideas such as more racial integration in the schools, more attention to
the needs of disadvantaged students, and more equitable treatment of
students in disciplinary matters do not seem less obviously "good" to us
The High School Incentive Gap
- High school students lack motivation to work hard because there are few immediate economic payoffs for academic performance after graduation.
- Proposed competency profiles and data banks for employers face a 'dose of realism' regarding their actual utility in the hiring process.
- Employers often find short intelligence tests more predictive of job productivity than high school transcripts or vocational grades.
- Colleges are disincentivized from raising admission standards due to a shrinking market of students and political pressure for inclusiveness.
- Federal mandates for educational reform often fail because they lack broad support from parents, students, and the local community.
- Historical reforms from the 1960s and 1970s, while well-intentioned, are viewed as having contributed to a decline in academic excellence.
There's close to nothing in it for them in working hard in high school. Ergo, they do not work hard in high school.
43 8
Living Together
The Leveling of American Education
439
selective schools; only a handful of schools at the summit routinely turn
away students with SATs in the 1200s and up (see Chapter 1). A stu-
dent who tests reasonably well (he knows this by the time he gets to
high school) and doesn't have his sights set on the likes of Yale does not
have to be too careful about which courses to take as long as his grades
are decent. Only youngsters who aspire to colleges that usually take stu-
dents with higher scores than their own have a strong incentive to study
hard-and
however common this situation may seem at the school at-
tended by the children of most of our readers, it describes a minuscule
proportion of the national high school population.
Bishop also shows that achievement in high school does not pay off
in higher wages or better jobs. Many employers assume that the high
school diploma no longer means much more than that the student
warmed a seat for twelve years. Others are willing to look at high school
transcripts as part of the hiring process, but though schools are le~ally
obligated to respond to requests for transcripts, hardly any transcripts
ever reach the employer, and those that do usually arrive so late that
they are ~se1ess.l~~'
Using the NLSY, Bishop found that better test scores
in science, language arts, and math were associated with lower wages
and employment among young men in the first ten years after h~gh
school.58 Students, like everybody else, respond to what's in it for them.
There's close to nothing in it for them in working hard in high school.
Ergo, they do not work hard in high school.
How might policy changes reconnect high school performance with
payoffs after graduation? For students not continuing to college, Bishop
recommends a variety of measures to certify competencies, to make tran-
scripts understandable and available to employers, and to hu~ld up data
banks, national or regional (private, not federal), to enable youths to
send their "competency profile" to potential employers.5y
Such programs may work if employers of high school graduates had
a shortage of competent workers applying for jobs. Some pilot projects
are underway that should tell how much such data banks are needed and
used.h0 But in thinking about linking up performance in high school
with the job market, here is a dose of realism: When it comes to pre-
dicting job productivity in most common jobs, an employer who rou-
tinely trains new employees in specific job skills anyway hasn't much
reason to care about whether the applicant got an A or a C in high
school English or, for that matter, how well the applicant did in high
school vocational courses, except perhaps as a rough measure of how
bright and conscientious the applicant is. O n the average, and assum-
ing no legal restrictions on testing, an employer can get a better idea of
how well a job applicant will perform in job training by giving him an
inexpensive twelve-minute intelligence test than by anything that the
high school can tell the employer about the applicant's academic
record.16'l This puts sharp limits on how interested employers will be
high school performance.
As far as colleges are concerned, what incentive do they have to raise
admissions requirements if it means fewer students? During and just af-
ter the baby boom years, private colleges added many students to their
rosters and now face an oversupply of places for a shrinking market. Few
prefer to go out of business rather than take students with modest cre-
dentials. Public universities make their admissions policies in response
to political pressures that generally push them toward more inclusive-
ness, not less. When neither buyer nor seller profits from higher stan-
dards, why would standards rise!
Realism About How Federal Reforms Will Work in the American
Context
In ways that few people want to acknowledge, America does not want
its schools to take a large leap in what they demand of youngsters. Our
conclusion is that if parents, students, and employers do not broadly sup-
port a significantly more demanding educational system, it's not going
to happen. Nonetheless, a variety of sensible reforms are on the table-
more homework, a longer school year, and the like. Why don't we at
least recommend that the federal government mandate these good
things? On this question, the experience of the 1960s and 1970s serves
as an object lesson for today.
Educational reformers in the 1960s and 1970s were confident that
their ideas were good things to do. They were impatient with the con-
servatism of local school districts. They turned to a responsive White
House, Congress, and Supreme Court, achieved many of their objec-
tives, and thereby contributed to a historic shift in American education.
On balance, the turn was for the worse as far as academic excellence
was concerned, but that doesn't mean the ideas were bad in themselves.
Ideas such as more racial integration in the schools, more attention to
the needs of disadvantaged students, and more equitable treatment of
students in disciplinary matters do not seem less obviously "good" to us
The Failure of Federal Reform
- The federal government acts as an outside force that is more likely to derail educational progress than accelerate it.
- Centralized standards in the U.S. are inevitably watered down to accommodate competing social and political interests.
- Political pressures from teachers' unions and minority advocacy groups prevent the implementation of rigorous national standards.
- Educational improvement is best achieved by empowering internal forces, specifically the motivations of parents and teachers.
- The authors advocate for universal school choice, including vouchers for private and religious schools, to restore order and safety.
- Restoring local control allows for specialized environments that can better serve gifted students and maintain classroom discipline.
It is very difficult for an outside force to accelerate the freight train but comparatively easy for an outside force to derail it.
440
Living Together
The Leveling of American Education
441
than ideals such as more homework and a longer school year. It was not
the core ideas that were at fault (in most instances) but some basic prob-
lems that go with reforming American education at a national level.
We characterize the situation as follows: Slow improvement seems to
have been a natural part of twentieth-century American education un-
til the 1960s. This slow improvement had great inertia, in the sense that
a slow-moving freight train has inertia. It is very difficult for an outside
force to accelerate the freight train but comparatively easy for an out-
side force to derail it. In the United States, the federal government tends
to be an outside force, more often derailing than pushing along, for rea-
sons that are peculiarly American.
In countries such as France and Germany, with more homogeneous
populations and more authoritarian and unapologetically elitest educa-
tional traditions, the national government can get away with central-
ized school systems that educate their brightest youth well. In the
United States, it cannot. Federal standards, federal rules, and federal
curricula, were they to be established, would inevitably be watered down
and educational goals would be compromised with social and political
ones. The federal government responds to pushes from all sides and gets
equally nervous about affirming the genius of either Huck Finn or
Charles Darwin. Powerful teachers' organizations will not tolerate cer-
tification tests that flunk large numbers of teachers. Organizations that
represent minority groups will not tolerate national educational stan-
dards that cause large numbers of minority children to flunk. These are
political facts of life that will not change soon, no matter who is in the
White House.
With Americ;tVs Immense diversity and its tradition of local control,
Washington is the wrong place to look for either energy or wisdom on
educational reform. In our view, any natural impulse toward educational
improvement will he hest nourished by letting the internal forces-the
motivations of parents for their children and teachers for a satisfying ca-
reer-have
their head. We will state our recommendation in broad
terms:
The federal goclernment should actively support program that enable all
parents, not just affluent ones, to choose the school that their children attend.
Current movements to provide increased parental choice in schools are
a hopeful sign, whether it he choice within the public school system,
vouchers, or tuition tax credits. Without being any more specific than
that, we urge that increased parental choice extend to private as well as
pblic schools, and to religious private schools as well as secular ones.
Will increased parental choice help, given the modest academic goals
that many parents have for their children? There are reasons for think-
ing it will. First, the learning that goes on in a school depends on the
school environment as well as on its curriculum. Here, the great ma-
jority of parents and teachers stand on common ground. Orderly class-
rooms and well-enforced codes of behavior do not need to be mandated
but simply permitted; parents, teachers, and administrators alike will see
to it, if the control they once had over their schools is returned to them.
To have America's children, poor as well as rich, once again attending
safe, orderly schools would be no small achievement and would likely
foster more learning than the often chaotic public schools do now.
Gifted youngsters would also benefit by restoring local control. While
most parents do not want an authentically tougher education for their
children, some do, and they tend to be concentrated among the parents
of the brightest. Policy should make it as easy as possible for them to
match up with classes that satisfy their ambitions.
To the extent that the government succeeds in this first goal, the oth-
ers that we have in mind become less important. Rut as long as the cur-
rent situation prevails, in which federal money and the conditions
surrounding it play a major role in shaping public education, we rec-
ommend two other measures:
A federal prize scholarship program. This is one instance in which a spe-
cific, federal program could do some good in restoring educational ex-
cellence. As the law stands, federal scholarships and loan assistance are
awarded almost exclusively on the basis of financial need, leaving the
administration of standards to the colleges that admit and teach the
students. That program may continue as is, but Congress should add a
second program, not contingent on financial need but awarded com-
petitively-for
example, a flat one-time award of $20,000 to the 25,000
students in the country earning the top scores on standardized tests of
academic achievement, over and above whatever scholarship assistance
the student was receiving from other sources. How much would such
"American Scholars" (the Congress might call them) cost? Five hun-
dred million dollars a year-an
amount equivalent to a rounding error
in the national budget but one that would dramatically transform the
signal that the federal government sends about the value it places on
academic excellence.[621
Reallocate some portion of existing elementary and secondary school fed-
Prioritizing Academic Excellence
- The authors propose a federal prize scholarship program that awards $20,000 to the top 25,000 students based on academic achievement rather than financial need.
- A shift in federal funding is recommended, moving resources from programs for the disadvantaged toward programs for the gifted to balance educational support.
- The proposal includes rescinding federal regulations that currently discourage local school systems from experimenting with gifted education.
- The authors argue that the current educational system has an 'overwhelming tilt' toward the low end of the cognitive ability distribution.
- The justification for these changes is based on national welfare rather than social justice, asserting that the nation's future depends on its most intellectually gifted members.
- The text identifies the failure to support the high end of the cognitive distribution as the most enduring failure of contemporary American education.
These gifted youngsters are important not because they are more virtuous or deserving but because our society's future depends on them.
440
Living Together
The Leveling of American Education
441
than ideals such as more homework and a longer school year. It was not
the core ideas that were at fault (in most instances) but some basic prob-
lems that go with reforming American education at a national level.
We characterize the situation as follows: Slow improvement seems to
have been a natural part of twentieth-century American education un-
til the 1960s. This slow improvement had great inertia, in the sense that
a slow-moving freight train has inertia. It is very difficult for an outside
force to accelerate the freight train but comparatively easy for an out-
side force to derail it. In the United States, the federal government tends
to be an outside force, more often derailing than pushing along, for rea-
sons that are peculiarly American.
In countries such as France and Germany, with more homogeneous
populations and more authoritarian and unapologetically elitest educa-
tional traditions, the national government can get away with central-
ized school systems that educate their brightest youth well. In the
United States, it cannot. Federal standards, federal rules, and federal
curricula, were they to be established, would inevitably be watered down
and educational goals would be compromised with social and political
ones. The federal government responds to pushes from all sides and gets
equally nervous about affirming the genius of either Huck Finn or
Charles Darwin. Powerful teachers' organizations will not tolerate cer-
tification tests that flunk large numbers of teachers. Organizations that
represent minority groups will not tolerate national educational stan-
dards that cause large numbers of minority children to flunk. These are
political facts of life that will not change soon, no matter who is in the
White House.
With Americ;tVs Immense diversity and its tradition of local control,
Washington is the wrong place to look for either energy or wisdom on
educational reform. In our view, any natural impulse toward educational
improvement will he hest nourished by letting the internal forces-the
motivations of parents for their children and teachers for a satisfying ca-
reer-have
their head. We will state our recommendation in broad
terms:
The federal goclernment should actively support program that enable all
parents, not just affluent ones, to choose the school that their children attend.
Current movements to provide increased parental choice in schools are
a hopeful sign, whether it he choice within the public school system,
vouchers, or tuition tax credits. Without being any more specific than
that, we urge that increased parental choice extend to private as well as
pblic schools, and to religious private schools as well as secular ones.
Will increased parental choice help, given the modest academic goals
that many parents have for their children? There are reasons for think-
ing it will. First, the learning that goes on in a school depends on the
school environment as well as on its curriculum. Here, the great ma-
jority of parents and teachers stand on common ground. Orderly class-
rooms and well-enforced codes of behavior do not need to be mandated
but simply permitted; parents, teachers, and administrators alike will see
to it, if the control they once had over their schools is returned to them.
To have America's children, poor as well as rich, once again attending
safe, orderly schools would be no small achievement and would likely
foster more learning than the often chaotic public schools do now.
Gifted youngsters would also benefit by restoring local control. While
most parents do not want an authentically tougher education for their
children, some do, and they tend to be concentrated among the parents
of the brightest. Policy should make it as easy as possible for them to
match up with classes that satisfy their ambitions.
To the extent that the government succeeds in this first goal, the oth-
ers that we have in mind become less important. Rut as long as the cur-
rent situation prevails, in which federal money and the conditions
surrounding it play a major role in shaping public education, we rec-
ommend two other measures:
A federal prize scholarship program. This is one instance in which a spe-
cific, federal program could do some good in restoring educational ex-
cellence. As the law stands, federal scholarships and loan assistance are
awarded almost exclusively on the basis of financial need, leaving the
administration of standards to the colleges that admit and teach the
students. That program may continue as is, but Congress should add a
second program, not contingent on financial need but awarded com-
petitively-for
example, a flat one-time award of $20,000 to the 25,000
students in the country earning the top scores on standardized tests of
academic achievement, over and above whatever scholarship assistance
the student was receiving from other sources. How much would such
"American Scholars" (the Congress might call them) cost? Five hun-
dred million dollars a year-an
amount equivalent to a rounding error
in the national budget but one that would dramatically transform the
signal that the federal government sends about the value it places on
academic excellence.[621
Reallocate some portion of existing elementary and secondary school fed-
442
Living Together
The Leveling of American Education
443
eral aid away from programs for the disadvantaged to programs for the gifted.
The objective is to make sure that public school systems have roughly
the same capability to provide for students at the high end of the dis-
tribution as they have for helping students at the low end. A collateral
part of this reform should be to rescind any federal regulations or grant
requirements that might discourage local school systems from experi-
menting with or supporting programs for the gifted. At present, there is
an overwhelming tilt toward enriching the education of children from
the low end of the cognitive ability distribution. We propose more of a
balance across the cognitive ability distribution.
Restoring the Concept of the Educated Man
Why should the federal government shift money from programs for the
disadvantaged to programs for the gifted, when we know that a large
portion of the gifted come from privileged families? Why not just sup-
port programs for the gifted who happen to come from poor families as
well? In Part I, we went to some lengths to describe the dangers of a cog-
nitive elite. And yet here we call for steps that could easily increase the
segregation of the gifted from everyone else. Won't programs for the
gifted further isolate them?
The answers to such questions have nothing to do with social justice
but much to do with the welfare of the nation, including the ultimate
welfare of the disadvantaged.
The first point echoes a continuing theme of this book: Tc? be intel-
lectually gifted is indeed a gift. Nobody "deserves" it. The monetary and
social rewards that accrue to being intellectually gifted are growing all
the time, for reasons that are easily condemned as being unfair. Never
mind, we are saying. These gifted youngsters are important not because
they are more virtuous or deserving but because our society's future de-
pends on them. The one clear and enduring failure of contemporary
American education is at the high end of the cognitive ability distrib-
ution.
Ideally we would like to see the most gifted children receive a de-
manding education and attend school side by side with a wide range of
children, learning firsthand how the rest of the world lives. But that op-
tion is no more available now than it was during the attempts to force
the racial integration of urban schools in the 1960s and 1970s. The na-
tion's elementary and secondary schools are highly segregated by so-
cioeconomic status, they will tend to become more so in the future, and
the forces pushing these trends are so powerful, stemming from the
deeply rooted causes that we described in Part 1, that they can be re-
versed only by a level of state coercion that would be a cure far deadlier
than the disease.
Most gifted students are going to grow up segregated from the rest of
society no matter what. They will then go to the elite colleges no mat-
ter what, move into successful careers no matter what, and eventually
lead the institutions of this country no matter what. Therefore, the na-
tion had better do its damnedest to make them as wise as it can. If they
cannot grow up knowing how the rest of the world lives, they can at
least grow up with a proper humility about their capacity to reinvent
the world de novo and thoughtfully aware of their intellectual, cultural,
and ethical heritage. They should be taught their responsibilities as cit-
izens of a broader society.
The educational deficit that worries us is symbolized by the drop in
verbal skills on the SAT. What we call verbal skills encompass, among
other things, the ability to think about difficult problems: to analyze,
pick apart, disaggregate, synthesize, and ultimately to understand. It has
seldom been more apparent how important it is that the people who
count in business, law, politics, and our universities know how to think
about their problems in complex, rigorous modes and how important it
is that they bring to their thinking depth of judgment and, in the lan-
guage of Aristotle, the habit of virtue. This kind of wisdom-for
wis-
dom is what we need more of-does not come naturally with a high IQ.
It has to be added through education, and education of a particular kind.
We are not talking about generalized higher standards. Rather, we are
thinking of the classical idea of the "educated mann-which
we will
amend to "educated personv-in
which to be educated meant first of all
to master a core body of material and skills. The idea is not wedded to
the specific curriculum that made an educated man in the nineteenth-
century British public school or in the Greek lyceum. Rut it is wedded
to the idea of certain high intellectual goals. For example, to be an ed-
ucated person meant being able to write competently and argue logi-
cally. Therefore, children were taught the inner logic of grammar and
syntax because that kind of attention to detail was believed to carry over
to greater precision of thinking. They were expected to learn Aristotle's
catalog of fallacies, because educators understood that the ability to as-
sess an argument in everyday life was honed by mastering the formal el-
ements of logic. Ethics and theology were part of the curriculum, to
Educating the Cognitive Elite
- Socioeconomic segregation in schools is viewed as an irreversible trend that cannot be fixed without excessive state coercion.
- Since gifted children are destined for leadership roles regardless of their upbringing, the focus must shift to ensuring they are wise and humble.
- The decline in SAT verbal scores reflects a broader deficit in the ability to synthesize information and analyze complex problems.
- Wisdom and virtue do not naturally accompany a high IQ; they must be intentionally cultivated through a specific type of rigorous education.
- The authors advocate for a return to the classical ideal of the 'educated person,' centered on mastering a core body of history, literature, and logic.
- This proposed educational model is intentionally elitist, aiming to challenge the most capable students with the world's highest intellectual standards.
If they cannot grow up knowing how the rest of the world lives, they can at least grow up with a proper humility about their capacity to reinvent the world de novo.
442
Living Together
The Leveling of American Education
443
eral aid away from programs for the disadvantaged to programs for the gifted.
The objective is to make sure that public school systems have roughly
the same capability to provide for students at the high end of the dis-
tribution as they have for helping students at the low end. A collateral
part of this reform should be to rescind any federal regulations or grant
requirements that might discourage local school systems from experi-
menting with or supporting programs for the gifted. At present, there is
an overwhelming tilt toward enriching the education of children from
the low end of the cognitive ability distribution. We propose more of a
balance across the cognitive ability distribution.
Restoring the Concept of the Educated Man
Why should the federal government shift money from programs for the
disadvantaged to programs for the gifted, when we know that a large
portion of the gifted come from privileged families? Why not just sup-
port programs for the gifted who happen to come from poor families as
well? In Part I, we went to some lengths to describe the dangers of a cog-
nitive elite. And yet here we call for steps that could easily increase the
segregation of the gifted from everyone else. Won't programs for the
gifted further isolate them?
The answers to such questions have nothing to do with social justice
but much to do with the welfare of the nation, including the ultimate
welfare of the disadvantaged.
The first point echoes a continuing theme of this book: Tc? be intel-
lectually gifted is indeed a gift. Nobody "deserves" it. The monetary and
social rewards that accrue to being intellectually gifted are growing all
the time, for reasons that are easily condemned as being unfair. Never
mind, we are saying. These gifted youngsters are important not because
they are more virtuous or deserving but because our society's future de-
pends on them. The one clear and enduring failure of contemporary
American education is at the high end of the cognitive ability distrib-
ution.
Ideally we would like to see the most gifted children receive a de-
manding education and attend school side by side with a wide range of
children, learning firsthand how the rest of the world lives. But that op-
tion is no more available now than it was during the attempts to force
the racial integration of urban schools in the 1960s and 1970s. The na-
tion's elementary and secondary schools are highly segregated by so-
cioeconomic status, they will tend to become more so in the future, and
the forces pushing these trends are so powerful, stemming from the
deeply rooted causes that we described in Part 1, that they can be re-
versed only by a level of state coercion that would be a cure far deadlier
than the disease.
Most gifted students are going to grow up segregated from the rest of
society no matter what. They will then go to the elite colleges no mat-
ter what, move into successful careers no matter what, and eventually
lead the institutions of this country no matter what. Therefore, the na-
tion had better do its damnedest to make them as wise as it can. If they
cannot grow up knowing how the rest of the world lives, they can at
least grow up with a proper humility about their capacity to reinvent
the world de novo and thoughtfully aware of their intellectual, cultural,
and ethical heritage. They should be taught their responsibilities as cit-
izens of a broader society.
The educational deficit that worries us is symbolized by the drop in
verbal skills on the SAT. What we call verbal skills encompass, among
other things, the ability to think about difficult problems: to analyze,
pick apart, disaggregate, synthesize, and ultimately to understand. It has
seldom been more apparent how important it is that the people who
count in business, law, politics, and our universities know how to think
about their problems in complex, rigorous modes and how important it
is that they bring to their thinking depth of judgment and, in the lan-
guage of Aristotle, the habit of virtue. This kind of wisdom-for
wis-
dom is what we need more of-does not come naturally with a high IQ.
It has to be added through education, and education of a particular kind.
We are not talking about generalized higher standards. Rather, we are
thinking of the classical idea of the "educated mann-which
we will
amend to "educated personv-in
which to be educated meant first of all
to master a core body of material and skills. The idea is not wedded to
the specific curriculum that made an educated man in the nineteenth-
century British public school or in the Greek lyceum. Rut it is wedded
to the idea of certain high intellectual goals. For example, to be an ed-
ucated person meant being able to write competently and argue logi-
cally. Therefore, children were taught the inner logic of grammar and
syntax because that kind of attention to detail was believed to carry over
to greater precision of thinking. They were expected to learn Aristotle's
catalog of fallacies, because educators understood that the ability to as-
sess an argument in everyday life was honed by mastering the formal el-
ements of logic. Ethics and theology were part of the curriculum, to
The Leveling of American Education
445
teach and to refine virtue. We will not try to prescribe how a contem-
porary curriculum might be revised to achieve the same ends, beyond a
few essentials: To be an educated person must mean to have mastered a
core of history, literature, arts, ethics, and the sciences and, in the
process of learning those disciplines, to have been trained to weigh, an-
alyze, and evaluate according to exacting standards. This process must
begin in elementary school and must continue through the university.
Our proposal will sound, and is, elitist, but only in the sense that, af-
ter exposing students to the best the world's intellectual heritage has to
offer and challenging them to achieve whatever level of excellence they
are capable of, just a minority of students has the potential to become
"an educated person" as we are using the term. It is not within every-
one's ability to understand the world's intellectual heritage at the same
level, any more than everyone who enters college can expect to he a
theoretical physicist by trying hard enough. At every stage of learning,
some people reach their limits. This is not a controversial statement when
it applies to the highest levels of learning. Readers who kept taking
mathematics as long as they could stand it know that at some point they
hit the wall, and studying hard was no longer enough.
The nation has been unwilling to accept in recent decades that the
same phenomenon of individual limitation applies at every level of ed-
ucation. Given the constraints of time and educational resources, some
students cannot be taught statistical theory; a smaller fraction of stu-
dents cannot be taught the role of mercantilism in European history; for
even a smaller fraction, writing a coherent essay may be out of reach.
Each level of accomplishment deserves respect on its own merits, hut
the ideal of the educated person is in itself an ideal that must be em-
braced openly. By abandoning it, America has been falling short both
in educating its most gifted and in inculcating, across the entire cogni-
tive distribution, the values we would want in an educated citizenry.
But what do we want to do? What courses should be required of ed-
ucated persons? Do we want to have separate schools for the gifted and
average student? Tracking systems? A national Great Books curriculum?
We will say it again: Different parents will want to make different
choices for their children. We are not wise enough-and
neither are
any of our colleagues wise enough, nor is the federal government wise
enough-to
prescribe for them what is best for their children. The goal
of developing educated persons, like the goal of improving American
Educated, Not Credentialed
If we have not already made it plain, let us state explicitly that we are
proposing a traditional ideal of education, not glorifying academic cre-
dentials. To be an educated person as we use the term will ordinarily en-
tail getting a degree, but that is incidental. Credentialism-unnecessarily
limiting access to jobs to people with certain licenses and degrees-is part
of the problem, not a solution. Because academic credentials are so over-
valued, America shies away from accepting that many people have acad-
emic I~mitations-hence, the dumbing down that holds back the brightest
youngsters.
education in general, will best be served by letting parents and local
communities make those choices.
Rut parents and communities must turn to educators to implement
their hopes for their children, and here is the problem: Too few educa-
tors are comfortable with the idea of the educated person. A century ago
the notion of an educated person was an expression of a shared under-
standing, not of legal requirements. That understanding arose because
people were at ease with intellectual standards, with rigor, with a recog-
nition that people differ in their capacities. The criterion for being an
educated person did not have to be compromised to include the suppo-
sition that everyone could meet it. The concept of the educated person
has been out of fashion with the people who run elementary and sec-
ondary schools and, for that matter, with too many of the people who
run universities.
Our policy goal? That educators who read these words change their
minds. It is a reform that is at once impossible to legislate but requires
no money at all. It a reform that would not jeopardize the educational
advances of the average student. All that we ask is that educational lead-
ers rededicate themselves to the duty that was once at the heart of their
calling, to demand much from those fortunate students to whom much
has been given.
The Ideal of Education
- The text argues that the capacity to become an 'educated person' is a minority potential, limited by individual cognitive boundaries similar to those found in advanced mathematics.
- Modern education has failed by refusing to acknowledge individual limitations, leading to a 'dumbing down' of curricula that neglects the most gifted students.
- The authors distinguish between true education and 'credentialism,' arguing that overvaluing degrees has compromised intellectual standards and rigor.
- Educational reform should not be legislated by the federal government but driven by parental choice and local community standards.
- The primary policy goal is a shift in educator mindset to once again demand excellence from students with high cognitive potential.
- A return to traditional ideals would foster a shared understanding of intellectual heritage without requiring every citizen to meet the same academic level.
Readers who kept taking mathematics as long as they could stand it know that at some point they hit the wall, and studying hard was no longer enough.
The Leveling of American Education
445
teach and to refine virtue. We will not try to prescribe how a contem-
porary curriculum might be revised to achieve the same ends, beyond a
few essentials: To be an educated person must mean to have mastered a
core of history, literature, arts, ethics, and the sciences and, in the
process of learning those disciplines, to have been trained to weigh, an-
alyze, and evaluate according to exacting standards. This process must
begin in elementary school and must continue through the university.
Our proposal will sound, and is, elitist, but only in the sense that, af-
ter exposing students to the best the world's intellectual heritage has to
offer and challenging them to achieve whatever level of excellence they
are capable of, just a minority of students has the potential to become
"an educated person" as we are using the term. It is not within every-
one's ability to understand the world's intellectual heritage at the same
level, any more than everyone who enters college can expect to he a
theoretical physicist by trying hard enough. At every stage of learning,
some people reach their limits. This is not a controversial statement when
it applies to the highest levels of learning. Readers who kept taking
mathematics as long as they could stand it know that at some point they
hit the wall, and studying hard was no longer enough.
The nation has been unwilling to accept in recent decades that the
same phenomenon of individual limitation applies at every level of ed-
ucation. Given the constraints of time and educational resources, some
students cannot be taught statistical theory; a smaller fraction of stu-
dents cannot be taught the role of mercantilism in European history; for
even a smaller fraction, writing a coherent essay may be out of reach.
Each level of accomplishment deserves respect on its own merits, hut
the ideal of the educated person is in itself an ideal that must be em-
braced openly. By abandoning it, America has been falling short both
in educating its most gifted and in inculcating, across the entire cogni-
tive distribution, the values we would want in an educated citizenry.
But what do we want to do? What courses should be required of ed-
ucated persons? Do we want to have separate schools for the gifted and
average student? Tracking systems? A national Great Books curriculum?
We will say it again: Different parents will want to make different
choices for their children. We are not wise enough-and
neither are
any of our colleagues wise enough, nor is the federal government wise
enough-to
prescribe for them what is best for their children. The goal
of developing educated persons, like the goal of improving American
Educated, Not Credentialed
If we have not already made it plain, let us state explicitly that we are
proposing a traditional ideal of education, not glorifying academic cre-
dentials. To be an educated person as we use the term will ordinarily en-
tail getting a degree, but that is incidental. Credentialism-unnecessarily
limiting access to jobs to people with certain licenses and degrees-is part
of the problem, not a solution. Because academic credentials are so over-
valued, America shies away from accepting that many people have acad-
emic I~mitations-hence, the dumbing down that holds back the brightest
youngsters.
education in general, will best be served by letting parents and local
communities make those choices.
Rut parents and communities must turn to educators to implement
their hopes for their children, and here is the problem: Too few educa-
tors are comfortable with the idea of the educated person. A century ago
the notion of an educated person was an expression of a shared under-
standing, not of legal requirements. That understanding arose because
people were at ease with intellectual standards, with rigor, with a recog-
nition that people differ in their capacities. The criterion for being an
educated person did not have to be compromised to include the suppo-
sition that everyone could meet it. The concept of the educated person
has been out of fashion with the people who run elementary and sec-
ondary schools and, for that matter, with too many of the people who
run universities.
Our policy goal? That educators who read these words change their
minds. It is a reform that is at once impossible to legislate but requires
no money at all. It a reform that would not jeopardize the educational
advances of the average student. All that we ask is that educational lead-
ers rededicate themselves to the duty that was once at the heart of their
calling, to demand much from those fortunate students to whom much
has been given.
Affirmative Action in Higher Education
- The authors argue that affirmative action as currently practiced involves an extremely large advantage for black and Latino candidates rather than a simple tie-breaker.
- Data suggests a significant gap in cognitive ability percentiles between minority students and their white or Asian peers on elite campuses.
- The current system often prioritizes affluent minority applicants over disadvantaged white applicants, complicating the moral defense of the practice.
- While affirmative action has increased minority enrollment, it is linked to high dropout rates and increased racial animosity due to visible performance disparities.
- Asian applicants are described as an unprotected minority who often face a modest penalty in the admissions process compared to white applicants.
- The text advocates for a return to original intentions: focusing on socioeconomic disadvantage regardless of race to foster a healthier multiracial society.
On elite campuses, the average black freshman is in the region of the 10th to 15th percentile of the distribution of cognitive ability among white freshman.
Chapter 19
Affirmative Action in Higher
Education
Affimtive action on the campus needs, at last, to be discussed as it is actu-
ally practiced, not as the rhetoric portrays it. Our own efforts to assemble data
on a secretive process kad us to conclude that affirmative action as it is prac-
ticed cannot survive public scrutiny.
The edge given to minority applicants to college and graduate school is not
a nod in their favor in the case of a close call but an extremely large advan-
tage that puts black and Lahno candidates in a separate admissions competi-
tion. On elite campuses, the average black freshman is in the region of the
loth to 15th percentile of the distribution of cognitive ability among white
freshman. Nationwide, the gap seems to be at least that large, perhaps larger.
The gap does not diminish in gnduate school. If anything, it may be larger.
In the world of college admissions, Asians are a conspicuously unprotected
minority. At the elite schools, they suffer a modest penalty, with the average
Asian freshman being at about the 60th percentile of the white cognitive abil-
ity dismbution. Our data from state universities are too sparse to draw con-
clusions. In all the available cases, the difference between white and Asian
distributions is small (either plus or minw) compared to the large differences
separating blacks and Latinos from whites.
The edge given to minority candidates could be more easily defended if the
competition were between disadvantaged minority youths and privileged white
youths. But nearly as large a cognitive difference separates disadvantaged
black freshmen from disadvantaged white freshmen. Still more difficult to de-
fend, blacks from afluent socioeconomic backgrounds are given a substantial
edge over disadvantaged whites.
There is no question that affirmative action has "worked," in the sense that
it has put more blacks and Latinos on college campuses than would otherwise
have been there. But this success must be measured against costs. When stu-
dents look around them, they see that blacks and Latinos constitute small pro-
448
Living Together
Affirmative Action in Higher Education
449
portions of the student population but high proportions of the students doing
poorly in school. The psychological consequences of this disparity may be part
of the explanation for the increaqingracial animosity and the high black dropout
rates that have troubled American campuses. In society at large, a college de-
gree does not have the same meaningfor a minority graduate and a white one,
with consequences that reverberate in the workplace and continue throughout
life.
It is time to return to the on'ginal intentions of affirmative action: to cast a
wider net, to gi~~e
preference to members of disadvantaged groups, whatever
their skin color, when qualifications are similar. Such a change wot4ld accrrrd
more closely with the logic underlying affirmative action, with the nee& of to-
day's students of all ethnic groups, and with progress toward a health? mul-
tiracial society.
e come to national policies that require people to treat groups
w
d
ifferently under the law. Affirmative action began to he woven
into American employment and educational practices in the 1960s as
universities and employers intensified their recruiting of blacks-ini-
tially on their own, then in compliance with a widening body of court
decisions and laws. By the early 1970s, affirmative action had been ex-
panded beyond blacks to include women, Latinos, and the disabled. It
also became more aggressive. Targets, guidelines, and de facto quotas"'
evolved as universities and employers discovered that the equality of
outcome that people sought was not to be had from traditional recruit-
ing methods. As it became more aggressive, affirmative action became
correspondingly more controversial.
Affirmative action creates antagonism partly because it affects the
distribution of scarce goods-university
places, scholarships, joh offers,
and promotions-that
people prize. But it is also problematic for rea-
sons that reach into deeply held beliefs-most
fundamentally, heliefs
about the ideal of equal opportunity versus the reality of the historical
experience of certain groups, preeminently blacks, in this countv. As
the rhetoric heats up, the arguments about affirmative action hecome
blurred. Affirmative action raises different questions in different con-
texts. What, people ask, are the proper goals of affirmative action, the
proper methods? Which groups are to be benefited? What are the costs
of affirmative action, and who should bear them? Is affirmative action
a temporary expedient to correct past wrongs, or must the American
ideal of individualism be permanently modified for the collective needs
of members of certain groups?
Affirmative action is part of this book because it has been based on
the explicit assumption that ethnic groups do not differ in the abilities
that contribute to success in school and the workplace--or, at any rate,
there are no differences that cannot be made up with a few remedial
courses or a few months on the job. Much of this book has been given
over to the many ways in which that assumption is wrong. The impli-
cations have to be discussed, and that is the purpose of this chapter and
the next, augmented by an appendix on the evolution of affirmative ac-
tion regulations (Appendix 7). Together, these materials constitute a
longer discussion than we devote to any other policy issue, for two rea-
sons. First, we are making a case that contradicts a received wisdom em-
bedded in an intellectual consensus, federal legislation, and Supreme
Court jurisprudence. If the task is to be attempted at all, it must be done
thoroughly. Second, we believe affirmative action to be one of the most
far-reaching domestic issues of our time-not
measured in its immedi-
ate effects, but in its deep and pervasive impact on America's under-
standing of what is just and unjust, how a pluralist society should be
organized, and what America is supposed to stand for.
In this chapter, the topic is the college campus. In Chapter 20, we
discuss affirmative action in the workplace. In both chapters, we pro-
vide data as available on Asians and Latinos, but the analysis centers
on blacks, as has the debate over affirmative action.
THE "EDGE" IN AFFIRMATIVE ACTION
People may agree that they want affirmative action in higher education
until they say more precisely what they mean by it. Then they may dis-
agree. But whatever the argument, it would help to have some data
about how colleges and universities have translated the universal desire
for greater fairness in university education into affirmative action pro-
grams. Our first goal is to inform the debate with such data.
At first glance, ours may seem an odd objective, for certain kinds of
data about affirmative action are abundant. Universities and businesses
keep detailed numbers about the numbers of minorities who apply and
are accepted. But data about the core mechanism of affirmative action-
The Affirmative Action Debate
- Affirmative action creates a conflict between the ideal of equal opportunity and the historical reality of group experiences.
- The policy is built on the assumption that ethnic groups do not differ in innate abilities relevant to academic or professional success.
- The authors argue that this foundational assumption is incorrect, necessitating a thorough re-examination of established intellectual and legal consensus.
- Affirmative action is viewed as a critical domestic issue that shapes the national understanding of justice and pluralism.
- While data on minority enrollment is public, the specific weight or 'value' assigned to group membership in admissions remains largely hidden.
- The controversy surrounding Timothy Maguire at Georgetown highlights the tension and secrecy regarding racial differences in standardized test scores.
Is affirmative action a temporary expedient to correct past wrongs, or must the American ideal of individualism be permanently modified for the collective needs of members of certain groups?
448
Living Together
Affirmative Action in Higher Education
449
portions of the student population but high proportions of the students doing
poorly in school. The psychological consequences of this disparity may be part
of the explanation for the increaqingracial animosity and the high black dropout
rates that have troubled American campuses. In society at large, a college de-
gree does not have the same meaningfor a minority graduate and a white one,
with consequences that reverberate in the workplace and continue throughout
life.
It is time to return to the on'ginal intentions of affirmative action: to cast a
wider net, to gi~~e
preference to members of disadvantaged groups, whatever
their skin color, when qualifications are similar. Such a change wot4ld accrrrd
more closely with the logic underlying affirmative action, with the nee& of to-
day's students of all ethnic groups, and with progress toward a health? mul-
tiracial society.
e come to national policies that require people to treat groups
w
d
ifferently under the law. Affirmative action began to he woven
into American employment and educational practices in the 1960s as
universities and employers intensified their recruiting of blacks-ini-
tially on their own, then in compliance with a widening body of court
decisions and laws. By the early 1970s, affirmative action had been ex-
panded beyond blacks to include women, Latinos, and the disabled. It
also became more aggressive. Targets, guidelines, and de facto quotas"'
evolved as universities and employers discovered that the equality of
outcome that people sought was not to be had from traditional recruit-
ing methods. As it became more aggressive, affirmative action became
correspondingly more controversial.
Affirmative action creates antagonism partly because it affects the
distribution of scarce goods-university
places, scholarships, joh offers,
and promotions-that
people prize. But it is also problematic for rea-
sons that reach into deeply held beliefs-most
fundamentally, heliefs
about the ideal of equal opportunity versus the reality of the historical
experience of certain groups, preeminently blacks, in this countv. As
the rhetoric heats up, the arguments about affirmative action hecome
blurred. Affirmative action raises different questions in different con-
texts. What, people ask, are the proper goals of affirmative action, the
proper methods? Which groups are to be benefited? What are the costs
of affirmative action, and who should bear them? Is affirmative action
a temporary expedient to correct past wrongs, or must the American
ideal of individualism be permanently modified for the collective needs
of members of certain groups?
Affirmative action is part of this book because it has been based on
the explicit assumption that ethnic groups do not differ in the abilities
that contribute to success in school and the workplace--or, at any rate,
there are no differences that cannot be made up with a few remedial
courses or a few months on the job. Much of this book has been given
over to the many ways in which that assumption is wrong. The impli-
cations have to be discussed, and that is the purpose of this chapter and
the next, augmented by an appendix on the evolution of affirmative ac-
tion regulations (Appendix 7). Together, these materials constitute a
longer discussion than we devote to any other policy issue, for two rea-
sons. First, we are making a case that contradicts a received wisdom em-
bedded in an intellectual consensus, federal legislation, and Supreme
Court jurisprudence. If the task is to be attempted at all, it must be done
thoroughly. Second, we believe affirmative action to be one of the most
far-reaching domestic issues of our time-not
measured in its immedi-
ate effects, but in its deep and pervasive impact on America's under-
standing of what is just and unjust, how a pluralist society should be
organized, and what America is supposed to stand for.
In this chapter, the topic is the college campus. In Chapter 20, we
discuss affirmative action in the workplace. In both chapters, we pro-
vide data as available on Asians and Latinos, but the analysis centers
on blacks, as has the debate over affirmative action.
THE "EDGE" IN AFFIRMATIVE ACTION
People may agree that they want affirmative action in higher education
until they say more precisely what they mean by it. Then they may dis-
agree. But whatever the argument, it would help to have some data
about how colleges and universities have translated the universal desire
for greater fairness in university education into affirmative action pro-
grams. Our first goal is to inform the debate with such data.
At first glance, ours may seem an odd objective, for certain kinds of
data about affirmative action are abundant. Universities and businesses
keep detailed numbers about the numbers of minorities who apply and
are accepted. But data about the core mechanism of affirmative action-
450
Living Together
Affirmutive Action in Higher Education
45 1
the magnitudes of the values assigned to group membership-are
not
part of the public debate.
This ignorance about practice was revealed in 1991 by a law student
at Georgetown University, Timothy Maguire, who had been hired to file
student records2 He surreptitiously compiled the entrance statistics for
a sample of applicants to Georgetown's law school and then published
the results of his research in the law school's student newspaper. He re-
vealed that the mean on the Law School Aptitude Test (LSAT) differed
by a large margin for accepted black and white students.
In the storm that ensued, the dean of the law school ordered copies
of the newspaper to be confiscated and black student groups called for
Maguire's expulsion. Hardly anyone would acknowledge that Maguire's
numbers even raised a legitimate issue. "Incomplete and distorted in-
formation about minority qualifications for admission into the Law
Center renew the long-standing and intellectually dishonest myth that
they are less qualified than their white counterparts to compete in
school, perform on the job or receive a promotion," wrote the authors
of an op-ed article in the Washington Post,j and that seemed to be the
prevailing attitude. The numerical magnitude of the edge given to mem-
bers of certain groups-the
value assigned to the state of being black,
Latino, female, or physically disabled-was
not considered relevant.
Such edges are inherent in the process. In as neutral and precise lan-
guage as we can devise: Perfectly practiced, the traditional American
ideal of equal opportunity means using exclusively individual measures,
applied uniformly, to choose some people over others. Perfectly prac-
ticed, affirmative action means assigning a premium, an edge, to group
membership in addition to the individual measures hefore making a fi-
nal assessment that chooses some people over others.
The size of the premium assigned to group membership-an ethnic
premium when it is applied to affirmative action for favored ethnic
groups-is
important in trying to judge whether affirmative action in
principle is working. This knowledge should be useful not only (or even
primarily) for deciding whether one is "for" or "against" affirmative ac-
tion in the abstract. It should be especially useful for the proponents of
affirmative action. Given that one is in favor of affirmative action, how
may it be practiced in a way that conforms with one's overall notions of
what is fair and appropriate? If one opposes affirmative action in prin-
ciple, how much is it deforming behavior in practice?
It is not obvious precisely where questions of fact trail into questions
of philosophy, hut we will attempt to stay on the factual side of the line
at first. A hit of philosophical speculation is reserved for the end of the
chapter. We first examine evidence on the magnitude of the ethnic pre-
mium from individual colleges and universities, then from professional
schools. We then recast the NLSY data in terms of the rationale un-
derlying affirmative action. We conclude that the size of the premium
is unreasonably large, producing differences in academic talent across
campus ethnic groups so gaping that they are in no one's best interest.
We further argue that the current practice is out of keeping with the ra-
tionale for affirmative action.
The Magnitude of the Edge in Undergraduate Schools
We have obtained SAT data on classes entering twenty-six of the na-
tion's top colleges and universities. In 1975, most of the nation's elite
private colleges and universities formed the Consortium on Financing
Higher Education (COFHE), which, among other things, compiles and
shares information on the students at member institutions, including
their SAT scores. We have obtained these data for the classes entering
in 1991 and 1992.4 They include sixteen out of the twenty top-rated
private universities and five of the top ten private colleges, as ranked in
U.S. News and World Report for 1993.5 The figure below shows the dif-
ference in the sum of the average Verbal and Math SAT scores between
whites and two minorities, blacks and Asians, for the classes in the
COFHE schools that matriculated in the fall of 1992. In addition, the
figure includes data on the University of Virginia and the University of
California at Berkeley in 1988.~
The difference between black and white scores was less than 100
points at only one school, Harvard. It exceeded 200 points at nine
schools, reaching its highest at Berkeley (288 points). Overall, the me-
dian difference between the white mean and the black mean was 180
SAT points, or, conservatively estimated, about 1.3 standard devia-
tion~.'~'
This would put the average black at about the 10th percentile
of white students. In all but four schools, Asians were within 6 points
of the white mean or above it, with a median SAT 30 points above the
local white average, working out to about .2 standard deviations. Or in
other words, the average Asian was at about the 60th percentile of the
white distribution. This combination means that blacks and Asians
have even less overlap than blacks and whites at most schools, with the
The Magnitude of Affirmative Action
- Critics argue that disclosing the specific numerical weight given to minority status reinforces harmful myths about the qualifications of minority students.
- The text distinguishes between the ideal of equal opportunity, based on individual measures, and affirmative action, which adds a premium for group membership.
- The authors contend that the size of the 'ethnic premium' is a critical metric for evaluating whether affirmative action is functioning fairly or effectively.
- Data from elite universities reveals a median gap of 180 SAT points between white and black students, equivalent to roughly 1.3 standard deviations.
- The authors argue that current premiums are 'unreasonably large,' creating academic talent gaps that serve neither the students nor the institutions.
- The study utilizes data from the Consortium on Financing Higher Education (COFHE) to compare admissions standards across top-tier private and public universities.
The difference between black and white scores was less than 100 points at only one school, Harvard.
450
Living Together
Affirmutive Action in Higher Education
45 1
the magnitudes of the values assigned to group membership-are
not
part of the public debate.
This ignorance about practice was revealed in 1991 by a law student
at Georgetown University, Timothy Maguire, who had been hired to file
student records2 He surreptitiously compiled the entrance statistics for
a sample of applicants to Georgetown's law school and then published
the results of his research in the law school's student newspaper. He re-
vealed that the mean on the Law School Aptitude Test (LSAT) differed
by a large margin for accepted black and white students.
In the storm that ensued, the dean of the law school ordered copies
of the newspaper to be confiscated and black student groups called for
Maguire's expulsion. Hardly anyone would acknowledge that Maguire's
numbers even raised a legitimate issue. "Incomplete and distorted in-
formation about minority qualifications for admission into the Law
Center renew the long-standing and intellectually dishonest myth that
they are less qualified than their white counterparts to compete in
school, perform on the job or receive a promotion," wrote the authors
of an op-ed article in the Washington Post,j and that seemed to be the
prevailing attitude. The numerical magnitude of the edge given to mem-
bers of certain groups-the
value assigned to the state of being black,
Latino, female, or physically disabled-was
not considered relevant.
Such edges are inherent in the process. In as neutral and precise lan-
guage as we can devise: Perfectly practiced, the traditional American
ideal of equal opportunity means using exclusively individual measures,
applied uniformly, to choose some people over others. Perfectly prac-
ticed, affirmative action means assigning a premium, an edge, to group
membership in addition to the individual measures hefore making a fi-
nal assessment that chooses some people over others.
The size of the premium assigned to group membership-an ethnic
premium when it is applied to affirmative action for favored ethnic
groups-is
important in trying to judge whether affirmative action in
principle is working. This knowledge should be useful not only (or even
primarily) for deciding whether one is "for" or "against" affirmative ac-
tion in the abstract. It should be especially useful for the proponents of
affirmative action. Given that one is in favor of affirmative action, how
may it be practiced in a way that conforms with one's overall notions of
what is fair and appropriate? If one opposes affirmative action in prin-
ciple, how much is it deforming behavior in practice?
It is not obvious precisely where questions of fact trail into questions
of philosophy, hut we will attempt to stay on the factual side of the line
at first. A hit of philosophical speculation is reserved for the end of the
chapter. We first examine evidence on the magnitude of the ethnic pre-
mium from individual colleges and universities, then from professional
schools. We then recast the NLSY data in terms of the rationale un-
derlying affirmative action. We conclude that the size of the premium
is unreasonably large, producing differences in academic talent across
campus ethnic groups so gaping that they are in no one's best interest.
We further argue that the current practice is out of keeping with the ra-
tionale for affirmative action.
The Magnitude of the Edge in Undergraduate Schools
We have obtained SAT data on classes entering twenty-six of the na-
tion's top colleges and universities. In 1975, most of the nation's elite
private colleges and universities formed the Consortium on Financing
Higher Education (COFHE), which, among other things, compiles and
shares information on the students at member institutions, including
their SAT scores. We have obtained these data for the classes entering
in 1991 and 1992.4 They include sixteen out of the twenty top-rated
private universities and five of the top ten private colleges, as ranked in
U.S. News and World Report for 1993.5 The figure below shows the dif-
ference in the sum of the average Verbal and Math SAT scores between
whites and two minorities, blacks and Asians, for the classes in the
COFHE schools that matriculated in the fall of 1992. In addition, the
figure includes data on the University of Virginia and the University of
California at Berkeley in 1988.~
The difference between black and white scores was less than 100
points at only one school, Harvard. It exceeded 200 points at nine
schools, reaching its highest at Berkeley (288 points). Overall, the me-
dian difference between the white mean and the black mean was 180
SAT points, or, conservatively estimated, about 1.3 standard devia-
tion~.'~'
This would put the average black at about the 10th percentile
of white students. In all but four schools, Asians were within 6 points
of the white mean or above it, with a median SAT 30 points above the
local white average, working out to about .2 standard deviations. Or in
other words, the average Asian was at about the 60th percentile of the
white distribution. This combination means that blacks and Asians
have even less overlap than blacks and whites at most schools, with the
Affirmative Action and SAT Disparities
- Data from elite universities reveals significant disparities in median SAT scores across different ethnic groups, with black students averaging 180 points below the white mean.
- Asian students frequently outperform white students, with a median SAT score 30 points above the local white average at many selective institutions.
- The text suggests that elite universities are effectively 'race norming' by maintaining student populations that reflect broader ethnic differences in cognitive distributions.
- Latino students occupy a middle ground in the data, typically scoring about 129 points below the white mean, placing them at the 20th percentile of white distribution.
- The disparity between Asian and black students is even more pronounced than the black-white gap, with the median black student falling in the 5th to 7th percentile of the Asian distribution.
- Investigations into potential reverse discrimination against Asian applicants have occurred at schools like Harvard and Brown, often citing preferences for athletes and alumni children as confounding factors.
At selective schools, the median black edge was 180 SAT points, while Asians faced a median penalty of 30 points.
450
Living Together
Affirmutive Action in Higher Education
45 1
the magnitudes of the values assigned to group membership-are
not
part of the public debate.
This ignorance about practice was revealed in 1991 by a law student
at Georgetown University, Timothy Maguire, who had been hired to file
student records2 He surreptitiously compiled the entrance statistics for
a sample of applicants to Georgetown's law school and then published
the results of his research in the law school's student newspaper. He re-
vealed that the mean on the Law School Aptitude Test (LSAT) differed
by a large margin for accepted black and white students.
In the storm that ensued, the dean of the law school ordered copies
of the newspaper to be confiscated and black student groups called for
Maguire's expulsion. Hardly anyone would acknowledge that Maguire's
numbers even raised a legitimate issue. "Incomplete and distorted in-
formation about minority qualifications for admission into the Law
Center renew the long-standing and intellectually dishonest myth that
they are less qualified than their white counterparts to compete in
school, perform on the job or receive a promotion," wrote the authors
of an op-ed article in the Washington Post,j and that seemed to be the
prevailing attitude. The numerical magnitude of the edge given to mem-
bers of certain groups-the
value assigned to the state of being black,
Latino, female, or physically disabled-was
not considered relevant.
Such edges are inherent in the process. In as neutral and precise lan-
guage as we can devise: Perfectly practiced, the traditional American
ideal of equal opportunity means using exclusively individual measures,
applied uniformly, to choose some people over others. Perfectly prac-
ticed, affirmative action means assigning a premium, an edge, to group
membership in addition to the individual measures hefore making a fi-
nal assessment that chooses some people over others.
The size of the premium assigned to group membership-an ethnic
premium when it is applied to affirmative action for favored ethnic
groups-is
important in trying to judge whether affirmative action in
principle is working. This knowledge should be useful not only (or even
primarily) for deciding whether one is "for" or "against" affirmative ac-
tion in the abstract. It should be especially useful for the proponents of
affirmative action. Given that one is in favor of affirmative action, how
may it be practiced in a way that conforms with one's overall notions of
what is fair and appropriate? If one opposes affirmative action in prin-
ciple, how much is it deforming behavior in practice?
It is not obvious precisely where questions of fact trail into questions
of philosophy, hut we will attempt to stay on the factual side of the line
at first. A hit of philosophical speculation is reserved for the end of the
chapter. We first examine evidence on the magnitude of the ethnic pre-
mium from individual colleges and universities, then from professional
schools. We then recast the NLSY data in terms of the rationale un-
derlying affirmative action. We conclude that the size of the premium
is unreasonably large, producing differences in academic talent across
campus ethnic groups so gaping that they are in no one's best interest.
We further argue that the current practice is out of keeping with the ra-
tionale for affirmative action.
The Magnitude of the Edge in Undergraduate Schools
We have obtained SAT data on classes entering twenty-six of the na-
tion's top colleges and universities. In 1975, most of the nation's elite
private colleges and universities formed the Consortium on Financing
Higher Education (COFHE), which, among other things, compiles and
shares information on the students at member institutions, including
their SAT scores. We have obtained these data for the classes entering
in 1991 and 1992.4 They include sixteen out of the twenty top-rated
private universities and five of the top ten private colleges, as ranked in
U.S. News and World Report for 1993.5 The figure below shows the dif-
ference in the sum of the average Verbal and Math SAT scores between
whites and two minorities, blacks and Asians, for the classes in the
COFHE schools that matriculated in the fall of 1992. In addition, the
figure includes data on the University of Virginia and the University of
California at Berkeley in 1988.~
The difference between black and white scores was less than 100
points at only one school, Harvard. It exceeded 200 points at nine
schools, reaching its highest at Berkeley (288 points). Overall, the me-
dian difference between the white mean and the black mean was 180
SAT points, or, conservatively estimated, about 1.3 standard devia-
tion~.'~'
This would put the average black at about the 10th percentile
of white students. In all but four schools, Asians were within 6 points
of the white mean or above it, with a median SAT 30 points above the
local white average, working out to about .2 standard deviations. Or in
other words, the average Asian was at about the 60th percentile of the
white distribution. This combination means that blacks and Asians
have even less overlap than blacks and whites at most schools, with the
45 2
Living Together
Afjirmative Action in Higher Education
453
At selective schools, the median black edge was 180 SAT points,
while Asians faced a median penalty of 30 points
SAT-point difference from the white mean
Blacks
Asians
7@ ,
R~ce
Berkeley
Un~v. of Virg~nla
119
Dartmouth
Oberlln
Un~v. of Rochester
n
Wedeyan
I
2-28
Un~v. of Ch~cago
Stanford
-
42
Columb~a
38
Duke
32
Trin~ty
36
W~ll~ams
I
35
Northwestern
-
355'
Johns Hopk~ns
-
34
Wellesley
v
Swarthmore
18
Amherst
II
R
Princeton
40
Brown
-21
Cornell
-23
U Penn
1
6
5
Harvard
-
Georgetown
1
5
M IT
I
Wash~ngton
I
I
I
I
I
I
I
I
I
-300 -250
-200 -150 -100
-SO
0
+ S O +loo
Sources: Consortium on Financing Higher Education 1992; Satich 1990 (for Rerkeley); L.
Ftinherg, "Rlack freshman enrollment rises 46% at U-Va," Washin*m Post, Dec. 26, 1988,
p. C1 (for University of Virginia).
median black at the 5th to 7th percentile of the distribution of Asian
students. Data for Latinos (not shown in the figure) put them between
blacks and whites, with a median of 129 points below the white mean,
or about .9 standard deviation below the white mean in the typical case.
The average Latino is therefore at about the 20th percentile of the dis-
tribution of white students.'"
The ordering of black, Latino, white, and Asian is similar to that re-
ported for IQ and SAT scores in Chapter 13. In other words, elite uni-
versities are race norming (though it is doubtful they think of it that
way), carrying with them into their student populations the ethnic dif-
ferences in cognitive distributions observed in the population at large.
We would prefer to have a sample of nonelite state universities rep-
resented in our data, but such numbers are closely .guarded.'" The only
data we have obtained come from the University of California at Davis,
for 1979. The black-white difference then was 27 1 SAT points, and the
Latino.white difference 21 1
T h e Asian mean at Davis was,
atypically, 54 points below the white mean, the largest such difference
we have found.
The data from the University of Virginia and the two University of
California campuses suggest that the gap hetween minorities and whites
among freshmen at state universities may be larger than at the elite pri-
vate schools. It is only a suggestion, given the limited data, but it also
Are Asians the Victims of Reverse Discrimination?
Complaints that Asian-American applicants were being subjected to re-
verse discrimination led eventually to a full-scale inquiry in the late 1980s
hy the federal Office for Civil Rights. Harvarcl, which was examined
closely, was ahle to show that the SAT penalty of their Asian admitted stu-
dents was accounted for by the smaller number of alumni children and ath-
letes in the pool, and eventually got a clean bill of health, hut the
controversy remains at many other institutions." Brown responded to a re-
port from its Asian-American Students Association hy admitting the ex-
istence of "an extremely serious situation" and called for "immediate
remedial measures."12 At Berkeley, Stanford, Princeton, and other elite
schools, special committees have investigated the issue, issuing reports that
tend to exonerate their colleges of actual reverse discrimination but ac-
knowledge shortcomings in keeping up with the revolution in Asian ap-
plicants."
The irnderlying source of tension remains: Asians are an ethnic minor-
ity, many of whom, or whose parents, came to the United States under cir-
cumstances of extreme deprivation. Many suffered from racial prejudice.
Whether or not they are treated differently from whites hy elite universi-
ties, Asians are indisputably treated differently from every other nonwhite
ethnic minority. University officials everywhere have heen reluctant to
confront this issue forthrightly.
The Mathematics of Minority Recruiting
- Elite private universities like Harvard and Stanford aggressively compete for a very small pool of high-scoring Black and Latino students.
- The scarcity of high-achieving minority applicants has led to 'athletic-style' recruitment tactics, including massive financial grants and travel budgets regardless of need.
- Aggressive affirmative action at top-tier state schools like Berkeley has paradoxically widened the SAT gap because white admission standards rose even faster.
- Asian applicants occupy a unique and difficult position, facing rising standards that have pushed their mean scores above those of white students.
- The resulting SAT disparities are so significant that there is often very little overlap between the academic profiles of different racial groups on the same campus.
As a result, a number of college officials privately accuse each other of 'stealing' black students.
45 2
Living Together
Afjirmative Action in Higher Education
453
At selective schools, the median black edge was 180 SAT points,
while Asians faced a median penalty of 30 points
SAT-point difference from the white mean
Blacks
Asians
7@ ,
R~ce
Berkeley
Un~v. of Virg~nla
119
Dartmouth
Oberlln
Un~v. of Rochester
n
Wedeyan
I
2-28
Un~v. of Ch~cago
Stanford
-
42
Columb~a
38
Duke
32
Trin~ty
36
W~ll~ams
I
35
Northwestern
-
355'
Johns Hopk~ns
-
34
Wellesley
v
Swarthmore
18
Amherst
II
R
Princeton
40
Brown
-21
Cornell
-23
U Penn
1
6
5
Harvard
-
Georgetown
1
5
M IT
I
Wash~ngton
I
I
I
I
I
I
I
I
I
-300 -250
-200 -150 -100
-SO
0
+ S O +loo
Sources: Consortium on Financing Higher Education 1992; Satich 1990 (for Rerkeley); L.
Ftinherg, "Rlack freshman enrollment rises 46% at U-Va," Washin*m Post, Dec. 26, 1988,
p. C1 (for University of Virginia).
median black at the 5th to 7th percentile of the distribution of Asian
students. Data for Latinos (not shown in the figure) put them between
blacks and whites, with a median of 129 points below the white mean,
or about .9 standard deviation below the white mean in the typical case.
The average Latino is therefore at about the 20th percentile of the dis-
tribution of white students.'"
The ordering of black, Latino, white, and Asian is similar to that re-
ported for IQ and SAT scores in Chapter 13. In other words, elite uni-
versities are race norming (though it is doubtful they think of it that
way), carrying with them into their student populations the ethnic dif-
ferences in cognitive distributions observed in the population at large.
We would prefer to have a sample of nonelite state universities rep-
resented in our data, but such numbers are closely .guarded.'" The only
data we have obtained come from the University of California at Davis,
for 1979. The black-white difference then was 27 1 SAT points, and the
Latino.white difference 21 1
T h e Asian mean at Davis was,
atypically, 54 points below the white mean, the largest such difference
we have found.
The data from the University of Virginia and the two University of
California campuses suggest that the gap hetween minorities and whites
among freshmen at state universities may be larger than at the elite pri-
vate schools. It is only a suggestion, given the limited data, but it also
Are Asians the Victims of Reverse Discrimination?
Complaints that Asian-American applicants were being subjected to re-
verse discrimination led eventually to a full-scale inquiry in the late 1980s
hy the federal Office for Civil Rights. Harvarcl, which was examined
closely, was ahle to show that the SAT penalty of their Asian admitted stu-
dents was accounted for by the smaller number of alumni children and ath-
letes in the pool, and eventually got a clean bill of health, hut the
controversy remains at many other institutions." Brown responded to a re-
port from its Asian-American Students Association hy admitting the ex-
istence of "an extremely serious situation" and called for "immediate
remedial measures."12 At Berkeley, Stanford, Princeton, and other elite
schools, special committees have investigated the issue, issuing reports that
tend to exonerate their colleges of actual reverse discrimination but ac-
knowledge shortcomings in keeping up with the revolution in Asian ap-
plicants."
The irnderlying source of tension remains: Asians are an ethnic minor-
ity, many of whom, or whose parents, came to the United States under cir-
cumstances of extreme deprivation. Many suffered from racial prejudice.
Whether or not they are treated differently from whites hy elite universi-
ties, Asians are indisputably treated differently from every other nonwhite
ethnic minority. University officials everywhere have heen reluctant to
confront this issue forthrightly.
454
Living Toge t k r
Affirmative Action in Higher Education
455
makes sense: Places like Harvard, Stanford, Yale, and MIT get first pick.
Because the raw numbers of high-scoring black and Latino students are
so small, the top schools dig deep into the thin layer of minority stu-
dents at the top of the SAT distribution. In 1993, for example, only 129
blacks and 234 Latinos nationwide had SATVerbal scores in the 700s-
and these represented all-time highs--compared to 7,114 whites. Even
highly rated state institutions such as the University of California's
Berkeley campus and the University of Virginia lose many of these most
talented minority students to the elite private schools while continuing
to get many of the top scorers in the larger white pool. Such are the
mathematics of competition for a scarce good, borne out by the limited
university data available, which show the three state universities with
three of the four largest black-white gaps in SATs.
The Law of Supply and Demand in Minority Recruiting
Affirmative action has produced intense competition for the top black and
Latino students. In the spring of 1992, Harvard reported that its "yield" of
black students abruptly declined from the year before. The Harvard report
suggested that the decline was due at least in part to the large financial in-
centives being offered to blacks by other colleges. One such black student,
it was reported, received a straight grant of $85,000, plus $10,000 in an-
nual travel budgets, from one of Harvard's competitors in minority re-
cruiting.14 An article in the New Ymk Times provided more instances of a
practice that increasingly includes the kind of enticements-full scholar-
ships even for families with ample financial resources, free trips to visit the
campus, recruiting visits, and promotional activities-that
used to be re-
served for star high school athletes. "As a result, a number of college offi-
cials privately accuse each other of 'stealing' black students," the Times
reporter noted. l 5
The differences do not seem to have changed a great deal between
the 1970s and the 1990s. The best longitudinal data from Berkeley il-
lustrate a perverse effect of a strong affirmative action policy: The more
aggressive the recruitment of minorities, the higher the average ability
of the nonminon'ty students. From 1978 to 1988, the combined SAT5 of
blacks at Berkeley rose by 101 points, a major improvement in the aca-
demic quality of black students at Berkeley. But the competition for the
allotment of white slots became ever more intense. The result was that
the SAT scores for Berkeley whites rose too, and the gap between black
and white students at Berkeley did not close but widened.'"jl Meanwhile,
the unprotected minority, Asians, also were competing for a restricted
allotment of slots. Their mean scores rose more than any other group's,
and by a large margin, going from far below the white mean to slightly
above it. In just eleven years, the Asian mean at Berkeley soared by 189
points.
The summary statement about affirmative action in undergraduate
institutions is that being either a black or a Latino is worth a great deal
in the admissions process at every undergraduate school for which we
have data. Even the smallest known black-white difference (95 points
at Harvard) represents close to a standard deviation for Harvard un-
dergraduates. The gap in most colleges is so large that the black and
white student bodies have little overlap. The situation is less extreme
for Latino students but still severe. Asian students appear to suffer a
penalty for being Asian, albeit a small one on the average. We have seen
no data that would dispute this picture. If such data exist, perhaps this
presentation will encourage their publication.
The Magnitude of the Edge in Graduate Schools
LAW SCHOOLS. Ttmothy Maguire's findings about the Georgetown Law
Center were consistent with more systematic evidence. The table be-
low shows the national Law School Aptitude Test (LSAT) results for
1992 for registered first-year law students. For blacks, overlap with the
white incoming law students was small; only 7 percent had scores above
the white mean. The overall Latino-white difference was 1 standard de-
viation. It was markedly larger for Puerto Ricans (-2.0 SDs) than for
Affirmative Action Weights:
The Law School Aptitude Test
Ethnic Group
Difference from
White Mean,
in SDs
AsianIPacific
-.32
Blacks
-1.49
Latinos
-1.01
Source: Barnes and Carr 1993.
Affirmative Action in Graduate Admissions
- Data from 1992 indicates significant disparities in standardized test scores among different ethnic groups entering law and medical schools.
- Black law students averaged 1.49 standard deviations below the white mean on the LSAT, with only 7 percent scoring above the white average.
- In elite law schools, the gap widened significantly, with the average black student scoring in the bottom 1 percent of the white distribution.
- Medical school admissions show a similar pattern, where the average black student ranks between the 8th and 10th percentile of white MCAT scores.
- Asian applicants appear to face a small penalty in law school admissions but outperform whites in the physical and biological sciences on the MCAT.
- The data suggests that affirmative action policies create substantial 'weights' or edges for underrepresented minority groups to ensure enrollment.
More than 1,100 registered white law students had scores of 170 or higher on a scale going from 120 to 180, compared to three blacks.
454
Living Toge t k r
Affirmative Action in Higher Education
455
makes sense: Places like Harvard, Stanford, Yale, and MIT get first pick.
Because the raw numbers of high-scoring black and Latino students are
so small, the top schools dig deep into the thin layer of minority stu-
dents at the top of the SAT distribution. In 1993, for example, only 129
blacks and 234 Latinos nationwide had SATVerbal scores in the 700s-
and these represented all-time highs--compared to 7,114 whites. Even
highly rated state institutions such as the University of California's
Berkeley campus and the University of Virginia lose many of these most
talented minority students to the elite private schools while continuing
to get many of the top scorers in the larger white pool. Such are the
mathematics of competition for a scarce good, borne out by the limited
university data available, which show the three state universities with
three of the four largest black-white gaps in SATs.
The Law of Supply and Demand in Minority Recruiting
Affirmative action has produced intense competition for the top black and
Latino students. In the spring of 1992, Harvard reported that its "yield" of
black students abruptly declined from the year before. The Harvard report
suggested that the decline was due at least in part to the large financial in-
centives being offered to blacks by other colleges. One such black student,
it was reported, received a straight grant of $85,000, plus $10,000 in an-
nual travel budgets, from one of Harvard's competitors in minority re-
cruiting.14 An article in the New Ymk Times provided more instances of a
practice that increasingly includes the kind of enticements-full scholar-
ships even for families with ample financial resources, free trips to visit the
campus, recruiting visits, and promotional activities-that
used to be re-
served for star high school athletes. "As a result, a number of college offi-
cials privately accuse each other of 'stealing' black students," the Times
reporter noted. l 5
The differences do not seem to have changed a great deal between
the 1970s and the 1990s. The best longitudinal data from Berkeley il-
lustrate a perverse effect of a strong affirmative action policy: The more
aggressive the recruitment of minorities, the higher the average ability
of the nonminon'ty students. From 1978 to 1988, the combined SAT5 of
blacks at Berkeley rose by 101 points, a major improvement in the aca-
demic quality of black students at Berkeley. But the competition for the
allotment of white slots became ever more intense. The result was that
the SAT scores for Berkeley whites rose too, and the gap between black
and white students at Berkeley did not close but widened.'"jl Meanwhile,
the unprotected minority, Asians, also were competing for a restricted
allotment of slots. Their mean scores rose more than any other group's,
and by a large margin, going from far below the white mean to slightly
above it. In just eleven years, the Asian mean at Berkeley soared by 189
points.
The summary statement about affirmative action in undergraduate
institutions is that being either a black or a Latino is worth a great deal
in the admissions process at every undergraduate school for which we
have data. Even the smallest known black-white difference (95 points
at Harvard) represents close to a standard deviation for Harvard un-
dergraduates. The gap in most colleges is so large that the black and
white student bodies have little overlap. The situation is less extreme
for Latino students but still severe. Asian students appear to suffer a
penalty for being Asian, albeit a small one on the average. We have seen
no data that would dispute this picture. If such data exist, perhaps this
presentation will encourage their publication.
The Magnitude of the Edge in Graduate Schools
LAW SCHOOLS. Ttmothy Maguire's findings about the Georgetown Law
Center were consistent with more systematic evidence. The table be-
low shows the national Law School Aptitude Test (LSAT) results for
1992 for registered first-year law students. For blacks, overlap with the
white incoming law students was small; only 7 percent had scores above
the white mean. The overall Latino-white difference was 1 standard de-
viation. It was markedly larger for Puerto Ricans (-2.0 SDs) than for
Affirmative Action Weights:
The Law School Aptitude Test
Ethnic Group
Difference from
White Mean,
in SDs
AsianIPacific
-.32
Blacks
-1.49
Latinos
-1.01
Source: Barnes and Carr 1993.
456
Living Together
Affirmative Action in Higher Education
457
Mexican-Americans (-.8) or "other" Latinos (-.7). The overall Asian
mean corresponds to the 38th ~ercentile on the white distribution, ev-
idence of modest affirmative action on behalf of Asian applicants in the
law schools.
The table above is for the national population of first-year law
students. To assess the effects of affirmative action, it would be prefer-
able to have data from individual law schools. At upper reaches of the
LSAT distribution, from which the elite law schools drew most of their
students, there was even less overlap between whites and blacks than in
the SAT pool. More than 1,100 registered white law students had scores
of 170 or higher on a scale going from 120 to 180, compared to three
blacks. At ten highly selective law schools for which individual data
were reported in a 1977 report by the Law School Admissions Council,
the smallest black-white difference in LSAT scores (expressed in terms
of the white distribution) at any of the ten schools was 2.4 standard de-
viations, the largest was 3.6 standard deviations, and the average differ-
ence for the ten schools was 2.9 standard deviations, meaning that the
average black was in the bottom 1 percent of the white distributi~n."'~
MEDICAL SCHOOLS.
Medical students repeat the familiar pattern, as
shown for the national population of matriculated first-year students in
1992 in the table below. In the national pool, the black-white gap is
Affirmative Action Weights:
The Medical College Admissions Test
Difference from the White Mean, in SDs
Ethnic
Biological
Physical
Verbal
Group
Sciences
Sciences Reasoning
Blacks
-1.36
-1.26
-1.40
"Other under-represented
minorities""
-.75
-.84
-.84
"Otherwh
+.04
+.I5
-.45
Source: Division of Educational Research and Assessment 1993, pp. 59-63.
"'Other under-represented minorities" consists of American IndianIAlaskan
natives, Mexican~American/Chicanos, and mainland Puerto Ricans.
Asianpacific, commonwealth Puerto Ricans, and Latinos not othenvfse
classified.
about the same as in the law schools, with the average entering black
medical student at the 8th to 10th percentile of the white distribution,
depending on which subtest of the Medical College Admissions Test
(MCAT) we consider. The gap between whites and "other underrepre-
sented minorities" is a bit smaller than the Latino-white gap in law
school, with the average student in this group standing at the 20th to
23d percentile of the white distribution. The "other" category-mostly
Asian-had
higher scores than whites on the physical sciences and
(fractionally) on biological sciences, standing, respectively, at the 56th
and 52d percentiles of the white distribution, while scoring lower in ver-
ha1 reasoning (32d percentile).
As in the case of law schools, the black medical student pool is even
more severely depleted at the top end of the range than it is in under-
graduate schools, with important implications for the gap in the elite
schools. In none of the three subtests did more than 19 blacks score in
the 12 to 15 range (on a scale that goes from 1 to 15), compared to 1,146,
1,469, and 853 whites (for the biological sciences, physical sciences, and
verhal reasoning tests, respectively).['R1
In practical terms, several of the
elite schools can fill their entire class with white students in the top
range, but only the one or two most elite schools can hope to have a sig-
nificant number of black students without producing extremely large
black-white differences, comparable to those reported for elite law
schools.
Other studies have published data on medical school admissions, ex-
pressed in terms of the odds of being accepted to medical school for dit-
ferent minorities. All tell similar stories to ours."9'
GRADUATE
SCHOOLS
IN THE ARTS AND SCIENCES.
Applicants to gradu-
ate schools other than law and medicine typically take the Graduate
Record Examination (GRE), comprising verbal, quantitative, and ana-
lytical subtests. The reports of GRE scores do not distinguish between
persons who take the test and persons who actually register in a gradu-
ate school, so they are less useful than the LSAT or MCAT in trying to
understand the scope and magnitude of affirmative action in those
schools. Nonetheless, the results, in the table below, look familiar. The
magnitudes of the ethnic differences on the individual subtests of the
GRE (in 1987-1988, the most recent year for which we were given data)
were somewhat smaller than for the ~rofessional schools, putting blacks
Graduate Admissions and Affirmative Action
- Standardized test scores for medical and graduate schools reveal significant disparities between ethnic groups, particularly in the highest scoring ranges.
- Elite professional schools face a dilemma where they can fill classes with high-scoring white students but must accept large score gaps to achieve racial diversity.
- GRE data shows that black applicants score between the 10th and 12th percentile of the white distribution across verbal, quantitative, and analytical subtests.
- Asian applicants consistently outperform white applicants on quantitative subtests while scoring lower on verbal sections, resulting in a slightly higher overall mean.
- The text argues that ethnic gaps in objective test scores observed at the undergraduate level are matched or exceeded in graduate and professional education.
- College admissions are framed not as a pure meritocracy but as a 'juggling act' of institutional benefits, social utility, and nonacademic goals.
The admissions process is a juggling act, and affirmative action fits squarely in a long tradition.
456
Living Together
Affirmative Action in Higher Education
457
Mexican-Americans (-.8) or "other" Latinos (-.7). The overall Asian
mean corresponds to the 38th ~ercentile on the white distribution, ev-
idence of modest affirmative action on behalf of Asian applicants in the
law schools.
The table above is for the national population of first-year law
students. To assess the effects of affirmative action, it would be prefer-
able to have data from individual law schools. At upper reaches of the
LSAT distribution, from which the elite law schools drew most of their
students, there was even less overlap between whites and blacks than in
the SAT pool. More than 1,100 registered white law students had scores
of 170 or higher on a scale going from 120 to 180, compared to three
blacks. At ten highly selective law schools for which individual data
were reported in a 1977 report by the Law School Admissions Council,
the smallest black-white difference in LSAT scores (expressed in terms
of the white distribution) at any of the ten schools was 2.4 standard de-
viations, the largest was 3.6 standard deviations, and the average differ-
ence for the ten schools was 2.9 standard deviations, meaning that the
average black was in the bottom 1 percent of the white distributi~n."'~
MEDICAL SCHOOLS.
Medical students repeat the familiar pattern, as
shown for the national population of matriculated first-year students in
1992 in the table below. In the national pool, the black-white gap is
Affirmative Action Weights:
The Medical College Admissions Test
Difference from the White Mean, in SDs
Ethnic
Biological
Physical
Verbal
Group
Sciences
Sciences Reasoning
Blacks
-1.36
-1.26
-1.40
"Other under-represented
minorities""
-.75
-.84
-.84
"Otherwh
+.04
+.I5
-.45
Source: Division of Educational Research and Assessment 1993, pp. 59-63.
"'Other under-represented minorities" consists of American IndianIAlaskan
natives, Mexican~American/Chicanos, and mainland Puerto Ricans.
Asianpacific, commonwealth Puerto Ricans, and Latinos not othenvfse
classified.
about the same as in the law schools, with the average entering black
medical student at the 8th to 10th percentile of the white distribution,
depending on which subtest of the Medical College Admissions Test
(MCAT) we consider. The gap between whites and "other underrepre-
sented minorities" is a bit smaller than the Latino-white gap in law
school, with the average student in this group standing at the 20th to
23d percentile of the white distribution. The "other" category-mostly
Asian-had
higher scores than whites on the physical sciences and
(fractionally) on biological sciences, standing, respectively, at the 56th
and 52d percentiles of the white distribution, while scoring lower in ver-
ha1 reasoning (32d percentile).
As in the case of law schools, the black medical student pool is even
more severely depleted at the top end of the range than it is in under-
graduate schools, with important implications for the gap in the elite
schools. In none of the three subtests did more than 19 blacks score in
the 12 to 15 range (on a scale that goes from 1 to 15), compared to 1,146,
1,469, and 853 whites (for the biological sciences, physical sciences, and
verhal reasoning tests, respectively).['R1
In practical terms, several of the
elite schools can fill their entire class with white students in the top
range, but only the one or two most elite schools can hope to have a sig-
nificant number of black students without producing extremely large
black-white differences, comparable to those reported for elite law
schools.
Other studies have published data on medical school admissions, ex-
pressed in terms of the odds of being accepted to medical school for dit-
ferent minorities. All tell similar stories to ours."9'
GRADUATE
SCHOOLS
IN THE ARTS AND SCIENCES.
Applicants to gradu-
ate schools other than law and medicine typically take the Graduate
Record Examination (GRE), comprising verbal, quantitative, and ana-
lytical subtests. The reports of GRE scores do not distinguish between
persons who take the test and persons who actually register in a gradu-
ate school, so they are less useful than the LSAT or MCAT in trying to
understand the scope and magnitude of affirmative action in those
schools. Nonetheless, the results, in the table below, look familiar. The
magnitudes of the ethnic differences on the individual subtests of the
GRE (in 1987-1988, the most recent year for which we were given data)
were somewhat smaller than for the ~rofessional schools, putting blacks
45 8
Living Together
Affmtilve Action in Higher Education
459
at the 10th to 12th percentile of the white distribution, depending on
the subtest. Asians were (as usual) higher than whites on the quantita-
tive and lower on the verbal. Adding up all three subtest means, Asians
were a few points higher than whites.
Applicants to Graduate Schools
Difference from the White Mean, in SDs
Ethnic Group
Verbal
Quantitative
Analytical
AsianIPacific
-.37
+.52
-. 15
Blacks
-1.20
-1.19
-1.29
Latino
-.74
-.46
-.54
Source: Wah and Robinson, 1990, Table 2.2.
The summary statement is that the ethnic gaps in objective test scores
observed in undergraduate institutions are matched, and perhaps ex-
ceeded, in graduate and professional schools. If data become available
from individual schools, this question can be answered definitively.
AFFIRMATIVE ACTION AS PART OF THE ADMISSIONS
PROCESS
The data we have just summarized should restrain casual assertions that
the differences among the blacks, Latinos, Asians, and whites who go
to college are not worth worrying about. The differences we have de-
scribed are large by any definition. But do these data give us any lever-
age on the question of whether affirmative action as it is currently
practiced is good or bad? For an answer, we begin by inquiring into the
logic of affirmative action and then examine whether the patterns of
racial and socioeconomic differences observed in the NLSY make sense
in terms of that logic.
The Logic of College Admissions
On the campus, affirmative action is not at odds with the normal ad-
missions process. College admission is not, has never been, nor is there
reason to think it should be, a competition based purely on academic
merit. The nonacademic ends can be legitimate and important. No ad-
missions policy can serve all good ends equally, because the ends are of-
ten inconsistent with one another. The admissions process is a juggling
act, and affirmative action fits squarely in a long tradition. Our under-
standing of the legitimate role of affirmative action, which owes much
to Robert Klitgaard's discussion of the same topic, will be categorized
under the headings of "institutional benefit," "social utility," and "just
deserts."'"
INSTITUTIONAL BENEFIT. One of the goals of any admissions process is
to serve the institution's own interests. Why do many colleges give some
preference to students from faraway states? To children of al~mni?'~"
To
all-state linebackers or concert pianists? Some of the answers involve
the good of the institution as a whole. A student from Montana can add
diversity to a college in Connecticut; a good football team can
strengthen a college's sense of community and perhaps encourage
alumni generosity. Black and Latino students admitted under affirma-
tive action can enrich a campus by adding to its diversity.
The institution also has interests beyond daily campus life. Admit-
ting the children of its faculty and of its most generous alumni may add
little that is distinctive to the student body, for example, but their par-
ents make a hig difference to the health and quality of the institution,
and keeping them happy is important. Beyond the college gates is soci-
ety at large. Universities cannot disregard what the broader community
thinks of them, and so they must be sensitive to the currents of their
time. The political pressure (let alone the legal requirement) for some
level of affirmative action in the universities has been irresistible.
These institutional interests are valid and significant but unsatisfac-
tory as the entire rationale for affirmative action, for there are too many
ways in which affirmative action has self-evident drawbacks. If it is ad-
missible to augment the presence of some racial or ethnic minorities
solely because they serve the interests of the university, is it not also ap-
propriate to limit the presence of minorities for the same reason? It is a
Rationales for Selective Admissions
- Colleges prioritize institutional interests by admitting students who provide geographic diversity, athletic talent, or legacy connections to ensure financial health and community spirit.
- Universities must navigate external societal pressures and legal requirements, making them sensitive to political currents regarding affirmative action.
- A purely institutional rationale for affirmative action is problematic because prioritizing one group's presence inherently limits the space available for others.
- The 'social utility' argument suggests admitting individuals based on their potential future impact on society, such as a foreign prince who will one day lead a nation.
- Professional schools face ethical dilemmas regarding resource efficiency, weighing the long-term career persistence of candidates against the goal of increasing representation.
If it is admissible to augment the presence of some racial or ethnic minorities solely because they serve the interests of the university, is it not also appropriate to limit the presence of minorities for the same reason?
45 8
Living Together
Affmtilve Action in Higher Education
459
at the 10th to 12th percentile of the white distribution, depending on
the subtest. Asians were (as usual) higher than whites on the quantita-
tive and lower on the verbal. Adding up all three subtest means, Asians
were a few points higher than whites.
Applicants to Graduate Schools
Difference from the White Mean, in SDs
Ethnic Group
Verbal
Quantitative
Analytical
AsianIPacific
-.37
+.52
-. 15
Blacks
-1.20
-1.19
-1.29
Latino
-.74
-.46
-.54
Source: Wah and Robinson, 1990, Table 2.2.
The summary statement is that the ethnic gaps in objective test scores
observed in undergraduate institutions are matched, and perhaps ex-
ceeded, in graduate and professional schools. If data become available
from individual schools, this question can be answered definitively.
AFFIRMATIVE ACTION AS PART OF THE ADMISSIONS
PROCESS
The data we have just summarized should restrain casual assertions that
the differences among the blacks, Latinos, Asians, and whites who go
to college are not worth worrying about. The differences we have de-
scribed are large by any definition. But do these data give us any lever-
age on the question of whether affirmative action as it is currently
practiced is good or bad? For an answer, we begin by inquiring into the
logic of affirmative action and then examine whether the patterns of
racial and socioeconomic differences observed in the NLSY make sense
in terms of that logic.
The Logic of College Admissions
On the campus, affirmative action is not at odds with the normal ad-
missions process. College admission is not, has never been, nor is there
reason to think it should be, a competition based purely on academic
merit. The nonacademic ends can be legitimate and important. No ad-
missions policy can serve all good ends equally, because the ends are of-
ten inconsistent with one another. The admissions process is a juggling
act, and affirmative action fits squarely in a long tradition. Our under-
standing of the legitimate role of affirmative action, which owes much
to Robert Klitgaard's discussion of the same topic, will be categorized
under the headings of "institutional benefit," "social utility," and "just
deserts."'"
INSTITUTIONAL BENEFIT. One of the goals of any admissions process is
to serve the institution's own interests. Why do many colleges give some
preference to students from faraway states? To children of al~mni?'~"
To
all-state linebackers or concert pianists? Some of the answers involve
the good of the institution as a whole. A student from Montana can add
diversity to a college in Connecticut; a good football team can
strengthen a college's sense of community and perhaps encourage
alumni generosity. Black and Latino students admitted under affirma-
tive action can enrich a campus by adding to its diversity.
The institution also has interests beyond daily campus life. Admit-
ting the children of its faculty and of its most generous alumni may add
little that is distinctive to the student body, for example, but their par-
ents make a hig difference to the health and quality of the institution,
and keeping them happy is important. Beyond the college gates is soci-
ety at large. Universities cannot disregard what the broader community
thinks of them, and so they must be sensitive to the currents of their
time. The political pressure (let alone the legal requirement) for some
level of affirmative action in the universities has been irresistible.
These institutional interests are valid and significant but unsatisfac-
tory as the entire rationale for affirmative action, for there are too many
ways in which affirmative action has self-evident drawbacks. If it is ad-
missible to augment the presence of some racial or ethnic minorities
solely because they serve the interests of the university, is it not also ap-
propriate to limit the presence of minorities for the same reason? It is a
460
Living Together
Affirmative Action in Higher Education
461
relevant question, for, while limits for Jews may be largely behind us,
limits for Asians may be upon us. Furthermore, one cannot avoid the
problem by arguing that it is appropriate to have floors for certain groups
but inappropriate to have ceilings for others. Making more room for one
group must reduce the room for others. Instinctively, one wishes for
morally stronger justifications for affirmative action than institutional
interests. Two are available.
SOCIAL
UTILITY. Consider the case of the crown prince of a large king*
dom who also happens to be a young man of pedestrian intelligence and
indifferent character. He applies to a competitive American university-
Princeton, we shall say. Should Princeton admit him in preference to the
many brighter and more virtuous students whose applications flood
the admissions office? The social utility criterion may say yes, for this
young man is eventually going to influence the lives of the millions of
people in his own country. He may be drawn into issues that could affect
international peace and prosperity. Princeton makes a contribution to
human happiness if it can help the crown prince develop into a thought-
ful and humane adult.
The same kind of calculation bedevils professional schools in choos-
ing among men and women. For example, if it is empirically true that
women are more likely than men to leave a profession, there is an au-
thentic question of resources to be considered when selecting who shall
be trained in that profession. Given that the good called a medical ed-
ucation is severely limited, how important is the ethical nudge in the
direction of using scarce resources efficiently? Conversely, how impor-
tant is it to get women into these professions so that, in the future, it
will be easier for more of them to pursue such careers?
Suppose now that it is again Princeton choosing between two can-
didates, one black and one white. Both are from affluent professional
families, so socioeconomic disadvantage is not an issue. The white has
higher test scores and (just to make the case still plainer) more glowing
references than the black candidate. Both plan to become attorneys. In
some sense, the white candidate "deserves" admission more, But who is
going to provide more social "value-added"? Adding one more white at-
torney to the ranks of prominent attorneys, or adding one more black
one? Princeton could reasonably choose the black candidate on grounds
that only by expanding the size of the next generation of minority
lawyers, physicians, businessmen, and professors can society attain racial
equality at the higher socioeconomic and professional levels. Only
when equality is reached at those higher levels will minority ~ouths
rou-
tinely aspire to such careers, And, the argument continues, only when
the aspirations for success and their fulfillment are thus equalized will
we reach the kind of real racial equality that will eventually show up in
test scores as well as everything else.
For now, let us ignore whether affirmative action will in fact have
these good effects and concentrate instead on the logic of the argument.
The same logic can justify not only choosing a member of a minority over
a white, it can justify choosing a member of one minority over another.
For example, a case may be made for systematically favoring blacks over
Asians on the social utility criterion-based
not on calculations that
African slaves faced greater oppression in the past than the Chinese
brought to build the railroads but on the proposition that the opportu-
nities for a degree may be more valuably distributed to African Ameri-
cans instead of Asian Americans, given the contemporary state of affairs
in American society. Indeed, early in this century, when colleges were
discriminating against Jews, the reasons given, when they were given at
all, were a mixture of institutional self-interest and social
Once again, however, the rationale for affirmative action is not fully
satisfactory. Looking back to the time when the numbers of Jews or
women on a campus were strictly limited, most people feel uncomfort.
able with the rationales, however dispassionately accurate they might
have seemed at the time. They are uncomfortable partly because of the
injustice, which brings us to the final criterion that should be part of
the admissions process.
JUST DESERTS. Beyond institutional benefit and social utility, college
admissions may recognize what might be called "just deserts." As the di-
rector of admissions to Columbia College expressed it, "One has to take
into account how well one has done with the environment [an appli.
cant has] been handed."z3 The applicant who overcame poverty, cul-
tural disadvantages, an unsettled home life, a prolonged illness, or a
chronic disability to do as well as he did in high school will get a tip
from most admissions committees, even if he is not doing as well acad-
emically as the applicants usually accepted. This tip for the disadvan-
taged does not seem unfair.
This is the intuitive rationale of affirmative action for blacks, who
were demonstrably the victims of legal oppression, enforced by the state,
from the founding of the colonies through the middle of this century,
and of pervasive social discrimination that still persists to some degree.
Rationales for Affirmative Action
- The social utility argument suggests that admitting minority candidates provides more long-term value by creating a diverse professional class.
- Achieving racial equality at high socioeconomic levels is seen as a prerequisite for equalizing the aspirations and test scores of future generations.
- The logic of social utility can be used to justify favoring one minority group over another based on contemporary societal needs rather than historical oppression.
- The 'just deserts' criterion rewards applicants who have demonstrated excellence relative to the specific environmental hardships they have overcome.
- Affirmative action is often intuitively framed as a corrective measure for the historical and legal oppression specifically faced by Black Americans.
- Some proponents argue that standardized testing and university reasoning styles are themselves inherently biased or racist.
The applicant who overcame poverty, cultural disadvantages, an unsettled home life, a prolonged illness, or a chronic disability to do as well as he did in high school will get a tip from most admissions committees, even if he is not doing as well academically as the applicants usually accepted.
460
Living Together
Affirmative Action in Higher Education
461
relevant question, for, while limits for Jews may be largely behind us,
limits for Asians may be upon us. Furthermore, one cannot avoid the
problem by arguing that it is appropriate to have floors for certain groups
but inappropriate to have ceilings for others. Making more room for one
group must reduce the room for others. Instinctively, one wishes for
morally stronger justifications for affirmative action than institutional
interests. Two are available.
SOCIAL
UTILITY. Consider the case of the crown prince of a large king*
dom who also happens to be a young man of pedestrian intelligence and
indifferent character. He applies to a competitive American university-
Princeton, we shall say. Should Princeton admit him in preference to the
many brighter and more virtuous students whose applications flood
the admissions office? The social utility criterion may say yes, for this
young man is eventually going to influence the lives of the millions of
people in his own country. He may be drawn into issues that could affect
international peace and prosperity. Princeton makes a contribution to
human happiness if it can help the crown prince develop into a thought-
ful and humane adult.
The same kind of calculation bedevils professional schools in choos-
ing among men and women. For example, if it is empirically true that
women are more likely than men to leave a profession, there is an au-
thentic question of resources to be considered when selecting who shall
be trained in that profession. Given that the good called a medical ed-
ucation is severely limited, how important is the ethical nudge in the
direction of using scarce resources efficiently? Conversely, how impor-
tant is it to get women into these professions so that, in the future, it
will be easier for more of them to pursue such careers?
Suppose now that it is again Princeton choosing between two can-
didates, one black and one white. Both are from affluent professional
families, so socioeconomic disadvantage is not an issue. The white has
higher test scores and (just to make the case still plainer) more glowing
references than the black candidate. Both plan to become attorneys. In
some sense, the white candidate "deserves" admission more, But who is
going to provide more social "value-added"? Adding one more white at-
torney to the ranks of prominent attorneys, or adding one more black
one? Princeton could reasonably choose the black candidate on grounds
that only by expanding the size of the next generation of minority
lawyers, physicians, businessmen, and professors can society attain racial
equality at the higher socioeconomic and professional levels. Only
when equality is reached at those higher levels will minority ~ouths
rou-
tinely aspire to such careers, And, the argument continues, only when
the aspirations for success and their fulfillment are thus equalized will
we reach the kind of real racial equality that will eventually show up in
test scores as well as everything else.
For now, let us ignore whether affirmative action will in fact have
these good effects and concentrate instead on the logic of the argument.
The same logic can justify not only choosing a member of a minority over
a white, it can justify choosing a member of one minority over another.
For example, a case may be made for systematically favoring blacks over
Asians on the social utility criterion-based
not on calculations that
African slaves faced greater oppression in the past than the Chinese
brought to build the railroads but on the proposition that the opportu-
nities for a degree may be more valuably distributed to African Ameri-
cans instead of Asian Americans, given the contemporary state of affairs
in American society. Indeed, early in this century, when colleges were
discriminating against Jews, the reasons given, when they were given at
all, were a mixture of institutional self-interest and social
Once again, however, the rationale for affirmative action is not fully
satisfactory. Looking back to the time when the numbers of Jews or
women on a campus were strictly limited, most people feel uncomfort.
able with the rationales, however dispassionately accurate they might
have seemed at the time. They are uncomfortable partly because of the
injustice, which brings us to the final criterion that should be part of
the admissions process.
JUST DESERTS. Beyond institutional benefit and social utility, college
admissions may recognize what might be called "just deserts." As the di-
rector of admissions to Columbia College expressed it, "One has to take
into account how well one has done with the environment [an appli.
cant has] been handed."z3 The applicant who overcame poverty, cul-
tural disadvantages, an unsettled home life, a prolonged illness, or a
chronic disability to do as well as he did in high school will get a tip
from most admissions committees, even if he is not doing as well acad-
emically as the applicants usually accepted. This tip for the disadvan-
taged does not seem unfair.
This is the intuitive rationale of affirmative action for blacks, who
were demonstrably the victims of legal oppression, enforced by the state,
from the founding of the colonies through the middle of this century,
and of pervasive social discrimination that still persists to some degree.
462
LivingTogether
Affirmative Action in Higher Education
463
To give blacks an edge because they are black accords with this sense of
justice. At an elaborated level, there is a widespread impression that the
underrepresentation of blacks and Latinos (and perhaps other groups,
such as American Indians) in elite schools is an effect of racial or eth-
nic injustice, properly corrected by affirmative action in university ad-
missions. If it were not for the racism in our society, the groups would
be proportionally represented, some believe. A still more elaborated
version of the argument is that the very approach to learning, reason-
ing, and argumentation in universities is itself racist, so that the pre-
dictors of university performance, such as SAT or IQ scores, are
therefore racist too. Affirmative action redresses the built-in racism in
the admissions process and the c~rriculum.~~
Two Common But Invalid Arguments Regarding
Affirmative Action
We have reviewed the rationales for affirmative action without even men-
tioning the two most commonly made points: first, that the real difference
in academic ability between minority and white candidates is much smaller
than the difference as measured by test scores, and, second, that gradations
in ability do not count for much after a certain threshold of ability has been
met.
This first point is based on allegations of cultural bias in the tests, cov-
ered in Chapter 13 and Appendix 5. As readers will by now be aware, much
research argues strongly against it. The second point, often expressed by
university officials with the words "everyone we admit can do the work,"
is true in the limited sense that students with comparatively low levels of
ability can get passing grades. It is not correct in any broader sense. Higher
scores predict better academic performance throughout the range of scores.
There is no reason to think that a threshold exists above which differences
in tested ability have little effect on the quality of the student body, stu-
dent performance, and the nature of student interaction^.'^
So there are three coherent rationales for concluding that it is just,
as well as institutionally and socially useful, to admit minority students
from specific minority groups even if they are somewhat less qualified
than the other candidates who would be admitted. The rationales are
not even controversial. Few of the opponents of affirmative action are
prepared to argue that universities should ignore any of these criteria al-
together in making admissions decisions. With that issue behind us, the
question becomes whether affirmative action as it is being practiced is
doing what its advocates want it to do. Does it serve worthwhile pure
poses for the institutions themselves, for students, for society at large,
or for a commonly shared sense of justice?
A Scheme for Comparing Rationales with Practice
We will set the problem first with hypothetical applicants to college, di-
vided into four categories, then we will insert the actual cognitive abil-
ity scores of the college students in those categories. The four categories
are represented in the 2 x 2 table below, where "low" and "high" refer
to the full range of cultural and economic advantages and disadvantages.
"Scarsdale" denotes any applicant from an upscale family. "South
Bronx" denotes a disadvantaged minority youth, and "Appalachia" de-
notes a disadvantaged white youth. Each cell in the table corresponds
to a pair of applicants-a
white and a minority-from
either high or
low socioeconomic and cultural circumstances. Starting at the lower
right and going clockwise around the table, the categories are: (1) a mi-
nority applicant from a disadvantaged background and a white from a
privileged background; (2) a minority and a white applicant, both from
disadvantaged backgrounds; (3) a minority applicant from a pivileged
background and a white from a disadvantaged background, and (4) a
minority and a white applicant, both from privileged backgrounds.
Imagine you are on the admissions committee and choosing between
A Framework for Thinking about the Magnitude of Pref.
erence That Should Be Given to a Minority Candidate
WHITE
Low
High
High
MINORITY
Low
(3)
Scarsdale
Appalachia
( 2 )
South Bronx
Appalachia
(4)
Scarsdale
Scarsdale
(1)
South Bronx
Scarsdale
Rationales for Affirmative Action
- The author identifies three coherent rationales for affirmative action: redressing built-in racism, institutional utility, and social usefulness.
- Two common arguments—cultural bias in testing and the 'threshold' theory of ability—are dismissed as invalid based on research.
- Data suggests that higher test scores predict better academic performance across the entire range, contradicting the idea that ability differences matter less after a certain point.
- The text introduces a 2x2 matrix comparing minority and white applicants from varying socioeconomic backgrounds, such as 'Scarsdale' and 'South Bronx.'
- The central question posed is whether current affirmative action practices actually achieve their intended goals for society and justice.
- The analysis focuses on IQ as a primary measure of academic ability while controlling for socioeconomic status in hypothetical admissions scenarios.
The second point, often expressed by university officials with the words 'everyone we admit can do the work,' is true in the limited sense that students with comparatively low levels of ability can get passing grades.
462
LivingTogether
Affirmative Action in Higher Education
463
To give blacks an edge because they are black accords with this sense of
justice. At an elaborated level, there is a widespread impression that the
underrepresentation of blacks and Latinos (and perhaps other groups,
such as American Indians) in elite schools is an effect of racial or eth-
nic injustice, properly corrected by affirmative action in university ad-
missions. If it were not for the racism in our society, the groups would
be proportionally represented, some believe. A still more elaborated
version of the argument is that the very approach to learning, reason-
ing, and argumentation in universities is itself racist, so that the pre-
dictors of university performance, such as SAT or IQ scores, are
therefore racist too. Affirmative action redresses the built-in racism in
the admissions process and the c~rriculum.~~
Two Common But Invalid Arguments Regarding
Affirmative Action
We have reviewed the rationales for affirmative action without even men-
tioning the two most commonly made points: first, that the real difference
in academic ability between minority and white candidates is much smaller
than the difference as measured by test scores, and, second, that gradations
in ability do not count for much after a certain threshold of ability has been
met.
This first point is based on allegations of cultural bias in the tests, cov-
ered in Chapter 13 and Appendix 5. As readers will by now be aware, much
research argues strongly against it. The second point, often expressed by
university officials with the words "everyone we admit can do the work,"
is true in the limited sense that students with comparatively low levels of
ability can get passing grades. It is not correct in any broader sense. Higher
scores predict better academic performance throughout the range of scores.
There is no reason to think that a threshold exists above which differences
in tested ability have little effect on the quality of the student body, stu-
dent performance, and the nature of student interaction^.'^
So there are three coherent rationales for concluding that it is just,
as well as institutionally and socially useful, to admit minority students
from specific minority groups even if they are somewhat less qualified
than the other candidates who would be admitted. The rationales are
not even controversial. Few of the opponents of affirmative action are
prepared to argue that universities should ignore any of these criteria al-
together in making admissions decisions. With that issue behind us, the
question becomes whether affirmative action as it is being practiced is
doing what its advocates want it to do. Does it serve worthwhile pure
poses for the institutions themselves, for students, for society at large,
or for a commonly shared sense of justice?
A Scheme for Comparing Rationales with Practice
We will set the problem first with hypothetical applicants to college, di-
vided into four categories, then we will insert the actual cognitive abil-
ity scores of the college students in those categories. The four categories
are represented in the 2 x 2 table below, where "low" and "high" refer
to the full range of cultural and economic advantages and disadvantages.
"Scarsdale" denotes any applicant from an upscale family. "South
Bronx" denotes a disadvantaged minority youth, and "Appalachia" de-
notes a disadvantaged white youth. Each cell in the table corresponds
to a pair of applicants-a
white and a minority-from
either high or
low socioeconomic and cultural circumstances. Starting at the lower
right and going clockwise around the table, the categories are: (1) a mi-
nority applicant from a disadvantaged background and a white from a
privileged background; (2) a minority and a white applicant, both from
disadvantaged backgrounds; (3) a minority applicant from a pivileged
background and a white from a disadvantaged background, and (4) a
minority and a white applicant, both from privileged backgrounds.
Imagine you are on the admissions committee and choosing between
A Framework for Thinking about the Magnitude of Pref.
erence That Should Be Given to a Minority Candidate
WHITE
Low
High
High
MINORITY
Low
(3)
Scarsdale
Appalachia
( 2 )
South Bronx
Appalachia
(4)
Scarsdale
Scarsdale
(1)
South Bronx
Scarsdale
464
Living Together
Affirmative Action in Higher Education
465
two candidates. Assume that all the nonacademic qualifications besides
race are fully specified by high and low status for this pair of candidates
and that the IQ is the only measure of academic ability being consid-
ered. (In other words, let us disregard grades, extracurricular activities,
athletics, alumni parents, and other factors.) You are trying to decide
whether to admit the minority applicant or the white applicant. How
big a difference in 1Q are you willing to accept in each cell and still pick
the minority candidate over the white candidate? Let us consider each
cell in turn, starting with the situation in which the minority might he
expected to get the largest premium to the one in which the premium
arguably should go to the white.
CELL
1: THE SOUTH
BRONX MINORITY
VERSUS THE SCARSDALE
WHITE.
The largest weight obviously belongs in the cell in which the minority
student is disadvantaged and the white student is advantaged. Consid-
erations of just deserts argue that it is not fair to equate the test scores
of the youngster who has gotten the finest education money and status
can buy with the test scores of the youngster who has struggled through
poor schools and a terrible neighborhood. Considerations of social util-
ity argue that it is desirable to have more minority students getting good
college educations, so that society may alter the effects of past discrim-
ination and provide a basis for an eventually color-blind society in the
future. We assign ++ to this cell to indicate a large preference for the
minority candidate. A relatively large deficit in the minority applicant's
test score may properly be overlooked.
CELL
4: THE SCARSDALE
MINORITY
VERSUS THE SCARSDALE
WHITE. If a
college is choosing between two students in the high-high cell, both
from Scarsdale with college-educated parents and family incomes in six
figures, the social utility criteria say that there is a rationale for picking
the minority youth even if his test scores are somewhat lower. Rut do-
ing so would violate just deserts when the white student has higher test
scores and is in every other way equal to the minority student. Which
criterion should win out? There is no way to say for sure. Our own view
is that, as personally hurtful as this injustice may be to the individual
white person involved, it is relatively minor in the grand scheme of
things. The privileged white youth, with strong credentials and parents
who can pay for college, will get into a good college someplace. We
therefore assign a + to this cell to signify some ethnic premium to the
minority candidate but less than in the first instance.
CELL 2: THE SOUTH BRONX MINORITY
VERSUS THE APPALACHIAN
WHITE. Now imagine a minority student from the South Bronx and a
white student from an impoverished Appalachian community. The fam.
ilies of both students are at the wrong end of the scale of advantage.
Which one should get the nod in a close call? The white has just as
much or nearly as much "social utility" going for him as the black does.
American society will benefit from educating youngsters from disad-
vantaged white backgrounds, too. Both have a claim based on just
deserts. America likes to think that people can work their way up from
the bottom, and Appalachia is the bottom no less than the South Bronx.
Perhaps there is some residual premium associated with being black,
based on the supposition that just being black puts one at a greater dis-
advantage than a white in the "all else equal" case-a
more persuasive
point when applied to blacks from the South Bronx than when applied
to blacks from Scarsdale. We assign =O to this cell, indicating that the
appropriate ethnic pemiurn for the minority student is not much greater
than zero (other things being equal) and is certainly smaller than in the
Scarsdale-Scarsdale case.
CELL 3: THE SCARSDALE
MINORITY VERSUS THE APPALACHIAN
WHITE.
Now we are comparing the privileged minority student with the disad-
vantaged white student. Where one comes out on the scale of social
utility depends on how one values the competing goals to be served. It
seems hard to justify a social utility value that nets out in favor of the
minority youth, however. (Yes, there is social utility in adding a rninor-
ity to the ranks of successful attorneys, even if he comes from an afflu-
ent background, but there is also social utility in vindicating the
American dream for poor whites and in adding a representative of dis-
advantaged white America to the ranks of successful attorneys.) Some-
thing close to zero seems to be the appropriate expected value on the
social utility measure, and the white youth should get a plus on the just
deserts argument. If the choice is between a poor white youngster from
an awful environment and an affluent minority youngster who has gone
to fine schools, and if the poor white has somewhat lower test scores
than the affluent minority, it is appropriate to give the poor white at
least a modest premium. We thus enter - into this cell, to reflect the
fact the white youth gets the nod in a close call.
The filled-in table is shown below. We may argue about how large an
ethnic premium, expressed in IQ, should be tolerated in each cell, but
The Ethics of Affirmative Action
- The text evaluates college admissions decisions by comparing minority and white applicants across different socioeconomic backgrounds.
- A 'large preference' is assigned to disadvantaged minority students over advantaged white students based on both social utility and fairness.
- Privileged minority students are still given a slight preference over privileged white students, though the authors acknowledge this may violate individual 'just deserts.'
- When comparing disadvantaged students of both races, the authors argue the ethnic premium should be near zero as both have claims to upward mobility.
- The analysis highlights the tension between correcting historical discrimination and maintaining a meritocratic system based on individual circumstances.
Considerations of just deserts argue that it is not fair to equate the test scores of the youngster who has gotten the finest education money and status can buy with the test scores of the youngster who has struggled through poor schools and a terrible neighborhood.
464
Living Together
Affirmative Action in Higher Education
465
two candidates. Assume that all the nonacademic qualifications besides
race are fully specified by high and low status for this pair of candidates
and that the IQ is the only measure of academic ability being consid-
ered. (In other words, let us disregard grades, extracurricular activities,
athletics, alumni parents, and other factors.) You are trying to decide
whether to admit the minority applicant or the white applicant. How
big a difference in 1Q are you willing to accept in each cell and still pick
the minority candidate over the white candidate? Let us consider each
cell in turn, starting with the situation in which the minority might he
expected to get the largest premium to the one in which the premium
arguably should go to the white.
CELL
1: THE SOUTH
BRONX MINORITY
VERSUS THE SCARSDALE
WHITE.
The largest weight obviously belongs in the cell in which the minority
student is disadvantaged and the white student is advantaged. Consid-
erations of just deserts argue that it is not fair to equate the test scores
of the youngster who has gotten the finest education money and status
can buy with the test scores of the youngster who has struggled through
poor schools and a terrible neighborhood. Considerations of social util-
ity argue that it is desirable to have more minority students getting good
college educations, so that society may alter the effects of past discrim-
ination and provide a basis for an eventually color-blind society in the
future. We assign ++ to this cell to indicate a large preference for the
minority candidate. A relatively large deficit in the minority applicant's
test score may properly be overlooked.
CELL
4: THE SCARSDALE
MINORITY
VERSUS THE SCARSDALE
WHITE. If a
college is choosing between two students in the high-high cell, both
from Scarsdale with college-educated parents and family incomes in six
figures, the social utility criteria say that there is a rationale for picking
the minority youth even if his test scores are somewhat lower. Rut do-
ing so would violate just deserts when the white student has higher test
scores and is in every other way equal to the minority student. Which
criterion should win out? There is no way to say for sure. Our own view
is that, as personally hurtful as this injustice may be to the individual
white person involved, it is relatively minor in the grand scheme of
things. The privileged white youth, with strong credentials and parents
who can pay for college, will get into a good college someplace. We
therefore assign a + to this cell to signify some ethnic premium to the
minority candidate but less than in the first instance.
CELL 2: THE SOUTH BRONX MINORITY
VERSUS THE APPALACHIAN
WHITE. Now imagine a minority student from the South Bronx and a
white student from an impoverished Appalachian community. The fam.
ilies of both students are at the wrong end of the scale of advantage.
Which one should get the nod in a close call? The white has just as
much or nearly as much "social utility" going for him as the black does.
American society will benefit from educating youngsters from disad-
vantaged white backgrounds, too. Both have a claim based on just
deserts. America likes to think that people can work their way up from
the bottom, and Appalachia is the bottom no less than the South Bronx.
Perhaps there is some residual premium associated with being black,
based on the supposition that just being black puts one at a greater dis-
advantage than a white in the "all else equal" case-a
more persuasive
point when applied to blacks from the South Bronx than when applied
to blacks from Scarsdale. We assign =O to this cell, indicating that the
appropriate ethnic pemiurn for the minority student is not much greater
than zero (other things being equal) and is certainly smaller than in the
Scarsdale-Scarsdale case.
CELL 3: THE SCARSDALE
MINORITY VERSUS THE APPALACHIAN
WHITE.
Now we are comparing the privileged minority student with the disad-
vantaged white student. Where one comes out on the scale of social
utility depends on how one values the competing goals to be served. It
seems hard to justify a social utility value that nets out in favor of the
minority youth, however. (Yes, there is social utility in adding a rninor-
ity to the ranks of successful attorneys, even if he comes from an afflu-
ent background, but there is also social utility in vindicating the
American dream for poor whites and in adding a representative of dis-
advantaged white America to the ranks of successful attorneys.) Some-
thing close to zero seems to be the appropriate expected value on the
social utility measure, and the white youth should get a plus on the just
deserts argument. If the choice is between a poor white youngster from
an awful environment and an affluent minority youngster who has gone
to fine schools, and if the poor white has somewhat lower test scores
than the affluent minority, it is appropriate to give the poor white at
least a modest premium. We thus enter - into this cell, to reflect the
fact the white youth gets the nod in a close call.
The filled-in table is shown below. We may argue about how large an
ethnic premium, expressed in IQ, should be tolerated in each cell, but
The Ethics of Affirmative Action
- The text argues that social utility and 'just deserts' should favor disadvantaged white applicants over affluent minority applicants in close admissions calls.
- A theoretical framework is proposed where the highest premium for affirmative action should be reserved for socioeconomically disadvantaged minorities.
- Data from the NLSY reveals that actual admissions practices show a massive cognitive ability gap between white and black students at the same institutions.
- In practice, black students at the 12th percentile of cognitive ability are often treated as equivalent to white students at the 49th percentile.
- The author questions whether a gap of over one full standard deviation in IQ is a reasonable or appropriate edge for affirmative action policies.
- The analysis suggests that current affirmative action implementation ignores socioeconomic status in favor of purely racial preferences.
Is it appropriate to treat the choice as a toss-up if the student at the 12th percentile happens to be black?
464
Living Together
Affirmative Action in Higher Education
465
two candidates. Assume that all the nonacademic qualifications besides
race are fully specified by high and low status for this pair of candidates
and that the IQ is the only measure of academic ability being consid-
ered. (In other words, let us disregard grades, extracurricular activities,
athletics, alumni parents, and other factors.) You are trying to decide
whether to admit the minority applicant or the white applicant. How
big a difference in 1Q are you willing to accept in each cell and still pick
the minority candidate over the white candidate? Let us consider each
cell in turn, starting with the situation in which the minority might he
expected to get the largest premium to the one in which the premium
arguably should go to the white.
CELL
1: THE SOUTH
BRONX MINORITY
VERSUS THE SCARSDALE
WHITE.
The largest weight obviously belongs in the cell in which the minority
student is disadvantaged and the white student is advantaged. Consid-
erations of just deserts argue that it is not fair to equate the test scores
of the youngster who has gotten the finest education money and status
can buy with the test scores of the youngster who has struggled through
poor schools and a terrible neighborhood. Considerations of social util-
ity argue that it is desirable to have more minority students getting good
college educations, so that society may alter the effects of past discrim-
ination and provide a basis for an eventually color-blind society in the
future. We assign ++ to this cell to indicate a large preference for the
minority candidate. A relatively large deficit in the minority applicant's
test score may properly be overlooked.
CELL
4: THE SCARSDALE
MINORITY
VERSUS THE SCARSDALE
WHITE. If a
college is choosing between two students in the high-high cell, both
from Scarsdale with college-educated parents and family incomes in six
figures, the social utility criteria say that there is a rationale for picking
the minority youth even if his test scores are somewhat lower. Rut do-
ing so would violate just deserts when the white student has higher test
scores and is in every other way equal to the minority student. Which
criterion should win out? There is no way to say for sure. Our own view
is that, as personally hurtful as this injustice may be to the individual
white person involved, it is relatively minor in the grand scheme of
things. The privileged white youth, with strong credentials and parents
who can pay for college, will get into a good college someplace. We
therefore assign a + to this cell to signify some ethnic premium to the
minority candidate but less than in the first instance.
CELL 2: THE SOUTH BRONX MINORITY
VERSUS THE APPALACHIAN
WHITE. Now imagine a minority student from the South Bronx and a
white student from an impoverished Appalachian community. The fam.
ilies of both students are at the wrong end of the scale of advantage.
Which one should get the nod in a close call? The white has just as
much or nearly as much "social utility" going for him as the black does.
American society will benefit from educating youngsters from disad-
vantaged white backgrounds, too. Both have a claim based on just
deserts. America likes to think that people can work their way up from
the bottom, and Appalachia is the bottom no less than the South Bronx.
Perhaps there is some residual premium associated with being black,
based on the supposition that just being black puts one at a greater dis-
advantage than a white in the "all else equal" case-a
more persuasive
point when applied to blacks from the South Bronx than when applied
to blacks from Scarsdale. We assign =O to this cell, indicating that the
appropriate ethnic pemiurn for the minority student is not much greater
than zero (other things being equal) and is certainly smaller than in the
Scarsdale-Scarsdale case.
CELL 3: THE SCARSDALE
MINORITY VERSUS THE APPALACHIAN
WHITE.
Now we are comparing the privileged minority student with the disad-
vantaged white student. Where one comes out on the scale of social
utility depends on how one values the competing goals to be served. It
seems hard to justify a social utility value that nets out in favor of the
minority youth, however. (Yes, there is social utility in adding a rninor-
ity to the ranks of successful attorneys, even if he comes from an afflu-
ent background, but there is also social utility in vindicating the
American dream for poor whites and in adding a representative of dis-
advantaged white America to the ranks of successful attorneys.) Some-
thing close to zero seems to be the appropriate expected value on the
social utility measure, and the white youth should get a plus on the just
deserts argument. If the choice is between a poor white youngster from
an awful environment and an affluent minority youngster who has gone
to fine schools, and if the poor white has somewhat lower test scores
than the affluent minority, it is appropriate to give the poor white at
least a modest premium. We thus enter - into this cell, to reflect the
fact the white youth gets the nod in a close call.
The filled-in table is shown below. We may argue about how large an
ethnic premium, expressed in IQ, should be tolerated in each cell, but
Affirmative Action in Higher Education
467
A Rationale for Thinking About the Preference
Given to a Minority Candidate
High
MINORITY
Low
SES
=O
+ +
SES
SES
the ranking of the premiums seems hard to dispute, With this in mind,
we are ready to examine how affirmative action in the NLSY sample
squared with this view of the appropriate discrepancies.[261
High
SES
Rationale us. Practice
To fill in the table with data, we divided NLSY students who went to
four-year institutions into those in the upper and lower halves of
socioeconomic background, using the socioeconomic status index
described in Appendix 2. (We also conducted the analysis with more
extreme definitions of privilege and disadvantage.)'271 We then selected
the subsample of whites and blacks who had attended the same schools,
and computed the mean IQ for the upper and lower halves of socioe-
conomic status for these matched pairs, statistically controlling for in-
stitution. Sample sizes of these matched pairs ranged from 72 for the cell
in the top left to 504 for the cell in the lower right. The filled-in table
below shows the difference between the white and black IQ scores in
standard deviation^.'^^]
Let us try to put these numbers in terms of the choices facing an ad-
missions officer. He has two folders on the desk, representing the lower
left-hand cell of the table, The two applicants differ in cognitive ability
by 1.17 standard deviations, and both are socioeconomically dis-
advantaged. More specifically (incorporating information about the
means not shown in the table), one student is almost exactly average in
cognitive ability for such college students, at the 49th percentile of the
distribution; the other is at the 12th percentile. Is it appropriate to treat
the choice as a toss-up if the student at the 12th percentile happens to
(3 -
The Actual Magnitude of the Preference
Given to Black Candidates
(4)
L
WHITE SES
Below
Above
average
average
Above average
BLACK SES
Below average
be black?[291
The typical admissions officer has, in effect, been treating
two such applicants as a toss-up.
We put the question in that way to try to encourage thinking about
a subject that is not much thought about. How big an edge is appropri-
ate? In a properly run system of affirmative action, should the average
disadvantaged black and average disadvantaged white who got to a
given college differ by so large a margin?
Consider the next pair of folders, with two applicants fromprivileged
backgrounds (the upper right-hand cell). One is at the 57th centile of
college students, the other at the 23d centile, corresponding to almost
a standard deviation difference. Is it reasonable to choose each with
equal likelihood if the one at the 23d centile is black, as the typical
admissions officer now does?
How might one justify the upper left cell, representing the privileged
black versus the disadvantaged white, where the edge given to the black
candidate should be no greater than zero under any plausible rationale
for affirmative action (or so we argue), and probably should be less than
zero? A disadvantaged white youth with cognitive ability at the 36th
centile of college youths now has the same chance of being admitted as
a privileged black youth at the 17th centile.
Finally, consider the lower right cell, the one that most closely fits
the image of affirmative action, in which a privileged white is compet-
ing with a disadvantaged black. The logic of affirmative action implies
a substantial difference in the qualifications of two youths fitting this
description who have an equal chance of being admitted. Is the differ-
ence actually observed-between
a white at the 57th percentile of col-
lege students and one at the 12th percentile-a
reasonable one? In IQ
terms, this is a difference of almost nineteen points.
Affirmative Action Disparities
- The text highlights significant gaps in cognitive ability percentiles between admitted minority students and white students under current affirmative action practices.
- A privileged black youth at the 17th percentile of college ability has the same admission chance as a disadvantaged white youth at the 36th percentile.
- Admissions committees are often driven by the pressure to meet minority representation quotas rather than balancing individual socioeconomic disadvantages.
- The authors argue that the current practice of affirmative action has lost touch with its original logical foundations and intended purposes.
- Universities possess extensive data on ethnicity, socioeconomic status, and academic ability that could be used to analyze and reform these admission processes.
- Despite criticisms of the methodology, the policy is credited with a drastic and indisputable increase in the number of minority students attending and graduating college.
If the percentage of minorities in the incoming freshman class goes up, that is considered good. If the percentage goes down, that is considered bad.
Affirmative Action in Higher Education
467
A Rationale for Thinking About the Preference
Given to a Minority Candidate
High
MINORITY
Low
SES
=O
+ +
SES
SES
the ranking of the premiums seems hard to dispute, With this in mind,
we are ready to examine how affirmative action in the NLSY sample
squared with this view of the appropriate discrepancies.[261
High
SES
Rationale us. Practice
To fill in the table with data, we divided NLSY students who went to
four-year institutions into those in the upper and lower halves of
socioeconomic background, using the socioeconomic status index
described in Appendix 2. (We also conducted the analysis with more
extreme definitions of privilege and disadvantage.)'271 We then selected
the subsample of whites and blacks who had attended the same schools,
and computed the mean IQ for the upper and lower halves of socioe-
conomic status for these matched pairs, statistically controlling for in-
stitution. Sample sizes of these matched pairs ranged from 72 for the cell
in the top left to 504 for the cell in the lower right. The filled-in table
below shows the difference between the white and black IQ scores in
standard deviation^.'^^]
Let us try to put these numbers in terms of the choices facing an ad-
missions officer. He has two folders on the desk, representing the lower
left-hand cell of the table, The two applicants differ in cognitive ability
by 1.17 standard deviations, and both are socioeconomically dis-
advantaged. More specifically (incorporating information about the
means not shown in the table), one student is almost exactly average in
cognitive ability for such college students, at the 49th percentile of the
distribution; the other is at the 12th percentile. Is it appropriate to treat
the choice as a toss-up if the student at the 12th percentile happens to
(3 -
The Actual Magnitude of the Preference
Given to Black Candidates
(4)
L
WHITE SES
Below
Above
average
average
Above average
BLACK SES
Below average
be black?[291
The typical admissions officer has, in effect, been treating
two such applicants as a toss-up.
We put the question in that way to try to encourage thinking about
a subject that is not much thought about. How big an edge is appropri-
ate? In a properly run system of affirmative action, should the average
disadvantaged black and average disadvantaged white who got to a
given college differ by so large a margin?
Consider the next pair of folders, with two applicants fromprivileged
backgrounds (the upper right-hand cell). One is at the 57th centile of
college students, the other at the 23d centile, corresponding to almost
a standard deviation difference. Is it reasonable to choose each with
equal likelihood if the one at the 23d centile is black, as the typical
admissions officer now does?
How might one justify the upper left cell, representing the privileged
black versus the disadvantaged white, where the edge given to the black
candidate should be no greater than zero under any plausible rationale
for affirmative action (or so we argue), and probably should be less than
zero? A disadvantaged white youth with cognitive ability at the 36th
centile of college youths now has the same chance of being admitted as
a privileged black youth at the 17th centile.
Finally, consider the lower right cell, the one that most closely fits
the image of affirmative action, in which a privileged white is compet-
ing with a disadvantaged black. The logic of affirmative action implies
a substantial difference in the qualifications of two youths fitting this
description who have an equal chance of being admitted. Is the differ-
ence actually observed-between
a white at the 57th percentile of col-
lege students and one at the 12th percentile-a
reasonable one? In IQ
terms, this is a difference of almost nineteen points.
468
Living Together
Affirmative Action in Higher Education
469
We do not suppose that admissions officers have these folders side by
side as they make their decisions. In fact, given the pressures on admis-
sions committees, the determining factor for admission is often the sheer
numbers of minority applicants. If the percentage of minorities in the
incoming freshman class goes up, that is considered good. If the per-
centage goes down, that is considered bad. To make the numbers come
out right, the admissions committee feels pressed to dig deeper into the
pool of available applicants if necessary. They do not want to admit un-
qualified minority candidates, nor do they want to prefer advantaged
minority applicants over disadvantaged whites. Rut these questions
arise, if they arise at all, only after the more pressing matter of minority
representation is attended to. The goal is to have "enough" blacks and
other minorities in the incoming class. Meanwhile, white applicants are
judged in competition with other white candidates, using the many cri-
teria that have always been applied.
The main purpose of the exercise we have just conducted is to suggest
that admissions committees should be permitted to behave a little more
like our imaginary one than they are at present, given the pressures from
higher levels in the university. If university officials think that these
data are not adequate for the purposes we have used them, or if they
think that we have misrepresented the affirmative action process, there
is an easy remedy. Universities across the country have in their
admissions files all the data needed for definitive analyses of the rela-
tionship of ethnicity, socioeconomic disadvantage, and academic
ability-test
data, grade data, parental background data in prufusion-
for students who were accepted and students who were rejected, students
who enrolled and students who did not. At many schools, the data are
already in computer files, ready for analysis. They may readily be made
available to scholars without compromising confidentiality. Our
proposition is that affirmative action as it is currently practiced in
America's universities has lost touch with any reasonable understand-
ing of the logic and purposes of affirmative action. It is easy to put this
proposition to the test.
THE SUCCESS OF AFFIRMATIVE ACTION IN THE
UNIVERSITIES
The success of affirmative action in the university is indisputable, in the
sense that a consciously designed public policy, backed by the enthusi-
astic cooperation of universities, drastically increased the number of
minority students who attend and graduate from college. The mag-
nitude of the success during the first flush of affirmative action is
apparent in the figure below, which shows the result for black enroll-
ments. 1~01
When aggressive affirmative action began, black college enrollment
surged for a decade
Blacks ages 20-24 enrolled in school
25% -
Source: U.S. Bureau of the Census 1975, 1993, various editions.
In 1967, black enrollment of 2C-24-year-olds suddenly shot up, and
continued to rise steeply through the mid-1970s. White enrollment
experienced no comparable surge during that period. The most plausi-
ble cause of the surge is the aggressive affirmative action that began in
the mid-1960s. On the other hand, this figure previews a problem we
will discuss at more length in the next chapter: Whatever initial impe-
tus was provided by affirmative action, it soon lost momentum. Black
enrollment in the early 1990s was higher than the trendline from 1950
to 1966 would have predicted, but some sort of evening-out process
seems to have set in as well. Black enrollment dropped during the late
1970s recovered modestly during the early and mid*1980s, then in-
Affirmative Action in Higher Education
- Black college enrollment saw a significant surge starting in 1967, likely driven by aggressive affirmative action policies.
- By the early 1990s, black enrollment reached historic highs, exceeding white enrollment when controlling for socioeconomic status and IQ.
- Affirmative action is credited with increasing the visibility of college as an option for minority youth and providing more role models.
- The policy has faced criticism regarding its long-term momentum and the potential 'evening-out' process observed in later decades.
- A major concern involves the psychological and social costs of placing students with disparate academic abilities in the same environment.
- The text suggests that while affirmative action achieved its goal of increasing access, it may negatively impact minority self-esteem and white perceptions of minority competence.
How much harm is done to minority self-esteem, to white perceptions of minorities, and ultimately to ethnic relations by a system that puts academically less able minority students side by side with students who are more able?
468
Living Together
Affirmative Action in Higher Education
469
We do not suppose that admissions officers have these folders side by
side as they make their decisions. In fact, given the pressures on admis-
sions committees, the determining factor for admission is often the sheer
numbers of minority applicants. If the percentage of minorities in the
incoming freshman class goes up, that is considered good. If the per-
centage goes down, that is considered bad. To make the numbers come
out right, the admissions committee feels pressed to dig deeper into the
pool of available applicants if necessary. They do not want to admit un-
qualified minority candidates, nor do they want to prefer advantaged
minority applicants over disadvantaged whites. Rut these questions
arise, if they arise at all, only after the more pressing matter of minority
representation is attended to. The goal is to have "enough" blacks and
other minorities in the incoming class. Meanwhile, white applicants are
judged in competition with other white candidates, using the many cri-
teria that have always been applied.
The main purpose of the exercise we have just conducted is to suggest
that admissions committees should be permitted to behave a little more
like our imaginary one than they are at present, given the pressures from
higher levels in the university. If university officials think that these
data are not adequate for the purposes we have used them, or if they
think that we have misrepresented the affirmative action process, there
is an easy remedy. Universities across the country have in their
admissions files all the data needed for definitive analyses of the rela-
tionship of ethnicity, socioeconomic disadvantage, and academic
ability-test
data, grade data, parental background data in prufusion-
for students who were accepted and students who were rejected, students
who enrolled and students who did not. At many schools, the data are
already in computer files, ready for analysis. They may readily be made
available to scholars without compromising confidentiality. Our
proposition is that affirmative action as it is currently practiced in
America's universities has lost touch with any reasonable understand-
ing of the logic and purposes of affirmative action. It is easy to put this
proposition to the test.
THE SUCCESS OF AFFIRMATIVE ACTION IN THE
UNIVERSITIES
The success of affirmative action in the university is indisputable, in the
sense that a consciously designed public policy, backed by the enthusi-
astic cooperation of universities, drastically increased the number of
minority students who attend and graduate from college. The mag-
nitude of the success during the first flush of affirmative action is
apparent in the figure below, which shows the result for black enroll-
ments. 1~01
When aggressive affirmative action began, black college enrollment
surged for a decade
Blacks ages 20-24 enrolled in school
25% -
Source: U.S. Bureau of the Census 1975, 1993, various editions.
In 1967, black enrollment of 2C-24-year-olds suddenly shot up, and
continued to rise steeply through the mid-1970s. White enrollment
experienced no comparable surge during that period. The most plausi-
ble cause of the surge is the aggressive affirmative action that began in
the mid-1960s. On the other hand, this figure previews a problem we
will discuss at more length in the next chapter: Whatever initial impe-
tus was provided by affirmative action, it soon lost momentum. Black
enrollment in the early 1990s was higher than the trendline from 1950
to 1966 would have predicted, but some sort of evening-out process
seems to have set in as well. Black enrollment dropped during the late
1970s recovered modestly during the early and mid*1980s, then in-
470
Living Together
Affimtive Action in Higher Education
471
creased sharply at the end of the decade. The level of black college
enrollment as of the early 1990s is higher than at any other time in
history
Furthermore, the enrollment of blacks rose not only to equality but
to more than equality with whites of comparable socioeconomic back-
ground and intelligence. As we showed in Chapter 14, the proportion
of blacks obtaining college degrees substantially exceeds that of whites,
after controlling for IQ. As we have just finished documenting at length,
the opportunity for college is also more open to blacks than to whites
with equivalent test scores.
Given the goals of affirmative action, it is appropriate to see this in-
crease as a success. We assume as well (we have found no hard data) that
affirmative action has also increased the sense among minority youths
that college is an option for them and increased the number of college-
educated minority role models for minority youths. Still other benefits
claimed for affirmative action-helping
jump-start advances in the next
generation of minority groups or improving race relations-are
yet in
the realm of speculation.
THE COSTS OF AFFIRMATIVE ACTION IN THE UNIVERSITIES
The costs of affirmative action have been measured in different ways.31
Relatively little of this commentary has involved the costs to whites.
There are such costs-some
number of white students are denied places
at universities they could otherwise have won, because of affirmative
action.32 But most of the concern about affirmative action comes down
to this question: How much harm is done to minority self-esteem, to
white perceptions of minorities, and ultimately to ethnic relations by a
system that puts academically less able minority students side by side
with students who are more able? There are no hard-and-fast answers,
but at least we can discuss the magnitude of the problem from the stu-
dent's eye view and from the vantage point of the general population.
The Student's Eye View of Minority and White Cognitive Ability
Getting to know students from different backgrounds is a proper part of
a college education. But given the differences in the cognitive abilities
of the students in different groups, diversity has other consequences. To
the extent that the groups have different scores, both perceptions and
grades will track with them. Consider once again the probability of
reaching college for students at different levels of cognitive ability.
Comparatively small proportions of students with low intelligence get
to college, no matter what their race. But the student on the ground
does not see the entire population of students with IQs in the bottom
quartile (let us say). Rather, the only people in the bottom quartile
whom he sees are the ones who reached college.
To see just how different these perspectives can be, let us take first
the extreme "above the battle" view of racial tensions that might be
caused by affirmative action. The argument goes as follows:
Yes, there is a racial discrepancy in test scores, though one should in-
terpret those differences cautiously no matter what the evidence on cultural
bias may be. But in reality we are talking about small numbers and small
differences. In the NLSY data, blacks in the bottom quartile of cognitive
ability who reach four-year colleges amount to less than 4 percent of the
youths on those campuses, while whites amount to almost 2 percent. Can
anyone seriously think that this trivial difference can be a major problem?
The answer seems as if it is self-evidently no. But now we switch to
the view from ground level: from the vantage point of the college
student who attends classes, listens to fellow students talk in class,
observes what is going on in the library and the labs, and gossips with
friends about other students. Let us imagine three observations of the
kind that students commonly make in the normal course of campus life:
the racial mix of the entire student population, the students who stand
out because they seem to be especially out of place in a university, and
the students who stand out because they seem to be especially smart.
We will operationalize this student's campus view by looking at the
NLSY subjects who attended a four-year university (excluding histori-
cally black schools), focusing on those with IQs that put them in the
top and bottom 10 percent of such students. The figure below displays
what our hypothetical student sees. It shows students by IQ, but a fig.
ure that contained the same breakdown by college grades (unavailable
in the NLSY) would show roughly the same pattern. Backed up by the
many studies that have examined the relationship between cognitive
test scores (especially SAT scores) and performance in college: Cogni-
tive test scores generally overpredict college grade point average (GPA)
for both blacks and Latinos, in comparison to whites.33 If anything, a
figure showing students with the top and bottom 10 percent of GPAs
would show an even greater ethnic discrepancy in college performance
The Student's Eye View
- While aggregate data suggests racial differences in cognitive ability on campus are small, the 'ground level' experience of students reveals a different pattern.
- In the NLSY data, black students represent a disproportionately high percentage of those in the bottom 10 percent of cognitive ability on campus.
- Conversely, black students constitute an 'almost invisibly small proportion' of the top 10 percent of the student body in terms of IQ.
- Cognitive test scores like the SAT tend to overpredict college GPA for black and Latino students compared to their white peers.
- The author argues that these visible performance gaps, driven by affirmative action, contribute to racial resentment and campus animosity.
- The discrepancy between 'the view from above' and the reality of daily campus life is cited as a major hidden cost of current admissions policies.
The statistical difference that was trivial in the view from above the battle has become a large racial discrepancy at ground level.
470
Living Together
Affimtive Action in Higher Education
471
creased sharply at the end of the decade. The level of black college
enrollment as of the early 1990s is higher than at any other time in
history
Furthermore, the enrollment of blacks rose not only to equality but
to more than equality with whites of comparable socioeconomic back-
ground and intelligence. As we showed in Chapter 14, the proportion
of blacks obtaining college degrees substantially exceeds that of whites,
after controlling for IQ. As we have just finished documenting at length,
the opportunity for college is also more open to blacks than to whites
with equivalent test scores.
Given the goals of affirmative action, it is appropriate to see this in-
crease as a success. We assume as well (we have found no hard data) that
affirmative action has also increased the sense among minority youths
that college is an option for them and increased the number of college-
educated minority role models for minority youths. Still other benefits
claimed for affirmative action-helping
jump-start advances in the next
generation of minority groups or improving race relations-are
yet in
the realm of speculation.
THE COSTS OF AFFIRMATIVE ACTION IN THE UNIVERSITIES
The costs of affirmative action have been measured in different ways.31
Relatively little of this commentary has involved the costs to whites.
There are such costs-some
number of white students are denied places
at universities they could otherwise have won, because of affirmative
action.32 But most of the concern about affirmative action comes down
to this question: How much harm is done to minority self-esteem, to
white perceptions of minorities, and ultimately to ethnic relations by a
system that puts academically less able minority students side by side
with students who are more able? There are no hard-and-fast answers,
but at least we can discuss the magnitude of the problem from the stu-
dent's eye view and from the vantage point of the general population.
The Student's Eye View of Minority and White Cognitive Ability
Getting to know students from different backgrounds is a proper part of
a college education. But given the differences in the cognitive abilities
of the students in different groups, diversity has other consequences. To
the extent that the groups have different scores, both perceptions and
grades will track with them. Consider once again the probability of
reaching college for students at different levels of cognitive ability.
Comparatively small proportions of students with low intelligence get
to college, no matter what their race. But the student on the ground
does not see the entire population of students with IQs in the bottom
quartile (let us say). Rather, the only people in the bottom quartile
whom he sees are the ones who reached college.
To see just how different these perspectives can be, let us take first
the extreme "above the battle" view of racial tensions that might be
caused by affirmative action. The argument goes as follows:
Yes, there is a racial discrepancy in test scores, though one should in-
terpret those differences cautiously no matter what the evidence on cultural
bias may be. But in reality we are talking about small numbers and small
differences. In the NLSY data, blacks in the bottom quartile of cognitive
ability who reach four-year colleges amount to less than 4 percent of the
youths on those campuses, while whites amount to almost 2 percent. Can
anyone seriously think that this trivial difference can be a major problem?
The answer seems as if it is self-evidently no. But now we switch to
the view from ground level: from the vantage point of the college
student who attends classes, listens to fellow students talk in class,
observes what is going on in the library and the labs, and gossips with
friends about other students. Let us imagine three observations of the
kind that students commonly make in the normal course of campus life:
the racial mix of the entire student population, the students who stand
out because they seem to be especially out of place in a university, and
the students who stand out because they seem to be especially smart.
We will operationalize this student's campus view by looking at the
NLSY subjects who attended a four-year university (excluding histori-
cally black schools), focusing on those with IQs that put them in the
top and bottom 10 percent of such students. The figure below displays
what our hypothetical student sees. It shows students by IQ, but a fig.
ure that contained the same breakdown by college grades (unavailable
in the NLSY) would show roughly the same pattern. Backed up by the
many studies that have examined the relationship between cognitive
test scores (especially SAT scores) and performance in college: Cogni-
tive test scores generally overpredict college grade point average (GPA)
for both blacks and Latinos, in comparison to whites.33 If anything, a
figure showing students with the top and bottom 10 percent of GPAs
would show an even greater ethnic discrepancy in college performance
47 2
Living Toge t k r
Affirmative Action in Higher Education
473
The student's eye view of cognitive ability
Ethnic Composition of the Student Body on an Average Campus
All students
m111
Students in the tor
10% of IQ
Whites
Blacks
between whites and blacks or Latinos than the discrepancy in 14s in-
dicate~.'~"
Similarly, the data from individual colleges that opened the
chapter suggest that this aggregate national picture would look no bet-
ter, and might well look worse, in a school-by-school portrait.
Such large differences in performance are obvious to all, including
other students. The problem, and a major cost of affirmative action, is
that while blacks in the NLSY constituted only 12 percent of those who
went to college, they were 52 percent of the students in the bottom 10
percent in cognitive ability and an almost invisibly small proportion of
the top 10 percent. The statistical difference that was trivial in the view
from above the battle has become a large racial discrepancy at ground
level. Meanwhile the imbalance between Latinos' representation in the
campus population and in the bottom 10 percent of intelligence is less
obvious, while the "other" category (a combination of Asians, Pacific
ethnic groups, and American Indians) is proportionately represented in
the top and bottom (as a conglomerate-if
we split them up, most of
those in the top are Asian). We suggest that the figure presented above
is important in trying to understand some of the most difficult racial
problems besetting America's universities.
RACIAL
ANIMOSITY.
Racial clashes on campuses began to surface in the
early 1980s and apparently have been growing since then, with the great
bulk of the difficulties between whites and blacks.35 A plausible expla-
nation is that whites resent blacks, who are in fact getting a large edge
in the admissions process and often in scholarship assistance and many
of whom, as whites look around their own campus and others, "don't
belong there" academically. Some whites begin to act out these resent-
ments. Blacks perceive the same disproportions and resentments, then
conclude that the college environment is hostile to them.
We will not pursue this line of argument. Rather, we refer our read-
ers to a growing literature by black scholars who have couched it in the
context of their own experience.36 It is plain that affirmative action fos-
ters differences in the distribution of academic ability across races in the
communities on college campuses. Students are not imagining these dif-
ferences.
BLACK DROMUT RATES. The high black dropout rates from college are
also easier to understand in the light of the figure above. Typically, the
black dropout rate from universities in the last decade has run at about
twice the white rate.lj7' This was also true of the NLSY. Of all those who
ever entered a four-year institution, 63 percent of whites had gotten a
bachelor's degree by 1990 (when the youngest reached 26) compared to
only 34 percent of blacks. But the discrepancy is not mysterious. The
first and dominant explanation of higher black dropout rates is cogni-
tive ability. Controlling for age and IQ, the hlack and white dropout
rates converge. Given the average IQ of those who entered four-year in-
stitutions (about 1 lo), the expected probability that a youth entering a
four-year college would graduate was 59 percent for blacks and 61 per-
cent for whites, a trivial difference."R'
But whereas cognitive ability explains most of the difference in
dropout rates, it may not explain everything. In particular, the NLSY
data reflect the overall experience of blacks and whites, ignoring the
experience at specific colleges as we described it earlier. Let us consider
MIT, for which dropout rates by race have also been reported. In 1985,
the average SAT-Math score for a black male accepted at MIT was
659, a score that put him above the 90th percentile of all students
taking the SAT but below the 25th centile of all students at MIT.'9 The
dropout rate for black students at MIT in the mid- 1980s was 24 percent,
compared to 14 percent for whites4' Even if the average MIT black
freshman in 1985 could indeed do the work there in some objective
sense, getting discouraged about one's capacity to compete in an envi-
ronment may be another cost of affirmative action, a phenomenon that
The Costs of Academic Disparity
- Affirmative action policies create visible differences in the distribution of academic ability across races on college campuses.
- High black dropout rates, which are roughly double those of whites, are primarily explained by differences in cognitive ability scores upon entry.
- When controlling for IQ and age, the probability of graduation for black and white students becomes nearly identical.
- Elite institutions like MIT show higher dropout rates for black students who, despite high national percentiles, fall into the bottom quartile of their specific campus population.
- Preferential admissions may dilute the value of a university degree as a social signal, potentially reinforcing rather than dismantling racial stereotypes.
Today the same degree from the same university is perceived differently if you have a black face or a white one.
47 2
Living Toge t k r
Affirmative Action in Higher Education
473
The student's eye view of cognitive ability
Ethnic Composition of the Student Body on an Average Campus
All students
m111
Students in the tor
10% of IQ
Whites
Blacks
between whites and blacks or Latinos than the discrepancy in 14s in-
dicate~.'~"
Similarly, the data from individual colleges that opened the
chapter suggest that this aggregate national picture would look no bet-
ter, and might well look worse, in a school-by-school portrait.
Such large differences in performance are obvious to all, including
other students. The problem, and a major cost of affirmative action, is
that while blacks in the NLSY constituted only 12 percent of those who
went to college, they were 52 percent of the students in the bottom 10
percent in cognitive ability and an almost invisibly small proportion of
the top 10 percent. The statistical difference that was trivial in the view
from above the battle has become a large racial discrepancy at ground
level. Meanwhile the imbalance between Latinos' representation in the
campus population and in the bottom 10 percent of intelligence is less
obvious, while the "other" category (a combination of Asians, Pacific
ethnic groups, and American Indians) is proportionately represented in
the top and bottom (as a conglomerate-if
we split them up, most of
those in the top are Asian). We suggest that the figure presented above
is important in trying to understand some of the most difficult racial
problems besetting America's universities.
RACIAL
ANIMOSITY.
Racial clashes on campuses began to surface in the
early 1980s and apparently have been growing since then, with the great
bulk of the difficulties between whites and blacks.35 A plausible expla-
nation is that whites resent blacks, who are in fact getting a large edge
in the admissions process and often in scholarship assistance and many
of whom, as whites look around their own campus and others, "don't
belong there" academically. Some whites begin to act out these resent-
ments. Blacks perceive the same disproportions and resentments, then
conclude that the college environment is hostile to them.
We will not pursue this line of argument. Rather, we refer our read-
ers to a growing literature by black scholars who have couched it in the
context of their own experience.36 It is plain that affirmative action fos-
ters differences in the distribution of academic ability across races in the
communities on college campuses. Students are not imagining these dif-
ferences.
BLACK DROMUT RATES. The high black dropout rates from college are
also easier to understand in the light of the figure above. Typically, the
black dropout rate from universities in the last decade has run at about
twice the white rate.lj7' This was also true of the NLSY. Of all those who
ever entered a four-year institution, 63 percent of whites had gotten a
bachelor's degree by 1990 (when the youngest reached 26) compared to
only 34 percent of blacks. But the discrepancy is not mysterious. The
first and dominant explanation of higher black dropout rates is cogni-
tive ability. Controlling for age and IQ, the hlack and white dropout
rates converge. Given the average IQ of those who entered four-year in-
stitutions (about 1 lo), the expected probability that a youth entering a
four-year college would graduate was 59 percent for blacks and 61 per-
cent for whites, a trivial difference."R'
But whereas cognitive ability explains most of the difference in
dropout rates, it may not explain everything. In particular, the NLSY
data reflect the overall experience of blacks and whites, ignoring the
experience at specific colleges as we described it earlier. Let us consider
MIT, for which dropout rates by race have also been reported. In 1985,
the average SAT-Math score for a black male accepted at MIT was
659, a score that put him above the 90th percentile of all students
taking the SAT but below the 25th centile of all students at MIT.'9 The
dropout rate for black students at MIT in the mid- 1980s was 24 percent,
compared to 14 percent for whites4' Even if the average MIT black
freshman in 1985 could indeed do the work there in some objective
sense, getting discouraged about one's capacity to compete in an envi-
ronment may be another cost of affirmative action, a phenomenon that
474
Living Together
Affirmative Action in Higher Education
475
has been described anecdotally by a number of observers, black and
white alike.41
The Population's Eye View of People with College Degrees
The other vantage point to take into account is the view of the public
toward minority and white college graduates. The college degree-what
it is and where you got it-packs
a lot of information in today's Amer-
ica, not just as a credential that employers evaluate in hiring but as a
broad social signal. One may lament this (people ought to be judged on
their own merits, not by where they went to school), but it also has a
positive side. Historically, that little sentence, "I have a [solid degree]
from [a well-regarded university]," jolted you loose from any number of
stereotypes that the person you encountered might have had of you.
The reason it did so was that a well-regarded college had a certain set
of standards, and its graduates presumably met those standards. No mat-
ter what one's view is of "credentialing" in theory, the greatest benefi-
ciaries of credentialing are those who are subject to negative stereotypes.
One of the great losses of preferential affirmative action has been to di-
lute the effects of the university credential for some minorities. Today
the same degree from the same university is perceived differently if you
have a black face or a white one. This is not a misguided prejudice that
will be changed if only people are given more accurate information
about how affirmative action really works. O n the contrary, more accu-
rate information about how affirmative action really works confirms
such perceptions.
This unhappy reality is unnecessary, There is no reason that minor-
ity graduates from any given college have to be any different from white
college graduates in their ability or accomplishments. Restoring the
value of the credential is easy: Use uniform procedures for selecting,
grading, and granting degrees to undergraduates. Some difference in the
cognitive distributions among college graduates would still remain, be-
cause even if individual schools were to treat applicants and students
without regard to race, we could expect some cognitive difference in the
national distributions of graduates (since a group with disproportion-
ately fewer high-scoring students would probably gravitate to less com-
petitive schools; they would graduate, but nonetheless have lower mean
ability), But within schools, the group differences could be as close to
zero as the institution chooses to get. America's universities are instead
perpetuating in the ranks of their graduates the same gap in cognitive
ability that separates blacks and Latinos from whites in the general pop-
ulation. As we saw in the data on law and medical schools, there is no
reason to think that the gap shrinks as people move further up the ed.
ucational ladder, and some reason to think it continues to grow.
Some will argue the gap in ability is an acceptable price to pay for
the other good things that are supposed to be accomplished by aggres-
sive affirmative action. Our judgment, in contrast, is that in trying to
build a society where ethnicity no longer matters in the important
events in life, it is crucially important that society's prestigious labels
have the same or as close to the same meaning as possible for different
ethnic groups. In the case of one of these key labels-the
educational
degree-policymakers,
aided and abetted by the universities, have pre-
vented this from happening.
We will trace some of the consequences in the next chapter, when
we turn to affirmative action in the workplace and present at more
length our assessment of how the double standard embedded in affir-
mative action affects society. For now, we will observe only that the seeds
of the consequences in the workplace and beyond are sown in colleges
and universities. To anticipate our larger conclusion, affirmative action
as it is being practiced is a grave error.
A POLICY AGENDA
We urge that affirmative action in the universities be radically modi-
fied, returning to the original conception. Universities should cast a
wide net in seeking applicants, making special efforts to seek talent
wherever it lives-in
the black South Bronx, Latino Los Angeles, and
white Appalachia alike. In the case of two candidates who are fairly
closely matched otherwise, universities should give the nod to the ap-
plicant from the disadvantaged background. This original sense of af-
firmative action seems to us to have been not only reasonable and fair
but wise.
What does "closely matched" mean in terms of test scores? We have
no firm rules, but as a guideline, admissions officers might aim for an ad-
missions policy such that no identifiable group (such as a racial minor-
ity) has a mean that is more than half a standard deviation below the
rest of the student body.'421 This guideline is by no means demanding.
In effect, it asks only that the average minority student is at the 30th
centile of the white distribution. Perhaps experience would prove that
Reforming University Affirmative Action
- The authors argue that current affirmative action policies perpetuate cognitive ability gaps between racial groups within the same educational institutions.
- They propose restoring the value of academic credentials by using uniform procedures for selection, grading, and degree granting.
- The text suggests that prestigious labels, such as degrees, must have the same meaning across all ethnic groups to build a society where ethnicity no longer matters.
- A return to the 'original conception' of affirmative action is advocated, focusing on casting a wide net for talent in disadvantaged areas rather than using double standards.
- The authors propose a specific guideline where no identifiable group's mean test score is more than half a standard deviation below the rest of the student body.
- The current practice of affirmative action is characterized as a 'grave error' that sows the seeds for societal consequences in the workplace and beyond.
To anticipate our larger conclusion, affirmative action as it is being practiced is a grave error.
474
Living Together
Affirmative Action in Higher Education
475
has been described anecdotally by a number of observers, black and
white alike.41
The Population's Eye View of People with College Degrees
The other vantage point to take into account is the view of the public
toward minority and white college graduates. The college degree-what
it is and where you got it-packs
a lot of information in today's Amer-
ica, not just as a credential that employers evaluate in hiring but as a
broad social signal. One may lament this (people ought to be judged on
their own merits, not by where they went to school), but it also has a
positive side. Historically, that little sentence, "I have a [solid degree]
from [a well-regarded university]," jolted you loose from any number of
stereotypes that the person you encountered might have had of you.
The reason it did so was that a well-regarded college had a certain set
of standards, and its graduates presumably met those standards. No mat-
ter what one's view is of "credentialing" in theory, the greatest benefi-
ciaries of credentialing are those who are subject to negative stereotypes.
One of the great losses of preferential affirmative action has been to di-
lute the effects of the university credential for some minorities. Today
the same degree from the same university is perceived differently if you
have a black face or a white one. This is not a misguided prejudice that
will be changed if only people are given more accurate information
about how affirmative action really works. O n the contrary, more accu-
rate information about how affirmative action really works confirms
such perceptions.
This unhappy reality is unnecessary, There is no reason that minor-
ity graduates from any given college have to be any different from white
college graduates in their ability or accomplishments. Restoring the
value of the credential is easy: Use uniform procedures for selecting,
grading, and granting degrees to undergraduates. Some difference in the
cognitive distributions among college graduates would still remain, be-
cause even if individual schools were to treat applicants and students
without regard to race, we could expect some cognitive difference in the
national distributions of graduates (since a group with disproportion-
ately fewer high-scoring students would probably gravitate to less com-
petitive schools; they would graduate, but nonetheless have lower mean
ability), But within schools, the group differences could be as close to
zero as the institution chooses to get. America's universities are instead
perpetuating in the ranks of their graduates the same gap in cognitive
ability that separates blacks and Latinos from whites in the general pop-
ulation. As we saw in the data on law and medical schools, there is no
reason to think that the gap shrinks as people move further up the ed.
ucational ladder, and some reason to think it continues to grow.
Some will argue the gap in ability is an acceptable price to pay for
the other good things that are supposed to be accomplished by aggres-
sive affirmative action. Our judgment, in contrast, is that in trying to
build a society where ethnicity no longer matters in the important
events in life, it is crucially important that society's prestigious labels
have the same or as close to the same meaning as possible for different
ethnic groups. In the case of one of these key labels-the
educational
degree-policymakers,
aided and abetted by the universities, have pre-
vented this from happening.
We will trace some of the consequences in the next chapter, when
we turn to affirmative action in the workplace and present at more
length our assessment of how the double standard embedded in affir-
mative action affects society. For now, we will observe only that the seeds
of the consequences in the workplace and beyond are sown in colleges
and universities. To anticipate our larger conclusion, affirmative action
as it is being practiced is a grave error.
A POLICY AGENDA
We urge that affirmative action in the universities be radically modi-
fied, returning to the original conception. Universities should cast a
wide net in seeking applicants, making special efforts to seek talent
wherever it lives-in
the black South Bronx, Latino Los Angeles, and
white Appalachia alike. In the case of two candidates who are fairly
closely matched otherwise, universities should give the nod to the ap-
plicant from the disadvantaged background. This original sense of af-
firmative action seems to us to have been not only reasonable and fair
but wise.
What does "closely matched" mean in terms of test scores? We have
no firm rules, but as a guideline, admissions officers might aim for an ad-
missions policy such that no identifiable group (such as a racial minor-
ity) has a mean that is more than half a standard deviation below the
rest of the student body.'421 This guideline is by no means demanding.
In effect, it asks only that the average minority student is at the 30th
centile of the white distribution. Perhaps experience would prove that
476
Living Together
Affimtiue Action in Higher Education
477
this is not closely matched enough. But at least let us move toward that
standard and see how it works. The present situation, with black stu-
dents averaging well over a full standard deviation below the white
mean, sometimes approaching two standard deviations, is so far out of
line with any plausible rationale that universities today cannot publish
the data on their admitted students and hope to persuade the public (or
specialists in education) that their policies are reasonable.
Would an end to aggressive affirmative action mean that minorities
who can profit from a genuine college education will find the door of
opportunity closed to them? There is no reason to think so. On the con-
trary, we urge that people examine more closely an ignored, brief era in
American university life-from
the mid-1950s to the mid-1960s. Si-
multaneously, the civil rights movement was gaining momentum, white
upper-middle-class America was having its consciousness raised on the
subject of racial discrimination, and color-blindness was actively taken
as the ideal. At many colleges during that era, applicants were forbid-
den to enclose a photograph and instructed to avoid any information in
the essay that might help identify their race or religion. Whether ad-
missions committees were truly innocent of this information is another
question, but the intent was clear, and so was the result: Racial differ-
ences in qualifications during that time were minor, or so it appeared to
both of us at the time.
What were campus race relations like then? What were the attitudes
of the black students toward achievement? What was the performance
of black students relative to the predictions that might have been made
based on their high school performance? What were the dropout rates
of blacks relative to whites in the same institution? What were the sub-
sequent careers of black students from that era? How do black students
from that era, looking back, assess the pluses and minuses of the current
state of affairs versus their experience?
We must put such topics as questions because that era has been ig-
nored. We suggest this possibility: American universities once ap-
proached the ideal in their handling of race on the campus, and there
is no reason why they could not do so again.
Fewer blacks would be at Berkeley or Yale if there were no affirma-
tive action. But admitting half as many black students to Yale does not
mean that the rejected ones will not go to college; it just means that
they will not go to Yale. For some individuals who are not chosen, this
will be a loss, for others a blessing, but it is a far different choice from
"college" versus "no college." It is not even clear how much the goals of
diversity would be adversely affected for the system as a whole. If affir-
mative action in its present form were ended, the schools at the very
top would have smaller numbers of blacks and some other minorities on
their campuses, but many other schools in the next echelons would add
those students, even as they lost some of their former students to schools
further down the line. And at every level of school, the gap in cogni-
tive ability between minorities and whites would shrink.
Ending affirmative action as it is currently practiced will surely have
other effects. Affirmative action does in fact bring a significant number
of minority students onto campuses who would not otherwise be there.
Perhaps the overall percentage of some minorities who attend college
would drop. But their white counterparts at the same level of ability and
similar socioeconomic background are not in college now. To what ex-
tent is a society fair when people of similar ability and background are
treated as differently as they are now? In 1964, the answer would have
been unambiguous: Such a society is manifestly unfair. The logic was
right then, and right now.
The Case for Color-Blindness
- The authors argue that universities must publish admission data to justify their policies to the public.
- A brief era from the mid-1950s to mid-1960s is cited as a successful model where color-blindness was the active ideal in admissions.
- Ending affirmative action would likely shift minority enrollment from elite institutions to other echelons rather than ending college access entirely.
- A return to merit-based admissions would shrink the cognitive ability gap between minority and white students within the same institutions.
- The text questions the fairness of treating individuals of similar ability and socioeconomic backgrounds differently based on race.
At many colleges during that era, applicants were forbidden to enclose a photograph and instructed to avoid any information in the essay that might help identify their race or religion.
476
Living Together
Affimtiue Action in Higher Education
477
this is not closely matched enough. But at least let us move toward that
standard and see how it works. The present situation, with black stu-
dents averaging well over a full standard deviation below the white
mean, sometimes approaching two standard deviations, is so far out of
line with any plausible rationale that universities today cannot publish
the data on their admitted students and hope to persuade the public (or
specialists in education) that their policies are reasonable.
Would an end to aggressive affirmative action mean that minorities
who can profit from a genuine college education will find the door of
opportunity closed to them? There is no reason to think so. On the con-
trary, we urge that people examine more closely an ignored, brief era in
American university life-from
the mid-1950s to the mid-1960s. Si-
multaneously, the civil rights movement was gaining momentum, white
upper-middle-class America was having its consciousness raised on the
subject of racial discrimination, and color-blindness was actively taken
as the ideal. At many colleges during that era, applicants were forbid-
den to enclose a photograph and instructed to avoid any information in
the essay that might help identify their race or religion. Whether ad-
missions committees were truly innocent of this information is another
question, but the intent was clear, and so was the result: Racial differ-
ences in qualifications during that time were minor, or so it appeared to
both of us at the time.
What were campus race relations like then? What were the attitudes
of the black students toward achievement? What was the performance
of black students relative to the predictions that might have been made
based on their high school performance? What were the dropout rates
of blacks relative to whites in the same institution? What were the sub-
sequent careers of black students from that era? How do black students
from that era, looking back, assess the pluses and minuses of the current
state of affairs versus their experience?
We must put such topics as questions because that era has been ig-
nored. We suggest this possibility: American universities once ap-
proached the ideal in their handling of race on the campus, and there
is no reason why they could not do so again.
Fewer blacks would be at Berkeley or Yale if there were no affirma-
tive action. But admitting half as many black students to Yale does not
mean that the rejected ones will not go to college; it just means that
they will not go to Yale. For some individuals who are not chosen, this
will be a loss, for others a blessing, but it is a far different choice from
"college" versus "no college." It is not even clear how much the goals of
diversity would be adversely affected for the system as a whole. If affir-
mative action in its present form were ended, the schools at the very
top would have smaller numbers of blacks and some other minorities on
their campuses, but many other schools in the next echelons would add
those students, even as they lost some of their former students to schools
further down the line. And at every level of school, the gap in cogni-
tive ability between minorities and whites would shrink.
Ending affirmative action as it is currently practiced will surely have
other effects. Affirmative action does in fact bring a significant number
of minority students onto campuses who would not otherwise be there.
Perhaps the overall percentage of some minorities who attend college
would drop. But their white counterparts at the same level of ability and
similar socioeconomic background are not in college now. To what ex-
tent is a society fair when people of similar ability and background are
treated as differently as they are now? In 1964, the answer would have
been unambiguous: Such a society is manifestly unfair. The logic was
right then, and right now.
Chapter 20
Affirmative Action in the
Workplace
Employers want to hire the best workers; employment tests are one of the best
and cheapest selection tools at their disposal. Since affirmative action began
in the early 1960s, and especially since a landmark decision by the Supreme
Court in 1971 , employers have been tightly constrained in the use they may
make of tests. The most common solution is for employers to use them but to
hire enough protected minorities to protect themselves from prosecution and
lawsuits under the job dism'mination rules.
The rules that constrain employers were developed by Congress and the
Supreme Court based on the assumptions that tests of general cognitive abil-
ity are not a good way of picking employees, that the best tests are ones that
measure specific job skills, that tests are biased against blacks and other mi-
norities, and that all groups have equal distributions of cognitive ability. These
msumptions are empirically incorrect. Paradoxically, job hiring and promo-
tion procedures that are truly fair and unbiased will produce the racial dis-
parities that public policy tries to prevent.
Have the job discrimination regulations worked? The scholarly consensus
is that they had some impact, on some kinds of jobs, in some settings, during
the 1960s and into the 1970s, but have not had the decisive impact that is
commonly asserted in political rhetoric. It also appears, however, that since
the early 1960s blacks have been overrepresented in white collar and profes-
sional occupations relative to the number of candidates in the IQ range from
which these jobs are usually filled, suggesting that the effects ofaffirmative ac-
tion policy may be greater than usually thought.
The successes of afirmative action have been much more extensively stud-
ied than the costs. One of the most understudied areas of this topic is job per-
formance. The scattered dam suggest that aggressive afirmative action does
produce large racial discrepancies in job performance in a given workplace. It
is time that this important area be explored systematically.
Affirmative Action in Employment
- Legal constraints since 1971 have forced employers to adopt hiring quotas to avoid discrimination lawsuits.
- The assumptions underlying these laws—that cognitive tests are biased or irrelevant—are empirically incorrect according to the authors.
- Affirmative action has led to an overrepresentation of minorities in professional roles relative to their IQ distribution.
- Aggressive affirmative action policies may result in significant racial discrepancies in job performance within the same workplace.
- The authors argue that current laws reduce economic efficiency and that racial discrimination in pay is negligible when controlling for IQ.
- Ending existing job discrimination laws is proposed to prevent ethnic balkanization and restore productivity.
Paradoxically, job hiring and promotion procedures that are truly fair and unbiased will produce the racial disparities that public policy tries to prevent.
Chapter 20
Affirmative Action in the
Workplace
Employers want to hire the best workers; employment tests are one of the best
and cheapest selection tools at their disposal. Since affirmative action began
in the early 1960s, and especially since a landmark decision by the Supreme
Court in 1971 , employers have been tightly constrained in the use they may
make of tests. The most common solution is for employers to use them but to
hire enough protected minorities to protect themselves from prosecution and
lawsuits under the job dism'mination rules.
The rules that constrain employers were developed by Congress and the
Supreme Court based on the assumptions that tests of general cognitive abil-
ity are not a good way of picking employees, that the best tests are ones that
measure specific job skills, that tests are biased against blacks and other mi-
norities, and that all groups have equal distributions of cognitive ability. These
msumptions are empirically incorrect. Paradoxically, job hiring and promo-
tion procedures that are truly fair and unbiased will produce the racial dis-
parities that public policy tries to prevent.
Have the job discrimination regulations worked? The scholarly consensus
is that they had some impact, on some kinds of jobs, in some settings, during
the 1960s and into the 1970s, but have not had the decisive impact that is
commonly asserted in political rhetoric. It also appears, however, that since
the early 1960s blacks have been overrepresented in white collar and profes-
sional occupations relative to the number of candidates in the IQ range from
which these jobs are usually filled, suggesting that the effects ofaffirmative ac-
tion policy may be greater than usually thought.
The successes of afirmative action have been much more extensively stud-
ied than the costs. One of the most understudied areas of this topic is job per-
formance. The scattered dam suggest that aggressive afirmative action does
produce large racial discrepancies in job performance in a given workplace. It
is time that this important area be explored systematically.
480
Living Together
Affirmative Action in the Workplace
481
In coming to grips with policy, a few hard truths have to be accepted. First,
there are no good ways to implement current job discrimination law without
incurring costs in economic efficiency and fairness to both employers and em-
ployees. Second, after controlling for IQ, it is hard to demonstrate that the
United States still suffers from a major problem of racial discrimination in oc-
cupations and pay.
As we did for affirmative action in higher education, we present the case
for returning to the original conception of affirmative action. This means
scrapping the existing edifice of job discrimination law. \Ve think the benefits
to productivity and to fairness of ending the antidiscrimination laws are sub-
stantial. But our larger reason is that this nation does not have the option of
ethnic balkanization.
ffirmative action in the workplace arose at the same time that it
A
d
id in the universities but with important differences. One differ-
ence is that in the workplace, the government and the courts have been
the main activists, forcing businesses into a variety of involuntary prac-
tices, whereas universities and colleges largely create their own policies
regarding student selection. Affirmative action policies in the work-
place have been more a matter of evolution than of coherent policy-
making. (Appendix 7 traces this evolution.) Universities and colleges
occasionally run afoul of affirmative action laws in their hiring and pro-
motion decisions, but in student admissions they are usually far ahead
of what has been legally required of them.
A second important difference is that almost everyone has a personal
stake, and can see what is going on, in the workplace, unlike on cam-
pus. In colleges, the applicant who does not get in because he was dis-
placed by an affirmative action admission never knows exactly why he
was rejected. In many workplaces, individuals can identify others who
are hired, fired, and promoted under the aegis of affirmative action, and
they tend to have strong opinions about the merits of each case. In many
workplaces, affirmative action decisions regarding a few people can af-
fect the daily life of tens or hundreds of people who work with them and
under them. College and university admission decisions have less ohvi-
ous immediate effects. These may be some of the reasons that few, if any,
points of friction in American society have been rubbed so raw as where
affirmative action operates in the workplace. The topic inflames rela-
tions between white elites (who generallv favor the ~olicies) and white
workers (many of whom feel victimized by them), between ethnic
groups, between the sexes, and between many citizens and their gov-
ernment.
The chapter is organized around several factual questions regarding
affirmative action in the workplace. We start with the facts because they
are pivotal to the arguments about affirmative action yet are often over-
looked or misconstrued. First, what are America's affirmative action
policies? Second, do they make sense, given the relevant data? Third,
what difference have they made? After reviewing the data on these is-
sues, we turn to some broader questions that the facts raise but cannot
altogether resolve. How should we think about the economic costs of
affirmative action in the workplace? Assuming that just about everyone
wants employment to be fair, what should "fairness" mean in the labor
market?
Throughout, we concentrate on the situation regarding blacks. Af-
firmative action has expanded to embrace many other groups, but this
policy came about because of an urgently felt national desire to redress
the plight of blacks, and the focal point of tension, intellectual and so-
cial, has been affirmative action for blacks ever since. Many of the points
we make about that story apply with modifications to other groups as
well. Our policy recommendations also apply generally.
THE FEDERAL GOVERNMENT'S REQUIREMENTS FOR
AFFIRMATIVE ACTION IN THE WORKPLACE
People apply for jobs. The employer hires some and not others. Later the
employer promotes some and not others. A n employer who appears to
have based hiring or promotion decisions on the person's being white (or
one of the other outlawed reasons) is in violation of the law. A pure heart
and good faith are not enough. If a rejected applicant or an unpromoted
employee brings a complaint, an employer must be able to prove that the
hiring and promotion processes meet legal definitions of fairness.
For some positions, employers may post job requirements and demon-
strate that the hired or promoted employees had the best qualifications.
But many jobs do not lend themselves to such case-by-case selection.
In these cases, how does the employer demonstrate that the chosen em-
ployees have been selected without illegal discrimination? The obvious
answer (or so it seemed in the beginning) is to use an objective job test
and hire applicants with the highest scores. Testing has therefore been
Affirmative Action in Workplaces
- Affirmative action in the workplace creates more immediate social friction than university admissions because it directly impacts daily professional hierarchies.
- The policy has created a significant divide between white elites who support the measures and white workers who often feel victimized by them.
- While affirmative action now covers various groups, its primary social and intellectual focus remains the historical redress of the plight of Black Americans.
- Employers face immense legal and financial risks if their hiring tests result in disparate outcomes for protected groups, regardless of the employer's intent.
- The legal landscape, shaped by the Civil Rights Acts and Supreme Court decisions like Griggs v. Duke Power Co., has forced employers to choose between abandoning testing or proving its absolute fairness.
Few, if any, points of friction in American society have been rubbed so raw as where affirmative action operates in the workplace.
480
Living Together
Affirmative Action in the Workplace
481
In coming to grips with policy, a few hard truths have to be accepted. First,
there are no good ways to implement current job discrimination law without
incurring costs in economic efficiency and fairness to both employers and em-
ployees. Second, after controlling for IQ, it is hard to demonstrate that the
United States still suffers from a major problem of racial discrimination in oc-
cupations and pay.
As we did for affirmative action in higher education, we present the case
for returning to the original conception of affirmative action. This means
scrapping the existing edifice of job discrimination law. \Ve think the benefits
to productivity and to fairness of ending the antidiscrimination laws are sub-
stantial. But our larger reason is that this nation does not have the option of
ethnic balkanization.
ffirmative action in the workplace arose at the same time that it
A
d
id in the universities but with important differences. One differ-
ence is that in the workplace, the government and the courts have been
the main activists, forcing businesses into a variety of involuntary prac-
tices, whereas universities and colleges largely create their own policies
regarding student selection. Affirmative action policies in the work-
place have been more a matter of evolution than of coherent policy-
making. (Appendix 7 traces this evolution.) Universities and colleges
occasionally run afoul of affirmative action laws in their hiring and pro-
motion decisions, but in student admissions they are usually far ahead
of what has been legally required of them.
A second important difference is that almost everyone has a personal
stake, and can see what is going on, in the workplace, unlike on cam-
pus. In colleges, the applicant who does not get in because he was dis-
placed by an affirmative action admission never knows exactly why he
was rejected. In many workplaces, individuals can identify others who
are hired, fired, and promoted under the aegis of affirmative action, and
they tend to have strong opinions about the merits of each case. In many
workplaces, affirmative action decisions regarding a few people can af-
fect the daily life of tens or hundreds of people who work with them and
under them. College and university admission decisions have less ohvi-
ous immediate effects. These may be some of the reasons that few, if any,
points of friction in American society have been rubbed so raw as where
affirmative action operates in the workplace. The topic inflames rela-
tions between white elites (who generallv favor the ~olicies) and white
workers (many of whom feel victimized by them), between ethnic
groups, between the sexes, and between many citizens and their gov-
ernment.
The chapter is organized around several factual questions regarding
affirmative action in the workplace. We start with the facts because they
are pivotal to the arguments about affirmative action yet are often over-
looked or misconstrued. First, what are America's affirmative action
policies? Second, do they make sense, given the relevant data? Third,
what difference have they made? After reviewing the data on these is-
sues, we turn to some broader questions that the facts raise but cannot
altogether resolve. How should we think about the economic costs of
affirmative action in the workplace? Assuming that just about everyone
wants employment to be fair, what should "fairness" mean in the labor
market?
Throughout, we concentrate on the situation regarding blacks. Af-
firmative action has expanded to embrace many other groups, but this
policy came about because of an urgently felt national desire to redress
the plight of blacks, and the focal point of tension, intellectual and so-
cial, has been affirmative action for blacks ever since. Many of the points
we make about that story apply with modifications to other groups as
well. Our policy recommendations also apply generally.
THE FEDERAL GOVERNMENT'S REQUIREMENTS FOR
AFFIRMATIVE ACTION IN THE WORKPLACE
People apply for jobs. The employer hires some and not others. Later the
employer promotes some and not others. A n employer who appears to
have based hiring or promotion decisions on the person's being white (or
one of the other outlawed reasons) is in violation of the law. A pure heart
and good faith are not enough. If a rejected applicant or an unpromoted
employee brings a complaint, an employer must be able to prove that the
hiring and promotion processes meet legal definitions of fairness.
For some positions, employers may post job requirements and demon-
strate that the hired or promoted employees had the best qualifications.
But many jobs do not lend themselves to such case-by-case selection.
In these cases, how does the employer demonstrate that the chosen em-
ployees have been selected without illegal discrimination? The obvious
answer (or so it seemed in the beginning) is to use an objective job test
and hire applicants with the highest scores. Testing has therefore been
482
Living Together
Affirmative Action in the WorkpIace
483
at the center of the history of employment discrimination law, as it has
played out from the Civil Rights Act of 1964 to the Civil Rights Act of
1991. Here are some features of the prevailing situation facing employ-
ers, with variations and an interlude described in the appendix, since
the Supreme Court's landmark Griggs v. Duke Power Co. decision in
1971:
If an employer uses a test in the employment process and the results
of that test lead to different results for different protected groups (mainly
blacks, Latinos, and women) that employer faces the prospect of law-
suits, fines, and damages that could cost the company millions-per-
haps tens of millions--of dollars. Employers can protect themselves in
three ways.
First, they may decline to use tests. Nevertheless, they will still be
vulnerable if their alternative hiring process has disparate impact (the
legal phrase) on the hiring of different groups.
-
.
Second, they can try to construct a test that has an urgent economic
justification and a manifest, direct relationship with the skills required
by the job. A general ability test is always unacceptable. Usually off-the-
shelf tests of any kind will also be found unacceptable until they are val-
idated for the particular job in question
Third, an employer may meet the 80 percent rule. Created as part
of federal guidelines issued in 1978, the 80 percent rule says in effect
that people in the protected groups have to be hired or promoted at 80
percent or more of the rate enjoyed by the group with the highest rate
of success in being hired or promoted. Here is how it works in practice:
Suppose that the Acme Corporation uses a test for all its job appli-
cants. Let us say that 225 white males apply and 90 are hired. This hir-
ing rate of 40 percent is the benchmark against which the hiring of
other groups is measured. All other groups must be hired at a rate no
lower than 80 percent of the 40 percent hiring rate of white males,
which comes to 32 percent. If 150 white women apply and 50 are
- -
hired-33
percent-Acme
meets the hiring rate for women. Suppose
that 100 Latinos apply and 25 are hired. Now Acme is vulnerable to
discrimination suits by the rejected Latino applicants because its
hiring rate for Latinos is 25 percent, not 32 percent. It should hire at
least seven more Latinos, bringing the Latino percentage up to the
needed 3 2 .I"
Note that we have said nothing about how the test was used or even
what the comparative scores were. With the 80 percent rule, those con-
siderations are irrelevant. It makes no difference if the rejected male ap-
plicants had scores that were twice those of the successful women ap-
plicants: All that matters is the bottom line: the 80 percent criterion.
Less than 80 percent, and Acme is in trouble; more than 80 percent,
and the government will probably leave Acme alone. Just "probably,"
however. The 80 percent rule is a guideline, not a law, and there is no
guarantee that meeting it will head off litigation.'''
SOME FALSE FACTUAL ASSUMPTIONS BEHIND EMPLOYMENT
TESTING POLICY
Federal affirmative action policy toward employment testing is laden
with assumptions not about fairness but about what is true as a factual
matter. Specifically, Congress and the Supreme Court developed fed-
eral job discrimination policy on the assumptions that (1) tests of gen-
eral cognitive ability are not a good way of picking employees, (2) the
best tests are ones that measure specific job skills, (3) tests are biased
against blacks and other minorities, and (4) all groups have equal dis-
tributions of cognitive ability.
To varying degrees, these assumptions were defensible when they
were first voiced in the 1960s. Ethnic differences in test scores were
known to exist, hut many experts at that time still thought they reflected
test bias, or that the differences would melt away as educational oppor-
tunity for minorities improved. The predictive validity of tests for job
performance was poorly understood. But however understandable these
views were in the 1960s, public policy over the next twenty years suf-
fered from an increasingly severe case of psychometric lag. To summa-
rize the by-now solidly established empirical situation described in
Chapters 3 and 13:
Cognitive ability has an economically important relationship to
job productivity that applies across the range of jobs and the range
of abilities.
Cognitive ability tests are often the single most predictive method
of picking employees-more
predictive than grades, education, or
a job interview.
The predictive power of tests derives almost completely from their
measure of general cognitive ability, not measures of job-specific
skills.
The Mechanics of Hiring Compliance
- Employers must navigate the '80 percent rule' to avoid disparate impact lawsuits, ensuring minority hiring rates are at least 80% of the most successful group's rate.
- Under current guidelines, the actual test scores of applicants are often legally irrelevant compared to the final demographic 'bottom line' of hiring outcomes.
- To legally justify a test that has disparate impact, an employer must prove it has an urgent economic justification and a direct relationship to specific job skills.
- Federal employment policy is built on the assumption that general cognitive ability tests are poor predictors of job performance and are inherently biased.
- The text argues there is a 'psychometric lag' in policy, as empirical data suggests cognitive ability is actually the single most predictive factor for job productivity.
- While the 80 percent rule serves as a primary administrative guideline, meeting it does not provide a total legal guarantee against discrimination litigation.
It makes no difference if the rejected male applicants had scores that were twice those of the successful women applicants: All that matters is the bottom line: the 80 percent criterion.
482
Living Together
Affirmative Action in the WorkpIace
483
at the center of the history of employment discrimination law, as it has
played out from the Civil Rights Act of 1964 to the Civil Rights Act of
1991. Here are some features of the prevailing situation facing employ-
ers, with variations and an interlude described in the appendix, since
the Supreme Court's landmark Griggs v. Duke Power Co. decision in
1971:
If an employer uses a test in the employment process and the results
of that test lead to different results for different protected groups (mainly
blacks, Latinos, and women) that employer faces the prospect of law-
suits, fines, and damages that could cost the company millions-per-
haps tens of millions--of dollars. Employers can protect themselves in
three ways.
First, they may decline to use tests. Nevertheless, they will still be
vulnerable if their alternative hiring process has disparate impact (the
legal phrase) on the hiring of different groups.
-
.
Second, they can try to construct a test that has an urgent economic
justification and a manifest, direct relationship with the skills required
by the job. A general ability test is always unacceptable. Usually off-the-
shelf tests of any kind will also be found unacceptable until they are val-
idated for the particular job in question
Third, an employer may meet the 80 percent rule. Created as part
of federal guidelines issued in 1978, the 80 percent rule says in effect
that people in the protected groups have to be hired or promoted at 80
percent or more of the rate enjoyed by the group with the highest rate
of success in being hired or promoted. Here is how it works in practice:
Suppose that the Acme Corporation uses a test for all its job appli-
cants. Let us say that 225 white males apply and 90 are hired. This hir-
ing rate of 40 percent is the benchmark against which the hiring of
other groups is measured. All other groups must be hired at a rate no
lower than 80 percent of the 40 percent hiring rate of white males,
which comes to 32 percent. If 150 white women apply and 50 are
- -
hired-33
percent-Acme
meets the hiring rate for women. Suppose
that 100 Latinos apply and 25 are hired. Now Acme is vulnerable to
discrimination suits by the rejected Latino applicants because its
hiring rate for Latinos is 25 percent, not 32 percent. It should hire at
least seven more Latinos, bringing the Latino percentage up to the
needed 3 2 .I"
Note that we have said nothing about how the test was used or even
what the comparative scores were. With the 80 percent rule, those con-
siderations are irrelevant. It makes no difference if the rejected male ap-
plicants had scores that were twice those of the successful women ap-
plicants: All that matters is the bottom line: the 80 percent criterion.
Less than 80 percent, and Acme is in trouble; more than 80 percent,
and the government will probably leave Acme alone. Just "probably,"
however. The 80 percent rule is a guideline, not a law, and there is no
guarantee that meeting it will head off litigation.'''
SOME FALSE FACTUAL ASSUMPTIONS BEHIND EMPLOYMENT
TESTING POLICY
Federal affirmative action policy toward employment testing is laden
with assumptions not about fairness but about what is true as a factual
matter. Specifically, Congress and the Supreme Court developed fed-
eral job discrimination policy on the assumptions that (1) tests of gen-
eral cognitive ability are not a good way of picking employees, (2) the
best tests are ones that measure specific job skills, (3) tests are biased
against blacks and other minorities, and (4) all groups have equal dis-
tributions of cognitive ability.
To varying degrees, these assumptions were defensible when they
were first voiced in the 1960s. Ethnic differences in test scores were
known to exist, hut many experts at that time still thought they reflected
test bias, or that the differences would melt away as educational oppor-
tunity for minorities improved. The predictive validity of tests for job
performance was poorly understood. But however understandable these
views were in the 1960s, public policy over the next twenty years suf-
fered from an increasingly severe case of psychometric lag. To summa-
rize the by-now solidly established empirical situation described in
Chapters 3 and 13:
Cognitive ability has an economically important relationship to
job productivity that applies across the range of jobs and the range
of abilities.
Cognitive ability tests are often the single most predictive method
of picking employees-more
predictive than grades, education, or
a job interview.
The predictive power of tests derives almost completely from their
measure of general cognitive ability, not measures of job-specific
skills.
Affirmative Action and Cognitive Testing
- Cognitive ability tests are not biased against black applicants as predictors of job performance and may occasionally favor them.
- The legal and political assumptions regarding IQ and group differences are fundamentally at odds with empirical data.
- Truly fair hiring procedures based on merit often produce the exact ethnic disparities that public policy aims to eliminate.
- The government should discard scientifically invalid rhetoric about testing and instead defend affirmative action on authentic, defensible grounds.
- Some proponents are shifting toward advocating for equal employment outcomes rather than just equal opportunity.
- Economists remain divided on whether federal civil rights activity has been the primary driver of black economic progress since the 1960s.
The dilemma is that job hiring and promotion procedures that are truly fair and unbiased in the sense in which everyone used those terms in 1964 will produce the ethnic and group disparities that public policy so vigorously tries to prevent.
484
Living Together
Affirmative Action in the Workplace
485
Cognitive ability tests either are not biased against blacks as pre-
dictors of job performance, or in some cases are biased in favor of
blacks.
Different ethnic groups have substantially different distributions
of cognitive ability that are not explainable by cultural bias and
not easily altered by remedial steps.
What is true regarding jobs, IQ, and group differences in cognitive
ability is the opposite of what the courts, the Congress, and many oth-
ers have supposed the truth to be. The dilemma is that job hiring and
promotion procedures that are truly fair and unbiased in the sense in
which everyone used those terms in 1964 will produce the ethnic and
group disparities that public policy so vigorously tries to prevent. The
most valid hiring tests may have the largest disparate impact. As a first
step in coming to terms with affirmative action-however
one balances
the many other factors that make affirmative action desirable or unde-
sirable-the
government should scrap the invalid scientific assumptions
that undergird ~olicy and express policy in terms that are empirically
defensible.
This step need not mean scrapping affirmative action. It means
only discarding rhetoric about testing and affirmative action ("tests
aren't valid for minorities," "tests of general ability don't predict any-
thing worth knowing about job performance") that are not true
and instead defending affirmative action on whatever grounds can
be authentically defended. Some progress has been made on this front.
The Hartigan Committee's report on the General Aptitude Test
Battery' was a step in the right direction, for example, acknow-
ledging many of the key facts about tests while continuing to defend
affirmative action (though the basis for their defense is in itself open
to technical debate). A few other proponents of strong affirmative
action are becoming more forthright about what they are really
promoting-not
just equal opportunity but equal employment out-
comes despite unequal job performance.4 But these are exceptions to a
general public discussion of affirmative action that relies on inaccurate
and to some degree dishonest representations of the state of knowledge
about tests, employment, and competition among protected and un-
protected groups.
HAS AFFIRMATIVE ACTION WORKED?
The scholarly debate over the effects of antidiscrimination legislation
in the workplace has been lively, and this is a good time to summarize
where that debate stands. The answers are complicated, but scholars
have done much better than the public commentators on this score.
Version I: lgnoring Cognitive Ability
According to official statistics, wages for blacks have risen since the
1960s and more blacks have entered prestigious occupations. Most peo-
ple take for granted that these changes have happened to some impor-
tant degree because of antidiscrimination laws. Rut what may seem
obvious at first glance is not obvious upon further inspection. "Two
decades of research have failed to produce professional consensus on the
contribution of federal government civil rights activity to the economic
progress of black Americans," wrote economists James Heckman and
Brook Payner in 1989,~ and the situation has clarified only marginally
since then. The nature of the problem facing the analysts is illustrated
hy the figure below for two categories of white-collar jobs that affirma-
The uncertain effects of affirmative action in the workplace
Percentage of employed blacks
Griggs
25 -
1964 Civil
decision
Uniform
Rights Act
is handed
Guidelines
Sources: Bureau of Lahor Statistics 1983,1989; U.S. Department of Lahor 1991. Figures prior
to 1973, reported for "blacks and others," are adjusted pro-rata to the hlack-only population.
486
Living Together
Affirmative Action in the Workplace
487
tive action was supposed to open up for blacks.16' The vertical lines de-
marcate three landmarks in antidiscrimination law: the passage of the
Civil Rights Act of 1964 that outlawed job discrimination, the G r i ~ s
decision that put increased pressure on employers to hire the right num-
ber of minorities even if they were using consistent hiring practices, and
adoption of the Uniform Guidelines on Employee Selection Procedures
that established the 80 percent guideline (all described further in Ap-
pendix 7).
To see why the analysts have a complicated task, consider clerical
jobs (the gray line in the figure). The story here seems ohvious: From
1959 until the passage of the Civil Rights Act, improvement was slow.
Immediately after the act came a sudden increase in the percentage of
employed blacks who held clerical jobs; thereafter the percentage con-
tinued rising but at a slower rate. Furthermore, the gap between hlack
and white percentages for these jobs (not shown in this graph) also
closed-again,
faster for a while after 1964 than before. We might con-
clude that the Civil Rights Act itself was effective but that the two suh-
sequent landmarks in affirmative action policy were not, at least for
these jobs.
Now follow the black line in the above figure, representing profes-
sional and technical jobs. Its slope before 1964 was certainly no lower
than its slope after; if anything, the slope decreased after the act. Rl;~cks
were making progress before the act; afterward they weren't progressing
any faster in their movement into these high-status, high-paying t ~ c u -
pations. Trendlines for other job categories, not shown in the graph,
that were supposed to open up for blacks-managerial
and administra-
tive, sales, and craft workers-similarly
fail to register much of a gain
from the new policies. The clerical job category is the unusual case; it
is the only job category that shows a visible change in slope after 1964.
If evidence of success is to be found for affirmative action, it must be
disentangled from a web of other factors that seem to have been influ-
encing the employment of blacks."'
This is not to say that antidiscrimination law had no effect, only that
the effects on hiring and promotion are not simply demonstrated. Our
understanding of the impact of affirmative action policies, drawn from
a number of technical assessments that have not taken cognitive abil-
ity into account, may be summarized as follow^:^
Affirmative action policies had the expected effect in public bu-
reaucracies. Police and firefighters are the most conspicuous ex.
amples, but affirmative action also has demonstrably increased the
proportion of minorities throughout government bureaucracies,
from the federal level on down.9 At the federal level, the strongest
effects are at the clerical level and below. In cities with large mi-
nority populations, the effects are spread across a broader range of
government positions, with de facto quotas up to the highest lev-
els.
Among private companies, affirmative action has had some
effects, particularly in the South and among companies that do
business with the federal government. Some unknown fraction
of the increase in black employment by companies with govern-
ment contracts is balanced off by compensating declines in com-
panies without them.
In private industry in the South (where much of the most demon-
strable progress in private industry has been made), a complicated
mix of forces seems to have been at work: partly the Civil Rights
Act of 1964 and its aftermath, partly the repeal of Jim Crow laws
restricting job entry into certain industries, partly a broader break-
down of racial segregation, legal and otherwise."
Whatever effects affirmative action may have had during the
1960s and 1970s, they had become too small to measure by the
1980s and will probably continue to be small in the future, largely
for economic reasons.
The behavior of employers has certainly been affected by job dis-
crimination law. Every large company must maintain a bureau-
cracy to monitor compliance with federal regulations and to
defend against (or, commonly, settle out of court) lawsuits alleg-
ing discrimination. The amounts of time, money, and resources de-
voted to compliance are substantial.
In short, federal antidiscrimination efforts writ large-embracing all
the disparate events following on the rise of the civil rights movement
in the mid- 1950s-probably had a significant impact on black economic
progress. Job discrimination law in particular probably had a smaller but
significant effect for some blacks in some settings. No serious student of
Impact of Antidiscrimination Law
- Three major legal landmarks—the Civil Rights Act of 1964, the Griggs decision, and the Uniform Guidelines—shaped the landscape of antidiscrimination law.
- Data suggests the Civil Rights Act had a visible impact on black employment in clerical roles, but professional and technical job trends showed little change in slope after 1964.
- Affirmative action demonstrated its most significant and measurable successes within public bureaucracies, particularly in police, fire departments, and federal clerical roles.
- In the private sector, progress was most notable in the South and among federal contractors, though gains were often offset by declines in non-contracting firms.
- The effectiveness of these policies appeared to diminish by the 1980s, as the initial legal and social shifts reached a point of diminishing returns.
- Disentangling the specific success of affirmative action is difficult due to overlapping factors like the repeal of Jim Crow laws and broader social desegregation.
If evidence of success is to be found for affirmative action, it must be disentangled from a web of other factors that seem to have been influencing the employment of blacks.
486
Living Together
Affirmative Action in the Workplace
487
tive action was supposed to open up for blacks.16' The vertical lines de-
marcate three landmarks in antidiscrimination law: the passage of the
Civil Rights Act of 1964 that outlawed job discrimination, the G r i ~ s
decision that put increased pressure on employers to hire the right num-
ber of minorities even if they were using consistent hiring practices, and
adoption of the Uniform Guidelines on Employee Selection Procedures
that established the 80 percent guideline (all described further in Ap-
pendix 7).
To see why the analysts have a complicated task, consider clerical
jobs (the gray line in the figure). The story here seems ohvious: From
1959 until the passage of the Civil Rights Act, improvement was slow.
Immediately after the act came a sudden increase in the percentage of
employed blacks who held clerical jobs; thereafter the percentage con-
tinued rising but at a slower rate. Furthermore, the gap between hlack
and white percentages for these jobs (not shown in this graph) also
closed-again,
faster for a while after 1964 than before. We might con-
clude that the Civil Rights Act itself was effective but that the two suh-
sequent landmarks in affirmative action policy were not, at least for
these jobs.
Now follow the black line in the above figure, representing profes-
sional and technical jobs. Its slope before 1964 was certainly no lower
than its slope after; if anything, the slope decreased after the act. Rl;~cks
were making progress before the act; afterward they weren't progressing
any faster in their movement into these high-status, high-paying t ~ c u -
pations. Trendlines for other job categories, not shown in the graph,
that were supposed to open up for blacks-managerial
and administra-
tive, sales, and craft workers-similarly
fail to register much of a gain
from the new policies. The clerical job category is the unusual case; it
is the only job category that shows a visible change in slope after 1964.
If evidence of success is to be found for affirmative action, it must be
disentangled from a web of other factors that seem to have been influ-
encing the employment of blacks."'
This is not to say that antidiscrimination law had no effect, only that
the effects on hiring and promotion are not simply demonstrated. Our
understanding of the impact of affirmative action policies, drawn from
a number of technical assessments that have not taken cognitive abil-
ity into account, may be summarized as follow^:^
Affirmative action policies had the expected effect in public bu-
reaucracies. Police and firefighters are the most conspicuous ex.
amples, but affirmative action also has demonstrably increased the
proportion of minorities throughout government bureaucracies,
from the federal level on down.9 At the federal level, the strongest
effects are at the clerical level and below. In cities with large mi-
nority populations, the effects are spread across a broader range of
government positions, with de facto quotas up to the highest lev-
els.
Among private companies, affirmative action has had some
effects, particularly in the South and among companies that do
business with the federal government. Some unknown fraction
of the increase in black employment by companies with govern-
ment contracts is balanced off by compensating declines in com-
panies without them.
In private industry in the South (where much of the most demon-
strable progress in private industry has been made), a complicated
mix of forces seems to have been at work: partly the Civil Rights
Act of 1964 and its aftermath, partly the repeal of Jim Crow laws
restricting job entry into certain industries, partly a broader break-
down of racial segregation, legal and otherwise."
Whatever effects affirmative action may have had during the
1960s and 1970s, they had become too small to measure by the
1980s and will probably continue to be small in the future, largely
for economic reasons.
The behavior of employers has certainly been affected by job dis-
crimination law. Every large company must maintain a bureau-
cracy to monitor compliance with federal regulations and to
defend against (or, commonly, settle out of court) lawsuits alleg-
ing discrimination. The amounts of time, money, and resources de-
voted to compliance are substantial.
In short, federal antidiscrimination efforts writ large-embracing all
the disparate events following on the rise of the civil rights movement
in the mid- 1950s-probably had a significant impact on black economic
progress. Job discrimination law in particular probably had a smaller but
significant effect for some blacks in some settings. No serious student of
Affirmative Action and Cognitive Disparity
- Large corporations maintain extensive bureaucracies to ensure compliance with federal antidiscrimination laws and to manage legal risks.
- While civil rights efforts impacted black economic progress, scholars argue job discrimination laws had less impact than political rhetoric suggests.
- When controlling for IQ, data from the late 1980s indicates that blacks and whites in the NLSY earned essentially equal wages.
- A significant IQ gap exists between black and white employees within the same job categories, often exceeding one standard deviation.
- The data shows the IQ gap does not narrow for high-skill professions, suggesting that employers may be applying dual standards for different racial groups.
- The text hypothesizes that government pressure and the threat of negative publicity drive employers to adopt these dual hiring standards.
The most plausible explanation for the large gap toward the top of the table is that employers are using dual standards for black and white job applicants.
486
Living Together
Affirmative Action in the Workplace
487
tive action was supposed to open up for blacks.16' The vertical lines de-
marcate three landmarks in antidiscrimination law: the passage of the
Civil Rights Act of 1964 that outlawed job discrimination, the G r i ~ s
decision that put increased pressure on employers to hire the right num-
ber of minorities even if they were using consistent hiring practices, and
adoption of the Uniform Guidelines on Employee Selection Procedures
that established the 80 percent guideline (all described further in Ap-
pendix 7).
To see why the analysts have a complicated task, consider clerical
jobs (the gray line in the figure). The story here seems ohvious: From
1959 until the passage of the Civil Rights Act, improvement was slow.
Immediately after the act came a sudden increase in the percentage of
employed blacks who held clerical jobs; thereafter the percentage con-
tinued rising but at a slower rate. Furthermore, the gap between hlack
and white percentages for these jobs (not shown in this graph) also
closed-again,
faster for a while after 1964 than before. We might con-
clude that the Civil Rights Act itself was effective but that the two suh-
sequent landmarks in affirmative action policy were not, at least for
these jobs.
Now follow the black line in the above figure, representing profes-
sional and technical jobs. Its slope before 1964 was certainly no lower
than its slope after; if anything, the slope decreased after the act. Rl;~cks
were making progress before the act; afterward they weren't progressing
any faster in their movement into these high-status, high-paying t ~ c u -
pations. Trendlines for other job categories, not shown in the graph,
that were supposed to open up for blacks-managerial
and administra-
tive, sales, and craft workers-similarly
fail to register much of a gain
from the new policies. The clerical job category is the unusual case; it
is the only job category that shows a visible change in slope after 1964.
If evidence of success is to be found for affirmative action, it must be
disentangled from a web of other factors that seem to have been influ-
encing the employment of blacks."'
This is not to say that antidiscrimination law had no effect, only that
the effects on hiring and promotion are not simply demonstrated. Our
understanding of the impact of affirmative action policies, drawn from
a number of technical assessments that have not taken cognitive abil-
ity into account, may be summarized as follow^:^
Affirmative action policies had the expected effect in public bu-
reaucracies. Police and firefighters are the most conspicuous ex.
amples, but affirmative action also has demonstrably increased the
proportion of minorities throughout government bureaucracies,
from the federal level on down.9 At the federal level, the strongest
effects are at the clerical level and below. In cities with large mi-
nority populations, the effects are spread across a broader range of
government positions, with de facto quotas up to the highest lev-
els.
Among private companies, affirmative action has had some
effects, particularly in the South and among companies that do
business with the federal government. Some unknown fraction
of the increase in black employment by companies with govern-
ment contracts is balanced off by compensating declines in com-
panies without them.
In private industry in the South (where much of the most demon-
strable progress in private industry has been made), a complicated
mix of forces seems to have been at work: partly the Civil Rights
Act of 1964 and its aftermath, partly the repeal of Jim Crow laws
restricting job entry into certain industries, partly a broader break-
down of racial segregation, legal and otherwise."
Whatever effects affirmative action may have had during the
1960s and 1970s, they had become too small to measure by the
1980s and will probably continue to be small in the future, largely
for economic reasons.
The behavior of employers has certainly been affected by job dis-
crimination law. Every large company must maintain a bureau-
cracy to monitor compliance with federal regulations and to
defend against (or, commonly, settle out of court) lawsuits alleg-
ing discrimination. The amounts of time, money, and resources de-
voted to compliance are substantial.
In short, federal antidiscrimination efforts writ large-embracing all
the disparate events following on the rise of the civil rights movement
in the mid- 1950s-probably had a significant impact on black economic
progress. Job discrimination law in particular probably had a smaller but
significant effect for some blacks in some settings. No serious student of
488
Living Together
Affimtiwe Action in the Workphce
489
the topic argues that job discrimination law had the decisive impact that
is commonly attributed to it in political rhetoric.
Version II: When Cognitive Ability Is Taken into Account
We now pose a question of affirmative action that has not been asked
in the literature we just reviewed: How do the observed differences be-
tween blacks and whites in occupations and wages compare to those
that would be predicted from the observed black-white difference in the
distribution of cognitive ability? We presented the summary answer as
of the end of the 1980s in Chapter 14, when we showed that, after con-
trolling for IQ, a higher proportion of blacks than whites in the NLSY
are in the professions and that wages for blacks and whites are essen-
tially equal. Neither education nor socioeconomic background, ac-
counted as well as IQ for the differences in jobs or wages between blacks
and whites.
These findings may bear on the question of the impact of affirmative
action in the workplace. To see why, let us examine the mean IQs for
NLSY members in different job categories as of 1990, as shown in the
table below. In all job categories, from highest to lowest in skill, em-
ployers are hiring blacks who differ from whites in those jobs by one or
more standard deviations in IQ. Part of the reason may be that em-
ployers hire blacks and whites of differing cognitive ahility because of
The Black-White IQ Difference by Job Category, 1990
Black-White Difference,
Job Category
Mean White IQ
in Standard Deviations
Professions
114
1.3
Managerial
108
1.1
Technical
113
1.5
Sales
106
1.4
Clerical
104
1.1
Protective services
103
1.4
Other service jobs
97
1.4
Craft
99
1.1
Low-skill labor
96
1.1
the pressures brought on them by government policies regarding the rep-
resentation of minority groups. Without such pressures and in a race-
hlind labor market, blacks and whites should be equal in those traits that
best predict performance on the job. From the kinds of data reviewed
in Chapter 3, we know that cognitive ability is such a trait-the
more
so, the greater the skills are involved in the job. Consequently, we should
expect the IQ gap between whites and blacks to be the narrowest for
high-skill jobs if hiring is race blind.
We may draw this conclus~on without knowing whether an employer
administers cognitive tests to job cand~dates or even thinks consciously
about cognitive ability when hiring. The relationship of cognitive abil-
ity to job productivity exists independent of the existence of test scores,
and a11 hiring practices that succeed in choosing productive workers will
tend to select employees with only small group differences in intelli-
gence for occupations in which IQ is most important. The table above
shows no such narrowing for the cognitively demanding jobs. If any-
thing the gap widens toward the top of the table.
The most
explanation for the large gap toward the top of
the tahle is that employers are using dual standards for black and white
job applicants. Moreover, we venture the hypothesis that employers are
using dual standards at least in part because someone or something (the
government or an aversion to harmful publicity) is making them do so-
hence our conclusion that affirmative action is probably having a more
substantial impact on hiring practices than the standard analyses indi-
cate.
This also leads to a reinterpretation of the graph on page 485 for
clerical and professional and technical jobs. We pointed out that the
trendlines for black employees did not get steeper, with the single ex-
ception of clerical jobs, after the Civil Rights Act was passed. Now we
are suggesting an alternative perspective: The fact that the trendlines
continued to go up as long as they did is in itself evidence of the impact
of affirmative action. Without affirmative action, the trendlines would
have leveled off sooner, perhaps at the point at which blacks and whites
of equal IQ had equal chances of employment in high-status jobs. In the
next figure, we adjust the hiring proportions for the known difference
in IQ between whites and blacks.["' For professional and technical jobs,
the assumption is that employees are normally drawn from people with
Affirmative Action and IQ
- Standard analyses may underestimate the impact of affirmative action on hiring practices for clerical and professional roles.
- The authors argue that the continued upward trend of black employment in high-status jobs is itself evidence of affirmative action's efficacy.
- When adjusting for IQ distributions, the data suggests that black candidates are hired at higher rates than white candidates within the same IQ ranges.
- The ratio of black-to-white hiring in professional jobs rose above parity in the early 1960s and continued to climb through the late 1980s.
- The authors conclude that these trends persist across various statistical assumptions regarding the IQ requirements for specific job categories.
In both categories of employment, blacks have been hired at higher rates than whites of equal IQ since the late 1960s, and the upward trend lasted at least until the late 1980s.
488
Living Together
Affimtiwe Action in the Workphce
489
the topic argues that job discrimination law had the decisive impact that
is commonly attributed to it in political rhetoric.
Version II: When Cognitive Ability Is Taken into Account
We now pose a question of affirmative action that has not been asked
in the literature we just reviewed: How do the observed differences be-
tween blacks and whites in occupations and wages compare to those
that would be predicted from the observed black-white difference in the
distribution of cognitive ability? We presented the summary answer as
of the end of the 1980s in Chapter 14, when we showed that, after con-
trolling for IQ, a higher proportion of blacks than whites in the NLSY
are in the professions and that wages for blacks and whites are essen-
tially equal. Neither education nor socioeconomic background, ac-
counted as well as IQ for the differences in jobs or wages between blacks
and whites.
These findings may bear on the question of the impact of affirmative
action in the workplace. To see why, let us examine the mean IQs for
NLSY members in different job categories as of 1990, as shown in the
table below. In all job categories, from highest to lowest in skill, em-
ployers are hiring blacks who differ from whites in those jobs by one or
more standard deviations in IQ. Part of the reason may be that em-
ployers hire blacks and whites of differing cognitive ahility because of
The Black-White IQ Difference by Job Category, 1990
Black-White Difference,
Job Category
Mean White IQ
in Standard Deviations
Professions
114
1.3
Managerial
108
1.1
Technical
113
1.5
Sales
106
1.4
Clerical
104
1.1
Protective services
103
1.4
Other service jobs
97
1.4
Craft
99
1.1
Low-skill labor
96
1.1
the pressures brought on them by government policies regarding the rep-
resentation of minority groups. Without such pressures and in a race-
hlind labor market, blacks and whites should be equal in those traits that
best predict performance on the job. From the kinds of data reviewed
in Chapter 3, we know that cognitive ability is such a trait-the
more
so, the greater the skills are involved in the job. Consequently, we should
expect the IQ gap between whites and blacks to be the narrowest for
high-skill jobs if hiring is race blind.
We may draw this conclus~on without knowing whether an employer
administers cognitive tests to job cand~dates or even thinks consciously
about cognitive ability when hiring. The relationship of cognitive abil-
ity to job productivity exists independent of the existence of test scores,
and a11 hiring practices that succeed in choosing productive workers will
tend to select employees with only small group differences in intelli-
gence for occupations in which IQ is most important. The table above
shows no such narrowing for the cognitively demanding jobs. If any-
thing the gap widens toward the top of the table.
The most
explanation for the large gap toward the top of
the tahle is that employers are using dual standards for black and white
job applicants. Moreover, we venture the hypothesis that employers are
using dual standards at least in part because someone or something (the
government or an aversion to harmful publicity) is making them do so-
hence our conclusion that affirmative action is probably having a more
substantial impact on hiring practices than the standard analyses indi-
cate.
This also leads to a reinterpretation of the graph on page 485 for
clerical and professional and technical jobs. We pointed out that the
trendlines for black employees did not get steeper, with the single ex-
ception of clerical jobs, after the Civil Rights Act was passed. Now we
are suggesting an alternative perspective: The fact that the trendlines
continued to go up as long as they did is in itself evidence of the impact
of affirmative action. Without affirmative action, the trendlines would
have leveled off sooner, perhaps at the point at which blacks and whites
of equal IQ had equal chances of employment in high-status jobs. In the
next figure, we adjust the hiring proportions for the known difference
in IQ between whites and blacks.["' For professional and technical jobs,
the assumption is that employees are normally drawn from people with
490
Living Together
Affirmative Action in the Workplace
491
IQs of 98 or higher; for clerical jobs, the assumption is that they are
drawn from within the range of 86 to 123.'12' The results are shown in
the figure below.
A revised view of equal employment opportunity after
correcting for ethnic differences in the IQ distributions
Blacklwhite ratio (l=equality)a
1964 Civil
Griggs
Unqorm
Professional &
Rights Act
decision is
Guidelines
terhniral i n h c
.vu .....
C'.
J"""
2 -
passes
handed down
are adopted
1
Source: Bureau of Labor Statistics 1983, 1989; U.S. Department of Lahor
1991.
m
e
ratio represents blacks employed in a given c~cupational gnwping ex-
pressed as a percentage of eligible blacks, divided hy the whites employed in
the same occupational gouping expressed as a percentage of eliaihle whites.
The number of eligibles is determined by the size of the working-age popula-
tion in that race who fall within the IQ range for that occupation, as calcu-
lated from a table of normal probabilities. The assumptions for computing
the ratio are: (1) the 1Q range for professional and technical jobs is 98 and
higher; (2) the IQ range for clerical johs is 86-123; (3) IQ is normally dis-
tributed with a mean of 85 for blacks and 100 for nonhlacks, with a standard
deviation of 15 for both groups.
What "should" the lines look like? If the assumptions in drawing them
were accurate, then both lines should have risen to 1 (to signify that
blacks and whites in the same IQ range are hired at the same rate) af-
ter the antidiscrimination laws were passed and then hovered near 1
thereafter. Anything above 1.0 signifies a higher likelihood for blacks
of being hired, once IQ is held constant; below 1.0, the opposite is true.
The proportion of blacks in professional and technical jobs rose above
1 in the early 1960s, flattened after the Civil Rights Act of 1964, took
another steep jump after Griggs, and then settled into a gradual rise
through the late 1980s. For clerical johs, progress after 1964 led to par-
ity in the late 1960s. The relative proportion of hlacks in clerical jobs
then continued to increase at a slower but more nearly linear pace since
then. In both categories of employment, blacks have been hired at
higher rates than whites of equal IQ since the late 1960s, and the up-
ward trend lasted at least until the late 1980s.
Since these job categories do not have precisely defined IQ ranges,
it may be asked what would happen if the assumptions were changed.
Some of the alternatives we tried are described in the note to this para-
graph. The short answer is that the picture stays essentially the same
within any reasonable range of assumptions. The overall conclusion is
that hlacks have for some years had more people working in both cler-
~cal johs and professional and technical jobs than would ordinarily be
expected, given the 1Q range from which those jobs are usually filled.['''
The figure above uses broad guidelines ahout the IQ range from which
certain jobs are held and applies them to national data ahout occupa-
tions. For a narrower focus, the NLSY supplies data about specific indi-
viduals, their occupations, and IQs."~'
In 1990, using the same definition
of "professional and technical occupations," and after controlling for IQ
(set at 113, the mean IQ for whites in such occupations), the propor-
tion of hlacks in the NLSY employed in professional and technical oc-
cupations was 1.5 times the proportion for whites, compared to the ratio
of 1.7 shown for 1990 in the graph. For clerical jobs, after controlling
for age and IQ (with IQ set at 103, the mean value for whites holding
clerical jobs), a black in the NLSY was 1.9 times more likely than a
white to be employed in a clerical job, compared to the figure of 1.6 for
1990 as shown In the graph.l'5'~he
conclusion drawn from national sta-
tistics is thus confirmed by the individual data in the NLSY.
Several points may be drawn from this exercise. First, it highlights
the reality and magnitude of the discrimination suffered by blacks prior
to the civil rights movement. As recently as 1959, the employment of
blacks in clerical and professional and technical jobs was only half the
proportion that would have been expected from recruitment to those
jobs based on IQ alone. Decennial census data (not to mention living
IQ and Occupational Representation
- Analysis of NLSY data suggests that when controlling for IQ, Black representation in professional and clerical roles exceeds that of whites.
- Historical data from 1959 reveals significant discrimination, with Black employment in high-level roles at only half the rate expected based on IQ.
- The occupational gap between races, when adjusted for cognitive ability, was largely closed by 1964, prior to the passage of the Civil Rights Act.
- The author suggests that current high levels of Black representation in IQ-correlated fields are likely driven by affirmative action policies.
- A tension exists between affirmative action goals and the established correlation between cognitive ability and job performance.
- The text introduces an investigation into the potential costs of affirmative action, specifically regarding teacher competency and job performance.
If cognitive ability is taken into account, the underrepresentation of blacks in professional and technical jobs was gone by 1964, prior to the Civil Rights Act.
490
Living Together
Affirmative Action in the Workplace
491
IQs of 98 or higher; for clerical jobs, the assumption is that they are
drawn from within the range of 86 to 123.'12' The results are shown in
the figure below.
A revised view of equal employment opportunity after
correcting for ethnic differences in the IQ distributions
Blacklwhite ratio (l=equality)a
1964 Civil
Griggs
Unqorm
Professional &
Rights Act
decision is
Guidelines
terhniral i n h c
.vu .....
C'.
J"""
2 -
passes
handed down
are adopted
1
Source: Bureau of Labor Statistics 1983, 1989; U.S. Department of Lahor
1991.
m
e
ratio represents blacks employed in a given c~cupational gnwping ex-
pressed as a percentage of eligible blacks, divided hy the whites employed in
the same occupational gouping expressed as a percentage of eliaihle whites.
The number of eligibles is determined by the size of the working-age popula-
tion in that race who fall within the IQ range for that occupation, as calcu-
lated from a table of normal probabilities. The assumptions for computing
the ratio are: (1) the 1Q range for professional and technical jobs is 98 and
higher; (2) the IQ range for clerical johs is 86-123; (3) IQ is normally dis-
tributed with a mean of 85 for blacks and 100 for nonhlacks, with a standard
deviation of 15 for both groups.
What "should" the lines look like? If the assumptions in drawing them
were accurate, then both lines should have risen to 1 (to signify that
blacks and whites in the same IQ range are hired at the same rate) af-
ter the antidiscrimination laws were passed and then hovered near 1
thereafter. Anything above 1.0 signifies a higher likelihood for blacks
of being hired, once IQ is held constant; below 1.0, the opposite is true.
The proportion of blacks in professional and technical jobs rose above
1 in the early 1960s, flattened after the Civil Rights Act of 1964, took
another steep jump after Griggs, and then settled into a gradual rise
through the late 1980s. For clerical johs, progress after 1964 led to par-
ity in the late 1960s. The relative proportion of hlacks in clerical jobs
then continued to increase at a slower but more nearly linear pace since
then. In both categories of employment, blacks have been hired at
higher rates than whites of equal IQ since the late 1960s, and the up-
ward trend lasted at least until the late 1980s.
Since these job categories do not have precisely defined IQ ranges,
it may be asked what would happen if the assumptions were changed.
Some of the alternatives we tried are described in the note to this para-
graph. The short answer is that the picture stays essentially the same
within any reasonable range of assumptions. The overall conclusion is
that hlacks have for some years had more people working in both cler-
~cal johs and professional and technical jobs than would ordinarily be
expected, given the 1Q range from which those jobs are usually filled.['''
The figure above uses broad guidelines ahout the IQ range from which
certain jobs are held and applies them to national data ahout occupa-
tions. For a narrower focus, the NLSY supplies data about specific indi-
viduals, their occupations, and IQs."~'
In 1990, using the same definition
of "professional and technical occupations," and after controlling for IQ
(set at 113, the mean IQ for whites in such occupations), the propor-
tion of hlacks in the NLSY employed in professional and technical oc-
cupations was 1.5 times the proportion for whites, compared to the ratio
of 1.7 shown for 1990 in the graph. For clerical jobs, after controlling
for age and IQ (with IQ set at 103, the mean value for whites holding
clerical jobs), a black in the NLSY was 1.9 times more likely than a
white to be employed in a clerical job, compared to the figure of 1.6 for
1990 as shown In the graph.l'5'~he
conclusion drawn from national sta-
tistics is thus confirmed by the individual data in the NLSY.
Several points may be drawn from this exercise. First, it highlights
the reality and magnitude of the discrimination suffered by blacks prior
to the civil rights movement. As recently as 1959, the employment of
blacks in clerical and professional and technical jobs was only half the
proportion that would have been expected from recruitment to those
jobs based on IQ alone. Decennial census data (not to mention living
492
Living Together
Affirmative Action in the W 0 ~ k p k e 493
memory) tell us that this underrepresentation was still more severe in
the 1950s and 1940s.I6 There was a clear and large racial deficit to be
made up.
Second, the exercise shows how rapidly changes were made in the
1960s and early 1970s. Ifcognitive ability is taken into account, the un-
derrepresentation of blacks in professional and technical jobs was gone
by 1964, prior to the Civil Rights Act. This closing of the occupational
gap between blacks and whites, obscured by trendlines that do not com-
pensate for IQ differences, argues that something besides antidiscrimi-
nation legislation was already afoot in America, making the job market
less stacked against blacks.
Third, by the end of the 1960s, the job market had pressed beyond
the point of parity for blacks and whites, again after cognitive ability is
taken into account. One might argue that this merely proves that IQ is
not so important for job productivity after all--except that a large lit-
erature, already summarized, demonstrates beyond much doubt that IQ
is as predictive of job performance for blacks as for whites." We can only
surmise that the reason for attaining such high levels of hlack repre-
sentation, particularly in the occupations that most strongly correlate
with IQ, includes the impact of affirmative action policies. To that ex-
tent, if these affirmative action policies were changed, black employ-
ment in these occupations would fall. Would this be a return to
unfairness? We will return to this hard question after considering the
costs of affirmative action for job performance.
THE COSTS OF AFFIRMATIVE ACTION: JOB PERFORMANCE
Inasmuch as cognitive ability is related to job performance and as mi-
nority workers are entering professions with lower ability distributions
than whites, is there evidence of lower average performance for minor-
ity workers than for whites? Of all the many kinds of double-speak as-
sociated with affirmative action, this question points to one of the most
egregious. Private complaints about the incompetent affirmative-action
hiree are much more common than scholarly examination of the issue.
We may nonetheless present several cases bearing on job performance,
all telling similar stories for different occupations, using different kinds
of data.
Teacher Competency Examinations
The nationwide enthusiasm for teacher competency examinations in
the 1980s resulted in teacher testing programs in virtually all states by
the end of the decade.'' These competency tests are seldom job perfor-
mance tests as such, but rather a test of basic knowledge of reading, writ-
ing, and mathematics. Even so, teachers who score higher on the tests
have greater success with their students." The competency exams seem
to have had some generally beneficial effects, though the cutoffs are low
by the usual standards of what we expect teachers to kn~w.~"he pass
rates for whites typically exceed 80 percent and sometimes 90 percent.
Whatever your profession may he, think about the meaning of a test
that would "pass" aspirants to the profession who perform in the bot-
tom 20 percent. But having so low a cutoff for whites sharpens the ev-
idence of the disparity in black and white qualifications, as shown in
the following table.
Typical Results of State
Teacher Competency Examinations
Pass Rate
Implied
Whites
Blacks Difference in SDsa
California, 1983-1991
80%
35%
1.2
Pennsylvania, 1989
93
68
1 .O
New York, 1987
83
36
1.3
Georgia, 197fL1986
87
40
1.4
Sources: H . Collins, "Minority groups are still lagging on teacher exam,"
Philadelphia Inquirer, Aug. 5, 1989, p. Bl; T. Spofford, "Teacher test called
hiased," Albany 7imes Union, Nov. 20, 1987, p. Al; R. Davila, "State's
teacher test biased against minorities, lawsuit contends," Sacramento Bee,
Sept. 24, 1992, p. R8; "Minority teachers," Richmond News Lender, May 16,
1989, p. A14.
Vssumes a normal distribution and equal standard deviations in hoth
gr1>ups.
Teacher Competency and Affirmative Action
- Teacher competency tests focus on basic literacy and mathematics rather than advanced pedagogical theory or job performance.
- Despite low passing thresholds, significant racial disparities exist in pass rates, with white candidates consistently outperforming black candidates by over one standard deviation.
- Data from several states indicates that while white pass rates often exceed 80 percent, black pass rates frequently fall below 40 percent.
- The 'compensating skills fallacy' suggests that lower cognitive scores are offset by non-intellectual traits like the ability to inspire or listen.
- The author argues that there is no empirical evidence to suggest that candidates with lower test scores possess superior non-intellectual qualities.
- Affirmative action programs typically select the highest-scoring minority candidates without actually measuring or verifying these purported compensating skills.
The fallacy lies in assuming that people who have lower cognitive test scores will, on average, be better endowed in these other areas than people with higher scores.
492
Living Together
Affirmative Action in the W 0 ~ k p k e 493
memory) tell us that this underrepresentation was still more severe in
the 1950s and 1940s.I6 There was a clear and large racial deficit to be
made up.
Second, the exercise shows how rapidly changes were made in the
1960s and early 1970s. Ifcognitive ability is taken into account, the un-
derrepresentation of blacks in professional and technical jobs was gone
by 1964, prior to the Civil Rights Act. This closing of the occupational
gap between blacks and whites, obscured by trendlines that do not com-
pensate for IQ differences, argues that something besides antidiscrimi-
nation legislation was already afoot in America, making the job market
less stacked against blacks.
Third, by the end of the 1960s, the job market had pressed beyond
the point of parity for blacks and whites, again after cognitive ability is
taken into account. One might argue that this merely proves that IQ is
not so important for job productivity after all--except that a large lit-
erature, already summarized, demonstrates beyond much doubt that IQ
is as predictive of job performance for blacks as for whites." We can only
surmise that the reason for attaining such high levels of hlack repre-
sentation, particularly in the occupations that most strongly correlate
with IQ, includes the impact of affirmative action policies. To that ex-
tent, if these affirmative action policies were changed, black employ-
ment in these occupations would fall. Would this be a return to
unfairness? We will return to this hard question after considering the
costs of affirmative action for job performance.
THE COSTS OF AFFIRMATIVE ACTION: JOB PERFORMANCE
Inasmuch as cognitive ability is related to job performance and as mi-
nority workers are entering professions with lower ability distributions
than whites, is there evidence of lower average performance for minor-
ity workers than for whites? Of all the many kinds of double-speak as-
sociated with affirmative action, this question points to one of the most
egregious. Private complaints about the incompetent affirmative-action
hiree are much more common than scholarly examination of the issue.
We may nonetheless present several cases bearing on job performance,
all telling similar stories for different occupations, using different kinds
of data.
Teacher Competency Examinations
The nationwide enthusiasm for teacher competency examinations in
the 1980s resulted in teacher testing programs in virtually all states by
the end of the decade.'' These competency tests are seldom job perfor-
mance tests as such, but rather a test of basic knowledge of reading, writ-
ing, and mathematics. Even so, teachers who score higher on the tests
have greater success with their students." The competency exams seem
to have had some generally beneficial effects, though the cutoffs are low
by the usual standards of what we expect teachers to kn~w.~"he pass
rates for whites typically exceed 80 percent and sometimes 90 percent.
Whatever your profession may he, think about the meaning of a test
that would "pass" aspirants to the profession who perform in the bot-
tom 20 percent. But having so low a cutoff for whites sharpens the ev-
idence of the disparity in black and white qualifications, as shown in
the following table.
Typical Results of State
Teacher Competency Examinations
Pass Rate
Implied
Whites
Blacks Difference in SDsa
California, 1983-1991
80%
35%
1.2
Pennsylvania, 1989
93
68
1 .O
New York, 1987
83
36
1.3
Georgia, 197fL1986
87
40
1.4
Sources: H . Collins, "Minority groups are still lagging on teacher exam,"
Philadelphia Inquirer, Aug. 5, 1989, p. Bl; T. Spofford, "Teacher test called
hiased," Albany 7imes Union, Nov. 20, 1987, p. Al; R. Davila, "State's
teacher test biased against minorities, lawsuit contends," Sacramento Bee,
Sept. 24, 1992, p. R8; "Minority teachers," Richmond News Lender, May 16,
1989, p. A14.
Vssumes a normal distribution and equal standard deviations in hoth
gr1>ups.
494
Living Together
Affirmative Action in the Workphce
495
These are not cognitive ability scores or scores that are being used to
select people for further education but the scores achieved by people
who are heading into the nation's classrooms. According to the insti-
tutions that have graduated these applicants for teacher certification (in
some cases, the scores are for teachers already on the job), all of them
have met the requirements for a college degree, and they presumably
can read, write, and do basic math. The scores are on tests that make
no pretense to seek excellence but to weed out the most obviously un-
suited.[211
With differences ranging upwards of 1 standard deviation, the
inescapable conclusion is that a large gap separates black and white
teachers in basic skills.'22'
The Compensating Skills Fallacy
--
One of the most common arguments about the current practice of affir-
mative action might he called the compensating skills fallacy. It is com-
monly applied to any profession under discussion, but teachers provide an
especially good example. The argument goes like this:
There are many skills and qualities that go into being a good teacher hesidt.s
test scores. The ability to inspire confidence, to create an eagerness to kani, to
listen to children are all part of the wide repertoire of skills that 0)
into being a
good teacher that have nothing to do with the traits meaiured by a copitiue ahil-
icy or academic skik test.
The statement itself is correct. Most professions involve a number of
important nonintellectual attributes. The fallacy lies in assuming that peo-
ple who have lower cognitive test scores will, on average, be hetrer en-
dowed in these other areas than people with higher scores.
Suppose that the teacher competency exams consistecl of several parts,
each of which measured one of these nonintellectual skills. It would be
possible to defend hiring teachers with marginal grades on the intellecti~al
skills if these teachers were hired from the top of the list on the tests of the
other qualities. But the way affirmative action programs actually work,
these other qualities are not tested or compared. The minority candidate
with the best score on the test of intellectual qualities is selected. As for
the other qualities, not measured by the test, there is no reason to assume
that they are any higher than average.'"'
A Journalist's Account of the Washington , D . C . , Police Force
Because affirmative action has been practiced most aggressively in pub-
lic employment-police,
firefighters, social welfare agencies, depart-
ments of motor vehicles, and the like-they
are logical places to look
if indeed job performance has been compromised.24 The Washington,
D.C., Police Department is a case in point, as described by journalist
Tucker Carl~on.'~
In the mid-1970s, the Washington, D.C., Police Department
inst~lled a residency requirement for police. Washington's white popu-
lation is densely concentrated among white-collar and professional
groups, with no significant white working-class neighborhoods. The res-
idency requirement thereby severely restricted the pool of potential
white applicants. By 1982, 40 percent of the candidates who took the
police admissions test failed it, and the department was having a hard
time filling positions. A new test was introduced in 1985, normed to fa-
vor minority applicants. Standards in the police academy were lowered
to the point at which not one student flunked out of the training course
in 1983 (despite the lower cognitive ability of the candidates being ad-
mitted). In 1988, the academy abolished its final comprehensive pen-
cil-and-paper examination after 40 percent of graduating recruits failed
it. The former head of the Fraternal Order of Police and a veteran of
twenty-two years on the force reported that, at about that time, he be-
gan hearing "about people at the academy who could not read or
write."2h A former academy instructor says that "I saw people who were
practically illiterate. I've seen people diagnosed as borderline retarded
graduate from the police academy."z7
This degradation of intellectual requirements translates into police
performance on the street. For example, the paperwork that follows an
arrest has been a bane of police everywhere for many years, but when
police can do the work, it is mainly an inconvenience, not a barrier. A n
officer who cannot do the paperwork or who finds that it pushes the lim-
its of his abilities may forgo making arrests in marginal cases. The ar-
rests that are made are often botched. Between 1986 and 1990, about a
third of all the murder cases brought to the U.S. attorney's office in the
District were dismissed, historically an unusually high rate, often be-
cause the prosecutors were unable to make sense of the arrest reports.
Affirmative Action and Police Performance
- The Washington, D.C., Police Department implemented residency requirements and normed tests to favor minority applicants, leading to a significant drop in candidate quality.
- Academic standards at the police academy were systematically lowered or abolished, resulting in the graduation of recruits described as practically illiterate.
- Intellectual degradation in the force led to tangible street-level failures, such as the dismissal of one-third of murder cases due to incoherent arrest reports.
- Similar patterns were observed in Miami, where a major corruption scandal was linked to the relaxation of hiring standards mandated by affirmative action regulations.
- The text argues that aggressive affirmative action in public employment sectors like police and fire departments has compromised job performance and public safety.
I've seen people diagnosed as borderline retarded graduate from the police academy.
494
Living Together
Affirmative Action in the Workphce
495
These are not cognitive ability scores or scores that are being used to
select people for further education but the scores achieved by people
who are heading into the nation's classrooms. According to the insti-
tutions that have graduated these applicants for teacher certification (in
some cases, the scores are for teachers already on the job), all of them
have met the requirements for a college degree, and they presumably
can read, write, and do basic math. The scores are on tests that make
no pretense to seek excellence but to weed out the most obviously un-
suited.[211
With differences ranging upwards of 1 standard deviation, the
inescapable conclusion is that a large gap separates black and white
teachers in basic skills.'22'
The Compensating Skills Fallacy
--
One of the most common arguments about the current practice of affir-
mative action might he called the compensating skills fallacy. It is com-
monly applied to any profession under discussion, but teachers provide an
especially good example. The argument goes like this:
There are many skills and qualities that go into being a good teacher hesidt.s
test scores. The ability to inspire confidence, to create an eagerness to kani, to
listen to children are all part of the wide repertoire of skills that 0)
into being a
good teacher that have nothing to do with the traits meaiured by a copitiue ahil-
icy or academic skik test.
The statement itself is correct. Most professions involve a number of
important nonintellectual attributes. The fallacy lies in assuming that peo-
ple who have lower cognitive test scores will, on average, be hetrer en-
dowed in these other areas than people with higher scores.
Suppose that the teacher competency exams consistecl of several parts,
each of which measured one of these nonintellectual skills. It would be
possible to defend hiring teachers with marginal grades on the intellecti~al
skills if these teachers were hired from the top of the list on the tests of the
other qualities. But the way affirmative action programs actually work,
these other qualities are not tested or compared. The minority candidate
with the best score on the test of intellectual qualities is selected. As for
the other qualities, not measured by the test, there is no reason to assume
that they are any higher than average.'"'
A Journalist's Account of the Washington , D . C . , Police Force
Because affirmative action has been practiced most aggressively in pub-
lic employment-police,
firefighters, social welfare agencies, depart-
ments of motor vehicles, and the like-they
are logical places to look
if indeed job performance has been compromised.24 The Washington,
D.C., Police Department is a case in point, as described by journalist
Tucker Carl~on.'~
In the mid-1970s, the Washington, D.C., Police Department
inst~lled a residency requirement for police. Washington's white popu-
lation is densely concentrated among white-collar and professional
groups, with no significant white working-class neighborhoods. The res-
idency requirement thereby severely restricted the pool of potential
white applicants. By 1982, 40 percent of the candidates who took the
police admissions test failed it, and the department was having a hard
time filling positions. A new test was introduced in 1985, normed to fa-
vor minority applicants. Standards in the police academy were lowered
to the point at which not one student flunked out of the training course
in 1983 (despite the lower cognitive ability of the candidates being ad-
mitted). In 1988, the academy abolished its final comprehensive pen-
cil-and-paper examination after 40 percent of graduating recruits failed
it. The former head of the Fraternal Order of Police and a veteran of
twenty-two years on the force reported that, at about that time, he be-
gan hearing "about people at the academy who could not read or
write."2h A former academy instructor says that "I saw people who were
practically illiterate. I've seen people diagnosed as borderline retarded
graduate from the police academy."z7
This degradation of intellectual requirements translates into police
performance on the street. For example, the paperwork that follows an
arrest has been a bane of police everywhere for many years, but when
police can do the work, it is mainly an inconvenience, not a barrier. A n
officer who cannot do the paperwork or who finds that it pushes the lim-
its of his abilities may forgo making arrests in marginal cases. The ar-
rests that are made are often botched. Between 1986 and 1990, about a
third of all the murder cases brought to the U.S. attorney's office in the
District were dismissed, historically an unusually high rate, often be-
cause the prosecutors were unable to make sense of the arrest reports.
496
Living Together
Affirmative Action in the Workplace
497
The basic features of Carlson's account are confirmed by a variety of
other journalistic accounts, most conspicuously a 1993 investigative se-
ries by the Washington Post on police perf~rrnance.'~
Two facts about the
Washington Police Department seem clear: Recruitment and training
standards deteriorated markedly in recent decades, and the performance
of the department, once considered a national model, has also deterio-
rated badly.
Washington is not unique. In Miami in 1985, the police department
was rocked by the discovery and seizure of hundreds of pounds of co-
caine hidden by police officers working in cahoots with smugglers. We
have the results of the intense self-examination that resulted. The main
conclusion was that this crime, as well as the many others that were
straining community~police relations at the time, could he traced in part
to the relaxation of hiring standards mandated hy affirmative action reg-
ulations. Almost 90 percent of the officers who were dismissed cjr sus.
pended within a few years of the initiation of aggressive affirmative
action policies at the beginning of the 1980s were officers with marginal
qualifications, hired because of those policies.2'
Such stories are common among people who have worked in, or been
a client of, organizations that practice aggressive affirmative action, and
the link they ascribe to affirmative action is usually explicit and em-
phati~."~'
There is a great deal of smoke emanating from such accounts.
We urge that people start checking out whether there is any fire.
A Scholarly Analysis of an Affirmutive Action Program
for Blue-Collar Jobs
Economist Eugene Silberberg systematically compared the experience
of blacks who were admitted to craft unions (electricians, plumbers, and
pipefitters) in Seattle at the end of the 1970s under a court order and
whites who were admitted under ordinary selection procedures at the
same time.)' Silberberg assembled data on performance in apprentice
school, on-the-job ratings, and educational background, then was given
access to a variety of job performance measures over an eighteen-month
follow-up period: hours worked, number of employees who quit, jobs
turned down, failures to respond to a dispatch, and being listed by an
employer as not eligible for rehire. The table below shows the combined
differences, expressed in standard deviations, for the pipefitters and
plumbers.
Job Performance of Black Affirmative Action Plumbers
and Pipefitters Compared to White Regular Hirees
Black-White Difference in SDs
Job performance measures
Quits or no rehire
+.6
Termination for cause
+.5
Nonresponse to job call
+.6
Hours worked
-.9
IQ-related measures
GPA in apprentice school
-1.3
GPA in on-the-job training
-.8
Sou~ce: Silberherg 1985, Tahle 2.
Note: The table combines data on apprentices and journeyman for both
crafts using weighted standard deviations.
Comparing the blacks admitted under the court order with whites
admitted under the ordinary procedures at the same time, the blacks
quit at more than six times the rate for whites, were terminated for cause
at more than three times the rate for whites, and did not respond to a
job dispatch at more than six times the rate for whites. Similar results
were obtained for the electricians. The results track closely with the
larger literature on IQ and job productivity. The differences in the job
performance measures are what might be expected from the discussion
in Chapter 3. Furthermore, the size of the difference in job performance
is economically important. Silberherg discusses the possibility that the
differences are themselves a result of bias among the dispatchers and su-
pervisors. Given the procedures for assigning jobs in the Seattle unions,
he concludes that it is extremely difficult to explain away the differences
in such terms.'32'
Having reviewed the less than plentiful data at hand about ethnic dif-
ferences in job performance, we are reminded of a passage by Andrew
Hacker, one of the stoutly "pro" voices in the affirmative action debate:
A favorite question of affirmative action's opponents is whether
you would want to be operated on by a surgeon who had been ad-
mitted to medical school under a racial dispensation. As it happens,
few posing this kind of question have any knowledge of what makes
Affirmative Action and Job Performance
- Economist Eugene Silberberg analyzed the performance of black craft union workers admitted under court orders versus white workers hired through standard procedures.
- The study found significant disparities in job performance metrics, including higher rates of quitting, termination for cause, and nonresponse to job calls among the affirmative action group.
- Performance gaps in apprentice school GPA and on-the-job training correlated with broader literature regarding IQ and workplace productivity.
- While some attribute these differences to supervisor bias, Silberberg argues the union's assignment procedures make bias an unlikely primary explanation.
- The authors critique the lack of hard data in the affirmative action debate, calling for more rigorous empirical studies similar to Silberberg’s analysis.
- The text suggests that the effects of affirmative action on job performance are likely large and pervasive, despite a general lack of public data.
There is a great deal of smoke emanating from such accounts. We urge that people start checking out whether there is any fire.
496
Living Together
Affirmative Action in the Workplace
497
The basic features of Carlson's account are confirmed by a variety of
other journalistic accounts, most conspicuously a 1993 investigative se-
ries by the Washington Post on police perf~rrnance.'~
Two facts about the
Washington Police Department seem clear: Recruitment and training
standards deteriorated markedly in recent decades, and the performance
of the department, once considered a national model, has also deterio-
rated badly.
Washington is not unique. In Miami in 1985, the police department
was rocked by the discovery and seizure of hundreds of pounds of co-
caine hidden by police officers working in cahoots with smugglers. We
have the results of the intense self-examination that resulted. The main
conclusion was that this crime, as well as the many others that were
straining community~police relations at the time, could he traced in part
to the relaxation of hiring standards mandated hy affirmative action reg-
ulations. Almost 90 percent of the officers who were dismissed cjr sus.
pended within a few years of the initiation of aggressive affirmative
action policies at the beginning of the 1980s were officers with marginal
qualifications, hired because of those policies.2'
Such stories are common among people who have worked in, or been
a client of, organizations that practice aggressive affirmative action, and
the link they ascribe to affirmative action is usually explicit and em-
phati~."~'
There is a great deal of smoke emanating from such accounts.
We urge that people start checking out whether there is any fire.
A Scholarly Analysis of an Affirmutive Action Program
for Blue-Collar Jobs
Economist Eugene Silberberg systematically compared the experience
of blacks who were admitted to craft unions (electricians, plumbers, and
pipefitters) in Seattle at the end of the 1970s under a court order and
whites who were admitted under ordinary selection procedures at the
same time.)' Silberberg assembled data on performance in apprentice
school, on-the-job ratings, and educational background, then was given
access to a variety of job performance measures over an eighteen-month
follow-up period: hours worked, number of employees who quit, jobs
turned down, failures to respond to a dispatch, and being listed by an
employer as not eligible for rehire. The table below shows the combined
differences, expressed in standard deviations, for the pipefitters and
plumbers.
Job Performance of Black Affirmative Action Plumbers
and Pipefitters Compared to White Regular Hirees
Black-White Difference in SDs
Job performance measures
Quits or no rehire
+.6
Termination for cause
+.5
Nonresponse to job call
+.6
Hours worked
-.9
IQ-related measures
GPA in apprentice school
-1.3
GPA in on-the-job training
-.8
Sou~ce: Silberherg 1985, Tahle 2.
Note: The table combines data on apprentices and journeyman for both
crafts using weighted standard deviations.
Comparing the blacks admitted under the court order with whites
admitted under the ordinary procedures at the same time, the blacks
quit at more than six times the rate for whites, were terminated for cause
at more than three times the rate for whites, and did not respond to a
job dispatch at more than six times the rate for whites. Similar results
were obtained for the electricians. The results track closely with the
larger literature on IQ and job productivity. The differences in the job
performance measures are what might be expected from the discussion
in Chapter 3. Furthermore, the size of the difference in job performance
is economically important. Silberherg discusses the possibility that the
differences are themselves a result of bias among the dispatchers and su-
pervisors. Given the procedures for assigning jobs in the Seattle unions,
he concludes that it is extremely difficult to explain away the differences
in such terms.'32'
Having reviewed the less than plentiful data at hand about ethnic dif-
ferences in job performance, we are reminded of a passage by Andrew
Hacker, one of the stoutly "pro" voices in the affirmative action debate:
A favorite question of affirmative action's opponents is whether
you would want to be operated on by a surgeon who had been ad-
mitted to medical school under a racial dispensation. As it happens,
few posing this kind of question have any knowledge of what makes
498
Living Together
Affirmative Action in the Workplace
499
for surgical skill. In fact, there are no known correlations between
good grades or high scores and subsequent success with a scalpel. If
we mean to debate this subject seriously, we should rely on hard data
rather than scare tactic^.^'
We cannot agree with Hacker's characterization of the state of knowl-
edge, but we enthusiastically subscribe to his concludingsentence. By all
means, let people on all sides of this issue assemble hard data. The pur-
pose of the foregoing examples is to make two points: (1) the scattered
evidence about job performance and affirmative action-indirect
and
direct, soft and hard-suggests
large and pervasive effects, and (2) there
is no excuse for not having many more hard-data studies of the type that
Silberberg conducted. Job performance is important, it is measurable,
and the issue of affirmative action and its effects on job performance has
been on many people's minds for years. Many corporations routinely
conduct studies of job performance and have databases that could be re-
analyzed to assess the effects of affirmative action on job performance.
The request we make of Hacker and other proponents of affirmative
action is that they join us in encouraging such work. Confident that
group differences in job performance are not an important problem, they
can try to prove their case. Our own conclusion is that they cannot do
so. If this is so, the debate about affirmative action must shift to another
level: How much degradation of job performance is acceptable in pur-
suit of the other goals of affirmative action? And that in turn brings
us to first questions. What, after all, is the nation trying to accomplish
with affirmative action in the workplace? What are the right measures
of success?
A POLICY AGENDA
In thinking about affirmative action in the workplace, more than psy-
chometric realities or efficiency in the workplace must be considered.
To avoid misunderstanding, this is a good time to lay out our perspec-
tive on these other matters.
As of the 1950s, minorities, especially blacks, in many parts of the
country were systematically and unjustly excluded from entering
skilled and professional occupations of all kinds.
At least since the 1950s, changes in white attitudes, as expressed
in the civil rights movement and in myriad other events in race
relations, the removal of Jim Crow restrictions in the South, and
affirmative action requirements opened up opportunities for mi-
norities. Progress was made.
In the 1990s, racial hostility continues to be a significant problem
in American life.
Affirmative action has an internally consistent rationale even if it
is at odds with the maximum efficiency in hiring productive work-
ers.
This last remark calls for some elaboration. Suppose, for the sake of
argument, that we are sure that a history of unfair discrimination has
handicapped some people so that they fare less well in the job market
than they otherwise would. Their handicaps may handicap their de-
scendants, so that past unfairness is propagated indefinitely into the
future, unless we do something about it. A properly constructed affir-
mative action policy may then be temporarily less efficient but more ef-
ficient in the long run. If it achieves long-run efficiency by breaking the
cycle of past discrimination, it is arguably fair. And even if the long run
is indefinitely far off, many people are willing to pay some price in lost
productivity for a large enough gain in group equality.
Or suppose that we knew that the inequality in employment that we
observe arises for reasons we consider inherently unfair. Perhaps blacks
are, for example, not being hired to be shop clerks in neighborhoods be-
cause the customers (or the other workers) are big~ted."~'
It may be ef-
ficient to hire fewer clerks who will he discriminated against, but it is
not fair. Many people would be willing, again, to lose some efficiency in
return for greater equality.
In short, we sympathize with some of the imaginable reasons for af-
firmative action in the workplace and are under no illusions about the
ways in which perceptions of racial differences still affect employers' hir-
ing decisions. But affirmative action does not mean just wanting good
things. It means specific and often substantial constraints on the em-
ployer's abilitv to make use of the most qualified people. What should
we make of such policies as of the 1990~7
Trying to Reconcile Ethnic Equity and Competitive Fairness
It is possible for an advocate of current affirmative action policies to
concede all the factual points we have made in this discussion and still
be in favor of continuing and even stronger affirmative action policies.
Affirmative Action and Performance
- The authors challenge proponents of affirmative action to analyze existing job performance databases to determine if group differences impact workplace productivity.
- A central question is posed regarding how much degradation in job performance a nation should accept to achieve social equity goals.
- The text acknowledges the historical context of systemic and unjust exclusion of minorities from skilled professions prior to the 1950s.
- Affirmative action is presented as having an internally consistent rationale, even if it conflicts with maximum hiring efficiency.
- The authors suggest that temporary losses in efficiency might be a price society is willing to pay to break cycles of past discrimination or combat current bigotry.
- The debate ultimately centers on the tension between ethnic equity and the competitive fairness of hiring the most qualified individuals.
How much degradation of job performance is acceptable in pursuit of the other goals of affirmative action?
498
Living Together
Affirmative Action in the Workplace
499
for surgical skill. In fact, there are no known correlations between
good grades or high scores and subsequent success with a scalpel. If
we mean to debate this subject seriously, we should rely on hard data
rather than scare tactic^.^'
We cannot agree with Hacker's characterization of the state of knowl-
edge, but we enthusiastically subscribe to his concludingsentence. By all
means, let people on all sides of this issue assemble hard data. The pur-
pose of the foregoing examples is to make two points: (1) the scattered
evidence about job performance and affirmative action-indirect
and
direct, soft and hard-suggests
large and pervasive effects, and (2) there
is no excuse for not having many more hard-data studies of the type that
Silberberg conducted. Job performance is important, it is measurable,
and the issue of affirmative action and its effects on job performance has
been on many people's minds for years. Many corporations routinely
conduct studies of job performance and have databases that could be re-
analyzed to assess the effects of affirmative action on job performance.
The request we make of Hacker and other proponents of affirmative
action is that they join us in encouraging such work. Confident that
group differences in job performance are not an important problem, they
can try to prove their case. Our own conclusion is that they cannot do
so. If this is so, the debate about affirmative action must shift to another
level: How much degradation of job performance is acceptable in pur-
suit of the other goals of affirmative action? And that in turn brings
us to first questions. What, after all, is the nation trying to accomplish
with affirmative action in the workplace? What are the right measures
of success?
A POLICY AGENDA
In thinking about affirmative action in the workplace, more than psy-
chometric realities or efficiency in the workplace must be considered.
To avoid misunderstanding, this is a good time to lay out our perspec-
tive on these other matters.
As of the 1950s, minorities, especially blacks, in many parts of the
country were systematically and unjustly excluded from entering
skilled and professional occupations of all kinds.
At least since the 1950s, changes in white attitudes, as expressed
in the civil rights movement and in myriad other events in race
relations, the removal of Jim Crow restrictions in the South, and
affirmative action requirements opened up opportunities for mi-
norities. Progress was made.
In the 1990s, racial hostility continues to be a significant problem
in American life.
Affirmative action has an internally consistent rationale even if it
is at odds with the maximum efficiency in hiring productive work-
ers.
This last remark calls for some elaboration. Suppose, for the sake of
argument, that we are sure that a history of unfair discrimination has
handicapped some people so that they fare less well in the job market
than they otherwise would. Their handicaps may handicap their de-
scendants, so that past unfairness is propagated indefinitely into the
future, unless we do something about it. A properly constructed affir-
mative action policy may then be temporarily less efficient but more ef-
ficient in the long run. If it achieves long-run efficiency by breaking the
cycle of past discrimination, it is arguably fair. And even if the long run
is indefinitely far off, many people are willing to pay some price in lost
productivity for a large enough gain in group equality.
Or suppose that we knew that the inequality in employment that we
observe arises for reasons we consider inherently unfair. Perhaps blacks
are, for example, not being hired to be shop clerks in neighborhoods be-
cause the customers (or the other workers) are big~ted."~'
It may be ef-
ficient to hire fewer clerks who will he discriminated against, but it is
not fair. Many people would be willing, again, to lose some efficiency in
return for greater equality.
In short, we sympathize with some of the imaginable reasons for af-
firmative action in the workplace and are under no illusions about the
ways in which perceptions of racial differences still affect employers' hir-
ing decisions. But affirmative action does not mean just wanting good
things. It means specific and often substantial constraints on the em-
ployer's abilitv to make use of the most qualified people. What should
we make of such policies as of the 1990~7
Trying to Reconcile Ethnic Equity and Competitive Fairness
It is possible for an advocate of current affirmative action policies to
concede all the factual points we have made in this discussion and still
be in favor of continuing and even stronger affirmative action policies.
500
Living Together
Afimtive Action in the Workplace
501
For such advocates, it makes no difference if the tests are reliable and
valid predictors of job performance. If a disadvantaged group performs
at a lower level, to these advocates, it is self-evidently society's fault,
and government must take whatever steps are necessary to bring the dis-
advantaged group up to the level of other groups, ensuring equal em-
ployment and income in the meantime. Sometimes this argument is
couched specifically in terms of the black experience in the United
States, sometimes as part of a broader argument for an egalitarian
agenda.j5
Our dispute with the egalitarian position has to be carried out on eth-
ical and philosophical grounds, for there is nothing much to argue about
in the facts. Briefly, we differ with the contemporary advocates of con-
tinued quotalike hiring requirements on two counts.
First, we adhere to the 1964 view of what constitutes fairness, exem-
plified by Hubert Humphrey, who, in fighting for passage of the Civil
Rights Act of 1964, declared that it "does not limit the employer's frce-
dorn to hire, fire, promote, or demote for any reason-or for no rea-
sons-so
long as his action is not based on race," and then volunteered
to eat the blll in public if he were wrong about what the new law would
do." Like the senator, we reject equality of outcome as an appropriate
goal. Equality of opportunity is the test most consistent with the vis~on
of the Congress that enacted the law in 1964, and for that matter with
the vision that animated the Constitution. The appropriate goal is a joh
market in which people are not favored or held back simply hecause of
their race. Nothing in nature or knowledge, however, says that all groups
should be equally successful in every walk of life. This may he "unfair"
in the same sense that life is unfair, but it need not mean that human
beings are treating one another unfairly.
Consider the convenient and appropriate case of athletic perfor-
mance. By the standard of proportional equality, there are "too many"
black players in the National Basketball Association compared to the
number of white players. No one thinks this is unjust. When profes-
sional tennis equalized the purses for male and women champions, it did
not also require the men and women to play against other, hecause
everyone recognized that all the top men would almost always beat all
of the top women. If men and women players were ranked in a single
list, would there be "too many" males among the top 100 tennis players
in the world? Any particular disproportion may be unfair, but it may not.
It may be less obvious why there are disproportions in other pursuits,
hence harder to tell whether they are fair, but the principle is the same,
and simple: If the quality of performance fairly differs among individu-
als, it may fairly differ among
If a disproportion is fair, then
"correcting" it-making
it proportional-may
produce unfairness along
with equal representation. We believe that is what has happened in the
case of current forms of affirmative action. People who bring equal qual-
ifications to a job should have an equal shot at being hired, and affir-
mative action regulations, originally intended to promote precisely that
goal, now impede it.
Second, the debate will be healthier if those who want private busi-
nesses to support social objectives openly acknowledge that such sup-
port does in fact entail costs in efficiency and productivity, hence the
benefits that flow from greater efficiency and higher productivity-in-
cluding a stronger economy for American society as a wh01e.l~~'
Nor are
the costs in productivity unique to private businesses. When a police
department hires people who become less effective police officers than
those it could have hired, the department loses some of its capability to
provide law enforcement. Affirmative action can cost something in gov-
ernment services every bit as much as in the productivity of a private
business.
We do not require equal outcomes, hut we do want fair treatment.
What policy alternatives might be employed to bring about this state
of affairs in hiring and promotion? Before exploring four alternatives,
let us say clearly that the worst alternative, the one we do not discuss
further, is what we are now doing: not raising the question at all and
proceeding as if there are easy and costless ways to achieving fairness.
Alternative I: Creating Tests That Are Legal Under th Current
Requirements
In theory, employers could construct job-specific tests that meet the
Supreme Court's (and now the Congress's) definition of fairness. It
would be expensive, and the tests would seldom (if ever) be more pre-
dictive than a general test of cognitive ability. But it is feasible. The dif-
ficulty is that predictiveness comes primarily from the tests' measure of
g. Therefore, although they cannot be faulted under the other legal re-
quirements, they will nonetheless be thrown out because of disparate
impact. This is what has happened most famously at New York City's
Police Department, which for more than a decade has been spending
Opportunity Versus Outcome
- The authors challenge the egalitarian view that government must mandate equal employment outcomes to compensate for societal disadvantages.
- They advocate for the 1964 Civil Rights Act's original vision of fairness, which emphasizes equality of opportunity rather than guaranteed results.
- The text argues that group disproportions in various fields, such as professional sports, do not inherently prove that human beings are treating one another unfairly.
- Current affirmative action regulations are criticized for impeding the goal of hiring based on equal qualifications, thereby creating new forms of unfairness.
- The authors contend that prioritizing social objectives over merit in hiring leads to measurable costs in economic productivity and the quality of government services.
- A distinction is drawn between the inherent 'unfairness' of life and the specific injustice of individuals being favored or held back due to race.
This may be 'unfair' in the same sense that life is unfair, but it need not mean that human beings are treating one another unfairly.
500
Living Together
Afimtive Action in the Workplace
501
For such advocates, it makes no difference if the tests are reliable and
valid predictors of job performance. If a disadvantaged group performs
at a lower level, to these advocates, it is self-evidently society's fault,
and government must take whatever steps are necessary to bring the dis-
advantaged group up to the level of other groups, ensuring equal em-
ployment and income in the meantime. Sometimes this argument is
couched specifically in terms of the black experience in the United
States, sometimes as part of a broader argument for an egalitarian
agenda.j5
Our dispute with the egalitarian position has to be carried out on eth-
ical and philosophical grounds, for there is nothing much to argue about
in the facts. Briefly, we differ with the contemporary advocates of con-
tinued quotalike hiring requirements on two counts.
First, we adhere to the 1964 view of what constitutes fairness, exem-
plified by Hubert Humphrey, who, in fighting for passage of the Civil
Rights Act of 1964, declared that it "does not limit the employer's frce-
dorn to hire, fire, promote, or demote for any reason-or for no rea-
sons-so
long as his action is not based on race," and then volunteered
to eat the blll in public if he were wrong about what the new law would
do." Like the senator, we reject equality of outcome as an appropriate
goal. Equality of opportunity is the test most consistent with the vis~on
of the Congress that enacted the law in 1964, and for that matter with
the vision that animated the Constitution. The appropriate goal is a joh
market in which people are not favored or held back simply hecause of
their race. Nothing in nature or knowledge, however, says that all groups
should be equally successful in every walk of life. This may he "unfair"
in the same sense that life is unfair, but it need not mean that human
beings are treating one another unfairly.
Consider the convenient and appropriate case of athletic perfor-
mance. By the standard of proportional equality, there are "too many"
black players in the National Basketball Association compared to the
number of white players. No one thinks this is unjust. When profes-
sional tennis equalized the purses for male and women champions, it did
not also require the men and women to play against other, hecause
everyone recognized that all the top men would almost always beat all
of the top women. If men and women players were ranked in a single
list, would there be "too many" males among the top 100 tennis players
in the world? Any particular disproportion may be unfair, but it may not.
It may be less obvious why there are disproportions in other pursuits,
hence harder to tell whether they are fair, but the principle is the same,
and simple: If the quality of performance fairly differs among individu-
als, it may fairly differ among
If a disproportion is fair, then
"correcting" it-making
it proportional-may
produce unfairness along
with equal representation. We believe that is what has happened in the
case of current forms of affirmative action. People who bring equal qual-
ifications to a job should have an equal shot at being hired, and affir-
mative action regulations, originally intended to promote precisely that
goal, now impede it.
Second, the debate will be healthier if those who want private busi-
nesses to support social objectives openly acknowledge that such sup-
port does in fact entail costs in efficiency and productivity, hence the
benefits that flow from greater efficiency and higher productivity-in-
cluding a stronger economy for American society as a wh01e.l~~'
Nor are
the costs in productivity unique to private businesses. When a police
department hires people who become less effective police officers than
those it could have hired, the department loses some of its capability to
provide law enforcement. Affirmative action can cost something in gov-
ernment services every bit as much as in the productivity of a private
business.
We do not require equal outcomes, hut we do want fair treatment.
What policy alternatives might be employed to bring about this state
of affairs in hiring and promotion? Before exploring four alternatives,
let us say clearly that the worst alternative, the one we do not discuss
further, is what we are now doing: not raising the question at all and
proceeding as if there are easy and costless ways to achieving fairness.
Alternative I: Creating Tests That Are Legal Under th Current
Requirements
In theory, employers could construct job-specific tests that meet the
Supreme Court's (and now the Congress's) definition of fairness. It
would be expensive, and the tests would seldom (if ever) be more pre-
dictive than a general test of cognitive ability. But it is feasible. The dif-
ficulty is that predictiveness comes primarily from the tests' measure of
g. Therefore, although they cannot be faulted under the other legal re-
quirements, they will nonetheless be thrown out because of disparate
impact. This is what has happened most famously at New York City's
Police Department, which for more than a decade has been spending
Affirmative Action Policy Alternatives
- The authors argue that the current approach to hiring—ignoring the costs of achieving fairness—is the least viable policy option.
- Creating job-specific tests that meet legal standards is technically feasible but often fails because the tests still produce 'disparate impact' results.
- The New York Police Department's struggle to create a sergeant's exam illustrates how even culturally neutral, video-based tests are invalidated by ethnic disparities.
- Using educational credentials as a hiring screen is ineffective because affirmative action in universities has decoupled degrees from consistent cognitive ability measures.
- Data from the NLSY suggests that significant gaps in cognitive test scores persist between ethnic groups even when they hold identical degrees in the same fields of study.
- The legal environment has shifted such that ethnic bias in testing no longer needs to be proven; it merely needs to be alleged to invalidate a selection process.
The lesson of the last two decades is that ethnic bias in a job test need not be proved. It need only be alleged.
500
Living Together
Afimtive Action in the Workplace
501
For such advocates, it makes no difference if the tests are reliable and
valid predictors of job performance. If a disadvantaged group performs
at a lower level, to these advocates, it is self-evidently society's fault,
and government must take whatever steps are necessary to bring the dis-
advantaged group up to the level of other groups, ensuring equal em-
ployment and income in the meantime. Sometimes this argument is
couched specifically in terms of the black experience in the United
States, sometimes as part of a broader argument for an egalitarian
agenda.j5
Our dispute with the egalitarian position has to be carried out on eth-
ical and philosophical grounds, for there is nothing much to argue about
in the facts. Briefly, we differ with the contemporary advocates of con-
tinued quotalike hiring requirements on two counts.
First, we adhere to the 1964 view of what constitutes fairness, exem-
plified by Hubert Humphrey, who, in fighting for passage of the Civil
Rights Act of 1964, declared that it "does not limit the employer's frce-
dorn to hire, fire, promote, or demote for any reason-or for no rea-
sons-so
long as his action is not based on race," and then volunteered
to eat the blll in public if he were wrong about what the new law would
do." Like the senator, we reject equality of outcome as an appropriate
goal. Equality of opportunity is the test most consistent with the vis~on
of the Congress that enacted the law in 1964, and for that matter with
the vision that animated the Constitution. The appropriate goal is a joh
market in which people are not favored or held back simply hecause of
their race. Nothing in nature or knowledge, however, says that all groups
should be equally successful in every walk of life. This may he "unfair"
in the same sense that life is unfair, but it need not mean that human
beings are treating one another unfairly.
Consider the convenient and appropriate case of athletic perfor-
mance. By the standard of proportional equality, there are "too many"
black players in the National Basketball Association compared to the
number of white players. No one thinks this is unjust. When profes-
sional tennis equalized the purses for male and women champions, it did
not also require the men and women to play against other, hecause
everyone recognized that all the top men would almost always beat all
of the top women. If men and women players were ranked in a single
list, would there be "too many" males among the top 100 tennis players
in the world? Any particular disproportion may be unfair, but it may not.
It may be less obvious why there are disproportions in other pursuits,
hence harder to tell whether they are fair, but the principle is the same,
and simple: If the quality of performance fairly differs among individu-
als, it may fairly differ among
If a disproportion is fair, then
"correcting" it-making
it proportional-may
produce unfairness along
with equal representation. We believe that is what has happened in the
case of current forms of affirmative action. People who bring equal qual-
ifications to a job should have an equal shot at being hired, and affir-
mative action regulations, originally intended to promote precisely that
goal, now impede it.
Second, the debate will be healthier if those who want private busi-
nesses to support social objectives openly acknowledge that such sup-
port does in fact entail costs in efficiency and productivity, hence the
benefits that flow from greater efficiency and higher productivity-in-
cluding a stronger economy for American society as a wh01e.l~~'
Nor are
the costs in productivity unique to private businesses. When a police
department hires people who become less effective police officers than
those it could have hired, the department loses some of its capability to
provide law enforcement. Affirmative action can cost something in gov-
ernment services every bit as much as in the productivity of a private
business.
We do not require equal outcomes, hut we do want fair treatment.
What policy alternatives might be employed to bring about this state
of affairs in hiring and promotion? Before exploring four alternatives,
let us say clearly that the worst alternative, the one we do not discuss
further, is what we are now doing: not raising the question at all and
proceeding as if there are easy and costless ways to achieving fairness.
Alternative I: Creating Tests That Are Legal Under th Current
Requirements
In theory, employers could construct job-specific tests that meet the
Supreme Court's (and now the Congress's) definition of fairness. It
would be expensive, and the tests would seldom (if ever) be more pre-
dictive than a general test of cognitive ability. But it is feasible. The dif-
ficulty is that predictiveness comes primarily from the tests' measure of
g. Therefore, although they cannot be faulted under the other legal re-
quirements, they will nonetheless be thrown out because of disparate
impact. This is what has happened most famously at New York City's
Police Department, which for more than a decade has been spending
502
Living Together
Affirmative Action in the Workplace
503
large amounts of money trying to create a sergeant's examination. Each
successive version has met strict standards of job specificity and free-
dom from demonstrable cultural bias, but large ethnic disparities have
persisted.39 The disparities themselves invalidate the test, and a new ver-
sion must be prepared. The police department has even used a video-
based test, on grounds that any form of paper-and-pencil test must
necessarily discriminate against minorities.
The case of the New York Police Department is one example of
many.40 In practice, no test that produces disparate results has been able
to withstand challenge. The lesson of the last two decades is that eth-
nic bias in a job test need not be proved. It need only be alleged. This
has been most consistently the case for public employment-police,
firefighters, sanitation workers, teachers, administrative staff-where
political constituencies can most easily bring pressure to bear.
Alternative 11: Choosing Among Applicants with Equal Education
Ordinarily a fair way to ease the existing affirmative action requirement
would be to permit employers to narrow the pool of qualified applicants
by using education as a screen. Thus, for example, the 80 percent rule
(see the definition on page 482) could be calculated on the hasis of ap-
plicants who met a minimum educational level, not all applicants. Rut
affirmative action at the university level (Chapter 19) prevents this so-
lution from working, because the same degree may not have the same
meaning for blacks, Latinos, and whites in terms of cognitive ability. We
showed this for the bachelor's degree in the preceding chapter. Rut em-
ployers who try to make finer discriminations are no better off. In the
NLSY, the black-white differences for every educational level, from
high school diploma to Ph.D, are large, with the smallest being a dif-
ference of 1.2 standard deviations.14"
Nor does it help to differentiate by major area of study. In the NLSY,
a black and a white with a bachelor's degree in engineering, math, or a
hard science-majors
that would apparently be least susceptible to Jou-
ble standards-were
nonetheless separated by 1.1 standard deviations
in IQ. Differences for other common majors (behavioral and social sci-
ences, fine arts, education, or business) ranged from 1.4 to 1.6 standard
deviations. For Latinos, the gap was smallest for engineering, math, or
a hard science (.7 standard deviation) and ranged from .9 to 1.3 stan-
dard deviations for the others.
The educational credential used to be an effective way for a person
from a deprived background to stand on an equal footing with other job
applicants. It is still so treated that way in political rhetoric. The real-
ity facing employers is that, given the aggressive affirmative action that
universities have employed over the last three decades, educational cre-
dentials can no longer be used to compare the intellectual qualifications
of black, Latino, and white job candidates.
Alternative Ill: Race Nowning
An employer who hires large numbers of people cannot very well get
along without using a test, but at the same time probably cannot devise
a test that will pass muster with the government. So it will have to test
applicants knowing that the test will produce unacceptably large group
differences between whites and blacks, then comply with the 80 per-
cent rule by hiring additional applicants from the protected minorities.
The simplest way to do this is to employ a pass-fail cutoff. Everyone
above the cutoff is deemed qualified for the job, and then the employer
uses other methods to choose among the candidates, making sure that
the end result meets the 80 percent rule. This is a common solution
and requires only that the cutoff be low enough that a sufficient num-
ber of protected candidates get into the final group of candidate^.'^^'
But the pass-fail cutoff throws away a great deal of valuable informa-
tion. Suppose that after complying with the 80 percent rule, the em-
ployer ends up with six new white employees out of twenty whites who
applied and two out of seven black applicants. W h y just take any six
whites who scored above the cutoff? Why not instead take the whites
with the top six scores? Similarly, why not take the top-scoring two
blacks?
This is called top-down hiring. If the test has high validity, if the
group differences are large, and if there are many applicants, it is much
more efficient than a c~toff.~'
But there is a difficulty with this method.
By deciding in advance on the number of whites and blacks who will be
hired and then picking the top-scoring candidates, the employer is us-
ing quotas, which is illegal (even before the 1991 Civil Rights Act, a n
employer who used explicit quotas was vulnerable to legal action).
One way to get around this difficulty is to use race norming. The
raw scores are converted into percentiles based on the distribution of
scores within each group: a white applicant receives a percentile score
based on the distribution of white scores; a black applicant's score rep-
The Mechanics of Race Norming
- Employers face a dilemma where standardized tests often produce group differences that conflict with government hiring regulations like the 80 percent rule.
- The pass-fail cutoff method allows employers to meet diversity quotas but discards valuable data by treating all candidates above a low threshold as equal.
- Top-down hiring is more efficient for selecting high-performing candidates but can be legally classified as an illegal quota system.
- Race norming emerged as a solution where raw test scores are converted into percentiles based on the distribution within the applicant's own racial group.
- Using tools like the Wonderlic 'Ethnic Conversion Table,' identical raw scores are assigned vastly different percentiles to ensure a diverse final hiring pool.
Suppose that five candidates—white, black, Latino, Asian, and American Indian—all got the Wonderlic's mean score of 22 prior to any adjustment for group distributions.
502
Living Together
Affirmative Action in the Workplace
503
large amounts of money trying to create a sergeant's examination. Each
successive version has met strict standards of job specificity and free-
dom from demonstrable cultural bias, but large ethnic disparities have
persisted.39 The disparities themselves invalidate the test, and a new ver-
sion must be prepared. The police department has even used a video-
based test, on grounds that any form of paper-and-pencil test must
necessarily discriminate against minorities.
The case of the New York Police Department is one example of
many.40 In practice, no test that produces disparate results has been able
to withstand challenge. The lesson of the last two decades is that eth-
nic bias in a job test need not be proved. It need only be alleged. This
has been most consistently the case for public employment-police,
firefighters, sanitation workers, teachers, administrative staff-where
political constituencies can most easily bring pressure to bear.
Alternative 11: Choosing Among Applicants with Equal Education
Ordinarily a fair way to ease the existing affirmative action requirement
would be to permit employers to narrow the pool of qualified applicants
by using education as a screen. Thus, for example, the 80 percent rule
(see the definition on page 482) could be calculated on the hasis of ap-
plicants who met a minimum educational level, not all applicants. Rut
affirmative action at the university level (Chapter 19) prevents this so-
lution from working, because the same degree may not have the same
meaning for blacks, Latinos, and whites in terms of cognitive ability. We
showed this for the bachelor's degree in the preceding chapter. Rut em-
ployers who try to make finer discriminations are no better off. In the
NLSY, the black-white differences for every educational level, from
high school diploma to Ph.D, are large, with the smallest being a dif-
ference of 1.2 standard deviations.14"
Nor does it help to differentiate by major area of study. In the NLSY,
a black and a white with a bachelor's degree in engineering, math, or a
hard science-majors
that would apparently be least susceptible to Jou-
ble standards-were
nonetheless separated by 1.1 standard deviations
in IQ. Differences for other common majors (behavioral and social sci-
ences, fine arts, education, or business) ranged from 1.4 to 1.6 standard
deviations. For Latinos, the gap was smallest for engineering, math, or
a hard science (.7 standard deviation) and ranged from .9 to 1.3 stan-
dard deviations for the others.
The educational credential used to be an effective way for a person
from a deprived background to stand on an equal footing with other job
applicants. It is still so treated that way in political rhetoric. The real-
ity facing employers is that, given the aggressive affirmative action that
universities have employed over the last three decades, educational cre-
dentials can no longer be used to compare the intellectual qualifications
of black, Latino, and white job candidates.
Alternative Ill: Race Nowning
An employer who hires large numbers of people cannot very well get
along without using a test, but at the same time probably cannot devise
a test that will pass muster with the government. So it will have to test
applicants knowing that the test will produce unacceptably large group
differences between whites and blacks, then comply with the 80 per-
cent rule by hiring additional applicants from the protected minorities.
The simplest way to do this is to employ a pass-fail cutoff. Everyone
above the cutoff is deemed qualified for the job, and then the employer
uses other methods to choose among the candidates, making sure that
the end result meets the 80 percent rule. This is a common solution
and requires only that the cutoff be low enough that a sufficient num-
ber of protected candidates get into the final group of candidate^.'^^'
But the pass-fail cutoff throws away a great deal of valuable informa-
tion. Suppose that after complying with the 80 percent rule, the em-
ployer ends up with six new white employees out of twenty whites who
applied and two out of seven black applicants. W h y just take any six
whites who scored above the cutoff? Why not instead take the whites
with the top six scores? Similarly, why not take the top-scoring two
blacks?
This is called top-down hiring. If the test has high validity, if the
group differences are large, and if there are many applicants, it is much
more efficient than a c~toff.~'
But there is a difficulty with this method.
By deciding in advance on the number of whites and blacks who will be
hired and then picking the top-scoring candidates, the employer is us-
ing quotas, which is illegal (even before the 1991 Civil Rights Act, a n
employer who used explicit quotas was vulnerable to legal action).
One way to get around this difficulty is to use race norming. The
raw scores are converted into percentiles based on the distribution of
scores within each group: a white applicant receives a percentile score
based on the distribution of white scores; a black applicant's score rep-
504
Living Together
Affimtive Action in the Workplace
505
resents his percentile within the black distribution; and so on. Then
the employer makes hiring decisions on the basis of these race-normed
~ercentiles. Starting in the late 1970s, the U.S. Department of Labor
began promoting this solution, offering such race-normed scores for
the General Aptitude Test Battery (the GATB, described in Chap-
ter 3).44
By the early 1980s, race norming had became a common solution to
the employer's dilemma. To see how race norming works, we may use
the example of the popular Wonderlic Personnel Test, a highly g-loaded
~aper-and-pencil test that takes just twelve minutes. In its test manual
in use during the 1980s, the Wonderlic company gave precise in-
structions for what it called "percentile selectionn-its
term for race
norming-along
with an "Ethnic Conversion Table." Suppose that five
candidates-white,
black, Latino, Asian, and American Indian-
all got the Wonderlic's mean score of 22 prior to any adjustment for
group distributions. Using the Ethnic Conversion Table, the personnel
office would then assign those five candidates, all of whom had identi-
cal scores, to the 45th percentile (for the white), 80th percentile (for
the black), 75th percentile (for the Latino), 55th percentile (for the
Asian), and 60th percentile (for the American Indian), and those scores
would thereafter be treated as the "real" scores.'451
An employer could
then hire from the top down using these adjusted scores and expect to
end up with ratios of employees that would avoid triggering the Uni-
form Guidelines.
In 1986, the U.S. Department of Justice challenged race norming on
the grounds that it was an unlawful and unconstitutional violation of
the rights of people who were neither black nor Latino. In our exam-
ple, a black with a score of 80 would indeed have a much better chance
of being hired than a white with a score of45, though both had the same
score on an unbiased, valid test. The Departments of Justice and Labor
adjudicated theirdifferences, agreeing to study the method further. Race
norming had few defenders in public, where its unfairness seemed
pable. In the Civil Rights Act of 1991, race norming was banned for any
employer subject to federal regulation. For now, this experiment in af-
firmative action policy-ironically,
by far the most efficient from a pro-
ductivity standpoint and even the "fairest," insofar as the highest scorers
at least won out in competition with members of their own group-has
been suspended.
Alternative IV: Returning to the Original Conception of Afirmative Ac-
tion
We are dissatisfied with all of the foregoing alternatives and are broadly
critical of the way in which the well-intentioned effort to end employ.
ment discrimination has played out. We therefore close by urging con-
sideration of this proposition: If tomorrow all job discrimination regulations
based on grout, proportions were rescinded, the United States would have a
job market that is ethically fairer, more conducive to racial harmony, and eco-
nomically more productive, than the one we have now. We cannot prove
that the proposition is true (just as no one can prove that it is not), but
here are two reasons for taking it seriously.
The first is public approval of the old concept of fairness. Preferen-
tial affirmative action has been a favorite cause of intellectuals, jour-
nalists, and liberal politicians, but it has never been rooted in broad
public support. Instead, according to polls taken in the 1970s and 1980s,
most Americans favor hiring by ability test scores over preferential hir-
ing for protected groups. At the same time, they approve of having the
government offer a helping hand-for
example, by offering free courses
to people to help them do better on ability tests used for employment.
A clear majority of blacks similarly favor ability test scores over prefer-
ential hiring.46 A return to policies based on evenhandedness for indi-
viduals (not for groups) seems sure to attract enthusiastic and broad
puhlic support.
The second reason is the potential for good faith. Our fundamental
recommendation for the workplace resembles the one we offered for
higher education: get rid of preferential affirmative action and return to
the original conception of casting a wider net and leaning over back-
ward to make sure that all minority applicants have a fair shot at the job
or the promotion. To the extent that the government has a role to play,
it is to ensure equality of opportunity, not of outcome. Once again, we
anticipate that the main objection will be that ending affirmative ac-
tion as now practiced will take us back to the bad old days. As we come
to the end of our long wrestle with the new American Dilemma known
as affirmative action, let us expand on our reasons for our optimism that
the United States can do without it very well.
Try this thought experiment on yourself. If all antidiscrimination law
were rescinded tomorrow, would you (if you are an employer) hire whites
in preference to blacks or Latinos? Would you (if you are an employee)
The Debate Over Race Norming
- The U.S. Department of Justice challenged race norming in 1986, arguing it violated the rights of non-minority applicants.
- The Civil Rights Act of 1991 ultimately banned race norming for federally regulated employers despite its efficiency in group-based productivity.
- The authors propose rescinding all group-based job discrimination regulations to create a fairer and more harmonious job market.
- Public opinion polls from the 1970s and 1980s suggest that most Americans, including a majority of Black citizens, prefer hiring based on ability tests over preferential treatment.
- The authors advocate for a return to the 'original' conception of affirmative action: ensuring equality of opportunity rather than equality of outcome.
- A thought experiment is proposed to challenge the assumption that rescinding these laws would lead to a return to systemic discriminatory behavior.
Race norming had few defenders in public, where its unfairness seemed palpable.
504
Living Together
Affimtive Action in the Workplace
505
resents his percentile within the black distribution; and so on. Then
the employer makes hiring decisions on the basis of these race-normed
~ercentiles. Starting in the late 1970s, the U.S. Department of Labor
began promoting this solution, offering such race-normed scores for
the General Aptitude Test Battery (the GATB, described in Chap-
ter 3).44
By the early 1980s, race norming had became a common solution to
the employer's dilemma. To see how race norming works, we may use
the example of the popular Wonderlic Personnel Test, a highly g-loaded
~aper-and-pencil test that takes just twelve minutes. In its test manual
in use during the 1980s, the Wonderlic company gave precise in-
structions for what it called "percentile selectionn-its
term for race
norming-along
with an "Ethnic Conversion Table." Suppose that five
candidates-white,
black, Latino, Asian, and American Indian-
all got the Wonderlic's mean score of 22 prior to any adjustment for
group distributions. Using the Ethnic Conversion Table, the personnel
office would then assign those five candidates, all of whom had identi-
cal scores, to the 45th percentile (for the white), 80th percentile (for
the black), 75th percentile (for the Latino), 55th percentile (for the
Asian), and 60th percentile (for the American Indian), and those scores
would thereafter be treated as the "real" scores.'451
An employer could
then hire from the top down using these adjusted scores and expect to
end up with ratios of employees that would avoid triggering the Uni-
form Guidelines.
In 1986, the U.S. Department of Justice challenged race norming on
the grounds that it was an unlawful and unconstitutional violation of
the rights of people who were neither black nor Latino. In our exam-
ple, a black with a score of 80 would indeed have a much better chance
of being hired than a white with a score of45, though both had the same
score on an unbiased, valid test. The Departments of Justice and Labor
adjudicated theirdifferences, agreeing to study the method further. Race
norming had few defenders in public, where its unfairness seemed
pable. In the Civil Rights Act of 1991, race norming was banned for any
employer subject to federal regulation. For now, this experiment in af-
firmative action policy-ironically,
by far the most efficient from a pro-
ductivity standpoint and even the "fairest," insofar as the highest scorers
at least won out in competition with members of their own group-has
been suspended.
Alternative IV: Returning to the Original Conception of Afirmative Ac-
tion
We are dissatisfied with all of the foregoing alternatives and are broadly
critical of the way in which the well-intentioned effort to end employ.
ment discrimination has played out. We therefore close by urging con-
sideration of this proposition: If tomorrow all job discrimination regulations
based on grout, proportions were rescinded, the United States would have a
job market that is ethically fairer, more conducive to racial harmony, and eco-
nomically more productive, than the one we have now. We cannot prove
that the proposition is true (just as no one can prove that it is not), but
here are two reasons for taking it seriously.
The first is public approval of the old concept of fairness. Preferen-
tial affirmative action has been a favorite cause of intellectuals, jour-
nalists, and liberal politicians, but it has never been rooted in broad
public support. Instead, according to polls taken in the 1970s and 1980s,
most Americans favor hiring by ability test scores over preferential hir-
ing for protected groups. At the same time, they approve of having the
government offer a helping hand-for
example, by offering free courses
to people to help them do better on ability tests used for employment.
A clear majority of blacks similarly favor ability test scores over prefer-
ential hiring.46 A return to policies based on evenhandedness for indi-
viduals (not for groups) seems sure to attract enthusiastic and broad
puhlic support.
The second reason is the potential for good faith. Our fundamental
recommendation for the workplace resembles the one we offered for
higher education: get rid of preferential affirmative action and return to
the original conception of casting a wider net and leaning over back-
ward to make sure that all minority applicants have a fair shot at the job
or the promotion. To the extent that the government has a role to play,
it is to ensure equality of opportunity, not of outcome. Once again, we
anticipate that the main objection will be that ending affirmative ac-
tion as now practiced will take us back to the bad old days. As we come
to the end of our long wrestle with the new American Dilemma known
as affirmative action, let us expand on our reasons for our optimism that
the United States can do without it very well.
Try this thought experiment on yourself. If all antidiscrimination law
were rescinded tomorrow, would you (if you are an employer) hire whites
in preference to blacks or Latinos? Would you (if you are an employee)
506
Living Together
Affirmative Action in the Workplace
507
begin looking for workplaces where you did not have to work with blacks
or Latinos? Would you (if you are a customer) seek out stores and ser-
vices that did not have black or Latino personnel? We put the Issue that
way to expose a strange dissonance among Americans. We are confi-
dent that the answer to all of those questions by virtually all of the white
readers of this book is an emphatic, deeply felt "no." May we even sug-
gest that many of you would feel much happier about what you were do-
lng if, as an employer, you spent your time concentrating on whether a
minority applicant was the right person for the job rather than worry-
ing about whether the applicant was likely to sue you if YOU turned him
down; that, as an employee, you would find it a blessed relief to work In
an office with black or Latino colleagues where it could be taken for
granted by everyone that the personnel office had hired all of you uslng
the same yardstick; that, as a consumer of services, you wish you could
choose a surgeon who happens to be an ethnic minority, because you
could be confident that his degree meant the same thing for everyone
who received it.
We have no doubt that all of the above statements are true for the
vast majority of our readers, and yet many people are convinced that
the population as a whole would take advantage of the situation if af.
firmative action were ended. Talk about it with your friends, and you
will find it to be a commonplace not limited to yourself. Although they
too are authentically committed to treating people fairly regardless of
race, color, or creed, they worry that massive bigotry still exlsts and will
bring hack the had old days as soon as the heavy hand of the govern.
ment regulation is lifted from them. By odd happenstance, the people
one knows personally are much more fairdminded than the people one
doesn't know personally.
Is this really true? That bigotry still exists is incontestable. Rut that
does not mean that bigotry would prevail in the American job market
as of the end of the twentieth century if the vast machinery of ant~dis-
crimination law did not exist. Much of what we have presented in this
chapter about occupational gains by blacks in the years hefore and af-
ter 1964 suggests the opposite. The civil rights movement authentically
raised white awareness of the oppression and exploitation of blacks in
the job market. The trendlines in both white behavior and black out-
comes began to move in the right direction, gathering speed. The civil
rights legislation came along at the same tlme and probably tweaked the
slopes of those trendlines in some instances. But the great truth about
the 1960s was not that the nation finally enacted the civil rights laws
but that the American people were finally and inexorably moving in
the right direction anyway. We are asking that you consider seriously
the proposition that it is feasible to remove antidiscrimination law, re-
placing it with vigorous enforcement of the time-honored American
principle that all citizens are equal before the law.
As in the case of college admissions, some economic and occupa-
tional reshuffling would occur. Some minorities would fail to get jobs
that they get now. If, for example, the Washington Police Department
returns to a policy of hiring the best-qualified candidates, a smaller pro-
portion of those new police would be black. Wherever else standards
have been lowered to increase the number of minorities in a workplace,
the number of minorities in those positions in that workplace would
probably diminish. On the other hand, the quality of the Washington
police force is likely to improve, which will be of tangible benefit to the
hundreds of thousands of blacks who live in that city. Minorities in all
walks of life will have lifted from them the post-1964 form of second-
class citizenship that affirmative action has imposed on them.
Much of the reshuffling that may be expected will not be bad even
for those who are reshuffled. As matters stand, newly hired minority ex-
ecutives in corporations often enjoy short-term benefits (higher pay and
status at the front end than new graduates could ordinarily expect) but
a career dead end. Blacks in companies that do business with the fed-
eral government are routinely used in highly visible positions as evi-
dence of affirmative action compliance and diverted from the more
pedestrian hut ultimately more beneficial apprenticeship positions that
the white employees have no choice but to serve. Minority business-
people are channeled into the minority set-aside game, learning how to
serve as fronts for contracts that are actually carried out by whites, in-
stead of running the business itself. Affirmative action has deformed
many aspects of American life, not least in twisting the ways in which
minorities must try to get ahead.
We will not try to estimate what the effects of doing away with job
discrimination legislation would be for business productivity. The ef-
fects would vary widely by industry and location in any case, from triv-
ial to substantial. Nor will we spend much time talking about the
benefits for whites, except to say that these benefits should be counted.
It is easy for highly educated whites with many options to look benignly
on affirmative action. It has little effect on their job prospects. For a
The Case Against Affirmative Action
- The authors argue that most white Americans desire a colorblind meritocracy where hiring and professional credentials are based on a single, universal standard.
- There is a psychological disconnect where individuals believe they and their peers are fair-minded, yet fear that society at large remains deeply bigoted.
- The text suggests that the civil rights progress of the 1960s was driven more by a genuine shift in American social consciousness than by government regulation.
- The authors propose replacing current antidiscrimination laws with a strict enforcement of the principle that all citizens are equal before the law.
- Ending affirmative action would likely lead to a decrease in minority representation in certain sectors where standards had been lowered to meet quotas.
- The authors contend that removing these policies would eliminate a 'second-class citizenship' and improve the overall quality of public services like policing.
By odd happenstance, the people one knows personally are much more fairdminded than the people one doesn't know personally.
506
Living Together
Affirmative Action in the Workplace
507
begin looking for workplaces where you did not have to work with blacks
or Latinos? Would you (if you are a customer) seek out stores and ser-
vices that did not have black or Latino personnel? We put the Issue that
way to expose a strange dissonance among Americans. We are confi-
dent that the answer to all of those questions by virtually all of the white
readers of this book is an emphatic, deeply felt "no." May we even sug-
gest that many of you would feel much happier about what you were do-
lng if, as an employer, you spent your time concentrating on whether a
minority applicant was the right person for the job rather than worry-
ing about whether the applicant was likely to sue you if YOU turned him
down; that, as an employee, you would find it a blessed relief to work In
an office with black or Latino colleagues where it could be taken for
granted by everyone that the personnel office had hired all of you uslng
the same yardstick; that, as a consumer of services, you wish you could
choose a surgeon who happens to be an ethnic minority, because you
could be confident that his degree meant the same thing for everyone
who received it.
We have no doubt that all of the above statements are true for the
vast majority of our readers, and yet many people are convinced that
the population as a whole would take advantage of the situation if af.
firmative action were ended. Talk about it with your friends, and you
will find it to be a commonplace not limited to yourself. Although they
too are authentically committed to treating people fairly regardless of
race, color, or creed, they worry that massive bigotry still exlsts and will
bring hack the had old days as soon as the heavy hand of the govern.
ment regulation is lifted from them. By odd happenstance, the people
one knows personally are much more fairdminded than the people one
doesn't know personally.
Is this really true? That bigotry still exists is incontestable. Rut that
does not mean that bigotry would prevail in the American job market
as of the end of the twentieth century if the vast machinery of ant~dis-
crimination law did not exist. Much of what we have presented in this
chapter about occupational gains by blacks in the years hefore and af-
ter 1964 suggests the opposite. The civil rights movement authentically
raised white awareness of the oppression and exploitation of blacks in
the job market. The trendlines in both white behavior and black out-
comes began to move in the right direction, gathering speed. The civil
rights legislation came along at the same tlme and probably tweaked the
slopes of those trendlines in some instances. But the great truth about
the 1960s was not that the nation finally enacted the civil rights laws
but that the American people were finally and inexorably moving in
the right direction anyway. We are asking that you consider seriously
the proposition that it is feasible to remove antidiscrimination law, re-
placing it with vigorous enforcement of the time-honored American
principle that all citizens are equal before the law.
As in the case of college admissions, some economic and occupa-
tional reshuffling would occur. Some minorities would fail to get jobs
that they get now. If, for example, the Washington Police Department
returns to a policy of hiring the best-qualified candidates, a smaller pro-
portion of those new police would be black. Wherever else standards
have been lowered to increase the number of minorities in a workplace,
the number of minorities in those positions in that workplace would
probably diminish. On the other hand, the quality of the Washington
police force is likely to improve, which will be of tangible benefit to the
hundreds of thousands of blacks who live in that city. Minorities in all
walks of life will have lifted from them the post-1964 form of second-
class citizenship that affirmative action has imposed on them.
Much of the reshuffling that may be expected will not be bad even
for those who are reshuffled. As matters stand, newly hired minority ex-
ecutives in corporations often enjoy short-term benefits (higher pay and
status at the front end than new graduates could ordinarily expect) but
a career dead end. Blacks in companies that do business with the fed-
eral government are routinely used in highly visible positions as evi-
dence of affirmative action compliance and diverted from the more
pedestrian hut ultimately more beneficial apprenticeship positions that
the white employees have no choice but to serve. Minority business-
people are channeled into the minority set-aside game, learning how to
serve as fronts for contracts that are actually carried out by whites, in-
stead of running the business itself. Affirmative action has deformed
many aspects of American life, not least in twisting the ways in which
minorities must try to get ahead.
We will not try to estimate what the effects of doing away with job
discrimination legislation would be for business productivity. The ef-
fects would vary widely by industry and location in any case, from triv-
ial to substantial. Nor will we spend much time talking about the
benefits for whites, except to say that these benefits should be counted.
It is easy for highly educated whites with many options to look benignly
on affirmative action. It has little effect on their job prospects. For a
The Costs of Affirmative Action
- Affirmative action often diverts minority professionals into visible compliance roles rather than essential apprenticeship positions.
- The current system encourages minority business owners to act as fronts for white-run contracts rather than developing independent operational skills.
- Working-class white individuals face significant personal and professional hardships when passed over for less-qualified candidates due to diversity mandates.
- The authors argue that affirmative action is 'leaking a poison into the American soul' by promoting ethnic balkanization over individualism.
- Cognitive stratification is creating a new caste society where an isolated elite restructures social rules to maintain their status.
- The 'invisible migration' of the twentieth century has concentrated high cognitive ability into a distinct, affluent social class.
But our largest reason for wanting to scrap job discrimination law is our belief that the system of affirmative action, in education and the workplace alike, is leaking a poison into the American soul.
506
Living Together
Affirmative Action in the Workplace
507
begin looking for workplaces where you did not have to work with blacks
or Latinos? Would you (if you are a customer) seek out stores and ser-
vices that did not have black or Latino personnel? We put the Issue that
way to expose a strange dissonance among Americans. We are confi-
dent that the answer to all of those questions by virtually all of the white
readers of this book is an emphatic, deeply felt "no." May we even sug-
gest that many of you would feel much happier about what you were do-
lng if, as an employer, you spent your time concentrating on whether a
minority applicant was the right person for the job rather than worry-
ing about whether the applicant was likely to sue you if YOU turned him
down; that, as an employee, you would find it a blessed relief to work In
an office with black or Latino colleagues where it could be taken for
granted by everyone that the personnel office had hired all of you uslng
the same yardstick; that, as a consumer of services, you wish you could
choose a surgeon who happens to be an ethnic minority, because you
could be confident that his degree meant the same thing for everyone
who received it.
We have no doubt that all of the above statements are true for the
vast majority of our readers, and yet many people are convinced that
the population as a whole would take advantage of the situation if af.
firmative action were ended. Talk about it with your friends, and you
will find it to be a commonplace not limited to yourself. Although they
too are authentically committed to treating people fairly regardless of
race, color, or creed, they worry that massive bigotry still exlsts and will
bring hack the had old days as soon as the heavy hand of the govern.
ment regulation is lifted from them. By odd happenstance, the people
one knows personally are much more fairdminded than the people one
doesn't know personally.
Is this really true? That bigotry still exists is incontestable. Rut that
does not mean that bigotry would prevail in the American job market
as of the end of the twentieth century if the vast machinery of ant~dis-
crimination law did not exist. Much of what we have presented in this
chapter about occupational gains by blacks in the years hefore and af-
ter 1964 suggests the opposite. The civil rights movement authentically
raised white awareness of the oppression and exploitation of blacks in
the job market. The trendlines in both white behavior and black out-
comes began to move in the right direction, gathering speed. The civil
rights legislation came along at the same tlme and probably tweaked the
slopes of those trendlines in some instances. But the great truth about
the 1960s was not that the nation finally enacted the civil rights laws
but that the American people were finally and inexorably moving in
the right direction anyway. We are asking that you consider seriously
the proposition that it is feasible to remove antidiscrimination law, re-
placing it with vigorous enforcement of the time-honored American
principle that all citizens are equal before the law.
As in the case of college admissions, some economic and occupa-
tional reshuffling would occur. Some minorities would fail to get jobs
that they get now. If, for example, the Washington Police Department
returns to a policy of hiring the best-qualified candidates, a smaller pro-
portion of those new police would be black. Wherever else standards
have been lowered to increase the number of minorities in a workplace,
the number of minorities in those positions in that workplace would
probably diminish. On the other hand, the quality of the Washington
police force is likely to improve, which will be of tangible benefit to the
hundreds of thousands of blacks who live in that city. Minorities in all
walks of life will have lifted from them the post-1964 form of second-
class citizenship that affirmative action has imposed on them.
Much of the reshuffling that may be expected will not be bad even
for those who are reshuffled. As matters stand, newly hired minority ex-
ecutives in corporations often enjoy short-term benefits (higher pay and
status at the front end than new graduates could ordinarily expect) but
a career dead end. Blacks in companies that do business with the fed-
eral government are routinely used in highly visible positions as evi-
dence of affirmative action compliance and diverted from the more
pedestrian hut ultimately more beneficial apprenticeship positions that
the white employees have no choice but to serve. Minority business-
people are channeled into the minority set-aside game, learning how to
serve as fronts for contracts that are actually carried out by whites, in-
stead of running the business itself. Affirmative action has deformed
many aspects of American life, not least in twisting the ways in which
minorities must try to get ahead.
We will not try to estimate what the effects of doing away with job
discrimination legislation would be for business productivity. The ef-
fects would vary widely by industry and location in any case, from triv-
ial to substantial. Nor will we spend much time talking about the
benefits for whites, except to say that these benefits should be counted.
It is easy for highly educated whites with many options to look benignly
on affirmative action. It has little effect on their job prospects. For a
508
Living Together
young white man with fewer advantages who has wanted to be a fire-
fighter all his life and is passed over in favor of a less-qualified minority
or female candidate, the costs loom larger. To dismiss his disappoint-
ment and the hardships worked on him just because his skin is white
and his sex is male is a peculiarly common-and
cruel-reaction
of peo-
ple who burst with indignation at every other kind of injustice.
Whatever their precise amounts, the benefits to productivity and to
fairness of ending the antidiscrimination laws are substantial. But our
largest reason for wanting to scrap job discrimination law is our belief
that the system of affirmative action, in education and the workplace
alike, is leaking a poison into the American soul. This nation does not
have the option of ethnic balkanization. The increasing proportions of
ethnic minorities-Latino,
East Asian, South Asian, African, East Eu-
ropean-make
it more imperative, not less, that we return to the melt-
ing pot as metaphor and color blindness as the ideal. Individualism is
not only America's heritage. It must be its future.
Chapter 21
The Way We Are Headed
In this penultimate chapter we speculate about the impact of cognitive
stratification on American life and government. Predicting the course
of society is chancy, but certain tendencies seem strong enough to worry
about:
An increasingly isolated cognitive elite.
A merging of the cognitive elite with the affluent.
A deteriorating quality of life for people at the bottom end of the
cognitive ability distribution.
Unchecked, these trends will lead the U.S. toward something resem-
bling a caste society, with the underclass mired ever more firmly at the
bottom and the cognitive elite ever more firmly anchored at the top, re-
structuring the rules of society so that it becomes harder and harder for
them to lose. Among the other casualties of this process would be Amer-
ican civil society as we have known it. Like other apocalyptic visions,
this one is pessimistic, perhaps too much so. O n the other hand, there
is much to be pessimistic about.
RECAPITULATION: THE INVISIBLE MIGRATION
As we described in Part I, the cognitive elite refers to people in the top
percentiles of cognitive ability who, over the course of the American
twentieth century, have been part of a vast but nearly invisible migra-
tion. The migration does not reveal itself in masses of humanity cross-
ing frontiers but in countless bits of data about the movement of
individuals across the levels of society. Like all other great migrations,
this one too will transform both the place people left and the place
they go.
At the beginning of the century, the great majority of people in the
top 5 or 10 percent of the intelligence distribution were not college ed-
The Rise of Cognitive Stratification
- In the early 20th century, the intellectually gifted were scattered across all social classes and occupations, living indistinguishably among the general population.
- Historical communities were once stratified by wealth, race, and religion, but they remained integrated in terms of cognitive ability.
- Modern higher education and professional channeling have concentrated the top of the IQ distribution into a distinct, isolated social class.
- This 'cognitive elite' now dominates the leadership of almost every major American institution, from corporate boardrooms to media and government.
- The dismantling of traditional barriers like ethnicity and social background has accelerated the sorting of people based purely on cognitive talent.
- While this shift represents the triumph of the meritocratic ideal, it has fundamentally transformed the social fabric by separating the brightest from the rest of society.
The stratifications may have been stark, even bitter, but people were not stratified by cognitive ability.
508
Living Together
young white man with fewer advantages who has wanted to be a fire-
fighter all his life and is passed over in favor of a less-qualified minority
or female candidate, the costs loom larger. To dismiss his disappoint-
ment and the hardships worked on him just because his skin is white
and his sex is male is a peculiarly common-and
cruel-reaction
of peo-
ple who burst with indignation at every other kind of injustice.
Whatever their precise amounts, the benefits to productivity and to
fairness of ending the antidiscrimination laws are substantial. But our
largest reason for wanting to scrap job discrimination law is our belief
that the system of affirmative action, in education and the workplace
alike, is leaking a poison into the American soul. This nation does not
have the option of ethnic balkanization. The increasing proportions of
ethnic minorities-Latino,
East Asian, South Asian, African, East Eu-
ropean-make
it more imperative, not less, that we return to the melt-
ing pot as metaphor and color blindness as the ideal. Individualism is
not only America's heritage. It must be its future.
Chapter 21
The Way We Are Headed
In this penultimate chapter we speculate about the impact of cognitive
stratification on American life and government. Predicting the course
of society is chancy, but certain tendencies seem strong enough to worry
about:
An increasingly isolated cognitive elite.
A merging of the cognitive elite with the affluent.
A deteriorating quality of life for people at the bottom end of the
cognitive ability distribution.
Unchecked, these trends will lead the U.S. toward something resem-
bling a caste society, with the underclass mired ever more firmly at the
bottom and the cognitive elite ever more firmly anchored at the top, re-
structuring the rules of society so that it becomes harder and harder for
them to lose. Among the other casualties of this process would be Amer-
ican civil society as we have known it. Like other apocalyptic visions,
this one is pessimistic, perhaps too much so. O n the other hand, there
is much to be pessimistic about.
RECAPITULATION: THE INVISIBLE MIGRATION
As we described in Part I, the cognitive elite refers to people in the top
percentiles of cognitive ability who, over the course of the American
twentieth century, have been part of a vast but nearly invisible migra-
tion. The migration does not reveal itself in masses of humanity cross-
ing frontiers but in countless bits of data about the movement of
individuals across the levels of society. Like all other great migrations,
this one too will transform both the place people left and the place
they go.
At the beginning of the century, the great majority of people in the
top 5 or 10 percent of the intelligence distribution were not college ed-
5 10
Living Together
The Way We Are Headed
5 1 1
ucated, often not even high school educated, and they lived their lives
scattered almost indistinguishably among the rest of the population.
Their interests were just as variegated. Many were small businessmen or
farmers, sharing the political outlook of those groups. Many worked on
assembly lines or as skilled craftsmen. The top of the cognitive ability
distribution probably included leaders of the labor movement and of
community organizations. Among the smart women, a few had profes-
sional careers of their own, but most of them kept house, reared chil-
dren, and were often the organizing forces of their religious and social
communities.
People from the top of the cognitive ability distribution lived next
door to people who were not so smart, with whose children their own
children went to school. They socialized with, went to church with, and
married people less bright than themselves as a matter of course. This
was not an egalitarian utopia that we are trying to recall. On the con-
trary, communities were stratified by wealth, religion, class, ethnic back-
ground, and race. The stratifications may have been stark, even bitter,
but people were not stratified by cognitive ability.
As the century progressed, the historical mix of intellectual abilities
at all levels of American society thinned as intelligence rose to the top.
The upper end of the cognitive ability distribution has been increas-
ingly channeled into higher education, especially the top colleges and
professional schools, thence into high-IQ occupations and senior man-
agerial positions, as Part 1 detailed. The upshot is that the scattered
brightest of the early twentieth century have congregated, forming a
new class.
Membership in this new class, the cognitive elite, is gained hy high
IQ; neither social background, nor ethnicity, nor lack of money will bar
the way. But once in the club, usually by age eighteen, members hegin
to share much else as well. Among other things, they will come to run
much of the country's business. In the private sector, the cognitive elite
dominates the ranks of CEOs and the top echelon of corporate execu-
tives. Smart people have no doubt always had the advantage in com-
merce and industry, but their advantage has grown as the harriers against
the "wrong" nationalities, ethnicities, religions, or socioeconomic ori-
gins have been dismantled. Meanwhile, the leaders in medicine, law,
science, print journalism, television, the film and publishing industries,
and the foundation world come largely from the cognitive elite. Almost
all of the leading figures in academia are part of it. In Washington, the
top echelons of federal officialdom, special interest groups, think tanks,
and the rest of Washington's satellite institutions draw heavily from the
cognitive elite. At the municipal level, the local business and political
movers are often members of the cognitive elite.
GIVING MERITOCRACY ITS DUE
Part I mostly described a success story-success
for the people lucky
enough to be part of the cognitive elite but also a success for the nation
as a whole. Before turning to the dark side, we should be explicit about
the good things that flow from the invisible migration.
Chief among them is the triumph of an American ideal. Americans
believe that each person should he able to go as far as talent and hard
work will take him, and much of what we have described is the realiza-
tion of that conviction, for people with high IQs. The breadth of the
change was made possible by twentieth-century technology, which ex-
panded the need for people with high IQs by orders of magnitude. But
the process itself has been a classic example of people free to respond to
opportunity and of an economic system that created opportunities in
abundance.
Life has been increasingly good for the cognitive elite, as it has dis-
placed the socioeconomic elites of earlier times. We showed in Part I
the increasing financial rewards for brains, hut money is only a part of
the cornucopia. In the far-from-idyllic past when most of the people at
the rop of the cognitive distribution were farmers, housewives, workers,
and shop owners, many of them were also frustrated, aware that they
had capabilities that were not being used. The graph on page 56 that
traced the steep rise in high-IQ jobs over the course of the century was
to some important extent a picture of people moving from unsatisfying
jobs to lucrative and interesting ones.
Technology has not just created more jobs for the cognitive elite but
revolutionized the way they may be done. Modem transportation has ex-
panded the realm in which people work. Beyond that, ~hysical separa-
tion is becoming irrelevant. A scientist passionately devoted to the study
of a certain protein or an investment analyst following a market can be
in daily electronic conversation with people throughout the world who
share the same passion, passing drafts of work back and forth, calling up
data files, doing analyses that would have required a mainframe com-
puter and a covey of assistants only a few years ago-all
while sitting
The Rise of Cognitive Stratification
- The modern economy has shifted from traditional socioeconomic elites to a cognitive elite defined by high IQ and specialized skills.
- Technological advancements have liberated high-IQ workers, allowing for increased productivity and personal freedom through remote work and global connectivity.
- The migration of intellectual talent into high-IQ occupations has likely increased national GNP and overall societal wealth through human capital efficiency.
- Despite the benefits of meritocracy, this shift has led to the coalescence of a new class that is increasingly isolated from the rest of society.
- The decline of the 'public sphere' and the end of shared experiences like the military draft have exacerbated the social segregation of this cognitive class.
I doubt I've had a friend or regular social acquaintance since who scored less than an 1100 on his SATs.
5 10
Living Together
The Way We Are Headed
5 1 1
ucated, often not even high school educated, and they lived their lives
scattered almost indistinguishably among the rest of the population.
Their interests were just as variegated. Many were small businessmen or
farmers, sharing the political outlook of those groups. Many worked on
assembly lines or as skilled craftsmen. The top of the cognitive ability
distribution probably included leaders of the labor movement and of
community organizations. Among the smart women, a few had profes-
sional careers of their own, but most of them kept house, reared chil-
dren, and were often the organizing forces of their religious and social
communities.
People from the top of the cognitive ability distribution lived next
door to people who were not so smart, with whose children their own
children went to school. They socialized with, went to church with, and
married people less bright than themselves as a matter of course. This
was not an egalitarian utopia that we are trying to recall. On the con-
trary, communities were stratified by wealth, religion, class, ethnic back-
ground, and race. The stratifications may have been stark, even bitter,
but people were not stratified by cognitive ability.
As the century progressed, the historical mix of intellectual abilities
at all levels of American society thinned as intelligence rose to the top.
The upper end of the cognitive ability distribution has been increas-
ingly channeled into higher education, especially the top colleges and
professional schools, thence into high-IQ occupations and senior man-
agerial positions, as Part 1 detailed. The upshot is that the scattered
brightest of the early twentieth century have congregated, forming a
new class.
Membership in this new class, the cognitive elite, is gained hy high
IQ; neither social background, nor ethnicity, nor lack of money will bar
the way. But once in the club, usually by age eighteen, members hegin
to share much else as well. Among other things, they will come to run
much of the country's business. In the private sector, the cognitive elite
dominates the ranks of CEOs and the top echelon of corporate execu-
tives. Smart people have no doubt always had the advantage in com-
merce and industry, but their advantage has grown as the harriers against
the "wrong" nationalities, ethnicities, religions, or socioeconomic ori-
gins have been dismantled. Meanwhile, the leaders in medicine, law,
science, print journalism, television, the film and publishing industries,
and the foundation world come largely from the cognitive elite. Almost
all of the leading figures in academia are part of it. In Washington, the
top echelons of federal officialdom, special interest groups, think tanks,
and the rest of Washington's satellite institutions draw heavily from the
cognitive elite. At the municipal level, the local business and political
movers are often members of the cognitive elite.
GIVING MERITOCRACY ITS DUE
Part I mostly described a success story-success
for the people lucky
enough to be part of the cognitive elite but also a success for the nation
as a whole. Before turning to the dark side, we should be explicit about
the good things that flow from the invisible migration.
Chief among them is the triumph of an American ideal. Americans
believe that each person should he able to go as far as talent and hard
work will take him, and much of what we have described is the realiza-
tion of that conviction, for people with high IQs. The breadth of the
change was made possible by twentieth-century technology, which ex-
panded the need for people with high IQs by orders of magnitude. But
the process itself has been a classic example of people free to respond to
opportunity and of an economic system that created opportunities in
abundance.
Life has been increasingly good for the cognitive elite, as it has dis-
placed the socioeconomic elites of earlier times. We showed in Part I
the increasing financial rewards for brains, hut money is only a part of
the cornucopia. In the far-from-idyllic past when most of the people at
the rop of the cognitive distribution were farmers, housewives, workers,
and shop owners, many of them were also frustrated, aware that they
had capabilities that were not being used. The graph on page 56 that
traced the steep rise in high-IQ jobs over the course of the century was
to some important extent a picture of people moving from unsatisfying
jobs to lucrative and interesting ones.
Technology has not just created more jobs for the cognitive elite but
revolutionized the way they may be done. Modem transportation has ex-
panded the realm in which people work. Beyond that, ~hysical separa-
tion is becoming irrelevant. A scientist passionately devoted to the study
of a certain protein or an investment analyst following a market can be
in daily electronic conversation with people throughout the world who
share the same passion, passing drafts of work back and forth, calling up
data files, doing analyses that would have required a mainframe com-
puter and a covey of assistants only a few years ago-all
while sitting
5 1 2
Living Together
The Way We Are Headed
5 13
alone at a computer, which need not be in an office, but can as easily be
in a beach house overlooking the ocean. Across the occupational do-
main of those who work primarily with their minds, the explosion of
computer and communications technologies has liberated and ex-
panded creativity, productivity, and personal freedom. There may be
some costs of this physical isolation, but many people are happier and
more fulfilled as a result of the reach of modem technology.
For the nation as a whole, the invisible migration has surely brought
benefits as well. We cannot measure the gains precisely, but they are the
inevitable side effect of greater efficiency in identifying intellectual tal-
ent and channeling it into high-IQ occupations. Compared to 1900 or
even 1950, America in the 1990s is getting more productivity out of its
stock of human capital, and this presumably translates into more jobs,
gains in GNP, and other effects that produce more wealth for the soci-
ety at large.
So what's the problem? The old stratifications are fading, erased by
a greater reliance on what people often call merit. Millions of people
have benefited from the changes-including
us. Would we prefer less
of a meritocracy? Put that way, no-but
"no" for larger reasons as well.
The invisible migration is in many ways an expression of what Amer-
ica is all about.
ISOLATION WITHIN THE COGNITIVE ELITE
What worries us first about the emerging cognitive elite is its coales-
cence into a class that views American society increasingly through a
lens of its own. In The End of Equality, which analyzes the stratification
of American society from a vantage point different from ours, social
critic Mickey Kaus describes the isolation we have in mind. He identi-
fies it broadly with the decline of "the public sphere."' The end of the
military draft, the social segregation of the school system, and the divi-
sive effects of the underclass are among his suspects, and each has doubt-
less played an important role independent (to some degree) of the effects
of the cognitive stratification that we described in Part I. Thinking
about the way these forces had affected his own life, Kaus remarked: "I
entered a good Ivy League college in 1969. I doubt I've had a friend or
regular social acquaintance since who scored less than an 1100 on his
or her SAT boards."'
Kaus is probably right. The reason why this is a problem is captured
by a remark attributed to the New Yorker's one-time movie critic Pauline
Kael following Richard Nixon's landslide victory in the presidential
election of 1972: "Nixon can't have won; no one I know voted for him."3
When the members of the cognitive elite (of whatever political con-
victions) hang out with each other, often exclusively with each other,
they find it hard to understand what ordinary people think.
The prohlem is not simply that smart people rise to the top more ef-
ficiently these days. If the only quality that CEOs of major corporations
and movie directors and the White House inner circle had in common
were their raw intelligence, things would not be so much different now
than they have always been, for to some degree the most successful have
always been drawn disproportionately from the most intelligent. But the
invisible migration of the twentieth century has done much more than
let the most intellectually able succeed more easily. It has also segre-
gated them and socialized them. The members of the cognitive elite are
likely to have gone to the same kinds of schools, live in similar neigh-
borhoods, go to the same kinds of theaters and restaurants, read the same
magazines and newspapers, watch the same television programs, even
drive the same makes of cars.
They also tend to be ignorant of the same things. They watch far less
commercial television than the average American. Their movie-going
tends to he highly selective. They seldom read the national tabloids
that have the nation's largest circulation figures or listen to the talk ra-
dio that has become a major form of national communication for other
parts of America. This does not mean that the cognitive elite spend
their lives at the ballet and reading Proust. Theirs is not a high culture,
but it is distinctive enough to set them off from the rest of the country
in many important ways.
The isolation of the cognitive elite is by no means complete, but the
statistical tendencies are strong, and the same advances in trans-
portation and communication that are so enhancing the professional
lives of the cognitive elite will make their isolation from the rest of the
public that much greater. As their common ground with the rest of
society decreases, their coalescence as a new class increases. The tra-
ditional separations between the business world, the entertainment
world, the university intellectuals, and government are being replaced
by an axis of bright people that runs through society. They already sense
their kinship across these spheres of interest. This too will increase with
time.
The Rise of Cognitive Segregation
- The cognitive elite have become increasingly isolated from the rest of society, living in a cultural bubble that limits their understanding of ordinary citizens.
- This new class is defined not just by intelligence, but by shared educational backgrounds, neighborhoods, and consumption habits.
- Members of this elite group tend to be ignorant of mainstream American culture, avoiding popular media like commercial television and talk radio.
- Advances in technology and transportation are paradoxically increasing the social distance between the cognitive elite and the general public.
- The centralization of government authority since 1960 has given this isolated class unprecedented power to impose its values on a decentralized nation.
- A new 'axis of bright people' is forming across business, entertainment, and government, creating a unified class with a shared worldview.
Nixon can't have won; no one I know voted for him.
5 1 2
Living Together
The Way We Are Headed
5 13
alone at a computer, which need not be in an office, but can as easily be
in a beach house overlooking the ocean. Across the occupational do-
main of those who work primarily with their minds, the explosion of
computer and communications technologies has liberated and ex-
panded creativity, productivity, and personal freedom. There may be
some costs of this physical isolation, but many people are happier and
more fulfilled as a result of the reach of modem technology.
For the nation as a whole, the invisible migration has surely brought
benefits as well. We cannot measure the gains precisely, but they are the
inevitable side effect of greater efficiency in identifying intellectual tal-
ent and channeling it into high-IQ occupations. Compared to 1900 or
even 1950, America in the 1990s is getting more productivity out of its
stock of human capital, and this presumably translates into more jobs,
gains in GNP, and other effects that produce more wealth for the soci-
ety at large.
So what's the problem? The old stratifications are fading, erased by
a greater reliance on what people often call merit. Millions of people
have benefited from the changes-including
us. Would we prefer less
of a meritocracy? Put that way, no-but
"no" for larger reasons as well.
The invisible migration is in many ways an expression of what Amer-
ica is all about.
ISOLATION WITHIN THE COGNITIVE ELITE
What worries us first about the emerging cognitive elite is its coales-
cence into a class that views American society increasingly through a
lens of its own. In The End of Equality, which analyzes the stratification
of American society from a vantage point different from ours, social
critic Mickey Kaus describes the isolation we have in mind. He identi-
fies it broadly with the decline of "the public sphere."' The end of the
military draft, the social segregation of the school system, and the divi-
sive effects of the underclass are among his suspects, and each has doubt-
less played an important role independent (to some degree) of the effects
of the cognitive stratification that we described in Part I. Thinking
about the way these forces had affected his own life, Kaus remarked: "I
entered a good Ivy League college in 1969. I doubt I've had a friend or
regular social acquaintance since who scored less than an 1100 on his
or her SAT boards."'
Kaus is probably right. The reason why this is a problem is captured
by a remark attributed to the New Yorker's one-time movie critic Pauline
Kael following Richard Nixon's landslide victory in the presidential
election of 1972: "Nixon can't have won; no one I know voted for him."3
When the members of the cognitive elite (of whatever political con-
victions) hang out with each other, often exclusively with each other,
they find it hard to understand what ordinary people think.
The prohlem is not simply that smart people rise to the top more ef-
ficiently these days. If the only quality that CEOs of major corporations
and movie directors and the White House inner circle had in common
were their raw intelligence, things would not be so much different now
than they have always been, for to some degree the most successful have
always been drawn disproportionately from the most intelligent. But the
invisible migration of the twentieth century has done much more than
let the most intellectually able succeed more easily. It has also segre-
gated them and socialized them. The members of the cognitive elite are
likely to have gone to the same kinds of schools, live in similar neigh-
borhoods, go to the same kinds of theaters and restaurants, read the same
magazines and newspapers, watch the same television programs, even
drive the same makes of cars.
They also tend to be ignorant of the same things. They watch far less
commercial television than the average American. Their movie-going
tends to he highly selective. They seldom read the national tabloids
that have the nation's largest circulation figures or listen to the talk ra-
dio that has become a major form of national communication for other
parts of America. This does not mean that the cognitive elite spend
their lives at the ballet and reading Proust. Theirs is not a high culture,
but it is distinctive enough to set them off from the rest of the country
in many important ways.
The isolation of the cognitive elite is by no means complete, but the
statistical tendencies are strong, and the same advances in trans-
portation and communication that are so enhancing the professional
lives of the cognitive elite will make their isolation from the rest of the
public that much greater. As their common ground with the rest of
society decreases, their coalescence as a new class increases. The tra-
ditional separations between the business world, the entertainment
world, the university intellectuals, and government are being replaced
by an axis of bright people that runs through society. They already sense
their kinship across these spheres of interest. This too will increase with
time.
5 14
Living Together
The Way We Are Headed
5 1 5
THE COALITION OF THE COGNITIVE ELITE AND THE
AFFLUENT
The trends we have described would not constitute a threat to the re-
public if the government still played the same role in civic life that it
played through the Eisenhower administration. As recently as 1960, it
did not make a lot of political difference what the cognitive elite
thought, because its power to impose those values on the rest of Amer-
ica was limited. In most of the matters that counted-the
way the
schools were run, keeping order in the public square, opening a business
or running it-the
nation remained decentralized. The still inchoate
cognitive elite in 1960 may have had ideas about how it wanted to move
the world but, like Archimedes, it lacked a place to stand.
We need not become embroiled here in a debate about whether the
centralization of authority since 1960 (or 1933, for those who take a
longer view) was right or wrong. We may all agree as a statement of fact
that such centralization occurred, through legislation, Supreme Court
decisions, and accretions of executive authority in every domain of daily
life. With it came something that did not exist before: a place for the
cognitive elite to stand. With the end of the historic limits on the fed-
eral reach, everything was up for grabs. If one political group could get
enough votes on the Supreme Court, it could move the Constitution
toward its goals. If it could get enough votes in Congress, it could do
similarly with legislation.
Through the 1960s, 1970s, and 1980s, the battle veered back and
forth, with groups identifiably "liberal" and "conservative" bloodying
each other's noses in accustomed ways. But in the Bush and Clinton ad-
ministrations, the old lines began to blur. One may analyze these trends
conventionally in terms of the evolution of party politics. The rise of
the New Democrats and the breakup of the Reagan coalition are the
conventional way of looking at the evolution. We think something else
is happening as well, with potential dangers: the converging interests of
the cognitive elite with the larger population of affluent Americans.
For most of the century, intellectuals and the affluent have been an-
tagonists. Intellectuals have been identified with the economic left and
the cultural avant-garde, while the affluent have been identified with
big business and cultural conservatism. These comfortable categories
have become muddled in recent years, as faculty at the top universities
put together salaries, consulting fees, speeches, and royalties that gar-
ner them six-figure incomes while the New York Review of Books shows
up in the mailbox of young corporate lawyers. The very bright have be-
come much more uniformly affluent than they used to be while, at the
same time, the universe of affluent people has become more densely pop-
ulated by the very bright, as Part I described. Not surprisingly, the in-
terests of affluence and the cognitive elite have begun to blend.
This melding has its limits, particularly when the affluent person is
not part of the cognitive elite. The high-IQ Stanford professor with the
hest-selling hook and the ordinary-IQ fellow who makes the same in-
come with his small chain of shoe stores are hardly allies on everything.
But in looking ahead to alliances and social trends, it is still useful to
think in terms of their increasing commonalities because, as any good
economist or politician will point out, there are theoretical interests and
practical interests. The Stanford professor's best+selling book may be a
diatribe against the punitive criminal justice system, but that doesn't
mean that he doesn't vote with his feet to move to a safe neighborhood.
Or his book may be a withering attack on outdated family norms, but
that doesn't mean that he isn't acting like an old-fashioned father in
looking after the interests of his children-and
if that means sending
his children to a lily-white private school so that they get a good edu-
cation, so he it. Meanwhile, the man with the chain of shoe stores may
he politically to the right of the Stanford professor, but he is looking for
the same safe neighborhood and the same good schools for his children.
And even if he is more likely to vote Republican than the professor, he
is unlikely to be the rugged individualist of yore. On the contrary, he is
likely to have become quite comfortable with the idea that government
is there to be used. He and the professor may not be so far apart at all
on how they want to live their own personal lives and how government
might serve those joint and important interests.
Consider the sheer size of this emerging coalition and how quickly
the affluent class as a whole (not just the cognitive elite) is growing.
What is "affluence"? The median answer in 1992 when the Roper Or-
ganization asked people how much annual income they would need "to
fulfill all your dreams" was $82,100, which indicates where affluence is
thought to start by most American~.~
For purposes of this exercise, we
will define affluence as beginning at an annual family income of
$100,000 in 1990 dollars, about three times the median family income.
By that definition, more than one out of twenty American families is
The Emerging Cognitive Coalition
- The expansion of federal power has created a new political landscape where the cognitive elite can exert significant influence over the Constitution and legislation.
- The historic divide between intellectuals (the economic left) and the affluent (the business right) is dissolving as their economic and cultural profiles merge.
- High-IQ professionals and wealthy business owners are increasingly finding common ground in their practical lifestyle choices, regardless of their theoretical political differences.
- This new alliance is driven by shared interests in personal security, elite education for their children, and the strategic use of government power to protect their status.
- The 'cognitive elite' and the broader affluent class are forming a massive, influential coalition that transcends traditional party lines like the New Democrats or the Reagan coalition.
The very bright have become much more uniformly affluent than they used to be while, at the same time, the universe of affluent people has become more densely populated by the very bright.
5 14
Living Together
The Way We Are Headed
5 1 5
THE COALITION OF THE COGNITIVE ELITE AND THE
AFFLUENT
The trends we have described would not constitute a threat to the re-
public if the government still played the same role in civic life that it
played through the Eisenhower administration. As recently as 1960, it
did not make a lot of political difference what the cognitive elite
thought, because its power to impose those values on the rest of Amer-
ica was limited. In most of the matters that counted-the
way the
schools were run, keeping order in the public square, opening a business
or running it-the
nation remained decentralized. The still inchoate
cognitive elite in 1960 may have had ideas about how it wanted to move
the world but, like Archimedes, it lacked a place to stand.
We need not become embroiled here in a debate about whether the
centralization of authority since 1960 (or 1933, for those who take a
longer view) was right or wrong. We may all agree as a statement of fact
that such centralization occurred, through legislation, Supreme Court
decisions, and accretions of executive authority in every domain of daily
life. With it came something that did not exist before: a place for the
cognitive elite to stand. With the end of the historic limits on the fed-
eral reach, everything was up for grabs. If one political group could get
enough votes on the Supreme Court, it could move the Constitution
toward its goals. If it could get enough votes in Congress, it could do
similarly with legislation.
Through the 1960s, 1970s, and 1980s, the battle veered back and
forth, with groups identifiably "liberal" and "conservative" bloodying
each other's noses in accustomed ways. But in the Bush and Clinton ad-
ministrations, the old lines began to blur. One may analyze these trends
conventionally in terms of the evolution of party politics. The rise of
the New Democrats and the breakup of the Reagan coalition are the
conventional way of looking at the evolution. We think something else
is happening as well, with potential dangers: the converging interests of
the cognitive elite with the larger population of affluent Americans.
For most of the century, intellectuals and the affluent have been an-
tagonists. Intellectuals have been identified with the economic left and
the cultural avant-garde, while the affluent have been identified with
big business and cultural conservatism. These comfortable categories
have become muddled in recent years, as faculty at the top universities
put together salaries, consulting fees, speeches, and royalties that gar-
ner them six-figure incomes while the New York Review of Books shows
up in the mailbox of young corporate lawyers. The very bright have be-
come much more uniformly affluent than they used to be while, at the
same time, the universe of affluent people has become more densely pop-
ulated by the very bright, as Part I described. Not surprisingly, the in-
terests of affluence and the cognitive elite have begun to blend.
This melding has its limits, particularly when the affluent person is
not part of the cognitive elite. The high-IQ Stanford professor with the
hest-selling hook and the ordinary-IQ fellow who makes the same in-
come with his small chain of shoe stores are hardly allies on everything.
But in looking ahead to alliances and social trends, it is still useful to
think in terms of their increasing commonalities because, as any good
economist or politician will point out, there are theoretical interests and
practical interests. The Stanford professor's best+selling book may be a
diatribe against the punitive criminal justice system, but that doesn't
mean that he doesn't vote with his feet to move to a safe neighborhood.
Or his book may be a withering attack on outdated family norms, but
that doesn't mean that he isn't acting like an old-fashioned father in
looking after the interests of his children-and
if that means sending
his children to a lily-white private school so that they get a good edu-
cation, so he it. Meanwhile, the man with the chain of shoe stores may
he politically to the right of the Stanford professor, but he is looking for
the same safe neighborhood and the same good schools for his children.
And even if he is more likely to vote Republican than the professor, he
is unlikely to be the rugged individualist of yore. On the contrary, he is
likely to have become quite comfortable with the idea that government
is there to be used. He and the professor may not be so far apart at all
on how they want to live their own personal lives and how government
might serve those joint and important interests.
Consider the sheer size of this emerging coalition and how quickly
the affluent class as a whole (not just the cognitive elite) is growing.
What is "affluence"? The median answer in 1992 when the Roper Or-
ganization asked people how much annual income they would need "to
fulfill all your dreams" was $82,100, which indicates where affluence is
thought to start by most American~.~
For purposes of this exercise, we
will define affluence as beginning at an annual family income of
$100,000 in 1990 dollars, about three times the median family income.
By that definition, more than one out of twenty American families is
The Secession of the Successful
- Affluence is defined as an annual family income of $100,000 in 1990 dollars, a threshold reached by over five percent of American families by the early 1990s.
- While median family income has remained stagnant since 1973, the proportion of affluent families has continued to grow significantly.
- The divergence between the average family and the affluent began in the early 1970s and appears to be independent of specific political administrations or parties.
- Economic stagnation for the average family is attributed to declining blue-collar wages and the rise of single-parent households.
- The growing affluent class is increasingly composed of the most talented individuals who possess the resources to bypass traditional social institutions.
- This trend leads to a 'secession' where the wealthy opt out of public services in favor of private alternatives like gated communities and private courts.
Try to envision what will happen when 10 or 20 percent of the population has enough income to bypass the social institutions they don't like in ways that only the top 1 percent used to be able to do.
5 14
Living Together
The Way We Are Headed
5 1 5
THE COALITION OF THE COGNITIVE ELITE AND THE
AFFLUENT
The trends we have described would not constitute a threat to the re-
public if the government still played the same role in civic life that it
played through the Eisenhower administration. As recently as 1960, it
did not make a lot of political difference what the cognitive elite
thought, because its power to impose those values on the rest of Amer-
ica was limited. In most of the matters that counted-the
way the
schools were run, keeping order in the public square, opening a business
or running it-the
nation remained decentralized. The still inchoate
cognitive elite in 1960 may have had ideas about how it wanted to move
the world but, like Archimedes, it lacked a place to stand.
We need not become embroiled here in a debate about whether the
centralization of authority since 1960 (or 1933, for those who take a
longer view) was right or wrong. We may all agree as a statement of fact
that such centralization occurred, through legislation, Supreme Court
decisions, and accretions of executive authority in every domain of daily
life. With it came something that did not exist before: a place for the
cognitive elite to stand. With the end of the historic limits on the fed-
eral reach, everything was up for grabs. If one political group could get
enough votes on the Supreme Court, it could move the Constitution
toward its goals. If it could get enough votes in Congress, it could do
similarly with legislation.
Through the 1960s, 1970s, and 1980s, the battle veered back and
forth, with groups identifiably "liberal" and "conservative" bloodying
each other's noses in accustomed ways. But in the Bush and Clinton ad-
ministrations, the old lines began to blur. One may analyze these trends
conventionally in terms of the evolution of party politics. The rise of
the New Democrats and the breakup of the Reagan coalition are the
conventional way of looking at the evolution. We think something else
is happening as well, with potential dangers: the converging interests of
the cognitive elite with the larger population of affluent Americans.
For most of the century, intellectuals and the affluent have been an-
tagonists. Intellectuals have been identified with the economic left and
the cultural avant-garde, while the affluent have been identified with
big business and cultural conservatism. These comfortable categories
have become muddled in recent years, as faculty at the top universities
put together salaries, consulting fees, speeches, and royalties that gar-
ner them six-figure incomes while the New York Review of Books shows
up in the mailbox of young corporate lawyers. The very bright have be-
come much more uniformly affluent than they used to be while, at the
same time, the universe of affluent people has become more densely pop-
ulated by the very bright, as Part I described. Not surprisingly, the in-
terests of affluence and the cognitive elite have begun to blend.
This melding has its limits, particularly when the affluent person is
not part of the cognitive elite. The high-IQ Stanford professor with the
hest-selling hook and the ordinary-IQ fellow who makes the same in-
come with his small chain of shoe stores are hardly allies on everything.
But in looking ahead to alliances and social trends, it is still useful to
think in terms of their increasing commonalities because, as any good
economist or politician will point out, there are theoretical interests and
practical interests. The Stanford professor's best+selling book may be a
diatribe against the punitive criminal justice system, but that doesn't
mean that he doesn't vote with his feet to move to a safe neighborhood.
Or his book may be a withering attack on outdated family norms, but
that doesn't mean that he isn't acting like an old-fashioned father in
looking after the interests of his children-and
if that means sending
his children to a lily-white private school so that they get a good edu-
cation, so he it. Meanwhile, the man with the chain of shoe stores may
he politically to the right of the Stanford professor, but he is looking for
the same safe neighborhood and the same good schools for his children.
And even if he is more likely to vote Republican than the professor, he
is unlikely to be the rugged individualist of yore. On the contrary, he is
likely to have become quite comfortable with the idea that government
is there to be used. He and the professor may not be so far apart at all
on how they want to live their own personal lives and how government
might serve those joint and important interests.
Consider the sheer size of this emerging coalition and how quickly
the affluent class as a whole (not just the cognitive elite) is growing.
What is "affluence"? The median answer in 1992 when the Roper Or-
ganization asked people how much annual income they would need "to
fulfill all your dreams" was $82,100, which indicates where affluence is
thought to start by most American~.~
For purposes of this exercise, we
will define affluence as beginning at an annual family income of
$100,000 in 1990 dollars, about three times the median family income.
By that definition, more than one out of twenty American families is
5 1 6
Living Together
The Way We Are Headed
5 17
affluent, roughly double what it was a decade earlier.5 Furthermore, this
growth has accompanied stagnant real income for the average family.
Here is the last of the many graphs we have asked you to examine in
this book. In some ways, it is more loaded with social implications than
any that have come before.
In the 1970s, economic growth began to enlarge the affluent class
Median family income
Percentage of families with
(bars)
incomes over $100,000 (line)
$40,000 -
- 6
The shaded years are ones in which real per capita
GNP dropped. All figures are based on 1990 dollars.
Sources: Median family income: U.S. Bureau of the Census 1991, Tahle R-4, supplementcd
with U.S. Bureau of the Census 1993, Tahle B-11. For families with incomes over $100,000,
data from 1967-1990 are taken from U.S. Bureau of the Census 1991, Tahle R-3: U.S. Rtr.
reau of the Census, 1993, Tahle B-6. Figures for 1947-1964 are estimated from U.S. Rureau
of the Census 1975, Series G 269-282, adjusted for differences in definition of the h~mrly.
The graph illustrates the reason for the intense recent interest in
American income inequality. From the end of World War 11 until the
early 1970s, average family income rose. Then in 1973, median family
income hit a peak. Part of the reason for the subsequent lack of progress
has been the declining real wages for many categories of blue-collar jobs,
described in Chapter 4. Part of the reason has been the decline in two-
parent families (economic progress continued, though modestly, for
families consisting of married couples). In any case, the average Amer-
ican family has been stuck at about the same place economically for
more than twenty years.
For the affluent, the story diverges sharply. Until the early 1970s, the
proportion of families with $100,000 in 1990 purchasing power in-
creased slowly and in tandem with the growth in median family income.
Rut after progress for the average family stalled, it continued for the af-
fluent. The steepest gains occurred during the 1980s, and Ronald Rea-
gan's policies of the 1980s are commonly thought to be an important
force (in praise or blame) for increasing the number of affluent. But
economists know that there is a difficulty with this explanation, as you
will see when you compare the 1970s with the 1980s. The rising pro-
portion of families with incomes of more than $100,000 since the early
1970s does not seem to be a function of any particular political party or
policy, except insofar as those policies encourage an expanding econ-
omy. It has gone with gains in real per capita GNP (indicated by the
unshaded bars in the graphic) whether those gains occurred under
Richard Nixon, Jimmy Carter, Ronald Reagan, or George ~ush.[~I
There
is no reason to think that this trend will be much different under Bill
Clinton or his successors, if the economy grows. The net result is that
the affluent will constitute a major portion of the population in the rel-
atively near future, and they will increasingly be constituted of the most
talented.
Try to envision what will happen when 10 or 20 percent of the pop-
ulation has enough income to bypass the social institutions they don't
like in ways that only the top 1 percent used to be able to do. Robert
Reich has called it the "secession of the successful."' The current sym-
bol of this phenomenon is the gated community, secure behind its walls
and guard posts, hut many other signs are visible. The fax, modem, and
Federal Express have already made the U.S. Postal Service nearly irrel-
evant to the way that the affluent communicate, for example. A more
portentous development is the private court system that businesses are
beginning to create. Or the mass exodus from public schools among
those living in cities, if they can afford it. Or the proliferation of private
security forces for companies, apartment houses, schools, malls, and any-
where else where people with money want to be safe.
Try to envision what will happen to the political process. Even as of
the early 1990s, the affluent class is no longer a thin layer of rich peo-
ple but a political bloc to be reckoned with. Speaking in round num-
bers (for the precise definitions of both groups are arbitrary), a coalition
of the cognitive elite and the affluent class now represents something
well in excess of 5 percent of families and, because of their much higher
The Rise of the Custodial State
- The cognitive elite and affluent class are merging into a powerful political bloc representing 10 to 15 percent of the voting population.
- This new coalition increasingly uses its financial and political clout to insulate itself through private security, private schools, and gated communities.
- Constitutional restraints on factional power have loosened, allowing the privileged to use government authority to further their specific interests.
- A new 'Latin American style' conservatism is emerging, focused on protecting the 'mansions on the hills' from the perceived menace of the underclass.
- The underclass is growing and becoming more entrenched due to the high birth rates of children born to single mothers with low cognitive ability.
- The convergence of these trends suggests a future of deep social stratification and defensive, rather than idealistic, governance.
We fear that a new kind of conservatism is becoming the dominant ideology of the affluent—not in the social tradition of an Edmund Burke or in the economic tradition of an Adam Smith but 'conservatism' along Latin American lines, where to be conservative has often meant doing whatever is necessary to preserve the mansions on the hills from the menace of the slums below.
5 1 6
Living Together
The Way We Are Headed
5 17
affluent, roughly double what it was a decade earlier.5 Furthermore, this
growth has accompanied stagnant real income for the average family.
Here is the last of the many graphs we have asked you to examine in
this book. In some ways, it is more loaded with social implications than
any that have come before.
In the 1970s, economic growth began to enlarge the affluent class
Median family income
Percentage of families with
(bars)
incomes over $100,000 (line)
$40,000 -
- 6
The shaded years are ones in which real per capita
GNP dropped. All figures are based on 1990 dollars.
Sources: Median family income: U.S. Bureau of the Census 1991, Tahle R-4, supplementcd
with U.S. Bureau of the Census 1993, Tahle B-11. For families with incomes over $100,000,
data from 1967-1990 are taken from U.S. Bureau of the Census 1991, Tahle R-3: U.S. Rtr.
reau of the Census, 1993, Tahle B-6. Figures for 1947-1964 are estimated from U.S. Rureau
of the Census 1975, Series G 269-282, adjusted for differences in definition of the h~mrly.
The graph illustrates the reason for the intense recent interest in
American income inequality. From the end of World War 11 until the
early 1970s, average family income rose. Then in 1973, median family
income hit a peak. Part of the reason for the subsequent lack of progress
has been the declining real wages for many categories of blue-collar jobs,
described in Chapter 4. Part of the reason has been the decline in two-
parent families (economic progress continued, though modestly, for
families consisting of married couples). In any case, the average Amer-
ican family has been stuck at about the same place economically for
more than twenty years.
For the affluent, the story diverges sharply. Until the early 1970s, the
proportion of families with $100,000 in 1990 purchasing power in-
creased slowly and in tandem with the growth in median family income.
Rut after progress for the average family stalled, it continued for the af-
fluent. The steepest gains occurred during the 1980s, and Ronald Rea-
gan's policies of the 1980s are commonly thought to be an important
force (in praise or blame) for increasing the number of affluent. But
economists know that there is a difficulty with this explanation, as you
will see when you compare the 1970s with the 1980s. The rising pro-
portion of families with incomes of more than $100,000 since the early
1970s does not seem to be a function of any particular political party or
policy, except insofar as those policies encourage an expanding econ-
omy. It has gone with gains in real per capita GNP (indicated by the
unshaded bars in the graphic) whether those gains occurred under
Richard Nixon, Jimmy Carter, Ronald Reagan, or George ~ush.[~I
There
is no reason to think that this trend will be much different under Bill
Clinton or his successors, if the economy grows. The net result is that
the affluent will constitute a major portion of the population in the rel-
atively near future, and they will increasingly be constituted of the most
talented.
Try to envision what will happen when 10 or 20 percent of the pop-
ulation has enough income to bypass the social institutions they don't
like in ways that only the top 1 percent used to be able to do. Robert
Reich has called it the "secession of the successful."' The current sym-
bol of this phenomenon is the gated community, secure behind its walls
and guard posts, hut many other signs are visible. The fax, modem, and
Federal Express have already made the U.S. Postal Service nearly irrel-
evant to the way that the affluent communicate, for example. A more
portentous development is the private court system that businesses are
beginning to create. Or the mass exodus from public schools among
those living in cities, if they can afford it. Or the proliferation of private
security forces for companies, apartment houses, schools, malls, and any-
where else where people with money want to be safe.
Try to envision what will happen to the political process. Even as of
the early 1990s, the affluent class is no longer a thin layer of rich peo-
ple but a political bloc to be reckoned with. Speaking in round num-
bers (for the precise definitions of both groups are arbitrary), a coalition
of the cognitive elite and the affluent class now represents something
well in excess of 5 percent of families and, because of their much higher
5 18
Living Together
The Way We Are Headed
5 19
than average voting rates, somewhere in the vicinity of 10 to 15 per-
cent of the votem8 The political clout of this group extends well be-
yond its mere voting size because of its financial contributions to
campaigns and because this group contributes a large proportion of lo-
cal political organizers. The combined weight of the cognitive elite and
the affluent is already considerable. But we asked you to envision to-
morrow, not today. Do you think that the rich in America already have
too much power? Or do you think the intellectuals already have too
much power? We are suggesting that a "yes" to both questions is prob-
ably right. And if you think the power of these groups is too great now,
just watch what happens as their outlooks and interests converge.
Cynical readers will be asking what else is new. The privileged have
always used the law to their advantage. Our own analysis is hardly novel;
it is taken straight from a book of essays written more than two centuries
ago, The Federalist. People are not naturally angelic but self-interested-
else, as Publius pointed out, governments would not be necessary in the
first place. Politically, people form factions to pursue their common
ends. Give them access to government power to further those ends, and
they will take advantage of it. The only modest additions we make to
these ancient truths are two propositions: First, as of the 1990s, the con-
stitutional restraints on how a faction may use government to further
its ends have loosened. Second, an unprecedented coalition of the smart
and the rich will take advantage of this new latitude in new ways.
FACING REALITY ABOUT THE UNDERCLASS
What new ways? There are many possibilities, but the central ones all
involve the underclass. We fear that a new kind of conservatism is be-
coming the dominant ideology of the affluent-not
in the social tradi-
tion of an Edmund Burke or in the economic tradition of an Adam
Smith but "conservatism" along Latin American lines, where to be con-
servative has often meant doing whatever is necessary to preserve the
mansions on the hills from the menace of the slums below. In the case
of the United States, the threat comes from an underclass that has been
with American society for some years but has been the subject of unre-
alistic analysis and ineffectual, often counterproductive policy. The new
coalition is already afraid of the underclass. In the next few decades, it
is going to have a lot more to be afraid of. Now is the time to bring to-
gether from many chapters throughout the book the implications of cog-
nitive stratification for the underclass.
The Fate of Children
Statistically, it is not good for children to be born either to a single
mother or a married couple of low cognitive ability. But the greatest
problems afflict children unlucky enough to be born to and reared by
unmarried mothers who are below average in intelligence-about 20
percent of children currently being born.[9' They tend to do badly,
socially and economically. They tend to have low cognitive ability
themselves. They suffer disproportionately from behavioral problems.
They will be disproportionately represented in prisons. They are less
likely to marry than others and will themselves produce large propor-
tions of the children born to single women of low intelligence.
Attempts to compensate for cognitive disadvantage at birth have
shown how extraordinarily hard it is to do. Many readers no doubt find
the plight of children to be among the most compelling arguments for
government activism, as we do. Rut inadequate nutrition, physical
abuse, emotional neglect, lack of intellectual stimulation, a chaotic
home environment-all
the things that worry us when we think about
the welfare of children-are
very difficult t o improve from outside the
home when the single mother is incompetent. Incompetent mothers are
highly concentrated among the least intelligent, and their numbers are
growing. In Chapter 15, we discussed differential fertility-a
bloodless
term-and
suggested that the nation is experiencing dysgenic pres-
sure-another
bloodless term. In the metric of human suffering, in-
creasing numbers of children are born into the conditions we most
deplore and the conditions that government is most helpless to affect.
What happens to the child of low intelligence who survives child-
hood and reaches adulthood trying to do his best to be a productive cit-
izen? Out of the many problems we have just sketched, this is the one
we choose to italicize: All of the problems that these children experience will
become worse rather than better as they grow older, for the labor market they
will confront a few decades down the road is going to be much harder for them
to cope with than the labor market is now. There will still be jobs for low-
skill labor, mostly with service businesses and private households, but
the natural wage for those jobs will be low. Attempts to increase their
wage artificially (by raising the minimum wage, for example, or man-
The Emerging White Underclass
- The authors argue that children born to single mothers of low intelligence face severe cognitive and environmental disadvantages that are difficult for government intervention to remedy.
- A 'dysgenic pressure' is identified, where a growing proportion of the population is being born into conditions of poverty and low intellectual stimulation.
- The future labor market is predicted to become increasingly hostile toward low-skill workers, as automation and economic shifts lower the 'natural wage' for simple labor.
- Artificial wage increases, such as minimum wage hikes, are viewed as counterproductive measures that may lead to the total disappearance of low-skill jobs.
- The text suggests that for a specific segment of the population, the cost of education will eventually exceed any potential economic return on that investment.
- A warning is issued regarding the formation of a white 'underclass' driven by rising illegitimacy rates, mirroring trends already seen in Britain.
For many people, there is nothing they can learn that will repay the cost of the teaching.
5 18
Living Together
The Way We Are Headed
5 19
than average voting rates, somewhere in the vicinity of 10 to 15 per-
cent of the votem8 The political clout of this group extends well be-
yond its mere voting size because of its financial contributions to
campaigns and because this group contributes a large proportion of lo-
cal political organizers. The combined weight of the cognitive elite and
the affluent is already considerable. But we asked you to envision to-
morrow, not today. Do you think that the rich in America already have
too much power? Or do you think the intellectuals already have too
much power? We are suggesting that a "yes" to both questions is prob-
ably right. And if you think the power of these groups is too great now,
just watch what happens as their outlooks and interests converge.
Cynical readers will be asking what else is new. The privileged have
always used the law to their advantage. Our own analysis is hardly novel;
it is taken straight from a book of essays written more than two centuries
ago, The Federalist. People are not naturally angelic but self-interested-
else, as Publius pointed out, governments would not be necessary in the
first place. Politically, people form factions to pursue their common
ends. Give them access to government power to further those ends, and
they will take advantage of it. The only modest additions we make to
these ancient truths are two propositions: First, as of the 1990s, the con-
stitutional restraints on how a faction may use government to further
its ends have loosened. Second, an unprecedented coalition of the smart
and the rich will take advantage of this new latitude in new ways.
FACING REALITY ABOUT THE UNDERCLASS
What new ways? There are many possibilities, but the central ones all
involve the underclass. We fear that a new kind of conservatism is be-
coming the dominant ideology of the affluent-not
in the social tradi-
tion of an Edmund Burke or in the economic tradition of an Adam
Smith but "conservatism" along Latin American lines, where to be con-
servative has often meant doing whatever is necessary to preserve the
mansions on the hills from the menace of the slums below. In the case
of the United States, the threat comes from an underclass that has been
with American society for some years but has been the subject of unre-
alistic analysis and ineffectual, often counterproductive policy. The new
coalition is already afraid of the underclass. In the next few decades, it
is going to have a lot more to be afraid of. Now is the time to bring to-
gether from many chapters throughout the book the implications of cog-
nitive stratification for the underclass.
The Fate of Children
Statistically, it is not good for children to be born either to a single
mother or a married couple of low cognitive ability. But the greatest
problems afflict children unlucky enough to be born to and reared by
unmarried mothers who are below average in intelligence-about 20
percent of children currently being born.[9' They tend to do badly,
socially and economically. They tend to have low cognitive ability
themselves. They suffer disproportionately from behavioral problems.
They will be disproportionately represented in prisons. They are less
likely to marry than others and will themselves produce large propor-
tions of the children born to single women of low intelligence.
Attempts to compensate for cognitive disadvantage at birth have
shown how extraordinarily hard it is to do. Many readers no doubt find
the plight of children to be among the most compelling arguments for
government activism, as we do. Rut inadequate nutrition, physical
abuse, emotional neglect, lack of intellectual stimulation, a chaotic
home environment-all
the things that worry us when we think about
the welfare of children-are
very difficult t o improve from outside the
home when the single mother is incompetent. Incompetent mothers are
highly concentrated among the least intelligent, and their numbers are
growing. In Chapter 15, we discussed differential fertility-a
bloodless
term-and
suggested that the nation is experiencing dysgenic pres-
sure-another
bloodless term. In the metric of human suffering, in-
creasing numbers of children are born into the conditions we most
deplore and the conditions that government is most helpless to affect.
What happens to the child of low intelligence who survives child-
hood and reaches adulthood trying to do his best to be a productive cit-
izen? Out of the many problems we have just sketched, this is the one
we choose to italicize: All of the problems that these children experience will
become worse rather than better as they grow older, for the labor market they
will confront a few decades down the road is going to be much harder for them
to cope with than the labor market is now. There will still be jobs for low-
skill labor, mostly with service businesses and private households, but
the natural wage for those jobs will be low. Attempts to increase their
wage artificially (by raising the minimum wage, for example, or man-
520
Living Together
The Way We Are Headed
5 2 1
dating job benefits) may backfire by making alternatives to human la-
bor more affordable and, in many cases, by making the jobs disappear
altogether. People in the bottom quartile of intelligence are becoming
not just increasingly expendable in economic terms; they will sometime
in the not-too-distant future become a net drag. In economic terms and
barring a profound change in direction for our society, many people will
be unable to perform that function so basic to human dignity: putting
more into the world than they take out.
Perhaps a revolution in teaching technology will drastically in-
crease the productivity returns to education for people in the lowest
quartile of intelligence, overturning our pessimistic forecast. But
there are no harbingers of any such revolution as we write. And un-
less such a revolution occurs, all the fine rhetoric about "investing
in human capital" to "make America competitive in the twenty-first
century" is not going to be able to overturn this reality: For many
people, there is nothing they can learn that will repay the cost of the
teaching.
The Emerging White Underchs
The dry tinder for the formation of an underclass community is a large
number of births to single women of low intelligence in a concentrated
spatial area. Sometime in the next few decades it seems likely that
American whites will reach the point of conflagration. The proportion
of white illegitimate births (including Latinos) reached 22 percent in
1991.~'~'
There is nothing about being Caucasian that must slow down
the process. Britain, where the white illegitimacy ratio, which was much
lower than the American white ratio as recently as 1979, hit 32 percent
in 1992 with no signs of slowing down.
When 22 percent of all births are to single women, the proportion in
low-income communities is perhaps twice that. In the NLSY, 43 per-
cent of all births to white women who were below the poverty line were
illegitimate, compared to 7 percent for all white women anywhere above
the poverty line.'"' In the nation at large, we know from the 1992
Census Bureau study of fertility that women with college degrees con-
tribute only 4 percent of white illegitimate babies, while women with a
high school education or less contribute 82 percent. Women with fam-
ily incomes of $75,000 or more contribute 1 percent of white illegiti-
mate babies, while women with family incomes under $20,000
contribute 69 percent.'2 White illegitimacy is overwhelmingly a lower-
class phenomenon.
In the past, whites have not had an "underclass" as such, because the
whites who might qualify have been too scattered among the working
class. Instead, white communities in America had a few streets on the
outskirts of town inhabited by the people who couldn't seem to cope
and skid rows of unattached white men in large cities, but these scat-
terings were seldom large enough to make up a neighborhood. An un-
derclass needs a critical mass, and white America has not had one. But
if the overall white illegitimacy ratio is 22 percent-probably
some-
where in the 40 percent range in low-income communities-and
rising
fast, the question arises: At what point is critical mass reached? How
much illegitimacy can a community tolerate? Nobody knows, but the
historical fact is that the trendlines on black crime, dropout from the
labor force, and illegitimacy all shifted sharply upward as the overall
black illegitimacy ratio passed 25 percent and the rate in low-income
black communities moved past 50 percent.
We need not rely on the analogy with the black experience. White
illegitimacy is also overwhelmingly a lower-cognitive-class phenome-
non, as we detailed in Chapter 8. Three-quarters of all white illegiti-
mate births are to women below average in IQ, and 45 percent are to
women with IQs under 90.~"~
These women are poorly equipped for the
labor market, often poorly equipped to be mothers, and there is no rea-
son to think that the outcomes for their children will be any better than
the outcomes have been for black children. Meanwhile, as never-mar-
ried mothers grow in numbers, the dynamics of the public housing mar-
ket (where they will probably continue to be welcome) and the private
housing market (where they will not) will foster increasing concentra-
tions of whites with high unemployment, high crime, high illegitimacy,
and low cognitive ability, creating communities that look very much
like the inner-city neighborhoods that people now tend to associate
with minorities.
The white cognitive elite is unlikely to greet this development sym-
pathetically. O n the contrary, much of white resentment and fear of the
black underclass has been softened by the complicated mixture of white
guilt and paternalism that has often led white elites so excuse behavior
in blacks that they would not excuse in whites. This does not mean that
white elites will abandon the white underclass, but it does suggest that
the means of dealing with their needs are likely to be brusque.
The Emerging White Underclass
- Statistical data indicates that white illegitimacy is heavily concentrated among women with lower educational attainment, lower income, and below-average IQ scores.
- The author argues that while white poverty was previously geographically scattered, rising illegitimacy rates are creating a 'critical mass' necessary for a distinct white underclass to form.
- Historical trends in black communities suggest that social indicators like crime and labor force dropout deteriorate rapidly once illegitimacy ratios pass specific thresholds.
- The white cognitive elite is predicted to respond to a white underclass with less sympathy and more brusqueness than they have shown toward minority underclasses due to a lack of racial guilt.
- The outmigration of high-ability individuals from inner cities has left those communities with depleted cognitive resources, making social and economic stability harder to maintain.
An underclass needs a critical mass, and white America has not had one.
520
Living Together
The Way We Are Headed
5 2 1
dating job benefits) may backfire by making alternatives to human la-
bor more affordable and, in many cases, by making the jobs disappear
altogether. People in the bottom quartile of intelligence are becoming
not just increasingly expendable in economic terms; they will sometime
in the not-too-distant future become a net drag. In economic terms and
barring a profound change in direction for our society, many people will
be unable to perform that function so basic to human dignity: putting
more into the world than they take out.
Perhaps a revolution in teaching technology will drastically in-
crease the productivity returns to education for people in the lowest
quartile of intelligence, overturning our pessimistic forecast. But
there are no harbingers of any such revolution as we write. And un-
less such a revolution occurs, all the fine rhetoric about "investing
in human capital" to "make America competitive in the twenty-first
century" is not going to be able to overturn this reality: For many
people, there is nothing they can learn that will repay the cost of the
teaching.
The Emerging White Underchs
The dry tinder for the formation of an underclass community is a large
number of births to single women of low intelligence in a concentrated
spatial area. Sometime in the next few decades it seems likely that
American whites will reach the point of conflagration. The proportion
of white illegitimate births (including Latinos) reached 22 percent in
1991.~'~'
There is nothing about being Caucasian that must slow down
the process. Britain, where the white illegitimacy ratio, which was much
lower than the American white ratio as recently as 1979, hit 32 percent
in 1992 with no signs of slowing down.
When 22 percent of all births are to single women, the proportion in
low-income communities is perhaps twice that. In the NLSY, 43 per-
cent of all births to white women who were below the poverty line were
illegitimate, compared to 7 percent for all white women anywhere above
the poverty line.'"' In the nation at large, we know from the 1992
Census Bureau study of fertility that women with college degrees con-
tribute only 4 percent of white illegitimate babies, while women with a
high school education or less contribute 82 percent. Women with fam-
ily incomes of $75,000 or more contribute 1 percent of white illegiti-
mate babies, while women with family incomes under $20,000
contribute 69 percent.'2 White illegitimacy is overwhelmingly a lower-
class phenomenon.
In the past, whites have not had an "underclass" as such, because the
whites who might qualify have been too scattered among the working
class. Instead, white communities in America had a few streets on the
outskirts of town inhabited by the people who couldn't seem to cope
and skid rows of unattached white men in large cities, but these scat-
terings were seldom large enough to make up a neighborhood. An un-
derclass needs a critical mass, and white America has not had one. But
if the overall white illegitimacy ratio is 22 percent-probably
some-
where in the 40 percent range in low-income communities-and
rising
fast, the question arises: At what point is critical mass reached? How
much illegitimacy can a community tolerate? Nobody knows, but the
historical fact is that the trendlines on black crime, dropout from the
labor force, and illegitimacy all shifted sharply upward as the overall
black illegitimacy ratio passed 25 percent and the rate in low-income
black communities moved past 50 percent.
We need not rely on the analogy with the black experience. White
illegitimacy is also overwhelmingly a lower-cognitive-class phenome-
non, as we detailed in Chapter 8. Three-quarters of all white illegiti-
mate births are to women below average in IQ, and 45 percent are to
women with IQs under 90.~"~
These women are poorly equipped for the
labor market, often poorly equipped to be mothers, and there is no rea-
son to think that the outcomes for their children will be any better than
the outcomes have been for black children. Meanwhile, as never-mar-
ried mothers grow in numbers, the dynamics of the public housing mar-
ket (where they will probably continue to be welcome) and the private
housing market (where they will not) will foster increasing concentra-
tions of whites with high unemployment, high crime, high illegitimacy,
and low cognitive ability, creating communities that look very much
like the inner-city neighborhoods that people now tend to associate
with minorities.
The white cognitive elite is unlikely to greet this development sym-
pathetically. O n the contrary, much of white resentment and fear of the
black underclass has been softened by the complicated mixture of white
guilt and paternalism that has often led white elites so excuse behavior
in blacks that they would not excuse in whites. This does not mean that
white elites will abandon the white underclass, but it does suggest that
the means of dealing with their needs are likely to be brusque.
5 2 2
Living Together
The Way We Are Headed
5 23
Spatial Concentration, Low Cognitive Ability, and Underclass Behavior
As the patience of whites for other whites wears thin, the black inner
city will simultaneously be getting worse rather than better. Various
scholars, led by William Julius Wilson, have described the outmigration
of the ablest blacks that has left the inner city without its former lead-
ers and role models.14 Given a mean black IQ of about 85 and the link
between socioeconomic status and IQ within ethnic populations, the
implication is that the black inner city has a population with a mean
IQ somewhere in the low 80s at best, with a correspondingly small tail
in the above-average range.[15'
What is the minimum level of cognitive resources necessary to sus-
tain a community at any given level of social and economic complex-
ity? For sustaining a village of a few hundred people in a premodern
society, the minimum average level is probably quite modest. What is
it for sustaining a modem community? The question is of enormous
practical significance yet remains innocent of any empirical investiga-
tion whatsoever. Perhaps the crucial feature is the average cognitive
ability. Perhaps it is the size of the cadre of high-ability people. Perhaps
it is the weight of the population at low end of the distribution. No one
knows. Whatever the details, a prima facie case exists that the cognitive
resources in the contemporary inner city have fallen below the mini-
mum level. What looked like a rising tide of social problems a genera-
tion ago has come to look more like a fundamental breakdown in social
organization.
One may look for signs that these communities are about to recover.
The crack cocaine epidemic of the 1980s has ebbed, for example, al-
though crack is cheaper than ever, as the savage effects of the drug he-
came evident to younger brothers and sisters. Black grass-roots efforts
to restore the family and combat crime have increased in recent years.
But counterpoised against these forces working on behalf of regenera-
tion within the inner city is a powerful force working against it: A large
majority of the next generation of blacks in the inner city is growing up
without fathers and with limited cognitive ability. The numbers con-
tinue to increase. The outmigration of the able continues.
While we can see how these trends might be reversed, which we de-
scribe in the next and final chapter, let us consider the prospect we face
if they do not. This brings us to the denouement of our prognosis.
THE COMING OF THE CUSTODIAL STATE
When a society reaches a certain overall level of affluence, the haves
begin to feel sympathy toward, if not guilt about, the condition of the
have-nots. Thus dawns the welfare state-the
attempt to raise the poor
and the needy out of their plight. In what direction does the social wel-
fare system evolve when a coalition of the cognitive elite and the af-
fluent continues to accept the main tenets of the welfare state but are
increasingly frightened of and hostile toward the recipients of help?
When the coalition is prepared to spend money but has lost faith that
remedial social programs work? The most likely consequence in our view
is that the cognitive elite, with its commanding position, will imple-
ment an expanded welfare state for the underclass that also keeps it out
from underfoot. Our label for this outcome is the custodial state.16
Should it come to pass, here is a scenario:
Over the next decades, it will become broadly accepted by the cog-
nitive elite that the people we now refer to as the underclass are in that
condition through no fault of their own but because of inherent short-
comings ahout which little can be done. Politicians and intellectuals
alike will become much more open about the role of dysfunctional he-
havior in the underclass, accepting that addiction, violence, unavail-
ability for work, child abuse, and family disorganization will keep most
members of the underclass from fending for themselves. It will be agreed
that the underclass cannot be trusted to use cash wisely. Therefore pol-
icy will consist of greater benefits, but these will be primarily in the form
of services rather than cash. Furthermore, there will be new restrictions.
Specifically, these consequences are plausible:
Child care in the inner city will become primarily the responsibility of the
state. Infants will get better nutrition because they will be spending their
days in day care centers from infancy. Children will get balanced diets
because they will be eating breakfast, lunch, and perhaps supper at
school. Day care centers and schools for elementary students will edge
closer toward comprehensive care facilities, whose staff will try to pro-
vide not only education and medical care but to train children in hy-
giene, sexual socialization, socialization to the world of work, and other
functions that the parents are deemed incapable of providing.
The homeless will vanish. One of the safer predictions is that sometime
in the near future, the cognitive elite will join the broad public senti-
The Coming Custodial State
- The author questions the minimum level of cognitive ability required to sustain a functioning modern community.
- Evidence suggests that cognitive resources in inner cities have fallen below a critical threshold, leading to a breakdown in social organization.
- Despite some grassroots recovery efforts, the continuous outmigration of high-ability individuals and rising fatherlessness create a cycle of decline.
- The 'cognitive elite' is predicted to shift from remedial social programs to a policy of containment and management.
- This 'custodial state' would provide extensive services like state-run childcare and nutrition instead of cash to an underclass deemed incapable of self-sufficiency.
- The transition is driven by a combination of affluent sympathy and a growing fear of the underclass's perceived inherent shortcomings.
The most likely consequence in our view is that the cognitive elite, with its commanding position, will implement an expanded welfare state for the underclass that also keeps it out from underfoot.
5 2 2
Living Together
The Way We Are Headed
5 23
Spatial Concentration, Low Cognitive Ability, and Underclass Behavior
As the patience of whites for other whites wears thin, the black inner
city will simultaneously be getting worse rather than better. Various
scholars, led by William Julius Wilson, have described the outmigration
of the ablest blacks that has left the inner city without its former lead-
ers and role models.14 Given a mean black IQ of about 85 and the link
between socioeconomic status and IQ within ethnic populations, the
implication is that the black inner city has a population with a mean
IQ somewhere in the low 80s at best, with a correspondingly small tail
in the above-average range.[15'
What is the minimum level of cognitive resources necessary to sus-
tain a community at any given level of social and economic complex-
ity? For sustaining a village of a few hundred people in a premodern
society, the minimum average level is probably quite modest. What is
it for sustaining a modem community? The question is of enormous
practical significance yet remains innocent of any empirical investiga-
tion whatsoever. Perhaps the crucial feature is the average cognitive
ability. Perhaps it is the size of the cadre of high-ability people. Perhaps
it is the weight of the population at low end of the distribution. No one
knows. Whatever the details, a prima facie case exists that the cognitive
resources in the contemporary inner city have fallen below the mini-
mum level. What looked like a rising tide of social problems a genera-
tion ago has come to look more like a fundamental breakdown in social
organization.
One may look for signs that these communities are about to recover.
The crack cocaine epidemic of the 1980s has ebbed, for example, al-
though crack is cheaper than ever, as the savage effects of the drug he-
came evident to younger brothers and sisters. Black grass-roots efforts
to restore the family and combat crime have increased in recent years.
But counterpoised against these forces working on behalf of regenera-
tion within the inner city is a powerful force working against it: A large
majority of the next generation of blacks in the inner city is growing up
without fathers and with limited cognitive ability. The numbers con-
tinue to increase. The outmigration of the able continues.
While we can see how these trends might be reversed, which we de-
scribe in the next and final chapter, let us consider the prospect we face
if they do not. This brings us to the denouement of our prognosis.
THE COMING OF THE CUSTODIAL STATE
When a society reaches a certain overall level of affluence, the haves
begin to feel sympathy toward, if not guilt about, the condition of the
have-nots. Thus dawns the welfare state-the
attempt to raise the poor
and the needy out of their plight. In what direction does the social wel-
fare system evolve when a coalition of the cognitive elite and the af-
fluent continues to accept the main tenets of the welfare state but are
increasingly frightened of and hostile toward the recipients of help?
When the coalition is prepared to spend money but has lost faith that
remedial social programs work? The most likely consequence in our view
is that the cognitive elite, with its commanding position, will imple-
ment an expanded welfare state for the underclass that also keeps it out
from underfoot. Our label for this outcome is the custodial state.16
Should it come to pass, here is a scenario:
Over the next decades, it will become broadly accepted by the cog-
nitive elite that the people we now refer to as the underclass are in that
condition through no fault of their own but because of inherent short-
comings ahout which little can be done. Politicians and intellectuals
alike will become much more open about the role of dysfunctional he-
havior in the underclass, accepting that addiction, violence, unavail-
ability for work, child abuse, and family disorganization will keep most
members of the underclass from fending for themselves. It will be agreed
that the underclass cannot be trusted to use cash wisely. Therefore pol-
icy will consist of greater benefits, but these will be primarily in the form
of services rather than cash. Furthermore, there will be new restrictions.
Specifically, these consequences are plausible:
Child care in the inner city will become primarily the responsibility of the
state. Infants will get better nutrition because they will be spending their
days in day care centers from infancy. Children will get balanced diets
because they will be eating breakfast, lunch, and perhaps supper at
school. Day care centers and schools for elementary students will edge
closer toward comprehensive care facilities, whose staff will try to pro-
vide not only education and medical care but to train children in hy-
giene, sexual socialization, socialization to the world of work, and other
functions that the parents are deemed incapable of providing.
The homeless will vanish. One of the safer predictions is that sometime
in the near future, the cognitive elite will join the broad public senti-
The Emerging Custodial State
- The state will increasingly assume parental roles, providing hygiene, socialization, and work training for children of parents deemed incapable.
- Public sentiment and the 'cognitive elite' will shift toward reasserting control over public spaces, leading to the institutionalization of the homeless and mentally incompetent.
- Law enforcement will likely return to aggressive tactics like stop-and-frisk, aided by new surveillance technologies such as electronic bracelets and national ID cards.
- Social services will be concentrated in inner cities, effectively segregating the underclass and creating an impassable cultural gap between them and the rest of society.
- Despite new rounds of social programming, the underclass is predicted to grow as local cultures of crime and welfare overwhelm the efforts of responsible low-income parents.
The gaping cultural gap between the habits of the underclass and the habits of the rest of society, far more impassable than a simple economic gap between poor and not poor or the racial gap of black and white, will make it increasingly difficult for children who have grown up in the inner city to function in the larger society even when they want to.
5 2 2
Living Together
The Way We Are Headed
5 23
Spatial Concentration, Low Cognitive Ability, and Underclass Behavior
As the patience of whites for other whites wears thin, the black inner
city will simultaneously be getting worse rather than better. Various
scholars, led by William Julius Wilson, have described the outmigration
of the ablest blacks that has left the inner city without its former lead-
ers and role models.14 Given a mean black IQ of about 85 and the link
between socioeconomic status and IQ within ethnic populations, the
implication is that the black inner city has a population with a mean
IQ somewhere in the low 80s at best, with a correspondingly small tail
in the above-average range.[15'
What is the minimum level of cognitive resources necessary to sus-
tain a community at any given level of social and economic complex-
ity? For sustaining a village of a few hundred people in a premodern
society, the minimum average level is probably quite modest. What is
it for sustaining a modem community? The question is of enormous
practical significance yet remains innocent of any empirical investiga-
tion whatsoever. Perhaps the crucial feature is the average cognitive
ability. Perhaps it is the size of the cadre of high-ability people. Perhaps
it is the weight of the population at low end of the distribution. No one
knows. Whatever the details, a prima facie case exists that the cognitive
resources in the contemporary inner city have fallen below the mini-
mum level. What looked like a rising tide of social problems a genera-
tion ago has come to look more like a fundamental breakdown in social
organization.
One may look for signs that these communities are about to recover.
The crack cocaine epidemic of the 1980s has ebbed, for example, al-
though crack is cheaper than ever, as the savage effects of the drug he-
came evident to younger brothers and sisters. Black grass-roots efforts
to restore the family and combat crime have increased in recent years.
But counterpoised against these forces working on behalf of regenera-
tion within the inner city is a powerful force working against it: A large
majority of the next generation of blacks in the inner city is growing up
without fathers and with limited cognitive ability. The numbers con-
tinue to increase. The outmigration of the able continues.
While we can see how these trends might be reversed, which we de-
scribe in the next and final chapter, let us consider the prospect we face
if they do not. This brings us to the denouement of our prognosis.
THE COMING OF THE CUSTODIAL STATE
When a society reaches a certain overall level of affluence, the haves
begin to feel sympathy toward, if not guilt about, the condition of the
have-nots. Thus dawns the welfare state-the
attempt to raise the poor
and the needy out of their plight. In what direction does the social wel-
fare system evolve when a coalition of the cognitive elite and the af-
fluent continues to accept the main tenets of the welfare state but are
increasingly frightened of and hostile toward the recipients of help?
When the coalition is prepared to spend money but has lost faith that
remedial social programs work? The most likely consequence in our view
is that the cognitive elite, with its commanding position, will imple-
ment an expanded welfare state for the underclass that also keeps it out
from underfoot. Our label for this outcome is the custodial state.16
Should it come to pass, here is a scenario:
Over the next decades, it will become broadly accepted by the cog-
nitive elite that the people we now refer to as the underclass are in that
condition through no fault of their own but because of inherent short-
comings ahout which little can be done. Politicians and intellectuals
alike will become much more open about the role of dysfunctional he-
havior in the underclass, accepting that addiction, violence, unavail-
ability for work, child abuse, and family disorganization will keep most
members of the underclass from fending for themselves. It will be agreed
that the underclass cannot be trusted to use cash wisely. Therefore pol-
icy will consist of greater benefits, but these will be primarily in the form
of services rather than cash. Furthermore, there will be new restrictions.
Specifically, these consequences are plausible:
Child care in the inner city will become primarily the responsibility of the
state. Infants will get better nutrition because they will be spending their
days in day care centers from infancy. Children will get balanced diets
because they will be eating breakfast, lunch, and perhaps supper at
school. Day care centers and schools for elementary students will edge
closer toward comprehensive care facilities, whose staff will try to pro-
vide not only education and medical care but to train children in hy-
giene, sexual socialization, socialization to the world of work, and other
functions that the parents are deemed incapable of providing.
The homeless will vanish. One of the safer predictions is that sometime
in the near future, the cognitive elite will join the broad public senti-
5 24
Living Together
The Way We Are Headed
5 25
ment in favor of reasserting control over public spaces. It will become
easier to consign mentally incompetent adults to custodial care. Perhaps
the clinically borderline cases that now constitute a high proportion of
the homeless will be required to reside in shelters, more elaborately
equipped and staffed than most homeless shelters are today. Police will
be returned their authority to roust people and enforce laws prohibiting
disorderly conduct.
Strict policing and custodial responses to crime will become more accept-
able and widespread. This issue could play out in several ways. The crime
rate in affluent suburbs may be low enough to keep the pressure for re-
form low. But events in the early 1990s suggest that fear of crime is ris-
ing, and support for strict law enforcement is increasing.
One possibility is that a variety of old police practices-especially the
stop-and-frisk-will
quietly come back into use in new guises. New pris-
ons will continue to be built, and the cells already available will be used
more efficiently to incarcerate dangerous offenders (for example, by
eliminating mandatory sentences for certain drug offenses and by in-
carcerating less serious offenders in camps rather than prisons). Tech-
nology will provide new options for segregating and containing
criminals, as the electronic bracelets now being used to enforce house
arrest (or perhaps "neighborhood arrest") become more flexible and
foolproof. Another possibility is that support will grow for a national
system of identification cards, coded with personal information includ-
ing criminal record. The possibilities for police surveillance and control
of behavior are expanding rapidly. Until recently, the cognitive elite has
predominantly opposed the use of such technology. In a few years, we
predict, it will not.
The underclass will become even more concentrated spatially than it is to-
day. The expanded network of day care centers, homeless shelters, pub-
lic housing, and other services will always be located in the poorest part
of the inner city, which means that anyone who wants access to them
will have to live there. Political support for such measures as relocation
of people from the inner city to the suburbs, never strong to begin with,
will wither altogether, The gaping cultural gap between the habits of
the underclass and the habits of the rest of society, far more impassable
than a simple economic gap between poor and not poor or the racial
gap of black and white, will make it increasingly difficult for children
who have grown up in the inner city to function in the larger society
even when they want to.
The underclass will grow. During the 1980s, scholars found evidence
that the size of the underclass was no longer expanding.17 But even as
they wrote, the welfare rolls, which had moved within a narrow range
since the late 1970s, began to surge again. The government will try yet
another round of the customary social programs-sex
education, job
training, parenting training, and the like-and
they will be as ineffec-
tual this round as they were in the 1960s and 1970s." Meanwhile, many
low-income parents who try to do all the right things and pass their val-
ues on to their children will be increasingly unable to do so. They can-
not propagate their norms in the face of a local culture in which
illegitimacy, welfare, crime, and drugs are commonplace, and there is
nothing magically invulnerable about them or their children. Some of
the reforms we have described will be improvements-crime
might ac-
tually drop in the inner city as well as in the other parts of town, for ex-
ample-but
the main effect will be to make it harder for the children
in these solid and conventional working-class families to emulate their
parents. Marriage, steady employment, and responsible behavior of
many kinds will fall among the next generation, and some portion of
the working class will become members of the underclass. Few children
of those already in the underclass will escape.
Social budgets and measures for social control will become still more cen-
tralized. The growing numbers of illegitimate children born to poor
women will have multiplier effects on social welfare budgets-directly
and through increased indirect costs generated in the educational and
law enforcement systems. As states become overwhelmed, the current
cost sharing between the states and federal government will shift toward
the federal budget. The mounting costs will also generate intense po-
litical pressure on Washington to do something. Unable to bring itself
to do away with the welfare edifice-for
by that time it will be assumed
that social chaos will follow any radical cutback-the
government will
continue to try to engineer behavior through new programs and regu-
lations. As time goes on and hostility toward the welfare-dependent in-
creases, those policies are likely to become authoritarian and rely
increasingly on custodial care.
Racism will reemerge in a new and more virulent form. The tension be-
tween what the white elite is supposed to think and what it is actually
thinking about race will reach something close to a breaking point. This
pessimistic prognosis must be contemplated: When the break comes,
the result, as so often happens when cognitive dissonance is resolved,
The Rise of Custodialism
- The erosion of traditional working-class values will lead to a generational shift where many children fall into a permanent underclass.
- Social welfare budgets will face massive strain, forcing a shift from state-level funding to centralized federal control and regulation.
- Increasing hostility toward the welfare-dependent may transform social policy into an authoritarian system focused on custodial care.
- A new, virulent form of racism may reemerge as the cognitive elite's private thoughts clash with their public rhetoric, leading to a dangerous overreaction.
- The 'custodial state' is envisioned as a high-tech version of a reservation system where a significant minority becomes permanent wards of the state.
- The cognitive elite is projected to move from a tacit to an explicit support of these totalitarian-leaning social management policies.
In short, by custodial state, we have in mind a high-tech and more lavish version of the Indian reservation for some substantial minority of the nation's population, while the rest of America tries to go about its business.
5 24
Living Together
The Way We Are Headed
5 25
ment in favor of reasserting control over public spaces. It will become
easier to consign mentally incompetent adults to custodial care. Perhaps
the clinically borderline cases that now constitute a high proportion of
the homeless will be required to reside in shelters, more elaborately
equipped and staffed than most homeless shelters are today. Police will
be returned their authority to roust people and enforce laws prohibiting
disorderly conduct.
Strict policing and custodial responses to crime will become more accept-
able and widespread. This issue could play out in several ways. The crime
rate in affluent suburbs may be low enough to keep the pressure for re-
form low. But events in the early 1990s suggest that fear of crime is ris-
ing, and support for strict law enforcement is increasing.
One possibility is that a variety of old police practices-especially the
stop-and-frisk-will
quietly come back into use in new guises. New pris-
ons will continue to be built, and the cells already available will be used
more efficiently to incarcerate dangerous offenders (for example, by
eliminating mandatory sentences for certain drug offenses and by in-
carcerating less serious offenders in camps rather than prisons). Tech-
nology will provide new options for segregating and containing
criminals, as the electronic bracelets now being used to enforce house
arrest (or perhaps "neighborhood arrest") become more flexible and
foolproof. Another possibility is that support will grow for a national
system of identification cards, coded with personal information includ-
ing criminal record. The possibilities for police surveillance and control
of behavior are expanding rapidly. Until recently, the cognitive elite has
predominantly opposed the use of such technology. In a few years, we
predict, it will not.
The underclass will become even more concentrated spatially than it is to-
day. The expanded network of day care centers, homeless shelters, pub-
lic housing, and other services will always be located in the poorest part
of the inner city, which means that anyone who wants access to them
will have to live there. Political support for such measures as relocation
of people from the inner city to the suburbs, never strong to begin with,
will wither altogether, The gaping cultural gap between the habits of
the underclass and the habits of the rest of society, far more impassable
than a simple economic gap between poor and not poor or the racial
gap of black and white, will make it increasingly difficult for children
who have grown up in the inner city to function in the larger society
even when they want to.
The underclass will grow. During the 1980s, scholars found evidence
that the size of the underclass was no longer expanding.17 But even as
they wrote, the welfare rolls, which had moved within a narrow range
since the late 1970s, began to surge again. The government will try yet
another round of the customary social programs-sex
education, job
training, parenting training, and the like-and
they will be as ineffec-
tual this round as they were in the 1960s and 1970s." Meanwhile, many
low-income parents who try to do all the right things and pass their val-
ues on to their children will be increasingly unable to do so. They can-
not propagate their norms in the face of a local culture in which
illegitimacy, welfare, crime, and drugs are commonplace, and there is
nothing magically invulnerable about them or their children. Some of
the reforms we have described will be improvements-crime
might ac-
tually drop in the inner city as well as in the other parts of town, for ex-
ample-but
the main effect will be to make it harder for the children
in these solid and conventional working-class families to emulate their
parents. Marriage, steady employment, and responsible behavior of
many kinds will fall among the next generation, and some portion of
the working class will become members of the underclass. Few children
of those already in the underclass will escape.
Social budgets and measures for social control will become still more cen-
tralized. The growing numbers of illegitimate children born to poor
women will have multiplier effects on social welfare budgets-directly
and through increased indirect costs generated in the educational and
law enforcement systems. As states become overwhelmed, the current
cost sharing between the states and federal government will shift toward
the federal budget. The mounting costs will also generate intense po-
litical pressure on Washington to do something. Unable to bring itself
to do away with the welfare edifice-for
by that time it will be assumed
that social chaos will follow any radical cutback-the
government will
continue to try to engineer behavior through new programs and regu-
lations. As time goes on and hostility toward the welfare-dependent in-
creases, those policies are likely to become authoritarian and rely
increasingly on custodial care.
Racism will reemerge in a new and more virulent form. The tension be-
tween what the white elite is supposed to think and what it is actually
thinking about race will reach something close to a breaking point. This
pessimistic prognosis must be contemplated: When the break comes,
the result, as so often happens when cognitive dissonance is resolved,
526
Living Together
will be an overreaction in the other direction. Instead of the candor and
realism about race that is so urgently needed, the nation will be faced
with racial divisiveness and hostility that is as great as, or greater, than
America experienced before the civil rights movement. We realize how
outlandish it seems to predict that educated and influential Americans,
who have been so puritanical about racial conversation, will openly re-
vert to racism. We would not go so far as to say it is probable. It is, how-
ever, more than just possible. If it were to happen, all the scenarios for
the custodial state would be more unpleasant-more
vicious-than
anyone can now imagine.
In short, by custodial state, we have in mind a high-tech and more lav-
ish version of the Indian reservation for some substantial minority of
the nation's population, while the rest of America tries to go about its
business. In its less benign forms, the solutions will become more and
more totalitarian. Benign or otherwise, "going about its business" in the
old sense will not be possible. It is difficult to imagine the United States
preserving its heritage of individualism, equal rights before the law, free
people running their own lives, once it is accepted that a significant part
of the population must be made permanent wards of the state.
Extrapolating from current trends, we project that the policies ofcus-
todialism will be not only tolerated but actively supported hy a consen-
sus of the cognitive elite. To some extent, we are not even really
projecting but reporting. The main difference between the position of
the cognitive elite that we portray here and the one that exists today is
to some extent nothing more than the distinction between tacit and ex-
plicit.
If we wish to avoid this prospect for the future, we cannot count on
the natural course of events to make things come out right. Now is the
time to think hard about how a society in which a cognitive elite dom-
inates and in which below-average cognitive ability is increasingly a
handicap can also be a society that makes good on the fundamental
promise of the American tradition: the opportunity for everyone, not
just the lucky ones, to live a satisfying life. That is the task to which we
now turn.
Chapter 22
A Place for Everyone
H
ow should policy deal with the twin realities that people differ in
intelligence for reasons that are not their fault, and that intelli-
gence has a powerful bearing on how well people do in life?
The answer of the twentieth century has been that government
should create the equality of condition that society has neglected to pro-
duce on its own. The assumption that egalitarianism is the proper ideal,
however difficult it may be to achieve in practice, suffuses contempo-
rary political theory. Socialism, communism, social democracy, and
America's welfare state have been different ways of moving toward the
egalitarian ideal. The phrase social justice has become virtually a syn-
onym for economic and social equality.
Until now, these political movements have focused on the evils of
systems in producing inequality. Human beings are potentially pretty
much the same, the dominant political doctrine has argued, except for
the inequalities produced by society. These same thinkers have gener-
ally rejected, often vitriolically, arguments that individual differences
such as intelligence are to blame. But there is no reason why they could
not shift ground. In many ways, the material in this book is tailor-made
for their case. If it's not someone's fault that he is less intelligent than
others, why should he be penalized in his income and social status?
We could respond with a defense of income differences. For exam-
ple, it is justified to pay the high-IQ businessman and engineer more
than the low-IQ ditch digger, producing income inequality, because
that's the only way to make the economy grow and produce more wealth
in which the ditch digger can share. We could grant that it is a matter
not of just deserts but of economic pragmatism about how to produce
compensating benefits for the least advantaged members of society.'
A Place for Everyone
- The authors address how policy should handle the reality that intelligence is both innate and a primary driver of life success.
- Twentieth-century political movements like socialism and the welfare state have historically sought to engineer equality of condition.
- While egalitarianism blames systemic evils for inequality, the authors suggest their findings on IQ could actually bolster the case for redistributive justice.
- Economic pragmatism justifies income inequality as a tool for growth, but the authors argue that social harmony requires a solution beyond economics.
- The text proposes a return to older intellectual traditions where social stability was found in defining a 'place' for every individual.
- Historical philosophies from Confucius to the Greeks prioritized social roles and hierarchy over the modern ideal of universal equality.
The phrase social justice has become virtually a synonym for economic and social equality.
526
Living Together
will be an overreaction in the other direction. Instead of the candor and
realism about race that is so urgently needed, the nation will be faced
with racial divisiveness and hostility that is as great as, or greater, than
America experienced before the civil rights movement. We realize how
outlandish it seems to predict that educated and influential Americans,
who have been so puritanical about racial conversation, will openly re-
vert to racism. We would not go so far as to say it is probable. It is, how-
ever, more than just possible. If it were to happen, all the scenarios for
the custodial state would be more unpleasant-more
vicious-than
anyone can now imagine.
In short, by custodial state, we have in mind a high-tech and more lav-
ish version of the Indian reservation for some substantial minority of
the nation's population, while the rest of America tries to go about its
business. In its less benign forms, the solutions will become more and
more totalitarian. Benign or otherwise, "going about its business" in the
old sense will not be possible. It is difficult to imagine the United States
preserving its heritage of individualism, equal rights before the law, free
people running their own lives, once it is accepted that a significant part
of the population must be made permanent wards of the state.
Extrapolating from current trends, we project that the policies ofcus-
todialism will be not only tolerated but actively supported hy a consen-
sus of the cognitive elite. To some extent, we are not even really
projecting but reporting. The main difference between the position of
the cognitive elite that we portray here and the one that exists today is
to some extent nothing more than the distinction between tacit and ex-
plicit.
If we wish to avoid this prospect for the future, we cannot count on
the natural course of events to make things come out right. Now is the
time to think hard about how a society in which a cognitive elite dom-
inates and in which below-average cognitive ability is increasingly a
handicap can also be a society that makes good on the fundamental
promise of the American tradition: the opportunity for everyone, not
just the lucky ones, to live a satisfying life. That is the task to which we
now turn.
Chapter 22
A Place for Everyone
H
ow should policy deal with the twin realities that people differ in
intelligence for reasons that are not their fault, and that intelli-
gence has a powerful bearing on how well people do in life?
The answer of the twentieth century has been that government
should create the equality of condition that society has neglected to pro-
duce on its own. The assumption that egalitarianism is the proper ideal,
however difficult it may be to achieve in practice, suffuses contempo-
rary political theory. Socialism, communism, social democracy, and
America's welfare state have been different ways of moving toward the
egalitarian ideal. The phrase social justice has become virtually a syn-
onym for economic and social equality.
Until now, these political movements have focused on the evils of
systems in producing inequality. Human beings are potentially pretty
much the same, the dominant political doctrine has argued, except for
the inequalities produced by society. These same thinkers have gener-
ally rejected, often vitriolically, arguments that individual differences
such as intelligence are to blame. But there is no reason why they could
not shift ground. In many ways, the material in this book is tailor-made
for their case. If it's not someone's fault that he is less intelligent than
others, why should he be penalized in his income and social status?
We could respond with a defense of income differences. For exam-
ple, it is justified to pay the high-IQ businessman and engineer more
than the low-IQ ditch digger, producing income inequality, because
that's the only way to make the economy grow and produce more wealth
in which the ditch digger can share. We could grant that it is a matter
not of just deserts but of economic pragmatism about how to produce
compensating benefits for the least advantaged members of society.'
5 28
Living Together
A Place for Everyone
529
Such arguments make sense to us, as far as they go. After the experience
of the twentieth century, it is hard to imagine that anyone still disagrees
with them. But there are other issues, transcending the efficiency of an
economy. Our central concern since we began writing this book is how
people might live together harmoniously despite fundamental individ-
ual differences. The answer lies outside economics.
The initial purpose of this chapter is to present for your considera-
tion another way of thinking about equality and inequality. It represents
an older intellectual tradition than social democracy or even socialism.
In our view, it is also a wiser tradition, more attuned to the way in which
individuals go about living satisfying lives and to the ways in which so-
cieties thrive. The more specific policy conclusions to which we then
turn cannot be explained apart from this underpinning
THINKING ABOUT EQUALITY AS AN IDEAL
For thousands of years, great political thinkers of East and West tried to
harmonize human differences. For Confucius, society was like his con-
ception of a family-extensions of a ruling father and obedient sons, de-
voted husbands and faithful wives, benign masters and loyal servants.
People were defined by their place, whether in the family or the com-
munity. So too for the ancient Greek and Roman philosophers: place
was all. All the great religious traditions define a place for everyone, if
not on earth then in heaven.
Society was to be ruled by the virtuous and wise few. The everyday
business of the community fell to the less worthy multitude, with the
most menial chores left to the slaves. Neither the Greek democrats nor
the Roman republicans believed that "all men are created equal." Nor
did the great Hindu thinkers of the Asian subcontinent, where one's
work defined one's caste, which in turn circumscribed every other aspect
of life. The ancients accepted the basic premise that people differ funda-
mentally and importantly and searched for ways in which people could
contentedly serve the community (or the monarch or the tyrant or the
gods), rather than themselves, despite their differences. Philosophers ar-
gued about obligations and duties, what they are and on whom they fall.
In our historical era, political philosophers have argued instead about
rights. They do so because they are trying to solve a different problem.
The great transformation from a search for duties and obligations to a
search for rights may be dated with Thomas Hobbes, writing in the mid-
1600s about a principle whereby all people, not just the rich and well
born, might have equal rights to liberty.' Everyone, said Hobbes, is enti-
tled to as much liberty in gratifying his desires as he is willing to allow
others in gratifying theirs.'" People differ, acknowledged Hobbes, but
they do not differ so much that they may justifiably be deprived of lib-
erty by differing amounts. In the modernview that Hobbes helpedshape,
individuals freely accept constraints on their own behavior in exchange
for ridding themselves of the dangers of living in perfect freedom, hence
perfect anarchy.14' The constraints constitute lawful government.
Hobbes believed that the only alternatives for human society are, in
effect, anarchy or absolute monarchy. Given those alternatives, said
Hobbes, a rational person would choose a monarch to ensure the equal-
ity of political rights, rather than take his chances with perfect freedom.
His successor in English political thought, John Locke, did not accept
the Hobbesian choice between despotism and anarchy. He conceived
of people in a state of nature as being in "a State also of Equality, wherein
all the Power and Jurisdiction is reciprocal, no one having more than
an~ther,"~
and sought to preserve that condition in actual societies
through a strictly limited government. What Locke propounded is es-
pecially pertinent here because it was his theory that the American
Founders brought into reality.
But with Locke also arose a confusion, which has grown steadily with
passing time. For most contemporary Americans who are aware of Locke
at all, he is identified with the idea of man as tabula rasa, a blank slate
on which experience writes. Without experience, Locke is often be-
lieved to have said, individuals are both equal and empty, a blank slate
to be written upon by the environment. Many contemporary libertari.
ans who draw their inspiration from Locke are hostile to the possibility
of genetic differences in intelligence because of their conviction that
equal rights apply only if in fact people at birth are tabulae rasae. With
that in mind, consider these remarks about human intelligence from
Locke's An Essay on Humn Understanding:
Now that there is such a difference between men in respect of their
understandings, I think nobody who has had any conversation with
his neighbors will question. . , . Which great difference in men's in-
tellectuals, whether it rises from any defect in the organs of the body
particularly adapted to thinking, or in the dullness or untractableness
of those faculties for want of use, or, as some think, in the natural dif-
From Duties to Rights
- Ancient societies focused on duties and obligations based on fixed castes, seeking ways for diverse people to serve the community rather than themselves.
- Thomas Hobbes shifted political philosophy toward equal rights to liberty, arguing that individuals accept government constraints to avoid the dangers of anarchy.
- John Locke expanded on Hobbes by rejecting absolute monarchy in favor of a limited government that preserves a natural state of equality.
- Modern interpretations often mistakenly link Locke's 'blank slate' concept to a requirement for biological identity, fearing that genetic differences undermine equal rights.
- Locke himself acknowledged profound intellectual differences between individuals, even comparing the cognitive gap between some men to that between men and beasts.
- The American Founders' political reality was built upon Locke’s theory of rights, which persists despite growing confusion over the nature of human equality.
Only this is evident, that there is a difference of degrees in men's understandings, apprehensions, and reasonings, to so great a latitude that one may, without doing injury to mankind, affirm that there is a greater distance between some men and others in this respect, than between some men and some beasts.
5 28
Living Together
A Place for Everyone
529
Such arguments make sense to us, as far as they go. After the experience
of the twentieth century, it is hard to imagine that anyone still disagrees
with them. But there are other issues, transcending the efficiency of an
economy. Our central concern since we began writing this book is how
people might live together harmoniously despite fundamental individ-
ual differences. The answer lies outside economics.
The initial purpose of this chapter is to present for your considera-
tion another way of thinking about equality and inequality. It represents
an older intellectual tradition than social democracy or even socialism.
In our view, it is also a wiser tradition, more attuned to the way in which
individuals go about living satisfying lives and to the ways in which so-
cieties thrive. The more specific policy conclusions to which we then
turn cannot be explained apart from this underpinning
THINKING ABOUT EQUALITY AS AN IDEAL
For thousands of years, great political thinkers of East and West tried to
harmonize human differences. For Confucius, society was like his con-
ception of a family-extensions of a ruling father and obedient sons, de-
voted husbands and faithful wives, benign masters and loyal servants.
People were defined by their place, whether in the family or the com-
munity. So too for the ancient Greek and Roman philosophers: place
was all. All the great religious traditions define a place for everyone, if
not on earth then in heaven.
Society was to be ruled by the virtuous and wise few. The everyday
business of the community fell to the less worthy multitude, with the
most menial chores left to the slaves. Neither the Greek democrats nor
the Roman republicans believed that "all men are created equal." Nor
did the great Hindu thinkers of the Asian subcontinent, where one's
work defined one's caste, which in turn circumscribed every other aspect
of life. The ancients accepted the basic premise that people differ funda-
mentally and importantly and searched for ways in which people could
contentedly serve the community (or the monarch or the tyrant or the
gods), rather than themselves, despite their differences. Philosophers ar-
gued about obligations and duties, what they are and on whom they fall.
In our historical era, political philosophers have argued instead about
rights. They do so because they are trying to solve a different problem.
The great transformation from a search for duties and obligations to a
search for rights may be dated with Thomas Hobbes, writing in the mid-
1600s about a principle whereby all people, not just the rich and well
born, might have equal rights to liberty.' Everyone, said Hobbes, is enti-
tled to as much liberty in gratifying his desires as he is willing to allow
others in gratifying theirs.'" People differ, acknowledged Hobbes, but
they do not differ so much that they may justifiably be deprived of lib-
erty by differing amounts. In the modernview that Hobbes helpedshape,
individuals freely accept constraints on their own behavior in exchange
for ridding themselves of the dangers of living in perfect freedom, hence
perfect anarchy.14' The constraints constitute lawful government.
Hobbes believed that the only alternatives for human society are, in
effect, anarchy or absolute monarchy. Given those alternatives, said
Hobbes, a rational person would choose a monarch to ensure the equal-
ity of political rights, rather than take his chances with perfect freedom.
His successor in English political thought, John Locke, did not accept
the Hobbesian choice between despotism and anarchy. He conceived
of people in a state of nature as being in "a State also of Equality, wherein
all the Power and Jurisdiction is reciprocal, no one having more than
an~ther,"~
and sought to preserve that condition in actual societies
through a strictly limited government. What Locke propounded is es-
pecially pertinent here because it was his theory that the American
Founders brought into reality.
But with Locke also arose a confusion, which has grown steadily with
passing time. For most contemporary Americans who are aware of Locke
at all, he is identified with the idea of man as tabula rasa, a blank slate
on which experience writes. Without experience, Locke is often be-
lieved to have said, individuals are both equal and empty, a blank slate
to be written upon by the environment. Many contemporary libertari.
ans who draw their inspiration from Locke are hostile to the possibility
of genetic differences in intelligence because of their conviction that
equal rights apply only if in fact people at birth are tabulae rasae. With
that in mind, consider these remarks about human intelligence from
Locke's An Essay on Humn Understanding:
Now that there is such a difference between men in respect of their
understandings, I think nobody who has had any conversation with
his neighbors will question. . , . Which great difference in men's in-
tellectuals, whether it rises from any defect in the organs of the body
particularly adapted to thinking, or in the dullness or untractableness
of those faculties for want of use, or, as some think, in the natural dif-
530
Living Together
A Place for Everyone
53 1
ferences of men's souls themselves; or some or all of these together,
it matters not here to examine. Only this is evident, that there is a
difference of degrees in men's understandings, apprehensions, and
reasonings, to so great a latitude that one may, without doing injury
to mankind, affirm that there is a greater distance between some men
and others in this respect, than between some men and some beasts6
Locke is strikingly indifferent to the source of cognitive differences
and strikingly harsh in his judgment about their size. But that does not
mean he believed people to have different rights. They are equal in
rights, Locke proclaimed, though they be unequal in everything else.
Those rights, however, are negative rights (to impose contemporary ter-
minology): They give all human beings the right not to have certain
things done to them by the state or by other human beings, not the right
to anything, except freedom of action.
This way of putting it is out of tune with the modem sensibility. The
original concept of equal rights is said to be meaningless cant, out-
moded; taking equal rights seriously, it is thought, requires enforcing
equal outcomes. The prevailing political attitude is so dismissive toward
the older conception of equal rights that it is difficult to think of seri-
ous public treatments of it; the Founders just didn't think hard enough
about that problem, it seems to be assumed. If he were alive today, some
eminent political scientists have argued, Thomas Jefferson would surely
be a social democrat or at least a New Deal Democrat.' We are asking
that you consider the alternative: that the Founders were fully aware of
how unequal people are, that they did not try to explain away natural
inequalities, and that they nonetheless thought the best way for people
to live together was under a system of equal rights.
The Founders wrote frankly about the inequality of men. For Thomas
Jefferson, it was obvious that they were especially unequal in virtue and
intelligence. He was thankful for a "natural aristocracy" that could
counterbalance the deficiencies of the others, an "aristocracy of virtue
and talent, which Nature has wisely provided for the direction of the
interests of society."' It was, he once wrote, "the most precious gift of
nature," and he thought that the best government was one that most
efficiently brought the natural aristocracy to high positions.9
Jefferson saw the consequences of inequalities of ability radiating
throughout the institutions of society. The main purpose of education,
he believed, was to prepare the natural aristocracy to govern, and he did
not mince words. The "best geniuses" should be "raked from the rub-
bish annuallyn by competitive grading and examinations, sent on to the
next educational stage, and finally called to public
But if the au-
thor of the Declaration of Independence was by today's standards unre-
pentantly elitist, he was nonetheless a democrat in his belief that the
natural aristocracy was "scattered with equal hand through all [of soci-
ety's] conditions,"" and in his confidence that the electorate had the
good sense to choose them. "Leave to the citizens the free election and
separation of the aristoi from the pseudo-aristoi," he advised. "In general,
they will elect the real good and wise."12 For Madison, the "great re-
publican principle" was that the common people would have the pub-
lic-spiritedness and the information necessary to choose "men of virtue
and wisdom" to govern them.13 For both Jefferson and Madison, politi-
cal equality was both right and workable. They would have been amazed
by the notion that humans are equal in any other sense.
Nor were Jefferson's and Madison's views a reflection of their south-
em heritage. John Adams, that quintessential Yankee, agreed that "nat-
ural aristocracy is a fact essential to be considered in the institution of
government"-or, as he put it in another instance, "I believe there is as
much in the breed of men as there is in that of horses."I4 He was not as
optimistic as Jefferson and Madison, for he was keenly aware that in-
telligence does not necessarily go with virtue, and he was fearful that
Jefferson's natural aristocracy would within a few generations have ce-
mented its descendants' positions into that of a ruling caste. But he did
not doubt that the reality of human inequalities was of central political
importance. 1151
The other Founders, including Hamilton and Washington, rumi-
nated in the same vein about the inequality of men and the political
implications of that inequality. In doing so, they were following an an-
cient tradition. Political philosophers have always begun from the un-
derstanding that good policy must be in accordance with what is good
for human beings, and that what is good for humans must be based on
an understanding of how they are similar and how they differ. Aristotle
put it earliest and perhaps best: "All men believe that justice means
equality in some sense. . . . The question we must keep in mind is, equal-
ity or inequality in what sort of thing."16
The Founders saw that making a stable and just government was dif-
ficult precisely because men were unequal in every respect except their
right to advance their own interests. Men had "different and unequal
The Founders and Natural Inequality
- The American Founders believed in equal negative rights despite acknowledging profound natural inequalities in human talent and virtue.
- Thomas Jefferson advocated for a 'natural aristocracy' of talent and virtue to lead society, viewing it as nature's most precious gift.
- The original concept of equal rights focused on freedom of action rather than the modern pursuit of equal outcomes or social democracy.
- Jefferson's educational philosophy sought to 'rake from the rubbish' the best geniuses to prepare them for governance.
- While the Founders were elitist by modern standards, they trusted the electorate's ability to distinguish true merit from 'pseudo-aristoi.'
- John Adams shared this recognition of human inequality, though he feared that a natural aristocracy might eventually harden into a hereditary ruling caste.
The 'best geniuses' should be 'raked from the rubbish annually' by competitive grading and examinations, sent on to the next educational stage, and finally called to public service.
530
Living Together
A Place for Everyone
53 1
ferences of men's souls themselves; or some or all of these together,
it matters not here to examine. Only this is evident, that there is a
difference of degrees in men's understandings, apprehensions, and
reasonings, to so great a latitude that one may, without doing injury
to mankind, affirm that there is a greater distance between some men
and others in this respect, than between some men and some beasts6
Locke is strikingly indifferent to the source of cognitive differences
and strikingly harsh in his judgment about their size. But that does not
mean he believed people to have different rights. They are equal in
rights, Locke proclaimed, though they be unequal in everything else.
Those rights, however, are negative rights (to impose contemporary ter-
minology): They give all human beings the right not to have certain
things done to them by the state or by other human beings, not the right
to anything, except freedom of action.
This way of putting it is out of tune with the modem sensibility. The
original concept of equal rights is said to be meaningless cant, out-
moded; taking equal rights seriously, it is thought, requires enforcing
equal outcomes. The prevailing political attitude is so dismissive toward
the older conception of equal rights that it is difficult to think of seri-
ous public treatments of it; the Founders just didn't think hard enough
about that problem, it seems to be assumed. If he were alive today, some
eminent political scientists have argued, Thomas Jefferson would surely
be a social democrat or at least a New Deal Democrat.' We are asking
that you consider the alternative: that the Founders were fully aware of
how unequal people are, that they did not try to explain away natural
inequalities, and that they nonetheless thought the best way for people
to live together was under a system of equal rights.
The Founders wrote frankly about the inequality of men. For Thomas
Jefferson, it was obvious that they were especially unequal in virtue and
intelligence. He was thankful for a "natural aristocracy" that could
counterbalance the deficiencies of the others, an "aristocracy of virtue
and talent, which Nature has wisely provided for the direction of the
interests of society."' It was, he once wrote, "the most precious gift of
nature," and he thought that the best government was one that most
efficiently brought the natural aristocracy to high positions.9
Jefferson saw the consequences of inequalities of ability radiating
throughout the institutions of society. The main purpose of education,
he believed, was to prepare the natural aristocracy to govern, and he did
not mince words. The "best geniuses" should be "raked from the rub-
bish annuallyn by competitive grading and examinations, sent on to the
next educational stage, and finally called to public
But if the au-
thor of the Declaration of Independence was by today's standards unre-
pentantly elitist, he was nonetheless a democrat in his belief that the
natural aristocracy was "scattered with equal hand through all [of soci-
ety's] conditions,"" and in his confidence that the electorate had the
good sense to choose them. "Leave to the citizens the free election and
separation of the aristoi from the pseudo-aristoi," he advised. "In general,
they will elect the real good and wise."12 For Madison, the "great re-
publican principle" was that the common people would have the pub-
lic-spiritedness and the information necessary to choose "men of virtue
and wisdom" to govern them.13 For both Jefferson and Madison, politi-
cal equality was both right and workable. They would have been amazed
by the notion that humans are equal in any other sense.
Nor were Jefferson's and Madison's views a reflection of their south-
em heritage. John Adams, that quintessential Yankee, agreed that "nat-
ural aristocracy is a fact essential to be considered in the institution of
government"-or, as he put it in another instance, "I believe there is as
much in the breed of men as there is in that of horses."I4 He was not as
optimistic as Jefferson and Madison, for he was keenly aware that in-
telligence does not necessarily go with virtue, and he was fearful that
Jefferson's natural aristocracy would within a few generations have ce-
mented its descendants' positions into that of a ruling caste. But he did
not doubt that the reality of human inequalities was of central political
importance. 1151
The other Founders, including Hamilton and Washington, rumi-
nated in the same vein about the inequality of men and the political
implications of that inequality. In doing so, they were following an an-
cient tradition. Political philosophers have always begun from the un-
derstanding that good policy must be in accordance with what is good
for human beings, and that what is good for humans must be based on
an understanding of how they are similar and how they differ. Aristotle
put it earliest and perhaps best: "All men believe that justice means
equality in some sense. . . . The question we must keep in mind is, equal-
ity or inequality in what sort of thing."16
The Founders saw that making a stable and just government was dif-
ficult precisely because men were unequal in every respect except their
right to advance their own interests. Men had "different and unequal
The Limits of Equality
- The American Founders believed that human inequality in faculties and property acquisition is an inherent reality that government must manage rather than eliminate.
- James Madison argued that protecting the unequal faculties of men is the primary objective of government, despite these differences being the source of political factions.
- The authors contend that contemporary egalitarianism fails by underestimating human variation and overestimating the power of political intervention to reshape character.
- Attempts to enforce equality of condition inevitably lead to tyranny because the state must impose uniformity to suppress natural human differences.
- The logic of total egalitarianism is compared to a dystopian ant colony where individual freedom is replaced by compulsory behavior.
People who are free to behave differently from one another in the important affairs of daily life inevitably generate the social and economic inequalities that egalitarianism seeks to suppress.
530
Living Together
A Place for Everyone
53 1
ferences of men's souls themselves; or some or all of these together,
it matters not here to examine. Only this is evident, that there is a
difference of degrees in men's understandings, apprehensions, and
reasonings, to so great a latitude that one may, without doing injury
to mankind, affirm that there is a greater distance between some men
and others in this respect, than between some men and some beasts6
Locke is strikingly indifferent to the source of cognitive differences
and strikingly harsh in his judgment about their size. But that does not
mean he believed people to have different rights. They are equal in
rights, Locke proclaimed, though they be unequal in everything else.
Those rights, however, are negative rights (to impose contemporary ter-
minology): They give all human beings the right not to have certain
things done to them by the state or by other human beings, not the right
to anything, except freedom of action.
This way of putting it is out of tune with the modem sensibility. The
original concept of equal rights is said to be meaningless cant, out-
moded; taking equal rights seriously, it is thought, requires enforcing
equal outcomes. The prevailing political attitude is so dismissive toward
the older conception of equal rights that it is difficult to think of seri-
ous public treatments of it; the Founders just didn't think hard enough
about that problem, it seems to be assumed. If he were alive today, some
eminent political scientists have argued, Thomas Jefferson would surely
be a social democrat or at least a New Deal Democrat.' We are asking
that you consider the alternative: that the Founders were fully aware of
how unequal people are, that they did not try to explain away natural
inequalities, and that they nonetheless thought the best way for people
to live together was under a system of equal rights.
The Founders wrote frankly about the inequality of men. For Thomas
Jefferson, it was obvious that they were especially unequal in virtue and
intelligence. He was thankful for a "natural aristocracy" that could
counterbalance the deficiencies of the others, an "aristocracy of virtue
and talent, which Nature has wisely provided for the direction of the
interests of society."' It was, he once wrote, "the most precious gift of
nature," and he thought that the best government was one that most
efficiently brought the natural aristocracy to high positions.9
Jefferson saw the consequences of inequalities of ability radiating
throughout the institutions of society. The main purpose of education,
he believed, was to prepare the natural aristocracy to govern, and he did
not mince words. The "best geniuses" should be "raked from the rub-
bish annuallyn by competitive grading and examinations, sent on to the
next educational stage, and finally called to public
But if the au-
thor of the Declaration of Independence was by today's standards unre-
pentantly elitist, he was nonetheless a democrat in his belief that the
natural aristocracy was "scattered with equal hand through all [of soci-
ety's] conditions,"" and in his confidence that the electorate had the
good sense to choose them. "Leave to the citizens the free election and
separation of the aristoi from the pseudo-aristoi," he advised. "In general,
they will elect the real good and wise."12 For Madison, the "great re-
publican principle" was that the common people would have the pub-
lic-spiritedness and the information necessary to choose "men of virtue
and wisdom" to govern them.13 For both Jefferson and Madison, politi-
cal equality was both right and workable. They would have been amazed
by the notion that humans are equal in any other sense.
Nor were Jefferson's and Madison's views a reflection of their south-
em heritage. John Adams, that quintessential Yankee, agreed that "nat-
ural aristocracy is a fact essential to be considered in the institution of
government"-or, as he put it in another instance, "I believe there is as
much in the breed of men as there is in that of horses."I4 He was not as
optimistic as Jefferson and Madison, for he was keenly aware that in-
telligence does not necessarily go with virtue, and he was fearful that
Jefferson's natural aristocracy would within a few generations have ce-
mented its descendants' positions into that of a ruling caste. But he did
not doubt that the reality of human inequalities was of central political
importance. 1151
The other Founders, including Hamilton and Washington, rumi-
nated in the same vein about the inequality of men and the political
implications of that inequality. In doing so, they were following an an-
cient tradition. Political philosophers have always begun from the un-
derstanding that good policy must be in accordance with what is good
for human beings, and that what is good for humans must be based on
an understanding of how they are similar and how they differ. Aristotle
put it earliest and perhaps best: "All men believe that justice means
equality in some sense. . . . The question we must keep in mind is, equal-
ity or inequality in what sort of thing."16
The Founders saw that making a stable and just government was dif-
ficult precisely because men were unequal in every respect except their
right to advance their own interests. Men had "different and unequal
53 2
Living Together
A Place for Everyone
533
faculties of acquiring property," Madison reflected in The Federalist.17
This diversity was the very reason why rights of property were so im-
portant and why "the protection of those faculties is the first object of
Government." But the diversity was also the defect of populist democ-
racy, because the unequal distribution of property to which it led was
'"he most common and durable source of factions." And faction, he ar-
gued, was the great danger that the Constitution sought above all to
confine and tame. The task of government was to set unequal persons
into a system of laws and procedures that would, as nearly as possible,
equalize their rights while allowing their differences to express them-
selves. The result would not necessarily be serene or quiet, but it would
be just. It might even work.
In reminding you of these views of the men who founded America,
we are not appealing to their historical eminence, but to their wisdom.
We think they were right. Let us stop using words like factions and fac-
ulties and aristoi and state in our own words, briefly and explicitly, how
and why we think they were right in ways that apply today.
The egalitarian ideal of contemporary political theory underestimates
the importance of the differences that separate human beings. It fails to
come to grips with human variation. It overestimates the ability of po-
litical interventions to shape human character and capacities. The sys-
tems of government that are necessary to carry out the egalitarian agenda
ignore the forces that the Founders described in The Federalist, which
lead inherently and inevitably to tyranny, throughout history and across
cultures. These defects in the egalitarian tradition are reflected in polit-
ical experience, where the failure of the communist bloc to construct
happy societies is palpably apparent and the ultimate fate of even the
more benign egalitarian model in Scandinavia is coming into question.
The perversions of the egalitarian ideal that began with the French
Revolution and have been so plentiful in the twentieth century are not
accidents of history or produced by technical errors in implementation.
Something more inevitable is at work. People who are free to behave
differently from one another in the important affairs of daily life in-
evitably generate the social and economic inequalities that egalitarian-
ism seeks to suppress. That, we believe, is as close to an immutable law
as the uncertainties of sociology permit. To reduce inequality of condi.
tion, the state must impose greater and greater uniformity. Perhaps that
is as close to an immutable law as political science permits. In T. H.
White's version of the Arthurian legend, The Once and Future King,
Merlyn transforms young Arthur into an ant as part of his education in
governance. In this guise, Arthur approaches the entrance to the ant
colony, where over the entrance are written the words, EVERYTHING NOT
FORBIDDEN IS COMPULSORY.'~ Such, in our view, is where the logic of the
egalitarian ideal ultimately leads. It is appropriate in the ant colony or
the beehive but not for human beings. Egalitarian tyrannies, whether
of the Jacobite or the Leninist variety, are worse than inhumane. They
are inhuman.
The same atmosphere prevails on a smaller scale wherever "equality"
comes to serve as the basis for a diffuse moral outlook. Consider the
many small tyrannies in America's contemporary universities, where it
has become objectionable to say that some people are superior to other
people in any way that is relevant to life in society. Nor is this outlook
confined to judgments about people. In art, literature, ethics, and cul-
tural norms, differences are not to be judged. Such relativism has be-
come the moral high ground for many modern commentators on life
and culture.
Even the existence of differences must be discussed gingerly, when
they are human differences, As soon as the differences are associated
with membership in a group, censorship arises. In this book, we have
trod on one of those most sensitive areas by talking about ethnic differ-
ences, but there are many others. In what respects do men differ from
women? Young differ from old? Heterosexuals from homosexuals? The
permissible answers, often even the permissible questions, are sharply
circumscribed. The moral outlook that has become associated with
equality has spawned a vocabulary of its own. Discrimination, once a
useful word with a praiseworthy meaning, is now almost always used in
a pejorative sense. Racism, sexism, ageism, elitism-all
are in common
parlance, and their meanings continue to spread, blotting up more and
more semantic territory.
The ideology of equality has done some good. For example, it is not
possible as a practical matter to be an identifiable racist or sexist and
still hold public office. But most of its effects are bad. Given the power
of contemporary news media to imprint a nationwide image overnight,
mainstream political figures have found that their allegiance to the
rhetoric of equality must extend very far indeed, for a single careless re-
mark can irretrievably damage or even end a public career. In everyday
life, the ideology of equality censors and straitjackets everything from
pedagogy to humor. The ideology of equality has stunted the range of
The Ideology of Equality
- The author argues that the egalitarian ideal is suited for insects like ants or bees but is fundamentally inhuman when applied to human society.
- Contemporary universities and cultural commentators have adopted a relativism that forbids judging differences in art, ethics, or human ability.
- A new vocabulary of pejoratives—such as racism, sexism, and elitism—has expanded to censor discourse and restrict permissible questions about human differences.
- The pressure to adhere to egalitarian rhetoric has stunted moral dialogue, making it difficult to discuss concepts like virtue, excellence, beauty, and truth.
- Governmental and legal principles have shifted from protecting individual freedom to compelling equal outcomes through affirmative action and tort law redistribution.
The ideology of equality has stunted the range of moral dialogue to triviality.
53 2
Living Together
A Place for Everyone
533
faculties of acquiring property," Madison reflected in The Federalist.17
This diversity was the very reason why rights of property were so im-
portant and why "the protection of those faculties is the first object of
Government." But the diversity was also the defect of populist democ-
racy, because the unequal distribution of property to which it led was
'"he most common and durable source of factions." And faction, he ar-
gued, was the great danger that the Constitution sought above all to
confine and tame. The task of government was to set unequal persons
into a system of laws and procedures that would, as nearly as possible,
equalize their rights while allowing their differences to express them-
selves. The result would not necessarily be serene or quiet, but it would
be just. It might even work.
In reminding you of these views of the men who founded America,
we are not appealing to their historical eminence, but to their wisdom.
We think they were right. Let us stop using words like factions and fac-
ulties and aristoi and state in our own words, briefly and explicitly, how
and why we think they were right in ways that apply today.
The egalitarian ideal of contemporary political theory underestimates
the importance of the differences that separate human beings. It fails to
come to grips with human variation. It overestimates the ability of po-
litical interventions to shape human character and capacities. The sys-
tems of government that are necessary to carry out the egalitarian agenda
ignore the forces that the Founders described in The Federalist, which
lead inherently and inevitably to tyranny, throughout history and across
cultures. These defects in the egalitarian tradition are reflected in polit-
ical experience, where the failure of the communist bloc to construct
happy societies is palpably apparent and the ultimate fate of even the
more benign egalitarian model in Scandinavia is coming into question.
The perversions of the egalitarian ideal that began with the French
Revolution and have been so plentiful in the twentieth century are not
accidents of history or produced by technical errors in implementation.
Something more inevitable is at work. People who are free to behave
differently from one another in the important affairs of daily life in-
evitably generate the social and economic inequalities that egalitarian-
ism seeks to suppress. That, we believe, is as close to an immutable law
as the uncertainties of sociology permit. To reduce inequality of condi.
tion, the state must impose greater and greater uniformity. Perhaps that
is as close to an immutable law as political science permits. In T. H.
White's version of the Arthurian legend, The Once and Future King,
Merlyn transforms young Arthur into an ant as part of his education in
governance. In this guise, Arthur approaches the entrance to the ant
colony, where over the entrance are written the words, EVERYTHING NOT
FORBIDDEN IS COMPULSORY.'~ Such, in our view, is where the logic of the
egalitarian ideal ultimately leads. It is appropriate in the ant colony or
the beehive but not for human beings. Egalitarian tyrannies, whether
of the Jacobite or the Leninist variety, are worse than inhumane. They
are inhuman.
The same atmosphere prevails on a smaller scale wherever "equality"
comes to serve as the basis for a diffuse moral outlook. Consider the
many small tyrannies in America's contemporary universities, where it
has become objectionable to say that some people are superior to other
people in any way that is relevant to life in society. Nor is this outlook
confined to judgments about people. In art, literature, ethics, and cul-
tural norms, differences are not to be judged. Such relativism has be-
come the moral high ground for many modern commentators on life
and culture.
Even the existence of differences must be discussed gingerly, when
they are human differences, As soon as the differences are associated
with membership in a group, censorship arises. In this book, we have
trod on one of those most sensitive areas by talking about ethnic differ-
ences, but there are many others. In what respects do men differ from
women? Young differ from old? Heterosexuals from homosexuals? The
permissible answers, often even the permissible questions, are sharply
circumscribed. The moral outlook that has become associated with
equality has spawned a vocabulary of its own. Discrimination, once a
useful word with a praiseworthy meaning, is now almost always used in
a pejorative sense. Racism, sexism, ageism, elitism-all
are in common
parlance, and their meanings continue to spread, blotting up more and
more semantic territory.
The ideology of equality has done some good. For example, it is not
possible as a practical matter to be an identifiable racist or sexist and
still hold public office. But most of its effects are bad. Given the power
of contemporary news media to imprint a nationwide image overnight,
mainstream political figures have found that their allegiance to the
rhetoric of equality must extend very far indeed, for a single careless re-
mark can irretrievably damage or even end a public career. In everyday
life, the ideology of equality censors and straitjackets everything from
pedagogy to humor. The ideology of equality has stunted the range of
534
Living Together
A Place for Everyone
535
moral dialogue to triviality. In daily life--conversations, the lessons
taught in public schools, the kinds of screenplays or newspaper feature
stories that people choose to write-the
moral ascendancy of equality
has made it difficult to use concepts such as virtue, excellence, beauty
and-above
all-truth.
Within the realm of government, small versions of the "everything
not forbidden is compulsory" mentality may be seen everywhere. The
informal old American principle governing personal behavior was that
you could do whatever you wanted as long you didn't force anyone else
to go along with you and as long as you let the other fellow go about his
affairs with equal freedom. The stopping point was defined by the use-
ful adage, "Your freedom to swing your arm stops where my nose be-
gins."" In laws great and small, this principle has been perverted beyond
recognition, as the notions of what constitutes "where my nose begins"
stretch far out into space. The practice of affirmative action has been a
classic example of the "everything not forbidden is compulsory" men-
tality, as the idea of forbidding people to discriminate by race mutated
into the idea of compelling everyone to help produce equal outcomes
by race. In tort law, the destruction of the concept of negligence grew
out of an explicitly egalitarian view of the purpose of liability-not
to
redress individual victims for acts of irresponsibility but to redistribute
goods more equitably.'" In personal life, the idea of forbidding people
from interfering with members of other groups (blacks, homosexuals,
women) as they went about their lives has been extended to the idea of
compelling people to "treat them the same." It is a mark of how far things
have gone that many people no longer can see the distinction between
"not interfering" and "treating the same."
Our views on all of these issues are decidedly traditional. We think
that rights are embedded in our freedom to act, not in the obligations
we may impose on others to act; that equality of rights is crucial while
equality of outcome is not; that concepts such as virtue, excellence,
beauty, and truth should be reintroduced into moral discourse. We are
comfortable with the idea that some things are better than others-not
just according to our subjective point of view but according to endur-
ing standards of merit and inferiority-and
at the same time reject the
thought that we (or anyone else) should have the right to impose those
standards. We are enthusiastic about diversity-the
rich, unending di-
versity that free human beings generate as a matter of course, not the
imposed diversity of group quotas.
And so we come to this final chapter, discussing the broadest policy
implications of all that has gone before. We bring to our recommenda-
tions a predisposition, believing that the original American conceptions
of human equality and the pursuit of happiness still offer the wisest guid-
ance for thinking about how to run today's America. These have been
some of our reasons why.
LETTING PEOPLE FIND VALUED PLACES IN SOCIETY
With these thoughts on the table, let us return to the question that
opened the chapter: How should policy deal with the twin realities that peo-
ple differ in intelligence for reasons that are not their fault and that intelligence
has a powerful bearing on how well people do in life? The answer turns us
back to the ancient concern with place.
The Goal and a Definition
The broadest goal is a society in which people throughout the functional
range of intelligence can find, and feel they have found, a valued place
for themselves. For "valued place," we offer a pragmatic definition: You
occupy a valued place if other people would miss you if you were gone. The
fact that you would be missed means that you were valued. Both the
quality and quantity of valued places are important. Most people hope
to find a soulmate for life, and that means someone who would "miss
you" in the widest and most intense way. The definition captures the
reason why children are so important in defining a valued place. But be-
sides the quality of the valuing, quantity too is important. If a single per-
son would miss you and no one else, you have a fragile hold on your
place in society, no matter how much that one person cares for you. To
have many different people who would miss you, in many different parts
of your life and at many levels of intensity, is a hallmark of a person
whose place is well and thoroughly valued. One way of thinking about
policy options is to ask whether they aid or obstruct this goal of creat-
ing valued places.
Finding Valued Places
The great bulk of the American population is amply equipped, in their
cognitive resources and in other personal characteristics, to find valued
places in society. We must emphasize that, because for hundreds of pages
we have focused on people at the two tails of the bell curve. Now is a
Finding Valued Places
- The authors distinguish between the right to non-interference and the modern demand for equal treatment or outcomes.
- A return to traditional moral discourse is advocated, emphasizing enduring standards of virtue, excellence, and truth over subjective viewpoints.
- True diversity is defined as the natural result of human freedom rather than the artificial implementation of group quotas.
- The primary goal of social policy should be ensuring individuals across the intelligence spectrum can find a 'valued place' in society.
- A 'valued place' is pragmatically defined by the degree to which an individual would be missed by others if they were gone.
- Data suggests social maladies are concentrated at the bottom of the IQ distribution, while the majority of the population is equipped to find social value.
You occupy a valued place if other people would miss you if you were gone.
534
Living Together
A Place for Everyone
535
moral dialogue to triviality. In daily life--conversations, the lessons
taught in public schools, the kinds of screenplays or newspaper feature
stories that people choose to write-the
moral ascendancy of equality
has made it difficult to use concepts such as virtue, excellence, beauty
and-above
all-truth.
Within the realm of government, small versions of the "everything
not forbidden is compulsory" mentality may be seen everywhere. The
informal old American principle governing personal behavior was that
you could do whatever you wanted as long you didn't force anyone else
to go along with you and as long as you let the other fellow go about his
affairs with equal freedom. The stopping point was defined by the use-
ful adage, "Your freedom to swing your arm stops where my nose be-
gins."" In laws great and small, this principle has been perverted beyond
recognition, as the notions of what constitutes "where my nose begins"
stretch far out into space. The practice of affirmative action has been a
classic example of the "everything not forbidden is compulsory" men-
tality, as the idea of forbidding people to discriminate by race mutated
into the idea of compelling everyone to help produce equal outcomes
by race. In tort law, the destruction of the concept of negligence grew
out of an explicitly egalitarian view of the purpose of liability-not
to
redress individual victims for acts of irresponsibility but to redistribute
goods more equitably.'" In personal life, the idea of forbidding people
from interfering with members of other groups (blacks, homosexuals,
women) as they went about their lives has been extended to the idea of
compelling people to "treat them the same." It is a mark of how far things
have gone that many people no longer can see the distinction between
"not interfering" and "treating the same."
Our views on all of these issues are decidedly traditional. We think
that rights are embedded in our freedom to act, not in the obligations
we may impose on others to act; that equality of rights is crucial while
equality of outcome is not; that concepts such as virtue, excellence,
beauty, and truth should be reintroduced into moral discourse. We are
comfortable with the idea that some things are better than others-not
just according to our subjective point of view but according to endur-
ing standards of merit and inferiority-and
at the same time reject the
thought that we (or anyone else) should have the right to impose those
standards. We are enthusiastic about diversity-the
rich, unending di-
versity that free human beings generate as a matter of course, not the
imposed diversity of group quotas.
And so we come to this final chapter, discussing the broadest policy
implications of all that has gone before. We bring to our recommenda-
tions a predisposition, believing that the original American conceptions
of human equality and the pursuit of happiness still offer the wisest guid-
ance for thinking about how to run today's America. These have been
some of our reasons why.
LETTING PEOPLE FIND VALUED PLACES IN SOCIETY
With these thoughts on the table, let us return to the question that
opened the chapter: How should policy deal with the twin realities that peo-
ple differ in intelligence for reasons that are not their fault and that intelligence
has a powerful bearing on how well people do in life? The answer turns us
back to the ancient concern with place.
The Goal and a Definition
The broadest goal is a society in which people throughout the functional
range of intelligence can find, and feel they have found, a valued place
for themselves. For "valued place," we offer a pragmatic definition: You
occupy a valued place if other people would miss you if you were gone. The
fact that you would be missed means that you were valued. Both the
quality and quantity of valued places are important. Most people hope
to find a soulmate for life, and that means someone who would "miss
you" in the widest and most intense way. The definition captures the
reason why children are so important in defining a valued place. But be-
sides the quality of the valuing, quantity too is important. If a single per-
son would miss you and no one else, you have a fragile hold on your
place in society, no matter how much that one person cares for you. To
have many different people who would miss you, in many different parts
of your life and at many levels of intensity, is a hallmark of a person
whose place is well and thoroughly valued. One way of thinking about
policy options is to ask whether they aid or obstruct this goal of creat-
ing valued places.
Finding Valued Places
The great bulk of the American population is amply equipped, in their
cognitive resources and in other personal characteristics, to find valued
places in society. We must emphasize that, because for hundreds of pages
we have focused on people at the two tails of the bell curve. Now is a
536
Living Together
A Place for Everyone
537
good time to recall the people in the broad part of the curve, between
the extremes. In figure after figure throughout Chapter 16, the pattern
was consistent: The prevalence of the social maladies we reviewed was
strikingly concentrated in the bottom IQ deciles. By the time people
were even approaching average IQ, the percentages of people who were
poor, had babies out of wedlock, provided poor environments for their
children, or exhibited any other problem constituted small percentages
of the
Translated into the themes we are about to introduce,
the evidence throughout this book supports the proposition that most
people by far have enough intelligence for getting on with the business
of life. We believe the policies we advocate will benefit them as well,
by creating a generally richer and more vital society, but it should be
made explicit: Our solutions assume that the average American is an
asset, not part of the problem.
Finding Valued Places If You Aren't Very Smart: The Traditional
Context
Nonetheless, millions of Americans have levels of cognitive ability low
enough to make their lives statistically much more difficult than life is
for most other ~eople.
How may policy help or obstruct them as they go
about their lives? Our thesis is that it used to be easier for people who
are low in ability to find a valued place than it is now.
In a simpler America, being comparatively low in the qualities mea-
sured by IQ did not necessarily affect the ability to find a valued niche
in society. Many such people worked on farms. When farms were small,
technology was limited to the horse-drawn plow and a few hand tools,
and the same subsistence crops were grown year after year. People who
would score 80 or 90 on an IQ test could be competent farmworkers,
not conspicuously distinguished from most other people in wealth,
home, neighborhood, or status in the community. Much the same could
be said of a wide variety of skilled and unskilled trades. Even an un-
skilled laborer who was noticeably lower on the economic scale was part
of a community in which many others with many levels of ability lived
close to him, literally and socially. Inevitably, with technological ad-
vances, the niches for the less intelligent have shrunk.
As for the most intimate affiliations-marriage
and children-there
formerly was little difference between people of varying abilities: To be
married meant to be responsible for each other, and for the children of
that marriage, in unqualified and uncompromising ways that the entire
community held to be of the highest importance. Those who met those
responsibilities had a valued lace in the community by definition.
Those who failed conspicuously in those responsibilities were outcasts
by definition. Meeting the responsibilities of marriage and parenthood
did not take a lot of money and did not take high intelligence. The com-
munity provided clear and understandable incentives for doing what
needed to be done.
Urban communities were somewhat different from small towns in
these respects but not unrecognizably so. The top socioeconomic layer
moved off to its own part of town, but this left a broad range of people
living together in the rest of a city's neighborhoods, and the social func.
tioning of those neighborhoods shared many characteristics with small
towns. The responsibilities of marriage and children were as clearly de-
fined in urban neighborhoods as in rural ones, and success and failure
in those responsibilities were as visibly rewarded and punished.
As for the other ways in which people found valued places for them-
selves, urban neighborhoods teemed with useful things to do. Anyone
who wanted to have a place in the community could find one in the lo+
cal school boards, churches, union halls, garden clubs, and benevolent
associations of one sort or another. The city government provided the
police who walked the local beat. It ran the courthouse and public hos-
pital downtown, and perhaps an orphanage and a home for the aged,
but otherwise the neighborhood had to do for itself just about every-
thing that needed doing to keep the social contract operative and daily
life on an even keel. Someone who was mentally a bit dull might not
be chosen to head up the parish clothing drive but was certainly eligi-
ble to help out. And these were just the organized aspects of commu-
nity life. The unorganized web of interactions was even more extensive
and provided still more ways in which people of all abilities, including
those without much intelligence, could fit in.
It is not necessary to idealize old-fashioned neighborhoods or old-
fashioned families to accept the description we have just given. All sorts
of human problems, from wretched marriages to neighborhood feuds
and human misery of every other sort, could be found. Poverty was ram-
pant (recall from Chapter 5 that more than half of the population prior
to War I1 was in poverty by today's definition). Even so, when the re-
sponsibilities of marriage and parenthood were clear and uncompro-
mising and when the stuff of community life had to be carried out by
Valued Places and Cognitive Ability
- The authors argue that the average American should be viewed as a societal asset rather than a problem to be solved.
- Historically, individuals with lower cognitive ability found it easier to secure a valued niche in a simpler, agrarian society.
- Technological advancement and economic complexity have significantly shrunk the available social and professional niches for the less intelligent.
- In the past, meeting the universal responsibilities of marriage and parenthood provided a clear path to community respect regardless of IQ.
- Traditional urban and rural neighborhoods relied on a dense web of local associations where even 'dull' individuals could contribute meaningfully.
- Modern policy and social shifts have made it statistically more difficult for those with low cognitive ability to maintain status and stability.
Meeting the responsibilities of marriage and parenthood did not take a lot of money and did not take high intelligence.
536
Living Together
A Place for Everyone
537
good time to recall the people in the broad part of the curve, between
the extremes. In figure after figure throughout Chapter 16, the pattern
was consistent: The prevalence of the social maladies we reviewed was
strikingly concentrated in the bottom IQ deciles. By the time people
were even approaching average IQ, the percentages of people who were
poor, had babies out of wedlock, provided poor environments for their
children, or exhibited any other problem constituted small percentages
of the
Translated into the themes we are about to introduce,
the evidence throughout this book supports the proposition that most
people by far have enough intelligence for getting on with the business
of life. We believe the policies we advocate will benefit them as well,
by creating a generally richer and more vital society, but it should be
made explicit: Our solutions assume that the average American is an
asset, not part of the problem.
Finding Valued Places If You Aren't Very Smart: The Traditional
Context
Nonetheless, millions of Americans have levels of cognitive ability low
enough to make their lives statistically much more difficult than life is
for most other ~eople.
How may policy help or obstruct them as they go
about their lives? Our thesis is that it used to be easier for people who
are low in ability to find a valued place than it is now.
In a simpler America, being comparatively low in the qualities mea-
sured by IQ did not necessarily affect the ability to find a valued niche
in society. Many such people worked on farms. When farms were small,
technology was limited to the horse-drawn plow and a few hand tools,
and the same subsistence crops were grown year after year. People who
would score 80 or 90 on an IQ test could be competent farmworkers,
not conspicuously distinguished from most other people in wealth,
home, neighborhood, or status in the community. Much the same could
be said of a wide variety of skilled and unskilled trades. Even an un-
skilled laborer who was noticeably lower on the economic scale was part
of a community in which many others with many levels of ability lived
close to him, literally and socially. Inevitably, with technological ad-
vances, the niches for the less intelligent have shrunk.
As for the most intimate affiliations-marriage
and children-there
formerly was little difference between people of varying abilities: To be
married meant to be responsible for each other, and for the children of
that marriage, in unqualified and uncompromising ways that the entire
community held to be of the highest importance. Those who met those
responsibilities had a valued lace in the community by definition.
Those who failed conspicuously in those responsibilities were outcasts
by definition. Meeting the responsibilities of marriage and parenthood
did not take a lot of money and did not take high intelligence. The com-
munity provided clear and understandable incentives for doing what
needed to be done.
Urban communities were somewhat different from small towns in
these respects but not unrecognizably so. The top socioeconomic layer
moved off to its own part of town, but this left a broad range of people
living together in the rest of a city's neighborhoods, and the social func.
tioning of those neighborhoods shared many characteristics with small
towns. The responsibilities of marriage and children were as clearly de-
fined in urban neighborhoods as in rural ones, and success and failure
in those responsibilities were as visibly rewarded and punished.
As for the other ways in which people found valued places for them-
selves, urban neighborhoods teemed with useful things to do. Anyone
who wanted to have a place in the community could find one in the lo+
cal school boards, churches, union halls, garden clubs, and benevolent
associations of one sort or another. The city government provided the
police who walked the local beat. It ran the courthouse and public hos-
pital downtown, and perhaps an orphanage and a home for the aged,
but otherwise the neighborhood had to do for itself just about every-
thing that needed doing to keep the social contract operative and daily
life on an even keel. Someone who was mentally a bit dull might not
be chosen to head up the parish clothing drive but was certainly eligi-
ble to help out. And these were just the organized aspects of commu-
nity life. The unorganized web of interactions was even more extensive
and provided still more ways in which people of all abilities, including
those without much intelligence, could fit in.
It is not necessary to idealize old-fashioned neighborhoods or old-
fashioned families to accept the description we have just given. All sorts
of human problems, from wretched marriages to neighborhood feuds
and human misery of every other sort, could be found. Poverty was ram-
pant (recall from Chapter 5 that more than half of the population prior
to War I1 was in poverty by today's definition). Even so, when the re-
sponsibilities of marriage and parenthood were clear and uncompro-
mising and when the stuff of community life had to be carried out by
The Erosion of Valued Places
- Historical neighborhoods and families provided accessible, valued roles for individuals of all cognitive abilities despite high poverty rates.
- The modern 'cognitive elite' has economically diverged from the rest of the population, leading to a 36 percent drop in real wages for low-skilled labor since 1973.
- While economic decline has demoralized low-skilled workers, the author argues that income levels alone do not explain the collapse of marriage and family stability.
- The modern laborer earns more in real dollars than their 1920s counterpart, suggesting that social decay is not purely a result of financial insufficiency.
- Vitality has drained from American communities as essential functions—like mutual aid and local problem-solving—have been stripped from the neighborhood level.
- The loss of a 'valued place' for those with modest abilities is driven by the centralization of policy and the weakening of the local social fabric.
A strong back isn't worth what it used to be.
536
Living Together
A Place for Everyone
537
good time to recall the people in the broad part of the curve, between
the extremes. In figure after figure throughout Chapter 16, the pattern
was consistent: The prevalence of the social maladies we reviewed was
strikingly concentrated in the bottom IQ deciles. By the time people
were even approaching average IQ, the percentages of people who were
poor, had babies out of wedlock, provided poor environments for their
children, or exhibited any other problem constituted small percentages
of the
Translated into the themes we are about to introduce,
the evidence throughout this book supports the proposition that most
people by far have enough intelligence for getting on with the business
of life. We believe the policies we advocate will benefit them as well,
by creating a generally richer and more vital society, but it should be
made explicit: Our solutions assume that the average American is an
asset, not part of the problem.
Finding Valued Places If You Aren't Very Smart: The Traditional
Context
Nonetheless, millions of Americans have levels of cognitive ability low
enough to make their lives statistically much more difficult than life is
for most other ~eople.
How may policy help or obstruct them as they go
about their lives? Our thesis is that it used to be easier for people who
are low in ability to find a valued place than it is now.
In a simpler America, being comparatively low in the qualities mea-
sured by IQ did not necessarily affect the ability to find a valued niche
in society. Many such people worked on farms. When farms were small,
technology was limited to the horse-drawn plow and a few hand tools,
and the same subsistence crops were grown year after year. People who
would score 80 or 90 on an IQ test could be competent farmworkers,
not conspicuously distinguished from most other people in wealth,
home, neighborhood, or status in the community. Much the same could
be said of a wide variety of skilled and unskilled trades. Even an un-
skilled laborer who was noticeably lower on the economic scale was part
of a community in which many others with many levels of ability lived
close to him, literally and socially. Inevitably, with technological ad-
vances, the niches for the less intelligent have shrunk.
As for the most intimate affiliations-marriage
and children-there
formerly was little difference between people of varying abilities: To be
married meant to be responsible for each other, and for the children of
that marriage, in unqualified and uncompromising ways that the entire
community held to be of the highest importance. Those who met those
responsibilities had a valued lace in the community by definition.
Those who failed conspicuously in those responsibilities were outcasts
by definition. Meeting the responsibilities of marriage and parenthood
did not take a lot of money and did not take high intelligence. The com-
munity provided clear and understandable incentives for doing what
needed to be done.
Urban communities were somewhat different from small towns in
these respects but not unrecognizably so. The top socioeconomic layer
moved off to its own part of town, but this left a broad range of people
living together in the rest of a city's neighborhoods, and the social func.
tioning of those neighborhoods shared many characteristics with small
towns. The responsibilities of marriage and children were as clearly de-
fined in urban neighborhoods as in rural ones, and success and failure
in those responsibilities were as visibly rewarded and punished.
As for the other ways in which people found valued places for them-
selves, urban neighborhoods teemed with useful things to do. Anyone
who wanted to have a place in the community could find one in the lo+
cal school boards, churches, union halls, garden clubs, and benevolent
associations of one sort or another. The city government provided the
police who walked the local beat. It ran the courthouse and public hos-
pital downtown, and perhaps an orphanage and a home for the aged,
but otherwise the neighborhood had to do for itself just about every-
thing that needed doing to keep the social contract operative and daily
life on an even keel. Someone who was mentally a bit dull might not
be chosen to head up the parish clothing drive but was certainly eligi-
ble to help out. And these were just the organized aspects of commu-
nity life. The unorganized web of interactions was even more extensive
and provided still more ways in which people of all abilities, including
those without much intelligence, could fit in.
It is not necessary to idealize old-fashioned neighborhoods or old-
fashioned families to accept the description we have just given. All sorts
of human problems, from wretched marriages to neighborhood feuds
and human misery of every other sort, could be found. Poverty was ram-
pant (recall from Chapter 5 that more than half of the population prior
to War I1 was in poverty by today's definition). Even so, when the re-
sponsibilities of marriage and parenthood were clear and uncompro-
mising and when the stuff of community life had to be carried out by
53 8
Living Together
A Place for Everyone
539
the neighborhood or it wouldn't get done, society was full of accessible
valued places for people of a broad range of abilities.
Finding Valued Places If You Aren't Very Smart: The Contemporary
Context
Out of the myriad things that have changed since the beginning of the
century, two overlapping phenomena have most affected people with
modest abilities: It has become harder to make a living to support the
valued roles of spouse, parent, and neighbor, and functions have been
stripped from one main source of valued place, the neighborhood.
THE ECONOMIC ARGUMENT. The cognitive elite has pulled away from
the rest of the population economically, becoming more prosperous
even as real wages in the rest of the economy stagnated or fell. The di-
vergence has been most conspicuous in the lowest-skilled jobs. From
their high point in 1973, the median earnings of full-time workers in
general nonfarm labor had fallen by 36 percent by 1990, far more than
for any other category.[211
A strong back isn't worth what it used to be.
Workers in those occupations have been demoralized. They have lost
their valued place in the workplace.
So far, we agree that economics plays an important role in taking val-
ued places in the workplace from those with low cognitive ability. But
the argument typically widens, asserting that economic change also ex-
plains why people in low-skill occupations experience the loss of other
valued places evidenced by falling marriage rates and rising illegitimacy:
Men in low-skill jobs no longer make enough money to support a fam-
ily, it is said. This common argument is too simplistic. In constant dol-
lars, the income of a full-time, year-round male worker in general
nonfarm labor in 1991 was at the level of his counterpart in 1958, when
the norm was still one income per family, marriage rates were as high as
ever, and illegitimacy was a fraction of its current levels. We may look
back still further: The low-skill laborer in 1991 made about twice the
real income of his counterpart in 1920, a year when no one thought to
question whether a laborer could support a family,[221
Economics is rel-
evant in understanding how it has become harder for people of modest
abilities to find a valued place, and solutions should take economics into
account. But economics is not decisive.
STRIPPING
FUNCTIONS FROM THENEIGHBORHOOD. Communities are rich
and vital places to the extent that they engage their members in the
stuff of life-birth,
death, raising children, making a living, helping
friends, singing in the local choir or playing on the softball team, cop-
ing with problems, setting examples, welcoming, chastising, celebrat-
ing, reconciling, and negotiating.23
If there is one theme on which observers from both left and right re-
cently sound very much alike, it is that something vital and important
has drained out of American comrnunitie~.~~
Most adults need some-
thing to do with their lives other than going to work, and that some-
thing consists of being stitched into a fabric of family and community.
In the preceding chapter, we alluded to the federal domination of pub-
lic policy that has augmented the cognitive elite's political leverage dur-
ing the last thirty years. The same process has had the collateral effect
of stripping the neighborhood of much of the stuff of life. For what
seemed like sufficient reasons at the time, Congress and presidents have
deemed it necessary to remove more and more functions from the neigh-
borhood. The entire social welfare system, services and cash payments
alike, may be viewed in that light. Certain tasks-such
as caring for the
poor, for example-were
deemed to be too difficult or too poorly per-
formed by the spontaneous efforts of neighborhoods and voluntary or-
ganizations, and hence were transferred. The states have joined in this
process. Whether federal and state policymakers were right to think that
neighborhoods had failed and that the centralized government has done
better is still a subject of debate, as is the net effect of the transfers, but
the transfers did indeed occur and they stripped neighborhoods of tra-
ditional functions,z5
The cognitive elite may not detect the declining vitality in the lo-
cal community. For many of them, the house is important-its
size, lo*
cation, view, grounds. They may want the right kind of address and the
right kind of neighbors. But their lives are centered outside a geo-
graphic community; their professional associates and friends may be
scattered over miles of suburbs, or for that matter across the nation and
the world. For large segments of American society, however, the geo-
graphic neighborhood is the major potential resource for infusing life
with much of its meaning, Even the cognitive elite needs local com-
munities, if not for itself, then for those of its children who happen not
to land at the top of the cognitive ability distribution. The massive
transfer of functions from the locality to the government has stripped
neighborhoods of their traditional shared tasks. Instead, we have neigh-
borhoods that are merely localities, not communities of people tend-
The Erosion of Local Community
- Federal and state policies have stripped neighborhoods of traditional functions by centralizing social welfare and services.
- The cognitive elite often fail to notice this decline because their social and professional lives are geographically dispersed.
- A neighborhood only becomes a true community when its residents have shared, valued tasks to perform together.
- Small towns and working-class neighborhoods still demonstrate the power of local mutual aid through fundraisers and direct support.
- Restoring functions to the local level creates 'valued places' where individuals of all ability levels can feel useful and known.
- The primary argument for decentralization is the restoration of social meaning rather than mere economic efficiency.
It creates ways for them to be known-not just as a name but as a helpful fellow, a useful person to know, the woman you can always count on.
53 8
Living Together
A Place for Everyone
539
the neighborhood or it wouldn't get done, society was full of accessible
valued places for people of a broad range of abilities.
Finding Valued Places If You Aren't Very Smart: The Contemporary
Context
Out of the myriad things that have changed since the beginning of the
century, two overlapping phenomena have most affected people with
modest abilities: It has become harder to make a living to support the
valued roles of spouse, parent, and neighbor, and functions have been
stripped from one main source of valued place, the neighborhood.
THE ECONOMIC ARGUMENT. The cognitive elite has pulled away from
the rest of the population economically, becoming more prosperous
even as real wages in the rest of the economy stagnated or fell. The di-
vergence has been most conspicuous in the lowest-skilled jobs. From
their high point in 1973, the median earnings of full-time workers in
general nonfarm labor had fallen by 36 percent by 1990, far more than
for any other category.[211
A strong back isn't worth what it used to be.
Workers in those occupations have been demoralized. They have lost
their valued place in the workplace.
So far, we agree that economics plays an important role in taking val-
ued places in the workplace from those with low cognitive ability. But
the argument typically widens, asserting that economic change also ex-
plains why people in low-skill occupations experience the loss of other
valued places evidenced by falling marriage rates and rising illegitimacy:
Men in low-skill jobs no longer make enough money to support a fam-
ily, it is said. This common argument is too simplistic. In constant dol-
lars, the income of a full-time, year-round male worker in general
nonfarm labor in 1991 was at the level of his counterpart in 1958, when
the norm was still one income per family, marriage rates were as high as
ever, and illegitimacy was a fraction of its current levels. We may look
back still further: The low-skill laborer in 1991 made about twice the
real income of his counterpart in 1920, a year when no one thought to
question whether a laborer could support a family,[221
Economics is rel-
evant in understanding how it has become harder for people of modest
abilities to find a valued place, and solutions should take economics into
account. But economics is not decisive.
STRIPPING
FUNCTIONS FROM THENEIGHBORHOOD. Communities are rich
and vital places to the extent that they engage their members in the
stuff of life-birth,
death, raising children, making a living, helping
friends, singing in the local choir or playing on the softball team, cop-
ing with problems, setting examples, welcoming, chastising, celebrat-
ing, reconciling, and negotiating.23
If there is one theme on which observers from both left and right re-
cently sound very much alike, it is that something vital and important
has drained out of American comrnunitie~.~~
Most adults need some-
thing to do with their lives other than going to work, and that some-
thing consists of being stitched into a fabric of family and community.
In the preceding chapter, we alluded to the federal domination of pub-
lic policy that has augmented the cognitive elite's political leverage dur-
ing the last thirty years. The same process has had the collateral effect
of stripping the neighborhood of much of the stuff of life. For what
seemed like sufficient reasons at the time, Congress and presidents have
deemed it necessary to remove more and more functions from the neigh-
borhood. The entire social welfare system, services and cash payments
alike, may be viewed in that light. Certain tasks-such
as caring for the
poor, for example-were
deemed to be too difficult or too poorly per-
formed by the spontaneous efforts of neighborhoods and voluntary or-
ganizations, and hence were transferred. The states have joined in this
process. Whether federal and state policymakers were right to think that
neighborhoods had failed and that the centralized government has done
better is still a subject of debate, as is the net effect of the transfers, but
the transfers did indeed occur and they stripped neighborhoods of tra-
ditional functions,z5
The cognitive elite may not detect the declining vitality in the lo-
cal community. For many of them, the house is important-its
size, lo*
cation, view, grounds. They may want the right kind of address and the
right kind of neighbors. But their lives are centered outside a geo-
graphic community; their professional associates and friends may be
scattered over miles of suburbs, or for that matter across the nation and
the world. For large segments of American society, however, the geo-
graphic neighborhood is the major potential resource for infusing life
with much of its meaning, Even the cognitive elite needs local com-
munities, if not for itself, then for those of its children who happen not
to land at the top of the cognitive ability distribution. The massive
transfer of functions from the locality to the government has stripped
neighborhoods of their traditional shared tasks. Instead, we have neigh-
borhoods that are merely localities, not communities of people tend-
540
Living Together
A Place for Everyone
54 1
ing to their communal affairs. Valued places in a neighborhood are
created only to the extent that the people in a neighborhood have
valued tasks to do.
People who have never lived in such a neighborhood-and
as time
goes on this includes more and more of the cognitive elite and the
affluent in general--often find this hard to believe. It is another case
of the isolation we discussed in Chapter 21: They may read about such
communities in books, but surely they no longer exist in real life. But
they do. Thumb through a few weeks' issues of the newspaper from
any small town, and you will find an America that is still replete with
fund-raising suppers for the local child who has cancer, drives to
collect food and clothing for a family that has suffered a reverse, and
even barn raisings. They may exist as well (though they are less well
documented) in urban working-class neighborhoods that have man-
aged to retain their identity. It is through such activities that much of
the real good for the disadvantaged is accomplished. Beyond that, they
have a crucial role, so hard to see from a Washington office, of creat-
ing ways for people of a wide level of incomes and abilities to play a
part. It creates ways for them to be known-not
just as a name but as
a helpful fellow, a useful person to know, the woman you can always
count on. It creates ways in which you would be missed if you were
gone.
Thus arises our first general policy prescription: A wide range of social
functions should be restored to the neighborhood when possible and otherwise
to the municipality. The reason for doing so, in the context of this book,
is not to save money, not even because such services will be provided
more humanely and efficiently by neighborhoods (though we believe
that generally to be the case), but because this is one of the best ways
to multiply the valued places that people can fill. As the chapter con-
tinues, we will offer some other possibilities for accomplishing this and
collateral objectives. But before arguing about how it is to be done, we
hope that there can be wide agreement on the importance of the goal:
In a decent postindustrial society, neighborhoods shall not have lost
their importance as a source of human satisfactions and as a generator
of valued places that all sorts of people can fill. Government policy can
do much to foster the vitality of neighborhoods by trying to do less for
them.
SIMPLIFYING RULES
The thesis of this section may be summarized quickly: As of the end of
the twentieth century, the United States is run by rules that are conge-
nial to people with high IQs and that make life more difficult for every-
one else. This is true in the areas of criminal justice, marriage and
divorce, welfare and tax policy, and business law, among others. It is true
of rules that have been intended to help ordinary people-rules
that
govern schooling, medical practice, the labeling of goods, to pick some
examples. It has happened not because the cognitive elite consciously
usurped the writing of the rules but because of the cognitive stratifica-
tion described throughout the book. The trend has affected not just
those at the low end of the cognitive distribution but just about every-
body who is not part of the cognitive and economic elites.
The systems have been created, bit by bit, over decades, by people
who think that complicated, sophisticated operationalizations of fair-
ness, justice, and right and wrong are ethically superior to simple, black-
and-white versions. The cognitive elite may not be satisfied with these
systems as they stand at any given point, but however they may reform
them, the systems are sure to become more complex. Additionally, com-
plex systems are precisely the ones that give the cognitive elite the great-
est competitive advantage. Deciphering complexity is one of the things
that cognitive ability is most directly good for.
We have in mind two ways in which the rules generated by the cog-
nitive elite are making life more difficult for everyone else. Each requires
somewhat more detailed explanation.
Making It Easier to Make a Living
First come all the rules that make life more difficult for people who are
trying to navigate everyday life. In looking for examples, the 1040 in.
come tax form is such an easy target that it need only be mentioned to
make the point. But the same complications and confusions apply to a
single woman with children seeking government assistance or a person
who is trying to open a drycleaning shop. As the cognitive elite busily
goes about making the world a better place, it is not so important to
them that they are complicating ordinary lives. It's not so complicated
to them.
The Burden of Complexity
- The United States is increasingly governed by complex rules that favor high-IQ individuals while marginalizing the rest of society.
- This systemic complexity was not a conscious usurpation of power but a natural byproduct of cognitive stratification among the elite.
- Sophisticated systems of justice and policy are often viewed as ethically superior by the elite, despite being functionally inaccessible to many.
- Bureaucratic barriers and 'credentialism' have replaced 'sweat equity' as the primary requirements for economic advancement.
- Complexity acts as a competitive advantage for the cognitive elite, as deciphering intricate systems is a direct application of high cognitive ability.
- Government policy could foster neighborhood vitality and individual success by simplifying rules and doing less for the citizenry.
American society has erected barriers to individual sweat equity, by saying, in effect, 'Only people who are good at navigating complex rules need apply.'
540
Living Together
A Place for Everyone
54 1
ing to their communal affairs. Valued places in a neighborhood are
created only to the extent that the people in a neighborhood have
valued tasks to do.
People who have never lived in such a neighborhood-and
as time
goes on this includes more and more of the cognitive elite and the
affluent in general--often find this hard to believe. It is another case
of the isolation we discussed in Chapter 21: They may read about such
communities in books, but surely they no longer exist in real life. But
they do. Thumb through a few weeks' issues of the newspaper from
any small town, and you will find an America that is still replete with
fund-raising suppers for the local child who has cancer, drives to
collect food and clothing for a family that has suffered a reverse, and
even barn raisings. They may exist as well (though they are less well
documented) in urban working-class neighborhoods that have man-
aged to retain their identity. It is through such activities that much of
the real good for the disadvantaged is accomplished. Beyond that, they
have a crucial role, so hard to see from a Washington office, of creat-
ing ways for people of a wide level of incomes and abilities to play a
part. It creates ways for them to be known-not
just as a name but as
a helpful fellow, a useful person to know, the woman you can always
count on. It creates ways in which you would be missed if you were
gone.
Thus arises our first general policy prescription: A wide range of social
functions should be restored to the neighborhood when possible and otherwise
to the municipality. The reason for doing so, in the context of this book,
is not to save money, not even because such services will be provided
more humanely and efficiently by neighborhoods (though we believe
that generally to be the case), but because this is one of the best ways
to multiply the valued places that people can fill. As the chapter con-
tinues, we will offer some other possibilities for accomplishing this and
collateral objectives. But before arguing about how it is to be done, we
hope that there can be wide agreement on the importance of the goal:
In a decent postindustrial society, neighborhoods shall not have lost
their importance as a source of human satisfactions and as a generator
of valued places that all sorts of people can fill. Government policy can
do much to foster the vitality of neighborhoods by trying to do less for
them.
SIMPLIFYING RULES
The thesis of this section may be summarized quickly: As of the end of
the twentieth century, the United States is run by rules that are conge-
nial to people with high IQs and that make life more difficult for every-
one else. This is true in the areas of criminal justice, marriage and
divorce, welfare and tax policy, and business law, among others. It is true
of rules that have been intended to help ordinary people-rules
that
govern schooling, medical practice, the labeling of goods, to pick some
examples. It has happened not because the cognitive elite consciously
usurped the writing of the rules but because of the cognitive stratifica-
tion described throughout the book. The trend has affected not just
those at the low end of the cognitive distribution but just about every-
body who is not part of the cognitive and economic elites.
The systems have been created, bit by bit, over decades, by people
who think that complicated, sophisticated operationalizations of fair-
ness, justice, and right and wrong are ethically superior to simple, black-
and-white versions. The cognitive elite may not be satisfied with these
systems as they stand at any given point, but however they may reform
them, the systems are sure to become more complex. Additionally, com-
plex systems are precisely the ones that give the cognitive elite the great-
est competitive advantage. Deciphering complexity is one of the things
that cognitive ability is most directly good for.
We have in mind two ways in which the rules generated by the cog-
nitive elite are making life more difficult for everyone else. Each requires
somewhat more detailed explanation.
Making It Easier to Make a Living
First come all the rules that make life more difficult for people who are
trying to navigate everyday life. In looking for examples, the 1040 in.
come tax form is such an easy target that it need only be mentioned to
make the point. But the same complications and confusions apply to a
single woman with children seeking government assistance or a person
who is trying to open a drycleaning shop. As the cognitive elite busily
goes about making the world a better place, it is not so important to
them that they are complicating ordinary lives. It's not so complicated
to them.
542
Living Together
A Place for Everyone
543
The same burden of complications that are only a nuisance to peo-
ple who are smart are much more of a barrier to people who are not. In
many cases, such barriers effectively block off avenues for people who
are not cognitively equipped to struggle through the bureaucracy. In
other cases, they reduce the margin of success so much that they make
the difference between success and failure. "Sweat equity," though the
phrase itself has been recently coined, is as distinctively an American
concept as "equality before the law" and "liberty." You could get ahead
by plain hard work. No one would stand in your way. Today that is no
longer true. American society has erected barriers to individual sweat
equity, by saying, in effect, "Only people who are good at navigating
complex rules need apply." Anyone who has tried to open or run a small
business in recent years can supply evidence of how formidable those
barriers have become.
Credentialism is a closely related problem. It goes all the way up the
cognitive range-the
Ph.D. is often referred to as "the union card" by
graduate students who want to become college professors-but
it is es-
pecially irksome and obstructive for occupations further down the lad-
der. Increasingly, occupations must be licensed, whether the service
involves barbering or taking care of neighborhood children. The the-
ory is persuasive--do you want someone taking care of your child who
is not qualified?-but the practice typically means jumping through bu-
reaucratic hoops that have little to do with one's ability to do the job.
The rise of licensing is both a symptom and a cause d
diminishing per-
sonal ties, along with the mutual trust that goes with those ties. The li-
censing may have some small capacity to filter out the least competent,
but the benefits are often outweighed by the costs of the increased bu-
reaucratization.
Enough examples. American society is rife with them. In many ways,
life is more complicated than it used to be, and there's nothing to be
done about it. But as the cognitive elite has come to power, it has trailed
in its wake a detritus of complexities as well, individually minor, that
together have reshaped society so that the average person has a much
tougher time running his own life. Our policy recommendation is to
stop it and strip away the nonsense. Consider the costs of complexity
itself. Return to the assumption that in America the government has
no business getting in people's way except for the most compelling rea-
sons, with "compelling" required to meet a stiff definition.
Making It Easier to Live a Virtuous Life
We start with the supposition that almost everyone is capable of being
a morally autonomous human being most of the time and given suitable
circumstances. Political scientist James Q. Wilson has put this case elo-
quently in The Moral Sense, calling on a wide range of social science
findings to support an old but lately unfashionable truth: Human beings
in general are capable of deciding between right and wrongOz6
This does
not mean, however, that everyone is capable of deciding between right
and wrong with the same sophistication and nuances. The difference
between people of low cognitive ability and the rest of society may be
put in terms of a metaphor: Everyone has a moral compass, but some of
those compasses are more susceptible to magnetic storms than others.
First, consider crime, then marriage.
CRIME.
Imagine living in a society where the rules about crime are sim-
ple and the consequences are equally simple. "Crime" consists of a few
obviously wrong acts: assault, rape, murder, robbery, theft, trespass, de-
struction of another's property, fraud. Someone who commits a crime is
probably caught-and
almost certainly punished. The punishment al-
most certainly hurts (it is meaningful). Punishment follows arrest
quickly, within a matter of days or weeks. The members of the society
subscribe to the underlying codes of conduct with enthusiasm and near
unanimity. They teach and enforce them whenever appropriate. Living
in such a world, the moral compass shows simple, easily understood di-
rections. North is north, south is south, right is right, wrong is wrong.
Now imagine that all the rules are made more complicated. The num-
ber of acts defined as crimes has multiplied, so that many things that are
crimes are not nearly as obviously "wrong" as something like robbery or
assault. The link between moral transgression and committing crime is
made harder to understand. Fewer crimes lead to an arrest. Fewer arrests
lead to prosecution. Many times, the prosecutions are not for something
the accused person did but for an offense that the defense lawyer and
the prosecutor agreed upon. Many times, people who are prosecuted are
let off, though everyone (including the accused) acknowledges that the
person was guilty. When people are convicted, the consequences have
no apparent connection to how much harm they have done. These
events are typically spread out over months and sometimes years. To top
it all off, even the "wrongness" of the basic crimes is called into ques-
The Burden of Complexity
- Occupational licensing has expanded into everyday jobs, creating bureaucratic hurdles that erode personal trust and community ties.
- The rise of the cognitive elite has introduced a 'detritus of complexities' that makes it harder for average citizens to manage their own lives.
- The authors advocate for a return to a government that only intervenes for the most compelling and strictly defined reasons.
- Moral autonomy is universal, but individuals with lower cognitive ability may have 'moral compasses' more easily disrupted by complex social rules.
- A simple society with clear, certain punishments for obvious wrongs reinforces moral behavior more effectively than a complex legal system.
- The current legal system decouples moral transgression from criminal consequences through plea bargaining and inconsistent prosecutions.
Everyone has a moral compass, but some of those compasses are more susceptible to magnetic storms than others.
542
Living Together
A Place for Everyone
543
The same burden of complications that are only a nuisance to peo-
ple who are smart are much more of a barrier to people who are not. In
many cases, such barriers effectively block off avenues for people who
are not cognitively equipped to struggle through the bureaucracy. In
other cases, they reduce the margin of success so much that they make
the difference between success and failure. "Sweat equity," though the
phrase itself has been recently coined, is as distinctively an American
concept as "equality before the law" and "liberty." You could get ahead
by plain hard work. No one would stand in your way. Today that is no
longer true. American society has erected barriers to individual sweat
equity, by saying, in effect, "Only people who are good at navigating
complex rules need apply." Anyone who has tried to open or run a small
business in recent years can supply evidence of how formidable those
barriers have become.
Credentialism is a closely related problem. It goes all the way up the
cognitive range-the
Ph.D. is often referred to as "the union card" by
graduate students who want to become college professors-but
it is es-
pecially irksome and obstructive for occupations further down the lad-
der. Increasingly, occupations must be licensed, whether the service
involves barbering or taking care of neighborhood children. The the-
ory is persuasive--do you want someone taking care of your child who
is not qualified?-but the practice typically means jumping through bu-
reaucratic hoops that have little to do with one's ability to do the job.
The rise of licensing is both a symptom and a cause d
diminishing per-
sonal ties, along with the mutual trust that goes with those ties. The li-
censing may have some small capacity to filter out the least competent,
but the benefits are often outweighed by the costs of the increased bu-
reaucratization.
Enough examples. American society is rife with them. In many ways,
life is more complicated than it used to be, and there's nothing to be
done about it. But as the cognitive elite has come to power, it has trailed
in its wake a detritus of complexities as well, individually minor, that
together have reshaped society so that the average person has a much
tougher time running his own life. Our policy recommendation is to
stop it and strip away the nonsense. Consider the costs of complexity
itself. Return to the assumption that in America the government has
no business getting in people's way except for the most compelling rea-
sons, with "compelling" required to meet a stiff definition.
Making It Easier to Live a Virtuous Life
We start with the supposition that almost everyone is capable of being
a morally autonomous human being most of the time and given suitable
circumstances. Political scientist James Q. Wilson has put this case elo-
quently in The Moral Sense, calling on a wide range of social science
findings to support an old but lately unfashionable truth: Human beings
in general are capable of deciding between right and wrongOz6
This does
not mean, however, that everyone is capable of deciding between right
and wrong with the same sophistication and nuances. The difference
between people of low cognitive ability and the rest of society may be
put in terms of a metaphor: Everyone has a moral compass, but some of
those compasses are more susceptible to magnetic storms than others.
First, consider crime, then marriage.
CRIME.
Imagine living in a society where the rules about crime are sim-
ple and the consequences are equally simple. "Crime" consists of a few
obviously wrong acts: assault, rape, murder, robbery, theft, trespass, de-
struction of another's property, fraud. Someone who commits a crime is
probably caught-and
almost certainly punished. The punishment al-
most certainly hurts (it is meaningful). Punishment follows arrest
quickly, within a matter of days or weeks. The members of the society
subscribe to the underlying codes of conduct with enthusiasm and near
unanimity. They teach and enforce them whenever appropriate. Living
in such a world, the moral compass shows simple, easily understood di-
rections. North is north, south is south, right is right, wrong is wrong.
Now imagine that all the rules are made more complicated. The num-
ber of acts defined as crimes has multiplied, so that many things that are
crimes are not nearly as obviously "wrong" as something like robbery or
assault. The link between moral transgression and committing crime is
made harder to understand. Fewer crimes lead to an arrest. Fewer arrests
lead to prosecution. Many times, the prosecutions are not for something
the accused person did but for an offense that the defense lawyer and
the prosecutor agreed upon. Many times, people who are prosecuted are
let off, though everyone (including the accused) acknowledges that the
person was guilty. When people are convicted, the consequences have
no apparent connection to how much harm they have done. These
events are typically spread out over months and sometimes years. To top
it all off, even the "wrongness" of the basic crimes is called into ques-
The Complexity of Modern Morality
- The modern criminal justice system has shifted from clear, objective rules to complex moral relativism that justifies crimes based on external conditions.
- Individuals with lower cognitive ability find it significantly harder to navigate a society where moral rules are no longer absolute but situational.
- The authors compare the 1950s justice system to a steady compass and the 1990s system to a 'magnetic storm' that causes moral needles to waver.
- The sexual revolution removed the primary, simple incentive for marriage—sexual access—making the institution harder to justify to those with short time horizons.
- State and social validation of alternative living arrangements has eroded the unique status of marriage, making it less accessible as a 'valued place' for the less intelligent.
- A policy shift toward simplicity in both law and social institutions is proposed to help those of limited intelligence lead successful, moral lives.
People of limited intelligence can lead moral lives in a society that is run on the basis of 'Thou shalt not steal.' They find it much harder to lead moral lives in a society that is run on the basis of 'Thou shalt not steal unless there is a really good reason to.'
542
Living Together
A Place for Everyone
543
The same burden of complications that are only a nuisance to peo-
ple who are smart are much more of a barrier to people who are not. In
many cases, such barriers effectively block off avenues for people who
are not cognitively equipped to struggle through the bureaucracy. In
other cases, they reduce the margin of success so much that they make
the difference between success and failure. "Sweat equity," though the
phrase itself has been recently coined, is as distinctively an American
concept as "equality before the law" and "liberty." You could get ahead
by plain hard work. No one would stand in your way. Today that is no
longer true. American society has erected barriers to individual sweat
equity, by saying, in effect, "Only people who are good at navigating
complex rules need apply." Anyone who has tried to open or run a small
business in recent years can supply evidence of how formidable those
barriers have become.
Credentialism is a closely related problem. It goes all the way up the
cognitive range-the
Ph.D. is often referred to as "the union card" by
graduate students who want to become college professors-but
it is es-
pecially irksome and obstructive for occupations further down the lad-
der. Increasingly, occupations must be licensed, whether the service
involves barbering or taking care of neighborhood children. The the-
ory is persuasive--do you want someone taking care of your child who
is not qualified?-but the practice typically means jumping through bu-
reaucratic hoops that have little to do with one's ability to do the job.
The rise of licensing is both a symptom and a cause d
diminishing per-
sonal ties, along with the mutual trust that goes with those ties. The li-
censing may have some small capacity to filter out the least competent,
but the benefits are often outweighed by the costs of the increased bu-
reaucratization.
Enough examples. American society is rife with them. In many ways,
life is more complicated than it used to be, and there's nothing to be
done about it. But as the cognitive elite has come to power, it has trailed
in its wake a detritus of complexities as well, individually minor, that
together have reshaped society so that the average person has a much
tougher time running his own life. Our policy recommendation is to
stop it and strip away the nonsense. Consider the costs of complexity
itself. Return to the assumption that in America the government has
no business getting in people's way except for the most compelling rea-
sons, with "compelling" required to meet a stiff definition.
Making It Easier to Live a Virtuous Life
We start with the supposition that almost everyone is capable of being
a morally autonomous human being most of the time and given suitable
circumstances. Political scientist James Q. Wilson has put this case elo-
quently in The Moral Sense, calling on a wide range of social science
findings to support an old but lately unfashionable truth: Human beings
in general are capable of deciding between right and wrongOz6
This does
not mean, however, that everyone is capable of deciding between right
and wrong with the same sophistication and nuances. The difference
between people of low cognitive ability and the rest of society may be
put in terms of a metaphor: Everyone has a moral compass, but some of
those compasses are more susceptible to magnetic storms than others.
First, consider crime, then marriage.
CRIME.
Imagine living in a society where the rules about crime are sim-
ple and the consequences are equally simple. "Crime" consists of a few
obviously wrong acts: assault, rape, murder, robbery, theft, trespass, de-
struction of another's property, fraud. Someone who commits a crime is
probably caught-and
almost certainly punished. The punishment al-
most certainly hurts (it is meaningful). Punishment follows arrest
quickly, within a matter of days or weeks. The members of the society
subscribe to the underlying codes of conduct with enthusiasm and near
unanimity. They teach and enforce them whenever appropriate. Living
in such a world, the moral compass shows simple, easily understood di-
rections. North is north, south is south, right is right, wrong is wrong.
Now imagine that all the rules are made more complicated. The num-
ber of acts defined as crimes has multiplied, so that many things that are
crimes are not nearly as obviously "wrong" as something like robbery or
assault. The link between moral transgression and committing crime is
made harder to understand. Fewer crimes lead to an arrest. Fewer arrests
lead to prosecution. Many times, the prosecutions are not for something
the accused person did but for an offense that the defense lawyer and
the prosecutor agreed upon. Many times, people who are prosecuted are
let off, though everyone (including the accused) acknowledges that the
person was guilty. When people are convicted, the consequences have
no apparent connection to how much harm they have done. These
events are typically spread out over months and sometimes years. To top
it all off, even the "wrongness" of the basic crimes is called into ques-
544
Living Together
A Place for Everyone
545
tion. In the society at large (and translated onto the television and
movie screens), it is commonly argued that robbery, for example, is not
always wrong if it is in a good cause (stealing medicine to save a dying
wife) or if it is in response to some external condition (exploitation,
racism, etc.). At every level, it becomes fashionable to point out the
complexities of moral decisions, and all the ways in which things that
might seem "wrong" at first glance are really "right" when properly an-
alyzed.
The two worlds we have described are not far removed from the con-
trast between the criminal justice system in the United States as re-
cently as the 1950s and that system as of the 1990s. We are arguing that
a person with comparatively low intelligence, whose time horizon is
short and ability to balance many competing and complex incentives is
low, has much more difficulty following a moral compass in the 1990s
than he would have in the 1950s. Put aside your feelings about whether
these changes in the criminal justice system represent progress. Simply
consider them as a magnetic storm-as
a set of changes that make the
needle pointing to right and wrong waver erratically if you happen to
be looking at the criminal justice system from the perspective of a per-
son who is not especially bright. People of limited intelligence can lead
moral lives in a society that is run on the basis of "Thou shalt not steal."
They find it much harder to lead moral lives in a society that is run on
the basis of "Thou shalt not steal unless there is a really good reason
to. 1,1271
The policy prescription is that the criminal justice system should be
made simpler. The meaning of criminal offenses used to be clear and oh-
jective, and so were the consequences. It is worth trying to make them
so again.
MARRIAGE. It has become much more difficult for a person of low cog-
nitive ability to figure out why marriage is a good thing, and, once in a
marriage, more difficult to figure out why one should stick with it
through bad times. The magnetic storm has swept through from many
directions.
The sexual revolution is the most obvious culprit. The old bargain
from the man's point of view-get
married, because that's the only way
you're going to be able to sleep with the lady-was
the kind of incen-
tive that did not require a lot of intellect to process and had an all-
powerful effect on behavior. Restoring it is not feasible by any (reason-
able) policy we can think of
But the state has interfered as well to make it more difficult for peo-
ple with little intelligence to do that thing-find
a compatible partner
and get married-that
constitutes the most accessible and richest of all
valued places. Marriage fills a vital role in people's lives to the extent
that it is hallowed as an institution and as a relationship unlike any
other. Marriage is satisfying to the extent that society validates these
propositions: "Yes, you may have a baby outside marriage if you choose;
but it isn't the same." "Yes, you may live with someone without many.
ing, but it isn't the same." "Yes, you may say that you are committed to
someone without marrying, but it isn't the same."
Once sex was no longer playing as important a role in the decision to
marry, it was essential that these other unique attributes of marriage be
highlighted and reinforced. But the opposite has happened. Repeatedly,
the prerogatives and responsibilities that used to be limited to marriage
have spilled over into nonmarital relationships, whether it is the rights
and responsibilities of an unmarried father, medical coverage for same.
sex partners, or palimony cases. Once the law says, "Well, in a legal sense,
living together is the same," what is the point of getting married?
For most people, there are still answers to that question. Even given
the diminished legal stature of marriage, marriage continues to have
unique value. But to see those values takes forethought about the long-
term differences between living together and being married, sensitivity
to many intangibles, and an appreciation of second-hand and third-
hand consequences. As Chapter 8's evidence about marriage rates im-
plies, people low on the intelligence distribution are less likely to think
through those issues than others.
Our policy prescription in this instance is to return marriage to its
formerly unique legal status. If you are married, you take on obligations.
If you are not married, you don't. In particular, we urge that marriage
once again become the sole legal institution through which rights and
responsibilities regarding children are exercised. If you are an unmar-
ried mother, you have no legal basis for demanding that the father of
the child provide support. If you are an unmarried father, you have no
legal standing regarding the child-not
even a right to see the child, let
alone any basis honored by society for claiming he or she is "yours" or
that you are a "father."
Simplifying Marriage and Law
- The authors argue that the legal blurring of marriage and cohabitation has diminished the unique value and incentive of the marital institution.
- They propose returning marriage to a unique legal status where rights and responsibilities regarding children are exclusively tied to being married.
- The text suggests that individuals with lower cognitive ability are less likely to appreciate the intangible, long-term benefits of marriage over cohabitation.
- A broader policy shift is advocated toward radical simplification of the American legal system to make it accessible to all citizens, not just the 'rich and smart.'
- The authors recommend replacing complex modern regulations with a core of common law and original concepts of negligence and liability.
- The goal of these reforms is to create a society with straightforward rules that parents of all cognitive levels can easily teach to their children.
As matters stand, the legal edifice has become a labyrinth that only the rich and the smart can navigate.
544
Living Together
A Place for Everyone
545
tion. In the society at large (and translated onto the television and
movie screens), it is commonly argued that robbery, for example, is not
always wrong if it is in a good cause (stealing medicine to save a dying
wife) or if it is in response to some external condition (exploitation,
racism, etc.). At every level, it becomes fashionable to point out the
complexities of moral decisions, and all the ways in which things that
might seem "wrong" at first glance are really "right" when properly an-
alyzed.
The two worlds we have described are not far removed from the con-
trast between the criminal justice system in the United States as re-
cently as the 1950s and that system as of the 1990s. We are arguing that
a person with comparatively low intelligence, whose time horizon is
short and ability to balance many competing and complex incentives is
low, has much more difficulty following a moral compass in the 1990s
than he would have in the 1950s. Put aside your feelings about whether
these changes in the criminal justice system represent progress. Simply
consider them as a magnetic storm-as
a set of changes that make the
needle pointing to right and wrong waver erratically if you happen to
be looking at the criminal justice system from the perspective of a per-
son who is not especially bright. People of limited intelligence can lead
moral lives in a society that is run on the basis of "Thou shalt not steal."
They find it much harder to lead moral lives in a society that is run on
the basis of "Thou shalt not steal unless there is a really good reason
to. 1,1271
The policy prescription is that the criminal justice system should be
made simpler. The meaning of criminal offenses used to be clear and oh-
jective, and so were the consequences. It is worth trying to make them
so again.
MARRIAGE. It has become much more difficult for a person of low cog-
nitive ability to figure out why marriage is a good thing, and, once in a
marriage, more difficult to figure out why one should stick with it
through bad times. The magnetic storm has swept through from many
directions.
The sexual revolution is the most obvious culprit. The old bargain
from the man's point of view-get
married, because that's the only way
you're going to be able to sleep with the lady-was
the kind of incen-
tive that did not require a lot of intellect to process and had an all-
powerful effect on behavior. Restoring it is not feasible by any (reason-
able) policy we can think of
But the state has interfered as well to make it more difficult for peo-
ple with little intelligence to do that thing-find
a compatible partner
and get married-that
constitutes the most accessible and richest of all
valued places. Marriage fills a vital role in people's lives to the extent
that it is hallowed as an institution and as a relationship unlike any
other. Marriage is satisfying to the extent that society validates these
propositions: "Yes, you may have a baby outside marriage if you choose;
but it isn't the same." "Yes, you may live with someone without many.
ing, but it isn't the same." "Yes, you may say that you are committed to
someone without marrying, but it isn't the same."
Once sex was no longer playing as important a role in the decision to
marry, it was essential that these other unique attributes of marriage be
highlighted and reinforced. But the opposite has happened. Repeatedly,
the prerogatives and responsibilities that used to be limited to marriage
have spilled over into nonmarital relationships, whether it is the rights
and responsibilities of an unmarried father, medical coverage for same.
sex partners, or palimony cases. Once the law says, "Well, in a legal sense,
living together is the same," what is the point of getting married?
For most people, there are still answers to that question. Even given
the diminished legal stature of marriage, marriage continues to have
unique value. But to see those values takes forethought about the long-
term differences between living together and being married, sensitivity
to many intangibles, and an appreciation of second-hand and third-
hand consequences. As Chapter 8's evidence about marriage rates im-
plies, people low on the intelligence distribution are less likely to think
through those issues than others.
Our policy prescription in this instance is to return marriage to its
formerly unique legal status. If you are married, you take on obligations.
If you are not married, you don't. In particular, we urge that marriage
once again become the sole legal institution through which rights and
responsibilities regarding children are exercised. If you are an unmar-
ried mother, you have no legal basis for demanding that the father of
the child provide support. If you are an unmarried father, you have no
legal standing regarding the child-not
even a right to see the child, let
alone any basis honored by society for claiming he or she is "yours" or
that you are a "father."
546
Living Together
A Place for Everyone
547
We do not expect such changes miraculously to resuscitate marriage
in the lowest cognitive classes, but they are a step in the return to a sim-
pler valuation of it. A family is unique and highly desirable. To start one,
you have to get married. The role of the state in restoring the rewards
of marriage is to validate once again the rewards that marriage naturally
carries with it.
More General Implications for Policy
Crime and marriage are only examples of a general principle: Modern
American society can be simplified. No law of nature says that the in-
creasing complexity of technology must be matched by a new com-
plexity in the way the nation is governed. The increasing complexity of
technology follows from the functions it serves. The increasing com-
plexity of government does not. Often the complexities introduced by
technology require highly sophisticated analysis before good law and reg-
ulation can be developed. But as a rule of thumb, the more sophisticated
the analysis, the simpler the policies can be. Policy is usually compli-
cated because it has been built incrementally through a political process,
not because it has needed to become more complicated. The time has
come to make simplification a top priority in reforming policy-not
for
a handful of regulations but across the board.
More broadly, we urge that it is possible once again to make a core of
common law, combined with the original concepts of negligence and
liability in tort law, the mechanism for running society+asily
under-
stood by all and a basis for the straightforward lessons that parents at
all levels of cognitive ability above the lowest can teach their child-
ren about how to behave as they grow up. We readily acknowledge
that modernity requires some amplifications of this simple mechanism,
but the nation needs to think through those amplifications from the
legal equivalent of zero-based budgeting. As matters stand, the legal
edifice has become a labyrinth that only the rich and the smart can
navigate.
BLANKS UNFILLED
We have presented what we believe needs to be done. We also under-
stand that a common response will be incredulity, for different readers
will interpret the long chapters that have come before as a manifesto
for completely different kinds of policy initiatives. Specifically, two lines
of argument are likely to follow from this book. To some, we will have
made a case for increased income redistribution. To others, we will have
made a case for steps to manipulate the fertility of people with high
and low IQs. We will be pleased if the book leads to a vigorous discus-
sion of these issues, but we have just a few words to say about them here.
Dealing with Income
Ever since most people quit believing that a person's income on earth
reflects God's judgment of his worth, it has been argued that income dis-
tributions are inherently unfair; most wealthy people do not "deserve"
their wealth nor the poor their poverty. That being the case, it is ap-
propriate for societies to take from the rich and give to the poor. The
statistical relationship we have documented between low cognitive abil-
ity and income is more evidence that the world is not fair.
Rut it is not news that the world is unfair. You knew before reading
this book that income differences arise from many arbitrary causes, so-
ciological and psychological, besides differences in intelligence. All of
them are reflected in correlations of varying sizes, which mean all of
them are riddled with exceptions. This complicates solutions. When-
ever individual cases are examined, differences in circumstances will be
found that do reflect the individual's fault or merit. The data in this book
support old arguments for supplementing the income of the poor with-
out giving any new guidance for how to do it.
The evidence about cognitive ability causes us to be sympathetic to
the straightforward proposition that "trying hard" ought to be rewarded.
Our prescription, borrowing from the case made by political scientist
David Ellwood, is that people who work full time should not be too poor
to have a decent standard of living, even if the kinds of work they can
do are not highly valued in the marketplace.2K We do not put this as a
principle of government for all countries-getting
everybody out of
poverty is not an option in most of the world-but
it is appropriate for
rich countries to try to do.
How? There is no economically perfect alternative. Any government
supplement of wages produces negative effects of many kinds. Such de-
fects are not the results of bad policy design but inherent. The least dam-
aging strategies are the simplest ones, which do not try to oversee or
manipulate the labor market behavior of low-income people, but rather
augment their earned income up to a floor. The earned income tax
Income, IQ, and Social Policy
- The authors argue that the correlation between low cognitive ability and low income reinforces the idea that economic outcomes are often inherently unfair.
- They advocate for a 'decent standard of living' for full-time workers, regardless of the market value of their specific labor.
- Simple income supplements, like the Earned Income Tax Credit, are preferred over complex social welfare systems that attempt to manipulate labor market behavior.
- The text suggests that the current social welfare system undermines the ability of the poor to take control of their lives and find meaningful community roles.
- A controversial claim is made that a society's well-being is linked to its mean IQ, and that current American demographic trends are moving in a negative direction.
- The authors propose replacing traditional social welfare with direct cash supplements to foster individual engagement and community value.
But it is not news that the world is unfair.
546
Living Together
A Place for Everyone
547
We do not expect such changes miraculously to resuscitate marriage
in the lowest cognitive classes, but they are a step in the return to a sim-
pler valuation of it. A family is unique and highly desirable. To start one,
you have to get married. The role of the state in restoring the rewards
of marriage is to validate once again the rewards that marriage naturally
carries with it.
More General Implications for Policy
Crime and marriage are only examples of a general principle: Modern
American society can be simplified. No law of nature says that the in-
creasing complexity of technology must be matched by a new com-
plexity in the way the nation is governed. The increasing complexity of
technology follows from the functions it serves. The increasing com-
plexity of government does not. Often the complexities introduced by
technology require highly sophisticated analysis before good law and reg-
ulation can be developed. But as a rule of thumb, the more sophisticated
the analysis, the simpler the policies can be. Policy is usually compli-
cated because it has been built incrementally through a political process,
not because it has needed to become more complicated. The time has
come to make simplification a top priority in reforming policy-not
for
a handful of regulations but across the board.
More broadly, we urge that it is possible once again to make a core of
common law, combined with the original concepts of negligence and
liability in tort law, the mechanism for running society+asily
under-
stood by all and a basis for the straightforward lessons that parents at
all levels of cognitive ability above the lowest can teach their child-
ren about how to behave as they grow up. We readily acknowledge
that modernity requires some amplifications of this simple mechanism,
but the nation needs to think through those amplifications from the
legal equivalent of zero-based budgeting. As matters stand, the legal
edifice has become a labyrinth that only the rich and the smart can
navigate.
BLANKS UNFILLED
We have presented what we believe needs to be done. We also under-
stand that a common response will be incredulity, for different readers
will interpret the long chapters that have come before as a manifesto
for completely different kinds of policy initiatives. Specifically, two lines
of argument are likely to follow from this book. To some, we will have
made a case for increased income redistribution. To others, we will have
made a case for steps to manipulate the fertility of people with high
and low IQs. We will be pleased if the book leads to a vigorous discus-
sion of these issues, but we have just a few words to say about them here.
Dealing with Income
Ever since most people quit believing that a person's income on earth
reflects God's judgment of his worth, it has been argued that income dis-
tributions are inherently unfair; most wealthy people do not "deserve"
their wealth nor the poor their poverty. That being the case, it is ap-
propriate for societies to take from the rich and give to the poor. The
statistical relationship we have documented between low cognitive abil-
ity and income is more evidence that the world is not fair.
Rut it is not news that the world is unfair. You knew before reading
this book that income differences arise from many arbitrary causes, so-
ciological and psychological, besides differences in intelligence. All of
them are reflected in correlations of varying sizes, which mean all of
them are riddled with exceptions. This complicates solutions. When-
ever individual cases are examined, differences in circumstances will be
found that do reflect the individual's fault or merit. The data in this book
support old arguments for supplementing the income of the poor with-
out giving any new guidance for how to do it.
The evidence about cognitive ability causes us to be sympathetic to
the straightforward proposition that "trying hard" ought to be rewarded.
Our prescription, borrowing from the case made by political scientist
David Ellwood, is that people who work full time should not be too poor
to have a decent standard of living, even if the kinds of work they can
do are not highly valued in the marketplace.2K We do not put this as a
principle of government for all countries-getting
everybody out of
poverty is not an option in most of the world-but
it is appropriate for
rich countries to try to do.
How? There is no economically perfect alternative. Any government
supplement of wages produces negative effects of many kinds. Such de-
fects are not the results of bad policy design but inherent. The least dam-
aging strategies are the simplest ones, which do not try to oversee or
manipulate the labor market behavior of low-income people, but rather
augment their earned income up to a floor. The earned income tax
548
Living Together
A Place for Everyone
549
credit, already in place, seems to be a generally good strategy, albeit with
the unavoidable drawbacks of any income supplement.i2v'
We will not try to elaborate on these arguments here. We leave the
income issue with this: As America enters the twenty-first century, it is
inconceivable that it will return to a laissez-faire system regarding in-
come. Some sort of redistribution is here to stay. The question is how
to redistribute in ways that increase the chances for people at the bot-
tom of society to take control of their lives, to be engaged meaningfully
in their communities, and to find valued places for themselves. Cash
supplements need not compete with that goal, whereas the social wel-
fare system that the nation has developed in the twentieth century most
definitely does. We should be looking for ways to replace the latter with
the former.
Dealing with Demography
Of all the uncomfortable topics we have explored, a pair of the most un-
comfortable ones are that a society with a higher mean IQ is also likely
to be a society with fewer social ills and brighter economic prospects,
and that the most efficient way to raise the IQ of a society is for smarter
women to have higher birth rates than duller women. Instead, Amer-
ica is going in the opposite direction, and the implication is a future
America with more social ills and gloomier economic prospects. These
conclusions follow directly from the evidence we have presented at such
length, and yet we have so far been silent on what to do about it.
We are silent partly because we are as apprehensive as most other
people about what might happen when a govemment decides to social-
engineer who has babies and who doesn't. We can imagine no recom-
mendation for using the govemment to manipulate fertility that does
not have dangers. But this highlights the problem: The United States
already has policies that inadvertently social-engineer who has babies,
and it is encouraging the wrong women. If the United States did as much
to encourage high-IQ women to have babies as it now does to encourage low-
lQ women, it would rightly be described as engaging in a~gressive manipula-
tion offertility. The technically precise description of America's fertility
policy is that it subsidizes births among poor women, who are also dis-
proportionately at the low end of the intelligence distribution. We urge
generally that these policies, represented by the extensive network of
cash and services for low-income women who have babies, be ended.
The government should stop subsidizing births to anyone, rich or poor.
The other generic recommendation, as close to harmless as any gov-
ernment program we can imagine, is to make i t easy for women to make
good on their prior decision not to get pregnant by making available
birth control mechanisms that are increasingly flexible, foolproof, in-
expensive, and safe.
The other demographic factor we discussed in Chapter 15 was im-
migration and the evidence that recent waves of immigrants are, on the
average, less successful and
less able, than earlier waves. There
is no reason to assume that the hazards associated with low cognitive
ability in America are somehow circumvented by having heen born
abroad or having parents or grandparents who were. An immigrant pop-
ulation with low cognitive ability will-again,
on the average-have
trouble not only in finding good work but have trouble in school, at
home, and with the law.
This is not the place, nor are we the people, to try to rewrite immi-
gration law. But we believe that the main purpose of immigration law
should be to serve America's interests. It should be among the goals of
public policy to shift the flow of immigrants away from those admitted
under the nepotistic rules (which broadly encourage the reunification
of relatives) and toward those admitted under competency rules, already
established in immigration law-not
to the total exclusion of nepotis-
tic and humanitarian criteria but a shift. Perhaps our central thought
ahout immigration is that present policy assumes an indifference to the
individual characteristics of immigrants that no society can indefinitely
maintain without danger.
CONCLUSION
Hundreds of pages ago, in the Preface, we reflected on the question that
we have been asked so often, "What good can come from writing this
book?" We have tried to answer it in many ways.
Our first answer has been implicit, scattered in material throughout
the book. For thirty years, vast changes in American life have been in-
stituted hy the federal government to deal with social problems. We
have tried to point out what a small segment of the population accounts
for such a large proportion of those problems. To the extent that the
problems of this small segment are susceptible to social-engineering so-
Cognitive Ability and Public Policy
- The authors argue that current U.S. welfare policies inadvertently subsidize births among women with lower cognitive ability, creating a form of accidental social engineering.
- They propose ending all government birth subsidies for both rich and poor to eliminate these demographic distortions.
- The text advocates for making birth control more accessible and foolproof to help women avoid unintended pregnancies.
- Regarding immigration, the authors suggest shifting priority from family reunification to competency-based rules to ensure immigrants contribute positively to the economy.
- They conclude that social problems are often concentrated within a small segment of the population, requiring highly targeted rather than broad federal interventions.
- The overarching recommendation is that all public policy should be designed with an awareness of the wide variation in human cognitive ability.
The technically precise description of America's fertility policy is that it subsidizes births among poor women, who are also disproportionately at the low end of the intelligence distribution.
548
Living Together
A Place for Everyone
549
credit, already in place, seems to be a generally good strategy, albeit with
the unavoidable drawbacks of any income supplement.i2v'
We will not try to elaborate on these arguments here. We leave the
income issue with this: As America enters the twenty-first century, it is
inconceivable that it will return to a laissez-faire system regarding in-
come. Some sort of redistribution is here to stay. The question is how
to redistribute in ways that increase the chances for people at the bot-
tom of society to take control of their lives, to be engaged meaningfully
in their communities, and to find valued places for themselves. Cash
supplements need not compete with that goal, whereas the social wel-
fare system that the nation has developed in the twentieth century most
definitely does. We should be looking for ways to replace the latter with
the former.
Dealing with Demography
Of all the uncomfortable topics we have explored, a pair of the most un-
comfortable ones are that a society with a higher mean IQ is also likely
to be a society with fewer social ills and brighter economic prospects,
and that the most efficient way to raise the IQ of a society is for smarter
women to have higher birth rates than duller women. Instead, Amer-
ica is going in the opposite direction, and the implication is a future
America with more social ills and gloomier economic prospects. These
conclusions follow directly from the evidence we have presented at such
length, and yet we have so far been silent on what to do about it.
We are silent partly because we are as apprehensive as most other
people about what might happen when a govemment decides to social-
engineer who has babies and who doesn't. We can imagine no recom-
mendation for using the govemment to manipulate fertility that does
not have dangers. But this highlights the problem: The United States
already has policies that inadvertently social-engineer who has babies,
and it is encouraging the wrong women. If the United States did as much
to encourage high-IQ women to have babies as it now does to encourage low-
lQ women, it would rightly be described as engaging in a~gressive manipula-
tion offertility. The technically precise description of America's fertility
policy is that it subsidizes births among poor women, who are also dis-
proportionately at the low end of the intelligence distribution. We urge
generally that these policies, represented by the extensive network of
cash and services for low-income women who have babies, be ended.
The government should stop subsidizing births to anyone, rich or poor.
The other generic recommendation, as close to harmless as any gov-
ernment program we can imagine, is to make i t easy for women to make
good on their prior decision not to get pregnant by making available
birth control mechanisms that are increasingly flexible, foolproof, in-
expensive, and safe.
The other demographic factor we discussed in Chapter 15 was im-
migration and the evidence that recent waves of immigrants are, on the
average, less successful and
less able, than earlier waves. There
is no reason to assume that the hazards associated with low cognitive
ability in America are somehow circumvented by having heen born
abroad or having parents or grandparents who were. An immigrant pop-
ulation with low cognitive ability will-again,
on the average-have
trouble not only in finding good work but have trouble in school, at
home, and with the law.
This is not the place, nor are we the people, to try to rewrite immi-
gration law. But we believe that the main purpose of immigration law
should be to serve America's interests. It should be among the goals of
public policy to shift the flow of immigrants away from those admitted
under the nepotistic rules (which broadly encourage the reunification
of relatives) and toward those admitted under competency rules, already
established in immigration law-not
to the total exclusion of nepotis-
tic and humanitarian criteria but a shift. Perhaps our central thought
ahout immigration is that present policy assumes an indifference to the
individual characteristics of immigrants that no society can indefinitely
maintain without danger.
CONCLUSION
Hundreds of pages ago, in the Preface, we reflected on the question that
we have been asked so often, "What good can come from writing this
book?" We have tried to answer it in many ways.
Our first answer has been implicit, scattered in material throughout
the book. For thirty years, vast changes in American life have been in-
stituted hy the federal government to deal with social problems. We
have tried to point out what a small segment of the population accounts
for such a large proportion of those problems. To the extent that the
problems of this small segment are susceptible to social-engineering so-
550
Living Together
A Place for Everyone
551
lutions at all, they should be highly targeted. The vast majority of Amer-
icans can run their own lives just fine, and policy should above all be
constructed so that it permits them to do so.
Our second answer, also implicit, has been that just about any policy
in any area---education, employment, welfare, criminal justice, or the
care of children--can profit if its designers ask how the policy accords
with the wide variation in cognitive ability. Policies may fail not be-
cause they are inherently flawed but because they do not make al-
lowances for how much people vary. There are hundreds of ways to frame
bits and pieces of public policy so that they are based on a realistic ap-
praisal of the responses they will get not from people who think like
Rhodes scholars but people who think in simpler ways.
Our third answer has gone to specific issues in raising the cognitive
functioning of the disadvantaged (Chapter 17) and in improving edu-
cation for all (Chapter 18). Part of our answer has been cautionary:
Much of public policy toward the disadvantaged starts from the premise
that interventions can make up for genetic or environmental disad-
vantages, and that premise is overly optimistic. Part of our answer has
been positive: Much can and should be done to improve education, es-
pecially for those who have the greatest potential.
Our fourth answer has been that group differences in cognitive abil-
ity, so desperately denied for so long, can best be handled--can only be
handled-by
a return to individualism. A person should not be judged
as a member of a group but as an individual. With that cornerstone of
the American doctrine once again in place, group differences can take
their appropriately insignificant place in affecting American life. But
until that cornerstone is once again in place, the anger, the hurt, and
the animosities will continue to grow.
In this closing chapter, we have focused on another aspect of what
makes America special. This most individualistic of nations contains
one of the friendliest, most eager to oblige, neighborly peoples in all the
world. Visitors to America from Tocqueville on down have observed it.
As a by-product of this generosity and civic mindedness, America has
had a genius for making valued places, for people of all kinds of abili-
ties, given only that they played by a few basic rules.
Once we as a nation absorbed people of different cultures, abilities,
incomes, and temperaments into communities that worked. The nation
was good at it precisely because of, not in spite of, the freedom that
American individuals and communities enjoyed. Have there been ex-
ceptions to that generalization? Yes, predominantly involving race, and
the nation rightly moved to rid itself of the enforced discrimination that
lay heh~nd those exceptions. Is the generalization nonetheless justified?
Overwhelmingly so, in our judgment. Reducing that freedom has ener-
vated our national genius for finding valued places for everyone; the ge-
nlus will not be revitalized until the freedom is restored.
Cognitive partitioning will continue. It cannot be stopped, because
the forces driving it cannot be stopped. But America can choose to pre-
serve a society in which every citizen has access to the central satisfac-
tions of life. Its people can, through an interweaving of choice and
responsibility, create valued places for themselves in their worlds. They
can l~ve in communities-urban
or rural-where
being a good parent,
a good neighbor, and a good friend will give their lives purpose and
meaning. They can weave the most crucial safety nets together, so that
their mistakes and misfortunes are mitigated and withstood with a lit-
tle help from their friends.
All of these good things are available now to those who are smart
enough or rich enough-if
they can exploit the complex rules to their
advantage, buy their way out of the social institutions that no longer
function, and have access to the rich human interconnections that are
growing, not diminishing, for the cognitively fortunate. We are calling
upon our readers, so heavily concentrated among those who fit that de-
scription, to recognize the ways in which public pol~cy has come to deny
those good things to those who are not smart enough and rich enough.
At the heart of our thought is the quest for human dignity. The cen-
tral measure of success for this government, as for any other, is to per-
mit people to live lives of dignity-not
to give them dignity, for that is
not in any government's power, but to make it accessible to all. That is
one way of thinking about what the Founders had in mind when they
proclaimed, as a truth self-evident, that all men are created equal. That
is what we have in mind when we talk about valued places for everyone.
Inequality of endowments, including intelligence, is a reality. Trying
to pretend that inequality does not really exist has led to disaster. Try-
ing to eradicate inequality with artificially manufactured outcomes has
led to disaster. It is time for America once again to try living with in-
equality, as life is lived: understanding that each human being has
strengths and weaknesses, qualities we admire and qualities we do not
Restoring Individualism and Community
- Public policy must be redesigned to account for realistic human cognitive diversity rather than assuming everyone processes information like scholars.
- The authors argue that group differences in ability should be rendered insignificant by returning to a strict focus on individual judgment.
- Historical American success in integrating diverse populations is attributed to a high degree of individual and community freedom.
- Current social structures allow the wealthy and intelligent to bypass failing institutions, while the disadvantaged remain trapped by them.
- The ultimate goal of government should be to foster a society where every citizen, regardless of cognitive ability, can find a 'valued place' and live with dignity.
The nation was good at it precisely because of, not in spite of, the freedom that American individuals and communities enjoyed.
550
Living Together
A Place for Everyone
551
lutions at all, they should be highly targeted. The vast majority of Amer-
icans can run their own lives just fine, and policy should above all be
constructed so that it permits them to do so.
Our second answer, also implicit, has been that just about any policy
in any area---education, employment, welfare, criminal justice, or the
care of children--can profit if its designers ask how the policy accords
with the wide variation in cognitive ability. Policies may fail not be-
cause they are inherently flawed but because they do not make al-
lowances for how much people vary. There are hundreds of ways to frame
bits and pieces of public policy so that they are based on a realistic ap-
praisal of the responses they will get not from people who think like
Rhodes scholars but people who think in simpler ways.
Our third answer has gone to specific issues in raising the cognitive
functioning of the disadvantaged (Chapter 17) and in improving edu-
cation for all (Chapter 18). Part of our answer has been cautionary:
Much of public policy toward the disadvantaged starts from the premise
that interventions can make up for genetic or environmental disad-
vantages, and that premise is overly optimistic. Part of our answer has
been positive: Much can and should be done to improve education, es-
pecially for those who have the greatest potential.
Our fourth answer has been that group differences in cognitive abil-
ity, so desperately denied for so long, can best be handled--can only be
handled-by
a return to individualism. A person should not be judged
as a member of a group but as an individual. With that cornerstone of
the American doctrine once again in place, group differences can take
their appropriately insignificant place in affecting American life. But
until that cornerstone is once again in place, the anger, the hurt, and
the animosities will continue to grow.
In this closing chapter, we have focused on another aspect of what
makes America special. This most individualistic of nations contains
one of the friendliest, most eager to oblige, neighborly peoples in all the
world. Visitors to America from Tocqueville on down have observed it.
As a by-product of this generosity and civic mindedness, America has
had a genius for making valued places, for people of all kinds of abili-
ties, given only that they played by a few basic rules.
Once we as a nation absorbed people of different cultures, abilities,
incomes, and temperaments into communities that worked. The nation
was good at it precisely because of, not in spite of, the freedom that
American individuals and communities enjoyed. Have there been ex-
ceptions to that generalization? Yes, predominantly involving race, and
the nation rightly moved to rid itself of the enforced discrimination that
lay heh~nd those exceptions. Is the generalization nonetheless justified?
Overwhelmingly so, in our judgment. Reducing that freedom has ener-
vated our national genius for finding valued places for everyone; the ge-
nlus will not be revitalized until the freedom is restored.
Cognitive partitioning will continue. It cannot be stopped, because
the forces driving it cannot be stopped. But America can choose to pre-
serve a society in which every citizen has access to the central satisfac-
tions of life. Its people can, through an interweaving of choice and
responsibility, create valued places for themselves in their worlds. They
can l~ve in communities-urban
or rural-where
being a good parent,
a good neighbor, and a good friend will give their lives purpose and
meaning. They can weave the most crucial safety nets together, so that
their mistakes and misfortunes are mitigated and withstood with a lit-
tle help from their friends.
All of these good things are available now to those who are smart
enough or rich enough-if
they can exploit the complex rules to their
advantage, buy their way out of the social institutions that no longer
function, and have access to the rich human interconnections that are
growing, not diminishing, for the cognitively fortunate. We are calling
upon our readers, so heavily concentrated among those who fit that de-
scription, to recognize the ways in which public pol~cy has come to deny
those good things to those who are not smart enough and rich enough.
At the heart of our thought is the quest for human dignity. The cen-
tral measure of success for this government, as for any other, is to per-
mit people to live lives of dignity-not
to give them dignity, for that is
not in any government's power, but to make it accessible to all. That is
one way of thinking about what the Founders had in mind when they
proclaimed, as a truth self-evident, that all men are created equal. That
is what we have in mind when we talk about valued places for everyone.
Inequality of endowments, including intelligence, is a reality. Trying
to pretend that inequality does not really exist has led to disaster. Try-
ing to eradicate inequality with artificially manufactured outcomes has
led to disaster. It is time for America once again to try living with in-
equality, as life is lived: understanding that each human being has
strengths and weaknesses, qualities we admire and qualities we do not
Equality and Statistical Distributions
- The author argues that governments cannot grant dignity but should ensure it is accessible by valuing every person as a fellow citizen.
- Attempts to pretend inequality of intelligence doesn't exist or to force equal outcomes have historically led to disaster.
- Human success should be measured internally rather than by external metrics of competence or endowment.
- The text transitions into a simplified explanation of statistics, defining standard deviation as a precise measure of how 'spread out' data points are.
- A frequency distribution is illustrated through a mental exercise of lining up high school students by height to visualize patterns in a population.
It is time for America once again to try living with inequality, as life is lived: understanding that each human being has strengths and weaknesses, qualities we admire and qualities we do not admire.
550
Living Together
A Place for Everyone
551
lutions at all, they should be highly targeted. The vast majority of Amer-
icans can run their own lives just fine, and policy should above all be
constructed so that it permits them to do so.
Our second answer, also implicit, has been that just about any policy
in any area---education, employment, welfare, criminal justice, or the
care of children--can profit if its designers ask how the policy accords
with the wide variation in cognitive ability. Policies may fail not be-
cause they are inherently flawed but because they do not make al-
lowances for how much people vary. There are hundreds of ways to frame
bits and pieces of public policy so that they are based on a realistic ap-
praisal of the responses they will get not from people who think like
Rhodes scholars but people who think in simpler ways.
Our third answer has gone to specific issues in raising the cognitive
functioning of the disadvantaged (Chapter 17) and in improving edu-
cation for all (Chapter 18). Part of our answer has been cautionary:
Much of public policy toward the disadvantaged starts from the premise
that interventions can make up for genetic or environmental disad-
vantages, and that premise is overly optimistic. Part of our answer has
been positive: Much can and should be done to improve education, es-
pecially for those who have the greatest potential.
Our fourth answer has been that group differences in cognitive abil-
ity, so desperately denied for so long, can best be handled--can only be
handled-by
a return to individualism. A person should not be judged
as a member of a group but as an individual. With that cornerstone of
the American doctrine once again in place, group differences can take
their appropriately insignificant place in affecting American life. But
until that cornerstone is once again in place, the anger, the hurt, and
the animosities will continue to grow.
In this closing chapter, we have focused on another aspect of what
makes America special. This most individualistic of nations contains
one of the friendliest, most eager to oblige, neighborly peoples in all the
world. Visitors to America from Tocqueville on down have observed it.
As a by-product of this generosity and civic mindedness, America has
had a genius for making valued places, for people of all kinds of abili-
ties, given only that they played by a few basic rules.
Once we as a nation absorbed people of different cultures, abilities,
incomes, and temperaments into communities that worked. The nation
was good at it precisely because of, not in spite of, the freedom that
American individuals and communities enjoyed. Have there been ex-
ceptions to that generalization? Yes, predominantly involving race, and
the nation rightly moved to rid itself of the enforced discrimination that
lay heh~nd those exceptions. Is the generalization nonetheless justified?
Overwhelmingly so, in our judgment. Reducing that freedom has ener-
vated our national genius for finding valued places for everyone; the ge-
nlus will not be revitalized until the freedom is restored.
Cognitive partitioning will continue. It cannot be stopped, because
the forces driving it cannot be stopped. But America can choose to pre-
serve a society in which every citizen has access to the central satisfac-
tions of life. Its people can, through an interweaving of choice and
responsibility, create valued places for themselves in their worlds. They
can l~ve in communities-urban
or rural-where
being a good parent,
a good neighbor, and a good friend will give their lives purpose and
meaning. They can weave the most crucial safety nets together, so that
their mistakes and misfortunes are mitigated and withstood with a lit-
tle help from their friends.
All of these good things are available now to those who are smart
enough or rich enough-if
they can exploit the complex rules to their
advantage, buy their way out of the social institutions that no longer
function, and have access to the rich human interconnections that are
growing, not diminishing, for the cognitively fortunate. We are calling
upon our readers, so heavily concentrated among those who fit that de-
scription, to recognize the ways in which public pol~cy has come to deny
those good things to those who are not smart enough and rich enough.
At the heart of our thought is the quest for human dignity. The cen-
tral measure of success for this government, as for any other, is to per-
mit people to live lives of dignity-not
to give them dignity, for that is
not in any government's power, but to make it accessible to all. That is
one way of thinking about what the Founders had in mind when they
proclaimed, as a truth self-evident, that all men are created equal. That
is what we have in mind when we talk about valued places for everyone.
Inequality of endowments, including intelligence, is a reality. Trying
to pretend that inequality does not really exist has led to disaster. Try-
ing to eradicate inequality with artificially manufactured outcomes has
led to disaster. It is time for America once again to try living with in-
equality, as life is lived: understanding that each human being has
strengths and weaknesses, qualities we admire and qualities we do not
55 2
Living Together
admire, competencies and incompetences, assets and debits; that the
success of each human life is not measured externally but internally;
that of all the rewards we can confer on each other, the most precious
is a place as a valued fellow citizen.
Appendix 1
Statistics for People Who Are
Sure They Can't Learn Statistics
The short explanations of standard deviation (page 44), correlation
(page 67), and regression (page 122) should be satisfactory for people
who are at home with math but never took a statistics course. The longer
explanations in this appendix are for people who would like to under-
stand what distribution, standard deviation, correlation, and regression
mean, but who are not at home with math.
DISTRIBUTIONS AND STANDARD DEVIATIONS
Why Do We Need "Standard Deviation"?
Every day, formally or informally, people make comparisons-among
people, among apples and oranges, among dairy cows or egg-laying hens,
among the screws being coughed out by a screw machine. The standard
deviation is a measure of how spread out the things being compared are.
"This egg is a lot bigger than average," a chicken farmer might say. The
standard deviation is a way of saying precisely what "a lot" means.
What Is a Frequency Distribution?
To get a clear idea of what a frequency distribution is, imagine yourself
back in your high school gym, with all the boys in the senior class in the
school gym assembled before you (including both sexes would compli-
cate matters, and the point of this discussion is to keep things simple).
Line up these boys from left to right in order of height.
Now you have a long line going from shortest to tallest. As you look
along the line you will see that only few boys are conspicuously short
and tall. Most are in the middle, and a lot of them seem identical in
height. Is there any way to get a better idea of how this pattern looks?
554
Appendix 1
Appendix 1
555
Tape a series of cards to the floor in a straight line from left to right,
with "60 inches and shorter" written on the one at the far left, "80 inches
and taller" on the card at the far right, and cards in l-inch increments
in between. Tell everyone to stand behind the card that corresponds to
his height.
Someone loops a rope over the rafters and pulls you up in the air so
you can look straight down on the tops of the heads of your classmates
standing in their single files behind the height labels. The figure below
shows what you see: a frequency distribution.' What good is it? Look-
The raw material of a frequency distribution
ing at your high school classmates standing around in a mob, you can
tell very little about their height. Looking at those same classmates
arranged into a frequency distribution, you can tell a lot, quickly and
memorably.
How Is the Distribution Related to the Standard Deviation?
We still lack a convenient way of expressing where people are in that
distribution. What does it mean to say that two different students are,
say, 6 inches different in height. How "big" is a 6-inch difference? That
brings us back to the standard deviation.
When it comes to high school students, you have a good idea of how
big a 6-inch difference is. But what does a 6-inch difference mean if you
are talking about the height of elephants? About the height of cats? It
depends. And the things it depends on are the average height and how
much height varies among the things you are measuring. A standard de-
viation gives you a way of taking both the average and that variability into ac-
count, so that "6 inches" can be expressed in a way that means the same thing
for high school students relative to other high school students, elephants rela-
tive to other elephants, and cats relative to other cats.
How Do You Compute a Standard Deviation?
Suppose that your high school class consisted of just two people who
were 66 inches and 70 inches. Obviously, the average is 68 inches. Just
as obviously, one person is 2 inches shorter than average, one person is
2 inches taller than average. The standard deviation is a kind of aver-
age of the differences from the mean-2
inches, in this example. Sup-
pose you add two more people to the class, one who is 64 inches and the
other who is 72 inches. The mean hasn't changed (the two new people
balance each other off exactly). But the newcomers are each 4 inches
different from the average height of 68 inches, so the standard devia-
tion, which measures the spread, has gotten bigger as well. Now two
people are 4 inches different from the average and two people are 2
inches different from the average. That adds up to a total 12 inches, di-
vided among four persons. The simple average of these differences from
the mean is 3 inches (12 + 4), which is almost (but not quite) what the
standard deviation is. To be precise, the standard deviation is calculated
by squaring the deviations from the mean, then summing them, then
finding their average, then taking the square root of the result. In this
example, two people are 4 inches from the mean and two are 2 inches
from the mean. The sum of the squared deviations is 40 (16 + 16 + 4
+ 4). Their average is 10 (40 + 4). And the square root of 10 is 3.16,
which is the standard deviation for this example, The technical reasons
for using the standard deviation instead of the simple average of the de-
viations from the mean are not necessary to go into, except that, in nor-
mal distributions, the standard deviation has wonderfully convenient
properties. If you are looking for a short, easy way to think of a standard
deviation, view it as the average difference from the mean.
As an example of how a standard deviation can be used to compare
apples and oranges, suppose we are comparing the Olympic women's
gymnastics team and NBA basketball teams. You see a woman who is 5
feet 6 inches and a man who is 7 feet. You know from watching gym-
nastics on television that 5 feet 6 inches is tall for a woman gymnast,
and 7 feet is tall even for a basketball player. But you want to do better
than a general impression. Just how unusual is the woman, compared to
Understanding the Standard Deviation
- The standard deviation provides a context-dependent measure of variability, allowing for meaningful comparisons across different scales like elephants and cats.
- It accounts for both the average and the spread of data, transforming raw measurements into a standardized language of relative difference.
- Calculating the standard deviation involves squaring deviations from the mean, averaging them, and then taking the square root.
- A 'standard score' allows for 'apples-to-oranges' comparisons, such as determining whether a gymnast is more unusually tall than a basketball player.
- In practical terms, the standard deviation can be conceptualized as the average difference from the mean within a specific population.
As an example of how a standard deviation can be used to compare apples and oranges, suppose we are comparing the Olympic women's gymnastics team and NBA basketball teams.
554
Appendix 1
Appendix 1
555
Tape a series of cards to the floor in a straight line from left to right,
with "60 inches and shorter" written on the one at the far left, "80 inches
and taller" on the card at the far right, and cards in l-inch increments
in between. Tell everyone to stand behind the card that corresponds to
his height.
Someone loops a rope over the rafters and pulls you up in the air so
you can look straight down on the tops of the heads of your classmates
standing in their single files behind the height labels. The figure below
shows what you see: a frequency distribution.' What good is it? Look-
The raw material of a frequency distribution
ing at your high school classmates standing around in a mob, you can
tell very little about their height. Looking at those same classmates
arranged into a frequency distribution, you can tell a lot, quickly and
memorably.
How Is the Distribution Related to the Standard Deviation?
We still lack a convenient way of expressing where people are in that
distribution. What does it mean to say that two different students are,
say, 6 inches different in height. How "big" is a 6-inch difference? That
brings us back to the standard deviation.
When it comes to high school students, you have a good idea of how
big a 6-inch difference is. But what does a 6-inch difference mean if you
are talking about the height of elephants? About the height of cats? It
depends. And the things it depends on are the average height and how
much height varies among the things you are measuring. A standard de-
viation gives you a way of taking both the average and that variability into ac-
count, so that "6 inches" can be expressed in a way that means the same thing
for high school students relative to other high school students, elephants rela-
tive to other elephants, and cats relative to other cats.
How Do You Compute a Standard Deviation?
Suppose that your high school class consisted of just two people who
were 66 inches and 70 inches. Obviously, the average is 68 inches. Just
as obviously, one person is 2 inches shorter than average, one person is
2 inches taller than average. The standard deviation is a kind of aver-
age of the differences from the mean-2
inches, in this example. Sup-
pose you add two more people to the class, one who is 64 inches and the
other who is 72 inches. The mean hasn't changed (the two new people
balance each other off exactly). But the newcomers are each 4 inches
different from the average height of 68 inches, so the standard devia-
tion, which measures the spread, has gotten bigger as well. Now two
people are 4 inches different from the average and two people are 2
inches different from the average. That adds up to a total 12 inches, di-
vided among four persons. The simple average of these differences from
the mean is 3 inches (12 + 4), which is almost (but not quite) what the
standard deviation is. To be precise, the standard deviation is calculated
by squaring the deviations from the mean, then summing them, then
finding their average, then taking the square root of the result. In this
example, two people are 4 inches from the mean and two are 2 inches
from the mean. The sum of the squared deviations is 40 (16 + 16 + 4
+ 4). Their average is 10 (40 + 4). And the square root of 10 is 3.16,
which is the standard deviation for this example, The technical reasons
for using the standard deviation instead of the simple average of the de-
viations from the mean are not necessary to go into, except that, in nor-
mal distributions, the standard deviation has wonderfully convenient
properties. If you are looking for a short, easy way to think of a standard
deviation, view it as the average difference from the mean.
As an example of how a standard deviation can be used to compare
apples and oranges, suppose we are comparing the Olympic women's
gymnastics team and NBA basketball teams. You see a woman who is 5
feet 6 inches and a man who is 7 feet. You know from watching gym-
nastics on television that 5 feet 6 inches is tall for a woman gymnast,
and 7 feet is tall even for a basketball player. But you want to do better
than a general impression. Just how unusual is the woman, compared to
556
Appendix 1
Appendix 1
5 5 7
the average gymnast on the U.S. women's team, and how unusual is the
man, compared to the average basketball player on the U.S. men's team?
We gather data on height among all the women gymnasts, and de-
termine that the mean is 5 feet 1 inches with a standard deviation (SD)
of 2 inches. For the men basketball players, we find that the mean is 6
feet 6 inches and the SD is 4 inches. Thus the woman who is 5 feet 6
inches is 2.5 standard deviations taller than the average; the 7-foot man
is only 1.5 standard deviations taller than the average. These numbers-
2.5 for the woman and 1.5 for the man-are
called standard scores in
statistical jargon. Now we have an explicit numerical way to compare
how different the two people are from their respective averages, and we
have a basis for concluding that the woman who is 5 feet 6 inches is a
lot taller relative to other female Olympic gymnasts than a 7-foot man
is relative to other NBA basketball players.
How Much More Different? Enter the Normal Distribution
Even before coming to this book, most readers had heard the phrases
normal disnibution or bell-shaped curve , or, as in our title, bell curve. .ey
refer to a common way that natural phenomena arrange themselves ap-
proximately. (The true normal distribution is a mathematical abstrac-
tion, never perfectly observed in nature.) If you look again at the
distribution of high school boys that opened the discussion, you will
see the makings of a bell curve. If we added several thousand more boys
to it, the kinks and irregularities would smooth out, and it would actually
get very close to a normal distribution. A perfect one is in the figure
below.
A perfect bell curve
It makes sense that most things will be arranged in bell-shaped curves.
Extremes tend to be rarer than the average. If that sounds like a tautol-
ogy, it is only because bell curves are so common. Consider height again.
Seven feet is "extreme" for humans. But if human height were distrib-
uted so that equal proportions of people were 5 feet, 6 feet, and 7 feet
tall, the extreme would not be rarer than the average. It just so happens
that the world hardly ever works that way.
Bell curves (or close approximations to them) are not only common
in nature; they have a close mathematical affinity to the meaning of the
standard deviation. In any true normal distribution, no matter whether
the elements are the heights of basketball players, the diameters of screw
heads, or the milk production of cows, 68.27 percent of all the cases fall
in the interval between 1 standard deviation above the mean and 1 stan-
dard deviation below it. It is worth pausing a moment over this link be-
tween a relatively simple measure of spread in a distribution and the way
things in everyday life vary, for it is one of nature's more remarkable uni-
formities.
In its mathematical form, the normal distribution extends to infin-
ity in both directions, never quite reaching the horizontal axis. But for
practical purposes, when we are talking about populations of people, a
normal distribution is about 6 standard deviations wide. The next fig-
ure shows how the bell curve looks, cut up into six regions, each marked
A bell curve cut into standard deviations
Standard deviations from the mean
by a standard deviation unit. The range within
3 standard deviation
units includes 99.7 percent of a population that is distributed normally.
We can squeeze the axis and make it look narrow, or stretch it out
and make it look wide, as shown in the following figure. Appearances
notwithstanding, the mathematical shape is not really changing. The
The Power of Bell Curves
- The normal distribution, or bell curve, is a mathematical abstraction that describes how natural phenomena typically arrange themselves.
- In a true normal distribution, 68.27 percent of all cases fall within one standard deviation above or below the mean.
- The standard deviation provides a universal metric for comparison, regardless of whether the data represents height, IQ, or industrial measurements.
- For practical human populations, the distribution is roughly six standard deviations wide, covering 99.7 percent of the group within three units of the mean.
- Standard deviations allow for intuitive categorization of differences, where one unit is 'large' and three units is 'huge' or extreme.
It is worth pausing a moment over this link between a relatively simple measure of spread in a distribution and the way things in everyday life vary, for it is one of nature's more remarkable uniformities.
556
Appendix 1
Appendix 1
5 5 7
the average gymnast on the U.S. women's team, and how unusual is the
man, compared to the average basketball player on the U.S. men's team?
We gather data on height among all the women gymnasts, and de-
termine that the mean is 5 feet 1 inches with a standard deviation (SD)
of 2 inches. For the men basketball players, we find that the mean is 6
feet 6 inches and the SD is 4 inches. Thus the woman who is 5 feet 6
inches is 2.5 standard deviations taller than the average; the 7-foot man
is only 1.5 standard deviations taller than the average. These numbers-
2.5 for the woman and 1.5 for the man-are
called standard scores in
statistical jargon. Now we have an explicit numerical way to compare
how different the two people are from their respective averages, and we
have a basis for concluding that the woman who is 5 feet 6 inches is a
lot taller relative to other female Olympic gymnasts than a 7-foot man
is relative to other NBA basketball players.
How Much More Different? Enter the Normal Distribution
Even before coming to this book, most readers had heard the phrases
normal disnibution or bell-shaped curve , or, as in our title, bell curve. .ey
refer to a common way that natural phenomena arrange themselves ap-
proximately. (The true normal distribution is a mathematical abstrac-
tion, never perfectly observed in nature.) If you look again at the
distribution of high school boys that opened the discussion, you will
see the makings of a bell curve. If we added several thousand more boys
to it, the kinks and irregularities would smooth out, and it would actually
get very close to a normal distribution. A perfect one is in the figure
below.
A perfect bell curve
It makes sense that most things will be arranged in bell-shaped curves.
Extremes tend to be rarer than the average. If that sounds like a tautol-
ogy, it is only because bell curves are so common. Consider height again.
Seven feet is "extreme" for humans. But if human height were distrib-
uted so that equal proportions of people were 5 feet, 6 feet, and 7 feet
tall, the extreme would not be rarer than the average. It just so happens
that the world hardly ever works that way.
Bell curves (or close approximations to them) are not only common
in nature; they have a close mathematical affinity to the meaning of the
standard deviation. In any true normal distribution, no matter whether
the elements are the heights of basketball players, the diameters of screw
heads, or the milk production of cows, 68.27 percent of all the cases fall
in the interval between 1 standard deviation above the mean and 1 stan-
dard deviation below it. It is worth pausing a moment over this link be-
tween a relatively simple measure of spread in a distribution and the way
things in everyday life vary, for it is one of nature's more remarkable uni-
formities.
In its mathematical form, the normal distribution extends to infin-
ity in both directions, never quite reaching the horizontal axis. But for
practical purposes, when we are talking about populations of people, a
normal distribution is about 6 standard deviations wide. The next fig-
ure shows how the bell curve looks, cut up into six regions, each marked
A bell curve cut into standard deviations
Standard deviations from the mean
by a standard deviation unit. The range within
3 standard deviation
units includes 99.7 percent of a population that is distributed normally.
We can squeeze the axis and make it look narrow, or stretch it out
and make it look wide, as shown in the following figure. Appearances
notwithstanding, the mathematical shape is not really changing. The
5 58
Appendix 1
Appendix 1
559
Standard deviations cut off the same portions of the population for
any normal distribution
standard deviation continues to chop off proportionately the same size
chunks of the distribution in each case. And therein lies its value. The
standard deviation has the same meaning no matter whether the dis-
tribution is tall and skinny or short and wide.
Furthermore, there are some simple characteristics about these scores
that make them especially valuable. As you can see by looking at the
figures above, it makes intuitive sense to think of a 1 standard deviation
difference as "large," a 2 standard deviation difference as "very large,"
and a 3 standard deviation difference as "huge." This is an easy metric
to remember. Specifically, a person who is 1 standard deviation above
the mean in IQ is at the 84th percentile. Two standard deviations above
the mean puts him at the 98th percentile. Three standard deviations
above the mean puts him at the 99.9th percentile. A person who is 1
standard deviation below the mean is at the 16th percentile. Two stan-
dard deviations below the mean puts him at the 2d percentile. Three
standard deviations below the mean puts him at the O.lth percentile.
Why Not Just Use Percentiles to Begin With?
Why go to all the trouble of computing standard scores? Most people
understand percentiles already. Tell them that someone is at the 84th
percentile, and they know right away what you mean. Tell them that
he's at the 99th percentile, and they know what that means. Aren't we
just introducing an unnecessary complication by talking about "stan-
dard scores"?
Thinking in terms of percentiles is convenient and has its legitimate
uses. We often speak in terms of percentiles--or centiles-in
the text.
But they can also be highly misleading, because they are artificially com-
pressed at the tails of the distributions. It is a longer way from, say, the
98th centile to the 99th than from the 50th to the 51s. In a true nor-
mal distribution, the distance from the 99th centile to the 100th (or,
similarly, from the 1st to the 0th) is infinite.
Consider two people who are at the 50th and 55th centiles in height.
Using the NLSY as our estimate of the national American distribution
of height, their actual height difference is only half an inch.''' Consider
another two people who are at the 94th and 99th centiles on height-
the identical gap in terms of centiles. Their height difference is 3.1
inches, six times the height difference of those at the 50th and 55th
centiles. The further out on the tail of the distribution you move, the
more misleading centiles become.
Standard scores reflect these real differences much more accurately
than do centiles. The people at the 50th and 55th centiles, only half an
inch apart in real height, have standard scores of 0 and .13. Compare
that difference of .13 standard deviation to the standard scores of those
at the 94th and 99th centiles: 1.55 and 2.33, respectively. In standard
scores, their difference-which
is .78 standard deviation-is
six times
as large, reflecting the six-fold difference in inches.
The same logic applies to intelligence test scores, and it explains why
they should be analyzed in terms of standard scores, not centiles. There
is a lot of difference between people at the 1st centile and the 5th, or
between those at the 95th and the 99rh, much more than those at the
48th and the 52d. If you doubt this, ask a university teacher to compare
the classroom performance of students with an SAT.Verba1 of 600 and
those with an SAT-Verbal of 800. Both are in the 99th centile of all 18-
year-olds-but
what a difference in verbal ability!''
CORRELATION AND REGRESSION
We now need to consider dealing with the relationships between two or
more distributions-which
is, after all, what scientists usually want to
do. How, for example, is the temperature of a gas related to its volume?
The answer is Boyle's Law, which you learned in high school science. In
social science, the relationships between variables are less clear cut and
harder to unearth. We may, for example, be interested in wealth as a vari-
able, but how shall wealth be measured? Yearly income? Yearly income
Standard Scores Versus Percentiles
- While percentiles are intuitive for the general public, they are mathematically misleading because they compress data at the tails of a distribution.
- In a normal distribution, the physical distance between centiles increases significantly as one moves away from the mean toward the extremes.
- Standard scores (z-scores) provide a more accurate representation of real-world differences, such as height or intelligence, than centiles do.
- The difference in ability between individuals at the 95th and 99th percentiles is vastly greater than the difference between those at the 48th and 52nd.
- Social science faces unique challenges in measurement and complexity compared to physical sciences, as human relationships are rarely reducible to simple variable pairs.
- Multiple relationships and complex variables are the rule in social science, making it harder to capture human affairs with the precision of laws like Boyle's Law.
In a true normal distribution, the distance from the 99th centile to the 100th (or, similarly, from the 1st to the 0th) is infinite.
5 58
Appendix 1
Appendix 1
559
Standard deviations cut off the same portions of the population for
any normal distribution
standard deviation continues to chop off proportionately the same size
chunks of the distribution in each case. And therein lies its value. The
standard deviation has the same meaning no matter whether the dis-
tribution is tall and skinny or short and wide.
Furthermore, there are some simple characteristics about these scores
that make them especially valuable. As you can see by looking at the
figures above, it makes intuitive sense to think of a 1 standard deviation
difference as "large," a 2 standard deviation difference as "very large,"
and a 3 standard deviation difference as "huge." This is an easy metric
to remember. Specifically, a person who is 1 standard deviation above
the mean in IQ is at the 84th percentile. Two standard deviations above
the mean puts him at the 98th percentile. Three standard deviations
above the mean puts him at the 99.9th percentile. A person who is 1
standard deviation below the mean is at the 16th percentile. Two stan-
dard deviations below the mean puts him at the 2d percentile. Three
standard deviations below the mean puts him at the O.lth percentile.
Why Not Just Use Percentiles to Begin With?
Why go to all the trouble of computing standard scores? Most people
understand percentiles already. Tell them that someone is at the 84th
percentile, and they know right away what you mean. Tell them that
he's at the 99th percentile, and they know what that means. Aren't we
just introducing an unnecessary complication by talking about "stan-
dard scores"?
Thinking in terms of percentiles is convenient and has its legitimate
uses. We often speak in terms of percentiles--or centiles-in
the text.
But they can also be highly misleading, because they are artificially com-
pressed at the tails of the distributions. It is a longer way from, say, the
98th centile to the 99th than from the 50th to the 51s. In a true nor-
mal distribution, the distance from the 99th centile to the 100th (or,
similarly, from the 1st to the 0th) is infinite.
Consider two people who are at the 50th and 55th centiles in height.
Using the NLSY as our estimate of the national American distribution
of height, their actual height difference is only half an inch.''' Consider
another two people who are at the 94th and 99th centiles on height-
the identical gap in terms of centiles. Their height difference is 3.1
inches, six times the height difference of those at the 50th and 55th
centiles. The further out on the tail of the distribution you move, the
more misleading centiles become.
Standard scores reflect these real differences much more accurately
than do centiles. The people at the 50th and 55th centiles, only half an
inch apart in real height, have standard scores of 0 and .13. Compare
that difference of .13 standard deviation to the standard scores of those
at the 94th and 99th centiles: 1.55 and 2.33, respectively. In standard
scores, their difference-which
is .78 standard deviation-is
six times
as large, reflecting the six-fold difference in inches.
The same logic applies to intelligence test scores, and it explains why
they should be analyzed in terms of standard scores, not centiles. There
is a lot of difference between people at the 1st centile and the 5th, or
between those at the 95th and the 99rh, much more than those at the
48th and the 52d. If you doubt this, ask a university teacher to compare
the classroom performance of students with an SAT.Verba1 of 600 and
those with an SAT-Verbal of 800. Both are in the 99th centile of all 18-
year-olds-but
what a difference in verbal ability!''
CORRELATION AND REGRESSION
We now need to consider dealing with the relationships between two or
more distributions-which
is, after all, what scientists usually want to
do. How, for example, is the temperature of a gas related to its volume?
The answer is Boyle's Law, which you learned in high school science. In
social science, the relationships between variables are less clear cut and
harder to unearth. We may, for example, be interested in wealth as a vari-
able, but how shall wealth be measured? Yearly income? Yearly income
560
Appendix I
averaged over a period of years?The value of one's savings or possessions?
And wealth, compared to many of the other things social science would
like to understand, is easy, reducible as it is to dollars and cents.
But beyond the problem of measurement, social science must cope
with sheer complexity. Our physical scientist colleagues may not agree,
but we believe it is harder to do science on human affairs than on inan-
imate objects-so
hard, in fact, that many people consider it impossi-
ble. We do not believe it is impossible, but it is rare that any human or
social relationship can be fully captured in terms of a single pair of vari-
ables, such as that between the temperature and volume of a gas. In so-
cial science, multiple relationships are the rule, not the exception.
For both of these reasons, the relations between social science vari-
ables are typically less than perfect. They are often weak and uncertain.
But they are nevertheless real, and, with the right methods, they can be
rigorously examined.
Correlation and regression, used so often in the text, are the primary
ways to quantify weak, uncertain relationships. For that reason, the ad-
vances in correlational and regression analysis since the late nineteenth
century have provided the impetus to social science. To understand
what this kind of analysis is, we need to introduce the idea of a scatter
diagram.
Scatter Diagrams
We left your male high school classmates lined up by height, with you
looking down from the rafters. Now imagine another row of cards, laid
out along the floor at a right angle to the ones for height. This set of
cards has weights in pounds on them. Start with 90 pounds for the class
shrimp, and in 10-pound increments, continue to add cards until you
reach 250 pounds to make room for the class giant. Now ask your class-
mates to find the point on the floor that corresponds to both their height
and weight (perhaps they'll insist on a grid of intersecting lines ex-
tending from the two rows of cards). When the traffic on the gym floor
ceases, you will see something like the figure below. This is a scatter di-
agram. Some sort of relationship between height and weight is imme-
diately obvious. The heaviest boys tend to be the tallest, the lightest
ones the shortest, and most of them are intermediate in both height and
weight. Equally obvious are the deviations from the trend that link
height and weight. The stocky boys appear as points above the mass,
Appendix J
561
A scatter diagram
Weight in pounds
100 -
.
.
8
0
1
~
,
~
,
~
,
~
1
1
,
~
,
~
1
~
1
60
62
64
66
68
70
72
74
76
78
80
Height in inches
the skinny ones as points below it. What we need now is some way to
quantify both the trend and the exceptions.
Correlations and regressions accomplish this in different ways. But be-
fore we go on to discuss these terms, be reassured that they are simple.
Look at the scatter diagram. You can see by the dots that as height in-
creases, so does weight, in an irregular way. Take a pencil (literally or
imaginarily) and draw a straight, sloping line through the dots in a way
that seems to you to best reflect this upward-sloping trend. Now con-
tinue to read, and see how well you have intuitively produced the result
of a correlation coefficient and a regression coefficient.
The Cowelation Coefficient
Modem statistics provides more than one method for measuring corre-
lation, but we confine ourselves to the one that is most important in
both use and generality: the Pearson product-moment correlation coef-
ficient (named after Karl Pearson, the English mathematician and bio-
metrician). To get at this coefficient, let us first replot the graph of the
class, replacing inches and pounds with standard scores. The variables
are now expressed in general terms. Remember: Any set of measure-
ments can be transformed similarly.
Quantifying Social Science Relationships
- Social science variables often exhibit weak and uncertain relationships that are nonetheless real and rigorously examinable.
- Correlation and regression analysis serve as the primary tools for quantifying these imperfect trends.
- A scatter diagram provides a visual representation of how two variables, such as height and weight, interact across a population.
- While general trends are often immediately obvious in a scatter plot, individual deviations like 'stocky' or 'skinny' profiles remain visible.
- The Pearson product-moment correlation coefficient is the standard mathematical method for measuring the strength of these relationships.
- Statistical formulas effectively find the 'best possible straight line' to represent the trend within a cloud of data points.
Take a pencil (literally or imaginarily) and draw a straight, sloping line through the dots in a way that seems to you to best reflect this upward-sloping trend.
560
Appendix I
averaged over a period of years?The value of one's savings or possessions?
And wealth, compared to many of the other things social science would
like to understand, is easy, reducible as it is to dollars and cents.
But beyond the problem of measurement, social science must cope
with sheer complexity. Our physical scientist colleagues may not agree,
but we believe it is harder to do science on human affairs than on inan-
imate objects-so
hard, in fact, that many people consider it impossi-
ble. We do not believe it is impossible, but it is rare that any human or
social relationship can be fully captured in terms of a single pair of vari-
ables, such as that between the temperature and volume of a gas. In so-
cial science, multiple relationships are the rule, not the exception.
For both of these reasons, the relations between social science vari-
ables are typically less than perfect. They are often weak and uncertain.
But they are nevertheless real, and, with the right methods, they can be
rigorously examined.
Correlation and regression, used so often in the text, are the primary
ways to quantify weak, uncertain relationships. For that reason, the ad-
vances in correlational and regression analysis since the late nineteenth
century have provided the impetus to social science. To understand
what this kind of analysis is, we need to introduce the idea of a scatter
diagram.
Scatter Diagrams
We left your male high school classmates lined up by height, with you
looking down from the rafters. Now imagine another row of cards, laid
out along the floor at a right angle to the ones for height. This set of
cards has weights in pounds on them. Start with 90 pounds for the class
shrimp, and in 10-pound increments, continue to add cards until you
reach 250 pounds to make room for the class giant. Now ask your class-
mates to find the point on the floor that corresponds to both their height
and weight (perhaps they'll insist on a grid of intersecting lines ex-
tending from the two rows of cards). When the traffic on the gym floor
ceases, you will see something like the figure below. This is a scatter di-
agram. Some sort of relationship between height and weight is imme-
diately obvious. The heaviest boys tend to be the tallest, the lightest
ones the shortest, and most of them are intermediate in both height and
weight. Equally obvious are the deviations from the trend that link
height and weight. The stocky boys appear as points above the mass,
Appendix J
561
A scatter diagram
Weight in pounds
100 -
.
.
8
0
1
~
,
~
,
~
,
~
1
1
,
~
,
~
1
~
1
60
62
64
66
68
70
72
74
76
78
80
Height in inches
the skinny ones as points below it. What we need now is some way to
quantify both the trend and the exceptions.
Correlations and regressions accomplish this in different ways. But be-
fore we go on to discuss these terms, be reassured that they are simple.
Look at the scatter diagram. You can see by the dots that as height in-
creases, so does weight, in an irregular way. Take a pencil (literally or
imaginarily) and draw a straight, sloping line through the dots in a way
that seems to you to best reflect this upward-sloping trend. Now con-
tinue to read, and see how well you have intuitively produced the result
of a correlation coefficient and a regression coefficient.
The Cowelation Coefficient
Modem statistics provides more than one method for measuring corre-
lation, but we confine ourselves to the one that is most important in
both use and generality: the Pearson product-moment correlation coef-
ficient (named after Karl Pearson, the English mathematician and bio-
metrician). To get at this coefficient, let us first replot the graph of the
class, replacing inches and pounds with standard scores. The variables
are now expressed in general terms. Remember: Any set of measure-
ments can be transformed similarly.
5 62
Appendix 1
Appendix 1
563
The next step on our way to the correlation coefficient is to apply a
formula (here dispensed with) that, in effect, finds the best possible
straight line passing through the cloud of points-the
mathematically
"best" version of the line you just drew by intuition.
What makes it the "best"? Any line is going to be "wrong" for most
of the points. For example, look at the weights of the boys who are 64
inches tall. Any sloping straight line is going to cross somewhere in the
middle of those weights and may not cross any of the dots exactly. For
boys 64 inches tall, you want the line to cross at the point where the to-
tal amount of the error is as small as possible. Taken over all the boys at
all the heights, you want a straight line that makes the sum of all the
errors for all the heights as small as possible. This "best fit" is shown in
the new version of the scatter diagram below, where both height and
weight are expressed in standard scores and the mathematical best-fit-
ting line has been superimposed.
The "best-fit" line for a scatter diagram
Weight, expressed in standard scores
4 -
.
I
3 -
. . .
.
2 -
. .
-2
.
.
-3
I
I '
I
I
I
I
-3
-2
- 1
0
1
2
3
Height, expressed in standard scores
This scatter diagram has (partly by serendipity) many lessons to teach
about how statistics relate to the real world. Here are a few of the main
ones:
1. Notice the many exceptions. There is a statistically substantial rela-
tionship between height and weight, but, visually, the exceptions
seem to dominate. So too with virtually all statistical relationships
in the social sciences, most of which are much weaker than this
one.
2. Linear relationships don't always seem to fit very well. The best-fit
line looks as if it is too shallow. Look at the tall boys, and see how
consistently it underpredicts how much they weigh. Given the in-
formation in the diagram, this might be an optical illusion-many
of the dots in the dense part of the range are on top of each other,
as it were, and thus it is impossible to grasp visually how the er-
rors are adding up-but
it could also be that the relationship be-
tween height and weight is not linear.
3. Small samples have individual anomalies. Before we jump to the con-
clusion that the straight line is not a good representation of the
relationship, remember that the sample consists of only 250 boys.
An anomaly of this particular small sample is that one of the boys
in the sample of 250 weighed 250 pounds. Eighteen-year-old
boys are very rarely that heavy, judging from the entire NLSY sam-
ple, fewer than one per 1,000. And yet one of those rarities hap-
pened to be picked up in a sample of 250. That's the way samples
work.
4. But small samples are also surprisingly accurate, despite their individ-
ual anomalies. The relationship between height and weight shown
by the sample of 250 18-year-old males is identical to the third
decimal place with the relationship among all 6,068 males in the
NLSY sample.14' This is closer than we have any right to expect,
but other random samples of only 250 generally produce correla-
tions that are within a few hundredths of the one produced by the
larger sample. (There are mathematics for figuring out what "gen-
erally" and "within a few hundredths" mean, but we needn't worry
about them here.)
Bearing these basics in mind, let us go back to the sloping line in the
figure above. Out of mathematical necessity, we know several things
about it. First, it must pass through the intersection of the zeros (which,
in standard scores, correspond to the averages) for both height and
weight. Second, the line would have had exactly the same slope had
height been the vertical axis and weight the horizontal one. Finally, and
most significant, the slope of the best-fitting line cannot be steeper than
1.0. The steepest possible best-fitting line, in other words, is one along
The Best-Fitting Line
- The 'best-fit' line is mathematically defined as the straight line that minimizes the total sum of errors across all data points in a scatter diagram.
- In social sciences, statistical relationships often appear dominated by exceptions, even when a substantial correlation exists.
- Visual interpretations of data can be misleading because overlapping data points in dense ranges may hide the true distribution of errors.
- Small samples frequently contain individual anomalies or outliers, yet they can remain surprisingly accurate in representing the broader population's correlation.
- A best-fitting line in standard scores must pass through the intersection of the averages and cannot possess a slope steeper than 1.0.
There is a statistically substantial relationship between height and weight, but, visually, the exceptions seem to dominate.
5 62
Appendix 1
Appendix 1
563
The next step on our way to the correlation coefficient is to apply a
formula (here dispensed with) that, in effect, finds the best possible
straight line passing through the cloud of points-the
mathematically
"best" version of the line you just drew by intuition.
What makes it the "best"? Any line is going to be "wrong" for most
of the points. For example, look at the weights of the boys who are 64
inches tall. Any sloping straight line is going to cross somewhere in the
middle of those weights and may not cross any of the dots exactly. For
boys 64 inches tall, you want the line to cross at the point where the to-
tal amount of the error is as small as possible. Taken over all the boys at
all the heights, you want a straight line that makes the sum of all the
errors for all the heights as small as possible. This "best fit" is shown in
the new version of the scatter diagram below, where both height and
weight are expressed in standard scores and the mathematical best-fit-
ting line has been superimposed.
The "best-fit" line for a scatter diagram
Weight, expressed in standard scores
4 -
.
I
3 -
. . .
.
2 -
. .
-2
.
.
-3
I
I '
I
I
I
I
-3
-2
- 1
0
1
2
3
Height, expressed in standard scores
This scatter diagram has (partly by serendipity) many lessons to teach
about how statistics relate to the real world. Here are a few of the main
ones:
1. Notice the many exceptions. There is a statistically substantial rela-
tionship between height and weight, but, visually, the exceptions
seem to dominate. So too with virtually all statistical relationships
in the social sciences, most of which are much weaker than this
one.
2. Linear relationships don't always seem to fit very well. The best-fit
line looks as if it is too shallow. Look at the tall boys, and see how
consistently it underpredicts how much they weigh. Given the in-
formation in the diagram, this might be an optical illusion-many
of the dots in the dense part of the range are on top of each other,
as it were, and thus it is impossible to grasp visually how the er-
rors are adding up-but
it could also be that the relationship be-
tween height and weight is not linear.
3. Small samples have individual anomalies. Before we jump to the con-
clusion that the straight line is not a good representation of the
relationship, remember that the sample consists of only 250 boys.
An anomaly of this particular small sample is that one of the boys
in the sample of 250 weighed 250 pounds. Eighteen-year-old
boys are very rarely that heavy, judging from the entire NLSY sam-
ple, fewer than one per 1,000. And yet one of those rarities hap-
pened to be picked up in a sample of 250. That's the way samples
work.
4. But small samples are also surprisingly accurate, despite their individ-
ual anomalies. The relationship between height and weight shown
by the sample of 250 18-year-old males is identical to the third
decimal place with the relationship among all 6,068 males in the
NLSY sample.14' This is closer than we have any right to expect,
but other random samples of only 250 generally produce correla-
tions that are within a few hundredths of the one produced by the
larger sample. (There are mathematics for figuring out what "gen-
erally" and "within a few hundredths" mean, but we needn't worry
about them here.)
Bearing these basics in mind, let us go back to the sloping line in the
figure above. Out of mathematical necessity, we know several things
about it. First, it must pass through the intersection of the zeros (which,
in standard scores, correspond to the averages) for both height and
weight. Second, the line would have had exactly the same slope had
height been the vertical axis and weight the horizontal one. Finally, and
most significant, the slope of the best-fitting line cannot be steeper than
1.0. The steepest possible best-fitting line, in other words, is one along
564
Appendix 1
Appendix 1
565
which one unit of change in height is exactly matched by one unit of
Regression Coefficients
change in weight, clearly not the case in these data. Real data in the so-
cial sciences never yield a slope that steep.
In the picture, the line goes uphill to the right, but for other pairs of
variables, it could go downhill. Consider a scatter diagram for, say,
educational level and fertility by the age of 30. Women with more
education tend to have fewer babies when they are young, compared to
women with less education, as we discuss in Chapters 8 and 15. The
cloud of points would decline from left to right, just the reverse of the
cloud in the picture above. The downhill slope of the best-fittinL 1' ~ n e
would be expressed as a negative number, but, again, it could be no
steeper than -1 .O.
We focus on the slope of the best-fitting line because it is the corre-
lation coefficient-in
this case, equal to S O , which is quite large by the
standards of variables used by social scientists. The closer it gets to + 1 .O,
the stronger is the linear relationship between the standardized vari-
ables (the variables expressed as standard scores). When the two vari-
ables are mutually independent, the best-fitting line is horizontal; hence
its slope is 0. Anything other than 0 signifies a relationship, albeit pos-
sibly a very weak one.
Whatever the correlation coefficient of a pair of variables is, squar-
ing it yields another notable number. Squaring .50, for example, gives
.25. The significance of the squared correlation is that it tells how much
the variation in weight would decrease if we could make everyone the
same height, or vice versa. If all the boys in the class were the same
height, the variation in their weights would decline by 25 percent. Per-
haps, if you have been compelled to be around social scientists, you have
heard the phrase "explains the variance," as in, for example, "Education
explains 20 percent of the variance in income." That figure comes from
the squared correlation.
In general, the squared correlation is a measure of the mutual redun-
dancy in a pair of variables. If they are highly correlated, they are highly
redundant in the sense that knowing the value of one of them places a
narrow range of possibilities for the value of the other. If they are un-
correlated or only slightly correlated, knowing the value of one tells us
nothing or little about the value of the other.15'
Correlation assesses the strength of a relationship between variables.
But we may want to know more about a relationship than merely its
strength. We may want to know what it is. We may want to know how
much of an increase in weight, for example, we should anticipate if we
compare 66-inch boys with 73-inch boys. Such questions arise naturally
if we are trying to explain a particular variable (e.g., annual income) in
terms of the effects of another variable (e.g., educational level). How
much income is another year of schooling worth? is just the sort of ques-
tion that social scientists are always trying to answer.
The standard method for answering it is regression analysis, which
has an intimate mathematical association with correlational analysis. If
we had left the scatter diagram with its original axes-inches
and
pounds-instead
of standardizing them, the slope of the best-fitting line
would have been a regression coefficient, rather than a correlation co-
efficient. The figure below shows the scatter diagram with nonstan-
dardized axes.
What a regression coefficient is telling you
Weight in pounds
260 -
How much does height
:F
with weight?
. .
.
.
How much does
weight increase
with height?
8
0
1
~
l
~
,
~
l
l
,
~
l
~
l
~
1
1
1
1
1
~
I
60 62 64 66 68 70 72 74 76 78 80
Height in inches
Correlation and Regression Analysis
- The slope of the best-fitting line for standardized variables represents the correlation coefficient, ranging from -1.0 to +1.0.
- Squaring the correlation coefficient reveals the 'explained variance,' indicating how much variation in one variable is reduced by knowing the other.
- High correlation implies mutual redundancy, where knowing one value significantly narrows the possible range of the other.
- While correlation measures the strength of a relationship, regression analysis is used to determine the specific nature and magnitude of that relationship.
- Regression coefficients differ from correlation coefficients by using original units of measurement, such as inches or pounds, rather than standardized scores.
Perhaps, if you have been compelled to be around social scientists, you have heard the phrase 'explains the variance,' as in, for example, 'Education explains 20 percent of the variance in income.'
564
Appendix 1
Appendix 1
565
which one unit of change in height is exactly matched by one unit of
Regression Coefficients
change in weight, clearly not the case in these data. Real data in the so-
cial sciences never yield a slope that steep.
In the picture, the line goes uphill to the right, but for other pairs of
variables, it could go downhill. Consider a scatter diagram for, say,
educational level and fertility by the age of 30. Women with more
education tend to have fewer babies when they are young, compared to
women with less education, as we discuss in Chapters 8 and 15. The
cloud of points would decline from left to right, just the reverse of the
cloud in the picture above. The downhill slope of the best-fittinL 1' ~ n e
would be expressed as a negative number, but, again, it could be no
steeper than -1 .O.
We focus on the slope of the best-fitting line because it is the corre-
lation coefficient-in
this case, equal to S O , which is quite large by the
standards of variables used by social scientists. The closer it gets to + 1 .O,
the stronger is the linear relationship between the standardized vari-
ables (the variables expressed as standard scores). When the two vari-
ables are mutually independent, the best-fitting line is horizontal; hence
its slope is 0. Anything other than 0 signifies a relationship, albeit pos-
sibly a very weak one.
Whatever the correlation coefficient of a pair of variables is, squar-
ing it yields another notable number. Squaring .50, for example, gives
.25. The significance of the squared correlation is that it tells how much
the variation in weight would decrease if we could make everyone the
same height, or vice versa. If all the boys in the class were the same
height, the variation in their weights would decline by 25 percent. Per-
haps, if you have been compelled to be around social scientists, you have
heard the phrase "explains the variance," as in, for example, "Education
explains 20 percent of the variance in income." That figure comes from
the squared correlation.
In general, the squared correlation is a measure of the mutual redun-
dancy in a pair of variables. If they are highly correlated, they are highly
redundant in the sense that knowing the value of one of them places a
narrow range of possibilities for the value of the other. If they are un-
correlated or only slightly correlated, knowing the value of one tells us
nothing or little about the value of the other.15'
Correlation assesses the strength of a relationship between variables.
But we may want to know more about a relationship than merely its
strength. We may want to know what it is. We may want to know how
much of an increase in weight, for example, we should anticipate if we
compare 66-inch boys with 73-inch boys. Such questions arise naturally
if we are trying to explain a particular variable (e.g., annual income) in
terms of the effects of another variable (e.g., educational level). How
much income is another year of schooling worth? is just the sort of ques-
tion that social scientists are always trying to answer.
The standard method for answering it is regression analysis, which
has an intimate mathematical association with correlational analysis. If
we had left the scatter diagram with its original axes-inches
and
pounds-instead
of standardizing them, the slope of the best-fitting line
would have been a regression coefficient, rather than a correlation co-
efficient. The figure below shows the scatter diagram with nonstan-
dardized axes.
What a regression coefficient is telling you
Weight in pounds
260 -
How much does height
:F
with weight?
. .
.
.
How much does
weight increase
with height?
8
0
1
~
l
~
,
~
l
l
,
~
l
~
l
~
1
1
1
1
1
~
I
60 62 64 66 68 70 72 74 76 78 80
Height in inches
566
Appendix 1
Appendix I
567
Why are there two lines? Recall that the best-fitting line is the one
that minimizes the aggregated distances between the data points and
the line. For standardized measurements, it makes no difference whether
the distances are measured along the pounds axis or the inches axis; for
unstandardized measurements, it may make a difference. Hence we may
get two lines, depending on which axis was used to fit the line. The two
lines, which always intersect at the average values for the two variables,
answer different questions. One answers the question we first posed:
How much of a difference in pounds is associated with a given differ-
ence in inches (i.e., the regression of weight on height). The other one
tells us how much of a difference in inches is associated with a given dif-
ference in pounds (i.e., the regression of height on weight).
Multipk Regression
Multiple regression analysis is the main way that social science deals
with the multiple relationships that are the rule in social science. To get
a fix on multiple regression, let us return to the high school gym for the
last time. Your classmates are still scattered ahout the floor. Now imag-
ine a pole, erected at the intersection of 60 inches and 90 pounds,
marked in inches from 18 inches to 50 inches. For some inscrutable rea-
son, you would like to know the impact of both height and weight on a
boy's waist size. Since imagination can defy gravity, you ask each boy to
levitate until the soles of his shoes are at the elevation that reads on the
pole at the waist size of his trousers. In general, the taller and heavier
boys must rise the most, the shorter and slighter ones the least, and most
boys, middling in height and weight, will have middling waist sites as
well. Multiple regression is a mathematical procedure for finding that
plane, slicing through the space in the gym, that minimizes the aggre-
gated distances (in this instance, along the waist size axis) between the
bottoms of the boys' shoes and the plane.
The best-fitting plane will tilt upward toward heavy weights and tall
heights. But it may tilt more along the pounds axis than along the inches
axis, or vice versa. It may tilt equally for each. The slope of the tilt along
each of these axes is again a regression coefficient. With two variables
predicting a third, as in this example, there are two coefficients. One of
them tells us how much of an increase in trouser waist size is associated
with a given increase in weight, holding height constant; the other, how
of an increase in trouser waist size is associated with a given in-
crease in height, holding weight constant.
With two variables predicting a third, we reach the limit of visual
imagination. But the principle of multiple regression can be extended
to any number of variables. Income, for example, may be related not just
to education but also to age, family background, IQ, personality, busi-
ness conditions, region of the country, and so on. The mathematical
procedures will yield coefficients for each of them, indicating again how
much of a change in income can be anticipated for a given change in
any particular variable, with all the others held constant.
Logistic Regression
The text frequently resorts to a method of analysis called logistic repes-
sion. Here, we need only say what the method is for rather than what it
is. Many of the variables we discuss are such things as heing unemployed
or not, being married or not, being a parent or not, and so on. Because
they are measured in two values<orresponding
to yes and no-they
are called binary variables. Logistic regression is an adaptation of ordi-
nary regression analysis tailored to the case of binary variables. (It can
also be used for variables with larger numbers of discrete values.) It tells
us how much change there is in the probability of heing unemployed,
married, and so forth, given a unit change in any given variable, hold-
ing all other variables in the analysis constant.
Principles of Regression Analysis
- Simple regression can yield two different lines depending on which variable is treated as the predictor and which as the outcome.
- Multiple regression allows researchers to analyze the impact of several independent variables on a single dependent variable simultaneously.
- The mathematical procedure for multiple regression involves finding a 'best-fitting plane' that minimizes the distance between data points and the model.
- Regression coefficients in a multiple variable model reveal the impact of one factor while 'holding constant' all other variables in the analysis.
- Logistic regression is a specialized adaptation used for binary variables, such as determining the probability of being employed or married.
Since imagination can defy gravity, you ask each boy to levitate until the soles of his shoes are at the elevation that reads on the pole at the waist size of his trousers.
566
Appendix 1
Appendix I
567
Why are there two lines? Recall that the best-fitting line is the one
that minimizes the aggregated distances between the data points and
the line. For standardized measurements, it makes no difference whether
the distances are measured along the pounds axis or the inches axis; for
unstandardized measurements, it may make a difference. Hence we may
get two lines, depending on which axis was used to fit the line. The two
lines, which always intersect at the average values for the two variables,
answer different questions. One answers the question we first posed:
How much of a difference in pounds is associated with a given differ-
ence in inches (i.e., the regression of weight on height). The other one
tells us how much of a difference in inches is associated with a given dif-
ference in pounds (i.e., the regression of height on weight).
Multipk Regression
Multiple regression analysis is the main way that social science deals
with the multiple relationships that are the rule in social science. To get
a fix on multiple regression, let us return to the high school gym for the
last time. Your classmates are still scattered ahout the floor. Now imag-
ine a pole, erected at the intersection of 60 inches and 90 pounds,
marked in inches from 18 inches to 50 inches. For some inscrutable rea-
son, you would like to know the impact of both height and weight on a
boy's waist size. Since imagination can defy gravity, you ask each boy to
levitate until the soles of his shoes are at the elevation that reads on the
pole at the waist size of his trousers. In general, the taller and heavier
boys must rise the most, the shorter and slighter ones the least, and most
boys, middling in height and weight, will have middling waist sites as
well. Multiple regression is a mathematical procedure for finding that
plane, slicing through the space in the gym, that minimizes the aggre-
gated distances (in this instance, along the waist size axis) between the
bottoms of the boys' shoes and the plane.
The best-fitting plane will tilt upward toward heavy weights and tall
heights. But it may tilt more along the pounds axis than along the inches
axis, or vice versa. It may tilt equally for each. The slope of the tilt along
each of these axes is again a regression coefficient. With two variables
predicting a third, as in this example, there are two coefficients. One of
them tells us how much of an increase in trouser waist size is associated
with a given increase in weight, holding height constant; the other, how
of an increase in trouser waist size is associated with a given in-
crease in height, holding weight constant.
With two variables predicting a third, we reach the limit of visual
imagination. But the principle of multiple regression can be extended
to any number of variables. Income, for example, may be related not just
to education but also to age, family background, IQ, personality, busi-
ness conditions, region of the country, and so on. The mathematical
procedures will yield coefficients for each of them, indicating again how
much of a change in income can be anticipated for a given change in
any particular variable, with all the others held constant.
Logistic Regression
The text frequently resorts to a method of analysis called logistic repes-
sion. Here, we need only say what the method is for rather than what it
is. Many of the variables we discuss are such things as heing unemployed
or not, being married or not, being a parent or not, and so on. Because
they are measured in two values<orresponding
to yes and no-they
are called binary variables. Logistic regression is an adaptation of ordi-
nary regression analysis tailored to the case of binary variables. (It can
also be used for variables with larger numbers of discrete values.) It tells
us how much change there is in the probability of heing unemployed,
married, and so forth, given a unit change in any given variable, hold-
ing all other variables in the analysis constant.
Appendix 2
Technical Issues Regarding the
National Longitudinal Survey of
Youth
This appendix provides details about the variables used in the text and
about other technical issues associated with the NLSY.' Colleagues who
wish to recreate analyses will need additional information, which may
be obtained from the authors.'
SURVEY YEAR, CONSTANT DOLLARS, AND SAMPLE WEIGHTS
Our use of the NLSY extends through the 1990 survey year.'31
All dollar figures are expressed in 1990 dollars, using the consumer
price index inflators as reported in the 1992 edition of Statistical Abstract
of the United States, Table 737.
Sample weights were employed in all analyses in the main text. We
do not so note in each instance, to simplify the description. In com-
puting scores that were based on the 11,878 subjects who had valid
scores on the Armed Forces Qualification Test (AFQT), we used the
sampling weights specifically assigned for the AFQT population. For
analyses based on the NLSY subjects' status as of a given year (usually
1990), we used the sampling weights for that survey year. For analyses
in which the children of NLSY women were the unit of analysis, the
child's sampling weights were used rather than the mother's.
To make interpretation of the statistical significance easier, we repli-
cated all the analyses in Part I1 using just the unweighted cross-sectional
sample of whites, as reported in Appendix 4.
Methodology and AFQT Scoring
- The study utilizes National Longitudinal Survey of Youth (NLSY) data through 1990, adjusting all financial figures to 1990 constant dollars.
- Complex sampling weights were applied to different units of analysis, including specific weights for the AFQT population and the children of NLSY women.
- The authors transitioned from the 1980 AFQT scoring method to the 1989 version because the latter was deemed psychometrically superior and more 'g-loaded'.
- The revised AFQT scoring removed the speeded 'numerical operations' subtest to avoid errors caused by minor timing discrepancies during administration.
- The researchers recomputed AFQT scores from raw data rather than using the NLSY's rounded centile variables to ensure a more precise across-ages measure.
- Data analysis revealed that AFQT scores in the sample rose by .07 standard deviations per year of age, reflecting the test's design for late-teen recruits.
The reason for the change was to avoid the numerical operations subtest, which was both less highly g-loaded than the mathematics knowledge subtest and sensitive to small discrepancies in the time given to subjects.
Appendix 2
Technical Issues Regarding the
National Longitudinal Survey of
Youth
This appendix provides details about the variables used in the text and
about other technical issues associated with the NLSY.' Colleagues who
wish to recreate analyses will need additional information, which may
be obtained from the authors.'
SURVEY YEAR, CONSTANT DOLLARS, AND SAMPLE WEIGHTS
Our use of the NLSY extends through the 1990 survey year.'31
All dollar figures are expressed in 1990 dollars, using the consumer
price index inflators as reported in the 1992 edition of Statistical Abstract
of the United States, Table 737.
Sample weights were employed in all analyses in the main text. We
do not so note in each instance, to simplify the description. In com-
puting scores that were based on the 11,878 subjects who had valid
scores on the Armed Forces Qualification Test (AFQT), we used the
sampling weights specifically assigned for the AFQT population. For
analyses based on the NLSY subjects' status as of a given year (usually
1990), we used the sampling weights for that survey year. For analyses
in which the children of NLSY women were the unit of analysis, the
child's sampling weights were used rather than the mother's.
To make interpretation of the statistical significance easier, we repli-
cated all the analyses in Part I1 using just the unweighted cross-sectional
sample of whites, as reported in Appendix 4.
570
Appendix 2
Appendix 2
5 7 1
SCORING OF THE ARMED FORCES QUALIFICATION TEST
( AFQT)
The AFQT is a combination of highlyg-loaded subtests from the Armed
Services Vocational Aptitude Battery (ASVAB) that serves as the
armed services' measure of cognitive ability, described in detail in Ap-
pendix 3. Until 1989, the AFQT consisted the summed raw scores of
the ASVAR's arithmetic reasoning, word knowledge, and paragraph
comprehension subtests, plus half of the score on numerical operations
subtest. In 1989, the armed forces decided to rescore the AFQT so that
it consisted of the word knowledge, paragraph comprehension, arith-
metic reasoning, and mathematics knowledge subtests. The reason for
the change was to avoid the numerical operations subtest, which was
both less highly g-loaded than the mathematics knowledge subtest and
sensitive to small discrepancies in the time given to subjects when ad-
ministering the test (numerical operations is a speeded test in which the
subject completes as many arithmetic problems as possible within a time
limit).
A draft of The Bell Curve was well underway when we became aware
of the 1989 scoring scheme. We completed a full draft using the 1980
scoring system but decided that the revised scoring system was psycho-
metrically superior to the old one and therefore replicated a11 of the
analyses using the 1989 version.
Scholars who wish to replicate our analyses should note that the 1989
AFQT score as reported in the NLSY database is not the one used in the
text. The NLSY's variable is rounded to the nearest whole centile ;~nci
based on the 18- to 23-year-old subset of the NLSY sample. We recom-
puted the AFQT from scratch using the raw subtest scores, and the pop-
- .
ulation mean and standard deviation used in producing the across-ages
AFQT score was based on all 11,878 subjects, not just those ages 18 to
23.'" This measure is useful for multivariate analyses in which age is also
entered as an independent variable but should not be used (and is never
used in the text) as a representation of an individual subject's cognitive
ability because of age-related differences in test scores (see discussion
below).
AFQT scores in the NLSY sample rose by an average of .07 standard de-
viations per year. The simplest explanation for this is that the AFQT
was designed by the military for a population of recruits who would be
taking the test in their late teens, and younger subjects in the NLSY
. ,
sample got lower scores for the same reason that high school freshmen
get lower SAT scores than high school seniors. However, a cohort ef-
fect could also be at work, whereby (because of educational or broad en-
vironmental reasons) youths born in the first half of the 1960s had lower
realized cognitive ability than youths born in the last half of the 1950s.
There is no empirical way of telling which reason really explains the
age-related differences in the AFQT or what the mix of reasons might
be. The age-related increase is not perfectly linear (it levels off in the
top two years) but close enough that the age problem is best handled in
the multivariate analyses by entering the subject's birthdate as an inde-
pendent variable (all the NLSY sample took the AFQT within a few
months of each other in late 1980).
For all analyses except the multivariate regression analyses, we use
age-equated scores. These were produced by using the sample weight as
a frequency, then preparing separate distributions by birth year, ex-
pressed in centiles.15' Each subject's rank in that population (mathe-
matically, the "population" is the sum of the sample weights for that
birth year) was divided by the population to obtain the centile where
that subject fell within his birth year cohort.'''
That AFQT scores vary according to education raises an additional
issue: To what extent is the AFQT a measure of cognitive ability, and
not just length and quality of education? We explore this issue at length
in Appendix 3.
Skew
The distribution of the AFQT in either of its versions is skewed so that
the high scores tend to be more closely bunched than the low scores.
To put it roughly, the most intelligent people who take the test have less
of an opportunity to get a high score than the least intelligent people
have to get a low score. One effect is to limit artificially the maximum
size of a standardized score. It is artificial because the AFQT does in fact
discriminate reasonably well at the high end of the scale. For example,
only 22 youths out of 11,878 in the NLSY with valid AFQT scores
earned perfect scores on the subtests, representing 0.253 percent of the
national population of their age (using sampling weights). In a test with
a normal distribution, those youths would have had a standardized score
Adjusting AFQT Scoring Methodologies
- The authors address age-related differences in AFQT scores by using age-equated centiles to account for potential environmental or educational cohorts.
- A significant concern is raised regarding whether the AFQT measures innate cognitive ability or simply the length and quality of a subject's education.
- The raw AFQT distribution is skewed, causing high scores to be bunched together and artificially limiting the maximum possible standardized score.
- To ensure accurate comparisons in 'The Bell Curve,' the researchers corrected for this skew by mapping centile scores to a normal distribution.
- Correcting for skew notably impacts the measurement of gaps between ethnic groups, generally reducing the calculated standard deviation differences.
- The methodology involves setting all extreme outliers beyond three standard deviations to a fixed cap to maintain statistical consistency.
The most intelligent people who take the test have less of an opportunity to get a high score than the least intelligent people have to get a low score.
570
Appendix 2
Appendix 2
5 7 1
SCORING OF THE ARMED FORCES QUALIFICATION TEST
( AFQT)
The AFQT is a combination of highlyg-loaded subtests from the Armed
Services Vocational Aptitude Battery (ASVAB) that serves as the
armed services' measure of cognitive ability, described in detail in Ap-
pendix 3. Until 1989, the AFQT consisted the summed raw scores of
the ASVAR's arithmetic reasoning, word knowledge, and paragraph
comprehension subtests, plus half of the score on numerical operations
subtest. In 1989, the armed forces decided to rescore the AFQT so that
it consisted of the word knowledge, paragraph comprehension, arith-
metic reasoning, and mathematics knowledge subtests. The reason for
the change was to avoid the numerical operations subtest, which was
both less highly g-loaded than the mathematics knowledge subtest and
sensitive to small discrepancies in the time given to subjects when ad-
ministering the test (numerical operations is a speeded test in which the
subject completes as many arithmetic problems as possible within a time
limit).
A draft of The Bell Curve was well underway when we became aware
of the 1989 scoring scheme. We completed a full draft using the 1980
scoring system but decided that the revised scoring system was psycho-
metrically superior to the old one and therefore replicated a11 of the
analyses using the 1989 version.
Scholars who wish to replicate our analyses should note that the 1989
AFQT score as reported in the NLSY database is not the one used in the
text. The NLSY's variable is rounded to the nearest whole centile ;~nci
based on the 18- to 23-year-old subset of the NLSY sample. We recom-
puted the AFQT from scratch using the raw subtest scores, and the pop-
- .
ulation mean and standard deviation used in producing the across-ages
AFQT score was based on all 11,878 subjects, not just those ages 18 to
23.'" This measure is useful for multivariate analyses in which age is also
entered as an independent variable but should not be used (and is never
used in the text) as a representation of an individual subject's cognitive
ability because of age-related differences in test scores (see discussion
below).
AFQT scores in the NLSY sample rose by an average of .07 standard de-
viations per year. The simplest explanation for this is that the AFQT
was designed by the military for a population of recruits who would be
taking the test in their late teens, and younger subjects in the NLSY
. ,
sample got lower scores for the same reason that high school freshmen
get lower SAT scores than high school seniors. However, a cohort ef-
fect could also be at work, whereby (because of educational or broad en-
vironmental reasons) youths born in the first half of the 1960s had lower
realized cognitive ability than youths born in the last half of the 1950s.
There is no empirical way of telling which reason really explains the
age-related differences in the AFQT or what the mix of reasons might
be. The age-related increase is not perfectly linear (it levels off in the
top two years) but close enough that the age problem is best handled in
the multivariate analyses by entering the subject's birthdate as an inde-
pendent variable (all the NLSY sample took the AFQT within a few
months of each other in late 1980).
For all analyses except the multivariate regression analyses, we use
age-equated scores. These were produced by using the sample weight as
a frequency, then preparing separate distributions by birth year, ex-
pressed in centiles.15' Each subject's rank in that population (mathe-
matically, the "population" is the sum of the sample weights for that
birth year) was divided by the population to obtain the centile where
that subject fell within his birth year cohort.'''
That AFQT scores vary according to education raises an additional
issue: To what extent is the AFQT a measure of cognitive ability, and
not just length and quality of education? We explore this issue at length
in Appendix 3.
Skew
The distribution of the AFQT in either of its versions is skewed so that
the high scores tend to be more closely bunched than the low scores.
To put it roughly, the most intelligent people who take the test have less
of an opportunity to get a high score than the least intelligent people
have to get a low score. One effect is to limit artificially the maximum
size of a standardized score. It is artificial because the AFQT does in fact
discriminate reasonably well at the high end of the scale. For example,
only 22 youths out of 11,878 in the NLSY with valid AFQT scores
earned perfect scores on the subtests, representing 0.253 percent of the
national population of their age (using sampling weights). In a test with
a normal distribution, those youths would have had a standardized score
572
Appendix 2
of 2.80. Rut given the skew in the NLSY, it is impossible for anyone to
have ;I standardized score higher than 1.66. The standard devi;~tion for
a high-scoring group is similarly squeezed.
A certain amount of skew is not a concern for milny kinds of analy-
sis. For the analyses in The Bell Curve, however, the difference between
two groups is often expressed in terms of standard deviations, :tnd the
size of that difference was likely to he affected by skew.
We therefore computed standardized scores corrected for skcw, tirst
by corilputing the centile scores for the NLSY population, usi~lg surnplc
weights as alw;~ys, then assigning to each subject the st;~ndardizej score
corresponding to that centile in n norm;tl distribution. Wc did this t;)r
both the old and new versions of the AFQT. Following ;~r~nc.d
forccs'
convention, a11 scores greater or srnaller than 3 standard deviations trom
the meitn were sct at 3 standarc] deviations (this affectccl only it srt~;tll
number of scores at the low end of the distribution).
The effects of correcting for skcw were noticeable whcn expressing
differences hetween groups. For example, for the most scnsitivc group
comparison, hrtween ethnic groups, the results ;ire shown in the h)l-
lowing rahlc. As always when fir11 i~>formation
about means, ~t;lrlci:ir~1
Comparison of Two Versions of The AFQT,
Uncorrected and Corrected for Skew
Black/
Latino/
Version of Corrected
White Ilif- White Dif-
the AFQT for Skew!
Black
Latino
White
ference
ferenreb
Mean SD Mean S1l Mean SD
I'rtt- I989
No
-.97
.91
-.h7 1.01
.24
.HS
I
1.d;
Ye5
-.90
1
-64
.93
. ! 3
.VL
1.25
IOS9 ~ , c v i a i ~ ) ~ l
No
-..91
.H7
-.67
.9H
.2 3
.YO
I . 30
,90
Ycs
-88
.H3
-.64
.Y4
.22
.92
1.21
.93
dcvi;~tions, and sample sizes is available, the group dit7ererrnces arc ccrnl-
~ I . E ~ C C ~
11si11:: the weighted average of the groups' standard Llevii~tions.
The ecluation is given in nl)te 25 for Chapter 13.The prirnary e f k c ~ of
the skew was to squeeze the standard deviation of the highcr-scoring
group (whites) anrl, in compi~rison, elungi~te the standard ~levii~tion
of
the lower scoring groups. Chrrecting fur skew thus shrank both the
black-white ;~nd Latino-white difterenccs. The same phenomenorl af-
fected all comparisons invi)lving subgroups with markedly different
AFQT me:lns. All standardized AFQT scores, for both the regression
:lllalyses and the age-equated scores, are therefore corrected for skew. In
other words, each represents the standardized score in a normal distri-
bution that corresponds to the (unrounded) centile score of the subject
in the observed distribution.
The effects of the different scoring methods on ethnic differences
raise a larger question that we should answer directly: How would the
results presented in this book be different if we had used the 1980 ver-
sion of the AFQT instead o f the 1989 version? If wc had not corrected
for skew instead of correcting for skew? For most analyses, the answer is
that the results are unaffected. But it may also be said that whenever
Why Not Just Use Centiles?
One way of avoiding the skew problem is tc) leave the AFQT scorcs in ccn-
cilcs. This was unsatisfactory, however, for we knew from collareral data
that much of the important role of LQ occurs at thc tails of the distl-ibu-
tion. Using centiles throws away information ;~bc)ut the pails. (See Ap-
pendix 1 on the norrnal distribution.)
differences were found, the scoring
we used tended to pro-
duce smaller relationships between IQ and the indicators, and smaller
ethnic differences, than the alternatives. W e did not cornpuce every
analysis by each of the four scoring permut.ations, but we did replicate
all of the analyses using the two extremes ( 1980 version uncorrected tor
skew and the 1989 version corrected for skew). In no instance did the
1989 version corrected for skew-the
version reported in the text-
yield significant findings that were not also found when using the 1980
uncorrected version. In terms of the relati.onships explored in this hook,
the 1989 version corrected for skew is the most conserv:itive of the al-
ternatives.
THE SOCIOECONOMIC STATUS INDEX
The SES index was created with the variables that are commonly used
in developing measures of socioeconomic status: educat~on, income,
Statistical Adjustments and SES Indexing
- The authors corrected for skew in AFQT scores to normalize distributions, which primarily resulted in shrinking the measured differences between ethnic groups.
- Standardizing scores into a normal distribution was preferred over using raw centiles because centiles discard critical data regarding the tails of the distribution.
- The 1989 version of the AFQT, corrected for skew, was selected as the most conservative scoring method, producing smaller relationships between IQ and social indicators than alternatives.
- A Socioeconomic Status (SES) index was constructed using parental education, family income, and occupational status to measure the environment in which subjects were raised.
- Family income data was converted to logarithms before standardization to discount extreme high values and allow for better discrimination among lower income levels.
In no instance did the 1989 version corrected for skew—the version reported in the text—yield significant findings that were not also found when using the 1980 uncorrected version.
572
Appendix 2
of 2.80. Rut given the skew in the NLSY, it is impossible for anyone to
have ;I standardized score higher than 1.66. The standard devi;~tion for
a high-scoring group is similarly squeezed.
A certain amount of skew is not a concern for milny kinds of analy-
sis. For the analyses in The Bell Curve, however, the difference between
two groups is often expressed in terms of standard deviations, :tnd the
size of that difference was likely to he affected by skew.
We therefore computed standardized scores corrected for skcw, tirst
by corilputing the centile scores for the NLSY population, usi~lg surnplc
weights as alw;~ys, then assigning to each subject the st;~ndardizej score
corresponding to that centile in n norm;tl distribution. Wc did this t;)r
both the old and new versions of the AFQT. Following ;~r~nc.d
forccs'
convention, a11 scores greater or srnaller than 3 standard deviations trom
the meitn were sct at 3 standarc] deviations (this affectccl only it srt~;tll
number of scores at the low end of the distribution).
The effects of correcting for skcw were noticeable whcn expressing
differences hetween groups. For example, for the most scnsitivc group
comparison, hrtween ethnic groups, the results ;ire shown in the h)l-
lowing rahlc. As always when fir11 i~>formation
about means, ~t;lrlci:ir~1
Comparison of Two Versions of The AFQT,
Uncorrected and Corrected for Skew
Black/
Latino/
Version of Corrected
White Ilif- White Dif-
the AFQT for Skew!
Black
Latino
White
ference
ferenreb
Mean SD Mean S1l Mean SD
I'rtt- I989
No
-.97
.91
-.h7 1.01
.24
.HS
I
1.d;
Ye5
-.90
1
-64
.93
. ! 3
.VL
1.25
IOS9 ~ , c v i a i ~ ) ~ l
No
-..91
.H7
-.67
.9H
.2 3
.YO
I . 30
,90
Ycs
-88
.H3
-.64
.Y4
.22
.92
1.21
.93
dcvi;~tions, and sample sizes is available, the group dit7ererrnces arc ccrnl-
~ I . E ~ C C ~
11si11:: the weighted average of the groups' standard Llevii~tions.
The ecluation is given in nl)te 25 for Chapter 13.The prirnary e f k c ~ of
the skew was to squeeze the standard deviation of the highcr-scoring
group (whites) anrl, in compi~rison, elungi~te the standard ~levii~tion
of
the lower scoring groups. Chrrecting fur skew thus shrank both the
black-white ;~nd Latino-white difterenccs. The same phenomenorl af-
fected all comparisons invi)lving subgroups with markedly different
AFQT me:lns. All standardized AFQT scores, for both the regression
:lllalyses and the age-equated scores, are therefore corrected for skew. In
other words, each represents the standardized score in a normal distri-
bution that corresponds to the (unrounded) centile score of the subject
in the observed distribution.
The effects of the different scoring methods on ethnic differences
raise a larger question that we should answer directly: How would the
results presented in this book be different if we had used the 1980 ver-
sion of the AFQT instead o f the 1989 version? If wc had not corrected
for skew instead of correcting for skew? For most analyses, the answer is
that the results are unaffected. But it may also be said that whenever
Why Not Just Use Centiles?
One way of avoiding the skew problem is tc) leave the AFQT scorcs in ccn-
cilcs. This was unsatisfactory, however, for we knew from collareral data
that much of the important role of LQ occurs at thc tails of the distl-ibu-
tion. Using centiles throws away information ;~bc)ut the pails. (See Ap-
pendix 1 on the norrnal distribution.)
differences were found, the scoring
we used tended to pro-
duce smaller relationships between IQ and the indicators, and smaller
ethnic differences, than the alternatives. W e did not cornpuce every
analysis by each of the four scoring permut.ations, but we did replicate
all of the analyses using the two extremes ( 1980 version uncorrected tor
skew and the 1989 version corrected for skew). In no instance did the
1989 version corrected for skew-the
version reported in the text-
yield significant findings that were not also found when using the 1980
uncorrected version. In terms of the relati.onships explored in this hook,
the 1989 version corrected for skew is the most conserv:itive of the al-
ternatives.
THE SOCIOECONOMIC STATUS INDEX
The SES index was created with the variables that are commonly used
in developing measures of socioeconomic status: educat~on, income,
5 74
Appendix 2
Appendix 2
575
and occupation. Since the purpose of the index was to measure the so-
cioeconomic environment in which the NLSY ~ o u t h was raised, the
specific variables employed referred to the parents' status: total net fam-
ily income, mother's education, father's education, and an index of oc-
cupational status of the adults living with the subject at the age of 14.
The population for the computation was limited to the 11,878 NLSY
subjects with valid AFQT scores. In more detail:
Mother's education and father's education were based on years of ed-
ucation, converted to standardized scores.
Family income was based on the averaged total net family income for
1978 and 1979, in constant dollars, when figures for both years were
available. If income for only one of the two years was reported, that year
was used. Family income was excluded if the subject was a Schedule C
interviewee (the reported income for the year in question referred to his
or her own income, not to the parental household's income). The dol-
lar figure was expressed as a logarithm before being standardized. This
procedure, customary when working with income data, has the effect of
discounting extremely high values of income and permitting greater dis-
crimination among lower incomes. A minimum standardized value of
-4 was set for incomes of less than $1,000 (all figures are in 1990
dollars).
Parental occupation was coded with a modified version of the Dun-
can socioeconomic index, grouping the Duncan values (which go from
1 to 100) into deciles. A value of -1 was assigned to persons out of the
labor force altogether. It was assumed that the family's socioeconomic
status is predominantly determined by the higher of the two occupa-
tions held by two parents. Thus the occupational variable was based on
the higher of the two ratings of the two parents. The increment in so-
cioeconomic status represented by both parents holding high-status oc-
cupations is indirectly reflected in the higher income and in the two
educational variables. The eleven values in the modified Duncan scale
were standardized.
The reliability of the four-indicator index (Cronbach's a) is .76. The
correlations among the components of the index are shown in the table.
The four variables were summed and averaged. If only a subset of vari-
ables had valid scores, that subset was summed and averaged. By far the
most common missing variable was family income, since many of the
NLSY youths were already living in independent households as of
Correlations of Indicators in the
Socioeconomic Status Index
Mother's
Father's
Parental
Education
Education
Occupation
Father's education
.63
-
Parental occupation
.47
.55
-
Family income
.36
.40
.47
the beginning of the survey, and hence were reporting their own
income, not parental income. Overall, data were available on all four
indicators for 7,447 subjects, for three on an additional 3,612, on two
for 679, and on one for 138. Two subjects with valid scores on the AFQT
had no information available on any of the four indicators. For use in
the regression analyses, the SES index scores were set to a mean of 0
and a standard deviation of 1.
EDUCATIONAL ATTAINMENT
Highest G r d Completed.
The NLSY creates a variable each year for "highest grade completed,"
incorporating information from several questions.7 For analyses based
on the occurrence of an event (e.g., the birth of a child), the value of
"highest grade completed" for the contemporaneous survey year is used.
For all other analyses, the 1990 value for "highest grade completed" is
used. Values run from 0 through 20.
Highest Degree Ever Received
In the 1988-1990 surveys, the NLSY asked respondents to report the
highest degree they had ever received. The possible responses were: high
school diploma, associate degree, bachelor of arts, bachelor of science,
master's, Ph.D., professional degree (law, medicine, dentistry), and
"other." These self-reported degrees were sometimes
es-
pecially when the degree did not correspond to the number of years of
education (e.g., a bachelor's degree for someone who also reported only
fourteen years of education). To eliminate the most egregiously suspi-
Measuring Socioeconomic and Educational Status
- A socioeconomic status (SES) index was constructed using four indicators: parental education, parental occupation, and family income.
- The index prioritized the higher occupational status of two parents to determine the family's overall socioeconomic standing.
- Missing data, particularly regarding family income for youths in independent households, was managed by averaging available subsets of the four indicators.
- Educational attainment was tracked through 'highest grade completed' and 'highest degree received' variables from the NLSY surveys.
- Researchers implemented strict validation rules to reconcile self-reported degrees with the actual number of years of education completed.
- Specific exclusions were made for ambiguous 'other' degrees and to distinguish between traditional high school diplomas and GEDs.
To eliminate the most egregiously suspicious cases, we made adjustments.
5 74
Appendix 2
Appendix 2
575
and occupation. Since the purpose of the index was to measure the so-
cioeconomic environment in which the NLSY ~ o u t h was raised, the
specific variables employed referred to the parents' status: total net fam-
ily income, mother's education, father's education, and an index of oc-
cupational status of the adults living with the subject at the age of 14.
The population for the computation was limited to the 11,878 NLSY
subjects with valid AFQT scores. In more detail:
Mother's education and father's education were based on years of ed-
ucation, converted to standardized scores.
Family income was based on the averaged total net family income for
1978 and 1979, in constant dollars, when figures for both years were
available. If income for only one of the two years was reported, that year
was used. Family income was excluded if the subject was a Schedule C
interviewee (the reported income for the year in question referred to his
or her own income, not to the parental household's income). The dol-
lar figure was expressed as a logarithm before being standardized. This
procedure, customary when working with income data, has the effect of
discounting extremely high values of income and permitting greater dis-
crimination among lower incomes. A minimum standardized value of
-4 was set for incomes of less than $1,000 (all figures are in 1990
dollars).
Parental occupation was coded with a modified version of the Dun-
can socioeconomic index, grouping the Duncan values (which go from
1 to 100) into deciles. A value of -1 was assigned to persons out of the
labor force altogether. It was assumed that the family's socioeconomic
status is predominantly determined by the higher of the two occupa-
tions held by two parents. Thus the occupational variable was based on
the higher of the two ratings of the two parents. The increment in so-
cioeconomic status represented by both parents holding high-status oc-
cupations is indirectly reflected in the higher income and in the two
educational variables. The eleven values in the modified Duncan scale
were standardized.
The reliability of the four-indicator index (Cronbach's a) is .76. The
correlations among the components of the index are shown in the table.
The four variables were summed and averaged. If only a subset of vari-
ables had valid scores, that subset was summed and averaged. By far the
most common missing variable was family income, since many of the
NLSY youths were already living in independent households as of
Correlations of Indicators in the
Socioeconomic Status Index
Mother's
Father's
Parental
Education
Education
Occupation
Father's education
.63
-
Parental occupation
.47
.55
-
Family income
.36
.40
.47
the beginning of the survey, and hence were reporting their own
income, not parental income. Overall, data were available on all four
indicators for 7,447 subjects, for three on an additional 3,612, on two
for 679, and on one for 138. Two subjects with valid scores on the AFQT
had no information available on any of the four indicators. For use in
the regression analyses, the SES index scores were set to a mean of 0
and a standard deviation of 1.
EDUCATIONAL ATTAINMENT
Highest G r d Completed.
The NLSY creates a variable each year for "highest grade completed,"
incorporating information from several questions.7 For analyses based
on the occurrence of an event (e.g., the birth of a child), the value of
"highest grade completed" for the contemporaneous survey year is used.
For all other analyses, the 1990 value for "highest grade completed" is
used. Values run from 0 through 20.
Highest Degree Ever Received
In the 1988-1990 surveys, the NLSY asked respondents to report the
highest degree they had ever received. The possible responses were: high
school diploma, associate degree, bachelor of arts, bachelor of science,
master's, Ph.D., professional degree (law, medicine, dentistry), and
"other." These self-reported degrees were sometimes
es-
pecially when the degree did not correspond to the number of years of
education (e.g., a bachelor's degree for someone who also reported only
fourteen years of education). To eliminate the most egregiously suspi-
5 7 6
Appendix 2
Appendix 2
5 7 7
cious cases, we made adjustments. For those who reported their highest
degree as being a high school diploma, we required at least eleven re-
ported years of completed education. For degrees beyond the high school
diploma, we required that the report of the highest grade completed be
within at least one year of the normal number of years required to ob-
tain that degree. Specifically, the minimum number of years of com-
pleted years of education required to use a reported degree were thirteen
for the Associate's degree, fifteen for a bachelor's degree, sixteen for a
master's degree, and 18 for a Ph.D., law degree, or medical degree.
We also employed the NLSY's variables to discriminate between
those whose terminal degree was a high school diploma versus a GED.
We excluded the 190 persons whose degree was listed as "other," after
trying fruitlessly to come up with a satisfactory means of estimating what
the "other" meant from collateral educational data.
The "high school" and "college graduate" samples used throughout
Part I1 are designed to isolate populations with homogeneous educa-
tional experiences as of the 1990 survey year. The high school sample
is defined as those who reported twelve years of completed education
and a high school diploma received through the normal process (i.e.,
excluding GEDs) as the highest attained degree. The college graduate
sample is defined as all those who reported sixteen years of completed
education and a B.A. or B.S. as the highest attained degree.
Transition to Colkge
In Chapter 1, we used the NLSY to determine the percentage of stu-
dents in various IQ groupings who went directly to college. We limited
the analysis to students who obtained a high school diploma between
January 1980 and July 1982, meaning that all subjects had taken the
AFQT prior to attending college. The analysis thus also reflects the ex-
perience of those who obtain their high school diploma via the normal
route (comparable to the analyses from the 1960s and 1920s, which
are also reported in the same figure). A subject is classified as attending
college in the year following graduation if he reported having enrolled
in college at any point in the calendar year following the date of
graduation.
MARITAL AND FERTILITY VARIABLES
All variables relating to marital history and childbearing employed the
NLSY's synthesis as contained in the 1990 Fertility File of the NLSY.
BIRTH WEIGHT
The most commonly reported measure of a problematic birth weight is
"low birth weight," defined as no more than 5.5 pounds. In its raw.form,
however, low birth weight is limited as a measure because it is con-
founded with prematurity. A baby born five weeks prematurely will
probably weigh less than 5.5 pounds and yet be a fully developed,
healthy child for gestational age, with excellent prospects. Conversely,
a child carried to term but weighing slightly more than the cutoff of 5.5
~ounds
is (given parents of average stature) small for its gestational age.
We therefore created a variable expressing the baby's birth weight as a
ratio of the weight for fetuses at the 50th centile for that gestational age,
using the Colorado Intrauterine Growth Charts as the basis for the com-
putation. If a baby weighed less than 5.5 pounds but the ratio was equal
to or greater than 1, that case was excluded from the analysis. All uses
of this variable in Chapters 10 and 13 are based on a sample that is ex-
clusively white (Latino or non-Latino) or black, thereby sidestepping
the complications that would be introduced by the populations of
smaller stature, such as East Asians. We further excluded cases report-
ing gestational ages of less than twenty-six weeks, reports of pregnan-
cies that lasted more than forty-four weeks or birth weights in excess of
thirteen pounds, and one remarkable case in which a mother reported
gestation of twenty-six weeks and a birth weight of more than twelve
pounds.
Methodology and IQ Measurement
- The study defines specific educational samples to ensure homogeneity, distinguishing between traditional high school graduates and those with four-year college degrees.
- College transition data is based on students who graduated between 1980 and 1982, ensuring all subjects completed the AFQT prior to enrollment.
- Birth weight analysis utilizes a specialized ratio based on gestational age to avoid confounding low birth weight with healthy prematurity.
- The birth weight sample is restricted by race and specific physiological outliers to maintain statistical consistency across populations of different average statures.
- The Armed Forces Qualification Test (AFQT) is defended as a valid proxy for IQ, despite its reliance on a standard high school education level.
- Unlike traditional IQ tests, the standard AFQT scoring used by the military is not age-referenced, reflecting its purpose for late-teen recruits.
A baby born five weeks prematurely will probably weigh less than 5.5 pounds and yet be a fully developed, healthy child for gestational age, with excellent prospects.
5 7 6
Appendix 2
Appendix 2
5 7 7
cious cases, we made adjustments. For those who reported their highest
degree as being a high school diploma, we required at least eleven re-
ported years of completed education. For degrees beyond the high school
diploma, we required that the report of the highest grade completed be
within at least one year of the normal number of years required to ob-
tain that degree. Specifically, the minimum number of years of com-
pleted years of education required to use a reported degree were thirteen
for the Associate's degree, fifteen for a bachelor's degree, sixteen for a
master's degree, and 18 for a Ph.D., law degree, or medical degree.
We also employed the NLSY's variables to discriminate between
those whose terminal degree was a high school diploma versus a GED.
We excluded the 190 persons whose degree was listed as "other," after
trying fruitlessly to come up with a satisfactory means of estimating what
the "other" meant from collateral educational data.
The "high school" and "college graduate" samples used throughout
Part I1 are designed to isolate populations with homogeneous educa-
tional experiences as of the 1990 survey year. The high school sample
is defined as those who reported twelve years of completed education
and a high school diploma received through the normal process (i.e.,
excluding GEDs) as the highest attained degree. The college graduate
sample is defined as all those who reported sixteen years of completed
education and a B.A. or B.S. as the highest attained degree.
Transition to Colkge
In Chapter 1, we used the NLSY to determine the percentage of stu-
dents in various IQ groupings who went directly to college. We limited
the analysis to students who obtained a high school diploma between
January 1980 and July 1982, meaning that all subjects had taken the
AFQT prior to attending college. The analysis thus also reflects the ex-
perience of those who obtain their high school diploma via the normal
route (comparable to the analyses from the 1960s and 1920s, which
are also reported in the same figure). A subject is classified as attending
college in the year following graduation if he reported having enrolled
in college at any point in the calendar year following the date of
graduation.
MARITAL AND FERTILITY VARIABLES
All variables relating to marital history and childbearing employed the
NLSY's synthesis as contained in the 1990 Fertility File of the NLSY.
BIRTH WEIGHT
The most commonly reported measure of a problematic birth weight is
"low birth weight," defined as no more than 5.5 pounds. In its raw.form,
however, low birth weight is limited as a measure because it is con-
founded with prematurity. A baby born five weeks prematurely will
probably weigh less than 5.5 pounds and yet be a fully developed,
healthy child for gestational age, with excellent prospects. Conversely,
a child carried to term but weighing slightly more than the cutoff of 5.5
~ounds
is (given parents of average stature) small for its gestational age.
We therefore created a variable expressing the baby's birth weight as a
ratio of the weight for fetuses at the 50th centile for that gestational age,
using the Colorado Intrauterine Growth Charts as the basis for the com-
putation. If a baby weighed less than 5.5 pounds but the ratio was equal
to or greater than 1, that case was excluded from the analysis. All uses
of this variable in Chapters 10 and 13 are based on a sample that is ex-
clusively white (Latino or non-Latino) or black, thereby sidestepping
the complications that would be introduced by the populations of
smaller stature, such as East Asians. We further excluded cases report-
ing gestational ages of less than twenty-six weeks, reports of pregnan-
cies that lasted more than forty-four weeks or birth weights in excess of
thirteen pounds, and one remarkable case in which a mother reported
gestation of twenty-six weeks and a birth weight of more than twelve
pounds.
Appendix 3
Technical Issues Regarding the
Armed Forces Qualification Test
as a Measure of IQ
Throughout The Bell Curve, we use the Armed Forces Qualification Test
(AFQT) as a measure of IQ. This appendix discusses a variety of related
issues that may help readers interpret the meaning of the analyses pre-
sented in the full text.
DOES THE AFQT MEASURE THE SAME THING THAT IQ TESTS
MEASURE!
The AFQT is a paper-and-pencil test designed for youths who have
reached their late teens. In effect, it assumes exposure to an ordinary
high school education (or the opportunity to get one). This kind of re-
striction is shared by any IQ test, all of which are designed for certain
groups.
The AFQT as scored by the armed forces is not age referenced. The
armed forces have no need to do so, because the overwhelming major-
ity of recruits taking the test are 18 and 19 years old. In contrast, the
NLSY sample varied from 14 to 23 years old when they took the test.
Therefore, as discussed in Appendix 3, all analyses in the book take age
into account through one of two methods: entering age as an indepen-
dent variable in the multivariate analyses, and, for all descriptive sta-
tistics, age referencing the AFQT score by expressing it in terms of the
mean and standard deviation for each year's birth cohort. In this ap-
pendix, we will uniformly use the age-referenced version for analyses
based on the NLSY.
Is a set of age-referenced AFQT scores appropriately treated as IQ
scores? We approach this issue from two perspectives. First, we examine
AFQT as a Psychometric Measure
- The researchers adjusted AFQT scores for age to ensure comparability between the NLSY sample and standard military recruits.
- The AFQT is identified as one of the most highly 'g-loaded' mental tests currently in use, effectively tapping into general intelligence.
- The test correlates more strongly with a wide range of other mental tests than those tests typically correlate with each other.
- The Armed Services Vocational Aptitude Battery (ASVAB) consists of ten subtests ranging from general intelligence to specific vocational knowledge.
- High correlations between disparate subtests, such as Word Knowledge and General Science, suggest a deep level of underlying mental functioning.
- Factor analysis is used to extract the general intelligence factor from the complex table of correlations between the various ASVAB subtests.
To see them arising between tests of such different subject matter should alert us to some deeper level of mental functioning.
Appendix 3
Technical Issues Regarding the
Armed Forces Qualification Test
as a Measure of IQ
Throughout The Bell Curve, we use the Armed Forces Qualification Test
(AFQT) as a measure of IQ. This appendix discusses a variety of related
issues that may help readers interpret the meaning of the analyses pre-
sented in the full text.
DOES THE AFQT MEASURE THE SAME THING THAT IQ TESTS
MEASURE!
The AFQT is a paper-and-pencil test designed for youths who have
reached their late teens. In effect, it assumes exposure to an ordinary
high school education (or the opportunity to get one). This kind of re-
striction is shared by any IQ test, all of which are designed for certain
groups.
The AFQT as scored by the armed forces is not age referenced. The
armed forces have no need to do so, because the overwhelming major-
ity of recruits taking the test are 18 and 19 years old. In contrast, the
NLSY sample varied from 14 to 23 years old when they took the test.
Therefore, as discussed in Appendix 3, all analyses in the book take age
into account through one of two methods: entering age as an indepen-
dent variable in the multivariate analyses, and, for all descriptive sta-
tistics, age referencing the AFQT score by expressing it in terms of the
mean and standard deviation for each year's birth cohort. In this ap-
pendix, we will uniformly use the age-referenced version for analyses
based on the NLSY.
Is a set of age-referenced AFQT scores appropriately treated as IQ
scores? We approach this issue from two perspectives. First, we examine
580
Appendix 3
Appendix 3
5 8 1
the internal psychometric properties of the AFQT and show that the
AFQT is one of the most highly g-loaded mental tests in current use. It
seems to do what a good IQ test is supposed to do-tap
into a general
factor rather than specific bits of learning or skill-as
well as or better
than its competitors. Second, we examine the correlation between the
AFQT and other IQ tests, and show that the AFQT is more highly cor-
related with a wide range of other mental tests than those other men-
tal tests are with each other. On both counts, the AFQT qualifies not
just as an IQ test, but one of the better ones psychometrically.
Psychometric Characteristics of the ASVAB
Let us begin by considering the larger test from which the AFQT is com-
puted, the ASVAB (Armed Services Vocational Aptitude Battery),
taken every year by between a half million and a million young adults
who are applying for entry into one of the armed services. The ASVAR
has ten subtests, spanning a range from test items that could appear
equally well on standard tests of intelligence to items testing knowledge
of automobile repair and electronics.'" Scores on the subtests determine
whether the applicant will be accepted by his chosen branch of service;
for those accepted, the scores are later used for the placement of enlisted
personnel into military occupations. How well or poorly a person per-
forms in military occupational training schools, and also how well he
does on the job, can therefore be evaluated against the scores earned on
a battery of standardized tests.
The ten subtests of ASVAB can be paired off into forty-five corre-
lations. Of the forty-five, the three highest correlations in a large study
of enlisted personnel were between Word Knowledge and General Sci-
ence, Word Knowledge and Paragraph Completion, and, highest of all,
between Mathematics Knowledge and Arithmetic Reasoning.* Corre-
lations above .8, as these were, are in the range observed between dif-
ferent IQ tests, which are frankly constructed to measure the same
attribute. To see them arising between tests of such different subject
matter should alert us to some deeper level of mental functioning. The
three lowest correlations, none lower than .22, were between Coding
Speed and Mechanical Comprehension, Numerical Operations and
AutolShop Information, and, lowest of all, between Coding Speed and
Automobile/Shop Information. Between those extremes, there were
rather large correlations between Paragraph Completion and General
Science and between Word Knowledge and Electronics Information
but only moderate correlations between Electronics Information and
Coding Speed and between Mathematics Knowledge and Automo-
bilelShop Information. Thirty-six of the forty-five correlations were
above -5.
Psychometrics approaches a table of correlations with one or another
of its methods for factor analysis. Factor analysis (or other mathemati-
cal procedures that go under other names) extracts the factors"' that ac-
count for the observed pattern of subtest scores. The basic idea is that
scores on any pair of tests are correlated to the extent that the tests mea-
sure something in common: If they test traits in common, they are cor-
related, and if not, not. Factor analysis tells how many different
underlying factors are necessary to account for the observed correlations
between them. If, for example, the subtest scores were totally uncorre-
lated, it would take ten independent and equally significant factors, one
for each subtest by itself. With each test drawing on its own unique fac-
tor, the forty-five correlations would all be zeros. At the other extreme,
if the subtests measured precisely the same thing down to the very small-
est detail, then all the correlations among scores on the subtests could
be explained by a single factor-that
thing which all the subtests pre-
cisely measured-and
the correlations would all be ones. Neither ex-
treme describes the actuality, but for measures of intellectual
performance, one large factor comes closer than many small ones. This
is not the place to dwell on mathematical details except to note that,
contrary to claims in nontechnical works,4 the conclusions we draw
about general intelligence do not depend on the particular method of
analysis used.5
For the ASVAR, 64 percent of the variance among the ten subtest
scores is accounted for by a single factor, g. A second factor accounts for
another 13 percent. With three inferred factors, 82 percent of the vari-
ance is accounted for.'" l
e
intercorrelations indicate that people do
vary importantly in some single, underlying trait and that those varia-
tions affect how they do on every test. Nor is the predominance of g a
fortuitous result of the particular subtests in ASVAB. The air force's ap-
titude test for prospective officers, the AFOQT (Air Force Officer Qual-
ifying Test) similarly has g as its major source of individual variation.'
Indeed, all broad-gauged test batteries of cognitive ability have g as their
major source of variation among the scores people get.R
The Dominance of g
- Factor analysis reveals that a single underlying factor, g, accounts for the majority of variance in cognitive test scores.
- In the ASVAB battery, g accounts for 64 percent of the variance, while subsequent factors contribute significantly less.
- The presence of g is a universal finding across all broad-gauged cognitive test batteries, including officer qualifying tests.
- Correlations between subtests are driven more by their reliance on general intelligence than by overlapping subject matter.
- The consistency of g across different mathematical methods of analysis refutes claims that it is a statistical artifact.
Why are scores on algebra and geometry more similar to those on word problems than to those on arithmetic?
580
Appendix 3
Appendix 3
5 8 1
the internal psychometric properties of the AFQT and show that the
AFQT is one of the most highly g-loaded mental tests in current use. It
seems to do what a good IQ test is supposed to do-tap
into a general
factor rather than specific bits of learning or skill-as
well as or better
than its competitors. Second, we examine the correlation between the
AFQT and other IQ tests, and show that the AFQT is more highly cor-
related with a wide range of other mental tests than those other men-
tal tests are with each other. On both counts, the AFQT qualifies not
just as an IQ test, but one of the better ones psychometrically.
Psychometric Characteristics of the ASVAB
Let us begin by considering the larger test from which the AFQT is com-
puted, the ASVAB (Armed Services Vocational Aptitude Battery),
taken every year by between a half million and a million young adults
who are applying for entry into one of the armed services. The ASVAR
has ten subtests, spanning a range from test items that could appear
equally well on standard tests of intelligence to items testing knowledge
of automobile repair and electronics.'" Scores on the subtests determine
whether the applicant will be accepted by his chosen branch of service;
for those accepted, the scores are later used for the placement of enlisted
personnel into military occupations. How well or poorly a person per-
forms in military occupational training schools, and also how well he
does on the job, can therefore be evaluated against the scores earned on
a battery of standardized tests.
The ten subtests of ASVAB can be paired off into forty-five corre-
lations. Of the forty-five, the three highest correlations in a large study
of enlisted personnel were between Word Knowledge and General Sci-
ence, Word Knowledge and Paragraph Completion, and, highest of all,
between Mathematics Knowledge and Arithmetic Reasoning.* Corre-
lations above .8, as these were, are in the range observed between dif-
ferent IQ tests, which are frankly constructed to measure the same
attribute. To see them arising between tests of such different subject
matter should alert us to some deeper level of mental functioning. The
three lowest correlations, none lower than .22, were between Coding
Speed and Mechanical Comprehension, Numerical Operations and
AutolShop Information, and, lowest of all, between Coding Speed and
Automobile/Shop Information. Between those extremes, there were
rather large correlations between Paragraph Completion and General
Science and between Word Knowledge and Electronics Information
but only moderate correlations between Electronics Information and
Coding Speed and between Mathematics Knowledge and Automo-
bilelShop Information. Thirty-six of the forty-five correlations were
above -5.
Psychometrics approaches a table of correlations with one or another
of its methods for factor analysis. Factor analysis (or other mathemati-
cal procedures that go under other names) extracts the factors"' that ac-
count for the observed pattern of subtest scores. The basic idea is that
scores on any pair of tests are correlated to the extent that the tests mea-
sure something in common: If they test traits in common, they are cor-
related, and if not, not. Factor analysis tells how many different
underlying factors are necessary to account for the observed correlations
between them. If, for example, the subtest scores were totally uncorre-
lated, it would take ten independent and equally significant factors, one
for each subtest by itself. With each test drawing on its own unique fac-
tor, the forty-five correlations would all be zeros. At the other extreme,
if the subtests measured precisely the same thing down to the very small-
est detail, then all the correlations among scores on the subtests could
be explained by a single factor-that
thing which all the subtests pre-
cisely measured-and
the correlations would all be ones. Neither ex-
treme describes the actuality, but for measures of intellectual
performance, one large factor comes closer than many small ones. This
is not the place to dwell on mathematical details except to note that,
contrary to claims in nontechnical works,4 the conclusions we draw
about general intelligence do not depend on the particular method of
analysis used.5
For the ASVAR, 64 percent of the variance among the ten subtest
scores is accounted for by a single factor, g. A second factor accounts for
another 13 percent. With three inferred factors, 82 percent of the vari-
ance is accounted for.'" l
e
intercorrelations indicate that people do
vary importantly in some single, underlying trait and that those varia-
tions affect how they do on every test. Nor is the predominance of g a
fortuitous result of the particular subtests in ASVAB. The air force's ap-
titude test for prospective officers, the AFOQT (Air Force Officer Qual-
ifying Test) similarly has g as its major source of individual variation.'
Indeed, all broad-gauged test batteries of cognitive ability have g as their
major source of variation among the scores people get.R
582
Appendix 3
Appendix 3
583
The naive theory assumes that when scores on two subtests are cor-
related, it is because of overlapping content. But it is impossible to make
sense of the varying correlations between the subtests in terms of over-
lapping content. Consider again the correlation between Arithmetic
Reasoning and Mathematical Knowledge, which is the highest of all. It
may seem to rest simply on a knowledge of mathematics and arithmetic.
However, the score on Numerical Operations is less correlated with ei-
ther of those two tests than the two are with each other. Content pro-
vides no clue as to why. Arithmetic Reasoning has only word problems
on it; Mathematical Knowledge applies the basic methods of algebra
and geometry; and Numerical Operations is an arithmetic test. Why are
scores on algebra and geometry more similar to those on word problems
than to those on arithmetic? Such variations in the correlations be-
tween the subtests arise, in fact, less from common content than from
how much they draw on the underlying ability we call g. The varying
correlations between the subtests preclude explaining g away as, for ex-
ample, simply a matter of test-taking ability or test-taking experience,
which should affect all tests more or less equally. We try to make some
of these ideas visible in the figure below.
The relation of the ASVAB subtests to each other and to g
Correlation with g
1 .o -
0.6 -
CS
Bold: Subtests used
in the AFQT
<
,
,
'
I
"
'
I
<
,
#
,
I
0.5
0.6
0.7
Average correlation with the other subtests
For each subtest on ASVAB, we averaged the nine correlations with
each of the other subtests, and that average correlation defines the hor-
izontal axis. The vertical axis is a measure, for each subtest, of the
correlation between the score and g.9 T h e two-letter codes identify
the subtests. At the top is General Science (GS), closely followed
by Word Knowledge (WK), and Arithmetical Reasoning (AR), for
which the scores are highly correlated with g and have the highest
average correlations with all the subtests. Another three subtests-
Mathematics Knowledge (MK), Paragraph Comprehension (PC), and
Electronics Information (E1)-are
just slightly below the top cluster
in both respects. At the bottom are Coding Speed (CS), Auto-
mobile/Shop Information (AS), Numerical Operations (NO), and
Mechanical Comprehension (MC), subtests that correlate, on the
average, the least with other subtests and are also the least correlated
with g (although still substantially correlated in their own right). The
bottom group includes the two speeded subtests, CS and NO, thereby
refuting another common misunderstanding about g, which is that
it refers to mental speed and little more. Virtually without exception,
the more dependent a subtest score is on g, the higher is its average
correlation with the other subtests. This is the pattern that betrays
what g means-a
broad mental capacity that permeates perform-
ance on anything that challenges people cognitively. A rough rule
of thumb is that items or tests that require mental complexity draw
more on g than items that do not-the
difference, for example,
between simply repeating a string of numbers after hearing them once,
which does not much test g, and repeating them in reverse order, which
does."
The four subtests used in the 1989 scoring version of the AFQT (the
one used throughout the text) and their g loadings are Word Knowledge
(.87), Paragraph Comprehension (.81), Arithmetic Reasoning (.87),
and Mathematics Knowledge (.82).'11' The AFQT is thus one of the
most highly g-loaded tests in use. By way of comparison, the factor load-
ings for the eleven subtests of the Wechsler Adult Intelligence Scale
(WAIS) range from .63 to .83, with a median of .69.1121
Whereas the first
factor, g, accounts for over 70 percent of the variance in the AFQT, it
accounts for only 53 percent in the WAIS.
The Nature of g
- The 'g' factor represents a broad mental capacity that permeates performance on any task requiring cognitive challenge or mental complexity.
- Subtests like General Science and Word Knowledge correlate most highly with g, while speed-based tests like Coding Speed show the weakest correlation.
- The AFQT is identified as an exceptionally highly g-loaded test, with its core components all scoring above .80 in factor loading.
- Statistical analysis shows the AFQT accounts for over 70 percent of variance in its scores, significantly higher than the 53 percent found in the WAIS.
- The AFQT correlates with classic IQ tests, such as the California Test of Mental Maturity, at levels equal to or higher than those tests correlate with each other.
- The data refutes the misconception that g is merely a measure of mental speed, emphasizing instead the role of complexity and manipulation of information.
This is the pattern that betrays what g means-a broad mental capacity that permeates performance on anything that challenges people cognitively.
582
Appendix 3
Appendix 3
583
The naive theory assumes that when scores on two subtests are cor-
related, it is because of overlapping content. But it is impossible to make
sense of the varying correlations between the subtests in terms of over-
lapping content. Consider again the correlation between Arithmetic
Reasoning and Mathematical Knowledge, which is the highest of all. It
may seem to rest simply on a knowledge of mathematics and arithmetic.
However, the score on Numerical Operations is less correlated with ei-
ther of those two tests than the two are with each other. Content pro-
vides no clue as to why. Arithmetic Reasoning has only word problems
on it; Mathematical Knowledge applies the basic methods of algebra
and geometry; and Numerical Operations is an arithmetic test. Why are
scores on algebra and geometry more similar to those on word problems
than to those on arithmetic? Such variations in the correlations be-
tween the subtests arise, in fact, less from common content than from
how much they draw on the underlying ability we call g. The varying
correlations between the subtests preclude explaining g away as, for ex-
ample, simply a matter of test-taking ability or test-taking experience,
which should affect all tests more or less equally. We try to make some
of these ideas visible in the figure below.
The relation of the ASVAB subtests to each other and to g
Correlation with g
1 .o -
0.6 -
CS
Bold: Subtests used
in the AFQT
<
,
,
'
I
"
'
I
<
,
#
,
I
0.5
0.6
0.7
Average correlation with the other subtests
For each subtest on ASVAB, we averaged the nine correlations with
each of the other subtests, and that average correlation defines the hor-
izontal axis. The vertical axis is a measure, for each subtest, of the
correlation between the score and g.9 T h e two-letter codes identify
the subtests. At the top is General Science (GS), closely followed
by Word Knowledge (WK), and Arithmetical Reasoning (AR), for
which the scores are highly correlated with g and have the highest
average correlations with all the subtests. Another three subtests-
Mathematics Knowledge (MK), Paragraph Comprehension (PC), and
Electronics Information (E1)-are
just slightly below the top cluster
in both respects. At the bottom are Coding Speed (CS), Auto-
mobile/Shop Information (AS), Numerical Operations (NO), and
Mechanical Comprehension (MC), subtests that correlate, on the
average, the least with other subtests and are also the least correlated
with g (although still substantially correlated in their own right). The
bottom group includes the two speeded subtests, CS and NO, thereby
refuting another common misunderstanding about g, which is that
it refers to mental speed and little more. Virtually without exception,
the more dependent a subtest score is on g, the higher is its average
correlation with the other subtests. This is the pattern that betrays
what g means-a
broad mental capacity that permeates perform-
ance on anything that challenges people cognitively. A rough rule
of thumb is that items or tests that require mental complexity draw
more on g than items that do not-the
difference, for example,
between simply repeating a string of numbers after hearing them once,
which does not much test g, and repeating them in reverse order, which
does."
The four subtests used in the 1989 scoring version of the AFQT (the
one used throughout the text) and their g loadings are Word Knowledge
(.87), Paragraph Comprehension (.81), Arithmetic Reasoning (.87),
and Mathematics Knowledge (.82).'11' The AFQT is thus one of the
most highly g-loaded tests in use. By way of comparison, the factor load-
ings for the eleven subtests of the Wechsler Adult Intelligence Scale
(WAIS) range from .63 to .83, with a median of .69.1121
Whereas the first
factor, g, accounts for over 70 percent of the variance in the AFQT, it
accounts for only 53 percent in the WAIS.
Appendix 3
585
Correlations of the AFQT with Other IQ Tests
Our second approach to the question, Is the AFQT an IQ test? is to ask
how the AFQT correlates with other well-known standardized mental
tests (see the table below). We can do so by making use of the high
school transcript survey conducted by the NLSY in 1979. In addition
to gathering information about grades, the survey picked up any other
IQ test that the student had taken within the school system. The data
usually included both the test score and the percentile rank, based on
national norms. In accordance with the recommendation of the NLSY
User's Manual, we use percentiles throughout.13
Correlations of the AFQT with
Other IQ Tests in The NLSY
Correlation
with the
Sample
AFQT
California Test of Mental Maturity
3 56
.8 1
Coop School and College Ability Test
12 1
.90
Differential Atitude Test
443
.8 1
Henmon Nelson Test of Mental Maturity
152
.71
Kuhlmann-Anderson Intelligence Test
36
.80
Lorge-Thorndike Intelligence Test
170
.72
Otis-Lennnon Mental Ability Test
530
.81
The magnitudes of the correlations between the AFQT (using the
age-referenced percentile scores) and classic IQ tests are as high as or
higher than the observed correlations of the classic 1Q tests with each
other. For example, the best-known adult test, the WAIS, is known to
correlate (using the median correlation with various studies, and not
correcting for restriction of range in the samples) with the Stanford-Bi-
net at .77, with the Ravens Standard Progressive Matrices at .72, the
SRA Non-verbal test at .81, the Peabody Picture Vocabulary Test at .83,
and the Otis at .78.14 The table below summarizes the intercorrelations
of IQ tests, based on the comparisons assembled by Arthur Jensen as of
1980, and adding a line for the AFQT comparisons from the NLSY. The
AFQT compares favorably with the other major IQ tests by this mea-
sure, which in turn is consistent with the high g-loading of the AFQT.
Correlations of the Major IQ Tests with
Other Standardized Mental Tests
Median Correlation
with Other
Mental Tests
AFQT (age-referenced, 1989 scoring)
.81
Wechsler-Bellevue I
.73
Wechsler Adult Intelligence Scale (WAIS)
.77
Wechsler Intelligence Scale for Children
.64
Stanford-Binet
.7 1
Source: Jensen 1980, Tahle 8.5, and author's analysis of the NLSY.
-
HOW SENSITIVE ARE THE RESULTS TO THE ASSUMPTION
THAT IQ IS NORMALLY DISTRIBUTED?
Any good test designed to measure a complex ability (whether a test of
cognitive ability or carpentry ability) will have several characteristics
that common sense says are desirable: a large number of items, a wide
range of difficulty among the items, no marked gaps in the difficulty of
the items, a variety of types of items, and items that have some rela-
tionship to each other (i.e., are to some degree measuring the same
thing).15 Empirically, tests with these characteristics, administered to a
representative sample of those for whom the test is intended, will yield
scores that are spread out in a fashion resembling a normal distribution,
or a bell curve. In this sense, tests of mental ability are not designed to
produce normally distributed scores; that's just what happens, the same
way that height is normally distributed without anyone planning it.
It is also true, however, that tests are usually scored and standardized
under the assumption that intelligence is normally distributed, and this
has led to allegations that psychometricians have bamboozled people
into accepting that intelligence is normally distributed, when in fact it
may just be an artifact of the way they choose to measure intelligence.
For a response to such allegations, Chapter 4 of Arthur Jensen's Bias in
Mental Testing (New York: Free Press, 1980) remains the best discussion
we have seen.
For purposes of assessing the analyses in this book, it may help read-
ers to know the extent to which any assumptions about the distribution
of AFQT scores might have affected the results, especially since we
IQ Distribution and AFQT Validity
- The AFQT demonstrates a high correlation with other major IQ tests, such as the WAIS and Stanford-Binet, suggesting it is a robust measure of general intelligence.
- The normal distribution of test scores is presented as an empirical outcome of well-designed tests rather than a forced artifact of psychometric design.
- Critics argue that the bell curve distribution of intelligence may be a result of specific scoring and standardization assumptions.
- To address these concerns, the authors used rank-based cognitive classes which remain invariant regardless of the underlying distribution's normality.
- Multivariate analysis comparing continuous AFQT scores against nominal cognitive classes yielded consistent results in predicting social outcomes like poverty.
In this sense, tests of mental ability are not designed to produce normally distributed scores; that's just what happens, the same way that height is normally distributed without anyone planning it.
Appendix 3
585
Correlations of the AFQT with Other IQ Tests
Our second approach to the question, Is the AFQT an IQ test? is to ask
how the AFQT correlates with other well-known standardized mental
tests (see the table below). We can do so by making use of the high
school transcript survey conducted by the NLSY in 1979. In addition
to gathering information about grades, the survey picked up any other
IQ test that the student had taken within the school system. The data
usually included both the test score and the percentile rank, based on
national norms. In accordance with the recommendation of the NLSY
User's Manual, we use percentiles throughout.13
Correlations of the AFQT with
Other IQ Tests in The NLSY
Correlation
with the
Sample
AFQT
California Test of Mental Maturity
3 56
.8 1
Coop School and College Ability Test
12 1
.90
Differential Atitude Test
443
.8 1
Henmon Nelson Test of Mental Maturity
152
.71
Kuhlmann-Anderson Intelligence Test
36
.80
Lorge-Thorndike Intelligence Test
170
.72
Otis-Lennnon Mental Ability Test
530
.81
The magnitudes of the correlations between the AFQT (using the
age-referenced percentile scores) and classic IQ tests are as high as or
higher than the observed correlations of the classic 1Q tests with each
other. For example, the best-known adult test, the WAIS, is known to
correlate (using the median correlation with various studies, and not
correcting for restriction of range in the samples) with the Stanford-Bi-
net at .77, with the Ravens Standard Progressive Matrices at .72, the
SRA Non-verbal test at .81, the Peabody Picture Vocabulary Test at .83,
and the Otis at .78.14 The table below summarizes the intercorrelations
of IQ tests, based on the comparisons assembled by Arthur Jensen as of
1980, and adding a line for the AFQT comparisons from the NLSY. The
AFQT compares favorably with the other major IQ tests by this mea-
sure, which in turn is consistent with the high g-loading of the AFQT.
Correlations of the Major IQ Tests with
Other Standardized Mental Tests
Median Correlation
with Other
Mental Tests
AFQT (age-referenced, 1989 scoring)
.81
Wechsler-Bellevue I
.73
Wechsler Adult Intelligence Scale (WAIS)
.77
Wechsler Intelligence Scale for Children
.64
Stanford-Binet
.7 1
Source: Jensen 1980, Tahle 8.5, and author's analysis of the NLSY.
-
HOW SENSITIVE ARE THE RESULTS TO THE ASSUMPTION
THAT IQ IS NORMALLY DISTRIBUTED?
Any good test designed to measure a complex ability (whether a test of
cognitive ability or carpentry ability) will have several characteristics
that common sense says are desirable: a large number of items, a wide
range of difficulty among the items, no marked gaps in the difficulty of
the items, a variety of types of items, and items that have some rela-
tionship to each other (i.e., are to some degree measuring the same
thing).15 Empirically, tests with these characteristics, administered to a
representative sample of those for whom the test is intended, will yield
scores that are spread out in a fashion resembling a normal distribution,
or a bell curve. In this sense, tests of mental ability are not designed to
produce normally distributed scores; that's just what happens, the same
way that height is normally distributed without anyone planning it.
It is also true, however, that tests are usually scored and standardized
under the assumption that intelligence is normally distributed, and this
has led to allegations that psychometricians have bamboozled people
into accepting that intelligence is normally distributed, when in fact it
may just be an artifact of the way they choose to measure intelligence.
For a response to such allegations, Chapter 4 of Arthur Jensen's Bias in
Mental Testing (New York: Free Press, 1980) remains the best discussion
we have seen.
For purposes of assessing the analyses in this book, it may help read-
ers to know the extent to which any assumptions about the distribution
of AFQT scores might have affected the results, especially since we
586
Appendix 3
Appendix 3
587
rescored the AFQT to correct for skew (see Appendix 2). The descrip-
tive statistics showing the breakdown ofeach variable by cognitive class,
presented in each chapter of Part 11, address that issue. Assignment to
cognitive classes was based on the subject's rank within the distribution,
and these ranks are invariant no matter what the normality of the distri-
bution might be. Ranks were also unaffected by the correction for skew.
The descriptive statistics in the text were bivariate. To examine this
issue in a multivariate framework, we replicated the analyses of Part I1
substituting a set of nominal variables, denoting the cognitive classes,
for the continuous AFQT measure. That is, the regression treated
"membership in Class I" as a nominal variable, just as it would treat
"married" or "Latino" as a nominal characteristic-and
similarly for the
other four cognitive classes, also entered as nominal variables (See Ap-
pendix 4 for a discussion of how to interpret the coefficients for nomi-
nal variables as created by the software used in these analyses, JMP 3.0).
Below, we show the results for the opening analysis of Part 11 (Chapter
5), the probability of being in poverty.
Comparison of results when AFQT is treated as a continuous,
normally distributed variable and when it is treated as a
set of nominal categories based on groupings by centile
Probability of being in poverty
30% -
Line: When AFQT is treated as
a continuous variable
Crosses: When cognitive class is
entered as a vector of nominal
variables
-
V
IV
I11
I1
I
Cognitive Class,
(1-5th
(5-25th
(2575th
(75-95th
(95-99th
in centiles
centile) centile)
centile)
centile)
centile)
Note: For computing the plot, age and SES were set at their mean values
The results of the logistic regression analysis using the normally
distributed AFQT score follow:
Whole-Model Test
Source
DF
-LogLikelihood
Chisquare
Prob>Ch~Sq
Model
3
477222.0
954443.9
0.000000
Error
4488
4587166.7
C Total
4491
5064388.7
RSquare (U)
0.0942
Observations
4,492
Parameter Estimates
Term
Estimate
Std Error
Chisquare
Prob>ChiSq
Intercept
-2.6579692
0.0009826
.
0.0000
zAFQT89
-0.81 77031
0.0012228
447179
0.0000
zSES
-0.2744971
0.0011661
55416
0.0000
zAge
-0.0482156
0.0009187
2754.1
0.0000
These are the results using the categorization into cognitive classes by
centile:
Source
Model
Error
C Total
Term
Intercept
CogClas.[l-51
CogClas.[2-51
CogClas.[3 -51
CogClas.[4-51
zSES
zAge
Whole-Model Test
DF
-LogLikelihood
Chisquare
6
383494.7
766989.4
4485
4680894.0
449 1
5064388.7
RSquare (U)
0.0757
Observations
4,492
Parameter Estimates
Estimate
Std Error
Chisquare
-2.5097718
0.0015823
.
-1.0067 168
0.0050693
39439
-0.6803606
0.0025486
7 1265
-0.1905042
0.001 8498
10606
0.64764109
0.0021336
92138
-0.3902981
0.0011276
119800
-0.1605992
0.000907
3 1350
We repeated these comparisons for a broad sampling of the outcome
variables discussed in Part 11. The results for poverty were typical. When
the results for the two expressions of IQ do not correspond (e.g., the re-
lationship of mother's IQ to low birth weight, as discussed in Chapter
lo), the lack of correspondence also showed up in the bivariate table
showing the breakdown by cognitive class. Or to put it another way, the
results presented in the text using IQ as a continuous, normally distrib-
uted variable are produced as well when IQ is treated as a set of cate-
AFQT Scores and Socioeconomic Status
- Statistical analysis shows that AFQT scores remain a robust predictor of outcomes whether treated as a continuous variable or categorized into cognitive classes.
- The correlation between the AFQT score and the composite Socioeconomic Status (SES) index is measured at .55, which aligns with previous research.
- The text explores the 'unresolvable' controversy regarding whether IQ tests measure innate ability or are merely proxies for environmental factors.
- Three interpretations for the IQ-SES correlation are proposed: test bias favoring high-status backgrounds, genuine environmental advantages, and potential genetic factors.
- Regression models indicate that while SES and age have independent causal effects, the AFQT score maintains its own independent statistical reality.
The relationship of an IQ test score to education and socioeconomic background is a constant and to some extent unresolvable source of controversy.
586
Appendix 3
Appendix 3
587
rescored the AFQT to correct for skew (see Appendix 2). The descrip-
tive statistics showing the breakdown ofeach variable by cognitive class,
presented in each chapter of Part 11, address that issue. Assignment to
cognitive classes was based on the subject's rank within the distribution,
and these ranks are invariant no matter what the normality of the distri-
bution might be. Ranks were also unaffected by the correction for skew.
The descriptive statistics in the text were bivariate. To examine this
issue in a multivariate framework, we replicated the analyses of Part I1
substituting a set of nominal variables, denoting the cognitive classes,
for the continuous AFQT measure. That is, the regression treated
"membership in Class I" as a nominal variable, just as it would treat
"married" or "Latino" as a nominal characteristic-and
similarly for the
other four cognitive classes, also entered as nominal variables (See Ap-
pendix 4 for a discussion of how to interpret the coefficients for nomi-
nal variables as created by the software used in these analyses, JMP 3.0).
Below, we show the results for the opening analysis of Part 11 (Chapter
5), the probability of being in poverty.
Comparison of results when AFQT is treated as a continuous,
normally distributed variable and when it is treated as a
set of nominal categories based on groupings by centile
Probability of being in poverty
30% -
Line: When AFQT is treated as
a continuous variable
Crosses: When cognitive class is
entered as a vector of nominal
variables
-
V
IV
I11
I1
I
Cognitive Class,
(1-5th
(5-25th
(2575th
(75-95th
(95-99th
in centiles
centile) centile)
centile)
centile)
centile)
Note: For computing the plot, age and SES were set at their mean values
The results of the logistic regression analysis using the normally
distributed AFQT score follow:
Whole-Model Test
Source
DF
-LogLikelihood
Chisquare
Prob>Ch~Sq
Model
3
477222.0
954443.9
0.000000
Error
4488
4587166.7
C Total
4491
5064388.7
RSquare (U)
0.0942
Observations
4,492
Parameter Estimates
Term
Estimate
Std Error
Chisquare
Prob>ChiSq
Intercept
-2.6579692
0.0009826
.
0.0000
zAFQT89
-0.81 77031
0.0012228
447179
0.0000
zSES
-0.2744971
0.0011661
55416
0.0000
zAge
-0.0482156
0.0009187
2754.1
0.0000
These are the results using the categorization into cognitive classes by
centile:
Source
Model
Error
C Total
Term
Intercept
CogClas.[l-51
CogClas.[2-51
CogClas.[3 -51
CogClas.[4-51
zSES
zAge
Whole-Model Test
DF
-LogLikelihood
Chisquare
6
383494.7
766989.4
4485
4680894.0
449 1
5064388.7
RSquare (U)
0.0757
Observations
4,492
Parameter Estimates
Estimate
Std Error
Chisquare
-2.5097718
0.0015823
.
-1.0067 168
0.0050693
39439
-0.6803606
0.0025486
7 1265
-0.1905042
0.001 8498
10606
0.64764109
0.0021336
92138
-0.3902981
0.0011276
119800
-0.1605992
0.000907
3 1350
We repeated these comparisons for a broad sampling of the outcome
variables discussed in Part 11. The results for poverty were typical. When
the results for the two expressions of IQ do not correspond (e.g., the re-
lationship of mother's IQ to low birth weight, as discussed in Chapter
lo), the lack of correspondence also showed up in the bivariate table
showing the breakdown by cognitive class. Or to put it another way, the
results presented in the text using IQ as a continuous, normally distrib-
uted variable are produced as well when IQ is treated as a set of cate-
588
Appendix 3
Appendix 3
589
gories. Any exceptions to that may be identified through the bivariate
tables based on cognitive class,
RELATIONSHIP OF THE AFQT SCORE TO EDUCATION AND
PARENTAL SES
The relationship of an IQ test score to education and socioeconomic
background is a constant and to some extent unresolvable source of con-
troversy. It is known that the environment (including exposure to edu-
cation) affects realized cognitive ability. To that extent, it is
conceptually appropriate that parental SES and years of education show
an independent causal effect on IQ. O n the other hand, an IQ test score
is supposed to represent cognitive ability and to have an independent
reality of its own; in other words, it should not simply be a proxy mea-
sure of either parental SES or years of education. The following discus-
sion elaborates on the statistical relationship of both parental SES and
years of education to the AFQT score.
The Socioeconomic Status Index and the AFQT Score.
The SES index consists of four indicators as described in Appendix 2:
mother's and father's years of education, the occupational status of the
parent with the higher-status job, and the parents' total family income
in 1979-1980. The correlations of the index and its four constituent
variables with the AFQT are in the table below.
Intercorrelations of the AFQT and the Indicators in the
1
Socioeconomic Status Index
AFQT
Mother's education
.43
Father's education
.46
Occupational status
.43
Family income
.38
SES Index
.55
The correlation of AFQT with the SES index itself is .55, consistent
with other investigations of this topic.16
There are three broad interpretations of these correlations:
1. Test bias. IQ tests scores are artificially high for persons from high-
status backgrounds because the tests are biased in favor of people
from high-status homes.
2. Environmental advantage. IQ tends to be genuinely higher for chil-
dren from high-status homes, because they enjoy a more favorable
environment for realizing their cognitive ability than do children
from low-status homes.
3. Genetic advantage. IQ tends to be genuinely higher for children
from high-status homes because they enjoy a more favorable ge-
netic background (parental SES is a proxy measure for parental
IQ).
The first explanation is discussed in Appendix 5. The other two ex-
planations have been discussed at various points in the text (principally
Chapter 4's discussion of heritability, Chapter 10's discussion of parent-
ing styles, and Chapter 17's discussion of adoption). To summarize those
discussions, being brought up in a conspicuously high-status or low-
status family from birth probably has a significant effect on IQ, in-
dependent of the genetic endowment of the parents. The magnitude
of this effect is uncertain. Studies of adoption suggest that the average
is in the region of six IQ points, given the difference in the environ-
ments provided by adopting and natural parents. Outside interventions
to augment the environment have had only an inconsistent and un-
certain effect, although it remains possible that larger effects might be
possible for children from extremely deprived environments. In terms
of the topic of this appendix, the flexibility of the AFQT score, the
AFQT was given at ages 14-23, when the effect of socioeconomic back-
ground on IQ had already played whatever independent role it might
have.
Years of Education and the AFQT Score
For the AFQT as for other IQ tests, scores vary directly with educational
attainment, leaving aside for the moment the magnitude of reciprocal
cause and effect. But to what extent could we expect that, if we man-
aged to keep low-scoring students in school for another year or two, their
AFQT scores would have risen appreciably?
Chapter 17 laid out the general answer from a large body of research:
Systematic attempts to raise IQ through education (exemplified by
the Venezuelan experiment and the analyses of SAT coaching) can
Education and IQ Stability
- Parental socioeconomic status serves as a proxy for genetic background, which correlates with higher childhood IQ scores.
- Environmental factors, such as being raised in high-status homes, are estimated to contribute approximately six IQ points independent of genetics.
- Systematic educational interventions and coaching typically yield modest gains of about three IQ points, or 0.2 standard deviations.
- The benefits of intensive coaching appear to follow a law of diminishing marginal returns, where repeated efforts yield smaller incremental gains.
- The relationship between earlier IQ scores and later AFQT results is mediated by the intervening years of education and the age of the subject.
- Researchers utilize a model where earlier IQ affects both educational attainment and the final AFQT score to isolate the impact of schooling.
As far as anyone can tell, there are diminishing marginal benefits of this kind of coaching (taking three intensive SAT coaching programs in succession will raise a score by less than three times the original increment).
588
Appendix 3
Appendix 3
589
gories. Any exceptions to that may be identified through the bivariate
tables based on cognitive class,
RELATIONSHIP OF THE AFQT SCORE TO EDUCATION AND
PARENTAL SES
The relationship of an IQ test score to education and socioeconomic
background is a constant and to some extent unresolvable source of con-
troversy. It is known that the environment (including exposure to edu-
cation) affects realized cognitive ability. To that extent, it is
conceptually appropriate that parental SES and years of education show
an independent causal effect on IQ. O n the other hand, an IQ test score
is supposed to represent cognitive ability and to have an independent
reality of its own; in other words, it should not simply be a proxy mea-
sure of either parental SES or years of education. The following discus-
sion elaborates on the statistical relationship of both parental SES and
years of education to the AFQT score.
The Socioeconomic Status Index and the AFQT Score.
The SES index consists of four indicators as described in Appendix 2:
mother's and father's years of education, the occupational status of the
parent with the higher-status job, and the parents' total family income
in 1979-1980. The correlations of the index and its four constituent
variables with the AFQT are in the table below.
Intercorrelations of the AFQT and the Indicators in the
1
Socioeconomic Status Index
AFQT
Mother's education
.43
Father's education
.46
Occupational status
.43
Family income
.38
SES Index
.55
The correlation of AFQT with the SES index itself is .55, consistent
with other investigations of this topic.16
There are three broad interpretations of these correlations:
1. Test bias. IQ tests scores are artificially high for persons from high-
status backgrounds because the tests are biased in favor of people
from high-status homes.
2. Environmental advantage. IQ tends to be genuinely higher for chil-
dren from high-status homes, because they enjoy a more favorable
environment for realizing their cognitive ability than do children
from low-status homes.
3. Genetic advantage. IQ tends to be genuinely higher for children
from high-status homes because they enjoy a more favorable ge-
netic background (parental SES is a proxy measure for parental
IQ).
The first explanation is discussed in Appendix 5. The other two ex-
planations have been discussed at various points in the text (principally
Chapter 4's discussion of heritability, Chapter 10's discussion of parent-
ing styles, and Chapter 17's discussion of adoption). To summarize those
discussions, being brought up in a conspicuously high-status or low-
status family from birth probably has a significant effect on IQ, in-
dependent of the genetic endowment of the parents. The magnitude
of this effect is uncertain. Studies of adoption suggest that the average
is in the region of six IQ points, given the difference in the environ-
ments provided by adopting and natural parents. Outside interventions
to augment the environment have had only an inconsistent and un-
certain effect, although it remains possible that larger effects might be
possible for children from extremely deprived environments. In terms
of the topic of this appendix, the flexibility of the AFQT score, the
AFQT was given at ages 14-23, when the effect of socioeconomic back-
ground on IQ had already played whatever independent role it might
have.
Years of Education and the AFQT Score
For the AFQT as for other IQ tests, scores vary directly with educational
attainment, leaving aside for the moment the magnitude of reciprocal
cause and effect. But to what extent could we expect that, if we man-
aged to keep low-scoring students in school for another year or two, their
AFQT scores would have risen appreciably?
Chapter 17 laid out the general answer from a large body of research:
Systematic attempts to raise IQ through education (exemplified by
the Venezuelan experiment and the analyses of SAT coaching) can
590
Appendix 3
Appendix 3
5 9 1
indeed have an effect on the order of .2 standard deviation, or three IQ
points. As far as anyone can tell, there are diminishing marginal bene-
fits of this kind of coaching (taking three intensive SAT coaching pro-
grams in succession will raise a score by less than three times the original
increment).
We may explore the issue more directly by making use of the other
IQ scores obtained for members of the NLSY. Given scores that were
obtained several years earlier than the AFQT score, to what extent do
the intervening years of education appear to have elevated the AFQT!
Underlying the discussion is a simple model:
Earlier IQ
+ AFQT
score
score
Years of /I
education
The earlier IQ score affects both years of education and is a measure of
the same thing that AFQT measures. Meanwhile, the years of educa-
tion add something (we hypothesize) to the AFQT score that would not
otherwise have been added.
Actually testing the model means bringing in several complications,
however. The elapsed time between the earlier IQ test and the AFQT
test presumably affects the relationships. So does the age of the subject
(a subject who took the test at age 22 had a much different "chance" to
add years of education than did a subject who took the test at age 18,
for example). The age at which the earlier IQ test was taken is also rel-
evant, since IQ test scores are known to become more stable at around
the age of 6. But the main point of the exercise may be illustrated
straightforwardly. We will leave the elaboration to our colleagues.
The database consists of all NLSY students who had an earlier IQ test
score, as reported in the table on page 596, plus students with valid Stan-
ford-Binet and WISC scores (too few to report separately). We report
the results for two models in the table below, with the AFQT score as
the dependent variable in both cases. In the first model, the explana-
tory variables are the earlier IQ score, age at the first test, elapsed years
between the two tests, and type of test (entered as a vector of dummy
variables). In the second model, we add years of education as an inde-
pendent variable. An additional year of education is associated with a
gain of 2.3 centiles per year, in line with other analyses of the effects of
The Independent Effect of Education on AFQT Scores
as Inferred from Earlier IQ Tests
Dependent variable: AFQT percentile score
Independent Variables
Model 1
Model 2
Coefficient Std. Error Coefficient Std. Error
Intercept
12.303
1.653
-6.783
2.443
Earlier 1Q
percentile score
.787
.016
.753
,015
Elapsed years
between tests
-.316
.166
-1.005
.I73
Years of education
-
-
2.280
.221
Type of test (entered
as a vector of nominal
variables, coefficients
not shown.)
No. of observations
1,408
1,408
R' (Adjusted)
,659
.681
education on I Q . ~ ~
What happens if the dependent variable is expressed
in standardized scores rather than percentiles? In that case (using the
same independent variables), the independent effect of education is to
increase the AFQT score by .07 standard deviation, or the equivalent
of about one IQ point per year-also
in line with other analyses.
We caution against interpreting these coefficients literally across the
entire educational range. Whereas it may be reasonable to think about
IQ gains for six additional years of education when comparing subjects
who had no schooling versus those who reached sixth grade, or even
comparing those who dropped out in sixth grade and those who re-
mained through high school, interpreting these coefficients becomes
problematic when moving into post-high school education.
The negative coefficient for "elapsed years between tests" in the table
above is worth mentioning. Suppose that the true independent rela-
tionship between years of education and AFQT is negatively acceler-
ated-that
is, the causal importance of the elementary grades in
developing a person's IQ is greater than the causal role of, say, graduate
school. If so, then the more years of separation between tests, the lower
would be the true value of the dependent variable, AFQT, compared to
Education's Impact on IQ Scores
- Statistical models demonstrate that an additional year of education is associated with a gain of approximately 2.3 centiles or one IQ point.
- The independent effect of education remains significant even when controlling for earlier IQ scores, age, and time elapsed between tests.
- Researchers caution that the cognitive benefits of schooling may not be linear across all levels of education.
- Evidence suggests a 'negatively accelerated' relationship where elementary education has a greater causal impact on IQ than graduate-level studies.
- The analysis utilizes a nationally representative cross-sectional sample of whites to ensure statistical clarity and reliable standard error interpretation.
The causal importance of the elementary grades in developing a person's IQ is greater than the causal role of, say, graduate school.
590
Appendix 3
Appendix 3
5 9 1
indeed have an effect on the order of .2 standard deviation, or three IQ
points. As far as anyone can tell, there are diminishing marginal bene-
fits of this kind of coaching (taking three intensive SAT coaching pro-
grams in succession will raise a score by less than three times the original
increment).
We may explore the issue more directly by making use of the other
IQ scores obtained for members of the NLSY. Given scores that were
obtained several years earlier than the AFQT score, to what extent do
the intervening years of education appear to have elevated the AFQT!
Underlying the discussion is a simple model:
Earlier IQ
+ AFQT
score
score
Years of /I
education
The earlier IQ score affects both years of education and is a measure of
the same thing that AFQT measures. Meanwhile, the years of educa-
tion add something (we hypothesize) to the AFQT score that would not
otherwise have been added.
Actually testing the model means bringing in several complications,
however. The elapsed time between the earlier IQ test and the AFQT
test presumably affects the relationships. So does the age of the subject
(a subject who took the test at age 22 had a much different "chance" to
add years of education than did a subject who took the test at age 18,
for example). The age at which the earlier IQ test was taken is also rel-
evant, since IQ test scores are known to become more stable at around
the age of 6. But the main point of the exercise may be illustrated
straightforwardly. We will leave the elaboration to our colleagues.
The database consists of all NLSY students who had an earlier IQ test
score, as reported in the table on page 596, plus students with valid Stan-
ford-Binet and WISC scores (too few to report separately). We report
the results for two models in the table below, with the AFQT score as
the dependent variable in both cases. In the first model, the explana-
tory variables are the earlier IQ score, age at the first test, elapsed years
between the two tests, and type of test (entered as a vector of dummy
variables). In the second model, we add years of education as an inde-
pendent variable. An additional year of education is associated with a
gain of 2.3 centiles per year, in line with other analyses of the effects of
The Independent Effect of Education on AFQT Scores
as Inferred from Earlier IQ Tests
Dependent variable: AFQT percentile score
Independent Variables
Model 1
Model 2
Coefficient Std. Error Coefficient Std. Error
Intercept
12.303
1.653
-6.783
2.443
Earlier 1Q
percentile score
.787
.016
.753
,015
Elapsed years
between tests
-.316
.166
-1.005
.I73
Years of education
-
-
2.280
.221
Type of test (entered
as a vector of nominal
variables, coefficients
not shown.)
No. of observations
1,408
1,408
R' (Adjusted)
,659
.681
education on I Q . ~ ~
What happens if the dependent variable is expressed
in standardized scores rather than percentiles? In that case (using the
same independent variables), the independent effect of education is to
increase the AFQT score by .07 standard deviation, or the equivalent
of about one IQ point per year-also
in line with other analyses.
We caution against interpreting these coefficients literally across the
entire educational range. Whereas it may be reasonable to think about
IQ gains for six additional years of education when comparing subjects
who had no schooling versus those who reached sixth grade, or even
comparing those who dropped out in sixth grade and those who re-
mained through high school, interpreting these coefficients becomes
problematic when moving into post-high school education.
The negative coefficient for "elapsed years between tests" in the table
above is worth mentioning. Suppose that the true independent rela-
tionship between years of education and AFQT is negatively acceler-
ated-that
is, the causal importance of the elementary grades in
developing a person's IQ is greater than the causal role of, say, graduate
school. If so, then the more years of separation between tests, the lower
would be the true value of the dependent variable, AFQT, compared to
592
Appendix 3
the predicted value in a linear regression, because people with many
years of separation between tests in the sample are, on average, getting
less incremental benefit of years of education than the sample with just
a few years of separation. The observed results are consistent with this
hypothesis.
Regression Analyses from Part I1
This appendix presents the logistic regressions for the figures in Chap-
ters 5 through 12. In the text, the figures are based on regressions that
use the entire white sample in the NLSY and are calculated using sam-
ple weights. We use the entire sample and weights to take advanrage of
the NLSY's supplemental sample of low-income whites; in our judg-
ment, doing so provides the best available estimates of the relationships
we discuss. But interpreting standard errors and statistical significance
is greatly complicated when using sample weights. In the regression re-
sults that follow, we therefore restrict the analyses to the nationally rep-
resentative cross-sectional sample of whites. This procedure not only
enables direct interpretation of the standard errors but also provides the
raw material for interested readers to see how much difference there is
between the results from the entire white sample and the cross-sectional
sample (which you may do by computing the probabilities for the cross-
sectional sample and comparing them to the ones shown in the text fig-
ures). We have done so ourselves and can report that the differences are
so small that they are seldom visually evident.
By "whites," we mean all NLSY subjects who were identified as "non-
black, non-Hispanic" in the NLSY's raciallethnic cohort screening
(variable R2147, in the NLSY's documentation), deleting those who
identified themselves as being of American Indian, Asian, or Pacific de-
scent in the "first or only raciallethnic origin" item (R96).
In the text, we do not refer to the usual measure of goodness of fit
for multiple regressions, R2, but they are presented here for the cross-
sectional analyses. As the ratio of the explained sum of squares to the
total sum of squares, R2 is in this instance the square of the correlation
between the set of independent variables and the dependent variable
expressed as the logarithm of the odds ratio. Inasmuch as the values of
R2 range widely in the tables to follow, some mention of them is war-
ranted.
Statistical Methodology and Parameters
- The authors explain their decision to prioritize regression coefficients and p-values over R-squared values to determine statistical significance.
- R-squared values are noted to be sensitive to sample composition and data distribution, potentially masking strong relationships in noisy datasets.
- The analysis utilizes standardized scores (z-scores) for key independent variables including cognitive ability (AFQT), socioeconomic status (SES), and age.
- A linear logistic model is employed to calculate the probability of binary outcomes, such as whether an individual falls below the poverty line.
- Specific sub-samples are defined for the study, including a 'High School Sample' and a 'College Sample' based on precise years of education and degree types.
Even an inherently strong relationship can result in low values of R2 if the data points are bunched in various ways, and relatively noisy relationships can result in high values if the sample includes disproportionate numbers of outliers.
592
Appendix 3
the predicted value in a linear regression, because people with many
years of separation between tests in the sample are, on average, getting
less incremental benefit of years of education than the sample with just
a few years of separation. The observed results are consistent with this
hypothesis.
Regression Analyses from Part I1
This appendix presents the logistic regressions for the figures in Chap-
ters 5 through 12. In the text, the figures are based on regressions that
use the entire white sample in the NLSY and are calculated using sam-
ple weights. We use the entire sample and weights to take advanrage of
the NLSY's supplemental sample of low-income whites; in our judg-
ment, doing so provides the best available estimates of the relationships
we discuss. But interpreting standard errors and statistical significance
is greatly complicated when using sample weights. In the regression re-
sults that follow, we therefore restrict the analyses to the nationally rep-
resentative cross-sectional sample of whites. This procedure not only
enables direct interpretation of the standard errors but also provides the
raw material for interested readers to see how much difference there is
between the results from the entire white sample and the cross-sectional
sample (which you may do by computing the probabilities for the cross-
sectional sample and comparing them to the ones shown in the text fig-
ures). We have done so ourselves and can report that the differences are
so small that they are seldom visually evident.
By "whites," we mean all NLSY subjects who were identified as "non-
black, non-Hispanic" in the NLSY's raciallethnic cohort screening
(variable R2147, in the NLSY's documentation), deleting those who
identified themselves as being of American Indian, Asian, or Pacific de-
scent in the "first or only raciallethnic origin" item (R96).
In the text, we do not refer to the usual measure of goodness of fit
for multiple regressions, R2, but they are presented here for the cross-
sectional analyses. As the ratio of the explained sum of squares to the
total sum of squares, R2 is in this instance the square of the correlation
between the set of independent variables and the dependent variable
expressed as the logarithm of the odds ratio. Inasmuch as the values of
R2 range widely in the tables to follow, some mention of them is war-
ranted.
594
Appendix 4
Appendix 4
595
The size of R2 tells something about the strength of the logistic re-
lationship between the dependent variable and the set of independent
variables, but it also depends on the composition of the sample, as do
correlation coefficients in general. Even an inherently strong relation-
ship can result in low values of R2 if the data points are bunched in
various ways, and relatively noisy relationships can result in high val-
ues if the sample includes disproportionate numbers of outliers. For ex-
ample, one of the smallest R2 in the following analyses, only 0.17, is
for white men out of the labor force for four weeks or more in 1989.
Apart from the distributional properties of the data that produce this
low R ~ ,
a rough common-sense meaning to keep in mind is that the
vast majority of NLSY white men were in the labor force even though
they had low IQs or deprived socioeconomic backgrounds. But the pa-
rameter for zAFQT in that same equation is significant beyond the .001
level and large enough to make a big difference in the probability that
a white male would be out of the labor force. This illustrates why we
therefore consider the regression coefficients themselves (and their as-
sociated p values) to suit our analytic purposes better than R2, and that
is why those are the ones we relied on in the text.
The standard independent variables, described in Appendix 2, are
zAFQT89, the 1989 scoring of the AFQT; zSES, the socioeconomic
background of the NLSY subjects; and zAge, based on the age of the
NLSY subjects as of December 31, 1990. All are expressed as standard
scores with a mean of 0 and a standard deviation of 1.
All dependent variables are binary. The coefficients are parameter
estimates when the dependent variable = "yes." The linear logistic
model has the form
logit(p) = log(pl(1-p)) = a + P'x
where a is the intercept parameter and p is the vector of slope para-
meters for a vector of independent variables x. Take as an example the
first set of results presented subsequently, involving poverty. Sup-
pose you want to know the probability that a person is under the poverty
line in 1989 (Poverty = "Yes"), stipulating that the person in question
has an IQ (zAFQT) 1.5 standard deviations below the mean, socioeco-
nomic background (zSES) .3 standard deviation above the mean, and
is exactly of mean age. Using the parameters in the basic analysis for
poverty rounded to four decimal places, and a computationally conve-
nient re-expression of p, the probability is computed as follows:
The probability we set out to compute is 18.37 percent.
"The High School Sample" consists of those who received a high
school diploma through the normal route (not a GED) and reported ex-
actly twelve years of education as of the 1990 interview.
"The College Sample" consists of those who completed a bachelor's
degree and reported exactly sixteen years of education as of the 1990 in-
terview.
The software used for the analyses is JMP Version 3, by SAS Insti-
tute Inc. JMP treats nominal independent variables differently from
other major software packages such as SAS and SPSS. In those pack-
ages, a parameter for a nominal variable represents the difference be-
tween that level of the nominal variable and an omitted level serving
as a reference group. In JMP, a parameter represents the difference of a
given level from the average over all levels of the nominal variable. The
implied parameter for the remaining level is the negative sum of the
other levels (i.e., the parameters sum to zero over all the effect levels).
For example, suppose Race were heing used as a nominal variable, with
categories of Black, Latino, and White. In the JMP printout, the coef-
ficients would appear as
Race[Black-White]
X I
Race[Latino-White]
Xz
The order is determined by the alphabetical order of the categories.
In this case, the coefficient x, applies to blacks, x2 to Latinos. The
implied White coefficient is -l*(x, + xZ). In the case of a binary
independent variable such as Sex, the printout would show a single
line
Sex[Female-Male]
X I
which applies to females. The coefficient for Male equals -x,.
CHAPTER 5: POVERTY
DEPENDENT VARIABLE:
Under the official poverty line in 1989.
SAMPLE RESTRICTIONS: Excludes those who reported they were out of
the labor force because they were in school in either the 1989 or 1990
interviews.
Statistical Modeling of Poverty and Schooling
- The text explains the technical methodology for handling nominal variables in JMP software, where parameters represent deviations from the average of all levels.
- Statistical tables analyze the likelihood of being under the official poverty line in 1989 based on variables like AFQT scores, socioeconomic status (SES), and age.
- Data for college-educated individuals was omitted from the poverty analysis because only six persons in that cross-sectional sample were in poverty.
- The analysis differentiates between married mothers and those who are separated, divorced, or never married, showing varying impacts of SES on poverty status.
- A separate model examines high school dropout rates, finding that AFQT scores and SES are highly significant predictors of permanent withdrawal from school.
- The use of 'z-scores' for AFQT, SES, and Age suggests a standardized approach to comparing the relative influence of cognitive and environmental factors.
The implied parameter for the remaining level is the negative sum of the other levels (i.e., the parameters sum to zero over all the effect levels).
594
Appendix 4
Appendix 4
595
The size of R2 tells something about the strength of the logistic re-
lationship between the dependent variable and the set of independent
variables, but it also depends on the composition of the sample, as do
correlation coefficients in general. Even an inherently strong relation-
ship can result in low values of R2 if the data points are bunched in
various ways, and relatively noisy relationships can result in high val-
ues if the sample includes disproportionate numbers of outliers. For ex-
ample, one of the smallest R2 in the following analyses, only 0.17, is
for white men out of the labor force for four weeks or more in 1989.
Apart from the distributional properties of the data that produce this
low R ~ ,
a rough common-sense meaning to keep in mind is that the
vast majority of NLSY white men were in the labor force even though
they had low IQs or deprived socioeconomic backgrounds. But the pa-
rameter for zAFQT in that same equation is significant beyond the .001
level and large enough to make a big difference in the probability that
a white male would be out of the labor force. This illustrates why we
therefore consider the regression coefficients themselves (and their as-
sociated p values) to suit our analytic purposes better than R2, and that
is why those are the ones we relied on in the text.
The standard independent variables, described in Appendix 2, are
zAFQT89, the 1989 scoring of the AFQT; zSES, the socioeconomic
background of the NLSY subjects; and zAge, based on the age of the
NLSY subjects as of December 31, 1990. All are expressed as standard
scores with a mean of 0 and a standard deviation of 1.
All dependent variables are binary. The coefficients are parameter
estimates when the dependent variable = "yes." The linear logistic
model has the form
logit(p) = log(pl(1-p)) = a + P'x
where a is the intercept parameter and p is the vector of slope para-
meters for a vector of independent variables x. Take as an example the
first set of results presented subsequently, involving poverty. Sup-
pose you want to know the probability that a person is under the poverty
line in 1989 (Poverty = "Yes"), stipulating that the person in question
has an IQ (zAFQT) 1.5 standard deviations below the mean, socioeco-
nomic background (zSES) .3 standard deviation above the mean, and
is exactly of mean age. Using the parameters in the basic analysis for
poverty rounded to four decimal places, and a computationally conve-
nient re-expression of p, the probability is computed as follows:
The probability we set out to compute is 18.37 percent.
"The High School Sample" consists of those who received a high
school diploma through the normal route (not a GED) and reported ex-
actly twelve years of education as of the 1990 interview.
"The College Sample" consists of those who completed a bachelor's
degree and reported exactly sixteen years of education as of the 1990 in-
terview.
The software used for the analyses is JMP Version 3, by SAS Insti-
tute Inc. JMP treats nominal independent variables differently from
other major software packages such as SAS and SPSS. In those pack-
ages, a parameter for a nominal variable represents the difference be-
tween that level of the nominal variable and an omitted level serving
as a reference group. In JMP, a parameter represents the difference of a
given level from the average over all levels of the nominal variable. The
implied parameter for the remaining level is the negative sum of the
other levels (i.e., the parameters sum to zero over all the effect levels).
For example, suppose Race were heing used as a nominal variable, with
categories of Black, Latino, and White. In the JMP printout, the coef-
ficients would appear as
Race[Black-White]
X I
Race[Latino-White]
Xz
The order is determined by the alphabetical order of the categories.
In this case, the coefficient x, applies to blacks, x2 to Latinos. The
implied White coefficient is -l*(x, + xZ). In the case of a binary
independent variable such as Sex, the printout would show a single
line
Sex[Female-Male]
X I
which applies to females. The coefficient for Male equals -x,.
CHAPTER 5: POVERTY
DEPENDENT VARIABLE:
Under the official poverty line in 1989.
SAMPLE RESTRICTIONS: Excludes those who reported they were out of
the labor force because they were in school in either the 1989 or 1990
interviews.
596
Appendix 4
Appendix 4
5 9 7
Basic Analysis:
Whole-Model Test
Source
DF
-LogLikelihood
Chisquare
Proh>ChiSq
Model
3
90.94009
181.8802
0.000000
Error
3363
784.40179
C Total
3366
875.34188
RSquare (U)
0.1039
Observations
3367
Parameter Estimates
Term
Estimate
Std Error
Chisquare
Prob>ChiSq
Intercept
-2.6487288
0.0768803
1187
0.0000
zAFQT89
-0.8376338
0.0935061
80.25
0.0000
zSES
-0.3300720
0.0900996
13.42
0.0002
zAge
-0.0238375
0.0723735
0.11
0.7419
The High School Sampk:
Whole-Model Test
Source
DF
-LogLikelihood
Chisquare
Proh>ChiScl
Model
3
22.01811
44.03622
0.000000
Error
1232
325.26939
C Total
1235
347.28750
RSquare (U)
0.0634
Observations
1236
Parameter Estimates
Term
Estimate
Std Error
Chisquare
Prob>ChiSy
Intercept
-2.7237775
0.1290286
445.63
0.0000
zAFQT89
-0.8267293
0.1627358
25.81
0.0000
zSES
-0.361 9703
0.1499855
5.82
0.01 58
z Ag e
+O. 1049227
0.1094603
0.92
0.3378
The Colkge Sampk: Omitted. Only six persons in the cross-sectional
College Sample were in poverty.
For Mothers Married as of the 1989 Interview:
Whole-Model Test
Source
DF
-LogLikelihood
Chisquare
Proh>ChiSq
Model
3
17.14553
34.29106
0.000000
Error
786
179.84999
C Total
789
196.99552
RSquare (U)
0.0870
Observations
790
Parameter Estimates
Term
Estimate
Std Error
Chisquare
Prob>ChiSq
Intercept
-2.773281 7
0.1646023
283.87
0.0000
zAFQT89
-0.6437797
0.2140132
9.05
0.0026
zSES
-0.3910629
0.2020317
3.75
0.0529
zAge
-0.3338674
0.1587605
4.42
0.0355
For Mothers Who Were Separated, Divorced, or Never Married as of the
1989 Interview:
Whole-Model Test
Source
DF
-LogLikelihood
Chisquare
Prob>ChiSq
Model
3
8.07 1 14
16.14228
0.001060
Error
211
135.77658
C Total
2 14
143.84772
RSquare (U )
0.0561
Observations
2 15
Parameter Estimates
Term
Estimate
Std Error
Chisquare
ProbChiSq
Intercept
-0.7449132
0.1713794
18.89
0.0000
zAFQT89
-0.6722 12 1
0.2277019
8.72
0.0032
zSES
-0.1597461
0.1952709
0.67
0.4133
zAge
-0.15243 15
0.1530986
0.99
0.3194
CHAPTER 6: SCHOOLING
DEPENDENT VARIARLE:
Permanently dropped out of high school.
SAMPLE RESTRICTIONS: Excludes those who obtained a GED.
Basic Analysis:
Whole-Model Test
Source
DF
-LogLikelihood
Chisquare
Prob>ChiSq
Model
3
393.8978
787.7956
0.000000
Error
3568
779.9904
C Total
3571
1 173.8882
RSquare (U)
0.3355
Observations
3572
Parameter Estimates
Term
Estimate
Std Error
Chisquare
ProbChiSq
Intercept
-2.85322606
0.0939659
922.00
0.0000
zAFQT89
-1.72295934
0.1028145
280.83
0.0000
zSES
-0.64776232
0.0896658
52.19
0.0000
zAge
+0.05695640
0.0688286
0.68
0.4079
Statistical Analysis of Socioeconomic Outcomes
- The data presents logistic regression models analyzing the relationship between cognitive ability (AFQT), socioeconomic status (SES), and various life outcomes.
- Higher cognitive ability and socioeconomic status are both strongly correlated with a lower probability of receiving a GED instead of a high school diploma.
- The likelihood of obtaining a bachelor's degree is positively and significantly predicted by both AFQT scores and socioeconomic background.
- Labor force participation analysis indicates that lower AFQT scores are associated with being out of the labor force for extended periods.
- The interaction term between AFQT and SES is statistically significant in predicting certain educational paths, suggesting these factors do not act entirely independently.
- Age appears to be a negligible factor in most of these specific educational and labor models, often failing to reach statistical significance.
zAFQT89"zSES -0.4133224 0.1 187879 12.11 0.0005
598
Appendix 4
Appendix 4
599
Basic Analysis, Adding an Interaction Term for gAFQT and gSES:
Whole-Model Test
Source
DF
-LogLikelihood
Chisquare
Prob>ChiSq
Model
4
399.9876
799.975 1
0.000000
Error
3567
773.9006
C Total
3571
1 173.8882
RSquare (U)
0.3407
Observations
3572
Parameter Estimates
Term
Estimate
Std Error
Chisquare
Prob>ChiSq
Intercept
-2.9143231
0.1029462
801.41
0.0000
zAFQT89
-1.8937642
0.1188518
253.89
0.0000
zSES
-0.9402389
0.1250634
56.52
0.0000
zAge
+0.0522667
0.0682755
0.59
0.4440
zAFQT89"zSES
-0.4133224
0.1 187879
12.11
0.0005
DEPENDENT VARIABLE: Received a GED instead of a high school diploma.
SAMPLE RESTRICTIONS: Excludes those who obtained neither a high
school diploma nor a GED.
Basic Analysis:
Whole-Mode1 Test
Source
DF
-LogLikelihood
Chisquare
Prob>ChiSq
Model
3
72.06475
144.1295
0.000000
Error
3490
915.28145
C Total
3493
987.34620
RSquare (U)
0.0730
Observations
3494
Parameter Estimates
Term
Estimate
Std Error
Chisquare
Prob>ChiSq
Intercept
-2.3548461
0.0653867
1297
0.0000
zAFQT89
-0.4325254
0,0851 185
25.82
0.0000
zSES
-0,6082151
0.0837515
52.74
0.0000
zAge
-0.0416441
0.0662445
0.40
0.5296
DEPENDENT VARIABLE: Received a bachelor's degree.
SAMPLE RESTRICTIONS: Excludes those who had less than a bachelor's de-
gree and were in postsecondary education in either the 1989 or 1990
interview.
Basic Analysis:
Whole-Model Test
Source
DF
-LogLikelihood
Chisquare
Prob>ChiSq
Model
3
807.9072
1615.814
0.000000
Error
3817
1364.3417
C Total
3820
2172.2489
RSquare (U)
0.3719
Observations
3821
Parameter Estimates
Term
Estimate
Std Error
Chisquare
Prob>ChiSq
Intercept
-2.41992250
0.0786991
945.50
0.0000
zAFQT89
+1.80771403
0.0795537
516.34
0.0000
zSES
+1.048!8417
0.0690372
230.52
0.0000
zAge
-0.29777760
0.05 16373
33.25
0.0000
CHAPTER 7: UNEMPLOYMENT, IDLENESS, AND INJURY
DEPENDENT VARIABLE: Out of the labor force for four weeks or more in
1989.
SAMPLE RESTRICTIONS: Civilian males who did not respond "unable to
work" or "in school" to the question on labor force participation in
the 1989 or 1990 interview.
Basic Analysis:
Whole-Model Test
Source
DF
-LogLikelihood
Chisquare
Prob>ChiSq
Model
3
9.44293
18.88586
0.000289
Error
1682
548.25144
C Total
1685
557.69437
RSquare (U)
0.0169
Observations
1686
Parameter Estimates
Term
Estimate
Std Error
Chisquare
Prob>ChiSq
Intercept
-2.20264085
0.0868001
643.94
0.0000
zAFQT89
-0.36246881
0.0992802
13.33
0.0003
zSES
+0.21788340
0.1075722
4.10
0.0428
zAge
-0,12815393
0.0864018
2.20
0.1380
The High School Sample:
Whole-Model Test
Source
DF
-LogLikelihood
Chisquare
Prob>ChiSq
Model
3
4.45831
8.916625
0.030420
Error
617
156.98046
C Total
620
161.43878
RSquare (U)
0.0276
Observations
621
Parameter Estimates
Term
Estimate
Std Error
Chisquare
Prob>ChiSq
Intercept
-2.69780012
0.1767563
232.95
0.0000
zAFQT89
-0.4215 1253
0.2264362
3.47
0.0627
zSES
+0.56489480
0.230053
6.03
0.0141
zAge
-0.14556950
0.1672623
0.76
0.3841
600
Appendix 4
Appendix 4
60 1
The College Sample:
Whole-Model Test
Source
DF
-LogLikelihood
Chisquare
Prob>ChiSq
Model
3
6.794337
13.58867
0.003522
Error
264
56.536860
C Total
267
63.331 196
RSquare (U)
0.1073
Observations
268
Parameter Estimates
Term
Estimate
Std Error
Chisquare
Prob>ChiSq
Intercept
-3.1 2957075
0.6081 769
26.48
0.0000
zAFQT89
-0.84324247
0.4526768
3.47
0.0625
zSES
+0.94514750
0.3875388
5.95
0.0147
z Age
-0.46061574
0.299044
2.37
0.1235
DEPENDENT VARIABLE:
Unemployed for four weeks or more in 1989.
SAMPLE RESTRICTIONS: Civilian males who did not respond "unable to
work" or "in school" to the question on labor force participation in
the 1989 or 1990 interview and were in the labor force throughout
1989.
Basic Analysis:
Whole-Model Test
Source
DF
-LogLikelihood
Chisquare
Prob>ChiSq
Model
3
1 1.3084 1
22.61682
0.000049
Error
1393
348.7151 1
C Total
1396
360.02353
RSquare (U)
0.0314
Observations
1397
Parameter Estimates
Term
Estimate
Std Error
Chisquare
Prob>ChiSq
Intercept
-2.53577016
0.1076083
555.30
0.0000
zAFQT89
-0.49486463
0.1298967
14.5 1
0.0001
zSES
-0.02534849
0.1383889
0.03
0.8547
zAge
-0.02 181428
0.1108396
0.04
0.8440
The High School Sampk:
Whole-Model Test
Source
DF
-LogLikelihood
Chisquare
Prob>ChiSq
Model
3
1.86533
3.730657
0.292056
Error
533
140.49123
C Total
536
142.35656
RSquare (U)
0.0131
Observations
537
Parameter Estimates
Term
Estimate
Std Error
Chisquare
Intercept
-2.59878187
0.1766146
216.51
zAFQT89
-0.39353140
0.2368752
2.76
zSES
+0.1395 1940
0.2353179
0.35
zAge
-0.10510566
0.1762471
0.36
The College Sample:
Whole-Model Test
Source
DF
-LogLikelihood
Chisquare
Model
3
3.570096
7.140193
Error
224
40.506133
C Total
227
44.076230
RSquare (U)
0.0810
Observations
228
Parameter Estimates
Term
Estimate
Std Error
Chisquare
Intercept
-3.1686886
0.7276735
18.96
zAFQT89
-0.9 196886
0.5641635
2.66
zSES
+1.0039255
0.5015717
4.01
z Age
+0.2941965
0.33 11 174
0.79
CHAPTER 8: FAMILY MATTERS
DEPENDENT VARIARLE:
Ever married before the age of 30.
SAMPLE RESTRICTIONS: Persons who turned thirty by the 1990 interview.
Basic Analysis:
Whole-Model Test
Source
DF
-LogLikelihood
Chisquare
Prob>ChiSq
Model
3
6.43345
1 2.8669
0.004933
Error
1630
839.76747
C Total
1633
846.20092
RSquare (U)
0.0076
Observations
1634
Parameter Estimates
Term
Estimate
Std Error
Chisquare
Prob>ChiSq
Intercept
+l. 19841361
0.128902
86.44
0.0000
zAFQT89
-0.0473587
0.0757854
0.39
0.5320
zSES
-0.1905526
0.0786307
5.87
0.01 54
zAge
+0.20403379
0.1290545
2.50
0.1139
Statistical Analysis of Family Matters
- The text presents detailed statistical tables analyzing the relationship between cognitive ability (zAFQT89), socioeconomic status (zSES), and age on family-related outcomes.
- One primary dependent variable analyzed is whether an individual married before the age of 30, categorized by high school and college samples.
- Another key analysis focuses on the likelihood of divorce within the first five years of marriage, incorporating the date of first marriage as a control variable.
- The data utilizes Chi-square tests and parameter estimates to determine the significance of various predictors across different educational subgroups.
- Results show varying levels of statistical significance for AFQT scores and SES in predicting marital stability and timing.
- The tables are part of an appendix for 'Chapter 8: Family Matters,' providing the empirical foundation for sociological arguments regarding family structure.
DEPENDENT VARIABLE: Divorced within the first five years of marriage.
600
Appendix 4
Appendix 4
60 1
The College Sample:
Whole-Model Test
Source
DF
-LogLikelihood
Chisquare
Prob>ChiSq
Model
3
6.794337
13.58867
0.003522
Error
264
56.536860
C Total
267
63.331 196
RSquare (U)
0.1073
Observations
268
Parameter Estimates
Term
Estimate
Std Error
Chisquare
Prob>ChiSq
Intercept
-3.1 2957075
0.6081 769
26.48
0.0000
zAFQT89
-0.84324247
0.4526768
3.47
0.0625
zSES
+0.94514750
0.3875388
5.95
0.0147
z Age
-0.46061574
0.299044
2.37
0.1235
DEPENDENT VARIABLE:
Unemployed for four weeks or more in 1989.
SAMPLE RESTRICTIONS: Civilian males who did not respond "unable to
work" or "in school" to the question on labor force participation in
the 1989 or 1990 interview and were in the labor force throughout
1989.
Basic Analysis:
Whole-Model Test
Source
DF
-LogLikelihood
Chisquare
Prob>ChiSq
Model
3
1 1.3084 1
22.61682
0.000049
Error
1393
348.7151 1
C Total
1396
360.02353
RSquare (U)
0.0314
Observations
1397
Parameter Estimates
Term
Estimate
Std Error
Chisquare
Prob>ChiSq
Intercept
-2.53577016
0.1076083
555.30
0.0000
zAFQT89
-0.49486463
0.1298967
14.5 1
0.0001
zSES
-0.02534849
0.1383889
0.03
0.8547
zAge
-0.02 181428
0.1108396
0.04
0.8440
The High School Sampk:
Whole-Model Test
Source
DF
-LogLikelihood
Chisquare
Prob>ChiSq
Model
3
1.86533
3.730657
0.292056
Error
533
140.49123
C Total
536
142.35656
RSquare (U)
0.0131
Observations
537
Parameter Estimates
Term
Estimate
Std Error
Chisquare
Intercept
-2.59878187
0.1766146
216.51
zAFQT89
-0.39353140
0.2368752
2.76
zSES
+0.1395 1940
0.2353179
0.35
zAge
-0.10510566
0.1762471
0.36
The College Sample:
Whole-Model Test
Source
DF
-LogLikelihood
Chisquare
Model
3
3.570096
7.140193
Error
224
40.506133
C Total
227
44.076230
RSquare (U)
0.0810
Observations
228
Parameter Estimates
Term
Estimate
Std Error
Chisquare
Intercept
-3.1686886
0.7276735
18.96
zAFQT89
-0.9 196886
0.5641635
2.66
zSES
+1.0039255
0.5015717
4.01
z Age
+0.2941965
0.33 11 174
0.79
CHAPTER 8: FAMILY MATTERS
DEPENDENT VARIARLE:
Ever married before the age of 30.
SAMPLE RESTRICTIONS: Persons who turned thirty by the 1990 interview.
Basic Analysis:
Whole-Model Test
Source
DF
-LogLikelihood
Chisquare
Prob>ChiSq
Model
3
6.43345
1 2.8669
0.004933
Error
1630
839.76747
C Total
1633
846.20092
RSquare (U)
0.0076
Observations
1634
Parameter Estimates
Term
Estimate
Std Error
Chisquare
Prob>ChiSq
Intercept
+l. 19841361
0.128902
86.44
0.0000
zAFQT89
-0.0473587
0.0757854
0.39
0.5320
zSES
-0.1905526
0.0786307
5.87
0.01 54
zAge
+0.20403379
0.1290545
2.50
0.1139
602
Appendix 4
Appendix 4
603
The High School Sampk:
Whole-Model Test
Source
DF
-LogLikelihood
Chisquare
Model
3
6.9287 1
13.857
Error
60 1
259.40296
C Total
604
266.33168
RSquare (U)
0.0260
Observations
605
Parameter Estimates
Term
Estimate
Std Error
Chisquare
Intercept
+ 1.41494853
0.2342703
36.48
zAFQT89
+0.51424443
0.1598383
10.35
zSES
-0.1 128845
0.1582799
.51
z Ag e
+0.36827169
0.2422543
2.3 1
The College Sample:
Whole-Model Test
Source
DF
-LogLikelihood
ChiSquare
Model
3
0.17181
0.3436 16
Error
233
145.35748
C Total
236
145.52929
RSquare (U)
0.001 2
Observations
237
Parameter Estimates
Term
Estimate
Std Error
Chisquare
Intercept
+0.71372375
0.3946174
3.27
zAFQT89
+0.05013859
0.2237528
0.05
zSES
+0.0968295
0.1833680
0.28
z Ag e
-0.01 77807
0.2950863
0.00
DEPENDENT VARIABLE: Divorced within the first five years of marriage.
SAMPLE RESTRICTIONS: Persons married prior to January 1, 1986.
Basic Analysis, Adding Date of First Marriage (MarDate 1 ) :
Whole-Model Test
Source
DF
-LogLikelihood
Chisquare
Proh>ChiSq
Model
4
21.8881
43.77626
0.000000
Error
2026
991.3719
C Total
2030
1013.2600
RSquare (U)
0.02 16
Observations
203 1
Parameter Estimates
Term
Estimate
Std Error
Chisquare
Proh>ChiSq
Intercept
+5.70860970
1.9858067
8.26
0.0040
zAFQT89
-0.35734009
0.0781258
20.92
0.0000
zSES
+0.22195410
0.0787612
7.94
0.0048
zAge
-0.1 7766944
0.0741478
5.74
0.0166
MarDatel
-0.08677335
0.0243 11 3
12.74
0.0004
The High School Sample, Adding Date of First Marriage (MarDate1) :
Whole-Model Test
Source
DF
-LogLikelihood
Chisquare
Prob>ChiSq
Model
4
3.54304
7.086073
0.13 1409
Error
870
428.70643
C Total
874
432.24947
RSquare (U)
0.0082
Observations
875
Parameter Estimates
Term
Estimate
Std Error
Chisquare
Prob>ChiSq
Intercept
+5.445 1395
3.1286887
3.03
0.08 18
zAFQT89
-0.03791 71
0.1348129
0.08
0.7785
zSES
+0.2206925
0.1288222
2.93
0.0867
zAge
-0.1078057
0.1 146773
0.88
0.3472
MarDatel
-0.0839950
0.0383236
4.80
0.0284
The College Sample, Adding Date of First Marriage (MarDate 1 ) :
Whole-Model Test
Source
DF
-LogLikelihood
Chisquare
Prob>ChiSq
Model
4
5.548154
11.09631
0.025503
Error
204
48.414468
C Total
208
53.962623
RSquare (U)
0.1028
Observations
209
Parameter Estimates
Term
Estimate
Std Error
Chisquare Prob>ChiSq
Intercept
+32.392875
13.508886
5.75
0.0165
zAFQT89
-0.75619367
0.4502182
2.82
0.0930
zSES
-0.07354619
0.3588816
0.04
0.8376
z Age
-0.55875424
0.404691 1
1.91
0.1674
MarDate1
-0.41 113710
0.1629791
6.36
0.01 16
Basic analysis, Adding Parental Living Awangements at Age 14 (Adult 14) :
Whole-Model Test
Source
DF
-LogLikelihood
Chisquare
Prob>ChiSq
Model
6
16.7457
33.49136
0.000008
Error
2022
994.677 1
C Total
2028
101 1.4228
RSquare (U)
0.0166
Ohservations
2029
Statistical Analysis of Out-of-Wedlock Births
- The data presents logistic regression models analyzing the likelihood of first births occurring out of wedlock among different educational samples.
- Key independent variables include cognitive ability (zAFQT89), socioeconomic status (zSES), age, and family structure at age 14.
- In the 'Basic Analysis' and 'High School Sample,' cognitive ability (zAFQT89) shows a strong, statistically significant negative correlation with out-of-wedlock births.
- The 'College Sample' shows much lower statistical significance across most variables, likely due to the rarity of the dependent variable within that specific demographic.
- Living arrangements at age 14, specifically comparing biological parents to unmarried mothers, are introduced as significant predictors in the expanded models.
- The models utilize Chi-square tests and Log-Likelihood ratios to determine the overall fit and predictive power of the included demographic factors.
DEPENDENT VARIABLE: First birth out of wedlock.
602
Appendix 4
Appendix 4
603
The High School Sampk:
Whole-Model Test
Source
DF
-LogLikelihood
Chisquare
Model
3
6.9287 1
13.857
Error
60 1
259.40296
C Total
604
266.33168
RSquare (U)
0.0260
Observations
605
Parameter Estimates
Term
Estimate
Std Error
Chisquare
Intercept
+ 1.41494853
0.2342703
36.48
zAFQT89
+0.51424443
0.1598383
10.35
zSES
-0.1 128845
0.1582799
.51
z Ag e
+0.36827169
0.2422543
2.3 1
The College Sample:
Whole-Model Test
Source
DF
-LogLikelihood
ChiSquare
Model
3
0.17181
0.3436 16
Error
233
145.35748
C Total
236
145.52929
RSquare (U)
0.001 2
Observations
237
Parameter Estimates
Term
Estimate
Std Error
Chisquare
Intercept
+0.71372375
0.3946174
3.27
zAFQT89
+0.05013859
0.2237528
0.05
zSES
+0.0968295
0.1833680
0.28
z Ag e
-0.01 77807
0.2950863
0.00
DEPENDENT VARIABLE: Divorced within the first five years of marriage.
SAMPLE RESTRICTIONS: Persons married prior to January 1, 1986.
Basic Analysis, Adding Date of First Marriage (MarDate 1 ) :
Whole-Model Test
Source
DF
-LogLikelihood
Chisquare
Proh>ChiSq
Model
4
21.8881
43.77626
0.000000
Error
2026
991.3719
C Total
2030
1013.2600
RSquare (U)
0.02 16
Observations
203 1
Parameter Estimates
Term
Estimate
Std Error
Chisquare
Proh>ChiSq
Intercept
+5.70860970
1.9858067
8.26
0.0040
zAFQT89
-0.35734009
0.0781258
20.92
0.0000
zSES
+0.22195410
0.0787612
7.94
0.0048
zAge
-0.1 7766944
0.0741478
5.74
0.0166
MarDatel
-0.08677335
0.0243 11 3
12.74
0.0004
The High School Sample, Adding Date of First Marriage (MarDate1) :
Whole-Model Test
Source
DF
-LogLikelihood
Chisquare
Prob>ChiSq
Model
4
3.54304
7.086073
0.13 1409
Error
870
428.70643
C Total
874
432.24947
RSquare (U)
0.0082
Observations
875
Parameter Estimates
Term
Estimate
Std Error
Chisquare
Prob>ChiSq
Intercept
+5.445 1395
3.1286887
3.03
0.08 18
zAFQT89
-0.03791 71
0.1348129
0.08
0.7785
zSES
+0.2206925
0.1288222
2.93
0.0867
zAge
-0.1078057
0.1 146773
0.88
0.3472
MarDatel
-0.0839950
0.0383236
4.80
0.0284
The College Sample, Adding Date of First Marriage (MarDate 1 ) :
Whole-Model Test
Source
DF
-LogLikelihood
Chisquare
Prob>ChiSq
Model
4
5.548154
11.09631
0.025503
Error
204
48.414468
C Total
208
53.962623
RSquare (U)
0.1028
Observations
209
Parameter Estimates
Term
Estimate
Std Error
Chisquare Prob>ChiSq
Intercept
+32.392875
13.508886
5.75
0.0165
zAFQT89
-0.75619367
0.4502182
2.82
0.0930
zSES
-0.07354619
0.3588816
0.04
0.8376
z Age
-0.55875424
0.404691 1
1.91
0.1674
MarDate1
-0.41 113710
0.1629791
6.36
0.01 16
Basic analysis, Adding Parental Living Awangements at Age 14 (Adult 14) :
Whole-Model Test
Source
DF
-LogLikelihood
Chisquare
Prob>ChiSq
Model
6
16.7457
33.49136
0.000008
Error
2022
994.677 1
C Total
2028
101 1.4228
RSquare (U)
0.0166
Ohservations
2029
604
Appendix 4
Appendix 4
605
Term
Intercept
zAFQT89
zSES
zAge
Adult 14
[2 Rio-UnmarMom]
Adult14
[BioIStep-UnmarMom]
Adult14
[Other-UnmarMom]
Parameter Estimates
Estimate
Std Error ChiSquare
Proh>ChiSq
-1.2952650
0.1066175 147.59
0.0000
-0.3925580 0.0774209
25.7 1
0.0000
+0.1910425 0.0783345
5.95
0.0147
-0.0278086 0.0617722
0.20
0.6526
DEPENDENT VARIABLE: First birth out of wedlock.
SAMPLE RESTRICTIONS: Women with at least one child.
Basic Analysis:
Whole-Model Test
Source
DF
-LogLikelihood
Chisquare
Proh>ChiSq
Model
3
39.86862
79.73723
0.000000
Error
1217
461.90618
C Total
1220
501.77480
RSquare (U)
0.0795
Observations
122 1
Parameter Estimates
Term
Estimate
Std Error
Chisquare
Proh>ChiSq
Intercept
-1.9432320
0.0938185
429.01
0.0000
zAFQT89
-0.6537960
0.1239489
27.82
0.0000
zSES
-0.3052597
0.1 189878
6.58
0.0103
zAge
-0.2405246
0.0902516
7.10
0.0077
The High School Sample:
Whole-Model Test
Source
DF
-LogLikelihood
Chisquare
Prob>ChiSq
Model
3
15.09449
30.18898
0.000001
Error
512
187.89956
C Total
5 15
202.99405
RSquare (U)
0.0744
Observations
516
Parameter Estimates
Term
Estimate
Std Error
Chisquare
Prob>ChiSq
Intercept
-2.1890354
0.1658602
174.19
0.0000
zAFQT89
-0.7846895
0.2142378
13.42
0.0002
zSES
-0.2428727
0.2 165927
1.26
0.262 1
z Ag e
-0.4145066
0.1447961
8.20
0.0042
The College Sample:
Whole-Model Test
Source
DF
-LogLikelihood
Chisquare
Proh>ChiSq
Model
3
1.1 299340
2.259868
0.520253
Error
112
4.6193334
C Total
115
5.7492674
RSquare (U)
0.1965
Observations
116
Parameter Estimates
Term
Estimate
Std Error
Chisquare
Prob>ChiSq
Intercept
-6.37685240
3.9705049
2.58
0.1083
zAFQT89
-0.3 1644570
1.9844225
0.03
0.8733
zSES
-0.72608390
1.5248314
0.23
0.6340
zAge
+2.58214793
2.8423709
0.83
0.3636
Basic analysis, add in^ Living Arrangements with Adults at Age 14
(Adult1 4) :
Whole-Model Test
Source
DF
-LogLikelihood
Chisquare
Prob>ChiSq
Model
6
46.62389
93.24777
0.000000
Error
1214
455.15091
C Total
1220
501.77480
RSquare (U)
0.0929
Observations
1221
Parameter Estimates
Term
Estimate
Std Error Chisquare
Prob>ChiSq
Intercept
-1.8260275
0.1541482
140.33
0.0000
zAFQT89
-0.6620720
0.1259903
27.61
0.0000
zSES
-0.2460336 0.1221771
4.06
0.0440
zAge
-0.2109268 0.0909302
5.38
0.0204
Adult 14
[2 Bio-UnmarMom]
-0.281 6545 0.1634249
2.97
0.0848
Adult14
[Bio/Step-UnmarMom] +0.2928507 0.206926
2.00
0.1570
Adult14
[Other-UnmarMom]
-0.4991 684 0.3593261
1.93
0.1648
Basic analysis, Adding Presence of Biological Parents at Age 14 ( I4Bio) :
Whole-Model Test
Source
DF
-LogLikelihood
Chisquare
Prob>ChiSq
Model
6
47.56391
95.12783
0.000000
Error
1214
454.21088
C Total
1220
501.77480
RSquare (U)
0.0948
Observations
1221
606
Appendix 4
Appendix 4
607
Parameter Estimates
Term
Estimate
Std Error Chisquare
Intercept
-2.0199123
0.2037839
98.25
zAFQT89
-0.6567746 0.1250691
27.58
zSES
-0.2479794
0.1214895
4.17
zAge
-0.2037178 0.0910296
5.01
14Bio
[MomOnly-PopOnly] +0.6528652 0.2233927
8.54
14Bio
[Mom/Pop-PopOnly] -0.0862208
0.2 102335
0.17
14Bio[Neither-PopOnly] -0.237 123 1 0.4150982
0.33
Basic Analysis, Adding Poverty Status in the Calendar Year Prior to Birth
(PreBirthPov) :
Whole-Model Test
Source
DF
-LogLikelihood
Chisquare
Proh>ChiSq
Model
4
63.21 118
126.4224
0.000000
Error
956
292.73717
C Total
960
355.94835
RSquare (U)
0.1776
Observations
96 1
Parameter Estimates
Term
Estimate
Std Error
Chisquare
Proh>ChiSq
Intercept
-1.6785743
0.1460018
132.18
0.0000
zAFQT89
-0.6300049
0.1665952
14.30
0.0002
zSES
-0.1828877
0.15 13393
1.46
0.2269
zAge
-0.4759393
0.127232
13.99
0.0002
PreBirthPov
[No-Yes]
-0.8 178684
0.1266496
41.70
0.0000
Basic Analysis, Restricted to Women Below the Poverty Line in the Calen-
dar Year Prior to Birth:
Whole-Model Test
Source
DF
-LogLikelihood
Chisquare
Proh>ChiSq
Model
3
3.005867
6.011735
0.111041
Error
95
65.003329
C Total
98
68.009 196
RSquare (U)
0.0442
Observations
99
Parameter Estimates
Term
Estimate
Std Error
Chisquare
Proh>ChiSq
Intercept
-0.65306390
0.2901964
5.06
0.0244
zAFQT89
-0.76887410
0.3453889
4.96
0.0260
zSES
+0.17993445
0.2589166
0.48
0.487 1
z Age
-0.13622880
0.2289764
0.35
0.5519
CHAPTER 9: WELFARE DEPENDENCY
DEPENDENT VARIARLE:
On welfare by the first calendar year after the birth
of the child.
SAMPLE RESTRICTIONS:
Women with at least one child born prior to Jan-
uary 1, 1989.
Basic Analysis, Adding Poverty Status in the Year Prior to Birth (PreBirth-
Pow) and Marital Status at the Time of the Birth (BStatus) :
Whole-Model Test
Source
DF
-LogLikelihood
Chisquare
Prob>ChiSq
Model
5
100.37993
200.7599
Error
833
221.75844
C Total
838
322.13837
RSquare (U)
0.31 16
Observations
839
Parameter Estimates
Term
Estimate
Std Error
Chisquare
Intercept
-1.03594055
0.1713324
36.56
zAFQT89
-0.5 7972844
0.1892548
9.38
zSES
-0.06130137
0.1746782
0.12
zAge
-0.1 1269946
0.1457313
0.60
PreRirthPov
[No-Yes]
-0.89960808
0.1446041
38.70
RStatus
[lllegit-Legit] + 1.05258560
0.1352006
60.61
The High School Sample, Adding Poverty Status in the Year Prior to Birth
(PreBirthPov) and Marital Status at the Erne of the Birth (BStatus):
Whole-Model Test
Source
DF
-LogLikelihood
Chisquare
Prob>ChiSq
Model
5
29.28354
58.56707
0.000000
Error
3 84
108.14153
C Total
389
137.42507
RSquare (U)
0.2131
Observations
390
Parameter Estimates
Term
Estimate
Std Error
Chisquare
Prob>ChiSq
Intercept
-1.44234110
0.2659616
29.41
0.0000
zAFQT89
-0.6073 5910
0.3004261
4.09
0.0432
zSES
+0.12094082
0.3096641
0.15
0.6961
zAge
-0.24139690
0.2089849
1.33
0.2481
Statistical Models of Welfare Dependency
- The data examines welfare dependency among women based on factors like cognitive ability (AFQT scores), socioeconomic status (SES), and age.
- A significant predictor of welfare receipt is whether the mother was living in poverty in the calendar year prior to the child's birth.
- Marital status at the time of birth (legitimate vs. illegitimate) shows a strong statistical correlation with subsequent welfare dependency.
- The 'College Sample' was omitted from certain analyses because it included no women who received AFDC benefits within a year of giving birth.
- Long-term welfare dependency (five years or more) is analyzed as a distinct dependent variable compared to women with no welfare experience.
The College Sample: Omitted. Included no women who had received Aid to Families with Dependent Children (AFDC) within a year after the birth.
606
Appendix 4
Appendix 4
607
Parameter Estimates
Term
Estimate
Std Error Chisquare
Intercept
-2.0199123
0.2037839
98.25
zAFQT89
-0.6567746 0.1250691
27.58
zSES
-0.2479794
0.1214895
4.17
zAge
-0.2037178 0.0910296
5.01
14Bio
[MomOnly-PopOnly] +0.6528652 0.2233927
8.54
14Bio
[Mom/Pop-PopOnly] -0.0862208
0.2 102335
0.17
14Bio[Neither-PopOnly] -0.237 123 1 0.4150982
0.33
Basic Analysis, Adding Poverty Status in the Calendar Year Prior to Birth
(PreBirthPov) :
Whole-Model Test
Source
DF
-LogLikelihood
Chisquare
Proh>ChiSq
Model
4
63.21 118
126.4224
0.000000
Error
956
292.73717
C Total
960
355.94835
RSquare (U)
0.1776
Observations
96 1
Parameter Estimates
Term
Estimate
Std Error
Chisquare
Proh>ChiSq
Intercept
-1.6785743
0.1460018
132.18
0.0000
zAFQT89
-0.6300049
0.1665952
14.30
0.0002
zSES
-0.1828877
0.15 13393
1.46
0.2269
zAge
-0.4759393
0.127232
13.99
0.0002
PreBirthPov
[No-Yes]
-0.8 178684
0.1266496
41.70
0.0000
Basic Analysis, Restricted to Women Below the Poverty Line in the Calen-
dar Year Prior to Birth:
Whole-Model Test
Source
DF
-LogLikelihood
Chisquare
Proh>ChiSq
Model
3
3.005867
6.011735
0.111041
Error
95
65.003329
C Total
98
68.009 196
RSquare (U)
0.0442
Observations
99
Parameter Estimates
Term
Estimate
Std Error
Chisquare
Proh>ChiSq
Intercept
-0.65306390
0.2901964
5.06
0.0244
zAFQT89
-0.76887410
0.3453889
4.96
0.0260
zSES
+0.17993445
0.2589166
0.48
0.487 1
z Age
-0.13622880
0.2289764
0.35
0.5519
CHAPTER 9: WELFARE DEPENDENCY
DEPENDENT VARIARLE:
On welfare by the first calendar year after the birth
of the child.
SAMPLE RESTRICTIONS:
Women with at least one child born prior to Jan-
uary 1, 1989.
Basic Analysis, Adding Poverty Status in the Year Prior to Birth (PreBirth-
Pow) and Marital Status at the Time of the Birth (BStatus) :
Whole-Model Test
Source
DF
-LogLikelihood
Chisquare
Prob>ChiSq
Model
5
100.37993
200.7599
Error
833
221.75844
C Total
838
322.13837
RSquare (U)
0.31 16
Observations
839
Parameter Estimates
Term
Estimate
Std Error
Chisquare
Intercept
-1.03594055
0.1713324
36.56
zAFQT89
-0.5 7972844
0.1892548
9.38
zSES
-0.06130137
0.1746782
0.12
zAge
-0.1 1269946
0.1457313
0.60
PreRirthPov
[No-Yes]
-0.89960808
0.1446041
38.70
RStatus
[lllegit-Legit] + 1.05258560
0.1352006
60.61
The High School Sample, Adding Poverty Status in the Year Prior to Birth
(PreBirthPov) and Marital Status at the Erne of the Birth (BStatus):
Whole-Model Test
Source
DF
-LogLikelihood
Chisquare
Prob>ChiSq
Model
5
29.28354
58.56707
0.000000
Error
3 84
108.14153
C Total
389
137.42507
RSquare (U)
0.2131
Observations
390
Parameter Estimates
Term
Estimate
Std Error
Chisquare
Prob>ChiSq
Intercept
-1.44234110
0.2659616
29.41
0.0000
zAFQT89
-0.6073 5910
0.3004261
4.09
0.0432
zSES
+0.12094082
0.3096641
0.15
0.6961
zAge
-0.24139690
0.2089849
1.33
0.2481
608
Appendix 4
Appendix 4
609
PreBirthPov
[No-Yes]
-0.67898980
0.223275
9.25
0.0024
BStatus
[Illegit-Legit] +0.80812194
0.2058033
15.42
0.000 1
The College Sample: Omitted. Included no women who had received
Aid to Families with Dependent Children (AFDC) within a year after
the birth.
DEPENDENT VARIABLE: O n welfare for at least five years versus women
with no welfare experience at all.
SAMPLE RESTRICTIONS: Women with at least one child born prior to Jan-
uary 1, 1986. For women scored as "no welfare," child born after De-
cember 3 1, 1977 and complete data on welfare receipt from 1978 to
1986.
Basic Analysis, Adding Poverty Status in the Year Prior to Birth
(PreBirthPov) and Marital Status at the Time of the Birth (BStatus):
Whole-Model Test
Source
DF
-LogLikelihood
Chisquare
Prob>ChiSq
Model
5
44.82635
89.65269
0.000000
Error
493
96.901 56
C Total
498
141.72790
RSquare (U)
0.3 163
Observations
499
Parameter Estimates
Term
Estimate
Std Error
Chisquare
Proh>ChiSq
Intercept
-1.5840878
0.2826002
3 1.42
0.0000
zAFQT89
-0.5506878
0.2950687
3.48
0.0620
zSES
-0.4921959
0.2779368
3.14
0.0766
zAge
-0.1094338
0.2276355
0.23
0.6307
PreBirthPov
[No-Yes]
-0.7636358
0.2336359
10.68
0.001 1
BStatus
[Illegit-Legit] +1.195 1879
0.205013
33.99
0.0000
The High School Sample, Adding Poverty Status in the Year Pricrr to Birth
(PreBirthPov) and Marital Status at the T m e of the Birth (BStatus) :
Whole-Model Test
Source
DF
-LogLikelihood
Chisquare
Proh>ChiSq
Model
5
13.898589
27.79718
0.000040
Error
25 1
48.695997
C Total
256
62.594585
RSquare (U)
0.2220
Observations
257
Parameter Estimates
Term
Estimate
Std Error
Chisquare Prob>ChiSq
Intercept
-1.7786656
0.3901684
20.78
0.0000
zAFQT89
-0.2301309
0.44293 17
0.27
0.6034
zSES
-0.3131157
0.4832739
0.42
0.5 170
zAge
-0.0377430
0.3173131
0.01
0.9053
PreBirthPov
[No-Yes]
-0.6891978
0.335585 1
4.22
0.0400
BStatus
[Illegit-Legit] +1.1068557
0.307595
12.95
0.0003
The College Sample: Omitted. The cross-sectional College Sample included
no women who were on chronic welfare within a year after the birth.
CHAPTER 10: PARENTING
DEPENDENT VARIABLE:
Did the mother smoke during pregnancy?
SAMPLE RESTRICTIONS: None.
Basic Analysis :
Whole-Model Test
Source
DF
-LogLikelihood
Chisquare
ProhChiSq
Model
3
84.6762
169.35 23
0.000000
Error
2338
1443.8251
C Total
2341
1528.5013
RSquare (U)
0.0554
Observations
2342
Parameter Estimates
Term
Estimate
Std Error
Chisquare
Proh>ChiSq
Intercept
-0.65729780
0.0465003
199.81
0.0000
zAFQT89
-0.63479220
0.0645408
96.74
0.0000
zSES
-0.13376440
0.0604787
4.89
0.0270
zAge
+0.09727632
0.0484283
4.03
0.0446
DEPENDENT VARIABLE: Low birth weight (weight less than 5.5 pounds at
birth).
SAMPLE RESTRICTIONS: Excludes premature babies whose weight was less
than 5.5 lbs. but was appropriate for gestational age.
Basic Analysis:
Whole-Model Test
Source
DF
-LogLikelihood
Chisquare
Prob>ChiSq
Model
3
6.55199
13.10397
0.004417
Error
2273
349.79375
C Total
2276
356.34574
RSquare (U)
0.0184
Observations
2277
Statistical Analysis of Parenting Outcomes
- The data examines the relationship between cognitive ability (AFQT scores), socioeconomic status, and maternal behaviors such as smoking during pregnancy.
- Statistical models show that higher AFQT scores are significantly correlated with a lower likelihood of smoking during pregnancy and lower incidences of low birth weight.
- The analysis includes controls for poverty status prior to birth and marital status at the time of birth to isolate the impact of cognitive ability.
- A 'College Sample' was omitted from certain chronic welfare analyses because it contained no women who met the criteria for that specific dependent variable.
- The findings suggest that maternal age and socioeconomic status often have less statistical significance than cognitive ability in predicting certain birth outcomes.
The cross-sectional College Sample included no women who were on chronic welfare within a year after the birth.
608
Appendix 4
Appendix 4
609
PreBirthPov
[No-Yes]
-0.67898980
0.223275
9.25
0.0024
BStatus
[Illegit-Legit] +0.80812194
0.2058033
15.42
0.000 1
The College Sample: Omitted. Included no women who had received
Aid to Families with Dependent Children (AFDC) within a year after
the birth.
DEPENDENT VARIABLE: O n welfare for at least five years versus women
with no welfare experience at all.
SAMPLE RESTRICTIONS: Women with at least one child born prior to Jan-
uary 1, 1986. For women scored as "no welfare," child born after De-
cember 3 1, 1977 and complete data on welfare receipt from 1978 to
1986.
Basic Analysis, Adding Poverty Status in the Year Prior to Birth
(PreBirthPov) and Marital Status at the Time of the Birth (BStatus):
Whole-Model Test
Source
DF
-LogLikelihood
Chisquare
Prob>ChiSq
Model
5
44.82635
89.65269
0.000000
Error
493
96.901 56
C Total
498
141.72790
RSquare (U)
0.3 163
Observations
499
Parameter Estimates
Term
Estimate
Std Error
Chisquare
Proh>ChiSq
Intercept
-1.5840878
0.2826002
3 1.42
0.0000
zAFQT89
-0.5506878
0.2950687
3.48
0.0620
zSES
-0.4921959
0.2779368
3.14
0.0766
zAge
-0.1094338
0.2276355
0.23
0.6307
PreBirthPov
[No-Yes]
-0.7636358
0.2336359
10.68
0.001 1
BStatus
[Illegit-Legit] +1.195 1879
0.205013
33.99
0.0000
The High School Sample, Adding Poverty Status in the Year Pricrr to Birth
(PreBirthPov) and Marital Status at the T m e of the Birth (BStatus) :
Whole-Model Test
Source
DF
-LogLikelihood
Chisquare
Proh>ChiSq
Model
5
13.898589
27.79718
0.000040
Error
25 1
48.695997
C Total
256
62.594585
RSquare (U)
0.2220
Observations
257
Parameter Estimates
Term
Estimate
Std Error
Chisquare Prob>ChiSq
Intercept
-1.7786656
0.3901684
20.78
0.0000
zAFQT89
-0.2301309
0.44293 17
0.27
0.6034
zSES
-0.3131157
0.4832739
0.42
0.5 170
zAge
-0.0377430
0.3173131
0.01
0.9053
PreBirthPov
[No-Yes]
-0.6891978
0.335585 1
4.22
0.0400
BStatus
[Illegit-Legit] +1.1068557
0.307595
12.95
0.0003
The College Sample: Omitted. The cross-sectional College Sample included
no women who were on chronic welfare within a year after the birth.
CHAPTER 10: PARENTING
DEPENDENT VARIABLE:
Did the mother smoke during pregnancy?
SAMPLE RESTRICTIONS: None.
Basic Analysis :
Whole-Model Test
Source
DF
-LogLikelihood
Chisquare
ProhChiSq
Model
3
84.6762
169.35 23
0.000000
Error
2338
1443.8251
C Total
2341
1528.5013
RSquare (U)
0.0554
Observations
2342
Parameter Estimates
Term
Estimate
Std Error
Chisquare
Proh>ChiSq
Intercept
-0.65729780
0.0465003
199.81
0.0000
zAFQT89
-0.63479220
0.0645408
96.74
0.0000
zSES
-0.13376440
0.0604787
4.89
0.0270
zAge
+0.09727632
0.0484283
4.03
0.0446
DEPENDENT VARIABLE: Low birth weight (weight less than 5.5 pounds at
birth).
SAMPLE RESTRICTIONS: Excludes premature babies whose weight was less
than 5.5 lbs. but was appropriate for gestational age.
Basic Analysis:
Whole-Model Test
Source
DF
-LogLikelihood
Chisquare
Prob>ChiSq
Model
3
6.55199
13.10397
0.004417
Error
2273
349.79375
C Total
2276
356.34574
RSquare (U)
0.0184
Observations
2277
6 10
Appendix 4
Appendix 4
6 1 1
Parameter Estimates
Term
Estimate
Std Error
Chisquare
Prob>ChiSq
Intercept
-3.40600010
0.1270004
719.25
0.0000
zAFQT89
-0.443081 70
0.1496847
8.76
0.003 1
zSES
+0.033 12669
0.1492929
0.05
0.8244
zAge
+0.26896236
0.1 226929
4.81
0.0284
Basic Analysis, Adding Poverty Status in the Year Prior to Birth (PreBirth-
Pov) :
Whole-Model Test
Source
DF
-LogLikelihood
Chisquare
ProbBChiSq
Model
4
9.09299
18.18599
0.001135
Error
1859
298.98002
C Total
1863
308.07301
RSquare (U)
0.0295
Observations
1864
Parameter Estimates
Term
Estimate
Std Error
Chisquare
Prob>ChiSq
Intercept
-3.12509860
0.16455
360.69
0.0000
zAFQT89
-0.45583800
0.1674174
7.41
0.0065
zSES
+0.02995737
0.1628609
0.03
0.8541
z Ag e
+0.34292817
0.1342861
6.52
0.0 107
PreBirthPov
[No-Yes]
-0.28644950
0.15725
3.32
0.0685
Basic Analysis, Adding Mother's Age at Birth (AgeBirth) :
Whole-Model Test
Source
DF
-LogLikelihood
Chisquare
Prob>ChiSq
Model
4
6.77955
13.55909
0.008844
Error
2272
349.56619
C Total
2276
356.34574
RSquare (U)
0.0 190
Observations
2277
Parameter Estimates
Term
Estimate
Std Error
Chisquare
Prob>ChiSq
Intercept
-3.90965790
0.761 75 14
26.34
0.0000
zAFQT89
-0.46251520
0.1522804
9.22
0.0024
zSES
+0.01584480
0.15 17047
0.01
0.9 168
zAge
+0.25360789
0.1252257
4.10
0.0428
AgeBirth
+0.02095854
0.03 1 1 104
0.45
0.5005
The High School Sample:
Whole-Model Test
Source
DF
-LogLikelihood
Chisquare
Prob>ChiSq
Model
3
1.96999
3.93998
0.268019
Error
944
179.09080
C Total
947
18 1.06079
RSquare (U)
0.0109
Observations
948
Parameter Estimates:
Term
Estimate
Std Error
ChiSquare
ProbBChiSq
Intercept
-3.1278597
0.1 778908
309.16
0.0000
zAFQT89
-0.3 5603 19
0.2387034
2.22
0.1358
zSES
+0.065365 1
0.2379847
0.08
0.7836
zAge
+0.2490558
0.1681270
2.19
0.1385
The College Sample: Omitted. The cross-sectional College Sample
included only four low-birth-weight babies.
DEPENDENT VARIABLE: The child's mother was under the poverty line
throughout the child's first three years of life.
SAMPLE RESTRICTIONS: Includes children born from January 1, 1978
through December 31, 1987, with complete data on poverty for the
first three years of the child's life, beginning with the calendar year
of birth. Comparison group consists of children of mothers who were
not in poverty in any of those years.
Basic Analysis:
Whole-Model Test
Source
DF
-LogLikelihood
Chisquare
Prob>ChiSq
Model
3
79.84242
159.6848
0.000000
Error
1054
246.63029
C Total
1057
326.47271
RSquare (U)
0.2446
Observations
1058
Parameter Estimates
Term
Estimate
Std Error
Chisquare
Prob>ChiSq
Intercept
-2.93 193 16
0.1679177
304.87
0.0000
zAFQT89
-1.1608860
0.1893877
37.57
0.0000
zSES
-1.0386253
0.1734586
35.85
0.0000
z Ag e
-0.1837537
0.1320334
1.94
0.1640
Statistical Analysis of Poverty Predictors
- The data examines the likelihood of a mother remaining below the poverty line during a child's first three years of life based on cognitive and socioeconomic factors.
- Statistical models utilize z-scores for AFQT (Armed Forces Qualification Test) and SES (Socioeconomic Status) as primary independent variables.
- A significant correlation is observed between prior poverty status (PreBirthPov) and continued poverty, with the model's RSquare value increasing from 0.24 to 0.45 when this variable is added.
- The 'College Sample' was omitted from certain analyses because only one child in that demographic met the criteria for persistent poverty.
- The HOME index score, which measures the quality of a child's home environment, is analyzed as a dependent variable to determine the impact of maternal intelligence and economic status.
- AFDC (welfare) status is introduced in the final models as a control variable to assess its relationship with home environment quality.
The College Sample: Omitted. The cross-sectional College Sample included only one child whose mother was beneath the poverty line throughout the first three years.
6 10
Appendix 4
Appendix 4
6 1 1
Parameter Estimates
Term
Estimate
Std Error
Chisquare
Prob>ChiSq
Intercept
-3.40600010
0.1270004
719.25
0.0000
zAFQT89
-0.443081 70
0.1496847
8.76
0.003 1
zSES
+0.033 12669
0.1492929
0.05
0.8244
zAge
+0.26896236
0.1 226929
4.81
0.0284
Basic Analysis, Adding Poverty Status in the Year Prior to Birth (PreBirth-
Pov) :
Whole-Model Test
Source
DF
-LogLikelihood
Chisquare
ProbBChiSq
Model
4
9.09299
18.18599
0.001135
Error
1859
298.98002
C Total
1863
308.07301
RSquare (U)
0.0295
Observations
1864
Parameter Estimates
Term
Estimate
Std Error
Chisquare
Prob>ChiSq
Intercept
-3.12509860
0.16455
360.69
0.0000
zAFQT89
-0.45583800
0.1674174
7.41
0.0065
zSES
+0.02995737
0.1628609
0.03
0.8541
z Ag e
+0.34292817
0.1342861
6.52
0.0 107
PreBirthPov
[No-Yes]
-0.28644950
0.15725
3.32
0.0685
Basic Analysis, Adding Mother's Age at Birth (AgeBirth) :
Whole-Model Test
Source
DF
-LogLikelihood
Chisquare
Prob>ChiSq
Model
4
6.77955
13.55909
0.008844
Error
2272
349.56619
C Total
2276
356.34574
RSquare (U)
0.0 190
Observations
2277
Parameter Estimates
Term
Estimate
Std Error
Chisquare
Prob>ChiSq
Intercept
-3.90965790
0.761 75 14
26.34
0.0000
zAFQT89
-0.46251520
0.1522804
9.22
0.0024
zSES
+0.01584480
0.15 17047
0.01
0.9 168
zAge
+0.25360789
0.1252257
4.10
0.0428
AgeBirth
+0.02095854
0.03 1 1 104
0.45
0.5005
The High School Sample:
Whole-Model Test
Source
DF
-LogLikelihood
Chisquare
Prob>ChiSq
Model
3
1.96999
3.93998
0.268019
Error
944
179.09080
C Total
947
18 1.06079
RSquare (U)
0.0109
Observations
948
Parameter Estimates:
Term
Estimate
Std Error
ChiSquare
ProbBChiSq
Intercept
-3.1278597
0.1 778908
309.16
0.0000
zAFQT89
-0.3 5603 19
0.2387034
2.22
0.1358
zSES
+0.065365 1
0.2379847
0.08
0.7836
zAge
+0.2490558
0.1681270
2.19
0.1385
The College Sample: Omitted. The cross-sectional College Sample
included only four low-birth-weight babies.
DEPENDENT VARIABLE: The child's mother was under the poverty line
throughout the child's first three years of life.
SAMPLE RESTRICTIONS: Includes children born from January 1, 1978
through December 31, 1987, with complete data on poverty for the
first three years of the child's life, beginning with the calendar year
of birth. Comparison group consists of children of mothers who were
not in poverty in any of those years.
Basic Analysis:
Whole-Model Test
Source
DF
-LogLikelihood
Chisquare
Prob>ChiSq
Model
3
79.84242
159.6848
0.000000
Error
1054
246.63029
C Total
1057
326.47271
RSquare (U)
0.2446
Observations
1058
Parameter Estimates
Term
Estimate
Std Error
Chisquare
Prob>ChiSq
Intercept
-2.93 193 16
0.1679177
304.87
0.0000
zAFQT89
-1.1608860
0.1893877
37.57
0.0000
zSES
-1.0386253
0.1734586
35.85
0.0000
z Ag e
-0.1837537
0.1320334
1.94
0.1640
612
Appendix 4
Appendix 4
6 1 3
Basic Analysis, M n g Poverty Status in the Year Prim to Birth (PreBirthPov):
Whole-Model Test
Source
DF
-LogLikelihood
Chisquare
Proh>ChiSq
Model
4
133.38437
266.7687
0.000000
Error
967
161.88379
C Total
97 1
295.26816
RSquare (U)
0.4517
Observations
972
Parameter Estimates
Term
Estimate
Std Error
Chiquare
Proh>ChiSy
Intercept
-1.968501 7
0.2 1 17444
86.43
0.0000
zAFQT89
-1.0772447
0.2375948
20.56
0.0000
zSES
-0.8977385
0.2215879
16.41
0.000 1
zAge
+0.0117316
0.168 1889
0.00
0.9444
PreBirthPov
[No-Yes]
-1.7345986
0.1635206
112.53
0.0000
The High School Sample, Adding Poverty Status in the Year Prior to Birth
(PreBirthPov) :
Whole-Model Test
Source
DF
-LogLikelihood
Chisquare
Proh>ChiSq
Model
4
133.38437
266.7687
0.000000
Error
967
161.88379
C Total
Term
Intercept
zAFQT89
zSES
zAge
PreBirthPov
[No-Yes]
97 1
295.26816
RSquare (U)
0.45 17
Observations
972
Parameter Estimates
Estimate
Std Error
Chisquare
Prob>ChiSq
-1.968501 7
0.2 1 17444
86.43
0.00CIO
-1.0772447
0.2375948
20.56
0.0000
-0.8977385
0.2215879
16.41
0.0001
+0.0117316
0.1681889
0.00
0.9444
The College Sample: Omitted. The cross-sectional College Sample
included only one child whose mother was beneath the poverty line
throughout the first three years.
DEPENDENT VARIABLE: The child's HOME index score was in the bottom
decile.
SAMPLE RESTRICTIONS:
None.
Additional control variables: Test year (TestYr, nominal: 1986,1988, or
1990) and the child's age category for scoring the HOME index
(HomeAgeCat, nominal, in years: 0/2,3/5,6+).
Basic Analysis:
Source
Model
Error
C Total
Term
Intercept
zAFQT89
zSES
zAge
TestYr
[86-901
Testy r
188-901
HorneAgeCat
[0/2-6+]
Home AgeCat
[3/5-6+]
Whole-Model Test
DF
-LogLikelihood
Chisquare
7
88.9225
177.845 1
5114
1190.6267
5121
1279.5492
RSquare (U)
0.0695
Observations
5122
Parameter Estimates
Estimate
Std Error
Chisquare
-2.843000 1 0.0687859
1708.3
-0.67 10186 0.0765998
76.74
4.2383458 0.0800828
8.86
-0.1428139
0.062902
5.15
Basic Analysis, Adding Poverty Status in the Year Before the HOME I d x
was Scored (PreTYPov):
Whole-Model Test
Source
DF
-LogLikelihood
Chisquare
Prob>ChiSq
Model
8
116.4719
232.9438
0.000000
Error
4655
1049.6688
C Total
4663
1166.1407
RSquare (U)
0.0999
Observations
4664
Term
Intercept
zAFQT89
zSES
tAge
TestYr
[86-901
0.9397
TestYr
[88-901
Home Age
Cat[0/2-6+]
Parameter Estimates
Estimate
Std Error
ChiSquare
-2.5413 180
0.0768882
1092.4
-0.5717052
0.0847651
45.49
-0.1646842
0.0848268
3.77
-0.0836204
0.0673282
1.54
Unstable
+0.0068172
0.09005 15
6 14
Appendix 4
Appendix 4
6 15
HomeAge
Cat[3/5-6+]
-0.0968535
0.0892661
1.18
0.2779
PreTYPnv
[No-Yes]
-0.5366001
0.0664395
65.23
0.0000
Basic Analysis, Adding AFDC Status in the Year Before the HOME Index
Was Scored (PreTYADC) :
Whole-Model Test
Source
DF
-LogLikelihood
Chisquare
Proh>ChiSq
Model
8
120.4866
240.9733
0.000000
Error
5101
1 150.3749
C Total
5109
1270.8615
RSquare (U)
0.0948
Observations
51 10
Term
Intercept
zAFQT89
zSES
z Age
TestYr[86-901
TestYr[88-901
Home Age
Cat[0/2-6+]
HomeAge
Cat1315 -6+]
PreTYADC
[No-Yes]
Parameter Estimates
Estimate
Std Error
Chisquare
-2.4639335
0.0797203
955.26
-0.5835098
0.078223
55.65
-0.1973545
0.0813485
5.89
-0.09087 13
0.0644499
1.99
-0.0105341
0.0872339
0.01
-0.0232495
0.081 1592
0.08
Basic Analysis, Adding Both Poverty and AFDC Status in the Year Before
the HOME Index was Scored (PreTYPov, PreTYADC) :
Whole-Model Test
Source
DF
-LogLikelihood
Chisquare
Proh>ChiSq
Model
9
127.1525
254.3049
0.000000
Error
4654
1038.9883
C Total
4663
1166.1407
RSquare (U)
0.1090
Observations
4664
Parameter Estimates
Term
Estimate
Std Error
Chisquare
Prob>ChiSq
Intercept
-2.3642864
0.0832843
805.89
0.0000
zAFQT89
-0.5452068
0.0849779
41.16
0.0000
zSES
-0.1657978
0.0852414
3.78
0.05 18
zAge
-0.0664416
0.0679088
0.96
0.3279
TestYr[86-901
Unstable
+0.0029083
0.090443 1
0.00
0.9743
TestYr[88-901
-0.0455863
0.0856239
0.28
0.5944
Home Age
Cat[0/2-6+]
+0.3145455 0.087279
12.99
0.0003
HomeAge
Cat[3/5-6+]
-0.1002522
0.0896764
1.25
0.2636
PreTYADC
[No.Yes]
-0.3806916
0.0809799
22.10
0.0000
PreTYPov
[No-Yes]
-0.3774093
0.0762828
24.48
0.0000
The High School Sample:
Whole-Model Test
Source
DF
-LogLikelihood
Chisquare
Model
7
26.905 13
53.81026
Error
2282
526.92206
C Total
2289
553.827 19
RSquare (U)
0.0486
Observations
2290
Term
Intercept
zAFQTR9
zSES
zAge
TestYrI86-901
Testy r[88-90)
HomeAge
Cat[0/2-6+]
HomeAge
Cat[3/5-6+]
Parameter Estimates
Estimate
Std Error
Chisquare
-2.907 1274
0.1079507
725.23
-0.5655610
0.133 1445
18.04
-0.3731384
0.1355456
7.58
-0.1569221
0.0964674
2.65
+0.07553 10
0.1295874
0.34
-0.1487970
0.1239539
1.44
The College Samgk: Omitted. The cross-sectional sample included
only five cases of children in the bottom decile on the HOME index.
DEPENDENT VARIABLE: The child was in the bottom decile on any of the
four developmental indicators (friendliness index, difficulty index,
motor and social development index, and behavioral problems
index).
SAMPLE RESTRICTIONS: None.
ADDITIONAL CONTROL VARIABLES: Test year (TestYr, nominal: 1986,
1988, or 1990).
Statistical Analysis of Child Development
- The data presents multiple logistic regression models analyzing factors that place children in the bottom decile of developmental indicators.
- Key independent variables include maternal AFQT scores, socioeconomic status (SES), and age, with AFQT consistently showing a strong negative correlation with poor developmental outcomes.
- The inclusion of poverty and welfare status (AFDC) in the year prior to testing significantly impacts the model's likelihood and chi-square values.
- Specific developmental indicators measured include friendliness, difficulty, motor and social development, and behavioral problems.
- The analysis distinguishes between a general sample and a high school sample, while noting that a college sample was omitted due to an insufficient number of cases in the bottom decile.
The college sample: Omitted. The cross-sectional sample included only five cases of children in the bottom decile on the HOME index.
6 14
Appendix 4
Appendix 4
6 15
HomeAge
Cat[3/5-6+]
-0.0968535
0.0892661
1.18
0.2779
PreTYPnv
[No-Yes]
-0.5366001
0.0664395
65.23
0.0000
Basic Analysis, Adding AFDC Status in the Year Before the HOME Index
Was Scored (PreTYADC) :
Whole-Model Test
Source
DF
-LogLikelihood
Chisquare
Proh>ChiSq
Model
8
120.4866
240.9733
0.000000
Error
5101
1 150.3749
C Total
5109
1270.8615
RSquare (U)
0.0948
Observations
51 10
Term
Intercept
zAFQT89
zSES
z Age
TestYr[86-901
TestYr[88-901
Home Age
Cat[0/2-6+]
HomeAge
Cat1315 -6+]
PreTYADC
[No-Yes]
Parameter Estimates
Estimate
Std Error
Chisquare
-2.4639335
0.0797203
955.26
-0.5835098
0.078223
55.65
-0.1973545
0.0813485
5.89
-0.09087 13
0.0644499
1.99
-0.0105341
0.0872339
0.01
-0.0232495
0.081 1592
0.08
Basic Analysis, Adding Both Poverty and AFDC Status in the Year Before
the HOME Index was Scored (PreTYPov, PreTYADC) :
Whole-Model Test
Source
DF
-LogLikelihood
Chisquare
Proh>ChiSq
Model
9
127.1525
254.3049
0.000000
Error
4654
1038.9883
C Total
4663
1166.1407
RSquare (U)
0.1090
Observations
4664
Parameter Estimates
Term
Estimate
Std Error
Chisquare
Prob>ChiSq
Intercept
-2.3642864
0.0832843
805.89
0.0000
zAFQT89
-0.5452068
0.0849779
41.16
0.0000
zSES
-0.1657978
0.0852414
3.78
0.05 18
zAge
-0.0664416
0.0679088
0.96
0.3279
TestYr[86-901
Unstable
+0.0029083
0.090443 1
0.00
0.9743
TestYr[88-901
-0.0455863
0.0856239
0.28
0.5944
Home Age
Cat[0/2-6+]
+0.3145455 0.087279
12.99
0.0003
HomeAge
Cat[3/5-6+]
-0.1002522
0.0896764
1.25
0.2636
PreTYADC
[No.Yes]
-0.3806916
0.0809799
22.10
0.0000
PreTYPov
[No-Yes]
-0.3774093
0.0762828
24.48
0.0000
The High School Sample:
Whole-Model Test
Source
DF
-LogLikelihood
Chisquare
Model
7
26.905 13
53.81026
Error
2282
526.92206
C Total
2289
553.827 19
RSquare (U)
0.0486
Observations
2290
Term
Intercept
zAFQTR9
zSES
zAge
TestYrI86-901
Testy r[88-90)
HomeAge
Cat[0/2-6+]
HomeAge
Cat[3/5-6+]
Parameter Estimates
Estimate
Std Error
Chisquare
-2.907 1274
0.1079507
725.23
-0.5655610
0.133 1445
18.04
-0.3731384
0.1355456
7.58
-0.1569221
0.0964674
2.65
+0.07553 10
0.1295874
0.34
-0.1487970
0.1239539
1.44
The College Samgk: Omitted. The cross-sectional sample included
only five cases of children in the bottom decile on the HOME index.
DEPENDENT VARIABLE: The child was in the bottom decile on any of the
four developmental indicators (friendliness index, difficulty index,
motor and social development index, and behavioral problems
index).
SAMPLE RESTRICTIONS: None.
ADDITIONAL CONTROL VARIABLES: Test year (TestYr, nominal: 1986,
1988, or 1990).
6 16
Appendix 4
Basic Analysis :
Whole-Model Test
Source
DF
-LogLikelihood
Chisquare
Model
5
35.5004
7 1.00086
Error
4885
1534.391 1
C Total
4890
1569.8915
RSquare (U)
0.0226
Observations
489 1
Parameter Estimates
Term
Estimate
Std Error
Chisquare
Intercept
-2.2678463
0.0523382
1877.5
zAFQT89
-0.3374850
0.0666453
25.64
zSES
-0.1454605
0.0662047
4.83
zAge
-0.0406925
0.053 1744
0.59
TestYr[86-901
+0.1789367 0.0698843
6.56
TestYr[88-901
-0.0070670
0.0677961
0.01
Basic Analysis, Adding Poverty Status and Welfare Status in the Year Prior
to Testing (Pre7YPov, PreTYADC) and Whether the Child wa5 Bmn out
of Wedlock (BStatus) :
Whole-Model Test
Source
DF
-LogLikelihood
Chisquare
Proh>ChiSq
Model
8
42.9933
85.9865 1
0.000000
Error
4329
1350.0000
C Total
4337
1392.9933
RSquare (U)
0.0309
Observations
4338
Term
Intercept
zAFQT89
zSES
z Age
TestYr[86-901
TestYr[88-901
PreTYADC
[Yes-No]
PreTYPov
[Yes-No]
BStatus
[Illegit-Legit]
Parameter Estimates
Estimate
Std Error
Chisquare
-2.0063 1470 0.0860525
543.59
-0.25 174490 0.075657
11.07
-0.13270420 0.0708367
3.5 1
+0.01726122 0.0575776
0.09
+0.18566228 0.0735475
6.37
+0.01877328 0.072493
0.07
The High School Sample:
Whole-Model Test
Source
DF
-LogLikelihood
Chisquare
Model
5
13.59824
27.19647
Error
2181
704.58153
C Total
2186
718.17976
RSquare (U)
0.01 89
Observations
2 187
Parameter Estimates
Term
Estimate
Std Error
Chisquare
Intercept
-2.3178135
0.0834745
770.99
zAFQT89
-0.3193097
0.1 100786
8.41
zSES
-0.3161019
0.1 113263
8.06
z Ag e
+0.023 1487
0.0778738
0.09
TestYr[86-901
+0.1566625
0.1029997
2.31
TestYr[88-901
+0.0136187
0.0996255
0.02
The College Sampk:
Whole-Model Test
Source
DF
-LogLikelihood
Chisquare
Model
5
5.166097
10.332 19
Error
346
74.395923
C Total
351
79.562020
RSquare (U)
0.0649
Observations
352
Term
Intercept
zAFQT89
zSES
zAge
0.9577
TestYr[86-901
TestYr[88-901
Parameter Estimates
Estimate
Std Error
Chisquare
-3.0081 530
0.530244
32.18
+0.78938018 0.35813 12
4.86
-0.80898430 0.337 1 107
5.76
Unstable
+0.01498142
0.2822683
DEPENDENT VARIABLE: The child was in the bottom decile on the
Peabody Picture Vocabulary Test (PPVT).
SAMPLE RESTRICTIONS: Includes only children tested at age 6 and older.
ADDITIONAL CONTROL VARIABLES: Test year (TestYr, nominal: 1986,
1988, or 1990) and age at which the child was tested (continuous, in
months. m = 107.0, s = 27.1)
Statistical Analysis of Child Development
- The data examines factors influencing children scoring in the bottom decile of the Peabody Picture Vocabulary Test (PPVT).
- Key independent variables include maternal AFQT scores, socioeconomic status (SES), and the HOME index score.
- Statistical models are segmented by maternal education levels, specifically comparing high school and college samples.
- In the college sample, there were no recorded cases of children age 6 or older scoring in the bottom decile of the PPVT.
- The analysis transitions into a study of criminal behavior, using a dependent variable based on the top decile of self-reported crime among men.
- Regression estimates show that maternal AFQT scores often have a significant negative correlation with the likelihood of a child scoring in the bottom decile.
The College Sample: Omitted. No cases of a child age 6 or older in the hottom decile on the PPVT in the cross-sectional sample.
6 16
Appendix 4
Basic Analysis :
Whole-Model Test
Source
DF
-LogLikelihood
Chisquare
Model
5
35.5004
7 1.00086
Error
4885
1534.391 1
C Total
4890
1569.8915
RSquare (U)
0.0226
Observations
489 1
Parameter Estimates
Term
Estimate
Std Error
Chisquare
Intercept
-2.2678463
0.0523382
1877.5
zAFQT89
-0.3374850
0.0666453
25.64
zSES
-0.1454605
0.0662047
4.83
zAge
-0.0406925
0.053 1744
0.59
TestYr[86-901
+0.1789367 0.0698843
6.56
TestYr[88-901
-0.0070670
0.0677961
0.01
Basic Analysis, Adding Poverty Status and Welfare Status in the Year Prior
to Testing (Pre7YPov, PreTYADC) and Whether the Child wa5 Bmn out
of Wedlock (BStatus) :
Whole-Model Test
Source
DF
-LogLikelihood
Chisquare
Proh>ChiSq
Model
8
42.9933
85.9865 1
0.000000
Error
4329
1350.0000
C Total
4337
1392.9933
RSquare (U)
0.0309
Observations
4338
Term
Intercept
zAFQT89
zSES
z Age
TestYr[86-901
TestYr[88-901
PreTYADC
[Yes-No]
PreTYPov
[Yes-No]
BStatus
[Illegit-Legit]
Parameter Estimates
Estimate
Std Error
Chisquare
-2.0063 1470 0.0860525
543.59
-0.25 174490 0.075657
11.07
-0.13270420 0.0708367
3.5 1
+0.01726122 0.0575776
0.09
+0.18566228 0.0735475
6.37
+0.01877328 0.072493
0.07
The High School Sample:
Whole-Model Test
Source
DF
-LogLikelihood
Chisquare
Model
5
13.59824
27.19647
Error
2181
704.58153
C Total
2186
718.17976
RSquare (U)
0.01 89
Observations
2 187
Parameter Estimates
Term
Estimate
Std Error
Chisquare
Intercept
-2.3178135
0.0834745
770.99
zAFQT89
-0.3193097
0.1 100786
8.41
zSES
-0.3161019
0.1 113263
8.06
z Ag e
+0.023 1487
0.0778738
0.09
TestYr[86-901
+0.1566625
0.1029997
2.31
TestYr[88-901
+0.0136187
0.0996255
0.02
The College Sampk:
Whole-Model Test
Source
DF
-LogLikelihood
Chisquare
Model
5
5.166097
10.332 19
Error
346
74.395923
C Total
351
79.562020
RSquare (U)
0.0649
Observations
352
Term
Intercept
zAFQT89
zSES
zAge
0.9577
TestYr[86-901
TestYr[88-901
Parameter Estimates
Estimate
Std Error
Chisquare
-3.0081 530
0.530244
32.18
+0.78938018 0.35813 12
4.86
-0.80898430 0.337 1 107
5.76
Unstable
+0.01498142
0.2822683
DEPENDENT VARIABLE: The child was in the bottom decile on the
Peabody Picture Vocabulary Test (PPVT).
SAMPLE RESTRICTIONS: Includes only children tested at age 6 and older.
ADDITIONAL CONTROL VARIABLES: Test year (TestYr, nominal: 1986,
1988, or 1990) and age at which the child was tested (continuous, in
months. m = 107.0, s = 27.1)
618
Appendix 4
Appendix 4
619
Basic Analysis:
Whole-Model Test
Source
DF
-LogLikelihood
Chisquare
Model
6
24.69587
49.39173
Error
640
186.29121
C Total
646
2 10.98708
RSquare (U)
0.1170
Observations
64 7
Term
Intercept
zAFQT89
zSES
z Ag e
PPVTAge
TestYr[86-901
TestYr[88-901
Parameter Estimates
Estimate
Std Error
Chisquare
-2.21570603
0.8589707
6.65
-1.1 1994138 0.1950498
32.97
-0.081853 12 0.1820132
0.20
-0.02769682 0.1856376
0.02
-0.00466266
0.0077779
0.36
-0.16528217 0.2424523
0.46
-0.07970146
0.2250145
0.13
Basic Analysis Adding Poverty Status in the Year Prior to the PPVT
(PreTYPov) and the HOME lndex Score Expressed in Standard Scores
(rHOME) :
Whole-Model Test
Source
DF
-LogLikelihood
Chisquare
Proh>ChiSq
Model
8
17.72094
35.44187
0.000022
Error
582
153.59135
C Total
590
171.31229
RSquare (U)
0.1034
Observations
59 1
Term
Intercept
zAFQT89
zSES
zAge
TestYr[86-901
TestYr[88-901
PPVTAge
zHOME
PreTY Pov
[No-Yes]
Parameter Estimates
Estimate
Std Error
Chisquare
-2.1291342
0.9565224
4.95
-1.0337219
0.2205373
21.97
-0.0861 738
0.2093703
0.17
+0.0296014 0.2145926
0.02
-0.2286597
0.2683805
0.73
-0.048301 7
0.2526343
0.04
-0.0067930
0.0085395
0.63
-0.1945375
0.1842224
1.12
The High School Sample:
Whole-Model Test
Source
DF
-LogLikelihood
Chisquare
Model
6
7.225514
14.45103
Error
254
68.236589
C Total
260
75.462103
RSquare (U)
0.0958
Observations
261
Term
Intercept
zAFQT89
zSES
z Ag e
TestYr(86-901
TestYr[88-901
PPVTAge
Parameter Estimates
Estimate
Std Error
Chisquare
-0.2705795
1.4383055
0.04
-0.9296387
0.3952333
5.53
-0.0918753
0.3493501
0.07
+0.9267613
0.4137423
5.02
-1.0895230
0.42143 16
6.68
+0.3 167489
0.3591565
0.78
-0.0287800
0.0132748
4.70
The College Sample: Omitted. No cases of a child age 6 or older in the
hottom decile on the PPVT in the cross-sectional sample.
Women with Less Than a High School Education:
Whole-Model Test
Source
DF
-LogLikelihood
Chisquare
Model
6
6.239129
12.47826
Error
139
70.537266
C Total
145
76.776395
RSquare (U)
0.08 13
Observations
146
Term
Intercept
zAFQT89
zSES
z Ag e
TestYr[86-901
TestYr[88-901
PPVTAge
Parameter Estimates
Estimate
Std Error
Chisquare
-3.6384326
1.460085
6.21
-0.8396200
0.3093784
7.37
+0.0090359
0.2914784
0.00
-0.43862 16
0.3016201
2.1 1
+0.377 1342
0.3759239
1.01
-0.4974755
0.3638669
1.87
+0.0133480
0.01 1851
1.27
620
Appendix 4
Appendix 4
62 1
CHAPTER 1 1 : CRIME
DEPENDENT VARIABLE:
The subject was in the top decile on an index of
self-reported crime.
SAMPLE RESTRICTIONS: Includes only men.
Basic Analysis:
Whole-Model Test
Source
DF
-LogLikelihood
Chisquare
Pmh>ChiSq
Model
3
10.02735
20.05469
0.0001 65
Error
2004
649.74218
C Total
2007
659.76953
RSquare (U)
0.0152
Observations
2008
Parameter Estimates
Term
Estimate
Std Error
Chisquare
Prob>ChiSq
Intercept
-2.22005314
0.0807852
755.20
0.0000
zAFQT89
-0.269801 89 0.0902397
8.94
0.0028
zSES
+0.13972790 0.0979853
2.03
0.1539
zAge
-0.20372081 0.080365
6.43
0.01 12
The High School Sample:
Whole-Model Test
Source
DF
-LogLikelihood
ChiSquare
Prob>ChiSq
Model
3
4.28228
8.564558
0.035677
Error
66 1
201.83770
C Total
664
206.1 1998
RSquare (U)
0.0208
Observations
665
Parameter Estimates
Term
Estimate
Std Error
Chisquare
Prob>ChiSq
Intercept
-2.35032467
0.1445857
264.24
0.0000
zAFQT89
+0.2120838 0.2006406
1.12
0.2905
zSES
+0.3653400 0.1981511
3.40
0.0652
zAge
-0.26122639 0.1457019
3.21
0.0730
The College Sampk:
Whole-Model Test
Source
DF
-LogLikelihood
Chisquare
Prob>ChiSq
Model
3
2.959829
5.919657
0.115585
Error
276
46.577870
C Total
279
49.537698
RSquare (U)
0.0597
Observations
280
Parameter Estimates
Term
Estimate
Std Error
Chisquare
Prob~ChiSq
lntercept
-3.33070801 0.7047663
22.33
0.0000
zAFQT89
-0.63468357
0.5194501
1.49
0.2218
zSES
+0.80027390 0.4591207
3.04
0.0813
z Ag e
+0.39913230 0.306701
1.69
0.1931
DEPENDENT VARIABLE: The subject was interviewed in a correctional fa-
cility in one or more interviews from 1979 to 1990.
SAMPLE RESTRICTIONS: Includes only men.
Basic Analysis:
Whole-Model Test
Source
DF
-LogLikelihood
Chisquare
ProbChiSq
Model
3
23.31444
46.62887
0.000000
Error
1941
219.90125
C Total
1944
243.2 1569
RSquare (U)
0.0959
Observations
1945
Parameter Estimates
Term
Estimate
Std Error
Chisquare
Prob>ChiSq
Intercept
-3.77716689 0.171 7938
483.41
0.0000
zAFQT89
-0.89666260 0.17536 19
26.14
0.0000
zSES
-0.15554116 0.1806149
0.74
0.3891
zAge
+0.0782992
0.1468634
0.28
0.5939
The High School Sample:
Whole-Model Test
Source
DF
-LogLikelihood
Chisquare
Prob>ChiSq
Model
3
4.058464
8.1 16928
0.043656
Error
7 12
39.850585
C Total
7 15
43.909049
RSquare (U)
0.0924
Observations
716
Parameter Estimates
Term
Estimate
Std Error
Chisquare
ProbChiSq
Intercept
-4.96578763 0.48063 19
106.75
0 .OOOO
zAFQT89
-1.07006679
0.443 12 1
5.83
0.0157
zSES
-0.1621 1965 0.4642977
0.12
0.7270
zAge
+0.46727190 0.367754
1.61
0.2039
The Colkge Sample: Omitted. No one in the cross-sectional College
Sample waj ever interviewed in jail.
Statistical Analysis of Social Outcomes
- The data presents logistic regression models analyzing the relationship between cognitive ability (zAFQT89), socioeconomic status (zSES), and age against various social outcomes.
- One primary dependent variable tracks whether male subjects were interviewed in a correctional facility between 1979 and 1990.
- Statistical results for the 'College Sample' regarding incarceration were omitted because no one in that specific cross-sectional group was ever interviewed in jail.
- A second analysis focuses on 'Civility and Citizenship' by measuring subjects against a 'Middle Class Values Index.'
- In the Middle Class Values Index analysis, cognitive ability (zAFQT89) shows a highly significant positive correlation (Prob>ChiSq of 0.0000) with higher scores.
- The data is segmented into 'Basic Analysis,' 'High School Sample,' and 'College Sample' to compare how these variables interact across different educational backgrounds.
The College Sample: Omitted. No one in the cross-sectional College Sample waj ever interviewed in jail.
620
Appendix 4
Appendix 4
62 1
CHAPTER 1 1 : CRIME
DEPENDENT VARIABLE:
The subject was in the top decile on an index of
self-reported crime.
SAMPLE RESTRICTIONS: Includes only men.
Basic Analysis:
Whole-Model Test
Source
DF
-LogLikelihood
Chisquare
Pmh>ChiSq
Model
3
10.02735
20.05469
0.0001 65
Error
2004
649.74218
C Total
2007
659.76953
RSquare (U)
0.0152
Observations
2008
Parameter Estimates
Term
Estimate
Std Error
Chisquare
Prob>ChiSq
Intercept
-2.22005314
0.0807852
755.20
0.0000
zAFQT89
-0.269801 89 0.0902397
8.94
0.0028
zSES
+0.13972790 0.0979853
2.03
0.1539
zAge
-0.20372081 0.080365
6.43
0.01 12
The High School Sample:
Whole-Model Test
Source
DF
-LogLikelihood
ChiSquare
Prob>ChiSq
Model
3
4.28228
8.564558
0.035677
Error
66 1
201.83770
C Total
664
206.1 1998
RSquare (U)
0.0208
Observations
665
Parameter Estimates
Term
Estimate
Std Error
Chisquare
Prob>ChiSq
Intercept
-2.35032467
0.1445857
264.24
0.0000
zAFQT89
+0.2120838 0.2006406
1.12
0.2905
zSES
+0.3653400 0.1981511
3.40
0.0652
zAge
-0.26122639 0.1457019
3.21
0.0730
The College Sampk:
Whole-Model Test
Source
DF
-LogLikelihood
Chisquare
Prob>ChiSq
Model
3
2.959829
5.919657
0.115585
Error
276
46.577870
C Total
279
49.537698
RSquare (U)
0.0597
Observations
280
Parameter Estimates
Term
Estimate
Std Error
Chisquare
Prob~ChiSq
lntercept
-3.33070801 0.7047663
22.33
0.0000
zAFQT89
-0.63468357
0.5194501
1.49
0.2218
zSES
+0.80027390 0.4591207
3.04
0.0813
z Ag e
+0.39913230 0.306701
1.69
0.1931
DEPENDENT VARIABLE: The subject was interviewed in a correctional fa-
cility in one or more interviews from 1979 to 1990.
SAMPLE RESTRICTIONS: Includes only men.
Basic Analysis:
Whole-Model Test
Source
DF
-LogLikelihood
Chisquare
ProbChiSq
Model
3
23.31444
46.62887
0.000000
Error
1941
219.90125
C Total
1944
243.2 1569
RSquare (U)
0.0959
Observations
1945
Parameter Estimates
Term
Estimate
Std Error
Chisquare
Prob>ChiSq
Intercept
-3.77716689 0.171 7938
483.41
0.0000
zAFQT89
-0.89666260 0.17536 19
26.14
0.0000
zSES
-0.15554116 0.1806149
0.74
0.3891
zAge
+0.0782992
0.1468634
0.28
0.5939
The High School Sample:
Whole-Model Test
Source
DF
-LogLikelihood
Chisquare
Prob>ChiSq
Model
3
4.058464
8.1 16928
0.043656
Error
7 12
39.850585
C Total
7 15
43.909049
RSquare (U)
0.0924
Observations
716
Parameter Estimates
Term
Estimate
Std Error
Chisquare
ProbChiSq
Intercept
-4.96578763 0.48063 19
106.75
0 .OOOO
zAFQT89
-1.07006679
0.443 12 1
5.83
0.0157
zSES
-0.1621 1965 0.4642977
0.12
0.7270
zAge
+0.46727190 0.367754
1.61
0.2039
The Colkge Sample: Omitted. No one in the cross-sectional College
Sample waj ever interviewed in jail.
622
Appendix 4
CHAPTER 12: CIVILITY AND CITIZENSHIP
DEPENDENT VARIABLE: Did the subject score "yes" on the Middle Class
Values Index?
SAMPLE RESTRICTIONS: Excludes never-married persons who met all the
other conditions of the index and men who were physically unable
to work or not in the labor force because they were attending school.
Basic Analysis:
Whole-Model Test
Source
DF
-LogLikelihood
Chisquare
Proh>ChiSq
Model
3
161.7136
323.4273
0.000000
Error
3025
1937.4328
C Total
3028
2099.1465
RSquare (U)
0.0770
Observations
3029
Parameter Estimates
Term
Estimate
Std Error
Chisquare
Proh>ChiSq
Intercept
-0.06385330
0.038934
2.69
0.1010
zAFQT89
+0.6325055 1
0.05281 76
143.41
0.0000
zSES
+0.24495537
0.0520624
22.14
0.0000
zAge
+0.00663732
0.0401929
0.03
0.8688
The High School Sample:
Whole-Model Test
Source
DF
-LogLikelihood
Chisquare
Proh>ChiSq
Model
3
3.00926
6.018528
0.1 10712
Error
1158
781 .a5686
C Total
1161
784.8661 2
RSquare (U)
0.0038
Observations
1162
Parameter Estimates
Term
Estimate
Std Error
Chisquare
Proh>ChiSq
Intercept
+0.39447706
0.061 1821
41.57
0.0000
zAFQT89
+0.16814512
0.0931181
3.26
0.07 10
zSES
-0.17993040
0.0903402
3.97
0.0464
z Age
+0.01887678
0.0621776
0.09
0.7614
The College Sample:
Whole-Model Test
Source
DF
-LogLikelihood
Chisquare
Prob>ChiSq
Model
3
3.26859
6.537177
0.088208
Error
398
200.09145
C Total
40 1
203.36004
RSquare (U)
0.0161
Observations
402
Parameter Estimates
Term
Estimate
Std Error
Chisquare
Prob>ChiSq
Intercept
+0.99516202
0.2386798
17.38
0.0000
zAFQT89
+0.39251349
0.1988073
3.90
0.0483
zSES
+0.03692158
0.168585
0.05
0.8266
z Ag e
+0.13876137
0.1336384
1.08
0.299 1
Analyzing Predictive Test Bias
- The text addresses the scientific debate over whether standardized cognitive tests are biased against Black individuals.
- It argues that average score differences between groups do not constitute prima facie evidence of bias.
- External evidence of bias is defined by whether a test score predicts the same real-world outcome for different groups.
- Bias is mathematically illustrated through regression analysis, where an unfair test would systematically underpredict the performance of one group.
- The authors contend that if a test were biased, a Black individual and a White individual with the same score would achieve different levels of success in school or work.
- The discussion explores various regression models, including differences in intercepts and slopes, to define what constitutes a less valid predictor for specific groups.
A group difference is, in and of itself, evidence of test bias only if we have some reason for assuming that an unbiased test would find no average difference between the groups.
622
Appendix 4
CHAPTER 12: CIVILITY AND CITIZENSHIP
DEPENDENT VARIABLE: Did the subject score "yes" on the Middle Class
Values Index?
SAMPLE RESTRICTIONS: Excludes never-married persons who met all the
other conditions of the index and men who were physically unable
to work or not in the labor force because they were attending school.
Basic Analysis:
Whole-Model Test
Source
DF
-LogLikelihood
Chisquare
Proh>ChiSq
Model
3
161.7136
323.4273
0.000000
Error
3025
1937.4328
C Total
3028
2099.1465
RSquare (U)
0.0770
Observations
3029
Parameter Estimates
Term
Estimate
Std Error
Chisquare
Proh>ChiSq
Intercept
-0.06385330
0.038934
2.69
0.1010
zAFQT89
+0.6325055 1
0.05281 76
143.41
0.0000
zSES
+0.24495537
0.0520624
22.14
0.0000
zAge
+0.00663732
0.0401929
0.03
0.8688
The High School Sample:
Whole-Model Test
Source
DF
-LogLikelihood
Chisquare
Proh>ChiSq
Model
3
3.00926
6.018528
0.1 10712
Error
1158
781 .a5686
C Total
1161
784.8661 2
RSquare (U)
0.0038
Observations
1162
Parameter Estimates
Term
Estimate
Std Error
Chisquare
Proh>ChiSq
Intercept
+0.39447706
0.061 1821
41.57
0.0000
zAFQT89
+0.16814512
0.0931181
3.26
0.07 10
zSES
-0.17993040
0.0903402
3.97
0.0464
z Age
+0.01887678
0.0621776
0.09
0.7614
The College Sample:
Whole-Model Test
Source
DF
-LogLikelihood
Chisquare
Prob>ChiSq
Model
3
3.26859
6.537177
0.088208
Error
398
200.09145
C Total
40 1
203.36004
RSquare (U)
0.0161
Observations
402
Parameter Estimates
Term
Estimate
Std Error
Chisquare
Prob>ChiSq
Intercept
+0.99516202
0.2386798
17.38
0.0000
zAFQT89
+0.39251349
0.1988073
3.90
0.0483
zSES
+0.03692158
0.168585
0.05
0.8266
z Ag e
+0.13876137
0.1336384
1.08
0.299 1
Appendix 5
Supplemental Material for
Chapter 13
Three issues raised in Chapter 13 are elaborated here: a more detailed
discussion of cultural bias, more evidence for the narrowing of the black-
white difference in cognitive ability, and the broader argument for racial
differences advanced by Philippe Rushton.
MORE ON TEST BIAS
In Chapter 13, we reported that the scientific evidence demonstrates
overwhelmingly that standardized tests of cognitive ability are not bi.
ased against blacks. Here, we elaborate on the reasoning and evidence
that lead to that conclusion.
More on External Evidence of Bias: Predictive Validity
Everyday commentary on test bias usually starts with the observation that
members of various ethnic (or socioeconomic) groups have different av-
erage scores and leaps to the assumption that a group difference is prima
facie evidence of bias. But a moment's thought should convince anyone
that this is not necessarily so. A group difference is, in and of itself, evi-
dence of test bias only if we have some reason for assuming that an un-
biased test would find no average difference between the groups. What
might such a reason be? We cast the answer in terms of whites and blacks,
since that is the context for most charges of test bias. Inasmuch as the con-
text also usually involves a criticism of the use of the test in selection of
persons for school or job, the most pertinent reason for assuming equality
in the absence of test bias would be that we have other data showing that
a randomly selected black and white with the same test score have differ-
ent outcomes. This is what the text refers to as external evidence of bias.
626
Appendix 5
Appendix 5
627
If for example, blacks do better in school than whites after choosing
blacks and whites with equal test scores, we could say that the test was
biased against blacks in academic prediction. Similarly, if they do bet-
ter on the job after choosing blacks and whites with equal test scores,
the test could be considered biased against blacks for predicting work
performance. This way of demonstrating bias is tantamount to showing
that the regression of outcomes on scores differs for the two groups. On
a test biased against blacks, the regression intercept would be higher for
blacks than whites, as illustrated in the graphic below. Test scores un-
When a test is biased because it systematically underpredicts one
group's performance
Outcome measure
Low Low
I
l
+ High
Predictor
der these conditions would underestimate, or "underpredict," the per.
formance outcome of blacks. A randomly selected black and white with
the same 1Q (shown by the vertical broken line) would not have equal
outcomes; the black would outperform the white (as shown by the hor-
izontal broken lines). The test is therefore biased against blacks. On an
unbiased test, the two regression lines would converge because they
would have the same intercept (the point at which the regression line
crosses the vertical axis).
But the graphic above captures only one of the many possible mani-
festations of predictive bias. Suppose, for example, a test was less valid
for blacks than for whites."' In regression terms, this would translate into
a smaller coefficient (slope in these graphics), which could, in turn, be
associated either with or without a difference in the intercept. The next
figure illustrates a few hypothetical possibilities.
All three black lines have the same low coefficient; they vary only
When a test is biased because it is a less valid predictor of perfor-
mance for one group than another
Outcome measure
High
-
Black
-
White
Low I
Low
+ High
Predictor
in their intercepts. The gray line, representing whites, has a higher co-
efficient (therefore, the line is steeper). Begin with the lowest of the
three black lines. Only at the very lowest predictor scores do blacks score
higher than whites on the outcome measure. As the score on the pre-
dictor increases, whites with equivalent predictor scores have higher
outcome scores. Here, the test bias is against whites, not blacks. For the
intermediate black line, we would pick up evidence for test bias against
blacks in the low range of test scores and bias against whites in the high
range. The top black line, with the highest of the three intercepts, would
accord with bias against blacks throughout the range, but diminishing
in magnitude the higher the score.
Readers will quickly grasp that test scores can predict outcomes dif-
ferently for members of different groups and that such differences may
justify claims of test bias. So what are the facts? Do we see anything like
the first of the two graphics in the data-a
clear difference in intercepts,
to the disadvantage of blacks taking the test? Or is the picture cloudier-
a mixture of intercept and coefficient differences, yielding one sort of
bias or another in different ranges of the test scores? When questions
about data come up, cloudier and murkier is usually a safe bet. So let us
start with the most relevant conclusion, and one about which there is
virtual unanimity among students of the subject of predictive bias in
testing: No one has found statistically reliabk evidence of predictive bias
against blacks, of the sort illustrated in the first graphic, in large, representa-
tive sampks of blacks and whites, where cognitive ability tests are the pedic-
tor variable for educational achievement or job performance. In the notes,
Predictive Bias in Testing
- The text examines whether cognitive ability tests unfairly predict lower outcomes for black individuals compared to white individuals with identical scores.
- Statistical analysis of large, representative samples consistently fails to find evidence of predictive bias against black test-takers in education or employment.
- While small, unrepresentative studies may show varying results due to measurement errors and sampling distortions, comprehensive literature syntheses remain unanimous.
- Prominent researchers like Arthur Jensen have noted a lack of any bona fide examples where tests underpredict the performance of black individuals.
- Available data, including massive national surveys of school children, suggests that if any bias exists, it often manifests as overprediction for black outcomes.
- The consensus among experts is that cognitive ability tests serve as accurate predictors of performance across different racial groups without systematic disadvantage.
When questions about data come up, cloudier and murkier is usually a safe bet.
626
Appendix 5
Appendix 5
627
If for example, blacks do better in school than whites after choosing
blacks and whites with equal test scores, we could say that the test was
biased against blacks in academic prediction. Similarly, if they do bet-
ter on the job after choosing blacks and whites with equal test scores,
the test could be considered biased against blacks for predicting work
performance. This way of demonstrating bias is tantamount to showing
that the regression of outcomes on scores differs for the two groups. On
a test biased against blacks, the regression intercept would be higher for
blacks than whites, as illustrated in the graphic below. Test scores un-
When a test is biased because it systematically underpredicts one
group's performance
Outcome measure
Low Low
I
l
+ High
Predictor
der these conditions would underestimate, or "underpredict," the per.
formance outcome of blacks. A randomly selected black and white with
the same 1Q (shown by the vertical broken line) would not have equal
outcomes; the black would outperform the white (as shown by the hor-
izontal broken lines). The test is therefore biased against blacks. On an
unbiased test, the two regression lines would converge because they
would have the same intercept (the point at which the regression line
crosses the vertical axis).
But the graphic above captures only one of the many possible mani-
festations of predictive bias. Suppose, for example, a test was less valid
for blacks than for whites."' In regression terms, this would translate into
a smaller coefficient (slope in these graphics), which could, in turn, be
associated either with or without a difference in the intercept. The next
figure illustrates a few hypothetical possibilities.
All three black lines have the same low coefficient; they vary only
When a test is biased because it is a less valid predictor of perfor-
mance for one group than another
Outcome measure
High
-
Black
-
White
Low I
Low
+ High
Predictor
in their intercepts. The gray line, representing whites, has a higher co-
efficient (therefore, the line is steeper). Begin with the lowest of the
three black lines. Only at the very lowest predictor scores do blacks score
higher than whites on the outcome measure. As the score on the pre-
dictor increases, whites with equivalent predictor scores have higher
outcome scores. Here, the test bias is against whites, not blacks. For the
intermediate black line, we would pick up evidence for test bias against
blacks in the low range of test scores and bias against whites in the high
range. The top black line, with the highest of the three intercepts, would
accord with bias against blacks throughout the range, but diminishing
in magnitude the higher the score.
Readers will quickly grasp that test scores can predict outcomes dif-
ferently for members of different groups and that such differences may
justify claims of test bias. So what are the facts? Do we see anything like
the first of the two graphics in the data-a
clear difference in intercepts,
to the disadvantage of blacks taking the test? Or is the picture cloudier-
a mixture of intercept and coefficient differences, yielding one sort of
bias or another in different ranges of the test scores? When questions
about data come up, cloudier and murkier is usually a safe bet. So let us
start with the most relevant conclusion, and one about which there is
virtual unanimity among students of the subject of predictive bias in
testing: No one has found statistically reliabk evidence of predictive bias
against blacks, of the sort illustrated in the first graphic, in large, representa-
tive sampks of blacks and whites, where cognitive ability tests are the pedic-
tor variable for educational achievement or job performance. In the notes,
628
Appendix 5
Appendix 5
629
we list some of the larger aggregations of data and comprehensive analy-
ses substantiating this con~lusion.~
We have found no modem, empiri-
cally based survey of the literature on test bias arguing that tests are
predictively biased against blacks, although we have looked for them.
When we turn to the hundreds of smaller studies that have accu-
mulated in the literature, we find examples of varying regression coef-
ficients and intercepts, and predictive validities. This is a fundamental
reason for focusing on syntheses of the literature. Smaller or unrepre-
sentative individual studies may occasionally find test bias because of
the statistical distortions that plague them. There are, for example, sam-
pling and measurement errors, errors of recording, transcribing, and
computing data, restrictions of range in both the predictor and outcome
measurements, and predictor or outcome scales that are less valid than
they might have been.j Given all the distorting sources of variation,
lack of agreement across studies is the rule.
But even taken down to so fine a level, the case against predictive
bias against blacks remains overwhelming. As late as 1984, Arthur
Jensen was able to proclaim that "I have not come across a bona fide ex-
ample of the opposite finding [of a test that underpredicts black perfor-
man~e]."~
Jensen's every finding regarding racial differences in IQ is
routinely subjected to intense scrutiny by his critics, but no one has con-
tradicted this one. We are not absolutely sure that our literature review
has identified every study since 1984, but our search revealed no ex-
amples to counter Jensen's generali~ation.'~]
Insofar as the many individual studies show a pattem at all, it points
to overprediction for blacks. More simply, this body of evidence suggests
that 1Q tests are biased in favor of blacks, not against them. The single
most massive set of data bearing on this issue is the national sample of
more than 645,000 school children conducted by sociologist James
Coleman and his associates for their landmark examination of the
American educational system in the mid-1960s. Coleman's survey in-
cluded a standardized test of verbal and nonverbal IQ, using the kinds
of items that characterize the classic IQ test and are commonly thought
to be culturally biased against blacks: picture vocabulary, sentence com-
pletion, analogies, and the like. The Coleman survey also included ed-
ucational achievement measures of reading level and math level that
are thought to be straightforward measures of what the student has
learned. If 1Q item are culturally biased against blacks, it could be pre-
dicted that a black student would do better on the achievement mea-
sures than the putative IQ measure would lead one to expect (this is the
rationale behind the current popularity of steps to modify the SAT so
that it focuses less on aptitude and more on measures of what has been
learned). But the opposite occurred. Overall, black IQ scores overpre-
dicted black academic achievement by .26 standard de~iations.~
One inference that might be drawn from this finding is that black
children were for some reason not taking as much from school as their
ability would permit, or that black children went to worse schools than
white children, or any of several other interpretations. But whatever the
explanation might be, the results directly contradict the hypothesis that
IQ tests give an unfairly low estimate of black academic performance.
A second major source of data suggesting that standardized tests over-
predict black performance is the SAT. Colleges commonly compare the
performance of freshmen, measured by grade point average, against the
expectations of their performance as predicted by SAT scores. A liter-
ature review of studies that broke down these data by ethnic group re-
vealed that SAT scores overpredicted freshman grades for blacks in
fourteen of fifteen studies, by a median of .20 standard deviation.' In
five additional studies where the ethnic classification was "minority"
rather than specifically "black," the SAT score overpredicted college
performance in all five cases, by a median of .40 standard deviation.'
For job performance, the most thorough analysis is provided by the
Hartigan Report, assessing the relationship between the General Apti-
tude Test Battery (GATB) and job performance measures. Out of sev-
enty-two studies that were assembled for review, the white intercept was
higher than the black intercept in sixty of them-that
is, the GATB
overpredicted black performance in sixty out of the seventy-two stud-
ies.' Of the twenty studies in which the intercepts were statistically sig-
nificantly different (at the .O1 level), the white intercept was greater
than the black intercept in all twenty cases.''
These findings about overprediction apply to the ordinary outcome
measures of academic and job performance. But it should also be noted
that "overprediction" can be a misleading concept when it is applied to
outcome measures for which the predictor (IQ, in our continuing ex-
ample) has very low validity. Inasmuch as blacks and whites differ on
average in their scores on some outcome that is not linked to the pre-
dictor, the more biased it will be against whites. Consider the next fig-
ure, constructed on the assumption that the predictor is nearly invalid
and that the two groups differ on average in their outcome levels.
Standardized Testing and Performance Prediction
- The Coleman survey found that black IQ scores overpredicted academic achievement in reading and math by 0.26 standard deviations.
- Data from fifteen studies on the SAT indicate that test scores consistently overpredict the freshman grade point averages of black students.
- The Hartigan Report on job performance found that the General Aptitude Test Battery overpredicted black performance in 60 out of 72 cases.
- These findings challenge the hypothesis that standardized IQ tests are culturally biased in a way that underestimates black academic or professional potential.
- The concept of 'overprediction' becomes complex when a predictor has low validity for a specific outcome, such as short-term unemployment.
- Discrepancies between predicted and actual outcomes may be influenced by school quality or other environmental factors not captured by the tests.
But whatever the explanation might be, the results directly contradict the hypothesis that IQ tests give an unfairly low estimate of black academic performance.
628
Appendix 5
Appendix 5
629
we list some of the larger aggregations of data and comprehensive analy-
ses substantiating this con~lusion.~
We have found no modem, empiri-
cally based survey of the literature on test bias arguing that tests are
predictively biased against blacks, although we have looked for them.
When we turn to the hundreds of smaller studies that have accu-
mulated in the literature, we find examples of varying regression coef-
ficients and intercepts, and predictive validities. This is a fundamental
reason for focusing on syntheses of the literature. Smaller or unrepre-
sentative individual studies may occasionally find test bias because of
the statistical distortions that plague them. There are, for example, sam-
pling and measurement errors, errors of recording, transcribing, and
computing data, restrictions of range in both the predictor and outcome
measurements, and predictor or outcome scales that are less valid than
they might have been.j Given all the distorting sources of variation,
lack of agreement across studies is the rule.
But even taken down to so fine a level, the case against predictive
bias against blacks remains overwhelming. As late as 1984, Arthur
Jensen was able to proclaim that "I have not come across a bona fide ex-
ample of the opposite finding [of a test that underpredicts black perfor-
man~e]."~
Jensen's every finding regarding racial differences in IQ is
routinely subjected to intense scrutiny by his critics, but no one has con-
tradicted this one. We are not absolutely sure that our literature review
has identified every study since 1984, but our search revealed no ex-
amples to counter Jensen's generali~ation.'~]
Insofar as the many individual studies show a pattem at all, it points
to overprediction for blacks. More simply, this body of evidence suggests
that 1Q tests are biased in favor of blacks, not against them. The single
most massive set of data bearing on this issue is the national sample of
more than 645,000 school children conducted by sociologist James
Coleman and his associates for their landmark examination of the
American educational system in the mid-1960s. Coleman's survey in-
cluded a standardized test of verbal and nonverbal IQ, using the kinds
of items that characterize the classic IQ test and are commonly thought
to be culturally biased against blacks: picture vocabulary, sentence com-
pletion, analogies, and the like. The Coleman survey also included ed-
ucational achievement measures of reading level and math level that
are thought to be straightforward measures of what the student has
learned. If 1Q item are culturally biased against blacks, it could be pre-
dicted that a black student would do better on the achievement mea-
sures than the putative IQ measure would lead one to expect (this is the
rationale behind the current popularity of steps to modify the SAT so
that it focuses less on aptitude and more on measures of what has been
learned). But the opposite occurred. Overall, black IQ scores overpre-
dicted black academic achievement by .26 standard de~iations.~
One inference that might be drawn from this finding is that black
children were for some reason not taking as much from school as their
ability would permit, or that black children went to worse schools than
white children, or any of several other interpretations. But whatever the
explanation might be, the results directly contradict the hypothesis that
IQ tests give an unfairly low estimate of black academic performance.
A second major source of data suggesting that standardized tests over-
predict black performance is the SAT. Colleges commonly compare the
performance of freshmen, measured by grade point average, against the
expectations of their performance as predicted by SAT scores. A liter-
ature review of studies that broke down these data by ethnic group re-
vealed that SAT scores overpredicted freshman grades for blacks in
fourteen of fifteen studies, by a median of .20 standard deviation.' In
five additional studies where the ethnic classification was "minority"
rather than specifically "black," the SAT score overpredicted college
performance in all five cases, by a median of .40 standard deviation.'
For job performance, the most thorough analysis is provided by the
Hartigan Report, assessing the relationship between the General Apti-
tude Test Battery (GATB) and job performance measures. Out of sev-
enty-two studies that were assembled for review, the white intercept was
higher than the black intercept in sixty of them-that
is, the GATB
overpredicted black performance in sixty out of the seventy-two stud-
ies.' Of the twenty studies in which the intercepts were statistically sig-
nificantly different (at the .O1 level), the white intercept was greater
than the black intercept in all twenty cases.''
These findings about overprediction apply to the ordinary outcome
measures of academic and job performance. But it should also be noted
that "overprediction" can be a misleading concept when it is applied to
outcome measures for which the predictor (IQ, in our continuing ex-
ample) has very low validity. Inasmuch as blacks and whites differ on
average in their scores on some outcome that is not linked to the pre-
dictor, the more biased it will be against whites. Consider the next fig-
ure, constructed on the assumption that the predictor is nearly invalid
and that the two groups differ on average in their outcome levels.
630
Appendix 5
Appendix 5
63 1
A predictor with law validity may seem to be biased against whites
if there is a substantial difference in the outcome measure
Outcome measure
Black
Low I
Low
b High
Predictor
This situation is relevant to some of the outcome measures discussed
in Chapter 14, such as short-term male unemployment, where the black
and white means are quite different, but IQ has little relationship to
short-term unemployment for either whites or blacks. This figure was
constructed assuming only that there are factors influencing outcomes
that are not captured by the predictor, hence its low validity, resulting
in the low slope of the parallel regression lines.'"' The intercepts differ,
expressing the generally higher level of performance by whites com-
pared to blacks that is unexplained by the predictor variable. If we knew
what the missing predictive factors are, we could include them in the
predictor, and the intercept difference would vanish-and
so would the
implication that the newly constituted predictor is biased against
whites. What such results seem to be telling us is, first, that IQ tests are
not predictively biased against blacks but, second, that IQ tests alone
do not explain the observed black-white differences in outcomes. It
therefore often looks as if the IQ test is biased against whites.
More on lnternal Evidence of Bias: ltem Analysis
Laymen are often skeptical that IQ test items could measure anything
as deep as intelligence. Knowing the answers seems to them to depend
less on intelligence than on having been exposed to certain kinds of cul-
tural or historical information. It is usually a short step from here to the
conclusion that the tests must be biased. Pundits of varying sorts rein-
force this intuition about test item bias, claiming that the middle- and
upper-class white culture infuses test items even after vigorous efforts to
expunge it.
The data confirming Spearman's hypothesis, which we discussed at
some length in Chapter 13, provide the most convincing conceptual
refutation of this allegation by providing an alternative explanation that
has been borne out by many studies: the items on which blacks and
whites differ most widely are not those with the most esoteric cultural
content, but the ones that best measure the general intelligence factor,
g. l 2 Rut many other studies have directly asked whether the cultural con-
tent of items is associated with the magnitude of the black-white dif-
ference, which we review here.
One of the earliest of the studies, a 1951 doctoral thesis at Catholic
University, proceeded on the assumption that some test items are more
dependent on exposure to culture than others." Frank McGurk, the
study's author, consequently had large numbers of independent judges
rate many test items for their cultural loading. On exploratory tests, he
was able to establish each item's general difficulty, which is defined sim-
ply as the proportion of a population that gets the item wrong. He could
therefore identify pairs of items, one highly loaded with cultural infor-
mation and the other not highly loaded but of equal difficulty. Now, fi-
nally, the crucial evaluation could be made with a sample of black and
white high school students matched for schooling and socioeconomic
background. The black-white gap, he discovered, was about twice as
large on items rated as low in cultural loading as on items rated as high
in cultural loading. Consider, for example, a pair of equally difficult test
items. The one that is culturally loaded is probably difficult because it
draws on esoteric knowledge; the other item is probably difficult because
it calls on complex cognitive processing-g.
McGurk's results under-
mined the proposition that access to esoteric knowledge was to blame
for the black-white difference.
Another approach in the pursuit of test-item bias is based on which
items blacks and whites find hard or easy. Conceptually, this is much
like McGurk's approach, except that it does not require us to have items
rated by experts, a subjective procedure that some might find suspect.
Instead, if the cultural influence matters and if blacks and whites have
access to different cultural backgrounds, then items that pick up these
cultural differences should split the two groups. Items drawing on cul-
tural knowledge more available to whites than to blacks should be, o n
average, relatively easier for whites than for blacks. Items lacking this
Analyzing Test Item Bias
- Regression analysis shows that IQ tests are not predictively biased against blacks, though they do not fully explain outcome differences between races.
- Lay skepticism often attributes IQ score gaps to cultural or historical exposure rather than innate intelligence.
- Spearman's hypothesis suggests that the largest racial performance gaps occur on items measuring general intelligence (g) rather than those with esoteric cultural content.
- A landmark 1951 study by Frank McGurk found that the black-white gap was twice as large on items with low cultural loading compared to those with high cultural loading.
- Research indicates that items requiring complex cognitive processing, rather than specific cultural knowledge, account for the majority of the score variance.
- Alternative methods of detecting bias involve comparing which specific items different groups find difficult, regardless of expert ratings.
The black-white gap, he discovered, was about twice as large on items rated as low in cultural loading as on items rated as high in cultural loading.
630
Appendix 5
Appendix 5
63 1
A predictor with law validity may seem to be biased against whites
if there is a substantial difference in the outcome measure
Outcome measure
Black
Low I
Low
b High
Predictor
This situation is relevant to some of the outcome measures discussed
in Chapter 14, such as short-term male unemployment, where the black
and white means are quite different, but IQ has little relationship to
short-term unemployment for either whites or blacks. This figure was
constructed assuming only that there are factors influencing outcomes
that are not captured by the predictor, hence its low validity, resulting
in the low slope of the parallel regression lines.'"' The intercepts differ,
expressing the generally higher level of performance by whites com-
pared to blacks that is unexplained by the predictor variable. If we knew
what the missing predictive factors are, we could include them in the
predictor, and the intercept difference would vanish-and
so would the
implication that the newly constituted predictor is biased against
whites. What such results seem to be telling us is, first, that IQ tests are
not predictively biased against blacks but, second, that IQ tests alone
do not explain the observed black-white differences in outcomes. It
therefore often looks as if the IQ test is biased against whites.
More on lnternal Evidence of Bias: ltem Analysis
Laymen are often skeptical that IQ test items could measure anything
as deep as intelligence. Knowing the answers seems to them to depend
less on intelligence than on having been exposed to certain kinds of cul-
tural or historical information. It is usually a short step from here to the
conclusion that the tests must be biased. Pundits of varying sorts rein-
force this intuition about test item bias, claiming that the middle- and
upper-class white culture infuses test items even after vigorous efforts to
expunge it.
The data confirming Spearman's hypothesis, which we discussed at
some length in Chapter 13, provide the most convincing conceptual
refutation of this allegation by providing an alternative explanation that
has been borne out by many studies: the items on which blacks and
whites differ most widely are not those with the most esoteric cultural
content, but the ones that best measure the general intelligence factor,
g. l 2 Rut many other studies have directly asked whether the cultural con-
tent of items is associated with the magnitude of the black-white dif-
ference, which we review here.
One of the earliest of the studies, a 1951 doctoral thesis at Catholic
University, proceeded on the assumption that some test items are more
dependent on exposure to culture than others." Frank McGurk, the
study's author, consequently had large numbers of independent judges
rate many test items for their cultural loading. On exploratory tests, he
was able to establish each item's general difficulty, which is defined sim-
ply as the proportion of a population that gets the item wrong. He could
therefore identify pairs of items, one highly loaded with cultural infor-
mation and the other not highly loaded but of equal difficulty. Now, fi-
nally, the crucial evaluation could be made with a sample of black and
white high school students matched for schooling and socioeconomic
background. The black-white gap, he discovered, was about twice as
large on items rated as low in cultural loading as on items rated as high
in cultural loading. Consider, for example, a pair of equally difficult test
items. The one that is culturally loaded is probably difficult because it
draws on esoteric knowledge; the other item is probably difficult because
it calls on complex cognitive processing-g.
McGurk's results under-
mined the proposition that access to esoteric knowledge was to blame
for the black-white difference.
Another approach in the pursuit of test-item bias is based on which
items blacks and whites find hard or easy. Conceptually, this is much
like McGurk's approach, except that it does not require us to have items
rated by experts, a subjective procedure that some might find suspect.
Instead, if the cultural influence matters and if blacks and whites have
access to different cultural backgrounds, then items that pick up these
cultural differences should split the two groups. Items drawing on cul-
tural knowledge more available to whites than to blacks should be, o n
average, relatively easier for whites than for blacks. Items lacking this
Testing Item Bias Hypotheses
- Researchers test for racial bias by ranking test items from easiest to hardest for both black and white groups.
- Statistical analysis shows that the rank order of item difficulty is nearly identical across racial groups, often exceeding a .95 correlation.
- Apparent differences in item difficulty frequently disappear when comparing groups based on mental age rather than chronological age.
- The failure to find systematic item bias has led researchers to investigate if certain item formats, like identifying false responses, tap into 'g' differently.
- The 'home-court advantage' theory suggests that privileged groups score higher due to familiarity with the testing environment and coaching.
- Evidence suggests that coaching and practice effects for IQ tests are generally insignificant and only occur under very specific, rare conditions.
Relative item difficulties are essentially the same for both races (by sex). That is, blacks and whites of the same sex come close to finding the same item the easiest, the same item next easiest, all the way down to the hardest item.
632
Appendix 5
Appendix 5
633
tip for whites or items with a tip for blacks should not be differentially
easier for whites and may be easier for blacks.
This idea is tested by ranking the items on a test separately for whites
and for blacks, in order of difficulty. That is, the easiest item for whites
is the one with the highest proportion of correct answers among whites;
the next easiest item for whites is the one with the second highest pro-
portion of correct answers for whites; and so on. Now repeat the proce-
dure using the blacks' proportions of correct answers. This will result in
two sets of rank orders for all the items. The rank-order correlation he-
tween them is a measure of the test-item bias hypothesis: The larger the
correlation is, the less support the hypothesis finds. Alternatively, the
proportions of correct responses within each group are transformed into
standard scores and then correlated by some other measure of correla-
tion, such as the Pearson product-moment coefficient.
Either way, the result is clear. Relative item difficulties are essentially
the same for both races (by sex). That is, blacks and whites of the same
sex come close to finding the same item the easiest, the same item next
easiest, all the way down to the hardest item.'I4' When the rank order
of difficulty differs across races, the differences tend to be small and un-
systematic. Rank order correlations above .95 are not uncommon for
the items on the Wechsler and Stanford-Binet tests, which are, in fact,
the tests that provide most of the anecdotal material for arguing that
test items are biased. Pearson correlations are often somewhat lower but
typically still above .8. Moreover, when items do vary in difficulty across
races, most of the variation is eliminated by taking mental age into ac-
count. Since blacks and whites of the same chronological age differ on
average in mental age, allowing a compensating lag in chronological age
will neutralize the contribution of mental age. Compare, say, the item
difficulties for 10-year-old blacks with that for 9-year-old or 8-year-old
whites. When this is done, the correlations in difficulty almost all rise
into the .9 range and above.15
Because "item bias" ordinarily defined has failed to materialize, the
concept has been extended to encompass item characteristics that are
intertwined with the underlying rationale for thinking that an item mea-
sures g. For example, one researcher has found that the black-white gap
is diminished for items that call for the subject to identify the one false
response, compared to items requiring the subject to identify the one cor-
rect response. l h Is this a matter of bias, or a matter of how well the two
types of items tap the construct called intelligence? This in turn brings
us full circle to Spearman's hypothesis discussed in Chapter 13, which
offers an interpretative framework for explaining such differences.
More on Other Potential Sources of Bias
We turn now to one of the least precisely but most commonly argued
reasons for thinking that tests are biased: Tests are a sort of game, and,
as in most games, it helps to have played the testing game, it helps to
get coaching, and it helps to be playing on the home field. Privileged
groups get more practice and coaching than underprivileged groups.
They have a home-court advantage; the tests are given in familiar en-
vironments, administered by familiar kinds of people. A major part of
the racial differences in test scores may be attributed to these differences.
In this discussion, we begin with coaching and practice, then turn to
some of the other ways in which the testing situation might influence
scores.
PRACTICE AND COACHING. For IQ tests, coaching and practice are not
a significant issue because coaching and practice effects exist only un-
der conditions that virtually never apply. To get a sizable practice effect
for an IQ test, it is necessary to use subjects who have never taken an
IQ-like test, administer the identical test twice, and do so quickly (prefer-
ably within a few weeks)." If the subjects fail to meet any of those con-
ditions, the chances of finding a practice effect are small, and the size
of any effect, if one is found, will be just a few points. Coaching effects
are even harder to obtain. We are unable to identify any IQ data in any
study, large or small, in which the results are compromised because the
IQ scores of part of the sample have been obtained after this kind of ex-
perience. That's not the way that IQ tests have been administered any-
where to any significant sample at any time during the history of IQ
testin-xcept
to the samples used to assess practice and coaching ef-
fects, and sometimes to the subjects of intensive remedial programs such
as those discussed in Chapter 17.
The story regarding practice and coaching for such tests as the
Scholastic Aptitude Test (SAT), the Law School Admissions Test
(LSAT), and the Medical College Admissions Test (MCAT) is much
more contentious than the story about IQ. Many people do take these
tests more than once, many people practice for them, and many people
get extensive coaching. Moreover, these tests are supposed to be "coach-
able," insofar as they measure the verbal, reasoning, and analytic skills
Coaching and IQ Disparities
- Standardized IQ tests are remarkably resistant to practice and coaching effects unless administered under very specific, rapid-repetition conditions.
- Academic admissions tests like the SAT and MCAT are more susceptible to coaching because they measure skills enhanced by education and study habits.
- The decline in SAT scores between 1964 and 1980 suggests that the test measures 'coachable' or 'negatively coachable' academic variables.
- The theory that the black-white score gap is caused by unequal access to coaching requires that coaching benefit the lower-scoring group more than the higher-scoring group.
- Scientific studies use a four-group experimental design to isolate the 'interaction effect' between race and coaching to see if it reduces group differences.
That SAT scores declined by almost half a standard deviation from 1964 to 1980 strongly suggests that something coachable--or 'negatively coachable' in this example--is being measured.
632
Appendix 5
Appendix 5
633
tip for whites or items with a tip for blacks should not be differentially
easier for whites and may be easier for blacks.
This idea is tested by ranking the items on a test separately for whites
and for blacks, in order of difficulty. That is, the easiest item for whites
is the one with the highest proportion of correct answers among whites;
the next easiest item for whites is the one with the second highest pro-
portion of correct answers for whites; and so on. Now repeat the proce-
dure using the blacks' proportions of correct answers. This will result in
two sets of rank orders for all the items. The rank-order correlation he-
tween them is a measure of the test-item bias hypothesis: The larger the
correlation is, the less support the hypothesis finds. Alternatively, the
proportions of correct responses within each group are transformed into
standard scores and then correlated by some other measure of correla-
tion, such as the Pearson product-moment coefficient.
Either way, the result is clear. Relative item difficulties are essentially
the same for both races (by sex). That is, blacks and whites of the same
sex come close to finding the same item the easiest, the same item next
easiest, all the way down to the hardest item.'I4' When the rank order
of difficulty differs across races, the differences tend to be small and un-
systematic. Rank order correlations above .95 are not uncommon for
the items on the Wechsler and Stanford-Binet tests, which are, in fact,
the tests that provide most of the anecdotal material for arguing that
test items are biased. Pearson correlations are often somewhat lower but
typically still above .8. Moreover, when items do vary in difficulty across
races, most of the variation is eliminated by taking mental age into ac-
count. Since blacks and whites of the same chronological age differ on
average in mental age, allowing a compensating lag in chronological age
will neutralize the contribution of mental age. Compare, say, the item
difficulties for 10-year-old blacks with that for 9-year-old or 8-year-old
whites. When this is done, the correlations in difficulty almost all rise
into the .9 range and above.15
Because "item bias" ordinarily defined has failed to materialize, the
concept has been extended to encompass item characteristics that are
intertwined with the underlying rationale for thinking that an item mea-
sures g. For example, one researcher has found that the black-white gap
is diminished for items that call for the subject to identify the one false
response, compared to items requiring the subject to identify the one cor-
rect response. l h Is this a matter of bias, or a matter of how well the two
types of items tap the construct called intelligence? This in turn brings
us full circle to Spearman's hypothesis discussed in Chapter 13, which
offers an interpretative framework for explaining such differences.
More on Other Potential Sources of Bias
We turn now to one of the least precisely but most commonly argued
reasons for thinking that tests are biased: Tests are a sort of game, and,
as in most games, it helps to have played the testing game, it helps to
get coaching, and it helps to be playing on the home field. Privileged
groups get more practice and coaching than underprivileged groups.
They have a home-court advantage; the tests are given in familiar en-
vironments, administered by familiar kinds of people. A major part of
the racial differences in test scores may be attributed to these differences.
In this discussion, we begin with coaching and practice, then turn to
some of the other ways in which the testing situation might influence
scores.
PRACTICE AND COACHING. For IQ tests, coaching and practice are not
a significant issue because coaching and practice effects exist only un-
der conditions that virtually never apply. To get a sizable practice effect
for an IQ test, it is necessary to use subjects who have never taken an
IQ-like test, administer the identical test twice, and do so quickly (prefer-
ably within a few weeks)." If the subjects fail to meet any of those con-
ditions, the chances of finding a practice effect are small, and the size
of any effect, if one is found, will be just a few points. Coaching effects
are even harder to obtain. We are unable to identify any IQ data in any
study, large or small, in which the results are compromised because the
IQ scores of part of the sample have been obtained after this kind of ex-
perience. That's not the way that IQ tests have been administered any-
where to any significant sample at any time during the history of IQ
testin-xcept
to the samples used to assess practice and coaching ef-
fects, and sometimes to the subjects of intensive remedial programs such
as those discussed in Chapter 17.
The story regarding practice and coaching for such tests as the
Scholastic Aptitude Test (SAT), the Law School Admissions Test
(LSAT), and the Medical College Admissions Test (MCAT) is much
more contentious than the story about IQ. Many people do take these
tests more than once, many people practice for them, and many people
get extensive coaching. Moreover, these tests are supposed to be "coach-
able," insofar as they measure the verbal, reasoning, and analytic skills
634
Appendix 5
Appendix 5
63 5
that a good education is supposed to enhance, and prolonged exposure
to such coaching should produce better scores. Or to put it another way,
two students with the same IQ should be able to get different LSAT and
MCAT scores if one student has taken more appropriate courses and
studied harder than the other student. That SAT scores declined by al-
most half a standard deviation from 1964 to 1980 strongly suggests that
something coachable--or "negatively coachable" in this example-is
being measured. In Chapter 17, we discuss the effects of coaching for
the SAT, which are real but also smaller and harder to obtain than the
widely advertised claims of the coaching industry.
The belief that coaching might explain part of the black-white gap
often rests on a notion that, on the average, blacks receive less of the
practice and coaching that might have elevated their scores than does
the average white. We have already undermined this notion by show-
ing that the tests are biased against blacks neither predictively nor in
terms of particular item difficulties. There is, however, a literature that
bears more directly on this idea, by looking for an interaction effect he-
tween practice or coaching and race.
If practice and coaching explain any portion of a group difference in
scores in the population as a whole, then it necessarily follows that rep-
resentative samples of those groups who are equally well practiced and
well coached will show a smaller difference than is observed in the pop-
ulation at large. It is not enough that practice or coaching raises the
mean score of the lower-scoring group; it must raise its mean score more
than it raises the score of the higher-scoring group.
Several studies have investigated whether this is found for blacks and
whites. In a well-designed study, representative samples of blacks and
whites are randomly divided into two groups. The experimental black
and white groups receive identical coaching (or practice), and the con-
trol groups receive no treatment at all. At the end of the experiment,
the investigator has four different sets of results: test scores for coached
blacks, uncoached blacks, coached whites, and uncoached whites.
These results may be analyzed in three basic ways: One may compare
blacks overall with whites overall, which will reveal the main effect of
race; or the coached samples overall with the uncoached samples over-
all, which will reveal the main effect of the coaching; or the way in which
the effects of coaching vary according to the race of the persons being
coached, known as the interaction effect.
One study found a statistically significant differential response to
practice, but not to direct instruction, on a reasoning test, between
black and white college students.18 The differential advantage of prac-
tice for blacks compared to whites was about an eighth of the overall
black-white gap on this test. Other studies have failed to find even this
much of a differential response, or they have found differential re-
sponses in the opposite direction, tending to increase the black-white
gap after practi~e.'~
Taking the evidence as a whole, any differential
coaching and practice effects by race (or socioeconomic status) is at
most sporadic and small. If such a differential effect exists, it is too small
to he replicated reliably. The scattered evidence of a differential effect
is ahout as supportive of a white advantage from coaching as of a black
advantage.
EXAMINER EFFECTS AND OTHER SITUATIONAL VARIABLES. Is it possible
that disadvantaged groups come to the test with greater anxiety than
confident middle-class students, and this mental state depresses their
scores? That, when a black student takes a bus across town to an unfa-
miliar neighborhood and goes into a testing room filled with white stu-
dents and overseen by a white test supervisor, this situation has an
intimidating effect on performance? What about the time limits on
tests? Might these have more pronounced effects on disadvantaged stu-
dents than on test-wise middle-class students? All are plausible ques-
tions, but the answer to each is the same: 1nvest.igations to date give no
reason to believe that such considerations explain a nontrivial portion
of the group differences in scores.
The race of the examiner has been the subject of numerous studies.
Of those with adequate experimental designs, most have showed non-
significant effects; of the rest, the evidence is as strong that the pres-
ence of a white examiner reduces overall black-white difference as that
a white examiner exacerbates the difference.*' Examinations of the re-
sults of time pressures fail to demonstrate either that blacks do better in
untimed than in timed tests or that the test-taking "personal tempo" of
blacks is different from that of whites." Test anxiety has been investi-
gated extensively but, as in so many other aspects of this discussion, the
relationship tends to be the opposite of the expected one: To the extent
that test anxiety affects performance at all, it seems to help slightly. Only
a few studies have specifically addressed black-white differences in test
anxiety; they have shown either nonsignificant results, or that the white
subjects were slightly more anxious than the black subject^.^'
Testing Variables and Group Differences
- Research indicates that coaching and practice effects do not significantly or reliably reduce the score gap between black and white students.
- Situational factors, such as the race of the test examiner, have been found to have negligible or inconsistent impacts on student performance.
- Contrary to common assumptions, test anxiety does not explain group score differences and may even slightly improve performance in some cases.
- Studies on time limits show no evidence that disadvantaged students are disproportionately hindered by the 'personal tempo' required for timed tests.
- While language barriers affect non-English speakers, evidence suggests black students using 'black English' understand standard English at a high level.
- Overall, investigations into environmental and situational variables fail to explain a nontrivial portion of the observed group differences in test scores.
To the extent that test anxiety affects performance at all, it seems to help slightly.
634
Appendix 5
Appendix 5
63 5
that a good education is supposed to enhance, and prolonged exposure
to such coaching should produce better scores. Or to put it another way,
two students with the same IQ should be able to get different LSAT and
MCAT scores if one student has taken more appropriate courses and
studied harder than the other student. That SAT scores declined by al-
most half a standard deviation from 1964 to 1980 strongly suggests that
something coachable--or "negatively coachable" in this example-is
being measured. In Chapter 17, we discuss the effects of coaching for
the SAT, which are real but also smaller and harder to obtain than the
widely advertised claims of the coaching industry.
The belief that coaching might explain part of the black-white gap
often rests on a notion that, on the average, blacks receive less of the
practice and coaching that might have elevated their scores than does
the average white. We have already undermined this notion by show-
ing that the tests are biased against blacks neither predictively nor in
terms of particular item difficulties. There is, however, a literature that
bears more directly on this idea, by looking for an interaction effect he-
tween practice or coaching and race.
If practice and coaching explain any portion of a group difference in
scores in the population as a whole, then it necessarily follows that rep-
resentative samples of those groups who are equally well practiced and
well coached will show a smaller difference than is observed in the pop-
ulation at large. It is not enough that practice or coaching raises the
mean score of the lower-scoring group; it must raise its mean score more
than it raises the score of the higher-scoring group.
Several studies have investigated whether this is found for blacks and
whites. In a well-designed study, representative samples of blacks and
whites are randomly divided into two groups. The experimental black
and white groups receive identical coaching (or practice), and the con-
trol groups receive no treatment at all. At the end of the experiment,
the investigator has four different sets of results: test scores for coached
blacks, uncoached blacks, coached whites, and uncoached whites.
These results may be analyzed in three basic ways: One may compare
blacks overall with whites overall, which will reveal the main effect of
race; or the coached samples overall with the uncoached samples over-
all, which will reveal the main effect of the coaching; or the way in which
the effects of coaching vary according to the race of the persons being
coached, known as the interaction effect.
One study found a statistically significant differential response to
practice, but not to direct instruction, on a reasoning test, between
black and white college students.18 The differential advantage of prac-
tice for blacks compared to whites was about an eighth of the overall
black-white gap on this test. Other studies have failed to find even this
much of a differential response, or they have found differential re-
sponses in the opposite direction, tending to increase the black-white
gap after practi~e.'~
Taking the evidence as a whole, any differential
coaching and practice effects by race (or socioeconomic status) is at
most sporadic and small. If such a differential effect exists, it is too small
to he replicated reliably. The scattered evidence of a differential effect
is ahout as supportive of a white advantage from coaching as of a black
advantage.
EXAMINER EFFECTS AND OTHER SITUATIONAL VARIABLES. Is it possible
that disadvantaged groups come to the test with greater anxiety than
confident middle-class students, and this mental state depresses their
scores? That, when a black student takes a bus across town to an unfa-
miliar neighborhood and goes into a testing room filled with white stu-
dents and overseen by a white test supervisor, this situation has an
intimidating effect on performance? What about the time limits on
tests? Might these have more pronounced effects on disadvantaged stu-
dents than on test-wise middle-class students? All are plausible ques-
tions, but the answer to each is the same: 1nvest.igations to date give no
reason to believe that such considerations explain a nontrivial portion
of the group differences in scores.
The race of the examiner has been the subject of numerous studies.
Of those with adequate experimental designs, most have showed non-
significant effects; of the rest, the evidence is as strong that the pres-
ence of a white examiner reduces overall black-white difference as that
a white examiner exacerbates the difference.*' Examinations of the re-
sults of time pressures fail to demonstrate either that blacks do better in
untimed than in timed tests or that the test-taking "personal tempo" of
blacks is different from that of whites." Test anxiety has been investi-
gated extensively but, as in so many other aspects of this discussion, the
relationship tends to be the opposite of the expected one: To the extent
that test anxiety affects performance at all, it seems to help slightly. Only
a few studies have specifically addressed black-white differences in test
anxiety; they have shown either nonsignificant results, or that the white
subjects were slightly more anxious than the black subject^.^'
636
Appendix 5
Appendix 5
63 7
"BLACK ENGLISH." Language looms larger. It is well established that the
students from many different cultural backgrounds for whom English is
a second language tend to score better on the nonverbal part of the test
than a verbal component given in ~ n ~ l i s h . ~ ~
Whereas this imbalance
may be independent of language for East Asians (Japanese in Japan have
superior nonverbal scores even taking verbal test batteries designed in
Japanese), it is also manifest among Latinos, who do not otherwise ex-
hibit the characteristic East Asian verbal-nonverbal pattern. This sug-
gests that students who are taking the test in a second language suffer
some decrement of their scores.
It has been a small step from this to hypothesize that, for practical
purposes, many blacks are taking the test in a "second language," with
their first language being the dialect known as "black English," ubiqui-
tous in the black inner city and used to some extent by blacks of broader
socioeconomic backgrounds. Researchers have approached the issue in
several ways. First, the evidence indicates that black children who use
black English understand standard English at least as we11.14 A more di-
rect test came in the 1970s, when L. C. Quay had the Stanford-Binet
translated into black dialect and tested several samples with both the
original and the revised version. The studies produced no evidence that
black students in any of the various test groups benefited (the differ-
ences in scores from the two tests generally amounted to less than one
1Q point).25 But the most powerful data suggesting that language does
not explain the black-white difference is provided by the evidence for
Spearman's hypothesis presented in Chapter 13: If language were the
problem, then blacks would be at the greatest disadvantage on test items
that rely on a knowledge of standard English and be at the least disad-
vantage on test items that use no language at all. As we discuss with re-
gard to Spearman's hypothesis in Chapter 13, this expectation is
contradicted by a large and consistent body of work. Black populations
generally do relatively better on test items that are less saturated with g
and relatively worse on items more saturated with g, whether the iterns
are verbal or nonverbal.
The Continuing Debate
Allegations that standardized tests are culturally biased still appear, and
presumably this account will fuel additional ones. What about all the
articles appearing in many quarters making these claims? They make up
a varied lot, but typically consist of allegations that ignore the data. A
particularly striking example was a long article entitled "IQ and Stan-
dard English," which appeared in a technical journal and attributed the
black-white IQ test differences to language difficulties. The article was
followed by four responses, plus by a counterstatement by the author.
Neither the original article nor any of the responses cited any of the
data discussed above.26 The debate was carried on entirely on the basis
of argumentation about the extent to which black culture is more orally
based than white culture. This readiness to theorize about what might
he true about black-white differences in test scores while ignoring the
pertinent data is common.
Other articles, cited in the note, have discussed a variety of ways in
which culture interacts with human functioning, intellectual and oth-
e r w i ~ e . ~ ~
The movement surrounding Howard Gardner's concept of
multiple intelligences (see the Introduction) is only the best known of
these new ways of talking about intelligence. But these discussions do
not try to argue with the two core statements that we have made: In the
major standardized tests, test items function in the same way for both
blacks and whites, and the tests results are similarly predictive for blacks
and whites, tending to overpredict black performance rather than un-
derpredict it.
In the popular media, the persistence of belief in cultural bias, we
think, is based on a misapprehension. To many people, proof that tests
are unbiased seems tantamount to proof that the black-white gap re-
flects genetic differences in intelligence. Since they reject the possibil-
ity that genetic differences could be involved, the tests must he biased.
One of the major purposes of Chapter 13 is to discredit both the no-
tion that real differences in intelligence must be genetically founded
and the assumption that a role for genes must have horrific con-
sequences.
IS THE BLACK-WHITE DIFFERENCE IN COGNITIVE ABILITY
SHRINKING?
The text discusses the evidence for converging black and white test
scores on the NAEP (National Assessment of Education Progress) and
Debating Cultural Bias in Testing
- Studies translating the Stanford-Binet into black dialect showed no significant improvement in scores, suggesting language is not the primary barrier.
- Evidence for Spearman's hypothesis indicates that black-white score gaps are more related to the 'g' factor of general intelligence than to verbal or nonverbal item formats.
- Academic and technical debates often ignore empirical data in favor of theoretical arguments about oral versus written cultural traditions.
- Standardized tests are found to function similarly for both groups and tend to overpredict rather than underpredict black performance.
- Public belief in test bias often stems from a fear that acknowledging unbiased tests necessitates a genetic explanation for score gaps.
- The authors argue that intelligence differences do not have to be genetically founded, nor do genetic roles imply horrific social consequences.
This readiness to theorize about what might be true about black-white differences in test scores while ignoring the pertinent data is common.
636
Appendix 5
Appendix 5
63 7
"BLACK ENGLISH." Language looms larger. It is well established that the
students from many different cultural backgrounds for whom English is
a second language tend to score better on the nonverbal part of the test
than a verbal component given in ~ n ~ l i s h . ~ ~
Whereas this imbalance
may be independent of language for East Asians (Japanese in Japan have
superior nonverbal scores even taking verbal test batteries designed in
Japanese), it is also manifest among Latinos, who do not otherwise ex-
hibit the characteristic East Asian verbal-nonverbal pattern. This sug-
gests that students who are taking the test in a second language suffer
some decrement of their scores.
It has been a small step from this to hypothesize that, for practical
purposes, many blacks are taking the test in a "second language," with
their first language being the dialect known as "black English," ubiqui-
tous in the black inner city and used to some extent by blacks of broader
socioeconomic backgrounds. Researchers have approached the issue in
several ways. First, the evidence indicates that black children who use
black English understand standard English at least as we11.14 A more di-
rect test came in the 1970s, when L. C. Quay had the Stanford-Binet
translated into black dialect and tested several samples with both the
original and the revised version. The studies produced no evidence that
black students in any of the various test groups benefited (the differ-
ences in scores from the two tests generally amounted to less than one
1Q point).25 But the most powerful data suggesting that language does
not explain the black-white difference is provided by the evidence for
Spearman's hypothesis presented in Chapter 13: If language were the
problem, then blacks would be at the greatest disadvantage on test items
that rely on a knowledge of standard English and be at the least disad-
vantage on test items that use no language at all. As we discuss with re-
gard to Spearman's hypothesis in Chapter 13, this expectation is
contradicted by a large and consistent body of work. Black populations
generally do relatively better on test items that are less saturated with g
and relatively worse on items more saturated with g, whether the iterns
are verbal or nonverbal.
The Continuing Debate
Allegations that standardized tests are culturally biased still appear, and
presumably this account will fuel additional ones. What about all the
articles appearing in many quarters making these claims? They make up
a varied lot, but typically consist of allegations that ignore the data. A
particularly striking example was a long article entitled "IQ and Stan-
dard English," which appeared in a technical journal and attributed the
black-white IQ test differences to language difficulties. The article was
followed by four responses, plus by a counterstatement by the author.
Neither the original article nor any of the responses cited any of the
data discussed above.26 The debate was carried on entirely on the basis
of argumentation about the extent to which black culture is more orally
based than white culture. This readiness to theorize about what might
he true about black-white differences in test scores while ignoring the
pertinent data is common.
Other articles, cited in the note, have discussed a variety of ways in
which culture interacts with human functioning, intellectual and oth-
e r w i ~ e . ~ ~
The movement surrounding Howard Gardner's concept of
multiple intelligences (see the Introduction) is only the best known of
these new ways of talking about intelligence. But these discussions do
not try to argue with the two core statements that we have made: In the
major standardized tests, test items function in the same way for both
blacks and whites, and the tests results are similarly predictive for blacks
and whites, tending to overpredict black performance rather than un-
derpredict it.
In the popular media, the persistence of belief in cultural bias, we
think, is based on a misapprehension. To many people, proof that tests
are unbiased seems tantamount to proof that the black-white gap re-
flects genetic differences in intelligence. Since they reject the possibil-
ity that genetic differences could be involved, the tests must he biased.
One of the major purposes of Chapter 13 is to discredit both the no-
tion that real differences in intelligence must be genetically founded
and the assumption that a role for genes must have horrific con-
sequences.
IS THE BLACK-WHITE DIFFERENCE IN COGNITIVE ABILITY
SHRINKING?
The text discusses the evidence for converging black and white test
scores on the NAEP (National Assessment of Education Progress) and
638
Appendix 5
Appendix 5
639
the SAT. Here, we summarize other sources of data about the two eth-
nic populations.
National High School Studies, 1972 and 1980
In 1972 and 1980, the federal government sponsored large-sample stud-
ies intended to provide reliable national estimates of the high school
population. As part of both studies, tests measuring vocabulary, reading,
and mathematics were administered to all participants. Although not
technically IQ tests, all three had high g loadings. Furthermore, the tests
were virtually identical for the two test administrations,12*' and the study
procedures in 1980 were deliberately constructed to maximize the com-
parability of the two samples. In 1982, the sophomores from the 1980
sample were tested as seniors. The table below summarizes the results
for the three test years by ethnic group. The black-white difference di-
minished on two of the three tests, but all of the shrinkage came about
because white scores fell, not because black scores rose. Indeed, black
scores also fell on all three tests but (except in the case of vocabulary),
by less than the reduction in white scores.
Black-White Difference for High School Seniors in
1972, 1980, and 1982
White-Black Difference, in SDs
1972
1980
1982
Vocabulary
1 .OO
.87
1.02
Reading
.99
.85
.78
Math
1.09
.9 1
.86
Source: Rock et al. 1985, Appendixes B.C, E.
Colkge Board Achievement Tests
THE SAT. In Chapter 13, we noted that the overall black-white gap in
SAT scores had narrowed between 1976 and 1993, from 1.16 to .88 stan-
dard deviation in the verbal portion of the test and from 1.27 to .92
standard deviation in the mathematics portion of the test." More de-
tailed breakdowns are available for the period 1980 to 1991, as shown
in the table below. The trend is consistently positive, with narrowing
Reductions in the Black-White Difference on the
Scholastic Aptitude and Achievement Tests, 1980-1991
White-Black Difference, in SDs
1980
1991
Change
SAT-Verbal
1.09
.87
-.22
Reading subscore
.93
.83
-.lo
Vocabulary subscore
1.09
-83
-.26
SAT-Math
1.10
.90
-.20
Test of standard written English
1.1 1
.89
-.22
Achievement tests
Overall average
.83
.78
-.05
English Composition
.73
.7 1
-.02
Literature
.86
.76
-.lo
American History
-69
.69
.OO
European History
.81
.56
-.25
Math I
.75
.75
.OO
Math I1
.98
.83
-.I5
Biology
.77
.68
-.09
Chemistry
.69
-74
+.05
Physics
.84
.74
-.lo
French
.33
.18
-.I5
German
.64
.27
-.37
Latin
.66
.25
-.4 1
Spanish
.50
.35
-.I5
Source: The College Board's annual summaries of test scores hy ethnicity.
black-white differences of at least .1 standard deviation units on the
tests for Literature. European History, Math 11, Physics, French, Ger-
man, Latin, and Spanish. The average shrinkage of the gap is .05 stan-
dard deviation unit. From further analyses, we conclude that the
narrowing is not entirely explained away by changes in the representa-
tiveness of the black and white samples of test takers or by declining
white scores.
To interpret the changes in scores on achievement tests, which are
taken by small proportions of the SAT test takers, we used the mean
that the College Board provides on the SAT Verbal and Math scores for
each achievement test population in each year. The question we asked
was: For a given achievement test, how did the place of the average test
taker on his race's cognitive ability distribution change from 1980 to
Trends in Ethnic Test Gaps
- Longitudinal data from 1972 to 1982 shows a narrowing of the black-white score gap in reading and math among high school seniors.
- The reduction in the gap during the early 1980s was primarily driven by a decline in white scores rather than an increase in black scores.
- Data from the SAT between 1980 and 1991 indicates a more positive trend, with the verbal gap narrowing by 0.22 and the math gap by 0.20 standard deviations.
- Achievement test gaps in specific subjects like European History, Latin, and German showed significant shrinkage during the 1980s.
- Statistical analysis suggests that the narrowing of the SAT gap cannot be fully explained by changes in sample representativeness or declining white performance.
- Researchers used percentile distributions to determine if self-selection among test-takers artificially inflated the narrowing of the achievement gaps.
The black-white difference diminished on two of the three tests, but all of the shrinkage came about because white scores fell, not because black scores rose.
638
Appendix 5
Appendix 5
639
the SAT. Here, we summarize other sources of data about the two eth-
nic populations.
National High School Studies, 1972 and 1980
In 1972 and 1980, the federal government sponsored large-sample stud-
ies intended to provide reliable national estimates of the high school
population. As part of both studies, tests measuring vocabulary, reading,
and mathematics were administered to all participants. Although not
technically IQ tests, all three had high g loadings. Furthermore, the tests
were virtually identical for the two test administrations,12*' and the study
procedures in 1980 were deliberately constructed to maximize the com-
parability of the two samples. In 1982, the sophomores from the 1980
sample were tested as seniors. The table below summarizes the results
for the three test years by ethnic group. The black-white difference di-
minished on two of the three tests, but all of the shrinkage came about
because white scores fell, not because black scores rose. Indeed, black
scores also fell on all three tests but (except in the case of vocabulary),
by less than the reduction in white scores.
Black-White Difference for High School Seniors in
1972, 1980, and 1982
White-Black Difference, in SDs
1972
1980
1982
Vocabulary
1 .OO
.87
1.02
Reading
.99
.85
.78
Math
1.09
.9 1
.86
Source: Rock et al. 1985, Appendixes B.C, E.
Colkge Board Achievement Tests
THE SAT. In Chapter 13, we noted that the overall black-white gap in
SAT scores had narrowed between 1976 and 1993, from 1.16 to .88 stan-
dard deviation in the verbal portion of the test and from 1.27 to .92
standard deviation in the mathematics portion of the test." More de-
tailed breakdowns are available for the period 1980 to 1991, as shown
in the table below. The trend is consistently positive, with narrowing
Reductions in the Black-White Difference on the
Scholastic Aptitude and Achievement Tests, 1980-1991
White-Black Difference, in SDs
1980
1991
Change
SAT-Verbal
1.09
.87
-.22
Reading subscore
.93
.83
-.lo
Vocabulary subscore
1.09
-83
-.26
SAT-Math
1.10
.90
-.20
Test of standard written English
1.1 1
.89
-.22
Achievement tests
Overall average
.83
.78
-.05
English Composition
.73
.7 1
-.02
Literature
.86
.76
-.lo
American History
-69
.69
.OO
European History
.81
.56
-.25
Math I
.75
.75
.OO
Math I1
.98
.83
-.I5
Biology
.77
.68
-.09
Chemistry
.69
-74
+.05
Physics
.84
.74
-.lo
French
.33
.18
-.I5
German
.64
.27
-.37
Latin
.66
.25
-.4 1
Spanish
.50
.35
-.I5
Source: The College Board's annual summaries of test scores hy ethnicity.
black-white differences of at least .1 standard deviation units on the
tests for Literature. European History, Math 11, Physics, French, Ger-
man, Latin, and Spanish. The average shrinkage of the gap is .05 stan-
dard deviation unit. From further analyses, we conclude that the
narrowing is not entirely explained away by changes in the representa-
tiveness of the black and white samples of test takers or by declining
white scores.
To interpret the changes in scores on achievement tests, which are
taken by small proportions of the SAT test takers, we used the mean
that the College Board provides on the SAT Verbal and Math scores for
each achievement test population in each year. The question we asked
was: For a given achievement test, how did the place of the average test
taker on his race's cognitive ability distribution change from 1980 to
640
Appendix 5
Appendix 5
64 1
1991? For example, the average white taking the Literature achieve-
ment test in 1980 had an SAT Verbal score that put him at the 80th
percentile of white testees; in 1991, he was at the 85thpercentile. Mean-
while, the average black taking the Literature achievement test in 1980
had an SAT Verbal score that put him at the 88th percentile of all hlack
SAT testees; in 1991, he was still at the 88th percentile of the hlack dis-
tribution. The difference between blacks and whites on the Literature
achievement test narrowed during that period, but, given where the
blacks and whites were relative to the white and black SAT distribu-
tions, it seems unlikely that the narrowing was caused by changes in the
self-selection that artificially raised black scores relative to whites. Ten
of the thirteen achievement tests fit this pattern. In only three cases
(European History, Physics, and German) did changes in the SAT Math
or Verbal scores indicate that the black pool had become differentially
more selective. Only in the case of German was this difference large
enough to account plausibly for much of the black improvement rela-
tive to whites.
THE ACT. The College Board's major competitor in the college en-
trance examination business is the American College Testing program,
which has also shown decreasing differences between black and white
students who take the test, as summarized in the table below. ReJuc-
Black-White Difference in the ACT, 1970-199 1
White-Black Difference, in SDs
1970
1991
Change
English
1.14
.83
-.3 1
Math
.86
.77
-.09
Science
.97
.91
-.06
Composite
1.12
.96
-. 16
Source: ACT 1991, Tahles 1 4; Congressional Budget Office 1986, FIE. E-2.
tions in the gap occurred in all the subtests between 1970 and 1991,
with by far the largest reduction on the English subtest. The magnitilde
of the overall change in the composite is about half the size of the re-
duction observed in the black-white difference on the SAT. Like the
SAT population, the ACT'S population of black test takers has been in-
creasing, suggesting that the increases in scores are not the result of a
more selective test-taking population.
THE
GRADUATE RECORD EXAMINATION
(GRE). The GRE is the equiva-
lent of the SAT for admission to graduate school in the arts and sci-
ences. Not many people in any cohort take the GRE, so the sample is
obviously highly self-selected and atypical of the population. In 1988,
for example, the number of white GRE test takers represented only 5.6
percent of the 22-year-old white population; black test takers repre-
sented 2.3 percent of its 22-year-old population. O n the other hand, the
proportions in 1988 were about the same as they were in 1979. The self-
selection process has remained fairly steady over the years, so it is worth
at least mentioning the results, as shown in the table below. The GRE
Black-White Difference in the GRE, 1979-1988
White-Black Difference, in SDs
1979
1988
Change
Verbal
1.25
1.13
-.I2
Math
1.28
1.13
-.I5
Analytical
1.46
1.2 1
-.25
Source. Graduate Record Examlnatlon Board.
gap narrowed only slightly less than that for the SAT. Another positive
note is that the narrowing was achieved because black scores rose more
than white scores, not because white scores were falling.
These results from national tests are echoed in state-level data from
Texas and North Carolina, as reported in the Congressional Budget Of-
fice's survey of trends in educational a~hievement.~"verall, the evi-
dence seems clear beyond a reasonable doubt: O n college entrance tests
and national tests of educational proficiency, the gap between whites
and blacks remained large into the early 1990s, but it had been nar-
rowing in the preceding decade or two. The optimist may argue that the
trend will continue indefinitely if improvements in the environment
and education for American blacks can be continued. The pessimist may
note that there seems to have been little narrowing since the mid-1980s,
as we observed in the text for Chapter 13, and that the black-white IQ
Narrowing Racial Achievement Gaps
- Data from the ACT and GRE show a consistent reduction in the score gap between black and white students from the 1970s through the early 1990s.
- The reduction in the ACT gap was most pronounced in the English subtest, though the overall composite change was smaller than that seen in the SAT.
- The narrowing of the GRE gap is particularly notable because it resulted from rising black scores rather than a decline in white performance.
- Evidence suggests these improvements are not merely the result of a more selective pool of test-takers, as the population of black students taking these tests has increased.
- While the historical trend shows a narrowing gap, recent data from the mid-1980s onward suggests a potential plateau or even a widening in the next generation.
- The text introduces J. Philippe Rushton's controversial theories regarding genetic racial differences and reproductive strategies as a counterpoint to environmental explanations.
Another positive note is that the narrowing was achieved because black scores rose more than white scores, not because white scores were falling.
640
Appendix 5
Appendix 5
64 1
1991? For example, the average white taking the Literature achieve-
ment test in 1980 had an SAT Verbal score that put him at the 80th
percentile of white testees; in 1991, he was at the 85thpercentile. Mean-
while, the average black taking the Literature achievement test in 1980
had an SAT Verbal score that put him at the 88th percentile of all hlack
SAT testees; in 1991, he was still at the 88th percentile of the hlack dis-
tribution. The difference between blacks and whites on the Literature
achievement test narrowed during that period, but, given where the
blacks and whites were relative to the white and black SAT distribu-
tions, it seems unlikely that the narrowing was caused by changes in the
self-selection that artificially raised black scores relative to whites. Ten
of the thirteen achievement tests fit this pattern. In only three cases
(European History, Physics, and German) did changes in the SAT Math
or Verbal scores indicate that the black pool had become differentially
more selective. Only in the case of German was this difference large
enough to account plausibly for much of the black improvement rela-
tive to whites.
THE ACT. The College Board's major competitor in the college en-
trance examination business is the American College Testing program,
which has also shown decreasing differences between black and white
students who take the test, as summarized in the table below. ReJuc-
Black-White Difference in the ACT, 1970-199 1
White-Black Difference, in SDs
1970
1991
Change
English
1.14
.83
-.3 1
Math
.86
.77
-.09
Science
.97
.91
-.06
Composite
1.12
.96
-. 16
Source: ACT 1991, Tahles 1 4; Congressional Budget Office 1986, FIE. E-2.
tions in the gap occurred in all the subtests between 1970 and 1991,
with by far the largest reduction on the English subtest. The magnitilde
of the overall change in the composite is about half the size of the re-
duction observed in the black-white difference on the SAT. Like the
SAT population, the ACT'S population of black test takers has been in-
creasing, suggesting that the increases in scores are not the result of a
more selective test-taking population.
THE
GRADUATE RECORD EXAMINATION
(GRE). The GRE is the equiva-
lent of the SAT for admission to graduate school in the arts and sci-
ences. Not many people in any cohort take the GRE, so the sample is
obviously highly self-selected and atypical of the population. In 1988,
for example, the number of white GRE test takers represented only 5.6
percent of the 22-year-old white population; black test takers repre-
sented 2.3 percent of its 22-year-old population. O n the other hand, the
proportions in 1988 were about the same as they were in 1979. The self-
selection process has remained fairly steady over the years, so it is worth
at least mentioning the results, as shown in the table below. The GRE
Black-White Difference in the GRE, 1979-1988
White-Black Difference, in SDs
1979
1988
Change
Verbal
1.25
1.13
-.I2
Math
1.28
1.13
-.I5
Analytical
1.46
1.2 1
-.25
Source. Graduate Record Examlnatlon Board.
gap narrowed only slightly less than that for the SAT. Another positive
note is that the narrowing was achieved because black scores rose more
than white scores, not because white scores were falling.
These results from national tests are echoed in state-level data from
Texas and North Carolina, as reported in the Congressional Budget Of-
fice's survey of trends in educational a~hievement.~"verall, the evi-
dence seems clear beyond a reasonable doubt: O n college entrance tests
and national tests of educational proficiency, the gap between whites
and blacks remained large into the early 1990s, but it had been nar-
rowing in the preceding decade or two. The optimist may argue that the
trend will continue indefinitely if improvements in the environment
and education for American blacks can be continued. The pessimist may
note that there seems to have been little narrowing since the mid-1980s,
as we observed in the text for Chapter 13, and that the black-white IQ
642
Appendix 5
Appendix 5
643
gap in the NLSY seems to be widening rather narrowing in the next
generation, as we discussed in Chapter 15.
RUSHTON ON RACE DIFFERENCES AND REPRODUCTIVE
STRATEGIES
Controversy unprecedented even for the contentious subject of racial
differences has erupted around the work of J. Philippe Rushton, a
developmental psychologist at the University of Western Ontario.
Rushton argues that the differences in the average intelligence test
scores among East Asians, blacks, and whites are not only primarily
genetic but part of a complex of racial differences that includes such
variables as brain size," genital size, rate of sexual maturation, length
of the menstrual cycle, frequency of sexual intercourse, gamete
production, sexual hormone levels, the tendency to produce dizygotic
twins, marital stability, infant mortality, altruism, law abidingness, and
mental health. For each variable, Rushton has concluded, the three
races-Mongoloids,
Caucasoids, and Negroids-fall
in a certain order,
with the average Caucasoid in the middle and the other two races on
one side or the other. The ordering of the races, he further argues, has
an evolutionary basis; hence these ordered racial differences must in-
volve genes.
To reach his conclusion, Rushton starts with the well-established
observation in biology that species vary in their reproductive strategies.
Some species produce many offspring (per parent) of which only a small
fraction survive; others produce small numbers of offspring with rela-
tively high survival rates. The involvement of parents in their offsprings'
health and development (which biologists call "parental investment")
tends to be high for species having few offspring and high survival rates
and low for those employing the other strategy (many offspring and low
survival rates). Many other species differences are concomitant with this
fundamental one, according to standard biological doctrine.
Rushton's thesis is that this standard biological principle may be ap-
plied within our own species. Rushton acknowledges that human be-
ings are as a species far out along the continuum of low reproduction,
high offspring survival, and high parental investment, but he argues that
the ordering of the races on the many variables he has identified can be
explained as the result of evolutionary differences in how far out the
races are. According to Rushton, the average Mongoloid is toward one
end of the continuum of reproductive strategies-the
few offspring, high
survival, and high parental investment end-the
average Negroid is
shifted toward the other end, and the average Caucasoid is in the
middle.
Rushton paints with a broad brush, focusing on the major racial cat-
egories rather than the dozens of more finely drawn reproductively
isolated human populations that might test his theory more con-
clusively. But beyond that, his thesis raises numerous questions-moral,
pragmatic, and scientific. Many critics attack the theory on scientific,
not just moral, grounds. They question whether Rushton has really
shown that the races are consistently ordered in the way he says they
are, or whether a biological theory that was meant to explain species
differences can be properly applied to groups within a single species, or
whether the evidence for genetic influences o n his variables stands up.
Rushton has responded to his critics with increasingly detailed and con*
vincing empirical reports of the race differences in some of the traits on
his list, and he cites preeminent biological authority for his use of the
concept of reproductive strategies. He has strengthened the case for
consistently ordered race differences, at least for some of the variables
he discusses, since his first formulation of the theory in 1985. Never-
theless, the theory remains a long way from confirmation.
We cannot at present say who is more nearly right as a matter of sci-
ence, Rushton or his critics." However, Rushton's work is not that of a
crackpot or a bigot, as many of his critics are given to charging. Nor are
we sympathetic with Rushton's academic colleagues or the politicians
in Ontario who have called for his peremptory dismissal from a tenured
professorship. Setting aside whether his work is timely or worthwhile-
a judgment we are loath to make under any circumstances-it
is plainly
science. He is not alone in seeking an evolutionary explanation of the
observed differences among the races.'33' As science, there is nothing
wrong with Rushton's work in principle; we expect that time will tell
whether it is right or wrong in fact.
Rushton's Racial Evolutionary Theory
- J. Philippe Rushton proposes that racial differences in behavior and biology are rooted in evolutionary reproductive strategies.
- The theory applies the biological concept of 'parental investment,' where species balance between producing many offspring or investing heavily in a few.
- Rushton argues that Mongoloids, Caucasoids, and Negroids fall into a consistent order across variables like brain size, maturation rate, and social stability.
- Critics challenge the validity of applying species-level biological doctrines to subgroups within the single human species.
- While the theory remains unconfirmed and highly controversial, the authors defend Rushton's work as legitimate scientific inquiry rather than bigotry.
- The debate involves complex questions regarding the genetic basis of racial differences and the ethics of academic freedom.
However, Rushton's work is not that of a crackpot or a bigot, as many of his critics are given to charging.
642
Appendix 5
Appendix 5
643
gap in the NLSY seems to be widening rather narrowing in the next
generation, as we discussed in Chapter 15.
RUSHTON ON RACE DIFFERENCES AND REPRODUCTIVE
STRATEGIES
Controversy unprecedented even for the contentious subject of racial
differences has erupted around the work of J. Philippe Rushton, a
developmental psychologist at the University of Western Ontario.
Rushton argues that the differences in the average intelligence test
scores among East Asians, blacks, and whites are not only primarily
genetic but part of a complex of racial differences that includes such
variables as brain size," genital size, rate of sexual maturation, length
of the menstrual cycle, frequency of sexual intercourse, gamete
production, sexual hormone levels, the tendency to produce dizygotic
twins, marital stability, infant mortality, altruism, law abidingness, and
mental health. For each variable, Rushton has concluded, the three
races-Mongoloids,
Caucasoids, and Negroids-fall
in a certain order,
with the average Caucasoid in the middle and the other two races on
one side or the other. The ordering of the races, he further argues, has
an evolutionary basis; hence these ordered racial differences must in-
volve genes.
To reach his conclusion, Rushton starts with the well-established
observation in biology that species vary in their reproductive strategies.
Some species produce many offspring (per parent) of which only a small
fraction survive; others produce small numbers of offspring with rela-
tively high survival rates. The involvement of parents in their offsprings'
health and development (which biologists call "parental investment")
tends to be high for species having few offspring and high survival rates
and low for those employing the other strategy (many offspring and low
survival rates). Many other species differences are concomitant with this
fundamental one, according to standard biological doctrine.
Rushton's thesis is that this standard biological principle may be ap-
plied within our own species. Rushton acknowledges that human be-
ings are as a species far out along the continuum of low reproduction,
high offspring survival, and high parental investment, but he argues that
the ordering of the races on the many variables he has identified can be
explained as the result of evolutionary differences in how far out the
races are. According to Rushton, the average Mongoloid is toward one
end of the continuum of reproductive strategies-the
few offspring, high
survival, and high parental investment end-the
average Negroid is
shifted toward the other end, and the average Caucasoid is in the
middle.
Rushton paints with a broad brush, focusing on the major racial cat-
egories rather than the dozens of more finely drawn reproductively
isolated human populations that might test his theory more con-
clusively. But beyond that, his thesis raises numerous questions-moral,
pragmatic, and scientific. Many critics attack the theory on scientific,
not just moral, grounds. They question whether Rushton has really
shown that the races are consistently ordered in the way he says they
are, or whether a biological theory that was meant to explain species
differences can be properly applied to groups within a single species, or
whether the evidence for genetic influences o n his variables stands up.
Rushton has responded to his critics with increasingly detailed and con*
vincing empirical reports of the race differences in some of the traits on
his list, and he cites preeminent biological authority for his use of the
concept of reproductive strategies. He has strengthened the case for
consistently ordered race differences, at least for some of the variables
he discusses, since his first formulation of the theory in 1985. Never-
theless, the theory remains a long way from confirmation.
We cannot at present say who is more nearly right as a matter of sci-
ence, Rushton or his critics." However, Rushton's work is not that of a
crackpot or a bigot, as many of his critics are given to charging. Nor are
we sympathetic with Rushton's academic colleagues or the politicians
in Ontario who have called for his peremptory dismissal from a tenured
professorship. Setting aside whether his work is timely or worthwhile-
a judgment we are loath to make under any circumstances-it
is plainly
science. He is not alone in seeking an evolutionary explanation of the
observed differences among the races.'33' As science, there is nothing
wrong with Rushton's work in principle; we expect that time will tell
whether it is right or wrong in fact.
Regression Analyses Methodology
- The appendix details the statistical framework for analyzing ethnic differences across black, Latino, and white populations using NLSY data.
- Researchers utilized separate regressions for each ethnic group to allow for independent slopes rather than constraining them to a single nominal variable.
- Logistic regression was applied to binary indicators, while ordinary least squares regression was used to estimate income and wage differences.
- The analysis evaluates how ethnic disparities shift when controlling for age, IQ (AFQT scores), and parental socioeconomic status (SES).
- Income models specifically incorporate educational attainment as a causal factor, comparing its impact against IQ and parental background.
- Data standardization was achieved by expressing age, IQ, and SES as standard scores to facilitate direct comparison of coefficients.
This procedure was chosen in preference to a single regression entering ethnicity as a nominal variable so that the relationships would not be constrained to a single slope.
642
Appendix 5
Appendix 5
643
gap in the NLSY seems to be widening rather narrowing in the next
generation, as we discussed in Chapter 15.
RUSHTON ON RACE DIFFERENCES AND REPRODUCTIVE
STRATEGIES
Controversy unprecedented even for the contentious subject of racial
differences has erupted around the work of J. Philippe Rushton, a
developmental psychologist at the University of Western Ontario.
Rushton argues that the differences in the average intelligence test
scores among East Asians, blacks, and whites are not only primarily
genetic but part of a complex of racial differences that includes such
variables as brain size," genital size, rate of sexual maturation, length
of the menstrual cycle, frequency of sexual intercourse, gamete
production, sexual hormone levels, the tendency to produce dizygotic
twins, marital stability, infant mortality, altruism, law abidingness, and
mental health. For each variable, Rushton has concluded, the three
races-Mongoloids,
Caucasoids, and Negroids-fall
in a certain order,
with the average Caucasoid in the middle and the other two races on
one side or the other. The ordering of the races, he further argues, has
an evolutionary basis; hence these ordered racial differences must in-
volve genes.
To reach his conclusion, Rushton starts with the well-established
observation in biology that species vary in their reproductive strategies.
Some species produce many offspring (per parent) of which only a small
fraction survive; others produce small numbers of offspring with rela-
tively high survival rates. The involvement of parents in their offsprings'
health and development (which biologists call "parental investment")
tends to be high for species having few offspring and high survival rates
and low for those employing the other strategy (many offspring and low
survival rates). Many other species differences are concomitant with this
fundamental one, according to standard biological doctrine.
Rushton's thesis is that this standard biological principle may be ap-
plied within our own species. Rushton acknowledges that human be-
ings are as a species far out along the continuum of low reproduction,
high offspring survival, and high parental investment, but he argues that
the ordering of the races on the many variables he has identified can be
explained as the result of evolutionary differences in how far out the
races are. According to Rushton, the average Mongoloid is toward one
end of the continuum of reproductive strategies-the
few offspring, high
survival, and high parental investment end-the
average Negroid is
shifted toward the other end, and the average Caucasoid is in the
middle.
Rushton paints with a broad brush, focusing on the major racial cat-
egories rather than the dozens of more finely drawn reproductively
isolated human populations that might test his theory more con-
clusively. But beyond that, his thesis raises numerous questions-moral,
pragmatic, and scientific. Many critics attack the theory on scientific,
not just moral, grounds. They question whether Rushton has really
shown that the races are consistently ordered in the way he says they
are, or whether a biological theory that was meant to explain species
differences can be properly applied to groups within a single species, or
whether the evidence for genetic influences o n his variables stands up.
Rushton has responded to his critics with increasingly detailed and con*
vincing empirical reports of the race differences in some of the traits on
his list, and he cites preeminent biological authority for his use of the
concept of reproductive strategies. He has strengthened the case for
consistently ordered race differences, at least for some of the variables
he discusses, since his first formulation of the theory in 1985. Never-
theless, the theory remains a long way from confirmation.
We cannot at present say who is more nearly right as a matter of sci-
ence, Rushton or his critics." However, Rushton's work is not that of a
crackpot or a bigot, as many of his critics are given to charging. Nor are
we sympathetic with Rushton's academic colleagues or the politicians
in Ontario who have called for his peremptory dismissal from a tenured
professorship. Setting aside whether his work is timely or worthwhile-
a judgment we are loath to make under any circumstances-it
is plainly
science. He is not alone in seeking an evolutionary explanation of the
observed differences among the races.'33' As science, there is nothing
wrong with Rushton's work in principle; we expect that time will tell
whether it is right or wrong in fact.
Appendix 6
Regression Analyses from
Chapter 14
This appendix presents the regression analyses underlying the presen-
tation in Chapter 14.
The results in Chapter 14 and in this appendix are based on separate
regressions for each of the three ethnic groups in question (black,
Latino, and white). This procedure was chosen in preference to a sin-
gle regression entering ethnicity as a nominal variable so that the rela-
tionships would not be constrained to a single slope. The regressions
used the entire NLSY sample, with exclusions as noted for specific
analyses, applying 1990 sample weights.
LOGISTIC REGRESSIONS
All the indicators in Chapter 14 except for those involving income are
binary variables, and the mode of analysis is logistic regression. The in-
terpretation of logistic regressions is discussed in Appendix 4.
The data tables use short labels for the indicators. The full descrip-
tion of each indicator and associated characteristics of the analysis are
shown in Table 1.
Table 2 first summarizes the results, by ethnic group, for four sets of
regressions: when age (zAge) is the only independent variable, when
age and IQ (zAFQT) are independent variables, when age and parental
SES (zSES) are independent variables, and when all three are entered
as independent variables. Three basic questions are then examined:
1. How much do ethnic differences change when IQ is taken into
account?
2. How much do ethnic differences change when parental SES is
taken into account?
3. What are the comparative roles of 1Q and parental SES?
Appendix 6
647
Because ~Age, zAFQT, and zSES are all expressed as standard scores
with mean of zero and standard deviation of 1, the intercept for the
equation (abbreviated Int. in the tables) represents the expected value
when those variables are set at their respective means. The coefficients
for zAFQT and zSES are given so that you may examine the slopes as-
sociated with them.
The summary columns (Table 3) show the computed probabilities of
the dependent variable when the independent variables are set at their
means.
lncome Analyses
Following the tables showing the logistic regressions, we present the
detailed results of the ordinary least squares regressions used to estimate
differences in income by ethnicity (Table 4). Because education is such an
important causal factor in income, we show analyses in which years of ed-
ucation (as of the 1990 interview) replaces IQ as an independent variable.
The first set of models shows the parameters for wages of full-time,
year-round workers by ethnic group. The sample for this analysis con-
sisted of all persons in the NLSY who reported working for fifty-two
weeks in 1989, had a reported wage greater than 0 (a handful of appar-
ently self-employed persons who reported working fifty+two weeks re-
ported no income), had an identified occupation, and had valid scores
for IQ, parental SES, and educational level as of 1990. The second set
of models shows the parameters for total family income from all sources.
The sample for this analysis includes all persons with valid scores on the
independent variables, excluding only those who reported being out of
the labor force in 1989 or 1990 because of enrollment in school.
Table 5 shows the results when IQ, parental SES, and education are
all entered as independent variables. Education is expressed as the high-
est degree attained as of 1990 (no high school diploma, high school
diploma, associate degree, bachelor's degree, professional degree).
Table 6 shows the analysis of wages by ethnicity and occupational
grouping based on the subject's occupation in the 1990 interview (the
variable labeled "Occ90"), using the 1970 U.S. Census Occupational
Classification System. The software used for these analyses, JMP 3.0,
treats nominal variables differently from the convention in many other
regression packages. See the introduction to Appendix 4 for details and
an example.
Logistic Regression and Demographic Indicators
- The text presents complex statistical tables detailing logistic regression coefficients for various social and economic outcomes based on NLSY data.
- Variables analyzed include educational attainment, poverty status, unemployment, incarceration rates, and welfare usage across White, Black, and Latino demographics.
- The analysis controls for multiple factors including age, IQ (measured via AFQT), and parental socioeconomic status (SES) to isolate their effects on life outcomes.
- A specific section focuses on the children of NLSY mothers, tracking indicators like low birth weight, home environment quality, and developmental indices.
- The data highlights significant disparities in 'expected probabilities' for outcomes like being born out of wedlock or living in poverty during the first three years of life.
- The methodology notes a unique approach to nominal variables compared to standard regression packages, directing readers to technical appendices for clarification.
The analysis treats nominal variables differently from the convention in many other regression packages.
Appendix 6
647
Because ~Age, zAFQT, and zSES are all expressed as standard scores
with mean of zero and standard deviation of 1, the intercept for the
equation (abbreviated Int. in the tables) represents the expected value
when those variables are set at their respective means. The coefficients
for zAFQT and zSES are given so that you may examine the slopes as-
sociated with them.
The summary columns (Table 3) show the computed probabilities of
the dependent variable when the independent variables are set at their
means.
lncome Analyses
Following the tables showing the logistic regressions, we present the
detailed results of the ordinary least squares regressions used to estimate
differences in income by ethnicity (Table 4). Because education is such an
important causal factor in income, we show analyses in which years of ed-
ucation (as of the 1990 interview) replaces IQ as an independent variable.
The first set of models shows the parameters for wages of full-time,
year-round workers by ethnic group. The sample for this analysis con-
sisted of all persons in the NLSY who reported working for fifty-two
weeks in 1989, had a reported wage greater than 0 (a handful of appar-
ently self-employed persons who reported working fifty+two weeks re-
ported no income), had an identified occupation, and had valid scores
for IQ, parental SES, and educational level as of 1990. The second set
of models shows the parameters for total family income from all sources.
The sample for this analysis includes all persons with valid scores on the
independent variables, excluding only those who reported being out of
the labor force in 1989 or 1990 because of enrollment in school.
Table 5 shows the results when IQ, parental SES, and education are
all entered as independent variables. Education is expressed as the high-
est degree attained as of 1990 (no high school diploma, high school
diploma, associate degree, bachelor's degree, professional degree).
Table 6 shows the analysis of wages by ethnicity and occupational
grouping based on the subject's occupation in the 1990 interview (the
variable labeled "Occ90"), using the 1970 U.S. Census Occupational
Classification System. The software used for these analyses, JMP 3.0,
treats nominal variables differently from the convention in many other
regression packages. See the introduction to Appendix 4 for details and
an example.
Table 2 Coefficients for Logistic Regression Analysis in Chapter 14
Independent
Controlling for Age
Controtling for Age and IQ
Variables
(Age)
(Age, zAFQT)
White
Black
Latino
White
Black
Latino
Indicator
Int.
Int.
I n t
I n t
IQ
Int.
IQ
I n t
IQ
Sample: NlSY subjects
High school dropout
-2.271
-1.598
-1.080
-2.943
-1.995
-3.676
-1.722
-3.046
-2.031
Bachelor's degree
-1.018
-2.089
-2.223
-2.004
2.127
-1.078
1.943
-1.927
1.987
High-IQ occupation
-2.871
-3.550
-3.335
-3.909
1.532
-2.997
1.705
-3.206
1.379
In poverty
-2.560
-1.066
-1.512
-2.671
-.957
-2.128
-1.046
-2.274
-398
Unemployed 1 mo. (men)
-2.714
-1.352
-1.819
-2.127
-.318
-1.706
-.315
-2.079
-.409
Married hy 30
-
-
-
1.336
-.I93
.311
.I22
1.070
-.I16
Ever on welfare (all women)
-1.91 1
-.053
-.856
-1 994 -1 .I91
-353
-.902
-1.737
-1.060
Ever on welfare (poor mothers)
.487
1.287
,592
,250
-.387
1.066
-.I86
.I69
-.314
Ever in jail (men)
-3.697
-1.895
-2.800
-3.917
-1.067
-3.015
-.954
-3.421
-.657
"Yes" on MCV index
.026
-1.362
-.824
-.MI
,727
-.744
.720
-.220
.962
Controlling for Age and Parental SES
(zAge, zSES)
White
Black
Latino
I n t
SES
Int.
SES
I n t
SES
Smnpk: Children of NLSY mother
Born out of wedlock
Low birth weight
In poverty 1st 3 yrs.
Ever in nonparental care
Worst decile: HOME index
Friendliness index
Difficulty index
Motor & Social Dev. index
Behavioral Prohlems index
Any developmental index
p
m
(1Q)
Table 2 (Cont'd) Coefficients for Logistic Regression Analysis in Chapter 14
Controlling for Age, IQ, and Parental SES
Independent Variables
(Independent variables: =Age, zAFQT, zSES)
White
Black
indicator
Int.
IQ
SES
Int.
IQ
SES
Latino
Int.
IQ
SES
Smnple: NLSY subjects
High school dropout
Bachelor's degree
High-lQ occupation
In poverty
Unemployed 1 mo. (men)
Married by 30
Ever on welfare (all women)
Ever on welfare (poor mothers)
Ever in jail (men)
"Yesn on MCV index
Sample: ChiIdr.cn of NLSY mothers
Born out of wedlock
Low birth weight
In poverty 1st 3 )m.
Ever in nonparental care
Worst dec~le: HOME index
Friendliness index
Difficulty index
Motor & Soc~al Dev. index
fkhaviorai Prohlems index
Any developmental index
PPVT (14)
Table 3 Expected Probabilities for Logistic Regression Analyses in Chapter 14
Indicator
Sample: NLSY subjects
High school dropout
Bachelor's degree
High-IQ occupation
In poverty
Unemployed 1 mo. (men)
Married by 30
Ever on welfare (all women)
Ever on welfare (poor mothers)
Ever in jail (men)
"Yes" on MCV index
When Age Is Average
(zAge = 0)
White
Black Latino
When Age and IQ When Age and Parental
When Age, IQ, and
Are Average
SES Are Average
Parental SES are Average
(zAge = 0, zAFQT = O)(zAge = o, zSES = 0) (zAge = 0, zAFQT = 0, zSES = 0)
White Black Latino White Black Latino
White
Black
Latino
Sampk: Children of NLSY mothers
Born out of wedlock
11.8
62.3
23.3
10.4
50.7
16.9
10.9
56.5
18.2
Low birth weight
3.5
10.1
5.3
3.3
6.5
4.7
3.4
9.9
5.3
In poverty 1st 3 yrs.
9.2
53.8
29.8
6.3
14.2
9.6
5.4
29.7
13.0
Ever in nonparental care
0.5
3.2
1.3
0.5
2.8
1.4
0.5
3.5
1.1
Worst decile: HOME index
7.1
27.7
21.1
5.6
16.1
10.7
6.0
19.0
13.4
Friendliness index
5.6
26.3
13.3
5.2
14.9
4.5
5.3
24.7
8.2
Difficulty index
7.5
21.9
10.8
7.7
12.8
3.7
50.0
17.9
6.0
Motor & Social Dev. index
6.7
9.1
11.4
6.8
4.3
7.3
6.8
6.9
7.3
BehavioraI Problems index
12.4
11.4
11.2
11.2
5.2
7.2
11.5
9.7
8.6
Any developmental index
10.0
13.1
12.6
9.6
6.8
7.8
9.7
11.4
9.1
PPVT (IQ)
7.1
55.0
53.5
9.8
33.3
30.3
6.9
46.3
45.3
Table 4 Income Analyses in Chapter 14 (in 1990 dollars)
Model I
Model I1
Model 111
Model IV
Model V
Independent
age)
(zAge, zAFQT)
(zAge, zAFQT, zSES)
(zAge, zEduc90)
(zAge, zEduc90, zSES)
Variables
White
Black Latino White Black Latino White
Black Latino White
Black Latino
White
Black
Latino
Dependent variable: Annual wages for full-time year-round works, 1989
Intercept
27,372
20,994 23,409 25,546 25,001 25,159 25,329 25,339 26,002 26,292 20,962 24,092
26,048 21,841 25,687
Age
2,814
1,354
2,163
1,968
861
1,896
2,057
949
2,144
2,636
1,333
2,188
2,632
1,377
2,463
IQ
5,660
5,454
4,018
4,850
4,875
3,162
Parental SES
1,753
1,420
1,352
1,341
1,626
2,000
Education as of 1990
5,395
4,794
2,755
4,790
4,140
1,934
De&t
variabk: Total family income, 1989"
Intercept
41,558 29,880 35,514 39,225 36,432 39,689 38,623 37,723 41,051 40,194 30,511 37,565 39,453 33,841 40,009
Age
3,326
1,576
3,628
2,049
805
2,709
2,354
888
3,010
2,921
1,415
3,553
2,963
1,294
3,788
IQ
8,332
8,590
8,870
5,936
5,804
7,488
Parental SES
5,097
5,817
2,223
4,217
6,022
3,109
Education as of 1990
8,313
7,933
7,764
6,394
5.346
6,360
Minority income as a percentage of white income
Annual wages
76.7%
85.5%
97.9%
98.5%
100.0% 102.7%
79.7% 91.6%
83.8%
98.6%
Family income
71.9%
85.5%
92.9% 101.2%
97.7% 106.3%
75.9% 93.5%
85.8% 101.4%
" For persons not out of labor force becaw of school in 1989 or 1990.
Income Disparities and Affirmative Action
- Statistical models compare annual wages and family income across White, Black, and Latino demographics using variables like IQ, age, and parental socioeconomic status.
- The data suggests that when controlling for IQ and education, the income gap between minority groups and whites significantly narrows or even reverses.
- Educational attainment, particularly graduate degrees, shows a high correlation with increased annual wages across all racial groups.
- The text transitions from raw economic data to a historical and legal analysis of affirmative action in the workplace.
- The authors argue that current debates over affirmative action often ignore the policy's original objectives and legal evolution.
Much of the current debate about affirmative action in employment takes place in ignorance of the original objectives of affirmative action and the ways in which antidiscrimination law has evolved.
Table 3 Expected Probabilities for Logistic Regression Analyses in Chapter 14
Indicator
Sample: NLSY subjects
High school dropout
Bachelor's degree
High-IQ occupation
In poverty
Unemployed 1 mo. (men)
Married by 30
Ever on welfare (all women)
Ever on welfare (poor mothers)
Ever in jail (men)
"Yes" on MCV index
When Age Is Average
(zAge = 0)
White
Black Latino
When Age and IQ When Age and Parental
When Age, IQ, and
Are Average
SES Are Average
Parental SES are Average
(zAge = 0, zAFQT = O)(zAge = o, zSES = 0) (zAge = 0, zAFQT = 0, zSES = 0)
White Black Latino White Black Latino
White
Black
Latino
Sampk: Children of NLSY mothers
Born out of wedlock
11.8
62.3
23.3
10.4
50.7
16.9
10.9
56.5
18.2
Low birth weight
3.5
10.1
5.3
3.3
6.5
4.7
3.4
9.9
5.3
In poverty 1st 3 yrs.
9.2
53.8
29.8
6.3
14.2
9.6
5.4
29.7
13.0
Ever in nonparental care
0.5
3.2
1.3
0.5
2.8
1.4
0.5
3.5
1.1
Worst decile: HOME index
7.1
27.7
21.1
5.6
16.1
10.7
6.0
19.0
13.4
Friendliness index
5.6
26.3
13.3
5.2
14.9
4.5
5.3
24.7
8.2
Difficulty index
7.5
21.9
10.8
7.7
12.8
3.7
50.0
17.9
6.0
Motor & Social Dev. index
6.7
9.1
11.4
6.8
4.3
7.3
6.8
6.9
7.3
BehavioraI Problems index
12.4
11.4
11.2
11.2
5.2
7.2
11.5
9.7
8.6
Any developmental index
10.0
13.1
12.6
9.6
6.8
7.8
9.7
11.4
9.1
PPVT (IQ)
7.1
55.0
53.5
9.8
33.3
30.3
6.9
46.3
45.3
Table 4 Income Analyses in Chapter 14 (in 1990 dollars)
Model I
Model I1
Model 111
Model IV
Model V
Independent
age)
(zAge, zAFQT)
(zAge, zAFQT, zSES)
(zAge, zEduc90)
(zAge, zEduc90, zSES)
Variables
White
Black Latino White Black Latino White
Black Latino White
Black Latino
White
Black
Latino
Dependent variable: Annual wages for full-time year-round works, 1989
Intercept
27,372
20,994 23,409 25,546 25,001 25,159 25,329 25,339 26,002 26,292 20,962 24,092
26,048 21,841 25,687
Age
2,814
1,354
2,163
1,968
861
1,896
2,057
949
2,144
2,636
1,333
2,188
2,632
1,377
2,463
IQ
5,660
5,454
4,018
4,850
4,875
3,162
Parental SES
1,753
1,420
1,352
1,341
1,626
2,000
Education as of 1990
5,395
4,794
2,755
4,790
4,140
1,934
De&t
variabk: Total family income, 1989"
Intercept
41,558 29,880 35,514 39,225 36,432 39,689 38,623 37,723 41,051 40,194 30,511 37,565 39,453 33,841 40,009
Age
3,326
1,576
3,628
2,049
805
2,709
2,354
888
3,010
2,921
1,415
3,553
2,963
1,294
3,788
IQ
8,332
8,590
8,870
5,936
5,804
7,488
Parental SES
5,097
5,817
2,223
4,217
6,022
3,109
Education as of 1990
8,313
7,933
7,764
6,394
5.346
6,360
Minority income as a percentage of white income
Annual wages
76.7%
85.5%
97.9%
98.5%
100.0% 102.7%
79.7% 91.6%
83.8%
98.6%
Family income
71.9%
85.5%
92.9% 101.2%
97.7% 106.3%
75.9% 93.5%
85.8% 101.4%
" For persons not out of labor force becaw of school in 1989 or 1990.
652
Appendix 6
Table 5 Income Analyses in Chapter 14 (in 1990 dollars), by De-
gree Attained
Dependent Variable:
Annual Wages for Full-Time ,
Year-Round Workers, 1989
Total Family Income"
Independent Variables
White
Black Latino
White
Black Latino
Intercept
26,994 27,048 26,474 40,813 38,050 41,271
Age
2,338
787
2,207
2,583
946
3,091
IQ
3,082
3,802
2,507
3,025
4,247
4,136
Parental SES
914
840
1,248
3,648
5,191
2,042
Highest degree attained
Less than high school
-4,992
-3,688 -1,588
-9,743 4,181 -9,461
GED
-2,622
-3,950 -3,039
-5,202 -4,159 -7,683
High school diploma
-2,602
-3,944 -1,15 1 -2,789 -2,817
-1,269
Bachelor's degree
3,329
734
2,938
4,286
4,362 10,506
Graduate degree
6,887 10,848
2,840 13,448
6,795
7,907
Minority income as a
percentage of white income
100.2%
98.1%
93.2% I01 .Ic%
" For persons not out of labor force because of school in 1989 or 1990.
Sample sizes for the different occupations analyzed in Tahle 6 helow
are as follow:
Professional/technical
Managersladministrators
Clerical workers
Sales workers
Craft and kindred workers
Transport operatives
Other operatives
Service workers
Unskilled laborers
Farmworkers
White
60 5
462
473
163
370
95
23 1
289
98
2 2
Black
143
110
2 60
34
113
5 5
143
218
78
4
Latino
129
103
172
30
106
40
67
9 5
40
12
Because of the small numbers of farmworkers, that category is omitted
from the table. Note, however, that farmworkers were included in the
actual regression equation; hence the coefficients for the nominal oc-
cupation categories will not sum to zero.
o
w
a
~
a
m
a
~
m
r
-
a - t r n m - w a r n o
m
a m r - w m m m w m
m - n n m w - r - t n -
.- z.:
r n - " t y ~ - ? ~ m * q W
J
.
~
~
>
~
~
-
~
-
~
A -
N
r . . m r d r . . b b ~ - -
a a c i m t - r - a - m
a d -
I
I
I
I
?, -, r, - e, P, ?.I r., N
:-?a
t-m-
,Q%
~
g
~
2
~
g
~
s
s
o-g-q%Ks5?0
T Y r - y m - q y " 1 2 Z
% t q - * q ? 9 q
g g $ z
2 -
r-a I n-NrjlTp mg2d.tNmmaa
& r 8 ? 4 - C B N r 4 - - -
?,E g
?
ly
Appendix 7
The Evolution of Affirmative
Action in the Workplace
Much of the current debate about affirmative action in employment
takes place in ignorance of the original objectives of affirmative action
and the ways in which antidiscrimination law has evolved. Because we
believe that returning to the original intention of affirmative action is
a key to progress in social policy on many fronts and because our rec-
ommendation seems so radical in the prevailing context, this appendix
presents a full discussion of the nature of the original objectives and the
evolution as it pertains specifically to employment tests.
Affirmative action in the workplace, as distinguished from the
broader and older civil rights movement, starts with Ttle VII of the
Civil Rights Act of 1964. Title VII laid down principles of fair employ-
ment practice as regards race, religion, national origin, and sex, and it
created the Equal Employment Opportunities Commission (EEOC) to
administer and promote them. Besides Title VII (as amended over the
years), affirmative action in the workplace comprises subsequent acts of
Congress (and state legislatures), presidential executive orders, rulings
by the EEOC and other branches of government, and landmark court
cases. The basic intent of all of this energetic policymaking has been to
make workplaces fairer to people from oppressed or mistreated groups.
As desirable as that goal may seem to just about anyone, a clear no-
tion either of what it means or how to accomplish it does not emerge
from the documents of this enormous (and spreading) battleground of
law, regulation, litigation, and commentary. The good news is that many
issues of fair employment practice need not concern us here.' But we
cannot avoid looking at how Title VII (and its elaborations) dealt with
the use of ability tests in the selection or promotion of employees; Al-
though the tests are given to individuals, the groups of which they are
Evolution of Employment Testing Law
- Affirmative action in the workplace originated with Title VII of the Civil Rights Act of 1964, creating the EEOC to oversee fair employment practices.
- While the original intent was to foster fairness for oppressed groups, the legal and regulatory framework has become an enormous and complex battleground.
- The government has increasingly moved toward a stance of distrusting ability tests that produce differing group averages, assuming equality in the absence of discrimination.
- Title VII did not initially prohibit tests but required they not be used as a pretext for discrimination based on race, religion, or sex.
- By 1966, the EEOC mandated that tests must demonstrate 'job relatedness' and a proven power to measure performance for specific roles.
- The regulation of employment testing has evolved into a massive legal specialty involving millions of bureaucratic hours and thousands of court cases.
The stance of the govemment and the courts has increasingly been to distrust tests that produce group differences, as if they presume that, in the absence of illegal discrimination, the groups should be equal.
Appendix 7
The Evolution of Affirmative
Action in the Workplace
Much of the current debate about affirmative action in employment
takes place in ignorance of the original objectives of affirmative action
and the ways in which antidiscrimination law has evolved. Because we
believe that returning to the original intention of affirmative action is
a key to progress in social policy on many fronts and because our rec-
ommendation seems so radical in the prevailing context, this appendix
presents a full discussion of the nature of the original objectives and the
evolution as it pertains specifically to employment tests.
Affirmative action in the workplace, as distinguished from the
broader and older civil rights movement, starts with Ttle VII of the
Civil Rights Act of 1964. Title VII laid down principles of fair employ-
ment practice as regards race, religion, national origin, and sex, and it
created the Equal Employment Opportunities Commission (EEOC) to
administer and promote them. Besides Title VII (as amended over the
years), affirmative action in the workplace comprises subsequent acts of
Congress (and state legislatures), presidential executive orders, rulings
by the EEOC and other branches of government, and landmark court
cases. The basic intent of all of this energetic policymaking has been to
make workplaces fairer to people from oppressed or mistreated groups.
As desirable as that goal may seem to just about anyone, a clear no-
tion either of what it means or how to accomplish it does not emerge
from the documents of this enormous (and spreading) battleground of
law, regulation, litigation, and commentary. The good news is that many
issues of fair employment practice need not concern us here.' But we
cannot avoid looking at how Title VII (and its elaborations) dealt with
the use of ability tests in the selection or promotion of employees; Al-
though the tests are given to individuals, the groups of which they are
656
Appendix 7
Appendix 7
657
a part may average high or low compared to the population as a whole;
as it happens, some of the groups who average low are protected from
"unfair employment practices" by Ttle VII. Hence the govemment gets
into the business of regulating employment testing.
The ramifications of even the narrow issue of employment test reg-
ulation have ranged so far and wide that employment testing has be-
come a new specialty in the creation and practice of law and in
govemment regulation undreamed of by the Founders. Thousands, per-
haps millions, of legislative and bureaucratic man hours have been lav-
ished on it. Thousands of cases have been argued in court.'2' Doubtless
many more cases have not been argued, as the specter of legal action
has shaped innumerable decisions in corporate offices and boardrooms.
The stance of the govemment and the courts has increasingly been to
distrust tests that produce group differences, as if they presume that, in
the absence of illegal discrimination, the groups should be equal.
THE EVOLUTION OF TITLE VII
Title VII of the 1964 Act specifically did not prohibit the use of em-
ployment tests, provided that the tests were not "designed, intended or
used" to discriminate against people because of their race, color, reli-
gion, sex, or national origin. It said nothing about group differences, al-
though it was clear in 1964 that ability tests would result in
disproportionately fewer high scores for at least some of the groups of
people protected from discrimination by the act. Some of the act's pro-
ponents believed that some of the group differences in test scores were
being used as a pretext for unfair discrimination; for that reason the act
included a proviso regarding the tests. The hope was that Title VII would
promptly eradicate this unfair use of tests. It was left to the EEOC to
come up with the means of doing so.
In 1966, the EEOC formulated the first of a series of guidelines. An
employment test, it ruled, had to have a proven power to measure a per-
son's "ability to perform a particular job or class of job^."^ It was not
enough, said the guideline, that the test be drawn up by professional
testers; it also had to have some practical import-some
"job related-
ness," in the evolving jargon of the field. Why this particular guideline?
The answer is that staff for the newly launched EEOC had quickly be-
come convinced that some employers were, as anticipated, hiding be-
hind the credentials of professional testers to use ability tests that had
little bearing on job performance, and that they were doing so to dis-
criminate against blackse4 The ,guideline was a n attempt to pierce the
veneer of professional respectability and thereby correct this violation
of law and principle, as the EEOC saw it.
The criterion of job relatedness did not resolve the uneasiness about
testing for the EEOC. Ability testing for employment had, after all, be-
come an issue under Title VII because various groups of people get dif-
ferent average scores. This was the heart of the matter, and new
guidelines laid down in 1970 addressed it frontally. For the first time,
EEOC guidelines mentioned the issue of disproportionate success of dif-
ferent groups on any given test.' When a test "adversely affects" (more
jargon, along with "disparate impact" or "adverse impact") members of
a protected group, said the new guidelines, it had to be shown not only
that the test really did predict job performance but that the prediction
was strong enough to make a significant economic difference and that
no nondiscriminatory alternative was available. An employer, the rea-
soning went, may have abandoned older and cruder forms of deliberately
discriminatory treatment of workers or job applicants (often called "dis-
parate treatment") but still be violating the intent of the law by using a
needlessly discriminatory test. Disparate impact, in other words, was to
be the red flag that set the EEOC in motion.
GRIGGS AND AFTERWARD
Soon after, the U.S. Supreme Court entered the fray. Applicants for cer-
tain desirable jobs at the Duke Power Company had been required to
have a high school diploma or to earn ability test scores above a cutoff.
Fewer blacks were getting over these hurdles than whites; a suit found
its way to the Supreme Court. The Court's decision in Griggs v. Duke
Power Co. ,6 was instantly recognized as a turning point in the march of
affirmative action in the workplace.7 The Supreme Court struck down
the use of either the tests or the educational requirement, because the
company was unable to satisfy the Court that either a diploma or a high
score on a test had any bearing on the jobs the applicants were being
hired for.'
Duke Power Co.'s defense was, among other things, that it was try.
ing to raise the general intellectual level of its work force by imposing
The Rise of Disparate Impact
- The EEOC developed guidelines to prevent employers from using professional testing as a veneer for racial discrimination.
- New 1970 regulations introduced the concept of 'adverse impact,' requiring tests to have significant economic justification if they disproportionately affected protected groups.
- The Supreme Court case Griggs v. Duke Power Co. became a landmark ruling by striking down job requirements that lacked a manifest relationship to job performance.
- Chief Justice Warren Burger's unanimous decision shifted the burden of proof to employers to demonstrate the 'business necessity' of their hiring criteria.
- The ruling effectively warned employers against using general ability tests, encouraging the development of job-specific validation studies instead.
- The Supreme Court granted 'great deference' to EEOC guidelines, giving them significant legal weight despite the agency's lack of direct enforcement powers.
Said the Court, good (i.e., nondiscriminatory) intentions do not excuse tests "that operate as 'built-in headwinds' for minority groups and are unrelated to measuring job capability."
656
Appendix 7
Appendix 7
657
a part may average high or low compared to the population as a whole;
as it happens, some of the groups who average low are protected from
"unfair employment practices" by Ttle VII. Hence the govemment gets
into the business of regulating employment testing.
The ramifications of even the narrow issue of employment test reg-
ulation have ranged so far and wide that employment testing has be-
come a new specialty in the creation and practice of law and in
govemment regulation undreamed of by the Founders. Thousands, per-
haps millions, of legislative and bureaucratic man hours have been lav-
ished on it. Thousands of cases have been argued in court.'2' Doubtless
many more cases have not been argued, as the specter of legal action
has shaped innumerable decisions in corporate offices and boardrooms.
The stance of the govemment and the courts has increasingly been to
distrust tests that produce group differences, as if they presume that, in
the absence of illegal discrimination, the groups should be equal.
THE EVOLUTION OF TITLE VII
Title VII of the 1964 Act specifically did not prohibit the use of em-
ployment tests, provided that the tests were not "designed, intended or
used" to discriminate against people because of their race, color, reli-
gion, sex, or national origin. It said nothing about group differences, al-
though it was clear in 1964 that ability tests would result in
disproportionately fewer high scores for at least some of the groups of
people protected from discrimination by the act. Some of the act's pro-
ponents believed that some of the group differences in test scores were
being used as a pretext for unfair discrimination; for that reason the act
included a proviso regarding the tests. The hope was that Title VII would
promptly eradicate this unfair use of tests. It was left to the EEOC to
come up with the means of doing so.
In 1966, the EEOC formulated the first of a series of guidelines. An
employment test, it ruled, had to have a proven power to measure a per-
son's "ability to perform a particular job or class of job^."^ It was not
enough, said the guideline, that the test be drawn up by professional
testers; it also had to have some practical import-some
"job related-
ness," in the evolving jargon of the field. Why this particular guideline?
The answer is that staff for the newly launched EEOC had quickly be-
come convinced that some employers were, as anticipated, hiding be-
hind the credentials of professional testers to use ability tests that had
little bearing on job performance, and that they were doing so to dis-
criminate against blackse4 The ,guideline was a n attempt to pierce the
veneer of professional respectability and thereby correct this violation
of law and principle, as the EEOC saw it.
The criterion of job relatedness did not resolve the uneasiness about
testing for the EEOC. Ability testing for employment had, after all, be-
come an issue under Title VII because various groups of people get dif-
ferent average scores. This was the heart of the matter, and new
guidelines laid down in 1970 addressed it frontally. For the first time,
EEOC guidelines mentioned the issue of disproportionate success of dif-
ferent groups on any given test.' When a test "adversely affects" (more
jargon, along with "disparate impact" or "adverse impact") members of
a protected group, said the new guidelines, it had to be shown not only
that the test really did predict job performance but that the prediction
was strong enough to make a significant economic difference and that
no nondiscriminatory alternative was available. An employer, the rea-
soning went, may have abandoned older and cruder forms of deliberately
discriminatory treatment of workers or job applicants (often called "dis-
parate treatment") but still be violating the intent of the law by using a
needlessly discriminatory test. Disparate impact, in other words, was to
be the red flag that set the EEOC in motion.
GRIGGS AND AFTERWARD
Soon after, the U.S. Supreme Court entered the fray. Applicants for cer-
tain desirable jobs at the Duke Power Company had been required to
have a high school diploma or to earn ability test scores above a cutoff.
Fewer blacks were getting over these hurdles than whites; a suit found
its way to the Supreme Court. The Court's decision in Griggs v. Duke
Power Co. ,6 was instantly recognized as a turning point in the march of
affirmative action in the workplace.7 The Supreme Court struck down
the use of either the tests or the educational requirement, because the
company was unable to satisfy the Court that either a diploma or a high
score on a test had any bearing on the jobs the applicants were being
hired for.'
Duke Power Co.'s defense was, among other things, that it was try.
ing to raise the general intellectual level of its work force by imposing
658
Appendix 7
Appendix 7
659
educational or ability test score requirements. In the Court's unanimous
decision (which reversed contrary opinions in both the federal district
and circuit courts), Chief Justice Warren Burger approved unstintingl~
of the EEOC's guidelines: Adverse impact placed a burden of proof on
employers to show not just that they were not intentionally discrimi-
nating against the protected groups but that their testing procedures
could be justified economically, and that no other available hiring pro-
cedure is equally useful but less discriminatory. Said the Court, good
(i.e., nondiscriminatory) intentions do not excuse tests "that operate as
'built-in headwinds' for minority groups and are unrelated to measuring
job capability."9 There must be both "business necessity" and a "mani-
fest relationship" between the test and the job, as the EEOC had ruled.
Employers were being told to be wary of off-the-shelf tests of general
ability; if they wanted to use a test at all, they would be well advised to
write them for the specific job at hand and to do their own validation
studies.
Ordinarily there is some presumption that people will obey guide-
lines proposed by a federal agency like EEOC, but not doing so does not
violate the law. Indeed, in the legislative record, Congress was assured
that the EEOC had no enforcement powers. However, the Court in
Griggs said that the EEOC guidelines deserve "great deference,"'%hich
endowed them with authority verging on the power of law itself. This
laying on of the hands of legality is one reason that Griggs has become
the landmark case it has turned out to be, for only a defiant or reckless
employer would disregard guidelines that the Court embraced so en-
thusiastically. Beyond that, however, Griggs transformed the very con-
ception of affirmative action in the workplace.
The Court grounded its decision in the 1964 Civil Rights Act itself,
although the act said nothing about job relatedness, adverse impact, or
the lack of alternative hiring criteria. The act did, however, say that a
test must not be "designed, intended or used" to discriminate against
people in the protected minority groups. Like the EEOC, the Court con-
sidered job relatedness and adverse impact to be reasonable translations
of Title VII's principles into practice. But it can be argued that job re-
latedness and disparate impact per se go well beyond Title VII, becausP
a test may have disparate impact and not be specifically related to the
particular job being filled without the employer's having designed, in-
tended, or used it for discriminatory purposes.1111
The issue hinges on whether each of the three terms-"designed,
in-
tended or usedn-must
signify discriminatory intent (i.e., the guilty
mind usually required in cases of liability) or only the first two. The first
two terms-"designed,
intended"--clearly imply discriminatory intent.
Must the third? No, said the Supreme Court, "used" need not. And if it
need not, then an employer is violating Title VII even if he is not guilty
of discriminatory intent, so long as the test has disparate impact and has
not been proved, to the Court's satisfaction, to be job related."*I
After two decades in force, the Court's interpretation may seem cor-
rect to many readers, but both the legislative record and the wording of
Title VII belie it.[131 Proponents of Title VII, on the floor of Congress
and elsewhere, repeatedly assured the opposition that tests administered
without discriminatory intent, however adverse their effects, were not
being challenged, let alone banned.'14' For example, in a memorandum
submitted by Senator Clifford Case, one of Title VII's leading advocates
during the legislative debates, we find the following assurance: "No
court could read Title VII as requiring an employer to lower or change
the occupational qualifications he sets for his employees simply because
fewer Negroes than whites are able to meet them."15 Senator Hubert
Humphrey, as we noted in Chapter 20, also assured fellow legislators
that Xtle VII would never be used to impose percentage hiring re-
quirements (disparate impact criteria) on employers.
A year later, in the Equal Employment Opportunity Act of 1972,
Congress spoke for the third branch of government, allying itself with
the Court and the EEOC. It disapproved of mere "'paper' credentials"
(such as cognitive ability test scores) that are of "questionable value."
It warned that such credentials burdened people who were "socioeco-
nomically or educationally disadvantaged" with "artificial qualifica-
tions."lWhen it first enacted Ttle VII in 1964, Congress on the whole
trusted general ability tests to serve the purpose of predicting worker
quality; by 1972, Congress, echoing Griggs, had become far more skep-
tical of the predictive power of those tests and suspicious that they were
a pretext for illegal di~crimination.'~
In the words of one legal scholar,
"The central rationale of the Court's decision in Griggs . . . was based
o n an assumption that those of different races are inherently equal in
ability and intelligence, and on a deep skepticism about the utility of
devices traditionally used to select among applicants for employment."1R
With all three branches of government pushing in the same general
The Legacy of Griggs
- The Supreme Court's decision in Griggs v. Duke Power Co. transformed affirmative action by establishing 'disparate impact' as a standard for illegality.
- The Court interpreted the word 'used' in the 1964 Civil Rights Act to mean that discriminatory intent was not required to prove a violation.
- This judicial interpretation arguably contradicted the original legislative intent, where proponents promised the act would not force employers to change occupational qualifications.
- By 1972, Congress aligned with the Court and the EEOC, expressing skepticism toward 'paper credentials' and cognitive ability tests.
- The Griggs rationale rests on the assumption of inherent equality in ability across races and a deep distrust of traditional employment selection devices.
The first two terms—'designed, intended'—clearly imply discriminatory intent. Must the third? No, said the Supreme Court, 'used' need not.
658
Appendix 7
Appendix 7
659
educational or ability test score requirements. In the Court's unanimous
decision (which reversed contrary opinions in both the federal district
and circuit courts), Chief Justice Warren Burger approved unstintingl~
of the EEOC's guidelines: Adverse impact placed a burden of proof on
employers to show not just that they were not intentionally discrimi-
nating against the protected groups but that their testing procedures
could be justified economically, and that no other available hiring pro-
cedure is equally useful but less discriminatory. Said the Court, good
(i.e., nondiscriminatory) intentions do not excuse tests "that operate as
'built-in headwinds' for minority groups and are unrelated to measuring
job capability."9 There must be both "business necessity" and a "mani-
fest relationship" between the test and the job, as the EEOC had ruled.
Employers were being told to be wary of off-the-shelf tests of general
ability; if they wanted to use a test at all, they would be well advised to
write them for the specific job at hand and to do their own validation
studies.
Ordinarily there is some presumption that people will obey guide-
lines proposed by a federal agency like EEOC, but not doing so does not
violate the law. Indeed, in the legislative record, Congress was assured
that the EEOC had no enforcement powers. However, the Court in
Griggs said that the EEOC guidelines deserve "great deference,"'%hich
endowed them with authority verging on the power of law itself. This
laying on of the hands of legality is one reason that Griggs has become
the landmark case it has turned out to be, for only a defiant or reckless
employer would disregard guidelines that the Court embraced so en-
thusiastically. Beyond that, however, Griggs transformed the very con-
ception of affirmative action in the workplace.
The Court grounded its decision in the 1964 Civil Rights Act itself,
although the act said nothing about job relatedness, adverse impact, or
the lack of alternative hiring criteria. The act did, however, say that a
test must not be "designed, intended or used" to discriminate against
people in the protected minority groups. Like the EEOC, the Court con-
sidered job relatedness and adverse impact to be reasonable translations
of Title VII's principles into practice. But it can be argued that job re-
latedness and disparate impact per se go well beyond Title VII, becausP
a test may have disparate impact and not be specifically related to the
particular job being filled without the employer's having designed, in-
tended, or used it for discriminatory purposes.1111
The issue hinges on whether each of the three terms-"designed,
in-
tended or usedn-must
signify discriminatory intent (i.e., the guilty
mind usually required in cases of liability) or only the first two. The first
two terms-"designed,
intended"--clearly imply discriminatory intent.
Must the third? No, said the Supreme Court, "used" need not. And if it
need not, then an employer is violating Title VII even if he is not guilty
of discriminatory intent, so long as the test has disparate impact and has
not been proved, to the Court's satisfaction, to be job related."*I
After two decades in force, the Court's interpretation may seem cor-
rect to many readers, but both the legislative record and the wording of
Title VII belie it.[131 Proponents of Title VII, on the floor of Congress
and elsewhere, repeatedly assured the opposition that tests administered
without discriminatory intent, however adverse their effects, were not
being challenged, let alone banned.'14' For example, in a memorandum
submitted by Senator Clifford Case, one of Title VII's leading advocates
during the legislative debates, we find the following assurance: "No
court could read Title VII as requiring an employer to lower or change
the occupational qualifications he sets for his employees simply because
fewer Negroes than whites are able to meet them."15 Senator Hubert
Humphrey, as we noted in Chapter 20, also assured fellow legislators
that Xtle VII would never be used to impose percentage hiring re-
quirements (disparate impact criteria) on employers.
A year later, in the Equal Employment Opportunity Act of 1972,
Congress spoke for the third branch of government, allying itself with
the Court and the EEOC. It disapproved of mere "'paper' credentials"
(such as cognitive ability test scores) that are of "questionable value."
It warned that such credentials burdened people who were "socioeco-
nomically or educationally disadvantaged" with "artificial qualifica-
tions."lWhen it first enacted Ttle VII in 1964, Congress on the whole
trusted general ability tests to serve the purpose of predicting worker
quality; by 1972, Congress, echoing Griggs, had become far more skep-
tical of the predictive power of those tests and suspicious that they were
a pretext for illegal di~crimination.'~
In the words of one legal scholar,
"The central rationale of the Court's decision in Griggs . . . was based
o n an assumption that those of different races are inherently equal in
ability and intelligence, and on a deep skepticism about the utility of
devices traditionally used to select among applicants for employment."1R
With all three branches of government pushing in the same general
disparate impact as the touchstone of illegality rather than on discrime
inatory intent or disparate treatment. As in Grigs, the Supreme Court
in 1975, in Albemark Paper Co. v. Moody," considered a case in which
an employer used intelligence tests (among other criteria) to select
workers for well-paying jobs. Once again, black applicants, who earned
lower scores than white applicants, brought suit.*?he Court reaffirmed
the general outlines of Griggs, but in filling out details, it provided three
steps to follow in proving that an employment test was in violation of
Title VII (as amended). First, the Court said, a complaining party must
show disparate impact. This involved a statistical proof that those who
were hired or promoted on the basis of the test included significantly
fewer members of a protected group than random selection from the ap-
plicant pool would have produced. Given this proof of disparate impact,
the burden of proof shifts to the employer, who must now prove that
scores on the test have a proven and vital relationship to the specific job
they were hired for. The criterion expressed in Grigs, "business neces-
sity," was carried forward into Albemarle. If the employer passes this hur-
dle, the complaining party can offer evidence that the employer could
have used a different hiring procedure, one that was as effective in sea
lecting workers but without the disparate impact. If this can be shown,
then, the Court ruled, the employer has been shown to have discrimi-
nated illegally by failing to have used the alternative procedure.'2"
Other federal authorities besides the EEOC were monitoring and pro-
moting affirmative action in the workplace. In the mid-1970s, as in-
consistencies began to crop up, pressure built up for coordinating as
broad a slice of the federal involvement in affirmative action as possi-
ble. After some false starts, the Uniform Guidelines on Employee Se-
lection Procedures were adopted in 1978 by EEOC, the Civil Service
Commission (later called the Office of Personnel Management), the
Department of Justice, the Department of the Treasury, and the De-
partment of ~abor.*' At this writing, they are still in force. The Court's
decisions in Griggs and Alhemarle set the broader framework for the Uni-
form Guidelines, hut further details were elaborated, in some respects
660
Appendix 7
Appendix 7
66 1
increasing the pressure on employers using tests. For example, the Uni-
form Guidelines held-in
contrast to the Court in Alkmarle-that
the
employer has a responsibility for seeking less discriminatory selection
procedures, a rather different matter from giving a complaining party
the opportunity to do so, as the Court had decreed.
direction, affirmative action policies evolved toward greater reliance on
The Uniform Guidelines attempt to define a unified approach to affir-
mative action in the workplace, but practices still vary, and there con-
tinue to be new laws and new interpretations by courts. But they come
as close to a policy consensus as anything does. They also reveal the un-
derlying assumptions about the facts. On the matter of test validation,
the Guidelines espouse the stringent "business necessity" requirement
held in Griggs and Albemarle. They provide detailed requirements for
validating tests. Without submerging our readers more deeply in tech-
nical minutiae than seems appropriate here, let us say that the Uniform
Guidelines lean sharply toward criteria that would be hard and expen-
sive for employers to meet, even when cheaper or easier methods almost
certainly would have been more effe~tive.~'
General ability tests, read-
ily availahle and widely standardized, are rarely acceptable to the EEOC
or the courts, ilnless the employer goes through the difficult, if not
impossible, and, psychometrically speaking, needless, process of re-
standardization of an established test. To validate a test, an employer
needs a measure of performance. The govemment typically rejects mea-
sures of training performance and supervisor ratings. As Chapter 3
detailed, both training scores and supervisor ratings may be suitable
measures of performance, and they are relatively easy to obtain. The
measures usually required by the government are all but impossible to
obtain, especially for job candidates who are not hired.
Despite an air of rigor and precision in discussing validation, neither
the EEOC nor any other branch of govemment involved in administer-
ing affirmative action policies has shown any interest in evaluating just
how predictive of worker performance the stringent and costly valida-
tion procedures it demands are, or whether there is any gain in predic-
tive power when they are used. The thrust continues to he, as it has been
from the beginning, to increase the numbers hired or promoted from the
protected groups, based on the underlying assumption that, except for
discrimination or the legacy of past discrimination, the protected groups
should he equally represented across the occupational spectrum.
VALIDATING EMPLOYMENT TESTS
DISPARATE IMPACT
According to the Guidelines, an employer that comes under their ju-
risdiction can expect to be required to validate a test-that
is, to prove
its business necessity-if
there is disparate impact. And, the Guidelines
The Evolution of Disparate Impact
- The Supreme Court case Albemarle Paper Co. v. Moody established a three-step legal framework for proving employment test violations under Title VII.
- Under this framework, the burden of proof shifts to the employer to demonstrate 'business necessity' once a statistical disparate impact is shown.
- The 1978 Uniform Guidelines on Employee Selection Procedures consolidated federal oversight across multiple departments including the EEOC and DOJ.
- These guidelines increased pressure on employers by requiring them to proactively seek less discriminatory selection procedures rather than waiting for a challenge.
- Federal standards often reject standardized general ability tests unless employers undergo an expensive and psychometrically difficult re-standardization process.
The Uniform Guidelines held—in contrast to the Court in Albemarle—that the employer has a responsibility for seeking less discriminatory selection procedures, a rather different matter from giving a complaining party the opportunity to do so, as the Court had decreed.
disparate impact as the touchstone of illegality rather than on discrime
inatory intent or disparate treatment. As in Grigs, the Supreme Court
in 1975, in Albemark Paper Co. v. Moody," considered a case in which
an employer used intelligence tests (among other criteria) to select
workers for well-paying jobs. Once again, black applicants, who earned
lower scores than white applicants, brought suit.*?he Court reaffirmed
the general outlines of Griggs, but in filling out details, it provided three
steps to follow in proving that an employment test was in violation of
Title VII (as amended). First, the Court said, a complaining party must
show disparate impact. This involved a statistical proof that those who
were hired or promoted on the basis of the test included significantly
fewer members of a protected group than random selection from the ap-
plicant pool would have produced. Given this proof of disparate impact,
the burden of proof shifts to the employer, who must now prove that
scores on the test have a proven and vital relationship to the specific job
they were hired for. The criterion expressed in Grigs, "business neces-
sity," was carried forward into Albemarle. If the employer passes this hur-
dle, the complaining party can offer evidence that the employer could
have used a different hiring procedure, one that was as effective in sea
lecting workers but without the disparate impact. If this can be shown,
then, the Court ruled, the employer has been shown to have discrimi-
nated illegally by failing to have used the alternative procedure.'2"
Other federal authorities besides the EEOC were monitoring and pro-
moting affirmative action in the workplace. In the mid-1970s, as in-
consistencies began to crop up, pressure built up for coordinating as
broad a slice of the federal involvement in affirmative action as possi-
ble. After some false starts, the Uniform Guidelines on Employee Se-
lection Procedures were adopted in 1978 by EEOC, the Civil Service
Commission (later called the Office of Personnel Management), the
Department of Justice, the Department of the Treasury, and the De-
partment of ~abor.*' At this writing, they are still in force. The Court's
decisions in Griggs and Alhemarle set the broader framework for the Uni-
form Guidelines, hut further details were elaborated, in some respects
660
Appendix 7
Appendix 7
66 1
increasing the pressure on employers using tests. For example, the Uni-
form Guidelines held-in
contrast to the Court in Alkmarle-that
the
employer has a responsibility for seeking less discriminatory selection
procedures, a rather different matter from giving a complaining party
the opportunity to do so, as the Court had decreed.
direction, affirmative action policies evolved toward greater reliance on
The Uniform Guidelines attempt to define a unified approach to affir-
mative action in the workplace, but practices still vary, and there con-
tinue to be new laws and new interpretations by courts. But they come
as close to a policy consensus as anything does. They also reveal the un-
derlying assumptions about the facts. On the matter of test validation,
the Guidelines espouse the stringent "business necessity" requirement
held in Griggs and Albemarle. They provide detailed requirements for
validating tests. Without submerging our readers more deeply in tech-
nical minutiae than seems appropriate here, let us say that the Uniform
Guidelines lean sharply toward criteria that would be hard and expen-
sive for employers to meet, even when cheaper or easier methods almost
certainly would have been more effe~tive.~'
General ability tests, read-
ily availahle and widely standardized, are rarely acceptable to the EEOC
or the courts, ilnless the employer goes through the difficult, if not
impossible, and, psychometrically speaking, needless, process of re-
standardization of an established test. To validate a test, an employer
needs a measure of performance. The govemment typically rejects mea-
sures of training performance and supervisor ratings. As Chapter 3
detailed, both training scores and supervisor ratings may be suitable
measures of performance, and they are relatively easy to obtain. The
measures usually required by the government are all but impossible to
obtain, especially for job candidates who are not hired.
Despite an air of rigor and precision in discussing validation, neither
the EEOC nor any other branch of govemment involved in administer-
ing affirmative action policies has shown any interest in evaluating just
how predictive of worker performance the stringent and costly valida-
tion procedures it demands are, or whether there is any gain in predic-
tive power when they are used. The thrust continues to he, as it has been
from the beginning, to increase the numbers hired or promoted from the
protected groups, based on the underlying assumption that, except for
discrimination or the legacy of past discrimination, the protected groups
should he equally represented across the occupational spectrum.
VALIDATING EMPLOYMENT TESTS
DISPARATE IMPACT
According to the Guidelines, an employer that comes under their ju-
risdiction can expect to be required to validate a test-that
is, to prove
its business necessity-if
there is disparate impact. And, the Guidelines
The Flaws of Disparate Impact
- Government validation requirements for employment tests are often impossible to meet, particularly because data on unhired candidates is unavailable.
- Regulatory bodies prioritize increasing representation for protected groups over evaluating the actual predictive power of their mandated validation procedures.
- The '80 percent rule' for determining disparate impact is psychometrically unsound because it fails to account for how selection ratios naturally shift as hiring standards rise.
- Statistical modeling shows that as IQ cutoffs increase for specialized roles, the ratio of selected candidates from lower-scoring groups inevitably shrinks, making the 80 percent rule unrealistic for high-skill professions.
- The 1989 Supreme Court case Wards Cove Packing Co. v. Atonio briefly signaled a shift away from the 'business necessity' standard toward a more attainable 'legitimate business goals' criterion.
The result of so extreme a requirement, warned the Court, would be 'a host of evils.'
disparate impact as the touchstone of illegality rather than on discrime
inatory intent or disparate treatment. As in Grigs, the Supreme Court
in 1975, in Albemark Paper Co. v. Moody," considered a case in which
an employer used intelligence tests (among other criteria) to select
workers for well-paying jobs. Once again, black applicants, who earned
lower scores than white applicants, brought suit.*?he Court reaffirmed
the general outlines of Griggs, but in filling out details, it provided three
steps to follow in proving that an employment test was in violation of
Title VII (as amended). First, the Court said, a complaining party must
show disparate impact. This involved a statistical proof that those who
were hired or promoted on the basis of the test included significantly
fewer members of a protected group than random selection from the ap-
plicant pool would have produced. Given this proof of disparate impact,
the burden of proof shifts to the employer, who must now prove that
scores on the test have a proven and vital relationship to the specific job
they were hired for. The criterion expressed in Grigs, "business neces-
sity," was carried forward into Albemarle. If the employer passes this hur-
dle, the complaining party can offer evidence that the employer could
have used a different hiring procedure, one that was as effective in sea
lecting workers but without the disparate impact. If this can be shown,
then, the Court ruled, the employer has been shown to have discrimi-
nated illegally by failing to have used the alternative procedure.'2"
Other federal authorities besides the EEOC were monitoring and pro-
moting affirmative action in the workplace. In the mid-1970s, as in-
consistencies began to crop up, pressure built up for coordinating as
broad a slice of the federal involvement in affirmative action as possi-
ble. After some false starts, the Uniform Guidelines on Employee Se-
lection Procedures were adopted in 1978 by EEOC, the Civil Service
Commission (later called the Office of Personnel Management), the
Department of Justice, the Department of the Treasury, and the De-
partment of ~abor.*' At this writing, they are still in force. The Court's
decisions in Griggs and Alhemarle set the broader framework for the Uni-
form Guidelines, hut further details were elaborated, in some respects
660
Appendix 7
Appendix 7
66 1
increasing the pressure on employers using tests. For example, the Uni-
form Guidelines held-in
contrast to the Court in Alkmarle-that
the
employer has a responsibility for seeking less discriminatory selection
procedures, a rather different matter from giving a complaining party
the opportunity to do so, as the Court had decreed.
direction, affirmative action policies evolved toward greater reliance on
The Uniform Guidelines attempt to define a unified approach to affir-
mative action in the workplace, but practices still vary, and there con-
tinue to be new laws and new interpretations by courts. But they come
as close to a policy consensus as anything does. They also reveal the un-
derlying assumptions about the facts. On the matter of test validation,
the Guidelines espouse the stringent "business necessity" requirement
held in Griggs and Albemarle. They provide detailed requirements for
validating tests. Without submerging our readers more deeply in tech-
nical minutiae than seems appropriate here, let us say that the Uniform
Guidelines lean sharply toward criteria that would be hard and expen-
sive for employers to meet, even when cheaper or easier methods almost
certainly would have been more effe~tive.~'
General ability tests, read-
ily availahle and widely standardized, are rarely acceptable to the EEOC
or the courts, ilnless the employer goes through the difficult, if not
impossible, and, psychometrically speaking, needless, process of re-
standardization of an established test. To validate a test, an employer
needs a measure of performance. The govemment typically rejects mea-
sures of training performance and supervisor ratings. As Chapter 3
detailed, both training scores and supervisor ratings may be suitable
measures of performance, and they are relatively easy to obtain. The
measures usually required by the government are all but impossible to
obtain, especially for job candidates who are not hired.
Despite an air of rigor and precision in discussing validation, neither
the EEOC nor any other branch of govemment involved in administer-
ing affirmative action policies has shown any interest in evaluating just
how predictive of worker performance the stringent and costly valida-
tion procedures it demands are, or whether there is any gain in predic-
tive power when they are used. The thrust continues to he, as it has been
from the beginning, to increase the numbers hired or promoted from the
protected groups, based on the underlying assumption that, except for
discrimination or the legacy of past discrimination, the protected groups
should he equally represented across the occupational spectrum.
VALIDATING EMPLOYMENT TESTS
DISPARATE IMPACT
According to the Guidelines, an employer that comes under their ju-
risdiction can expect to be required to validate a test-that
is, to prove
its business necessity-if
there is disparate impact. And, the Guidelines
662
Appendix 7
Appendix 7
663
further say, disparate impact is assumed if selecting employees by the test
violates the 80 percent rule, explained in Chapter 20. As helpful as it
may be to employers and regulators to have a fixed standard for disparate
impact, the 80 percent rule is psychometrically unsound because it sets
a fixed standard. Given two groups with differing average scores and a
cutoff for hiring or promotion, the ratio of those selected from the lower
group to those selected from the higher group, given a fair hiring process,
shrinks as the cutoff rises.
Suppose that you are an employer faced with two groups that are of
equal size in the applicant pool. The higher group averages one stan-
dard deviation above the lower on an IQ test, but the distribution of
scores for each group is normal and has the same variability. The eighty
percent rule fixes the ratio at eighty hired from the lower group (if it is
protected by affirmative action) per hundred hired from the higher
group. But if you want to establish a minimum IQ of 100 as the cutoff
point for hiring workers, only slightly more than thirty applicants from
the lower group would be selected for every hundred from the higher.
Suppose that you need a work force with above-average IQs, so you raise
the cutoff to an IQ score of 110. In that case, a fair hiring process could
be expected to select only twenty of the lower group for each hundred
selected from the upper group. If you need a work force with a minimum
IQ of 120, the ratio drops to about ten from the lower per hundred from
the higher. The ratio will continue to shrink indefinitely as the cutoff
moves upward. In other words, applying the 80 percent rule has drasti-
cally different effects for an employer hiring people for janitorial jobs
compared to an employer hiring lawyers or accountants. Even if one is
in favor of the concept of avoiding "disparate impact," the 80 percent
rule is an extremely unrealistic way of doing so.
A REVERSAL IN THE AFFIRMATIVE ACTION TREND LINE, OR
A BLIP?
The Supreme Court in 1989 backed off from its most demanding re-
quirements for employment testing. In Wards Cove Packing Co., rnc, v.
Atonio,I4 it softened the obligation on the employer in justifying dis-
parate impact of a test. "Business necessity," the Court said, is an un-
reasonably stringent criterion, virtually impossible for most ordinary
businesses to meet. The result of so extreme a requirement, warned the
Court, would be "a host of evils."25 It was, the Court now said, enough
to show that the test serves legitimate business goals. It looked as if the
Duke Power Co.'s defense in Griggs-to
improve the general intellec-
tual quality of its employees-would
have met this new standard. Soon
thereafter, however, Congress retaliated. The Civil Rights Act of 1991
repudiated Wards Cove and returned to the standards of Griggs and Albe-
mark-to
business necessity, job relatedness, and disparate impact as
those earlier decisions had defined it. Once again, employers evidently
must satisfy a criterion for employment testing that the Court, two years
before, judged to be impossibly demanding. The new law is fraught with
ambiguity and will doubtless send lawyers, their clients, and courts back
to work to figure out what it requires.'"ut
the best guess is that the
trendline had blipped, not reversed.
Legal Battles Over Employment Testing
- The Civil Rights Act of 1991 effectively reversed the Wards Cove decision, reinstating stricter standards for employment testing.
- Employers must now prove 'business necessity' and 'job relatedness' to justify tests that result in a disparate impact.
- The Supreme Court had previously deemed these reinstated standards to be 'impossibly demanding' for employers to satisfy.
- The legislative shift created significant legal ambiguity, likely leading to increased litigation and judicial interpretation.
- Despite legal fluctuations, the text suggests the long-term trend toward standardized intellectual assessment remains intact.
- The accompanying notes trace the historical evolution of intelligence testing from Galton and Spearman to modern legal precedents.
The new law is fraught with ambiguity and will doubtless send lawyers, their clients, and courts back to work to figure out what it requires.
662
Appendix 7
Appendix 7
663
further say, disparate impact is assumed if selecting employees by the test
violates the 80 percent rule, explained in Chapter 20. As helpful as it
may be to employers and regulators to have a fixed standard for disparate
impact, the 80 percent rule is psychometrically unsound because it sets
a fixed standard. Given two groups with differing average scores and a
cutoff for hiring or promotion, the ratio of those selected from the lower
group to those selected from the higher group, given a fair hiring process,
shrinks as the cutoff rises.
Suppose that you are an employer faced with two groups that are of
equal size in the applicant pool. The higher group averages one stan-
dard deviation above the lower on an IQ test, but the distribution of
scores for each group is normal and has the same variability. The eighty
percent rule fixes the ratio at eighty hired from the lower group (if it is
protected by affirmative action) per hundred hired from the higher
group. But if you want to establish a minimum IQ of 100 as the cutoff
point for hiring workers, only slightly more than thirty applicants from
the lower group would be selected for every hundred from the higher.
Suppose that you need a work force with above-average IQs, so you raise
the cutoff to an IQ score of 110. In that case, a fair hiring process could
be expected to select only twenty of the lower group for each hundred
selected from the upper group. If you need a work force with a minimum
IQ of 120, the ratio drops to about ten from the lower per hundred from
the higher. The ratio will continue to shrink indefinitely as the cutoff
moves upward. In other words, applying the 80 percent rule has drasti-
cally different effects for an employer hiring people for janitorial jobs
compared to an employer hiring lawyers or accountants. Even if one is
in favor of the concept of avoiding "disparate impact," the 80 percent
rule is an extremely unrealistic way of doing so.
A REVERSAL IN THE AFFIRMATIVE ACTION TREND LINE, OR
A BLIP?
The Supreme Court in 1989 backed off from its most demanding re-
quirements for employment testing. In Wards Cove Packing Co., rnc, v.
Atonio,I4 it softened the obligation on the employer in justifying dis-
parate impact of a test. "Business necessity," the Court said, is an un-
reasonably stringent criterion, virtually impossible for most ordinary
businesses to meet. The result of so extreme a requirement, warned the
Court, would be "a host of evils."25 It was, the Court now said, enough
to show that the test serves legitimate business goals. It looked as if the
Duke Power Co.'s defense in Griggs-to
improve the general intellec-
tual quality of its employees-would
have met this new standard. Soon
thereafter, however, Congress retaliated. The Civil Rights Act of 1991
repudiated Wards Cove and returned to the standards of Griggs and Albe-
mark-to
business necessity, job relatedness, and disparate impact as
those earlier decisions had defined it. Once again, employers evidently
must satisfy a criterion for employment testing that the Court, two years
before, judged to be impossibly demanding. The new law is fraught with
ambiguity and will doubtless send lawyers, their clients, and courts back
to work to figure out what it requires.'"ut
the best guess is that the
trendline had blipped, not reversed.
Notes
Abbreviations
DES.
National Center for Education Statistics, Digest of Education Statistics.
Published annually, Washington, D.C.: Govemment Printing Office.
NLSY. National Longitudinal Survey of Youth. Center for Human Resource
Research, Ohio State University, Columbus, Ohio.
SAUS. U.S. Bureau of the Census. Statistical Absnact of the United States. Pub-
lished annually, Washington, D.C.: Govemment Printing Office. For
each cite in the text, we have added the year of the edition and table
numbers to the abbreviation; e.g., DES, 19xx, Table xx"
1. Galton 1869.
2. Forrest 1974.
3. For a brief history of testing from Galton on, see Herrnstein and Boring
1965.
4. In China, civil service examinations that functioned de facto as intelli-
gence tests-though
overweighted with pure memory questions-had
been in use for more than a thousand years.
5. Spearman 1904.
6. Galton 1888; Stigler 1986.
7. A correlation matrix is the set of all pairs of correlations. For example, in
a 20-item test, each item will have 19 unique correlations with the other
items, and the total matrix will contain 190 unique correlations (of Item
1 with Item 2, Item 1 with Item 3, etc.).
8. We are glossing over many complexities, including the effects of varying
reliabilities for the items or tests. Spearman understood, and took account
of, the contribution of reliability variations.
9. Buck v. Bell, 1927.
10. This was Harry Laughlin, whose story is told in Kevles 1985.
11. Brigham 1923; Kevles 1985.
12. The stories have been most influentially told by Fallows 1980; Gould 1981 ;
Kamin 1974.
13. Snyderman and Herrnstein 1983.
14. Snvderman and Hermstein 1983.
666
Notes to pages 15-23
Notes to pages 26-35
667
15. Lippmann 1922 p. 10.
16. Lippmann, 1923 p. 46.
17. Snyderman and Hermstein 1983.
18. Maier and Schneirla 1935.
19. Skinner 1938.
20. Skinner 1953; Skinner 1971.
21. Jensen 1969.
22. Hirsch 1975, p. 3.
23. Pearson 1992.
24. Herrnstein 1971.
25. Griggs et al. v. Duke Power Co., 1971.
26. Quoted in Jensen 1980, p. 13.
27. Elliott 1987.
28. Kamin 1974, p. 3.
29. 0. Gillie. 1976. Crucial data faked by eminent psychologist. Sunday 'Times
(London), Oct. 24, pp. 1-2.
30. Joynson 1989; Fletcher 1991.
3 1. Bouchard et al. 1990.
32. Gould 1981.
33. Gould 1981, pp. 27-28.
34. Snyderman and Rothman 1988.
35. Binet himself had died by the time Piaget arrived at the Sorhonne in 1919,
but the work on intelligence testing was be~ng carried forward by his col-
laborator on the first Binet test, Theophile Simon (see Piaget 1952).
36. Sternberg 1988, p. 8.
37. Sternberg 1985, p. 18.
38. Block and Dworkin 1974.
39. Gardner 1983, pp. 60-61. Emphasis in the original.
40. Gardner 1983, p. 278.
41. Gardner 1983, p. xi. Emphasis in original.
42. Gardner 1983, p. 17. In fact, Gardner's claim about the arbitrariness of fac-
tor analysis is incorrect.
43. Gardner 1983, pp. xi-xii.
44. Gardner 1983, p. 17.
45. Although some of the accomplishments of mental calculators remain in-
explicable, much has been learned about how they are done. See Jensen
1990; O'Connor and Hermelin 1987.
46. Ceci and Liker 1986.
47. An accurate and highly readable summary of the major pints is Seligman
1992. For those who are prepared to dig deeper, Jensen 1980 remains an
authoritative statement on most of the basic issues despite the passage of
time since it was published.
Introduction to Part I
1. Reuning 1988.
2. Robert Laird Collier, quoted in Manchester 1983, p. 79.
Chapter 1
1. Bender 1960, p. 2.
2. The national SAT-V in 1952 was 476, a little more than a standard devi-
ation lower than the Harvard mean. Perhaps the average Harvard student
was much farther ahead of the national average than the text suggests be-
cause the national SAT-taking population was so selective, representing
only 6.8 percent of high school graduates. But one of the oddities of the
1950s, discussed in more detail in Chapter 18, is that the SAT means re-
mained constant through the decade and into 1963, even as the size of the
test-taking population mushroomed. By 1963, when SAT scores hit their
all-time high in the post-1952 period, the test-taking population had
grown to 47.9 percent of all high school graduates. Thus there is reason to
think that the comparison is about the same as the one that would have
been produced by a much larger number of test takers in 1952.
3. Bender 1960, p. 4.
4. In the 1920s, fewer than 30 percent of all young people graduated from
high school, and the differences between the cognitive ability of graduates
and nongraduates were small, as discussed in Chapter 6. Something be-
tween 60 and 75 percent of the 18-year-olds in the top IQ quartile never
even made it into the calculations shown in the figure on page 34. From
the early 1960s on, 70 percent of the nation's youth have graduated from
high school, and we know that the difference between the ability of those
who do and do not graduate has been large. More concretely, of a nation-
ally representative sample of youth who were administered a highly re-
garded psychometric test in 1980 when they were 15 and 16 years old, 95
percent of those who scored in the top quartile subsequently graduated
from high school, and another 4 percent eventually got a general equiva-
lency diploma. The test was the Armed Forces Qualification Test, and the
sample was the 1964 birth cohort of the National Longitudinal Survey of
Youth (NLSY), discussed in detail in the introduction to Part 11. The fig-
ure for the proportion entering colleges is based on the NLSY cohorts and
students entering colleges over 1981-1983.
5. The top IQ quartile of the NLSY that first attended college in 1981-1983
was split as follows: 21 percent did not continue to college in the first year
after graduation, 18 percent went to a two-year college, and 61 percent at-
tended a four-year college.
6. O'Brien 1928. These percentages are based on high school graduates,
Evolution of Academic Selectivity
- The text highlights a significant shift in the relationship between cognitive ability and educational attainment from the 1920s to the 1980s.
- In the 1950s, SAT means remained surprisingly constant despite a massive increase in the percentage of high school graduates taking the test.
- Early 20th-century high school graduation rates were below 30 percent, with minimal cognitive differences between graduates and non-graduates.
- By the 1960s, the correlation between high IQ and college attendance strengthened, with over 95 percent of the top 5 percent of students entering college.
- Data from the National Longitudinal Survey of Youth (NLSY) shows that by the early 1980s, 95 percent of the top IQ quartile graduated high school.
- The transition to college became a primary filter for cognitive ability, with 61 percent of the top quartile attending four-year institutions by 1983.
But one of the oddities of the 1950s, discussed in more detail in Chapter 18, is that the SAT means remained constant through the decade and into 1963, even as the size of the test-taking population mushroomed.
666
Notes to pages 15-23
Notes to pages 26-35
667
15. Lippmann 1922 p. 10.
16. Lippmann, 1923 p. 46.
17. Snyderman and Hermstein 1983.
18. Maier and Schneirla 1935.
19. Skinner 1938.
20. Skinner 1953; Skinner 1971.
21. Jensen 1969.
22. Hirsch 1975, p. 3.
23. Pearson 1992.
24. Herrnstein 1971.
25. Griggs et al. v. Duke Power Co., 1971.
26. Quoted in Jensen 1980, p. 13.
27. Elliott 1987.
28. Kamin 1974, p. 3.
29. 0. Gillie. 1976. Crucial data faked by eminent psychologist. Sunday 'Times
(London), Oct. 24, pp. 1-2.
30. Joynson 1989; Fletcher 1991.
3 1. Bouchard et al. 1990.
32. Gould 1981.
33. Gould 1981, pp. 27-28.
34. Snyderman and Rothman 1988.
35. Binet himself had died by the time Piaget arrived at the Sorhonne in 1919,
but the work on intelligence testing was be~ng carried forward by his col-
laborator on the first Binet test, Theophile Simon (see Piaget 1952).
36. Sternberg 1988, p. 8.
37. Sternberg 1985, p. 18.
38. Block and Dworkin 1974.
39. Gardner 1983, pp. 60-61. Emphasis in the original.
40. Gardner 1983, p. 278.
41. Gardner 1983, p. xi. Emphasis in original.
42. Gardner 1983, p. 17. In fact, Gardner's claim about the arbitrariness of fac-
tor analysis is incorrect.
43. Gardner 1983, pp. xi-xii.
44. Gardner 1983, p. 17.
45. Although some of the accomplishments of mental calculators remain in-
explicable, much has been learned about how they are done. See Jensen
1990; O'Connor and Hermelin 1987.
46. Ceci and Liker 1986.
47. An accurate and highly readable summary of the major pints is Seligman
1992. For those who are prepared to dig deeper, Jensen 1980 remains an
authoritative statement on most of the basic issues despite the passage of
time since it was published.
Introduction to Part I
1. Reuning 1988.
2. Robert Laird Collier, quoted in Manchester 1983, p. 79.
Chapter 1
1. Bender 1960, p. 2.
2. The national SAT-V in 1952 was 476, a little more than a standard devi-
ation lower than the Harvard mean. Perhaps the average Harvard student
was much farther ahead of the national average than the text suggests be-
cause the national SAT-taking population was so selective, representing
only 6.8 percent of high school graduates. But one of the oddities of the
1950s, discussed in more detail in Chapter 18, is that the SAT means re-
mained constant through the decade and into 1963, even as the size of the
test-taking population mushroomed. By 1963, when SAT scores hit their
all-time high in the post-1952 period, the test-taking population had
grown to 47.9 percent of all high school graduates. Thus there is reason to
think that the comparison is about the same as the one that would have
been produced by a much larger number of test takers in 1952.
3. Bender 1960, p. 4.
4. In the 1920s, fewer than 30 percent of all young people graduated from
high school, and the differences between the cognitive ability of graduates
and nongraduates were small, as discussed in Chapter 6. Something be-
tween 60 and 75 percent of the 18-year-olds in the top IQ quartile never
even made it into the calculations shown in the figure on page 34. From
the early 1960s on, 70 percent of the nation's youth have graduated from
high school, and we know that the difference between the ability of those
who do and do not graduate has been large. More concretely, of a nation-
ally representative sample of youth who were administered a highly re-
garded psychometric test in 1980 when they were 15 and 16 years old, 95
percent of those who scored in the top quartile subsequently graduated
from high school, and another 4 percent eventually got a general equiva-
lency diploma. The test was the Armed Forces Qualification Test, and the
sample was the 1964 birth cohort of the National Longitudinal Survey of
Youth (NLSY), discussed in detail in the introduction to Part 11. The fig-
ure for the proportion entering colleges is based on the NLSY cohorts and
students entering colleges over 1981-1983.
5. The top IQ quartile of the NLSY that first attended college in 1981-1983
was split as follows: 21 percent did not continue to college in the first year
after graduation, 18 percent went to a two-year college, and 61 percent at-
tended a four-year college.
6. O'Brien 1928. These percentages are based on high school graduates,
668
Notes to pages 3540
Notes to pages 40-45
669
which accounts for the high percentages of students shown as going to col-
lege in the 1920s. If the estimates had been based on the proportion of the
18eyear-olds who have been graduating from high school since the 1970s,
those proportions would have been much smaller. The shape of the curve,
however, would be essentially unchanged (because the IQ distribution of
students who did not complete high school was so close to the distribution
of those who did; see Finch 1946).
7. Another excellent database from the same period, a nationally represen-
tative sample tested with the Preliminary SAT in 1960 and followed up a
year later, confirms results from Project TALENT, a large, nationally rep-
resentative sample of high school ~ouths taken in 1960 (Seibel 1962).
Among those who scored in the bottom quartile, for example, only 1 1 per-
cent went to college; of those in the top quartile, 79 percent went to cul-
lege; of those in the top 5 percent, more than 95 percent went to college.
8. These data are taken from Project TALENT in 1960.
9. From the NLSY, described in the introduction to Part 11.
10. The test was Form A of the Otis. Brigham 1932, Table XVIII, p. 336.
11. The schools are Brown, Bryn Mawr, Columbia, Haward, Mount Holyoke,
Princeton, Radcliffe, Smith, University of Pennsylvania (with separate
means for men and women), Vassar, Wellesley, Williams, and Yale.
12. Learned and Wood 1938.
13. Not including the University of Pennsylvania, one of the elite schools.
14. Between the earliest SAT and 1964, the SAT had divided into a verbal
and a math score. It is a moot question whether the modem overall SAT
or the verbal SAT is more comparable to the original SAT. In the com-
parisons being made here, we rely on the Educational Testing Service norm
studies, which enable us to place an SAT value on the national 18-year-old
cohort, not just the cohort who takes the test. We explain the norm stud-
ies in Chapter 18.
15. This is not the usual SAT distribution, which is ordinarily restricted to
college-bound seniors, but rather shows the distribution for a nationally
representative sample of all high school seniors, based on the norm stud-
ies mentioned in note 14. It is restricted to persons still in high school and
does not include the 34 percent of 18-year-olds who were not.
16. We know how high the scores were for many schools as of the early 1960s.
We know Harvard's scores in the early 1950s. We can further be confident
that no school was much more selective than Harvard as of 1952 (with the
possible exception of science students going to Cal Tech and MIT). There-
fore means for virtually all of the other schools as of 1952 had to be near
or below Harvard's, and the dramatic changes for the other elite schools
had to be occurring in the same comparatively brief period of time con-
centrated in the 1950s.
17. Bender 1960, p. 6.
18. This percentage is derived from 1960 data reported by Bender 1960, p. 15,
regarding the median family income of candidates who applied for schol-
arship aid, were denied, but came to Harvard anyway. Total costs at Har+
vard in 1960 represented 21 percent of that median.
19. The families for whom a year at Haward represented less than 20 percent
of their income constituted approximately 5.8 percent of families in 1950
and 5.5 percent of families in 1950. Estimated from U.S. Bureau of the
Census 1975, G-1-15.
20. The faculty's views were expressed in Faculty of Arts and Sciences 1960.
21. Bender 1960,p. 31.
22. For an analysis of the ascriptive qualities that Harvard continued to use for
admissions choices in the 1980s, see Karen 1991.
23. The increase in applications to Harvard had been just as rapid from 1952
to 1958, when the size of the birth cohorts was virtually constant, as in
1959 and 1960, when they started to increase.
24. For an analysis of forces driving more recent increases in applications, see
Clotfelter 1990 and Cook and Frank 1992.
25. Cook and Frank 1992.
26. Harvard, MIT, Princeton, Stanford, and Cal Tech were in the top seven
in all three decades. Columbia and Chicago were the other two in the
1960s, Yale and Comell in the 1970s and 1980s. Cook and Frank 1992,
Table 3.
27. Cook and Frank 1992, Table 4. The list of "most competitive" consists of
the thirty-three schools named by Bawon's in its 1980 list. The Cook and
Frank analysis generally suggests that the concentration of top students in
a few schools may have plateaued during the 1970s, then resumed again in
the 1980s.
28. U.S. News €4 Wmld Report, October 15, 1990, pp. 116-134. It is not nec-
essary to insist that this ranking is precisely accurate. It is enough that it
includes all the schools that most people would name if they were asked
to list the nation's top schools, and the method for arriving at the list of
fifty seems reasonable.
29. The College Board ethnic and race breakdowns for 199 1, available by re-
quest from the College Board. There is also reason to believe that an ex-
tremely high proportion of high school students in each senior class who
have the potential to score in the high 600s and the 700s on the SAT ac-
tually take the test. See Murray and Herrnstein 1992.
30. See Chapter 18 for where the SAT population resides in the national con-
text.
31. These represent normal distributions based on estimates drawn from the
Learned data that the mean IQ of Pennsylvania graduates in 1930 was ap-
Evolution of Elite Admissions
- The text documents a significant shift in the selectivity of elite American universities, particularly during the 1950s.
- Data suggests that Harvard's academic standards in the early 1950s served as a ceiling for most other elite institutions of that era.
- The concentration of high-scoring students in a small number of 'most competitive' schools plateaued in the 1970s before resuming in the 1980s.
- Economic barriers were substantial, with Harvard's total costs in 1960 representing over 20 percent of the median income for many families.
- The rise in applications to top-tier schools was driven by factors beyond simple birth cohort size, as evidenced by rapid growth during periods of constant birth rates.
We can further be confident that no school was much more selective than Harvard as of 1952 (with the possible exception of science students going to Cal Tech and MIT).
668
Notes to pages 3540
Notes to pages 40-45
669
which accounts for the high percentages of students shown as going to col-
lege in the 1920s. If the estimates had been based on the proportion of the
18eyear-olds who have been graduating from high school since the 1970s,
those proportions would have been much smaller. The shape of the curve,
however, would be essentially unchanged (because the IQ distribution of
students who did not complete high school was so close to the distribution
of those who did; see Finch 1946).
7. Another excellent database from the same period, a nationally represen-
tative sample tested with the Preliminary SAT in 1960 and followed up a
year later, confirms results from Project TALENT, a large, nationally rep-
resentative sample of high school ~ouths taken in 1960 (Seibel 1962).
Among those who scored in the bottom quartile, for example, only 1 1 per-
cent went to college; of those in the top quartile, 79 percent went to cul-
lege; of those in the top 5 percent, more than 95 percent went to college.
8. These data are taken from Project TALENT in 1960.
9. From the NLSY, described in the introduction to Part 11.
10. The test was Form A of the Otis. Brigham 1932, Table XVIII, p. 336.
11. The schools are Brown, Bryn Mawr, Columbia, Haward, Mount Holyoke,
Princeton, Radcliffe, Smith, University of Pennsylvania (with separate
means for men and women), Vassar, Wellesley, Williams, and Yale.
12. Learned and Wood 1938.
13. Not including the University of Pennsylvania, one of the elite schools.
14. Between the earliest SAT and 1964, the SAT had divided into a verbal
and a math score. It is a moot question whether the modem overall SAT
or the verbal SAT is more comparable to the original SAT. In the com-
parisons being made here, we rely on the Educational Testing Service norm
studies, which enable us to place an SAT value on the national 18-year-old
cohort, not just the cohort who takes the test. We explain the norm stud-
ies in Chapter 18.
15. This is not the usual SAT distribution, which is ordinarily restricted to
college-bound seniors, but rather shows the distribution for a nationally
representative sample of all high school seniors, based on the norm stud-
ies mentioned in note 14. It is restricted to persons still in high school and
does not include the 34 percent of 18-year-olds who were not.
16. We know how high the scores were for many schools as of the early 1960s.
We know Harvard's scores in the early 1950s. We can further be confident
that no school was much more selective than Harvard as of 1952 (with the
possible exception of science students going to Cal Tech and MIT). There-
fore means for virtually all of the other schools as of 1952 had to be near
or below Harvard's, and the dramatic changes for the other elite schools
had to be occurring in the same comparatively brief period of time con-
centrated in the 1950s.
17. Bender 1960, p. 6.
18. This percentage is derived from 1960 data reported by Bender 1960, p. 15,
regarding the median family income of candidates who applied for schol-
arship aid, were denied, but came to Harvard anyway. Total costs at Har+
vard in 1960 represented 21 percent of that median.
19. The families for whom a year at Haward represented less than 20 percent
of their income constituted approximately 5.8 percent of families in 1950
and 5.5 percent of families in 1950. Estimated from U.S. Bureau of the
Census 1975, G-1-15.
20. The faculty's views were expressed in Faculty of Arts and Sciences 1960.
21. Bender 1960,p. 31.
22. For an analysis of the ascriptive qualities that Harvard continued to use for
admissions choices in the 1980s, see Karen 1991.
23. The increase in applications to Harvard had been just as rapid from 1952
to 1958, when the size of the birth cohorts was virtually constant, as in
1959 and 1960, when they started to increase.
24. For an analysis of forces driving more recent increases in applications, see
Clotfelter 1990 and Cook and Frank 1992.
25. Cook and Frank 1992.
26. Harvard, MIT, Princeton, Stanford, and Cal Tech were in the top seven
in all three decades. Columbia and Chicago were the other two in the
1960s, Yale and Comell in the 1970s and 1980s. Cook and Frank 1992,
Table 3.
27. Cook and Frank 1992, Table 4. The list of "most competitive" consists of
the thirty-three schools named by Bawon's in its 1980 list. The Cook and
Frank analysis generally suggests that the concentration of top students in
a few schools may have plateaued during the 1970s, then resumed again in
the 1980s.
28. U.S. News €4 Wmld Report, October 15, 1990, pp. 116-134. It is not nec-
essary to insist that this ranking is precisely accurate. It is enough that it
includes all the schools that most people would name if they were asked
to list the nation's top schools, and the method for arriving at the list of
fifty seems reasonable.
29. The College Board ethnic and race breakdowns for 199 1, available by re-
quest from the College Board. There is also reason to believe that an ex-
tremely high proportion of high school students in each senior class who
have the potential to score in the high 600s and the 700s on the SAT ac-
tually take the test. See Murray and Herrnstein 1992.
30. See Chapter 18 for where the SAT population resides in the national con-
text.
31. These represent normal distributions based on estimates drawn from the
Learned data that the mean IQ of Pennsylvania graduates in 1930 was ap-
Cognitive Stratification in Elite Education
- The text provides a statistical analysis of IQ and SAT score distributions among graduates of elite American universities compared to the general population.
- Data from the 1930s indicates that Ivy League graduates already possessed cognitive scores significantly higher than the national mean, often by 1.25 standard deviations.
- By the early 1990s, the mean SAT-Verbal score for graduates of the top twelve universities was estimated at 650, contrasted with a national norm of 376.
- The authors utilize the Armed Forces Qualification Test (AFQT) and SAT-Verbal scores as proxies for general intelligence (g) to map cognitive distributions.
- The probability of attending a top-tier university like Harvard or Yale is described as statistically 'tiny' when viewed as a proportion of the total age cohort.
- The research highlights a growing concentration of high-cognitive-ability individuals within a small cluster of prestigious academic institutions.
The odds are already so tiny that they are for practical purposes unaffected by further restrictions.
668
Notes to pages 3540
Notes to pages 40-45
669
which accounts for the high percentages of students shown as going to col-
lege in the 1920s. If the estimates had been based on the proportion of the
18eyear-olds who have been graduating from high school since the 1970s,
those proportions would have been much smaller. The shape of the curve,
however, would be essentially unchanged (because the IQ distribution of
students who did not complete high school was so close to the distribution
of those who did; see Finch 1946).
7. Another excellent database from the same period, a nationally represen-
tative sample tested with the Preliminary SAT in 1960 and followed up a
year later, confirms results from Project TALENT, a large, nationally rep-
resentative sample of high school ~ouths taken in 1960 (Seibel 1962).
Among those who scored in the bottom quartile, for example, only 1 1 per-
cent went to college; of those in the top quartile, 79 percent went to cul-
lege; of those in the top 5 percent, more than 95 percent went to college.
8. These data are taken from Project TALENT in 1960.
9. From the NLSY, described in the introduction to Part 11.
10. The test was Form A of the Otis. Brigham 1932, Table XVIII, p. 336.
11. The schools are Brown, Bryn Mawr, Columbia, Haward, Mount Holyoke,
Princeton, Radcliffe, Smith, University of Pennsylvania (with separate
means for men and women), Vassar, Wellesley, Williams, and Yale.
12. Learned and Wood 1938.
13. Not including the University of Pennsylvania, one of the elite schools.
14. Between the earliest SAT and 1964, the SAT had divided into a verbal
and a math score. It is a moot question whether the modem overall SAT
or the verbal SAT is more comparable to the original SAT. In the com-
parisons being made here, we rely on the Educational Testing Service norm
studies, which enable us to place an SAT value on the national 18-year-old
cohort, not just the cohort who takes the test. We explain the norm stud-
ies in Chapter 18.
15. This is not the usual SAT distribution, which is ordinarily restricted to
college-bound seniors, but rather shows the distribution for a nationally
representative sample of all high school seniors, based on the norm stud-
ies mentioned in note 14. It is restricted to persons still in high school and
does not include the 34 percent of 18-year-olds who were not.
16. We know how high the scores were for many schools as of the early 1960s.
We know Harvard's scores in the early 1950s. We can further be confident
that no school was much more selective than Harvard as of 1952 (with the
possible exception of science students going to Cal Tech and MIT). There-
fore means for virtually all of the other schools as of 1952 had to be near
or below Harvard's, and the dramatic changes for the other elite schools
had to be occurring in the same comparatively brief period of time con-
centrated in the 1950s.
17. Bender 1960, p. 6.
18. This percentage is derived from 1960 data reported by Bender 1960, p. 15,
regarding the median family income of candidates who applied for schol-
arship aid, were denied, but came to Harvard anyway. Total costs at Har+
vard in 1960 represented 21 percent of that median.
19. The families for whom a year at Haward represented less than 20 percent
of their income constituted approximately 5.8 percent of families in 1950
and 5.5 percent of families in 1950. Estimated from U.S. Bureau of the
Census 1975, G-1-15.
20. The faculty's views were expressed in Faculty of Arts and Sciences 1960.
21. Bender 1960,p. 31.
22. For an analysis of the ascriptive qualities that Harvard continued to use for
admissions choices in the 1980s, see Karen 1991.
23. The increase in applications to Harvard had been just as rapid from 1952
to 1958, when the size of the birth cohorts was virtually constant, as in
1959 and 1960, when they started to increase.
24. For an analysis of forces driving more recent increases in applications, see
Clotfelter 1990 and Cook and Frank 1992.
25. Cook and Frank 1992.
26. Harvard, MIT, Princeton, Stanford, and Cal Tech were in the top seven
in all three decades. Columbia and Chicago were the other two in the
1960s, Yale and Comell in the 1970s and 1980s. Cook and Frank 1992,
Table 3.
27. Cook and Frank 1992, Table 4. The list of "most competitive" consists of
the thirty-three schools named by Bawon's in its 1980 list. The Cook and
Frank analysis generally suggests that the concentration of top students in
a few schools may have plateaued during the 1970s, then resumed again in
the 1980s.
28. U.S. News €4 Wmld Report, October 15, 1990, pp. 116-134. It is not nec-
essary to insist that this ranking is precisely accurate. It is enough that it
includes all the schools that most people would name if they were asked
to list the nation's top schools, and the method for arriving at the list of
fifty seems reasonable.
29. The College Board ethnic and race breakdowns for 199 1, available by re-
quest from the College Board. There is also reason to believe that an ex-
tremely high proportion of high school students in each senior class who
have the potential to score in the high 600s and the 700s on the SAT ac-
tually take the test. See Murray and Herrnstein 1992.
30. See Chapter 18 for where the SAT population resides in the national con-
text.
31. These represent normal distributions based on estimates drawn from the
Learned data that the mean IQ of Pennsylvania graduates in 1930 was ap-
670
Notes to pages 46-47
Notes to pages 50-53
6 7 1
proximately two-thirds of a standard deviation above the mean (the mean
of incoming freshmen was .48 SDs above the mean), and from the Brigham
data that the graduates of the Ivy League and Seven Sisters were approxi-
mately 1.25 SDs above the mean (they were 1.1 SDs above the mean as
freshmen, and the Ivy League graduated extremely high proportions of the
incoming students).
32. The distributions for the main groups are based on the NLSY, for youths
who came of college age from 1981 to 1983 and have been followed through
the 1990 interview wave. The top dozen universities are those ranked 1
through 12 in the U.S. News B World Report survey for 1990. U.S. News
B World Report, October 15, 1990, pp. 116-134. The analysis is based on
pblished distribution of SAT-Verbal scores, which is the more highly g-
loaded of the SAT subtests. The estimated verbal mean (weighted by size
of the freshman class) for these twenty schools, based on their published
SAT distributions, is 633. The estimated mean for graduates is 650
(dropout rates for these schools are comparatively low but highly con-
centrated among those with the lowest entering scores). This compares
with a national SAT-Verbal norm estimated at 376 with an SD of 102
(Braun, Centra, and King, 1987, Appendix B). The distribution in the fig-
ure on page 46 converts the SAT data to standardized scores. The implicit
assumption is that AFQT (Armed Forces Qualification Test, an intelli-
gence test discussed in Appendix 3) and SAT-Verbal measure the same
thing, which is surely wrong to some degree. Both tests are highly g-loaded,
however, and it is reasonable to conclude that youths who have a mean
2.5 SDs above the mean on the SAT would have means somewhere close
to that on a full-fledged mental test.
33. We have defined these as the first twelve of the listed universities in the
U.S. News B World Report listing for 1990. They are (in the order of their
ranking) Harvard, Stanford, Yale, Princeton, Cal Tech, MIT, Duke, Dart-
mouth, Comell, Columbia, University of Chicago, and Brown.
34. The probabilities are based on the proportions of people entering these
categories in the 1980s, which means that they become progressively too
generous for older readers (when the proportion of people getting college
degrees was smaller). But this is a technicality; the odds are already so tiny
that they are for practical purposes unaffected by further restrictions. The
figure for college degrees reflects the final educational attainment of mem-
bers of the NLSY, who were born in 1957 through 1964, as of 1990 (when
the youngest was 25), as a weighted proportion of the NLSY population.
The figure for Ph.D., law, and medical degrees is based on the number of
degrees awarded over 1980-1989 expressed as a proportion of the popula-
tion age 26 in each of those years. The figure for graduates of the dozen
elite schools is based on the number of undergraduate degrees awarded by
these institutions in 1989 (the figure has varied little for many years), ex-
pressed as a proportion of the population age 22 in 1989 (incidentally, the
smallest cohort since the mid-1970s.)
35. Based on the median percentages for those score intervals among those
schools.
Chapter 2
1. Hermstein 1973.
2. For a one-source discussion of IQs and occupations, see Matarazzo 1972,
Chap. 7. Also seelencks et al. 1972 and Sewell and Hauser 1975 for com-
prehensive analyses of particular sets of data. The literature is large and ex-
tends back to the early part of the century. For earlier studies, see, for
example, Bingham 1937; Clark and Gist 1938; Fryer 1922; Pond 1933;
Stewart 1947; Terman 1942. For more recent estimates of minimum scores
for a wide variety of occupations, see E. F. Wonderlic & Associates 1983;
U.S. Department of Labor 1970.
3. Jencks et al. 1972.
4. Fallows 1985.
5. The Fels Longitudinal Study; see McCall 1977.
6. The correlation was a sizable .5-.6, on a scale that goes from -1 to +l. See
Chapter 3 and Appendix 1 for a fuller explanation of what the correlation
coefficient means. Job status for the boys was about equally well predicted
by childhood IQ as by their completed educational levels; for the girls, job
status was more correlated with childhood IQ than with educational at-
tainment. In another study, adult intelligence was also more highly corre-
lated with occupational status than with educational attainment (see
Duncan 1968). But this may make a somewhat different point, inasmuch
as adult intelligence may itself be affected by educational attainment, in
contrast to the IQ one chalks up at age 7 or 8 years. In yet another study,
based on Swedish data, adult income (as distinguished from occupational
status) was less strongly dependent on childhood IQ (age 10) than on even-
tual educational attainment (T. Husen's data presented in Griliches 1970),
although being strongly dependent on both. Other analyses come up with
different assessments of the underlying relationships (e.g., Bowles and Gin-
tis 1976; Jencks 1979). Not surprisingly, the empirical picture, being ex-
tremely diverse and rich, has lent itself to myriad formal analyses, which
we will make no attempt to review. In Chapters 3 and 4, we present our
interpretation of the link between individual ability and occupation. We
also discuss some of the evident exceptions to these findings.
7. Many of the major studies (e.g., Duncan 1968; Jencks et al. 1972; McCall
1977; Sewell and Hauser 1975) include variables describing familial so-
IQ and Occupational Success
- Extensive longitudinal data suggests a strong correlation between childhood IQ and future occupational status, often rivaling or exceeding the predictive power of educational attainment.
- Gender differences appear in the data, with job status for girls showing a higher correlation with childhood IQ than with their completed education levels.
- While adult income is strongly linked to both IQ and education, some studies suggest education may have a slightly stronger influence on earnings than early childhood intelligence.
- Research into adoptive and biological siblings suggests that the resemblance in occupational destinies among relatives is largely driven by shared genetic factors influencing IQ.
- Specific cognitive strengths align with professional choices, such as engineers scoring higher in quantitative areas while English professors excel in verbal domains.
- The distribution of IQ in high-status occupations is often skewed, with scores of 120 or higher typically representing the top tenth of the general population.
It could, of course, be traits of personality rather than of intellect that tie a family's occupational destinies together.
670
Notes to pages 46-47
Notes to pages 50-53
6 7 1
proximately two-thirds of a standard deviation above the mean (the mean
of incoming freshmen was .48 SDs above the mean), and from the Brigham
data that the graduates of the Ivy League and Seven Sisters were approxi-
mately 1.25 SDs above the mean (they were 1.1 SDs above the mean as
freshmen, and the Ivy League graduated extremely high proportions of the
incoming students).
32. The distributions for the main groups are based on the NLSY, for youths
who came of college age from 1981 to 1983 and have been followed through
the 1990 interview wave. The top dozen universities are those ranked 1
through 12 in the U.S. News B World Report survey for 1990. U.S. News
B World Report, October 15, 1990, pp. 116-134. The analysis is based on
pblished distribution of SAT-Verbal scores, which is the more highly g-
loaded of the SAT subtests. The estimated verbal mean (weighted by size
of the freshman class) for these twenty schools, based on their published
SAT distributions, is 633. The estimated mean for graduates is 650
(dropout rates for these schools are comparatively low but highly con-
centrated among those with the lowest entering scores). This compares
with a national SAT-Verbal norm estimated at 376 with an SD of 102
(Braun, Centra, and King, 1987, Appendix B). The distribution in the fig-
ure on page 46 converts the SAT data to standardized scores. The implicit
assumption is that AFQT (Armed Forces Qualification Test, an intelli-
gence test discussed in Appendix 3) and SAT-Verbal measure the same
thing, which is surely wrong to some degree. Both tests are highly g-loaded,
however, and it is reasonable to conclude that youths who have a mean
2.5 SDs above the mean on the SAT would have means somewhere close
to that on a full-fledged mental test.
33. We have defined these as the first twelve of the listed universities in the
U.S. News B World Report listing for 1990. They are (in the order of their
ranking) Harvard, Stanford, Yale, Princeton, Cal Tech, MIT, Duke, Dart-
mouth, Comell, Columbia, University of Chicago, and Brown.
34. The probabilities are based on the proportions of people entering these
categories in the 1980s, which means that they become progressively too
generous for older readers (when the proportion of people getting college
degrees was smaller). But this is a technicality; the odds are already so tiny
that they are for practical purposes unaffected by further restrictions. The
figure for college degrees reflects the final educational attainment of mem-
bers of the NLSY, who were born in 1957 through 1964, as of 1990 (when
the youngest was 25), as a weighted proportion of the NLSY population.
The figure for Ph.D., law, and medical degrees is based on the number of
degrees awarded over 1980-1989 expressed as a proportion of the popula-
tion age 26 in each of those years. The figure for graduates of the dozen
elite schools is based on the number of undergraduate degrees awarded by
these institutions in 1989 (the figure has varied little for many years), ex-
pressed as a proportion of the population age 22 in 1989 (incidentally, the
smallest cohort since the mid-1970s.)
35. Based on the median percentages for those score intervals among those
schools.
Chapter 2
1. Hermstein 1973.
2. For a one-source discussion of IQs and occupations, see Matarazzo 1972,
Chap. 7. Also seelencks et al. 1972 and Sewell and Hauser 1975 for com-
prehensive analyses of particular sets of data. The literature is large and ex-
tends back to the early part of the century. For earlier studies, see, for
example, Bingham 1937; Clark and Gist 1938; Fryer 1922; Pond 1933;
Stewart 1947; Terman 1942. For more recent estimates of minimum scores
for a wide variety of occupations, see E. F. Wonderlic & Associates 1983;
U.S. Department of Labor 1970.
3. Jencks et al. 1972.
4. Fallows 1985.
5. The Fels Longitudinal Study; see McCall 1977.
6. The correlation was a sizable .5-.6, on a scale that goes from -1 to +l. See
Chapter 3 and Appendix 1 for a fuller explanation of what the correlation
coefficient means. Job status for the boys was about equally well predicted
by childhood IQ as by their completed educational levels; for the girls, job
status was more correlated with childhood IQ than with educational at-
tainment. In another study, adult intelligence was also more highly corre-
lated with occupational status than with educational attainment (see
Duncan 1968). But this may make a somewhat different point, inasmuch
as adult intelligence may itself be affected by educational attainment, in
contrast to the IQ one chalks up at age 7 or 8 years. In yet another study,
based on Swedish data, adult income (as distinguished from occupational
status) was less strongly dependent on childhood IQ (age 10) than on even-
tual educational attainment (T. Husen's data presented in Griliches 1970),
although being strongly dependent on both. Other analyses come up with
different assessments of the underlying relationships (e.g., Bowles and Gin-
tis 1976; Jencks 1979). Not surprisingly, the empirical picture, being ex-
tremely diverse and rich, has lent itself to myriad formal analyses, which
we will make no attempt to review. In Chapters 3 and 4, we present our
interpretation of the link between individual ability and occupation. We
also discuss some of the evident exceptions to these findings.
7. Many of the major studies (e.g., Duncan 1968; Jencks et al. 1972; McCall
1977; Sewell and Hauser 1975) include variables describing familial so-
67 2
Notes to pages 54-56
Notes to pages 57-66
673
cioeconomic status, which prove to be somewhat predictive of a person's
own status.
8. For a fuller discussion of both the explanation and the controversy, see
Herrnstein 1973.
9. Teasdale, Sorenson, and Owen 1984.
10. The authors of the study offered as an explanation for this pattern of re-
sults the well-established pattern of resemblances among relatives in IQ,
presumably owing to the genes that natural siblings share and that adop-
tive siblings do not share. It could, of course, be traits of personality rather
than of intellect that tie a family's occupational dest~nies together. How-
ever, the small body of evidence bearing on personality traits finds them
to be distinctly weaker predictors of job status than is IQ. Another study,
of over 1,000 pairs of Norwegian twins, supported the conclusion that the
resemblance in job status among close relatives is largely explained by their
similarity in IQ and that genes play a significant role in this similarity. See
Tambs et al. 1989.
11. For some of the most detailed distributional data, see Stewart 1947, Tahle 1.
12. Matarazzo 1972, p. 177.
13. Specific cognitlve strengths also vary by occupation, with engineers tend-
ing to score higher on analytic and quantitative sections of the Graduate
Record Exams, while English professors do better on the verhal portions
(e.g., Wah and Robinson 1990, Figure 2.2).
14. With a mean of 100 and SD of 15, an 1Q score of 120 cuts off the 91st per-
centile of a normal distribution. But the IQ distrihution tends to he skewed
so that it is fat on the right tail. To say that 120 cuts off the top tenth 1s
only approximate but close enough for our purposes.
15. The procedure we used to create the figure on page 56 yielded an estimate
of 23.2 percent of the top IQ decile in high-IQ occupations in 1990. Of
the top IQ decile in the NLSY as of 1990, when they ranged in age from
25 to 32, 22.2 percent of the top decile were employed in the dozen high-
IQ occupations. The analysis excludes those who were still enrolled in
school in 1990 and those who were in the military (because the~r occupa-
tion within the military was unknown). The NLSY figure is an underesti-
mate (compared to the national estimate) in that those who are st111
students will disproportionately enter high-IQ professions. On the other
hand, the NLSY would be likely to exceed the national data in the figure
insofar as the entire NLSY age cohort is of working age, without retirees.
One other comment on possible distortions over time: It might be hy-
pothesized that, since 1900, the mean has dropped and distribution has
spread, as more and more people have entered those professions. The plau-
sibility of the hypothesis is arguable; indeed, there are reasons for h p t h -
esizing that the opposite has occurred (for the same reasons educational
stratification has raised the 1Q of students at the elite colleges). But it
would not materially affect the plot in the figure on page 56 even if true,
because the numbers of people in those professions were so small in the
early decades of the century. It may also be noted that in the NLSY data,
46 percent of all job slots in the high-1Q occupations were held by people
in the top decile, again matching our conjecture about the IQ scores within
the occupations.
16. Terman and Oden 1947.
17. The NLSY cannot answer that question, because even a sample of 11,878
(the number that took the AFQT) is too small to yield adequate sample
sizes for analyzing subgroups in the top tenth of the top percentile.
18. There are not that many people with IQs of 120+ left over, after the known
concentrations of them in the high IQ occupations are taken into account.
19. The literature is extensive. The studies used for this discussion, in addi-
tion to those cited specifically, include Bendix 1949; Macmahon and Mil-
lett 1939; Pierson 1969; Stanley, Mann, and Doig 1967; Sturdivant and
Adler 1976; Vance 1966; Warner and Abegglen 1955.
20. Newcomer 1955, Table 24, p. 68.
21. Clews 1908, pp. 27,37, quoted in Newcomer 1955, p. 66.
22. The data are drawn from Newcomer 1955.
23. Burck 1976. The Fortune survey was designed to yield data comparable
with those in Newcomer 1955.
24. The ostensible decline in college degrees after 1950 is explained by col-
lege graduates' going on to get additional educational credentials. For an-
other study of educational attainment of CEOs that shows the same
pattern, see Priest 1982.
25. U.S. Bureau of the Census 1992, Tables 18,615, and U.S. Department of
Labor 1991, Table 22.
26. Excluding accountants, who were already counted in the high-IQ profes-
sions.
27. Matarazzo 1972, Table 7.3, p. 178.
Chapter 3
1. Bok 198513. In another setting, again discussing the SAT, he wrote, "Such
tests are only modestly correlated with subsequent academic success and
give no reliable indication of achievement in later life" (Bok 1985a, p. 15).
2. The correlation of IQ with income in a restricted population such as Har-
vard graduates could be negative when people toward the top of the IQ
distribution are disproportionately drawn into academia, where they make
IQ and Occupational Stratification
- Statistical analysis shows that approximately 23 percent of the top IQ decile were employed in high-IQ occupations as of 1990.
- Data from the NLSY suggests that nearly half of all job slots in high-IQ professions are occupied by individuals from the top IQ decile.
- The authors address potential distortions in historical data, arguing that educational stratification has likely concentrated high IQs in elite institutions over time.
- A paradox exists where IQ and income may correlate negatively within elite groups like Harvard graduates because the highest-IQ individuals often choose lower-paying academic paths.
- The text highlights the difficulty of studying the extreme upper tail of the intelligence distribution due to insufficient sample sizes even in large datasets like the NLSY.
The correlation of IQ with income in a restricted population such as Harvard graduates could be negative when people toward the top of the IQ distribution are disproportionately drawn into academia, where they make a decent living but seldom much more than that.
67 2
Notes to pages 54-56
Notes to pages 57-66
673
cioeconomic status, which prove to be somewhat predictive of a person's
own status.
8. For a fuller discussion of both the explanation and the controversy, see
Herrnstein 1973.
9. Teasdale, Sorenson, and Owen 1984.
10. The authors of the study offered as an explanation for this pattern of re-
sults the well-established pattern of resemblances among relatives in IQ,
presumably owing to the genes that natural siblings share and that adop-
tive siblings do not share. It could, of course, be traits of personality rather
than of intellect that tie a family's occupational dest~nies together. How-
ever, the small body of evidence bearing on personality traits finds them
to be distinctly weaker predictors of job status than is IQ. Another study,
of over 1,000 pairs of Norwegian twins, supported the conclusion that the
resemblance in job status among close relatives is largely explained by their
similarity in IQ and that genes play a significant role in this similarity. See
Tambs et al. 1989.
11. For some of the most detailed distributional data, see Stewart 1947, Tahle 1.
12. Matarazzo 1972, p. 177.
13. Specific cognitlve strengths also vary by occupation, with engineers tend-
ing to score higher on analytic and quantitative sections of the Graduate
Record Exams, while English professors do better on the verhal portions
(e.g., Wah and Robinson 1990, Figure 2.2).
14. With a mean of 100 and SD of 15, an 1Q score of 120 cuts off the 91st per-
centile of a normal distribution. But the IQ distrihution tends to he skewed
so that it is fat on the right tail. To say that 120 cuts off the top tenth 1s
only approximate but close enough for our purposes.
15. The procedure we used to create the figure on page 56 yielded an estimate
of 23.2 percent of the top IQ decile in high-IQ occupations in 1990. Of
the top IQ decile in the NLSY as of 1990, when they ranged in age from
25 to 32, 22.2 percent of the top decile were employed in the dozen high-
IQ occupations. The analysis excludes those who were still enrolled in
school in 1990 and those who were in the military (because the~r occupa-
tion within the military was unknown). The NLSY figure is an underesti-
mate (compared to the national estimate) in that those who are st111
students will disproportionately enter high-IQ professions. On the other
hand, the NLSY would be likely to exceed the national data in the figure
insofar as the entire NLSY age cohort is of working age, without retirees.
One other comment on possible distortions over time: It might be hy-
pothesized that, since 1900, the mean has dropped and distribution has
spread, as more and more people have entered those professions. The plau-
sibility of the hypothesis is arguable; indeed, there are reasons for h p t h -
esizing that the opposite has occurred (for the same reasons educational
stratification has raised the 1Q of students at the elite colleges). But it
would not materially affect the plot in the figure on page 56 even if true,
because the numbers of people in those professions were so small in the
early decades of the century. It may also be noted that in the NLSY data,
46 percent of all job slots in the high-1Q occupations were held by people
in the top decile, again matching our conjecture about the IQ scores within
the occupations.
16. Terman and Oden 1947.
17. The NLSY cannot answer that question, because even a sample of 11,878
(the number that took the AFQT) is too small to yield adequate sample
sizes for analyzing subgroups in the top tenth of the top percentile.
18. There are not that many people with IQs of 120+ left over, after the known
concentrations of them in the high IQ occupations are taken into account.
19. The literature is extensive. The studies used for this discussion, in addi-
tion to those cited specifically, include Bendix 1949; Macmahon and Mil-
lett 1939; Pierson 1969; Stanley, Mann, and Doig 1967; Sturdivant and
Adler 1976; Vance 1966; Warner and Abegglen 1955.
20. Newcomer 1955, Table 24, p. 68.
21. Clews 1908, pp. 27,37, quoted in Newcomer 1955, p. 66.
22. The data are drawn from Newcomer 1955.
23. Burck 1976. The Fortune survey was designed to yield data comparable
with those in Newcomer 1955.
24. The ostensible decline in college degrees after 1950 is explained by col-
lege graduates' going on to get additional educational credentials. For an-
other study of educational attainment of CEOs that shows the same
pattern, see Priest 1982.
25. U.S. Bureau of the Census 1992, Tables 18,615, and U.S. Department of
Labor 1991, Table 22.
26. Excluding accountants, who were already counted in the high-IQ profes-
sions.
27. Matarazzo 1972, Table 7.3, p. 178.
Chapter 3
1. Bok 198513. In another setting, again discussing the SAT, he wrote, "Such
tests are only modestly correlated with subsequent academic success and
give no reliable indication of achievement in later life" (Bok 1985a, p. 15).
2. The correlation of IQ with income in a restricted population such as Har-
vard graduates could be negative when people toward the top of the IQ
distribution are disproportionately drawn into academia, where they make
674
Notes to pages 66-69
Notes to pages 69-72
675
a decent living but seldom much more than that, while students with IQs
of "only" 120 and 130 will more often go into the business world, where
they may get rich.
3. See Chapter 19; Dunnette 1976; Ghiselli 1973.
4. Technically, a correlation coefficient is a ratio, with the covariation of the
two variables in the numerator and the product of the separate standard
deviations of the two variables in the denominator. The formula for com-
puting a Pearson product moment correlation r (the kind that we will be
using throughout) is:
where X and Y refer to the actual values for each case and X and Y refer to
the mean values of the X and Y, respectively.
5. We limited the sample to families making less than $100,000, so as to avoid
some distracting technical issues that arise when analyzing income across
the entire spectrum (e.g., the appropriateness of using logged values rather
than raw values). The results from the 1 percent sample are in line with
the statistics ~roduced when the analysis is repeated for the entire national
sample: a correlation of .3 1 and an increment of $2,700 per year of addi-
tional education. Income data are for 1989, expressed in 1990 dollars.
6. An important distinction: The underlying relationship persists in a sam-
ple with restricted range, but the restriction of range makes the relation-
ship harder to identify (i.e., the correlation coefficient is attenuated,
sometimes to near zero).
Forgetting about restriction of range produces fallacious reasoning that
is remarkably common, even among academics who are presumably famil-
iar with the problem. For example, psychologist David McClelland, writ-
ing at the height of the anti-1Qera in 1973, argued against any relationship
between career success and IQ, pointing out that whereas college gradu-
ates got better jobs than nongraduates, the academic records of graduates
did not correlate with job success, even though college grades correlate
with 1Q. He added, anecdotally, that he recalled his own college class-
Wesleyan University, a top-rated small college-and
was convinced that
the eight best and eight worst students in his class had not done much dif-
ferently in their subsequent careers (McClelland 1973). This kind of ar-
gument is also common in everyday life, as in the advice offered by friends
during the course of writing this book. There was, for example, our friend
the nuclear physicist, who prefaced his remarks by saying, "I don't think
I'm any smarter than the average nuclear physicist . . ." Or an engineer
friend, a key figure in the Apollo lunar landing program, who insisted that
this IQ business is much overemphasized. He had been a C student in col-
lege and would not have even graduated, except that he managed to pull
himself together in his senior year. His conclusion was that motivation was
important, not IQ. Did he happen to know what his IQ was? Sure, he
replied. It was 146. He was right, insofar as motivation can make the dif-
ference between being a first-rate rocket scientist and a mediocre one-if
you start with an IQ of 146. But the population with a score of 146 (or
above) represents something less than 0.2 percent of the population. Sim-
~larly, correlations of IQ and job success among college graduates suffer
from restriction of range. The more selective the group is, the greater the
restriction, which is why Derek Bok may plausibly (if not quite accurately)
have claimed that SAT scores have "no correlation at all with what you
do In the rest of your life" if he was talking about Harvard students.
7. E.g., Fallows 1985.
8. See Chapter 20 for more detail.
9. Griggs v. Duke Power, 401 U.S. 424 (197 1).
10. The doctrine has been built into the U.S. Employment and Training Ser-
vice's General Aptitude Test Battery (GATB), into the federal civil ser-
vice's Professional and Administrative Career Examination (PACE), and
into the military's Armed Serv~ces Vocational Aptitude Battery (ASVAB).
Bartholet 1982; Braun 1992; Gifford 1989; Kelman 1991; Seymour 1988.
For a survey of test instruments and their use, see Friedman and Williams
1982.
11. For a recent review of the expert community as a whole, see Schmidt and
Ones 1992.
12. Hartigan and Wigdor 1989 and Schmidt and Hunter 1991 represent the
two ends of the range of expert opinion.
13. For a sampling of the new methods, see Bangert-Drowns 1986; Glass 1976;
Glass, McGaw, and Smith 1981; Hunter and Schmidt 1990. Meta-analytic
strategies had been tried for decades prior to the 1970s, but it was after the
advent of powerfill computers and statistical software that many of the
techniques became practicable.
14. Hartigan and Wigdor 1989; Hunter and Schmidt 1990; Schmidt and
Hunter 198 1.
15. We have used the terms job productivity or job perfmnce or pe.fOTrnance
ratings without explaining what they mean or how they are measured. O n
the other hand, all of us have a sense of what job productivity is like-we
are confident that we know who are the better and worse secretaries, man-
agers, and colleagues among those with whom we work closely. But how is
this knowledge to be captured in objective measures? Ratings by supervi-
sors or peers? Samples of work in the various tasks that a job demands? Tests
The Fallacy of Restricted Range
- The text explains the Pearson product moment correlation and its application in analyzing the relationship between education and income.
- Researchers often limit sample ranges to avoid technical distractions, such as the complexities of analyzing income across the entire national spectrum.
- A 'restriction of range' occurs when a sample is highly selective, making underlying relationships harder to identify and attenuating correlation coefficients toward zero.
- The authors argue that many academics and professionals fallaciously dismiss the importance of IQ by only looking at elite, narrow subgroups.
- Anecdotes from high-achievers, like a rocket scientist with a 146 IQ, illustrate how people often mistake motivation for the primary driver of success while ignoring their high baseline cognitive ability.
- The text notes that legal and institutional doctrines have historically integrated aptitude testing despite ongoing debates regarding its predictive validity.
He was right, insofar as motivation can make the difference between being a first-rate rocket scientist and a mediocre one—if you start with an IQ of 146.
674
Notes to pages 66-69
Notes to pages 69-72
675
a decent living but seldom much more than that, while students with IQs
of "only" 120 and 130 will more often go into the business world, where
they may get rich.
3. See Chapter 19; Dunnette 1976; Ghiselli 1973.
4. Technically, a correlation coefficient is a ratio, with the covariation of the
two variables in the numerator and the product of the separate standard
deviations of the two variables in the denominator. The formula for com-
puting a Pearson product moment correlation r (the kind that we will be
using throughout) is:
where X and Y refer to the actual values for each case and X and Y refer to
the mean values of the X and Y, respectively.
5. We limited the sample to families making less than $100,000, so as to avoid
some distracting technical issues that arise when analyzing income across
the entire spectrum (e.g., the appropriateness of using logged values rather
than raw values). The results from the 1 percent sample are in line with
the statistics ~roduced when the analysis is repeated for the entire national
sample: a correlation of .3 1 and an increment of $2,700 per year of addi-
tional education. Income data are for 1989, expressed in 1990 dollars.
6. An important distinction: The underlying relationship persists in a sam-
ple with restricted range, but the restriction of range makes the relation-
ship harder to identify (i.e., the correlation coefficient is attenuated,
sometimes to near zero).
Forgetting about restriction of range produces fallacious reasoning that
is remarkably common, even among academics who are presumably famil-
iar with the problem. For example, psychologist David McClelland, writ-
ing at the height of the anti-1Qera in 1973, argued against any relationship
between career success and IQ, pointing out that whereas college gradu-
ates got better jobs than nongraduates, the academic records of graduates
did not correlate with job success, even though college grades correlate
with 1Q. He added, anecdotally, that he recalled his own college class-
Wesleyan University, a top-rated small college-and
was convinced that
the eight best and eight worst students in his class had not done much dif-
ferently in their subsequent careers (McClelland 1973). This kind of ar-
gument is also common in everyday life, as in the advice offered by friends
during the course of writing this book. There was, for example, our friend
the nuclear physicist, who prefaced his remarks by saying, "I don't think
I'm any smarter than the average nuclear physicist . . ." Or an engineer
friend, a key figure in the Apollo lunar landing program, who insisted that
this IQ business is much overemphasized. He had been a C student in col-
lege and would not have even graduated, except that he managed to pull
himself together in his senior year. His conclusion was that motivation was
important, not IQ. Did he happen to know what his IQ was? Sure, he
replied. It was 146. He was right, insofar as motivation can make the dif-
ference between being a first-rate rocket scientist and a mediocre one-if
you start with an IQ of 146. But the population with a score of 146 (or
above) represents something less than 0.2 percent of the population. Sim-
~larly, correlations of IQ and job success among college graduates suffer
from restriction of range. The more selective the group is, the greater the
restriction, which is why Derek Bok may plausibly (if not quite accurately)
have claimed that SAT scores have "no correlation at all with what you
do In the rest of your life" if he was talking about Harvard students.
7. E.g., Fallows 1985.
8. See Chapter 20 for more detail.
9. Griggs v. Duke Power, 401 U.S. 424 (197 1).
10. The doctrine has been built into the U.S. Employment and Training Ser-
vice's General Aptitude Test Battery (GATB), into the federal civil ser-
vice's Professional and Administrative Career Examination (PACE), and
into the military's Armed Serv~ces Vocational Aptitude Battery (ASVAB).
Bartholet 1982; Braun 1992; Gifford 1989; Kelman 1991; Seymour 1988.
For a survey of test instruments and their use, see Friedman and Williams
1982.
11. For a recent review of the expert community as a whole, see Schmidt and
Ones 1992.
12. Hartigan and Wigdor 1989 and Schmidt and Hunter 1991 represent the
two ends of the range of expert opinion.
13. For a sampling of the new methods, see Bangert-Drowns 1986; Glass 1976;
Glass, McGaw, and Smith 1981; Hunter and Schmidt 1990. Meta-analytic
strategies had been tried for decades prior to the 1970s, but it was after the
advent of powerfill computers and statistical software that many of the
techniques became practicable.
14. Hartigan and Wigdor 1989; Hunter and Schmidt 1990; Schmidt and
Hunter 198 1.
15. We have used the terms job productivity or job perfmnce or pe.fOTrnance
ratings without explaining what they mean or how they are measured. O n
the other hand, all of us have a sense of what job productivity is like-we
are confident that we know who are the better and worse secretaries, man-
agers, and colleagues among those with whom we work closely. But how is
this knowledge to be captured in objective measures? Ratings by supervi-
sors or peers? Samples of work in the various tasks that a job demands? Tests
Measuring Job Performance
- The rise of powerful computing in the 1970s made complex meta-analytic strategies for studying workplace productivity practicable.
- Defining job productivity is difficult because objective measures like supervisor ratings, work samples, and job knowledge tests often capture different facets of performance.
- Supervisor ratings are the most common metric in research due to their convenience, though critics question if they measure actual skill or merely social rapport.
- Research by John Hunter indicates that intelligence has a massive correlation with job knowledge, which in turn serves as the primary driver for high performance in work samples.
- The link between intelligence and supervisor ratings is largely mediated by job knowledge; supervisors tend to favor 'brighter' workers because those workers know more about their roles.
But how is this knowledge to be captured in objective measures? Ratings by supervisors or peers? Samples of work in the various tasks that a job demands? Tests of job knowledge?
674
Notes to pages 66-69
Notes to pages 69-72
675
a decent living but seldom much more than that, while students with IQs
of "only" 120 and 130 will more often go into the business world, where
they may get rich.
3. See Chapter 19; Dunnette 1976; Ghiselli 1973.
4. Technically, a correlation coefficient is a ratio, with the covariation of the
two variables in the numerator and the product of the separate standard
deviations of the two variables in the denominator. The formula for com-
puting a Pearson product moment correlation r (the kind that we will be
using throughout) is:
where X and Y refer to the actual values for each case and X and Y refer to
the mean values of the X and Y, respectively.
5. We limited the sample to families making less than $100,000, so as to avoid
some distracting technical issues that arise when analyzing income across
the entire spectrum (e.g., the appropriateness of using logged values rather
than raw values). The results from the 1 percent sample are in line with
the statistics ~roduced when the analysis is repeated for the entire national
sample: a correlation of .3 1 and an increment of $2,700 per year of addi-
tional education. Income data are for 1989, expressed in 1990 dollars.
6. An important distinction: The underlying relationship persists in a sam-
ple with restricted range, but the restriction of range makes the relation-
ship harder to identify (i.e., the correlation coefficient is attenuated,
sometimes to near zero).
Forgetting about restriction of range produces fallacious reasoning that
is remarkably common, even among academics who are presumably famil-
iar with the problem. For example, psychologist David McClelland, writ-
ing at the height of the anti-1Qera in 1973, argued against any relationship
between career success and IQ, pointing out that whereas college gradu-
ates got better jobs than nongraduates, the academic records of graduates
did not correlate with job success, even though college grades correlate
with 1Q. He added, anecdotally, that he recalled his own college class-
Wesleyan University, a top-rated small college-and
was convinced that
the eight best and eight worst students in his class had not done much dif-
ferently in their subsequent careers (McClelland 1973). This kind of ar-
gument is also common in everyday life, as in the advice offered by friends
during the course of writing this book. There was, for example, our friend
the nuclear physicist, who prefaced his remarks by saying, "I don't think
I'm any smarter than the average nuclear physicist . . ." Or an engineer
friend, a key figure in the Apollo lunar landing program, who insisted that
this IQ business is much overemphasized. He had been a C student in col-
lege and would not have even graduated, except that he managed to pull
himself together in his senior year. His conclusion was that motivation was
important, not IQ. Did he happen to know what his IQ was? Sure, he
replied. It was 146. He was right, insofar as motivation can make the dif-
ference between being a first-rate rocket scientist and a mediocre one-if
you start with an IQ of 146. But the population with a score of 146 (or
above) represents something less than 0.2 percent of the population. Sim-
~larly, correlations of IQ and job success among college graduates suffer
from restriction of range. The more selective the group is, the greater the
restriction, which is why Derek Bok may plausibly (if not quite accurately)
have claimed that SAT scores have "no correlation at all with what you
do In the rest of your life" if he was talking about Harvard students.
7. E.g., Fallows 1985.
8. See Chapter 20 for more detail.
9. Griggs v. Duke Power, 401 U.S. 424 (197 1).
10. The doctrine has been built into the U.S. Employment and Training Ser-
vice's General Aptitude Test Battery (GATB), into the federal civil ser-
vice's Professional and Administrative Career Examination (PACE), and
into the military's Armed Serv~ces Vocational Aptitude Battery (ASVAB).
Bartholet 1982; Braun 1992; Gifford 1989; Kelman 1991; Seymour 1988.
For a survey of test instruments and their use, see Friedman and Williams
1982.
11. For a recent review of the expert community as a whole, see Schmidt and
Ones 1992.
12. Hartigan and Wigdor 1989 and Schmidt and Hunter 1991 represent the
two ends of the range of expert opinion.
13. For a sampling of the new methods, see Bangert-Drowns 1986; Glass 1976;
Glass, McGaw, and Smith 1981; Hunter and Schmidt 1990. Meta-analytic
strategies had been tried for decades prior to the 1970s, but it was after the
advent of powerfill computers and statistical software that many of the
techniques became practicable.
14. Hartigan and Wigdor 1989; Hunter and Schmidt 1990; Schmidt and
Hunter 198 1.
15. We have used the terms job productivity or job perfmnce or pe.fOTrnance
ratings without explaining what they mean or how they are measured. O n
the other hand, all of us have a sense of what job productivity is like-we
are confident that we know who are the better and worse secretaries, man-
agers, and colleagues among those with whom we work closely. But how is
this knowledge to be captured in objective measures? Ratings by supervi-
sors or peers? Samples of work in the various tasks that a job demands? Tests
6 76
Notes to page 72
Notes to pages 72-74
67 7
of job knowledge? Job tenure or promotion? Direct cost accounting of
workers' output! There is no way to answer such a question decisively, for
people may legitimately disagree about what it is about a worker's perfor-
mance that is most worth predicting. As a practical matter, ratings by su-
pervisors, being the most readily obtained and the least intrusive in the
workplace, have dominated the literature (Hunter 1986). Rut it is natural
to wonder whether supervisor ratings, besides being easy to get, truly mea-
sure how well workers perform rather than, say, how they get along with
the boss or how they look (Guion 1983).
To get a better fix on what the various measures of performance mean,
it is useful to evaluate a number of studies that have included measures of
cognitive ability, supervisor ratings, samples of work, and tests of job knowl-
edge. Work samples are usually obtained by setting up stations for workers
to do the various tasks required by their johs and having their work eval-
uated in some reasonably objective way. Different occupations lend them-
selves more or less plausibly to this kind of simulated performance. The
same is true of written or oral tests of job knowledge.
One of the field's leaders, John Hunter, has examined the correlational
structure that relates these different ways of looking at job performance to
each other and to an intelligence test score (Hunter 1983,1986). In a study
of 1,800 workers, Hunter found a strong direct link between intelligence
and job knowledge and a much smaller direct one between intelligence
and performance in work sample tasks. By direct we mean that the vari-
ables predict each other without taking any other variable into account.
The small direct link between intelligence and work sample was aug-
mented hy a large indirect link, via job knowledge: a person's intelligence
predicted his knowledge of the job, and his knowledge in turn predicted
his work sample. The correlation (after the usual statistical corrections)
between intelligence and job knowledge was .8; between intelligence and
work sample it was .75. The indirect link hetween intelligence and work
sample, via job knowledge, was larger by half than the direct one (Hunter
1986).
The correlation between intelligence and supervisor ratings in Hunter's
analysis was .47. Upon analysis, Hunter found that the primary reason is
that hrighter workers know more about their johs, and supervisors respond
favorably to their knowledge. A comparable analysis of approximately
1,500 military personnel in four specialties produced the same basic find-
ing (Hunter 1986). This may seem a weakness of the supervisor rating mea-
sure, but is it really? How much workers know about their johs correlates,
on the one hand, with their intelligence and, on the other, with hoth how
they do on direct tests of their work and how they are rated by their su-
pervisors. A worker's intelligence influences how much he learns about the
job, and joh knowledge contributes to proficiency. The knowledge also in-
fluences the impression the worker makes on a supervisor rating more than
the work as measured by a work sample test (which, of course, the super-
visor may never see in the ordinary course of business). Using supervisor
rating as a measure of proficiency is thereby justified, without having to
claim that the rating directly measures proficiency.
Hunter found that work samples are more dependent on intelligence
and job knowledge than are supervisor ratings. Supervisor ratings, which
are so predominant in this literature, may, in other words, underestimate
how important intelligence is for proficiency. Recent research suggests that
supervisor ratings in fact do underestimate the correlation between intel-
ligence and productivity (Becker and Huselid 1992). But we should ac-
knowledge again that none of the measures of proficiency-work
samples,
supervisor ratings, or job knowledge tests-is
free of the taint of artificial-
ity, let alone arbitrariness. Supervisor ratings may be biased in many ways;
a test of job knowledge is a test, not a job; and even a worker going from
one work station to another under the watchful eye of an industrial psy-
chologist may he revealing something other than everyday competence. It
has been suggested that the various contrived measures of workers tell us
more about maximum performance than they do about typical, day-to-day
proficiency (Guion 1983). We therefore advise that the quantitative esti-
mates we present here (or that can he found in the technical literature at
large) he considered only tentative and suggestive.
16. The average validity of .4 is ohtained after standard statistical corrections
of various sorts. The two most important of these are a correction for test
unreliahility or measurement error and a correction for restriction of range
among the workers in any occupation. All of the validities in this section
of the chapter are similarly corrected, unless otherwise noted.
17. Ghiselli 1966, 1973; Hunter and Hunter 1984, Table 1.
18. Hunter 1980; Hunter and Hunter 1984.
19. Where available, ratings by peers, tests of job knowledge, and actual work
samples often come close to ability measures as ~redictors of job perfor-
mance (Hunter and Hunter 1984). But aptitude tests have the practical
advantage that they can be administered relatively inexpensively to large
numbers of applicants, and they do not depend on applicants' having been
on the job for any length of time.
20. E. F, Wonderlic & Associates 1983; Hunter 1989. These validities, which
are even higher than the ones presented in the table on page 74 are for
training success rather than for measures of job performance and are more
directly comparable with the column for training success in the GATB
Measuring Worker Proficiency
- Supervisor ratings often underestimate the true correlation between intelligence and job productivity compared to objective work samples.
- Work samples and job knowledge tests are more heavily dependent on cognitive ability than subjective evaluations by management.
- All current measures of proficiency—including tests and ratings—suffer from artificiality and may reflect maximum rather than typical performance.
- Aptitude tests remain a preferred predictor because they are inexpensive to administer and do not require prior job experience.
- Large-scale military studies show a consistent correlation (average .40) between AFQT scores and hands-on performance across various specialties.
It has been suggested that the various contrived measures of workers tell us more about maximum performance than they do about typical, day-to-day proficiency.
6 76
Notes to page 72
Notes to pages 72-74
67 7
of job knowledge? Job tenure or promotion? Direct cost accounting of
workers' output! There is no way to answer such a question decisively, for
people may legitimately disagree about what it is about a worker's perfor-
mance that is most worth predicting. As a practical matter, ratings by su-
pervisors, being the most readily obtained and the least intrusive in the
workplace, have dominated the literature (Hunter 1986). Rut it is natural
to wonder whether supervisor ratings, besides being easy to get, truly mea-
sure how well workers perform rather than, say, how they get along with
the boss or how they look (Guion 1983).
To get a better fix on what the various measures of performance mean,
it is useful to evaluate a number of studies that have included measures of
cognitive ability, supervisor ratings, samples of work, and tests of job knowl-
edge. Work samples are usually obtained by setting up stations for workers
to do the various tasks required by their johs and having their work eval-
uated in some reasonably objective way. Different occupations lend them-
selves more or less plausibly to this kind of simulated performance. The
same is true of written or oral tests of job knowledge.
One of the field's leaders, John Hunter, has examined the correlational
structure that relates these different ways of looking at job performance to
each other and to an intelligence test score (Hunter 1983,1986). In a study
of 1,800 workers, Hunter found a strong direct link between intelligence
and job knowledge and a much smaller direct one between intelligence
and performance in work sample tasks. By direct we mean that the vari-
ables predict each other without taking any other variable into account.
The small direct link between intelligence and work sample was aug-
mented hy a large indirect link, via job knowledge: a person's intelligence
predicted his knowledge of the job, and his knowledge in turn predicted
his work sample. The correlation (after the usual statistical corrections)
between intelligence and job knowledge was .8; between intelligence and
work sample it was .75. The indirect link hetween intelligence and work
sample, via job knowledge, was larger by half than the direct one (Hunter
1986).
The correlation between intelligence and supervisor ratings in Hunter's
analysis was .47. Upon analysis, Hunter found that the primary reason is
that hrighter workers know more about their johs, and supervisors respond
favorably to their knowledge. A comparable analysis of approximately
1,500 military personnel in four specialties produced the same basic find-
ing (Hunter 1986). This may seem a weakness of the supervisor rating mea-
sure, but is it really? How much workers know about their johs correlates,
on the one hand, with their intelligence and, on the other, with hoth how
they do on direct tests of their work and how they are rated by their su-
pervisors. A worker's intelligence influences how much he learns about the
job, and joh knowledge contributes to proficiency. The knowledge also in-
fluences the impression the worker makes on a supervisor rating more than
the work as measured by a work sample test (which, of course, the super-
visor may never see in the ordinary course of business). Using supervisor
rating as a measure of proficiency is thereby justified, without having to
claim that the rating directly measures proficiency.
Hunter found that work samples are more dependent on intelligence
and job knowledge than are supervisor ratings. Supervisor ratings, which
are so predominant in this literature, may, in other words, underestimate
how important intelligence is for proficiency. Recent research suggests that
supervisor ratings in fact do underestimate the correlation between intel-
ligence and productivity (Becker and Huselid 1992). But we should ac-
knowledge again that none of the measures of proficiency-work
samples,
supervisor ratings, or job knowledge tests-is
free of the taint of artificial-
ity, let alone arbitrariness. Supervisor ratings may be biased in many ways;
a test of job knowledge is a test, not a job; and even a worker going from
one work station to another under the watchful eye of an industrial psy-
chologist may he revealing something other than everyday competence. It
has been suggested that the various contrived measures of workers tell us
more about maximum performance than they do about typical, day-to-day
proficiency (Guion 1983). We therefore advise that the quantitative esti-
mates we present here (or that can he found in the technical literature at
large) he considered only tentative and suggestive.
16. The average validity of .4 is ohtained after standard statistical corrections
of various sorts. The two most important of these are a correction for test
unreliahility or measurement error and a correction for restriction of range
among the workers in any occupation. All of the validities in this section
of the chapter are similarly corrected, unless otherwise noted.
17. Ghiselli 1966, 1973; Hunter and Hunter 1984, Table 1.
18. Hunter 1980; Hunter and Hunter 1984.
19. Where available, ratings by peers, tests of job knowledge, and actual work
samples often come close to ability measures as ~redictors of job perfor-
mance (Hunter and Hunter 1984). But aptitude tests have the practical
advantage that they can be administered relatively inexpensively to large
numbers of applicants, and they do not depend on applicants' having been
on the job for any length of time.
20. E. F, Wonderlic & Associates 1983; Hunter 1989. These validities, which
are even higher than the ones presented in the table on page 74 are for
training success rather than for measures of job performance and are more
directly comparable with the column for training success in the GATB
678
Notes to page 74
Notes to pages 74-76
679
studies than the column for job proficiency. Regarding job performance,
one major study evaluated the performance of about 1,500 air force en-
listed men and women working in eight military specialties, chosen to be
representative of military specialties in the air force. Performance was var-
iously measured: by defining a set of tasks involved in each joh, then train-
ing a group of evaluators to assess those specific tasks; by interviews of the
~ersonnel on technical aspects of their jobs; by supervisor ratings after
training the supervisors; and combinations of methods. The average cor-
relation between AFQT score and a hands-on job performance measure
was .40, with the highest among the precision measurement equipment
specialists and the avionics communications specialists and the lowest
among the air traffic control operators and the air crew life support spe-
cialists. Insofar as the jobs were restricted to those held by enlisted men,
the distribution of jobs was somewhat skewed toward the lower end of the
skill range. We do not have an available estimate of the validity of the
AFQT over all military jobs.
Hartigan and Wigdor 1989.
It is one of the chronically frustrating experiences when reading scientific
results: Two sets of experts, supposedly using comparable data, come out
with markedly different conclusions, and the reasons for the differences are
buried in technical and opaque language. How is it possible for a layper-
son to decide who is right? The different estimates of mean validity of the
G A T b . 4 5 according to Hunter, Schmidt, and some others; .25 accord-
ing to the Hartigan committee-is
an instructive case in point.
Sometimes the differences really are technical and opaque. For exam-
ple, the Hartigan committee based its estimate on the assumption that the
reliability of supervisor ratings was higher than other studies assumed-.8
instead of .6 (Hartigan and Wigdor 1989, p. 170). By assuming a higher re-
liability, the committee's correction for measurement error was smaller
than Hunter's. Deciding between the Hartigan committee's use of .8 as the
reliability of supervisor ratings instead of the .6 used by Hunter is impossi-
ble for anyone who is not intimately familiar with a large and scattered lit-
erature on that topic, and even then the choice remains a matter of
judgment. But the Hartigan committee's decision not to correct for re-
striction of range, which makes the largest difference in their estimates of
the overall validity, is based on a much different kind of disagreement.
Here, a layperson is as qualified to decide as an expert, for this is a dis-
agreement about what question is being answered.
John Hunter and others assumed that for any job the applicant pool 1s
the entire U.S. work force. That is, they sought an answer to the question,
"What is the relationship between job performance and intell~gence for
the work force at large!" The Hartigan committee ohjected to their as-
sumption on grounds that, in practice, the applicant pool for any partlcu-
lar job is not the entire U.S. work force hut people who have a chance to
get the job. As they accurately noted, "People gravitate to jobs for which
they are potentially suited" (Hartigan and Wigdor 1989, p. 166).
But embedded in the committee's objection to Hunter's estimates is a
tacit switch in the question that the analysis is supposed to answer. The
Hartigan committee sought an answer to the question, "Among those peo-
ple who apply for such-and-such a position, what is the relationship be-
tween intelligence and job performance!" If one's objective is not to
discourage people who weigh only 250 pounds from applying for johs as
tackles in the NFL, to return to our analogy, then the Hartigan commit-
tee's question is the appropriate one. Of course, by minimizing the valid-
ity of weight, a large number of 150-pound lineman may apply for the jobs.
Thus our reasons for concluding that the assumption used by Hunter and
Schmidt (among others), that restriction of range calculations should be
based on the entire work force, is self-evidently the appropriate choice if
one wants to know the overall relationship of IQ to job performance and
its economic consequences.
23. The ASVAB comprises ten subtests: General Science, Arithmetic Rea-
soning, Word Knowledge, Paragraph Comprehension, Numerical Opera-
tions, Coding Speed, Auto/Shop Information, Mathematics Knowledge,
Mechanical Comprehension, and Electronics Information. Only Numer-
ical Operations and Coding Speed are highly speeded; the other eight are
nonspeeded "power" tests. All the armed services use the four MAGE com-
posites, for Mechanical, Administrative, General, and Electronics sped
cialties, each of which includes three or four subtests in a particular
weighting. These composites are supposed to predict a recruit's trainabil-
ity for the particular specialty. The AFQT is yet another composite from
the ASVAB, selected so as to measure g efficiently. See Appendix 3.
24. About 80 percent of the sample had graduated from high school and had
no further civilian schooling, fewer than 1 percent had failed to graduate
from high school, and fewer than 2 percent had graduated from college;
the remainder had some post-high school civilian schooling short of a col-
lege degree. The modal person in the sample was a white male between 19
and 20 years old, but the sample also included thousands of women and
people from all American ethnic groups; their ages ranged from a mini-
mum of 17 to almost 15 percent above 23 years (see Ree and Earles 1990b).
Other studies, using educationally heterogeneous samples, have in fact
shown that, holding AFQT constant, high school graduates are more likely
to avoid disciplinary action, to be recommended for reenlistment, and to
be promoted to higher rank than nongraduates (Office of the Assistant
Secretary of Defense 1980). Current enlistment policies reflect the inde-
The Conflict of Scientific Validity
- Scientific experts often reach divergent conclusions from the same data, leaving laypeople confused by technical and opaque justifications.
- The discrepancy between Hunter's .45 validity estimate and the Hartigan committee's .25 estimate stems from differing assumptions about measurement reliability.
- A major point of contention involves 'restriction of range' and whether the applicant pool should be viewed as the entire U.S. workforce or a self-selected group.
- The Hartigan committee argues that people naturally gravitate toward jobs they are suited for, which narrows the range of intelligence within an applicant pool.
- The author contends that Hunter’s broader assumption is more appropriate for understanding the total economic consequences and the overall relationship between IQ and performance.
- The disagreement ultimately shifts from a technical dispute to a fundamental disagreement over which specific question the analysis is intended to answer.
How is it possible for a layperson to decide who is right? The different estimates of mean validity of the GATB—45 according to Hunter, Schmidt, and some others; .25 according to the Hartigan committee—is an instructive case in point.
678
Notes to page 74
Notes to pages 74-76
679
studies than the column for job proficiency. Regarding job performance,
one major study evaluated the performance of about 1,500 air force en-
listed men and women working in eight military specialties, chosen to be
representative of military specialties in the air force. Performance was var-
iously measured: by defining a set of tasks involved in each joh, then train-
ing a group of evaluators to assess those specific tasks; by interviews of the
~ersonnel on technical aspects of their jobs; by supervisor ratings after
training the supervisors; and combinations of methods. The average cor-
relation between AFQT score and a hands-on job performance measure
was .40, with the highest among the precision measurement equipment
specialists and the avionics communications specialists and the lowest
among the air traffic control operators and the air crew life support spe-
cialists. Insofar as the jobs were restricted to those held by enlisted men,
the distribution of jobs was somewhat skewed toward the lower end of the
skill range. We do not have an available estimate of the validity of the
AFQT over all military jobs.
Hartigan and Wigdor 1989.
It is one of the chronically frustrating experiences when reading scientific
results: Two sets of experts, supposedly using comparable data, come out
with markedly different conclusions, and the reasons for the differences are
buried in technical and opaque language. How is it possible for a layper-
son to decide who is right? The different estimates of mean validity of the
G A T b . 4 5 according to Hunter, Schmidt, and some others; .25 accord-
ing to the Hartigan committee-is
an instructive case in point.
Sometimes the differences really are technical and opaque. For exam-
ple, the Hartigan committee based its estimate on the assumption that the
reliability of supervisor ratings was higher than other studies assumed-.8
instead of .6 (Hartigan and Wigdor 1989, p. 170). By assuming a higher re-
liability, the committee's correction for measurement error was smaller
than Hunter's. Deciding between the Hartigan committee's use of .8 as the
reliability of supervisor ratings instead of the .6 used by Hunter is impossi-
ble for anyone who is not intimately familiar with a large and scattered lit-
erature on that topic, and even then the choice remains a matter of
judgment. But the Hartigan committee's decision not to correct for re-
striction of range, which makes the largest difference in their estimates of
the overall validity, is based on a much different kind of disagreement.
Here, a layperson is as qualified to decide as an expert, for this is a dis-
agreement about what question is being answered.
John Hunter and others assumed that for any job the applicant pool 1s
the entire U.S. work force. That is, they sought an answer to the question,
"What is the relationship between job performance and intell~gence for
the work force at large!" The Hartigan committee ohjected to their as-
sumption on grounds that, in practice, the applicant pool for any partlcu-
lar job is not the entire U.S. work force hut people who have a chance to
get the job. As they accurately noted, "People gravitate to jobs for which
they are potentially suited" (Hartigan and Wigdor 1989, p. 166).
But embedded in the committee's objection to Hunter's estimates is a
tacit switch in the question that the analysis is supposed to answer. The
Hartigan committee sought an answer to the question, "Among those peo-
ple who apply for such-and-such a position, what is the relationship be-
tween intelligence and job performance!" If one's objective is not to
discourage people who weigh only 250 pounds from applying for johs as
tackles in the NFL, to return to our analogy, then the Hartigan commit-
tee's question is the appropriate one. Of course, by minimizing the valid-
ity of weight, a large number of 150-pound lineman may apply for the jobs.
Thus our reasons for concluding that the assumption used by Hunter and
Schmidt (among others), that restriction of range calculations should be
based on the entire work force, is self-evidently the appropriate choice if
one wants to know the overall relationship of IQ to job performance and
its economic consequences.
23. The ASVAB comprises ten subtests: General Science, Arithmetic Rea-
soning, Word Knowledge, Paragraph Comprehension, Numerical Opera-
tions, Coding Speed, Auto/Shop Information, Mathematics Knowledge,
Mechanical Comprehension, and Electronics Information. Only Numer-
ical Operations and Coding Speed are highly speeded; the other eight are
nonspeeded "power" tests. All the armed services use the four MAGE com-
posites, for Mechanical, Administrative, General, and Electronics sped
cialties, each of which includes three or four subtests in a particular
weighting. These composites are supposed to predict a recruit's trainabil-
ity for the particular specialty. The AFQT is yet another composite from
the ASVAB, selected so as to measure g efficiently. See Appendix 3.
24. About 80 percent of the sample had graduated from high school and had
no further civilian schooling, fewer than 1 percent had failed to graduate
from high school, and fewer than 2 percent had graduated from college;
the remainder had some post-high school civilian schooling short of a col-
lege degree. The modal person in the sample was a white male between 19
and 20 years old, but the sample also included thousands of women and
people from all American ethnic groups; their ages ranged from a mini-
mum of 17 to almost 15 percent above 23 years (see Ree and Earles 1990b).
Other studies, using educationally heterogeneous samples, have in fact
shown that, holding AFQT constant, high school graduates are more likely
to avoid disciplinary action, to be recommended for reenlistment, and to
be promoted to higher rank than nongraduates (Office of the Assistant
Secretary of Defense 1980). Current enlistment policies reflect the inde-
Predicting Military Success
- The military sample studied consisted primarily of white males aged 19 to 20, though it included thousands of women and diverse ethnic groups.
- Educational attainment serves as an independent predictor of success; high school graduates are preferred over non-graduates even when test scores are identical.
- Statistical 'variation' is explained by squaring the correlation coefficient, revealing how much one factor like general intelligence (g) accounts for performance outcomes.
- General intelligence (g) accounted for approximately 60 percent of the variation in grades across eighty-nine different military occupational schools.
- While g is a powerful predictor of academic success in training, other cognitive factors play a more significant role in actual on-the-job performance.
- Research indicates that high school graduates are more likely to avoid disciplinary action and earn promotions compared to those with equivalent test scores but no diploma.
How much less would they have varied had they entered the course with the same level of g?
678
Notes to page 74
Notes to pages 74-76
679
studies than the column for job proficiency. Regarding job performance,
one major study evaluated the performance of about 1,500 air force en-
listed men and women working in eight military specialties, chosen to be
representative of military specialties in the air force. Performance was var-
iously measured: by defining a set of tasks involved in each joh, then train-
ing a group of evaluators to assess those specific tasks; by interviews of the
~ersonnel on technical aspects of their jobs; by supervisor ratings after
training the supervisors; and combinations of methods. The average cor-
relation between AFQT score and a hands-on job performance measure
was .40, with the highest among the precision measurement equipment
specialists and the avionics communications specialists and the lowest
among the air traffic control operators and the air crew life support spe-
cialists. Insofar as the jobs were restricted to those held by enlisted men,
the distribution of jobs was somewhat skewed toward the lower end of the
skill range. We do not have an available estimate of the validity of the
AFQT over all military jobs.
Hartigan and Wigdor 1989.
It is one of the chronically frustrating experiences when reading scientific
results: Two sets of experts, supposedly using comparable data, come out
with markedly different conclusions, and the reasons for the differences are
buried in technical and opaque language. How is it possible for a layper-
son to decide who is right? The different estimates of mean validity of the
G A T b . 4 5 according to Hunter, Schmidt, and some others; .25 accord-
ing to the Hartigan committee-is
an instructive case in point.
Sometimes the differences really are technical and opaque. For exam-
ple, the Hartigan committee based its estimate on the assumption that the
reliability of supervisor ratings was higher than other studies assumed-.8
instead of .6 (Hartigan and Wigdor 1989, p. 170). By assuming a higher re-
liability, the committee's correction for measurement error was smaller
than Hunter's. Deciding between the Hartigan committee's use of .8 as the
reliability of supervisor ratings instead of the .6 used by Hunter is impossi-
ble for anyone who is not intimately familiar with a large and scattered lit-
erature on that topic, and even then the choice remains a matter of
judgment. But the Hartigan committee's decision not to correct for re-
striction of range, which makes the largest difference in their estimates of
the overall validity, is based on a much different kind of disagreement.
Here, a layperson is as qualified to decide as an expert, for this is a dis-
agreement about what question is being answered.
John Hunter and others assumed that for any job the applicant pool 1s
the entire U.S. work force. That is, they sought an answer to the question,
"What is the relationship between job performance and intell~gence for
the work force at large!" The Hartigan committee ohjected to their as-
sumption on grounds that, in practice, the applicant pool for any partlcu-
lar job is not the entire U.S. work force hut people who have a chance to
get the job. As they accurately noted, "People gravitate to jobs for which
they are potentially suited" (Hartigan and Wigdor 1989, p. 166).
But embedded in the committee's objection to Hunter's estimates is a
tacit switch in the question that the analysis is supposed to answer. The
Hartigan committee sought an answer to the question, "Among those peo-
ple who apply for such-and-such a position, what is the relationship be-
tween intelligence and job performance!" If one's objective is not to
discourage people who weigh only 250 pounds from applying for johs as
tackles in the NFL, to return to our analogy, then the Hartigan commit-
tee's question is the appropriate one. Of course, by minimizing the valid-
ity of weight, a large number of 150-pound lineman may apply for the jobs.
Thus our reasons for concluding that the assumption used by Hunter and
Schmidt (among others), that restriction of range calculations should be
based on the entire work force, is self-evidently the appropriate choice if
one wants to know the overall relationship of IQ to job performance and
its economic consequences.
23. The ASVAB comprises ten subtests: General Science, Arithmetic Rea-
soning, Word Knowledge, Paragraph Comprehension, Numerical Opera-
tions, Coding Speed, Auto/Shop Information, Mathematics Knowledge,
Mechanical Comprehension, and Electronics Information. Only Numer-
ical Operations and Coding Speed are highly speeded; the other eight are
nonspeeded "power" tests. All the armed services use the four MAGE com-
posites, for Mechanical, Administrative, General, and Electronics sped
cialties, each of which includes three or four subtests in a particular
weighting. These composites are supposed to predict a recruit's trainabil-
ity for the particular specialty. The AFQT is yet another composite from
the ASVAB, selected so as to measure g efficiently. See Appendix 3.
24. About 80 percent of the sample had graduated from high school and had
no further civilian schooling, fewer than 1 percent had failed to graduate
from high school, and fewer than 2 percent had graduated from college;
the remainder had some post-high school civilian schooling short of a col-
lege degree. The modal person in the sample was a white male between 19
and 20 years old, but the sample also included thousands of women and
people from all American ethnic groups; their ages ranged from a mini-
mum of 17 to almost 15 percent above 23 years (see Ree and Earles 1990b).
Other studies, using educationally heterogeneous samples, have in fact
shown that, holding AFQT constant, high school graduates are more likely
to avoid disciplinary action, to be recommended for reenlistment, and to
be promoted to higher rank than nongraduates (Office of the Assistant
Secretary of Defense 1980). Current enlistment policies reflect the inde-
680
Notes to page 76
Notes to pages 77-42
681
pendent predictiveness of education, in that of two applicants with equal
AFQT score, the high school graduate is selected over the nongraduate if
only one is to be accepted.
25. In fact, there may be some upward bias in these correlations, inasmuch as
they were not cross validated to exclude capitalization on chance.
26. What does it mean to "account for the observed variation"? Think of it in
this way: A group of recruits finishes its training course; their grades vary.
How much less would they have varied had they entered the course with
the same level of g? This may seem like a hypothetical question, but it is
answered simply by squaring the correlation between the recruits' level of
g and their final grades. In general, given any two variables, the degree to
which variation in either is explained (or accounted for, in statistical lingo)
by the other variable is obtained by squaring the correlation between them.
For example, a perfect correlation of 1 between two variables means that
each of the variables fully explains the observed variations in the other.
When two variables are perfectly correlated, they are also perfectly re-
dundant since if we know the value of one of them, we also know the value
of the other without having to measure it. Hence, 1 squared is 1.0 or 100
percent. A correlation of .5 means that each variable explains, or accounts
for, 25 percent of the observed variation in the other; a correlation of 0
means that neither variable accounts for any of the observed variation in
the other.
In the Ree and Earles study, over all eighty-nine occupational schools,
the average value of this square correlation was 58 percent (which corre-
sponds to a correlation of .76). g, in other words, accounted for almost 60
percent of the observed variation in school grades in the average military
course, once the results were corrected for range restriction. Even without
a correction for range restriction, g accounted for over 20 percent of the
variance in school grades on the average (corresponding to a correlation
of .45).
27. Welsh, Watson, and Ree 1990.
28. Jones 1988. A similar analysis was performed for job performance but, he-
cause of the expense of obtaining special performance measures, with a
much smaller sample (1,545) spread across just eight enlisted job special-
ties (Ree and Earles 1991). The correlations with g in this study did not
reach the extraordinarily high levels of predictiveness as for school grades,
and the other cognitive factors were relatively more important for job per-
formance than for school grade-points
to which we shall return. But
combining the results with the previously cited job performance study of
air force personnel (Office of the Assistant Secretary of Defense for Force
Management and Personnel 1989), the job predictiveness of AFQT for the
specialties is correlated above .9 with the job predictiveness ofg. Using the
highest of the various correlations between job performance measures and
g, the product-moment correlation is .97 and the Spearman rank-order cor-
relation is .93. In other words, in predicting job performance, at least for
these jobs and these performance tests, the validity of an AFQT score is
virtually entirely explained by how well it measures g, per se.
29. Thorndike 1986. The comparison is between the predictiveness of the first
factor extracted by factor analysis of the five cognitive subtests ofGATB ver-
sus the regression-weighted subtest scores themselves, for cross-validating
samples of at least fifty workers in each of the twenty-eight occupations.
30. Hawk 1986; Jensen 1980,1986; Linn 1986,
31. For the linear relationship of cognitive ability, see Schmidt, Ones, and
Hunter 1992. For the nonlinear relationship of job experiences see
Blankenship and Taylor 1938; Ghiselli and Brown 1947; Taylor and Smith
1956.
32. Hawk 1970; Hunter and Schmidt 1982.
33. Humphreys 1968, 1973; Wilson 1983.
34. See p. 66.
35. Butler and McCauley 1987.
36. McDaniel, Schmidt, and Hunter 1986.
37. Schmidt et al. 1988.
38. Maier and Hiatt 1985.
39. This story echoes the mixed findings for the learning of simple tasks in the
psychological laboratory. Depending on which measures are used to pre-
dict performance and which tasks are being predicted, one can expect ei-
ther to see convergence of performance with practice, or no convergence,
or even divergence under some circumstances. See Ackermann 1987.
40. Schmidt et al. 1988. No data have yet tested the possibility that produc-
tivity diverges (the advantage enjoyed by the smarter employee increases
with experience) in very-high-complexity jobs.
41. See also Schmidt et al. 1984.
42. See the discussion in note 15.
43. Burke and Frederick 1984; Hunter and Schmidt 1982; Hunter, Schmidt,
andludiesch 1990; Schmidt and Hunter 1983; Weekley et al. 1985. In the
technical literature, the standard deviation of productivity measured in
dollars is represented as SD, and has generally been estimated to average,
over many different occupations, .4 times the average wage for the job. The
corresponding figure as a proportion of the value of the average worker out-
put is .2. Methods for estimating these distributions are discussed in the
cited references, but they include such techniques as supervisor ratings of
the dollar costs of replacing workers at various points in the distribution
of workers, cost accounting of worker product, and scores on proficiency
tests and at work sample stations.
Cognitive Ability and Economic Productivity
- The validity of AFQT scores in predicting job performance is almost entirely derived from their measurement of general intelligence (g).
- Research indicates a linear relationship between cognitive ability and job performance, whereas the impact of job experience often shows nonlinear patterns.
- While some tasks show performance convergence with practice, high-complexity jobs may actually see a divergence where the advantage of smarter employees increases over time.
- The standard deviation of worker productivity in dollars is estimated to be approximately 40 percent of the average wage for a given job.
- Small correlations in validity (such as .4) can translate into massive economic consequences and productivity gains when applied to a large workforce.
- Methods for valuing worker output include supervisor ratings of replacement costs, cost accounting, and proficiency test scores.
No data have yet tested the possibility that productivity diverges (the advantage enjoyed by the smarter employee increases with experience) in very-high-complexity jobs.
680
Notes to page 76
Notes to pages 77-42
681
pendent predictiveness of education, in that of two applicants with equal
AFQT score, the high school graduate is selected over the nongraduate if
only one is to be accepted.
25. In fact, there may be some upward bias in these correlations, inasmuch as
they were not cross validated to exclude capitalization on chance.
26. What does it mean to "account for the observed variation"? Think of it in
this way: A group of recruits finishes its training course; their grades vary.
How much less would they have varied had they entered the course with
the same level of g? This may seem like a hypothetical question, but it is
answered simply by squaring the correlation between the recruits' level of
g and their final grades. In general, given any two variables, the degree to
which variation in either is explained (or accounted for, in statistical lingo)
by the other variable is obtained by squaring the correlation between them.
For example, a perfect correlation of 1 between two variables means that
each of the variables fully explains the observed variations in the other.
When two variables are perfectly correlated, they are also perfectly re-
dundant since if we know the value of one of them, we also know the value
of the other without having to measure it. Hence, 1 squared is 1.0 or 100
percent. A correlation of .5 means that each variable explains, or accounts
for, 25 percent of the observed variation in the other; a correlation of 0
means that neither variable accounts for any of the observed variation in
the other.
In the Ree and Earles study, over all eighty-nine occupational schools,
the average value of this square correlation was 58 percent (which corre-
sponds to a correlation of .76). g, in other words, accounted for almost 60
percent of the observed variation in school grades in the average military
course, once the results were corrected for range restriction. Even without
a correction for range restriction, g accounted for over 20 percent of the
variance in school grades on the average (corresponding to a correlation
of .45).
27. Welsh, Watson, and Ree 1990.
28. Jones 1988. A similar analysis was performed for job performance but, he-
cause of the expense of obtaining special performance measures, with a
much smaller sample (1,545) spread across just eight enlisted job special-
ties (Ree and Earles 1991). The correlations with g in this study did not
reach the extraordinarily high levels of predictiveness as for school grades,
and the other cognitive factors were relatively more important for job per-
formance than for school grade-points
to which we shall return. But
combining the results with the previously cited job performance study of
air force personnel (Office of the Assistant Secretary of Defense for Force
Management and Personnel 1989), the job predictiveness of AFQT for the
specialties is correlated above .9 with the job predictiveness ofg. Using the
highest of the various correlations between job performance measures and
g, the product-moment correlation is .97 and the Spearman rank-order cor-
relation is .93. In other words, in predicting job performance, at least for
these jobs and these performance tests, the validity of an AFQT score is
virtually entirely explained by how well it measures g, per se.
29. Thorndike 1986. The comparison is between the predictiveness of the first
factor extracted by factor analysis of the five cognitive subtests ofGATB ver-
sus the regression-weighted subtest scores themselves, for cross-validating
samples of at least fifty workers in each of the twenty-eight occupations.
30. Hawk 1986; Jensen 1980,1986; Linn 1986,
31. For the linear relationship of cognitive ability, see Schmidt, Ones, and
Hunter 1992. For the nonlinear relationship of job experiences see
Blankenship and Taylor 1938; Ghiselli and Brown 1947; Taylor and Smith
1956.
32. Hawk 1970; Hunter and Schmidt 1982.
33. Humphreys 1968, 1973; Wilson 1983.
34. See p. 66.
35. Butler and McCauley 1987.
36. McDaniel, Schmidt, and Hunter 1986.
37. Schmidt et al. 1988.
38. Maier and Hiatt 1985.
39. This story echoes the mixed findings for the learning of simple tasks in the
psychological laboratory. Depending on which measures are used to pre-
dict performance and which tasks are being predicted, one can expect ei-
ther to see convergence of performance with practice, or no convergence,
or even divergence under some circumstances. See Ackermann 1987.
40. Schmidt et al. 1988. No data have yet tested the possibility that produc-
tivity diverges (the advantage enjoyed by the smarter employee increases
with experience) in very-high-complexity jobs.
41. See also Schmidt et al. 1984.
42. See the discussion in note 15.
43. Burke and Frederick 1984; Hunter and Schmidt 1982; Hunter, Schmidt,
andludiesch 1990; Schmidt and Hunter 1983; Weekley et al. 1985. In the
technical literature, the standard deviation of productivity measured in
dollars is represented as SD, and has generally been estimated to average,
over many different occupations, .4 times the average wage for the job. The
corresponding figure as a proportion of the value of the average worker out-
put is .2. Methods for estimating these distributions are discussed in the
cited references, but they include such techniques as supervisor ratings of
the dollar costs of replacing workers at various points in the distribution
of workers, cost accounting of worker product, and scores on proficiency
tests and at work sample stations.
682
Notes to pages 82-85
Notes to pages 85-96
683
44. Becker and Huselid 1992.
45. The more contemporary estimate would place this value at about $16,000
rather than $8,000. All the other dollar estimates of the benefits of test-
ing mentioned in this section could similarly he doubled.
46. Hunter, Schmidt, and Judiesch 1990.
47. We use rounds numbers to make the calculations easy to follow, but these
are in fact close to the current medians.
48. Hunter, Schmidt, and Judiesch 1990.
49. 25,000x.15 =3,750; 100,000~.5
= 50,000;50,000/3,750= 13.33.
50. 100,000 x .5 x .6 = 30,000; 25,000 x .15 x .2 = 750.
5 1. There is another point illustrated by this exercise. Recall that a validity
(correlation) "explains" only the amount of variance equal to its square;
hence a validity of .4 explains only 16 percent of the variance, and this of-
fers a temptation to dismiss the importance of intelligence as heing of neg-
ligible economic consequences. And yet when we calculated the gains to
be realized from an ability test that is less than perfectly valid as a predic-
tor of proficiency, we multiplied the gain from a perfect test by the valid-
ity, not by the square of the validity. When trying to estimate how much
of the value of a perfect selection procedure is captured by an imperfect
substitute, the validity of the imperfect test is equal to the proportion of
the value that is captured by it. A test with a validity of .4 captures 40 per-
cent of the value that would be realized from a perfect test, even though it
explains only 16 percent of the variance. Readers interested in the math-
ematical proof, which was first derived in the 1940s, will find it in Hunter
and Schmidt 1982.
52. Two of the classic discussions of the conditions under which testing pays
off are Brogden 1949 and Cronbach and Gleser 1965.
53. These correlations cover the empirical range in two senses. First, they
bracket the values found in the technical literature dealing with the prep
dictiveness of intelligence. Second, they bracket the various occupations,
as described hy Hunter, Schmidt, and their colleagues. More complex jobs
have higher correlations hetween intelligence and proficiency, but almost
a11 common occupations fall in the range between .2 and .6. The graphs
assume normality of the predictor and outcome variables and a linear re-
lation between them. None of these assumptions needs to be strictly met
in order for the figure to give at least an approximately correct account of
the relationships, nor are there any known deviations from normality or
linearity that would materially alter the account.
54. We estimate the percentile values by assuming that proficiencies are nor-
mally distributed.
55. Hunter and Hunter 1984; Schmidt, Mack, and Hunter 1984.
56. Hartigan and Wigdor 1989; Hunter and Hunter 1984.
57. The data for the following description come from Herrnstein, Belke, and
Taylor 1990.
58. Hunter 1979.
59. Murphy 1986.
1. Juhn, Murphy, and Pierce 1990; Katz and Murphy 1900.
2. Twenty-three percent for sixteen or more years of education versus 11 per-
cent for twelve or fewer years, according to Katz and Murphy 1990.
3. Freeman 1976.
4. The wage decline in the 1970sfor highly educated workers and in the 1980s
for less educated workers could conceivably have been due to declines in
the quality of college education in the earlier period and in primary and
high school education in the later period or in corresponding changes in
the skills of people at those levels of education, as reflected, for example,
in the decline of SAT scores (Bishop 1989). Economists assessing this hy-
pothesis have concluded that it could not have played a major role (see
Blackhum, Bloom, and Freeman 1990; Juhn, Murphy, and Pierce 1990;
Katz and Murphy 1990).
5. The dramatic growth of female work force participation would necessitate
complex modeling to address for the labor force as a whole the question
here dealt with just for men.
6. Comparing men with sixteen or more years in school to those with fewer
than twelve years gives a 26.8 percent differential and to those with twelve
years in school gives 29.8. Since each category is being compared to its own
baseline, this calculation understates the size of the change in actual real
wages.
7. In a slightly different approach to the data, Kevin Murphy and Finis Welch,
restricting the analysis to white workers, also found that more education
had a shrinking wage benefit from 1963 to 1979, followed by a steeply ris-
ing benefit, but only for new workers. For experienced workers, the wage
benefit for education did not decline during the earlier period, then rose
more modestly thereafter. Work experience, in other words, dampened the
wage benefit for education from the 1970s to the 1980s (Murphy and
Welch 1989. See also Murphy and Welch 1993a, 1993b).
8. That intelligence is confounded with educational attainment is hardly a
new idea. See Arrow 1973; Herrnstein 1973; Jencks et al. 1972; Sewell and
Hauser 1975.
9. Juhn, Murphy, and Pierce 1990; Katz and Murphy 1990.
10. Public employment shielded workers, especially female workers, from the
rising wage premium for education in the 1980s and the rising premium
Intelligence, Education, and Wage Dynamics
- The economic value of an imperfect ability test is directly proportional to its validity coefficient rather than the square of that coefficient.
- Intelligence test validity for predicting job proficiency typically ranges between .2 and .6 across most common occupations.
- More complex job roles generally exhibit a higher correlation between intelligence and measured proficiency.
- The wage premium for highly educated workers fluctuated significantly between the 1960s and 1980s, showing a steep rise in the latter decade.
- Economic analysis suggests that shifts in wage benefits were driven more by market demand than by changes in the quality of education or SAT scores.
- Intelligence and educational attainment are deeply confounded factors when analyzing labor market outcomes and wage differentials.
A test with a validity of .4 captures 40 percent of the value that would be realized from a perfect test, even though it explains only 16 percent of the variance.
682
Notes to pages 82-85
Notes to pages 85-96
683
44. Becker and Huselid 1992.
45. The more contemporary estimate would place this value at about $16,000
rather than $8,000. All the other dollar estimates of the benefits of test-
ing mentioned in this section could similarly he doubled.
46. Hunter, Schmidt, and Judiesch 1990.
47. We use rounds numbers to make the calculations easy to follow, but these
are in fact close to the current medians.
48. Hunter, Schmidt, and Judiesch 1990.
49. 25,000x.15 =3,750; 100,000~.5
= 50,000;50,000/3,750= 13.33.
50. 100,000 x .5 x .6 = 30,000; 25,000 x .15 x .2 = 750.
5 1. There is another point illustrated by this exercise. Recall that a validity
(correlation) "explains" only the amount of variance equal to its square;
hence a validity of .4 explains only 16 percent of the variance, and this of-
fers a temptation to dismiss the importance of intelligence as heing of neg-
ligible economic consequences. And yet when we calculated the gains to
be realized from an ability test that is less than perfectly valid as a predic-
tor of proficiency, we multiplied the gain from a perfect test by the valid-
ity, not by the square of the validity. When trying to estimate how much
of the value of a perfect selection procedure is captured by an imperfect
substitute, the validity of the imperfect test is equal to the proportion of
the value that is captured by it. A test with a validity of .4 captures 40 per-
cent of the value that would be realized from a perfect test, even though it
explains only 16 percent of the variance. Readers interested in the math-
ematical proof, which was first derived in the 1940s, will find it in Hunter
and Schmidt 1982.
52. Two of the classic discussions of the conditions under which testing pays
off are Brogden 1949 and Cronbach and Gleser 1965.
53. These correlations cover the empirical range in two senses. First, they
bracket the values found in the technical literature dealing with the prep
dictiveness of intelligence. Second, they bracket the various occupations,
as described hy Hunter, Schmidt, and their colleagues. More complex jobs
have higher correlations hetween intelligence and proficiency, but almost
a11 common occupations fall in the range between .2 and .6. The graphs
assume normality of the predictor and outcome variables and a linear re-
lation between them. None of these assumptions needs to be strictly met
in order for the figure to give at least an approximately correct account of
the relationships, nor are there any known deviations from normality or
linearity that would materially alter the account.
54. We estimate the percentile values by assuming that proficiencies are nor-
mally distributed.
55. Hunter and Hunter 1984; Schmidt, Mack, and Hunter 1984.
56. Hartigan and Wigdor 1989; Hunter and Hunter 1984.
57. The data for the following description come from Herrnstein, Belke, and
Taylor 1990.
58. Hunter 1979.
59. Murphy 1986.
1. Juhn, Murphy, and Pierce 1990; Katz and Murphy 1900.
2. Twenty-three percent for sixteen or more years of education versus 11 per-
cent for twelve or fewer years, according to Katz and Murphy 1990.
3. Freeman 1976.
4. The wage decline in the 1970sfor highly educated workers and in the 1980s
for less educated workers could conceivably have been due to declines in
the quality of college education in the earlier period and in primary and
high school education in the later period or in corresponding changes in
the skills of people at those levels of education, as reflected, for example,
in the decline of SAT scores (Bishop 1989). Economists assessing this hy-
pothesis have concluded that it could not have played a major role (see
Blackhum, Bloom, and Freeman 1990; Juhn, Murphy, and Pierce 1990;
Katz and Murphy 1990).
5. The dramatic growth of female work force participation would necessitate
complex modeling to address for the labor force as a whole the question
here dealt with just for men.
6. Comparing men with sixteen or more years in school to those with fewer
than twelve years gives a 26.8 percent differential and to those with twelve
years in school gives 29.8. Since each category is being compared to its own
baseline, this calculation understates the size of the change in actual real
wages.
7. In a slightly different approach to the data, Kevin Murphy and Finis Welch,
restricting the analysis to white workers, also found that more education
had a shrinking wage benefit from 1963 to 1979, followed by a steeply ris-
ing benefit, but only for new workers. For experienced workers, the wage
benefit for education did not decline during the earlier period, then rose
more modestly thereafter. Work experience, in other words, dampened the
wage benefit for education from the 1970s to the 1980s (Murphy and
Welch 1989. See also Murphy and Welch 1993a, 1993b).
8. That intelligence is confounded with educational attainment is hardly a
new idea. See Arrow 1973; Herrnstein 1973; Jencks et al. 1972; Sewell and
Hauser 1975.
9. Juhn, Murphy, and Pierce 1990; Katz and Murphy 1990.
10. Public employment shielded workers, especially female workers, from the
rising wage premium for education in the 1980s and the rising premium
Wages, Intelligence, and Education
- Public sector employment acted as a buffer in the 1980s, shielding certain workers from the rising private-sector wage premiums tied to education and individual traits.
- The wage gap between federal and private sectors narrowed for highly educated women as they found more lucrative opportunities in the private market.
- Beyond cognitive ability, noncognitive traits like diligence and ambition earn wage premiums, though their economic impact appears less significant than intelligence.
- Econometric studies using birth months and draft lottery numbers suggest that education provides a wage benefit independent of innate intelligence.
- The 'residual' variance in wages—the portion unexplained by education or experience—has been increasing, likely reflecting the growing value of unmeasured individual characteristics.
For people who want to drop out as soon as possible, those born in, say, October will spend a year in school more than those born in January.
682
Notes to pages 82-85
Notes to pages 85-96
683
44. Becker and Huselid 1992.
45. The more contemporary estimate would place this value at about $16,000
rather than $8,000. All the other dollar estimates of the benefits of test-
ing mentioned in this section could similarly he doubled.
46. Hunter, Schmidt, and Judiesch 1990.
47. We use rounds numbers to make the calculations easy to follow, but these
are in fact close to the current medians.
48. Hunter, Schmidt, and Judiesch 1990.
49. 25,000x.15 =3,750; 100,000~.5
= 50,000;50,000/3,750= 13.33.
50. 100,000 x .5 x .6 = 30,000; 25,000 x .15 x .2 = 750.
5 1. There is another point illustrated by this exercise. Recall that a validity
(correlation) "explains" only the amount of variance equal to its square;
hence a validity of .4 explains only 16 percent of the variance, and this of-
fers a temptation to dismiss the importance of intelligence as heing of neg-
ligible economic consequences. And yet when we calculated the gains to
be realized from an ability test that is less than perfectly valid as a predic-
tor of proficiency, we multiplied the gain from a perfect test by the valid-
ity, not by the square of the validity. When trying to estimate how much
of the value of a perfect selection procedure is captured by an imperfect
substitute, the validity of the imperfect test is equal to the proportion of
the value that is captured by it. A test with a validity of .4 captures 40 per-
cent of the value that would be realized from a perfect test, even though it
explains only 16 percent of the variance. Readers interested in the math-
ematical proof, which was first derived in the 1940s, will find it in Hunter
and Schmidt 1982.
52. Two of the classic discussions of the conditions under which testing pays
off are Brogden 1949 and Cronbach and Gleser 1965.
53. These correlations cover the empirical range in two senses. First, they
bracket the values found in the technical literature dealing with the prep
dictiveness of intelligence. Second, they bracket the various occupations,
as described hy Hunter, Schmidt, and their colleagues. More complex jobs
have higher correlations hetween intelligence and proficiency, but almost
a11 common occupations fall in the range between .2 and .6. The graphs
assume normality of the predictor and outcome variables and a linear re-
lation between them. None of these assumptions needs to be strictly met
in order for the figure to give at least an approximately correct account of
the relationships, nor are there any known deviations from normality or
linearity that would materially alter the account.
54. We estimate the percentile values by assuming that proficiencies are nor-
mally distributed.
55. Hunter and Hunter 1984; Schmidt, Mack, and Hunter 1984.
56. Hartigan and Wigdor 1989; Hunter and Hunter 1984.
57. The data for the following description come from Herrnstein, Belke, and
Taylor 1990.
58. Hunter 1979.
59. Murphy 1986.
1. Juhn, Murphy, and Pierce 1990; Katz and Murphy 1900.
2. Twenty-three percent for sixteen or more years of education versus 11 per-
cent for twelve or fewer years, according to Katz and Murphy 1990.
3. Freeman 1976.
4. The wage decline in the 1970sfor highly educated workers and in the 1980s
for less educated workers could conceivably have been due to declines in
the quality of college education in the earlier period and in primary and
high school education in the later period or in corresponding changes in
the skills of people at those levels of education, as reflected, for example,
in the decline of SAT scores (Bishop 1989). Economists assessing this hy-
pothesis have concluded that it could not have played a major role (see
Blackhum, Bloom, and Freeman 1990; Juhn, Murphy, and Pierce 1990;
Katz and Murphy 1990).
5. The dramatic growth of female work force participation would necessitate
complex modeling to address for the labor force as a whole the question
here dealt with just for men.
6. Comparing men with sixteen or more years in school to those with fewer
than twelve years gives a 26.8 percent differential and to those with twelve
years in school gives 29.8. Since each category is being compared to its own
baseline, this calculation understates the size of the change in actual real
wages.
7. In a slightly different approach to the data, Kevin Murphy and Finis Welch,
restricting the analysis to white workers, also found that more education
had a shrinking wage benefit from 1963 to 1979, followed by a steeply ris-
ing benefit, but only for new workers. For experienced workers, the wage
benefit for education did not decline during the earlier period, then rose
more modestly thereafter. Work experience, in other words, dampened the
wage benefit for education from the 1970s to the 1980s (Murphy and
Welch 1989. See also Murphy and Welch 1993a, 1993b).
8. That intelligence is confounded with educational attainment is hardly a
new idea. See Arrow 1973; Herrnstein 1973; Jencks et al. 1972; Sewell and
Hauser 1975.
9. Juhn, Murphy, and Pierce 1990; Katz and Murphy 1990.
10. Public employment shielded workers, especially female workers, from the
rising wage premium for education in the 1980s and the rising premium
684
Notes to pages 96-98
for unmeasured individual characteristics, presumably including intelli-
gence. In the upper half of the wage distribution for highly educated work-
ers, the ratio of federal to private wages declined from 1979 to 1988, even
after corrections for race, age, and region of the country (Cutler and Katz
1991). The decline was especially large for women, perhaps because edu-
cated women were finding relatively more lucrative alternatives outside
the government. For less educated workers in the lower half of the wage
distribution, the ratio of federal to private wages rose during that intewal,
again especially for women. For state and local (as distinguished from fed-
eral) public employees, the rise in the ratio of ~uhlic to private wages for
less educated workers was larger still.
11. "Residual" in the regression analysis sense. After accounting for the effects
of education, experience, gender, and their various interactions, a certain
amount of real wage variance remains unexplained. This is the residual
that has been growing.
12. Juhn, Murphy, and Pierce, 1990; Katz and Murphy 1990; Levy and Mur-
nane 1992.
13. Juhn, Murphy, and Pierce 1990.
14. Diligence, or conscientiousness, is one noncognitive trait that appears to
earn a wage premium (Schmidt and Ones 1992). Drive, ambition, and so-
ciability have been examined by Filer (1981). None of these has been as
well established as cognitive ability, nor do they appear to he as significant
in their economic effects.
15. Blackburn and Neumark 1991.
16. Blackbum and Neumark 1991. This study used the National Longitudinal
Survey of Youth (NLSY), a database described in the introduction to Part
11.
17. Lest we convey the false impression that we are suggesting that education
per se is immaterial, once intelligence is taken account of, we note two in-
genious studies by economists Joshua Angrist and Alan Krueger (Angrist
and Krueger 1991a, 1991b). They examined wages in relation to school-
ing for school dropouts born at different times of year and for people with
varying draft lottery numbers. Dropouts in many states must remain in
school until the end of the academic year in which they reach a given age.
For people who want to drop out as soon as possible, those born in, say, Oc-
tober will spend a year in school more than those born in January. Like-
wise, during the Vietnam era, people whose only reason for staying in
school was to avoid the draft would get more schooling if they had low lot-
tery numbers, making them more likely to be drafted, than if they had high
numbers. In both populations, the extra schooling showed a wage benefit
later on. These findings show effects of education above and beyond per-
sonal traits like intelligence, if we assume that intelligence is uncorrelated
with the month in which one is born or the lottery number. In fact, hu-
man births are moderately seasonal, and the seasonality differs across races,
ethnic groups, and socioeconomic status, which may mean that births are
seasonal with respect to average intelligence (Lam and Miron 1991). No
such complication confounds the study using lottery numbers. Even so, the
generality of these findings for populations other than school dropouts and
for people who stayed in school only to avoid being drafted remains to be
established.
18. Again from the NLSY. The sample chosen for this particular analysis was
at least 30 years old, had been out of school for at least a year, and had
worked fifty-two weeks in 1989 (from Top Decile Analysis). The median
(as distinguished from the mean) difference in annual wages and salaries
was much smaller: $3,000. A bulge of very-high-income individuals in
these occupations among those with high IQs explains the gap between
the mean and the median. For example, in these occupations, among those
in the top decile of IQ, the 97.5th percentile of annual income was over
$180,000; for those not in the top EQ decile, the corresponding income
was $62,186.
19. The median wage for each occupation is the wage that has as many wages
above it as below it in the distribution of wages in the occupation. A me-
dian expresses an average that is relatively insensitive to extreme values at
either end.
20. A high 1Q is also worth extra income outside the high-1Q occupations as
we defined them. The wages and salaries of people not in the high-IQ oc-
cupations but with an IQ in the top 10 percent earned over $1 1,000 more
in 1989 (again in 1990 dollars) than those with IQs below the top decile.
The median family income of those in the top 1Q decile who did not en-
ter the high-IQ professions was $49,000, putting them at the 72d percentile
of family incomes.
2 1. Solon 1992; Zimmerman 1992. Women are not usually included in these
studies because of the analytic complications arising in the recent dramatic
changes in their work force participation. The correlation is even higher
if the predictor of the son's income is the family income rather than just
the father's (Solon 1992). These estimates of the correlation between fa-
ther and son income represent a new finding. Until recently, specialists
mostly agreed that income was not a strong family trait, certainly not like
the family chin or the baldness that passes on from generation to genera-
tion, and not even as enduring as the family nest egg. They had concluded
that the correlation between fathers and sons in income was between .I
and .2-very
low. Expert opinion has, however, been changing. The older
estimates of the correlation between fathers' and sons' incomes, it turns
out, were plagued by two familiar problems that artificially depress come-
IQ and Economic Mobility
- High IQ scores correlate with significantly higher income levels even outside of traditionally high-IQ professions.
- A small group of high-IQ individuals earns exceptionally high wages, creating a large gap between mean and median incomes.
- Recent longitudinal studies suggest that the correlation between father and son incomes is much higher than previously thought, ranging from .4 to .5.
- Previous research underestimated intergenerational income links due to unrepresentative samples and measurement errors from single-year data.
- Heritability estimates for intelligence are being refined through studies of identical twins and quantitative genetics models.
- The data suggests that income and cognitive ability are more enduring family traits than earlier social science consensus indicated.
Until recently, specialists mostly agreed that income was not a strong family trait, certainly not like the family chin or the baldness that passes on from generation to generation, and not even as enduring as the family nest egg.
684
Notes to pages 96-98
for unmeasured individual characteristics, presumably including intelli-
gence. In the upper half of the wage distribution for highly educated work-
ers, the ratio of federal to private wages declined from 1979 to 1988, even
after corrections for race, age, and region of the country (Cutler and Katz
1991). The decline was especially large for women, perhaps because edu-
cated women were finding relatively more lucrative alternatives outside
the government. For less educated workers in the lower half of the wage
distribution, the ratio of federal to private wages rose during that intewal,
again especially for women. For state and local (as distinguished from fed-
eral) public employees, the rise in the ratio of ~uhlic to private wages for
less educated workers was larger still.
11. "Residual" in the regression analysis sense. After accounting for the effects
of education, experience, gender, and their various interactions, a certain
amount of real wage variance remains unexplained. This is the residual
that has been growing.
12. Juhn, Murphy, and Pierce, 1990; Katz and Murphy 1990; Levy and Mur-
nane 1992.
13. Juhn, Murphy, and Pierce 1990.
14. Diligence, or conscientiousness, is one noncognitive trait that appears to
earn a wage premium (Schmidt and Ones 1992). Drive, ambition, and so-
ciability have been examined by Filer (1981). None of these has been as
well established as cognitive ability, nor do they appear to he as significant
in their economic effects.
15. Blackburn and Neumark 1991.
16. Blackbum and Neumark 1991. This study used the National Longitudinal
Survey of Youth (NLSY), a database described in the introduction to Part
11.
17. Lest we convey the false impression that we are suggesting that education
per se is immaterial, once intelligence is taken account of, we note two in-
genious studies by economists Joshua Angrist and Alan Krueger (Angrist
and Krueger 1991a, 1991b). They examined wages in relation to school-
ing for school dropouts born at different times of year and for people with
varying draft lottery numbers. Dropouts in many states must remain in
school until the end of the academic year in which they reach a given age.
For people who want to drop out as soon as possible, those born in, say, Oc-
tober will spend a year in school more than those born in January. Like-
wise, during the Vietnam era, people whose only reason for staying in
school was to avoid the draft would get more schooling if they had low lot-
tery numbers, making them more likely to be drafted, than if they had high
numbers. In both populations, the extra schooling showed a wage benefit
later on. These findings show effects of education above and beyond per-
sonal traits like intelligence, if we assume that intelligence is uncorrelated
with the month in which one is born or the lottery number. In fact, hu-
man births are moderately seasonal, and the seasonality differs across races,
ethnic groups, and socioeconomic status, which may mean that births are
seasonal with respect to average intelligence (Lam and Miron 1991). No
such complication confounds the study using lottery numbers. Even so, the
generality of these findings for populations other than school dropouts and
for people who stayed in school only to avoid being drafted remains to be
established.
18. Again from the NLSY. The sample chosen for this particular analysis was
at least 30 years old, had been out of school for at least a year, and had
worked fifty-two weeks in 1989 (from Top Decile Analysis). The median
(as distinguished from the mean) difference in annual wages and salaries
was much smaller: $3,000. A bulge of very-high-income individuals in
these occupations among those with high IQs explains the gap between
the mean and the median. For example, in these occupations, among those
in the top decile of IQ, the 97.5th percentile of annual income was over
$180,000; for those not in the top EQ decile, the corresponding income
was $62,186.
19. The median wage for each occupation is the wage that has as many wages
above it as below it in the distribution of wages in the occupation. A me-
dian expresses an average that is relatively insensitive to extreme values at
either end.
20. A high 1Q is also worth extra income outside the high-1Q occupations as
we defined them. The wages and salaries of people not in the high-IQ oc-
cupations but with an IQ in the top 10 percent earned over $1 1,000 more
in 1989 (again in 1990 dollars) than those with IQs below the top decile.
The median family income of those in the top 1Q decile who did not en-
ter the high-IQ professions was $49,000, putting them at the 72d percentile
of family incomes.
2 1. Solon 1992; Zimmerman 1992. Women are not usually included in these
studies because of the analytic complications arising in the recent dramatic
changes in their work force participation. The correlation is even higher
if the predictor of the son's income is the family income rather than just
the father's (Solon 1992). These estimates of the correlation between fa-
ther and son income represent a new finding. Until recently, specialists
mostly agreed that income was not a strong family trait, certainly not like
the family chin or the baldness that passes on from generation to genera-
tion, and not even as enduring as the family nest egg. They had concluded
that the correlation between fathers and sons in income was between .I
and .2-very
low. Expert opinion has, however, been changing. The older
estimates of the correlation between fathers' and sons' incomes, it turns
out, were plagued by two familiar problems that artificially depress come-
686
Notes to pages 101 -1 08
Notes to pages 108-1 10
687
lation coefficients. First, the populations used for gathering the estimates
were unrepresentative. One large study, for example, used only high school
graduates, which no doubt restricted the range of IQ scores (Sewell and
Hauser 1975). Another problem has been measurement error-in
the case
of intergenerational comparisons of income, measurement error intro-
duced by basing the analysis on a single year's income. Averaging income
over a few years reduces this source of error. Now, using the nationally rep-
resentative, longitudinal data in the National Longitudinal Survey (NLS)
and the Panel Study of Income Dynamics (PSID), economists have found
the correlations of .4 to .5 reported in the text.
22. Solon 1992. For comparable estimates for Great Britain, see Atkinson,
Maynard, and Trinder 1983.
23. U.S. Bureau of the Census 1991 b, Table 32.
24. Herrnstein 1973, pp. 197-198.
25. For reviews of the literature as of 1980, see Bouchard 1981; Plomin and
DeFries 1980. For more recent analyses, on which we base the upper bounct
estimate of 80 percent, see Bouchard et al. 1990; Pedersen et al. 1992.
26. Plomin and Loehlin 1989.
27. The proper statistical measure of variation is the standard deviation
squared, which is called the variance.
28. Heritability is a concept in quantitative genetics; for a good texthook, see
Falconer 1989.
29. Social scientists will recognize the heritability question as heing akin to
the general statistical model of variance analysis.
30. Plomin and Loehlin 1989.
3 1. Bouchard et a!. 1990.
32. Estimating heritabilities from any relationship other than for identical
twins is inherently more uncertain because the modeling is more complex,
involving the estimation of additional sources of genetic variation, such as
assortative mating (about which more below) and genetic dominance and
epistasis. See Falconer 1989.
33. For a broad survey of all kinds of data published before 1981, set into sev-
eral statistical models, the best fitting of which gave .5 1 as the estimate of
IQ heritability, see Chipuer, Rovine, and Plomin 1990. Most of the data
are from Western countries, but a recent analysis of Japanese data, based
on a comparison of identical and fraternal twin correlations in IQ, yields
a heritability estimate of ,518 (Lynn and Hattori 1990).
34. The extraordinary discrepancy between what the experts say in their tech-
nical publications on this subject and what the media say the experts say
is well described in Snyderman and Rothman 1988.
35. Cyphers et al. 1989; Pedersen et al. 1992.
36. Cyphers et al. 1989; Pedersen et al. 1992.
37. Based primarily on a large study of Swedish identical and fraternal twins
followed into late adulthood (Pedersen et al. 1992).
38. Plomin and Rergeman 1987; Rowe and Plomin 198 1.
39. IQ is not the only trait with a biological component that varies across so-
cioeconomic strata. Height, head size, blood type, age at menarche, sus-
ceptibility to various congenital diseases, and so on are some of the other
traits for which there is evidence of social class differences even in racially
homogeneous societies (for review, see Mascie-Taylor 1990).
40. The standard deviation squared times the heritability gives variance due
just to genes; the square root of that number is the s ~ n d a r d
deviation of
IQ in a world of perfectly uniform environments: 1/(15' x 6 ) = 11.6 A
heritability of .4 would reduce the standard deviation from the normative
value of 15 to 9.5; with a heritability of .8., it would be reduced to 13.4.
41. If we take the heritability of IQ to be .6, then the swing in 1Q is 24 points
for two children with identical genes, but growing up in circumstances that
are at, say, the 10th and the 90th centile in their capacity to foster intel-
ligence, a very large swing indeed. A less extreme swing from the 40th to
the 60th centile in environmental conditions would move the average IQ
only 4.75 points. In a normal distribution, the distance from the 10th to
the 90th percentile is about 2.5 standard deviation units; from the 40th to
the 60th percentile, it is about .5 standard deviation units. If the heri-
tability is .8, instead of .6, then the swing from the 10th to the 90th per-
centile would be worth 17 IQ points, from the 40th to the 60th, 3.4 IQ
points.
42. Burgess and Wallin 1943.
43. Spuhler 1968.
44. Jensen 1978. This estimate may be high for a variety of technical reasons
that are still being explored, but apparently not a lot too high. For more,
see DeFries et al. 1979; Mascie-Taylor 1989; Mascie-Taylor and Vanden-
berg 1988; Price and Vandenberg 1980; Watkins and Meredith 1981. In
the 1980s, some researchers argued that data from Hawaii indicated a
falling level of assortative mating for IQ, which they attributed to increased
social mobility and greater access to higher education (Ahern, Johnson,
and Cole 1983; Johnson, Ahem, and Cole 1980; Johnson, Nagoshi, and
Ahem 1987). But the evidence seems to be limited to Hawaii. Other re-
cent data from Norway and Virginia, not to mention the national census
data developed by Mare and discussed in the text, fail to confirm the
Hawaii data (Heath et al. 1985,1987). When intelligence and educational
level are statistically pulled apart, the assortative mating for education, net
of intelligence, is stronger than that for intelligence, net of educational
level (Neale and McArdle 1990; Phillips et al. 1988).
45. For a discussion of regression to the mean, see Chapter 15. The calcula-
Heritability and Environmental Variance
- Statistical models across Western and Japanese data consistently estimate the heritability of IQ at approximately .5 to .6.
- There is a documented discrepancy between technical expert publications on intelligence and the way these findings are portrayed in the media.
- Biological traits beyond IQ, such as height and susceptibility to disease, show significant variation across socioeconomic strata even in homogeneous societies.
- Mathematical models suggest that even with high heritability, extreme environmental differences can cause an IQ swing of up to 24 points.
- Assortative mating for educational level appears to be statistically stronger than assortative mating for intelligence itself.
- The standard deviation of IQ would only be moderately reduced in a hypothetical world of perfectly uniform environments.
The extraordinary discrepancy between what the experts say in their technical publications on this subject and what the media say the experts say is well described in Snyderman and Rothman 1988.
686
Notes to pages 101 -1 08
Notes to pages 108-1 10
687
lation coefficients. First, the populations used for gathering the estimates
were unrepresentative. One large study, for example, used only high school
graduates, which no doubt restricted the range of IQ scores (Sewell and
Hauser 1975). Another problem has been measurement error-in
the case
of intergenerational comparisons of income, measurement error intro-
duced by basing the analysis on a single year's income. Averaging income
over a few years reduces this source of error. Now, using the nationally rep-
resentative, longitudinal data in the National Longitudinal Survey (NLS)
and the Panel Study of Income Dynamics (PSID), economists have found
the correlations of .4 to .5 reported in the text.
22. Solon 1992. For comparable estimates for Great Britain, see Atkinson,
Maynard, and Trinder 1983.
23. U.S. Bureau of the Census 1991 b, Table 32.
24. Herrnstein 1973, pp. 197-198.
25. For reviews of the literature as of 1980, see Bouchard 1981; Plomin and
DeFries 1980. For more recent analyses, on which we base the upper bounct
estimate of 80 percent, see Bouchard et al. 1990; Pedersen et al. 1992.
26. Plomin and Loehlin 1989.
27. The proper statistical measure of variation is the standard deviation
squared, which is called the variance.
28. Heritability is a concept in quantitative genetics; for a good texthook, see
Falconer 1989.
29. Social scientists will recognize the heritability question as heing akin to
the general statistical model of variance analysis.
30. Plomin and Loehlin 1989.
3 1. Bouchard et a!. 1990.
32. Estimating heritabilities from any relationship other than for identical
twins is inherently more uncertain because the modeling is more complex,
involving the estimation of additional sources of genetic variation, such as
assortative mating (about which more below) and genetic dominance and
epistasis. See Falconer 1989.
33. For a broad survey of all kinds of data published before 1981, set into sev-
eral statistical models, the best fitting of which gave .5 1 as the estimate of
IQ heritability, see Chipuer, Rovine, and Plomin 1990. Most of the data
are from Western countries, but a recent analysis of Japanese data, based
on a comparison of identical and fraternal twin correlations in IQ, yields
a heritability estimate of ,518 (Lynn and Hattori 1990).
34. The extraordinary discrepancy between what the experts say in their tech-
nical publications on this subject and what the media say the experts say
is well described in Snyderman and Rothman 1988.
35. Cyphers et al. 1989; Pedersen et al. 1992.
36. Cyphers et al. 1989; Pedersen et al. 1992.
37. Based primarily on a large study of Swedish identical and fraternal twins
followed into late adulthood (Pedersen et al. 1992).
38. Plomin and Rergeman 1987; Rowe and Plomin 198 1.
39. IQ is not the only trait with a biological component that varies across so-
cioeconomic strata. Height, head size, blood type, age at menarche, sus-
ceptibility to various congenital diseases, and so on are some of the other
traits for which there is evidence of social class differences even in racially
homogeneous societies (for review, see Mascie-Taylor 1990).
40. The standard deviation squared times the heritability gives variance due
just to genes; the square root of that number is the s ~ n d a r d
deviation of
IQ in a world of perfectly uniform environments: 1/(15' x 6 ) = 11.6 A
heritability of .4 would reduce the standard deviation from the normative
value of 15 to 9.5; with a heritability of .8., it would be reduced to 13.4.
41. If we take the heritability of IQ to be .6, then the swing in 1Q is 24 points
for two children with identical genes, but growing up in circumstances that
are at, say, the 10th and the 90th centile in their capacity to foster intel-
ligence, a very large swing indeed. A less extreme swing from the 40th to
the 60th centile in environmental conditions would move the average IQ
only 4.75 points. In a normal distribution, the distance from the 10th to
the 90th percentile is about 2.5 standard deviation units; from the 40th to
the 60th percentile, it is about .5 standard deviation units. If the heri-
tability is .8, instead of .6, then the swing from the 10th to the 90th per-
centile would be worth 17 IQ points, from the 40th to the 60th, 3.4 IQ
points.
42. Burgess and Wallin 1943.
43. Spuhler 1968.
44. Jensen 1978. This estimate may be high for a variety of technical reasons
that are still being explored, but apparently not a lot too high. For more,
see DeFries et al. 1979; Mascie-Taylor 1989; Mascie-Taylor and Vanden-
berg 1988; Price and Vandenberg 1980; Watkins and Meredith 1981. In
the 1980s, some researchers argued that data from Hawaii indicated a
falling level of assortative mating for IQ, which they attributed to increased
social mobility and greater access to higher education (Ahern, Johnson,
and Cole 1983; Johnson, Ahem, and Cole 1980; Johnson, Nagoshi, and
Ahem 1987). But the evidence seems to be limited to Hawaii. Other re-
cent data from Norway and Virginia, not to mention the national census
data developed by Mare and discussed in the text, fail to confirm the
Hawaii data (Heath et al. 1985,1987). When intelligence and educational
level are statistically pulled apart, the assortative mating for education, net
of intelligence, is stronger than that for intelligence, net of educational
level (Neale and McArdle 1990; Phillips et al. 1988).
45. For a discussion of regression to the mean, see Chapter 15. The calcula-
Cognitive Stratification and Educational Homogamy
- The text establishes a high correlation (+.8) between parental IQ and child IQ, factoring in both heritability and family environment.
- Data from 1960 shows Harvard freshmen averaged 2.9 standard deviations above the national mean, placing their estimated mean IQ at approximately 130.
- There is documented evidence of increasing educational homogamy, where individuals with similar schooling levels are more likely to marry one-another.
- Statistical analysis of the NLSY and other longitudinal studies reveals that a significant percentage of high-ability students fail to complete degrees within six years.
- The authors note a lack of attention to IQ in mainstream economic literature, despite its relevance to understanding social and family problems.
- Methodological details regarding the NLSY sample highlight that participants were paid for testing to ensure engagement and data quality.
That each NLSY subject was paid $50 to take the test helped ensure a positive attitude toward the experience.
688
Notes to pages 1 10-1 17
Notes to pages 1 1 8-1 25
689
tion in the text assumes a correlation of +.8 between the average child's
IQ and the midpoint of the ~arental IQs, consistent with a heritability of
.6 and a family environment effect of .2. The estimate of average IQs in
1930 is explained in Chapter 1. The estimate for the class of 1964 (who
were freshmen in 1960) is based on Harvard SAT-Verbal scores compared
to the Educational Testing Service's national norm study conducted in
1960, which indicates that the mean verbal score for entering Harvard
freshmen was 2.9 SDs above the mean of all high school seniors-and,
by
implication, considerably higher than that for the entire 18-~ear old co-
hort (which includes the high school dropouts; Seibel1962, Bender 1960).
If we estimate the correlation between the SAT-Verbal and IQ as +.65
(from Donlon 1984), the estimated mean IQ of Harvard freshmen as of
1960 was about 130, from which the estimate of children's IQ has been cal-
culated.
46. With a parent-child correlation of .8, 64 percent of the variance is nc-
counted for, 36 percent not accounted for. The square root of .36, which
is .6, times 15, is the standard deviation of the distribution of IQ scores of
the children of these parents. This gives a value of 9, from which the per-
centages in the text are estimated.
47. Operationally, Mare compared marriage among people with sixteen o r
more years of schooling with those who had fewer than sixteen years of
schooling (Mare 1991, p. 23). For additional evidence of increasing edu-
cational homogamy in the 1970s and 1980s, see Qian and Preston 1993.
48. Oppenheimer, 1988.
49. DES 1992, Tahles 160, 168.
50. Buss 1987. For evidence that this phenomenon is well underway, see Qian
and Preston 1993.
51. In the NLSY, whose members graduated from high school in the period
1976-1983, 59.3 percent had obtained a bachelor's or higher degree by
1990. In the "High School and Beyond" study conducted by the Depart-
ment of Education, only 44 percent of 1980 high school graduates who
were in the top quartile of ability had obtained a B.A. or B.S. by 1986 (Ea-
gle 1988a, Table 3).
52. See Chapter 1.
53. Authors' analysis of the NLSY.
54. Authors' analysis of the NLSY.
55. SAUS 1991. Table 17.
Introduction to Part 11
1. Sussman and Steinmetz 1987. This is still a valuable source of information
about myriad aspects of family life, mainly in America.
2. For example, in the last ten years, out of hundreds of articles and research
notes, the preeminent economics journal, American Economic Review,
has published just a handful of articles that call upon IQ as a way of un-
derstanding such problems. The most conspicuous exceptions are Bishop
1989; Boissiere et al. 1985; Levin 1989; Silberberg 1985; Smith 1984.
3. The criterion for eligibility was that they be ages 14 to 21 on January 1,
1979, which meant that some of them had turned 22 by the time the first
interview occurred.
4. Details of the Department of Defense enlistment tests, the ASVAB, are
also given in Appendix 3.
5. The test battery was administered to small groups by trained test person-
nel. That each NLSY subject was paid $50 to take the test helped ensure
a positive attitude toward the experience.
6. See Appendix 3 for more on the test and its g loading, and the Introduc-
tion for a discussion of g itself.
7. Raw AFQT scores in the NLSY sample rose with age throughout the age
cohorts who were still in their teens when they took the test. The sim-
plest explanation is that the AFQT was designed by the military for a pop-
ulation of recruits who would be taking the test in their late teens, and
younger youths in the NLSY sample got lower scores for the same reason
that hiah school freshmen get lower SAT scores than high school seniors.
However, a cohort effect could also be at work, whereby (because of ed-
ucational or broad environmental reasons) youths born in the first half of
the 1960s had lower realized cognitive ability than youths born in the last
half of the 1950s. There is no empirical way of telling which reason ex-
plains the age-related differences in the AFQT or what the mix of rea-
sons might be. This uncertainty is readily handled in the multivariate
analyses by enrering the subject's birthdate as an independent variable (all
the NLSY sample took the AFQT within a few months of each other in
late 1980). When we present descriptive statistics, we use age-equated
centiles.
8. We assigned the NLSY youths to a cognitive class on the basis of their age-
equated centile scores. We use the class divisions as a way to communicate
the data in an easily understood form. It should be remembered, however,
that all of the statistical analyses are based on the actual test scores of each
individual in the NLSY.
9. Regression analysis is only remotely related to the regression to the mean
referred to earlier. See Appendix 1.
10. Age, too, is always part of the analytic package, a necessity given the na-
ture of the NLSY sample (see note 7).
11. The white sample for the NLSY was chosen by first selecting all who were
categorized by the interview screener as nonblack and non-Hispanic. From
Methodology and Cognitive Stability
- The authors address age-related differences in AFQT scores by using birthdates as independent variables and age-equated centiles for descriptive statistics.
- The NLSY white sample was strictly defined by excluding individuals who identified as black, Hispanic, Asian, Pacific Islander, or American Indian.
- Historical poverty data from 1939 and 1949 suggests that high poverty rates were not merely artifacts of the Great Depression but were even higher in preceding years.
- Cognitive test scores demonstrate significant stability after age 10, with correlations typically falling between the product and the square root of the tests' reliabilities.
- Major standardized tests like the SAT, ACT, and WAIS exhibit extremely high reliability coefficients, often exceeding 0.90.
Since the best IQ tests have reliabilities in excess of .9, this is tantamount to saying that the stability of scores is quite high.
688
Notes to pages 1 10-1 17
Notes to pages 1 1 8-1 25
689
tion in the text assumes a correlation of +.8 between the average child's
IQ and the midpoint of the ~arental IQs, consistent with a heritability of
.6 and a family environment effect of .2. The estimate of average IQs in
1930 is explained in Chapter 1. The estimate for the class of 1964 (who
were freshmen in 1960) is based on Harvard SAT-Verbal scores compared
to the Educational Testing Service's national norm study conducted in
1960, which indicates that the mean verbal score for entering Harvard
freshmen was 2.9 SDs above the mean of all high school seniors-and,
by
implication, considerably higher than that for the entire 18-~ear old co-
hort (which includes the high school dropouts; Seibel1962, Bender 1960).
If we estimate the correlation between the SAT-Verbal and IQ as +.65
(from Donlon 1984), the estimated mean IQ of Harvard freshmen as of
1960 was about 130, from which the estimate of children's IQ has been cal-
culated.
46. With a parent-child correlation of .8, 64 percent of the variance is nc-
counted for, 36 percent not accounted for. The square root of .36, which
is .6, times 15, is the standard deviation of the distribution of IQ scores of
the children of these parents. This gives a value of 9, from which the per-
centages in the text are estimated.
47. Operationally, Mare compared marriage among people with sixteen o r
more years of schooling with those who had fewer than sixteen years of
schooling (Mare 1991, p. 23). For additional evidence of increasing edu-
cational homogamy in the 1970s and 1980s, see Qian and Preston 1993.
48. Oppenheimer, 1988.
49. DES 1992, Tahles 160, 168.
50. Buss 1987. For evidence that this phenomenon is well underway, see Qian
and Preston 1993.
51. In the NLSY, whose members graduated from high school in the period
1976-1983, 59.3 percent had obtained a bachelor's or higher degree by
1990. In the "High School and Beyond" study conducted by the Depart-
ment of Education, only 44 percent of 1980 high school graduates who
were in the top quartile of ability had obtained a B.A. or B.S. by 1986 (Ea-
gle 1988a, Table 3).
52. See Chapter 1.
53. Authors' analysis of the NLSY.
54. Authors' analysis of the NLSY.
55. SAUS 1991. Table 17.
Introduction to Part 11
1. Sussman and Steinmetz 1987. This is still a valuable source of information
about myriad aspects of family life, mainly in America.
2. For example, in the last ten years, out of hundreds of articles and research
notes, the preeminent economics journal, American Economic Review,
has published just a handful of articles that call upon IQ as a way of un-
derstanding such problems. The most conspicuous exceptions are Bishop
1989; Boissiere et al. 1985; Levin 1989; Silberberg 1985; Smith 1984.
3. The criterion for eligibility was that they be ages 14 to 21 on January 1,
1979, which meant that some of them had turned 22 by the time the first
interview occurred.
4. Details of the Department of Defense enlistment tests, the ASVAB, are
also given in Appendix 3.
5. The test battery was administered to small groups by trained test person-
nel. That each NLSY subject was paid $50 to take the test helped ensure
a positive attitude toward the experience.
6. See Appendix 3 for more on the test and its g loading, and the Introduc-
tion for a discussion of g itself.
7. Raw AFQT scores in the NLSY sample rose with age throughout the age
cohorts who were still in their teens when they took the test. The sim-
plest explanation is that the AFQT was designed by the military for a pop-
ulation of recruits who would be taking the test in their late teens, and
younger youths in the NLSY sample got lower scores for the same reason
that hiah school freshmen get lower SAT scores than high school seniors.
However, a cohort effect could also be at work, whereby (because of ed-
ucational or broad environmental reasons) youths born in the first half of
the 1960s had lower realized cognitive ability than youths born in the last
half of the 1950s. There is no empirical way of telling which reason ex-
plains the age-related differences in the AFQT or what the mix of rea-
sons might be. This uncertainty is readily handled in the multivariate
analyses by enrering the subject's birthdate as an independent variable (all
the NLSY sample took the AFQT within a few months of each other in
late 1980). When we present descriptive statistics, we use age-equated
centiles.
8. We assigned the NLSY youths to a cognitive class on the basis of their age-
equated centile scores. We use the class divisions as a way to communicate
the data in an easily understood form. It should be remembered, however,
that all of the statistical analyses are based on the actual test scores of each
individual in the NLSY.
9. Regression analysis is only remotely related to the regression to the mean
referred to earlier. See Appendix 1.
10. Age, too, is always part of the analytic package, a necessity given the na-
ture of the NLSY sample (see note 7).
11. The white sample for the NLSY was chosen by first selecting all who were
categorized by the interview screener as nonblack and non-Hispanic. From
690
Notes to pages 128-1 29
Notes to pages 130-1 37
691
this group, we excluded all youths who identified their own ethnicity as
Asian, Pacific, American Indian, African, or Hispanic.
Chapter 5
1. Ross et al. 1987. The authors used the sample tapes for the 1940 and 1950
census to calculate the figures for 1939 and 1949, antedating the begin-
ning of the annual poverty statistics in 1959. The numbers represent total
money income, including govemment transfers. The figure for 1939 is ex-
trapolated, since the 1939 census did not include data on income other
than eamings. It assumes that the ratio of poverty based on eamings to
poverty based on total income in 1949 (.761) also applied in 1939, when
68.1 percent of the population had eamings that put them below the
poverty line. Since govemment transfers increased somewhat in the in-
tervening decade, the resulting figure for 1939 should be considered a lower
bound.
It may be asked if the high poverty percentage in 1939 was an artifact
of the Great Depression. The numbers are inexact, but the answer is no.
The poverty rate prior to the Depression-defined by the contemporary
poverty line-was
higher yet. (See Murray 1988b, pp. 72-73).
2. See the introduction to Part I1 for more on the distinction between inde-
pendent and dependent variables.
3. Jensen 1980, p. 281.
4. The observed stability of tests for children up to 10 years of age is reason-
ably well approximated by the formula,
where r,, and rz2 are the reliabilities of the tests on occasions 1 and 2,
CAI and CA, are the subject's chronological age on occasions 1 and 2, and
rI2 is the correlation between a test taken and retaken at ages CAI and CA2.
See Bloom 1964 for a full discussion.
5. After age 10, the correlation of test scores will usually fall between the
product of the reliabilities of the two tests and the square root of their prod-
uct. Thus, for example, the correlation of two measures of IQ after age 10
when both tests had reliabilities of .9 may be expected to fall between .81
and .9. Since the best IQ tests have reliabilities in excess of .9, this is tan-
tamount to saying that the stability of scores is quite high. Following are
some sample reliabilities as reported in the publisher's test manuals. WlSC
= .95, WAIS = .97, Wonderlic Personnel Test = .95. The reliabilities of
some of the major standardized achievement tests are also extremely high.
For example: ACT = .95, SAT = 90+, California Achievement Tests =
.90-.95, Iowa Test of Basic Skills Composite = .98--99. For a longer list of
reliabilities and an accessible discussion of both reliability and stability, see
Jensen 1980, Chap. 7.
6. Is there reason to think that, had the test been administered earlier, at age
7 or 8, the results would have turned out differently ?The answer, with some
reservations, is no. We would observe the normal level of fluctuation in
tests administered at ages 7 and 20, with some individuals scoring higher
and some lower as they grow up. The correlations between a person's IQ
obtained at age 7 and social behavior in adulthood would support the same
qualitative conclusions as those based on an IQ obtained at age 20. The
correlations using the younget scores would be smaller, because they mea-
sure the adult trait of intelligence less reliably than a score obtained later
in life. See Appendix 3 for a discussion of changes in IQ among the mem-
bers of the NLSY sample.
7. Himmelfarb 1984.
8. E.g., Ryan 1971.
9. For a few words about regression analysis, see the Introduction to Part 11
and Appendix 1. In fewer words still, this is a method for assessing the in-
dependent impact of each of a set of independent variables on a depen-
dent variable. The specific form used here is called logistic regression
analysis, the appropriate method for binary dependent variables, such as
yes-no or female-male or married-unmarried.
10. We eliminate students to avoid misleading ourselves with, for example,
third-year law students who have low incomes in 1989 but are soon to be
making high incomes.
11. Note a distinction: Age has an important independent effect on income
(income trajectories are highly sensitive to age), but not on the yes-no
question of whether a person lives above the poverty line. It is also worth
noting that age in the NLSY is restricted in range because the sample was
all born within a few years of each other.
12. The imaginary person is sexless.
13. We refrain from precise numerical estimates of how much more important
1Q is than socioeconomic background, for two reasons. First, they are not
essential to the point of this discussion. Second, doing so would get us into
problems of measurement and measurement error that would needlessly
complicate the text. It seems sufficient for our purpose to note that IQ has
a greater impact on the likelihood of being poor than socioeconomic hack-
ground, as those variables are usually measured.
14. The 1991 poverty rate for persons 15 and over was 1 1.9 percent, compared
Stability of IQ and Poverty
- IQ scores obtained in early childhood are reliable predictors of adult social behavior and intelligence despite minor fluctuations.
- Logistic regression analysis is utilized to isolate the independent impact of IQ and socioeconomic background on poverty.
- The study excludes current students from income data to prevent temporary low earnings from skewing long-term poverty results.
- IQ is found to have a greater impact on the likelihood of living in poverty than a person's socioeconomic background.
- Gender differences in poverty rates become negligible when comparing childless individuals of similar age, IQ, and background.
- The authors prioritize statistical significance, ensuring all presented relationships meet rigorous mathematical standards before being discussed.
The correlations between a person's IQ obtained at age 7 and social behavior in adulthood would support the same qualitative conclusions as those based on an IQ obtained at age 20.
690
Notes to pages 128-1 29
Notes to pages 130-1 37
691
this group, we excluded all youths who identified their own ethnicity as
Asian, Pacific, American Indian, African, or Hispanic.
Chapter 5
1. Ross et al. 1987. The authors used the sample tapes for the 1940 and 1950
census to calculate the figures for 1939 and 1949, antedating the begin-
ning of the annual poverty statistics in 1959. The numbers represent total
money income, including govemment transfers. The figure for 1939 is ex-
trapolated, since the 1939 census did not include data on income other
than eamings. It assumes that the ratio of poverty based on eamings to
poverty based on total income in 1949 (.761) also applied in 1939, when
68.1 percent of the population had eamings that put them below the
poverty line. Since govemment transfers increased somewhat in the in-
tervening decade, the resulting figure for 1939 should be considered a lower
bound.
It may be asked if the high poverty percentage in 1939 was an artifact
of the Great Depression. The numbers are inexact, but the answer is no.
The poverty rate prior to the Depression-defined by the contemporary
poverty line-was
higher yet. (See Murray 1988b, pp. 72-73).
2. See the introduction to Part I1 for more on the distinction between inde-
pendent and dependent variables.
3. Jensen 1980, p. 281.
4. The observed stability of tests for children up to 10 years of age is reason-
ably well approximated by the formula,
where r,, and rz2 are the reliabilities of the tests on occasions 1 and 2,
CAI and CA, are the subject's chronological age on occasions 1 and 2, and
rI2 is the correlation between a test taken and retaken at ages CAI and CA2.
See Bloom 1964 for a full discussion.
5. After age 10, the correlation of test scores will usually fall between the
product of the reliabilities of the two tests and the square root of their prod-
uct. Thus, for example, the correlation of two measures of IQ after age 10
when both tests had reliabilities of .9 may be expected to fall between .81
and .9. Since the best IQ tests have reliabilities in excess of .9, this is tan-
tamount to saying that the stability of scores is quite high. Following are
some sample reliabilities as reported in the publisher's test manuals. WlSC
= .95, WAIS = .97, Wonderlic Personnel Test = .95. The reliabilities of
some of the major standardized achievement tests are also extremely high.
For example: ACT = .95, SAT = 90+, California Achievement Tests =
.90-.95, Iowa Test of Basic Skills Composite = .98--99. For a longer list of
reliabilities and an accessible discussion of both reliability and stability, see
Jensen 1980, Chap. 7.
6. Is there reason to think that, had the test been administered earlier, at age
7 or 8, the results would have turned out differently ?The answer, with some
reservations, is no. We would observe the normal level of fluctuation in
tests administered at ages 7 and 20, with some individuals scoring higher
and some lower as they grow up. The correlations between a person's IQ
obtained at age 7 and social behavior in adulthood would support the same
qualitative conclusions as those based on an IQ obtained at age 20. The
correlations using the younget scores would be smaller, because they mea-
sure the adult trait of intelligence less reliably than a score obtained later
in life. See Appendix 3 for a discussion of changes in IQ among the mem-
bers of the NLSY sample.
7. Himmelfarb 1984.
8. E.g., Ryan 1971.
9. For a few words about regression analysis, see the Introduction to Part 11
and Appendix 1. In fewer words still, this is a method for assessing the in-
dependent impact of each of a set of independent variables on a depen-
dent variable. The specific form used here is called logistic regression
analysis, the appropriate method for binary dependent variables, such as
yes-no or female-male or married-unmarried.
10. We eliminate students to avoid misleading ourselves with, for example,
third-year law students who have low incomes in 1989 but are soon to be
making high incomes.
11. Note a distinction: Age has an important independent effect on income
(income trajectories are highly sensitive to age), but not on the yes-no
question of whether a person lives above the poverty line. It is also worth
noting that age in the NLSY is restricted in range because the sample was
all born within a few years of each other.
12. The imaginary person is sexless.
13. We refrain from precise numerical estimates of how much more important
1Q is than socioeconomic background, for two reasons. First, they are not
essential to the point of this discussion. Second, doing so would get us into
problems of measurement and measurement error that would needlessly
complicate the text. It seems sufficient for our purpose to note that IQ has
a greater impact on the likelihood of being poor than socioeconomic hack-
ground, as those variables are usually measured.
14. The 1991 poverty rate for persons 15 and over was 1 1.9 percent, compared
Notes to pages 141-145
693
to 22.4 percent for children under 15. U.S. Bureau of the Census, 1992,
Table 1.
15. For an analysis of the demographic reasons and some measurement issues,
see Smith 1989.
16. U.S. Bureau of the Census 1992, Table C, p. xiv.
17. U.S. Bureau of the Census 1992, Table C, p. xiv.
18. Eggebeen and Lichter 1991; Smith 1989.
19. Given childless white men and women of average age, socioeconomic
background, and IQ, the expected poverty rates are only 1.6 percentage
points apart and are exceedingly low in both cases: 3.1 and 4.7 percent, re-
spectively.
20. The relationships of IQ to poverty were statistically significant beyond the
.01 level for both married and unmarried women. Our policy throughout
the book is not routinely to report significance statistics, hut at the same
time not to present any relationship as being substantively significant iln-
less we know that it also is statistically significant.
2 1. An entire draft of the hook was written using a different measure of IQ. As
described in Appendix 3, the armed forces changed the scoring system for
the AFQT in 1989. The first draft was written using the old version. Af-
ter discussing the merits of the old and new measures at length, we decided
to switch to the new one, because, for arcane reasons, it is psychometri-
cally superior. The substantive effects of this change on the conclusions in
the book are, as far as we can tell, effectively nil. All of the analyses have
also been repeated with two versions of the SES index, and many of them
with three. Again, the three versions yielded substantively indistinguish-
able results. But each of the successive versions of the SES index was, in
our judgment, a theoretically more satisfying and statistically more rohust
way of capturing the construct of "socioeconomic status."
Regarding the specific analysis of the role of gender and marital status
in mediating the relationship between IQ and poverty: Originally, the
analysis (and the graphic included in the text on page 138) was hased on
married/unmarried, menlwomen. Then we looked more closely at women
and their various marital situations, then at those marital situations for
women with children. All of the poverty analyses were conducted with two
measures of poverty: the official definition (represented in this book), and
a definition based on cash income obtained from sources other than
government transfers. We decided to present the results using the official
definition to avoid an extra layer of explanation, hut we have the comfort
of knowing that the interpretation fits both definitions, except for a few
nuances that are not important enough to warrant a place in this concise
an account. We have conducted some of these analyses for age-restricted
samples, to see if things change for older cohorts in ways that are not
captured by using age as an independent variable in the regression equa-
tion. Throughout all of these regression analyses, we were also looking at
cross-tabulations and frequency distributions to try to see what gnomes
might he lurking in the regression coefficients. Finally, we duplicated all
of the analyses you see with and without sample weights, to ensure that
there were no marked, mysterious differences in the two sets of results.
There were undoubtedly other iterations and variations that we have
forgotten over the last four years.
None of this will be surprising to our colleagues, for the process we have
described is SOP for social scientists engaged in complex analyses. But for
nonspecialists, the story is worth remembering. It should make you more
skeptical, insofar as you understand that such enterprises are not as elegant
and preordained as authors (including us) sometimes make it sound. But the
story can also give you some additional confidence, insofar as, when you
find yourself wondering whether we considered such-and-such an alterna-
tive way of looking at the data, the chances are fairly good that we did.
22. In passing, it just isn't so for blacks either. The independent roles of poverty
and socioeconomic status are almost exactly the same for blacks in the
NLSY as for whites. See Chapter 14.
Chupter 6
1. Kronick and Hargis 1990.
2. For a discussion of definitional issues in measuring the dropout rate, see
Kominski 1990.
3. Most people get their high school degrees or equivalences later than at the
age of 17, so the figure on page 144 implicitly overestimates the propor-
tion of dropouts in the population as a whole, at least for recent times. In
1985, the U.S. Government Accounting Office estimated that 13 percent
of the population between the ages of 16 and 24 could be characterized as
school dropouts, which amounted to 4.3 million people (cited by Hahn
and Lefkowitz 1987; Kronick and Hargis 1990). Dropout rates in some
locales may differ markedly from the national averages. In Boston, for
example, dropping out of the public schools (as distinguished from losses
due to transferring out of the school system) has recently risen above 45
percent (Camayd-Freixas and Horst 1987).
4. In 1990, the percentage of persons ages 25 to 29 who had completed four
years of high school or more was 85.7 percent, higher than the plotted
"graduation ratio," which is based on 1 7-year-olds (National Center for
Education 1992, Table 8).
5. Quoted in Clignet 1974, p. 38. See Chapter 22 for additional discussion.
6. Tildsley 1936, p. 89.
The Messy Reality of Research
- The authors detail the iterative process of refining socioeconomic status (SES) indices to ensure statistical robustness and theoretical satisfaction.
- Multiple variables, including gender, marital status, and alternative definitions of poverty, were tested to confirm that the core interpretations remained consistent.
- The researchers cross-referenced regression analyses with frequency distributions and sample weights to identify any hidden anomalies or 'gnomes' in the data.
- A candid admission is made that social science research is often less elegant and preordained than the final published accounts suggest.
- The text provides specific context on high school dropout rates, noting that national averages often mask extreme local variations, such as those found in Boston.
- The authors argue that their exhaustive testing should give readers confidence that most alternative explanations for the data were likely considered.
Throughout all of these regression analyses, we were also looking at cross-tabulations and frequency distributions to try to see what gnomes might be lurking in the regression coefficients.
Notes to pages 141-145
693
to 22.4 percent for children under 15. U.S. Bureau of the Census, 1992,
Table 1.
15. For an analysis of the demographic reasons and some measurement issues,
see Smith 1989.
16. U.S. Bureau of the Census 1992, Table C, p. xiv.
17. U.S. Bureau of the Census 1992, Table C, p. xiv.
18. Eggebeen and Lichter 1991; Smith 1989.
19. Given childless white men and women of average age, socioeconomic
background, and IQ, the expected poverty rates are only 1.6 percentage
points apart and are exceedingly low in both cases: 3.1 and 4.7 percent, re-
spectively.
20. The relationships of IQ to poverty were statistically significant beyond the
.01 level for both married and unmarried women. Our policy throughout
the book is not routinely to report significance statistics, hut at the same
time not to present any relationship as being substantively significant iln-
less we know that it also is statistically significant.
2 1. An entire draft of the hook was written using a different measure of IQ. As
described in Appendix 3, the armed forces changed the scoring system for
the AFQT in 1989. The first draft was written using the old version. Af-
ter discussing the merits of the old and new measures at length, we decided
to switch to the new one, because, for arcane reasons, it is psychometri-
cally superior. The substantive effects of this change on the conclusions in
the book are, as far as we can tell, effectively nil. All of the analyses have
also been repeated with two versions of the SES index, and many of them
with three. Again, the three versions yielded substantively indistinguish-
able results. But each of the successive versions of the SES index was, in
our judgment, a theoretically more satisfying and statistically more rohust
way of capturing the construct of "socioeconomic status."
Regarding the specific analysis of the role of gender and marital status
in mediating the relationship between IQ and poverty: Originally, the
analysis (and the graphic included in the text on page 138) was hased on
married/unmarried, menlwomen. Then we looked more closely at women
and their various marital situations, then at those marital situations for
women with children. All of the poverty analyses were conducted with two
measures of poverty: the official definition (represented in this book), and
a definition based on cash income obtained from sources other than
government transfers. We decided to present the results using the official
definition to avoid an extra layer of explanation, hut we have the comfort
of knowing that the interpretation fits both definitions, except for a few
nuances that are not important enough to warrant a place in this concise
an account. We have conducted some of these analyses for age-restricted
samples, to see if things change for older cohorts in ways that are not
captured by using age as an independent variable in the regression equa-
tion. Throughout all of these regression analyses, we were also looking at
cross-tabulations and frequency distributions to try to see what gnomes
might he lurking in the regression coefficients. Finally, we duplicated all
of the analyses you see with and without sample weights, to ensure that
there were no marked, mysterious differences in the two sets of results.
There were undoubtedly other iterations and variations that we have
forgotten over the last four years.
None of this will be surprising to our colleagues, for the process we have
described is SOP for social scientists engaged in complex analyses. But for
nonspecialists, the story is worth remembering. It should make you more
skeptical, insofar as you understand that such enterprises are not as elegant
and preordained as authors (including us) sometimes make it sound. But the
story can also give you some additional confidence, insofar as, when you
find yourself wondering whether we considered such-and-such an alterna-
tive way of looking at the data, the chances are fairly good that we did.
22. In passing, it just isn't so for blacks either. The independent roles of poverty
and socioeconomic status are almost exactly the same for blacks in the
NLSY as for whites. See Chapter 14.
Chupter 6
1. Kronick and Hargis 1990.
2. For a discussion of definitional issues in measuring the dropout rate, see
Kominski 1990.
3. Most people get their high school degrees or equivalences later than at the
age of 17, so the figure on page 144 implicitly overestimates the propor-
tion of dropouts in the population as a whole, at least for recent times. In
1985, the U.S. Government Accounting Office estimated that 13 percent
of the population between the ages of 16 and 24 could be characterized as
school dropouts, which amounted to 4.3 million people (cited by Hahn
and Lefkowitz 1987; Kronick and Hargis 1990). Dropout rates in some
locales may differ markedly from the national averages. In Boston, for
example, dropping out of the public schools (as distinguished from losses
due to transferring out of the school system) has recently risen above 45
percent (Camayd-Freixas and Horst 1987).
4. In 1990, the percentage of persons ages 25 to 29 who had completed four
years of high school or more was 85.7 percent, higher than the plotted
"graduation ratio," which is based on 1 7-year-olds (National Center for
Education 1992, Table 8).
5. Quoted in Clignet 1974, p. 38. See Chapter 22 for additional discussion.
6. Tildsley 1936, p. 89.
IQ and High School Completion
- Historical data from the 1920s and 30s suggests a relatively small IQ gap of less than 7.5 points between high school dropouts and graduates.
- A significant correlation of +.66 between IQ and highest grade completed was observed in urban settings like New York City during the 1930s.
- By the mid-20th century, the gap between dropouts and graduates widened significantly, reaching approximately 1.05 standard deviations.
- Researchers addressed the 'cause and effect' debate by testing whether staying in school itself raises IQ scores, concluding that school presence is not the decisive factor.
- Analyses using age-equated scores and restricted samples of younger youths confirm that the observed IQ differences are not merely artifacts of additional schooling.
In the late 1960s, the Youth in Transition study found a difference of about .8 SDs on the vocabulary subtest of the GATB and the Gates Reading Tests between dropouts and nondropouts.
694
Notes to pages 145-147
7. These numbers represent an unweighted mean of the six studies of ninth
graders and the nine studies of students who were either seniors or gradu-
ates. When sample sizes are taken into account, the (weighted) means for
the two groups are 104.2 and 105.5 (Finch 1946, Table I, pp. 28-29). This
may understate the degree of difference between the dropout and the high
school senior. Other studies indicate that within any given school, a sta-
tistical relationship existed between IQ and the likelihood offinishing high
school. In urban areas, the size of the correlation itself could he substan-
tial. In one of the best such studies, Lorge found for the city of New York
in the 1930s that the correlation of IQ with highest completed grade was
+.66 (Lorge 1942). Some of the individual studies of specific high schools
conducted during that period reviewed by Finch also showed larger differ-
ences. But those studies tended to be subject to a numher of technical er-
rors. Even giving substantial weight to them, the difference between the
mean IQ of the high school dropout and youths who made it to the senior
year during the 1920s was considerably less than half a standard deviation
(7.5 IQ points). Perhaps children who dropped out before the ninth grade
had somewhat lower IQs, so that the overall difference between diploma
holders and dropouts was larger than the difference between ninth graders
and twelfth graders. The data on this issue for the first half of the century
are fragmentary, however.
8. If a third dropped out between ninth grade and twelfth grade, their aver-
age IQ must have been 101, compared to 107 for the seniors and ~radu-
ates; if half dropped out, it must have been 103. Assuming a population
average of 100, this implies that those who dropped out prior to ninth grade
had still lower scores than those who dropped out afterward.
9. Iowa State Department of Public Instruction, 1965.
10. Dillon 1949, quoted in Jensen 1980, p. 334.
1 I. Based on a comparison of the academic aptitude scores of the ninth gr. 1 ers
in the sample who had and had not graduated from high schcwl five yearb
later. The IQ equivalents are computed from a graduate-dropout gap of
1.14 standard deviations (SDs) for boys and 1.00 SDs for girls, or approx-
imately 1.05 SDs overall (Wise et al. 1977, Table A-3). In the late 1960s,
the Youth in Transition study found a difference of about .8 SDs on the vo-
cabulary subtest of the GATB and the Gates Reading Tests between
dropouts and nondropouts, consistent with a 1 SDdifference on a full-scale
battery of tests (reconstructed from Table 6-1, p. 100, and Tables C-3-7 and
C-3-8 in Bachman et al. 1971).
12. Looking at these numbers, some readers will be wondering how much these
dropout figures represent cause and how much effect. After all, wouldn't a
person who stayed through high school and then took the IQ test have got-
ten a higher score by virtue of staying in high school? This question of cause
and effect may he raised with all of the topics using the NLSY, hut it is most
obvious for school dropout. But while age has an effect on AFQT scores
and is always taken into account (either through age-equated scores in the
descriptive statistics or by entering age as an independent variable in the
regression analyses), there is no reason to think that presence in school is
decisive. The simplest way to document this is by replicating the analyses
for a restricted sample of youths who were age 16 and under when they
took the test, thereby excluding almost all of the members of the sample
who might create these artifacts. Having done so for all of the results re-
ported in this chapter, we may report that it makes no difference in terms
of interpretations. We will not present all of these duplicate results, but an
example will illustrate.
Using the full sample of whites, the mean IQs, expressed in standard
scores, of those who completed high school via the normal route, those
who got a high school equivalency, and those who dropped out perma-
nently were +.37, -.14, and -.94 respectively. For whites who took the
AFQT before they were age 17, the comparable means were +.34, -.04,
and -.95. The main effect of using the age-restricted sample is drastically
to reduce sample sizes, which we judged to he an unnecessary sacrifice. The
NLSY data are consistent with other investigations of this issue (e.g.,
Hush and Tuijnman 1991). Continued schooling makes a modest
contribution to intellectual capital but not enough to make much differ-
ence in the basic relationships linking IQ to other outcomes, Chapter 17
specifically discusses the impact of schooling on IQ, and Appendix 3 elab-
orates on the relationship of schooling to I Q in the NLSY.
13. Other data confirm this general picture. In the High School and Beyond
national sample conducted by the Department of Education in 1980, it was
found that those in the lowest quartile on the cognitive ability test dropped
out at a rate of 26.5 percent, compared to 14.7 percent, 7.8 percent, and
3.2 percent in the next three quartiles, respectively (Barro and Kolstad
1987, Table 6.1, p. 46). Similar results have been found in other recent
studies of dropouts and cognitive ability (e.g., Alexander et al. 1985; Hill
1979). Comparable rates of dropping out across the 1Q categories and
across categories defined by vocabulary test scores were also found in the
earlier Youth in Transition study, based on approximately 2,000 men
selected to be representative of the national population in the tenth grade
in 1967 (Bachman et al. 1971). For an estimate of the loss in cognitive
ability that may be attributed to dropout itself, see Alexander et al. 1985.
14. The General Educational Development exam is administered by the
American Council on Education.
IQ and Educational Attainment
- Statistical analysis shows a strong correlation between cognitive ability and the likelihood of completing high school.
- Data from the NLSY and other national samples indicate that dropout rates decrease significantly as IQ quartiles increase.
- While continued schooling contributes to intellectual capital, it does not fundamentally alter the relationship between IQ and life outcomes.
- The GED population is often characterized by individuals who struggled with school routines or came from deprived backgrounds.
- Among specific demographics, such as black permanent dropouts in the NLSY, almost none were found in the top quartile of IQ.
- Logistic regression models suggest that IQ is a more powerful predictor of high school graduation than socioeconomic status.
Continued schooling makes a modest contribution to intellectual capital but not enough to make much difference in the basic relationships linking IQ to other outcomes.
694
Notes to pages 145-147
7. These numbers represent an unweighted mean of the six studies of ninth
graders and the nine studies of students who were either seniors or gradu-
ates. When sample sizes are taken into account, the (weighted) means for
the two groups are 104.2 and 105.5 (Finch 1946, Table I, pp. 28-29). This
may understate the degree of difference between the dropout and the high
school senior. Other studies indicate that within any given school, a sta-
tistical relationship existed between IQ and the likelihood offinishing high
school. In urban areas, the size of the correlation itself could he substan-
tial. In one of the best such studies, Lorge found for the city of New York
in the 1930s that the correlation of IQ with highest completed grade was
+.66 (Lorge 1942). Some of the individual studies of specific high schools
conducted during that period reviewed by Finch also showed larger differ-
ences. But those studies tended to be subject to a numher of technical er-
rors. Even giving substantial weight to them, the difference between the
mean IQ of the high school dropout and youths who made it to the senior
year during the 1920s was considerably less than half a standard deviation
(7.5 IQ points). Perhaps children who dropped out before the ninth grade
had somewhat lower IQs, so that the overall difference between diploma
holders and dropouts was larger than the difference between ninth graders
and twelfth graders. The data on this issue for the first half of the century
are fragmentary, however.
8. If a third dropped out between ninth grade and twelfth grade, their aver-
age IQ must have been 101, compared to 107 for the seniors and ~radu-
ates; if half dropped out, it must have been 103. Assuming a population
average of 100, this implies that those who dropped out prior to ninth grade
had still lower scores than those who dropped out afterward.
9. Iowa State Department of Public Instruction, 1965.
10. Dillon 1949, quoted in Jensen 1980, p. 334.
1 I. Based on a comparison of the academic aptitude scores of the ninth gr. 1 ers
in the sample who had and had not graduated from high schcwl five yearb
later. The IQ equivalents are computed from a graduate-dropout gap of
1.14 standard deviations (SDs) for boys and 1.00 SDs for girls, or approx-
imately 1.05 SDs overall (Wise et al. 1977, Table A-3). In the late 1960s,
the Youth in Transition study found a difference of about .8 SDs on the vo-
cabulary subtest of the GATB and the Gates Reading Tests between
dropouts and nondropouts, consistent with a 1 SDdifference on a full-scale
battery of tests (reconstructed from Table 6-1, p. 100, and Tables C-3-7 and
C-3-8 in Bachman et al. 1971).
12. Looking at these numbers, some readers will be wondering how much these
dropout figures represent cause and how much effect. After all, wouldn't a
person who stayed through high school and then took the IQ test have got-
ten a higher score by virtue of staying in high school? This question of cause
and effect may he raised with all of the topics using the NLSY, hut it is most
obvious for school dropout. But while age has an effect on AFQT scores
and is always taken into account (either through age-equated scores in the
descriptive statistics or by entering age as an independent variable in the
regression analyses), there is no reason to think that presence in school is
decisive. The simplest way to document this is by replicating the analyses
for a restricted sample of youths who were age 16 and under when they
took the test, thereby excluding almost all of the members of the sample
who might create these artifacts. Having done so for all of the results re-
ported in this chapter, we may report that it makes no difference in terms
of interpretations. We will not present all of these duplicate results, but an
example will illustrate.
Using the full sample of whites, the mean IQs, expressed in standard
scores, of those who completed high school via the normal route, those
who got a high school equivalency, and those who dropped out perma-
nently were +.37, -.14, and -.94 respectively. For whites who took the
AFQT before they were age 17, the comparable means were +.34, -.04,
and -.95. The main effect of using the age-restricted sample is drastically
to reduce sample sizes, which we judged to he an unnecessary sacrifice. The
NLSY data are consistent with other investigations of this issue (e.g.,
Hush and Tuijnman 1991). Continued schooling makes a modest
contribution to intellectual capital but not enough to make much differ-
ence in the basic relationships linking IQ to other outcomes, Chapter 17
specifically discusses the impact of schooling on IQ, and Appendix 3 elab-
orates on the relationship of schooling to I Q in the NLSY.
13. Other data confirm this general picture. In the High School and Beyond
national sample conducted by the Department of Education in 1980, it was
found that those in the lowest quartile on the cognitive ability test dropped
out at a rate of 26.5 percent, compared to 14.7 percent, 7.8 percent, and
3.2 percent in the next three quartiles, respectively (Barro and Kolstad
1987, Table 6.1, p. 46). Similar results have been found in other recent
studies of dropouts and cognitive ability (e.g., Alexander et al. 1985; Hill
1979). Comparable rates of dropping out across the 1Q categories and
across categories defined by vocabulary test scores were also found in the
earlier Youth in Transition study, based on approximately 2,000 men
selected to be representative of the national population in the tenth grade
in 1967 (Bachman et al. 1971). For an estimate of the loss in cognitive
ability that may be attributed to dropout itself, see Alexander et al. 1985.
14. The General Educational Development exam is administered by the
American Council on Education.
696
NOES to pages 147-1 57
Notes to pages 158-1 62
697
15. Cameron and Heckman 1992.
16. DES 1991, Tables 95, 97. In the NLSY, 9.5 percent of those classified as
having a high school education got their certification through the GED.
17. As depicted in, for example, Coles 1967, in his work on certain impover-
ished populations. The relative roles of socioeconomic background and IQ
found in the NLSY are roughly comparable to those found for the Youth
in Transition study based on students in the late 1960s, though the method
of presentation in that study does not lend itself to a precise comparison
(Bachman et al. 1971, Chap. 4-6).
18. In passing, it may be noted that these results hold true for blacks as well.
Of the blacks in the NLSY who permanently dropped out of school, none
was in the top quartile of IQ. Only nine-tenths of 1 percent of black per-
manent dropouts were in the top half of IQ and the bottom half of SES.
See Chapter 14 as well.
19. In a logistic regression, with all independent variables expressed as stan-
dard scores, the coefficients for IQ, SES, Age, and the SES x IQ interac-
tion term were 1.91, .98, -.06, and .32, respectively. The intercept was
2.81. The interaction term was significant at the .005 level, and rZ = .38.
The equation is predicting "true" for a binary variable denoting high school
graduation (with permanent dropout as the "false" state).
20. Press accounts of the GED population suggest that the typical youngster
in it had trouble with the routine of ordinary school and comes from un-
commonly deprived family circumstances (e.g., Marriot 1993).
21. Matarazzo 1972, pp. 178-180.
22. The percentages were 68 and 23, respectively.
Chapter 7
1. The figure on page 156 also echoes some of the large macroeconomic forces
that we did discuss in preceding chapters. To some extent, the pool of
"16-19-year-olds not in school" has changed as high schools have retained
more students longer and colleges have recruited larger numbers of the
brightest into college. As the pool has changed, so perhaps has the em-
ployability of its members. The greater employment problems shown by
the figure also fit in with the discussion about earnings in Chapter 4 and
the way in which income has stagnated or fallen for those without college
educations. For concise reviews of the empirical literature on labor supply
and unemployment, see Heckman 1993; Topel 1993. Studies focused on
young disadvantaged men include Wolpin 1992; Cogan 1982; Bluestone
and Harrison 1988; Cohen 1973; Holzer 1986. There is, of course, a large
literature devoted explicitly to blacks. See Chapters 14 and 20.
2. We conducted parallel analyses with a sample based on the most recent
year of observation (back to 1984), which enabled us to include data on
some men who were being followed earlier but subsequently disappeared
from the NLSY sample. The purpose was to compensate for a potential
source of attrition bias, on the assumption that men who disappeared from
the NLSY sample might be weighted to some degree toward those with the
fewest connections to a fixed address and (by the same token) to the labor
market. The results obtained by this method were substantively indistin-
guishable from the ones reported.
3. We replicated all of the analyses using the actual number of weeks out of
the labor force as the dependent variable instead of a binary yes-no mea-
sure of whether any time was spent out of the labor force. The relative roles
of the independent variables were the same as in the reported analyses,
with similar comparative magnitudes as well as the same signs and levels
of statistical significance. The relationship, such as it is, does not seem to
be concentrated among the children of the very wealthy.
4. A more fine-grained examination of the data reveals that absence from the
labor force and job disabilities is extraordinarily concentrated within a lim-
ited set of the lowest-status jobs. Using a well-known index of job prestige,
the Duncan index, 46 percent of the reports of job limitations and 63 per-
cent of those who reported being prevented from working (but who were
still listing an occupation) came from jobs scored 1 to 19 on the Duncan
scale, which ranges from 1 to 100. A total of 975 white men in the NLSY
listed such a job as their occupation in 1990. The five most common jobs
in this range, accounting for 35 percent of the total, were truck driver, au-
tomobile mechanic, construction laborer, carpenter, and janitor. Another
299 white males working in blue-collar jobs scored 20 to 29 on the Dun-
can scale. The five most common jobs in this range, accounting for 37 per-
cent of the total, were welder, heavy equipment mechanic, other mechanic
and repairman, brick mason, and farmer. Another 158 white males were
working in blue-collar jobs scored 30 to 39 o n the scale. The five most com-
mon jobs in this range, accounting for 47 percent of the total, were deliv-
ery man, plumber and pipefitter, machinist, sheet metal worker, and
f' ireman.
Looking over these jobs, it is not readily apparent that the lowest-rated
jobs in terms of prestige are also the physically most dangerous or de-
manding. construction work fits that description in the lowest category,
but so does fireman, sheet metal worker, and others in the higher cate-
gories. Meanwhile, some of jobs in the lowest category (e.g., truck driver,
janitor) are not self-evidently more dangerous or physically demanding
than some jobs in the higher categories. Or to put it another way: If a third
Labor Supply and Job Prestige
- The pool of non-college-educated workers has changed as more high-ability individuals pursue higher education, potentially impacting the employability of those remaining.
- Economic data shows stagnating or falling incomes for those without college degrees, aligning with broader labor supply and unemployment trends.
- Researchers addressed potential attrition bias by analyzing men who disappeared from the NLSY sample, finding that their absence did not substantively alter the results.
- Labor force absence and reported job disabilities are heavily concentrated in low-prestige occupations, specifically those scoring below 20 on the Duncan index.
- Common low-status jobs associated with work limitations include truck drivers, janitors, and construction laborers, though these are not always the most physically demanding roles.
- The data suggests that the correlation between low job prestige and work disability is not strictly a function of physical danger or the necessity of fitness.
A more fine-grained examination of the data reveals that absence from the labor force and job disabilities is extraordinarily concentrated within a limited set of the lowest-status jobs.
696
NOES to pages 147-1 57
Notes to pages 158-1 62
697
15. Cameron and Heckman 1992.
16. DES 1991, Tables 95, 97. In the NLSY, 9.5 percent of those classified as
having a high school education got their certification through the GED.
17. As depicted in, for example, Coles 1967, in his work on certain impover-
ished populations. The relative roles of socioeconomic background and IQ
found in the NLSY are roughly comparable to those found for the Youth
in Transition study based on students in the late 1960s, though the method
of presentation in that study does not lend itself to a precise comparison
(Bachman et al. 1971, Chap. 4-6).
18. In passing, it may be noted that these results hold true for blacks as well.
Of the blacks in the NLSY who permanently dropped out of school, none
was in the top quartile of IQ. Only nine-tenths of 1 percent of black per-
manent dropouts were in the top half of IQ and the bottom half of SES.
See Chapter 14 as well.
19. In a logistic regression, with all independent variables expressed as stan-
dard scores, the coefficients for IQ, SES, Age, and the SES x IQ interac-
tion term were 1.91, .98, -.06, and .32, respectively. The intercept was
2.81. The interaction term was significant at the .005 level, and rZ = .38.
The equation is predicting "true" for a binary variable denoting high school
graduation (with permanent dropout as the "false" state).
20. Press accounts of the GED population suggest that the typical youngster
in it had trouble with the routine of ordinary school and comes from un-
commonly deprived family circumstances (e.g., Marriot 1993).
21. Matarazzo 1972, pp. 178-180.
22. The percentages were 68 and 23, respectively.
Chapter 7
1. The figure on page 156 also echoes some of the large macroeconomic forces
that we did discuss in preceding chapters. To some extent, the pool of
"16-19-year-olds not in school" has changed as high schools have retained
more students longer and colleges have recruited larger numbers of the
brightest into college. As the pool has changed, so perhaps has the em-
ployability of its members. The greater employment problems shown by
the figure also fit in with the discussion about earnings in Chapter 4 and
the way in which income has stagnated or fallen for those without college
educations. For concise reviews of the empirical literature on labor supply
and unemployment, see Heckman 1993; Topel 1993. Studies focused on
young disadvantaged men include Wolpin 1992; Cogan 1982; Bluestone
and Harrison 1988; Cohen 1973; Holzer 1986. There is, of course, a large
literature devoted explicitly to blacks. See Chapters 14 and 20.
2. We conducted parallel analyses with a sample based on the most recent
year of observation (back to 1984), which enabled us to include data on
some men who were being followed earlier but subsequently disappeared
from the NLSY sample. The purpose was to compensate for a potential
source of attrition bias, on the assumption that men who disappeared from
the NLSY sample might be weighted to some degree toward those with the
fewest connections to a fixed address and (by the same token) to the labor
market. The results obtained by this method were substantively indistin-
guishable from the ones reported.
3. We replicated all of the analyses using the actual number of weeks out of
the labor force as the dependent variable instead of a binary yes-no mea-
sure of whether any time was spent out of the labor force. The relative roles
of the independent variables were the same as in the reported analyses,
with similar comparative magnitudes as well as the same signs and levels
of statistical significance. The relationship, such as it is, does not seem to
be concentrated among the children of the very wealthy.
4. A more fine-grained examination of the data reveals that absence from the
labor force and job disabilities is extraordinarily concentrated within a lim-
ited set of the lowest-status jobs. Using a well-known index of job prestige,
the Duncan index, 46 percent of the reports of job limitations and 63 per-
cent of those who reported being prevented from working (but who were
still listing an occupation) came from jobs scored 1 to 19 on the Duncan
scale, which ranges from 1 to 100. A total of 975 white men in the NLSY
listed such a job as their occupation in 1990. The five most common jobs
in this range, accounting for 35 percent of the total, were truck driver, au-
tomobile mechanic, construction laborer, carpenter, and janitor. Another
299 white males working in blue-collar jobs scored 20 to 29 on the Dun-
can scale. The five most common jobs in this range, accounting for 37 per-
cent of the total, were welder, heavy equipment mechanic, other mechanic
and repairman, brick mason, and farmer. Another 158 white males were
working in blue-collar jobs scored 30 to 39 o n the scale. The five most com-
mon jobs in this range, accounting for 47 percent of the total, were deliv-
ery man, plumber and pipefitter, machinist, sheet metal worker, and
f' ireman.
Looking over these jobs, it is not readily apparent that the lowest-rated
jobs in terms of prestige are also the physically most dangerous or de-
manding. construction work fits that description in the lowest category,
but so does fireman, sheet metal worker, and others in the higher cate-
gories. Meanwhile, some of jobs in the lowest category (e.g., truck driver,
janitor) are not self-evidently more dangerous or physically demanding
than some jobs in the higher categories. Or to put it another way: If a third
698
NotestopagesJ62-165
party were given these fifteen job titles and told to rank them in terms of
potential accidents and the importance of physical fitness, it is unlikely
that the list would also be rank-ordered according to the job prestige in-
dex or even that the rank ordering would have much of a positive corre-
lation with the job prestige index.
Instead, the index was created based on the pay and training that the
jobs entail-both
of which would tend to give higher ratings to cognitively
more demanding jobs. And so indeed it works out. Here are the mean IQ
scores of white males in blue-collar jobs, subdivided by groups on the
Duncan scale, alongside the number per 1,000 who reported some fc~rm of
job-related health limitation in 1989:
Duncan Scale Score
(Limited to Blue Collar
Occupations)
0-9
10-19
20-29
30-39
40-49
No. per 1,000
Mean IQ
with Job-Related
Percentile
Health Disability
35th
5 2
40th
55
48th
3 2
56th
26
59th
16
In short, the results of the regression analysis indicating that IQ has an
important relationship to job disability even among blue-collar jobs, and
even after taking age and years of education into account, are not explained
away by the differences in the physical risks of these occupations. The same
conclusion holds true when the analysis is conducted only for blue-collar
workers and the variable "years of education" is added to the equatton. The
coefficient relating IQ to likelihood of disability is about four times the cn-
efficient for years of education (with age as the other independent variahle
constant). Intriguingly, the opposite is true when the analysis is conducted
just for white-collar workers: Years of education is important, wiplng out
any independent role for IQ. Interpreting this is difficult, both because
health disability is such a rare phenomenon among white-collar workers
and because IQ becomes so tightly linked to advanced education, whtch
in turn is associated with jobs in which physical disability is virtually ir-
relevant (short of a stroke or other accident causing a mental impairment).
5. Terman and Oden 1947.
6. H1ll1980; Mayerand Treat 1977; O'Toole 1990; Smithand Kirkham 1982.
7. Grossman 1976; K~tagawa and Hauser 1960.
8. Restriction of range (see Chapter 3) might also reduce the independent
role of IQ among college graduates.
Notes to pages 1 68-1 76
699
Chapter 8
1 . For a review of the literature about family decline, see Popenoe 1993.
2. U.S. Bureau of the Census 1992, Table 5 1 .
3. Retherford 1986.
4. Garrison 1968; James 1989.
5. The cognitive elite did get married at somewhat older ages than others,
and this difference will grow as the NLSY cohort gets older. Judging from
other data, almost all of those in the bottom half of the IQ distribution
who will ever marry have already married by 30, whereas many of that 29
percent unmarried in Class 1 will eventually marry, raising their mean age
of marriage by some unknown amount. If all of them married at, say, age
40, the average age at marriage would approach 30, which may be taken
;IS the highest mean that the NLSY could plausibly produce as it follows
its sample into middle age.
6. In his famous lifetime study of intellectually gifted children born around
1910, Lewis Terman found that, as of the 1930s and 1940, highly gifted
Inen eventually got married at higher rates than the national norms-
about 84 percent, compared to a national rate of 67 percent for men of sim-
ilar age. Gifted women married later than the average woman, but by their
mid-30s they too had higher marriage rates than the general population,
though the difference was not as great as for men: 84 percent compared to
78 percent (Terman and Oden 1947, p. 227).
7. Cherlin 1981, Figure 1-5. His estimation procedure suggests that the odds
of eventual divorce in 1980 were 54 percent. Also see Raschke 1987.
8. We are here calculating odds mtios-the
likelihood of marital survival di-
vided by the likelihood of divorce within the first five years-from
the table
on page 174. The ratio of odds ratios for marital survival versus divorce dur-
tng the first five years of marriage was 2.7, comparing Class I to Class V.
9. In addition to the standard variables (age, parental socioeconomic status,
and IQ), we added "date of first marriage." We wished to add age at first
marriage as well, but it was so highly correlated with the date of first mar-
riage in the entire white sample (r = +.81) that the two variables could not
be used together. It was possible to use them together in some of the sub-
samples we analyzed. The pattern of results was unchanged.
10. Different subsets of white youths, both the entire sample of those who had
married and the subset of those who had reached the age of 30, and the
subset below the age of 30 all yielded similar results.
11. E.g. Raschke 1987; Sweet and Rumpass 1987.
12. Higher socioeconomic status is also associated with a lower probability of
divorce in the college sample, though the independent effect of parental
SES is much smaller than the independent effect of IQ. Socioeconomic
IQ and Occupational Disability
- The text examines the relationship between IQ and job-related health disabilities, specifically within blue-collar occupations.
- Data shows a clear inverse correlation: as mean IQ percentiles rise across the Duncan Scale, the number of job-related health limitations per 1,000 workers decreases significantly.
- Regression analysis suggests that IQ is a stronger predictor of disability in blue-collar jobs than years of education, even when controlling for age.
- In white-collar professions, the independent role of IQ disappears, largely because IQ and advanced education are so closely linked in those fields.
- The physical risks of specific blue-collar jobs do not fully explain the higher disability rates among those with lower cognitive scores.
- Historical data from the Terman study indicates that high-IQ individuals eventually marry at higher rates than the national average, despite marrying later in life.
The coefficient relating IQ to likelihood of disability is about four times the coefficient for years of education.
698
NotestopagesJ62-165
party were given these fifteen job titles and told to rank them in terms of
potential accidents and the importance of physical fitness, it is unlikely
that the list would also be rank-ordered according to the job prestige in-
dex or even that the rank ordering would have much of a positive corre-
lation with the job prestige index.
Instead, the index was created based on the pay and training that the
jobs entail-both
of which would tend to give higher ratings to cognitively
more demanding jobs. And so indeed it works out. Here are the mean IQ
scores of white males in blue-collar jobs, subdivided by groups on the
Duncan scale, alongside the number per 1,000 who reported some fc~rm of
job-related health limitation in 1989:
Duncan Scale Score
(Limited to Blue Collar
Occupations)
0-9
10-19
20-29
30-39
40-49
No. per 1,000
Mean IQ
with Job-Related
Percentile
Health Disability
35th
5 2
40th
55
48th
3 2
56th
26
59th
16
In short, the results of the regression analysis indicating that IQ has an
important relationship to job disability even among blue-collar jobs, and
even after taking age and years of education into account, are not explained
away by the differences in the physical risks of these occupations. The same
conclusion holds true when the analysis is conducted only for blue-collar
workers and the variable "years of education" is added to the equatton. The
coefficient relating IQ to likelihood of disability is about four times the cn-
efficient for years of education (with age as the other independent variahle
constant). Intriguingly, the opposite is true when the analysis is conducted
just for white-collar workers: Years of education is important, wiplng out
any independent role for IQ. Interpreting this is difficult, both because
health disability is such a rare phenomenon among white-collar workers
and because IQ becomes so tightly linked to advanced education, whtch
in turn is associated with jobs in which physical disability is virtually ir-
relevant (short of a stroke or other accident causing a mental impairment).
5. Terman and Oden 1947.
6. H1ll1980; Mayerand Treat 1977; O'Toole 1990; Smithand Kirkham 1982.
7. Grossman 1976; K~tagawa and Hauser 1960.
8. Restriction of range (see Chapter 3) might also reduce the independent
role of IQ among college graduates.
Notes to pages 1 68-1 76
699
Chapter 8
1 . For a review of the literature about family decline, see Popenoe 1993.
2. U.S. Bureau of the Census 1992, Table 5 1 .
3. Retherford 1986.
4. Garrison 1968; James 1989.
5. The cognitive elite did get married at somewhat older ages than others,
and this difference will grow as the NLSY cohort gets older. Judging from
other data, almost all of those in the bottom half of the IQ distribution
who will ever marry have already married by 30, whereas many of that 29
percent unmarried in Class 1 will eventually marry, raising their mean age
of marriage by some unknown amount. If all of them married at, say, age
40, the average age at marriage would approach 30, which may be taken
;IS the highest mean that the NLSY could plausibly produce as it follows
its sample into middle age.
6. In his famous lifetime study of intellectually gifted children born around
1910, Lewis Terman found that, as of the 1930s and 1940, highly gifted
Inen eventually got married at higher rates than the national norms-
about 84 percent, compared to a national rate of 67 percent for men of sim-
ilar age. Gifted women married later than the average woman, but by their
mid-30s they too had higher marriage rates than the general population,
though the difference was not as great as for men: 84 percent compared to
78 percent (Terman and Oden 1947, p. 227).
7. Cherlin 1981, Figure 1-5. His estimation procedure suggests that the odds
of eventual divorce in 1980 were 54 percent. Also see Raschke 1987.
8. We are here calculating odds mtios-the
likelihood of marital survival di-
vided by the likelihood of divorce within the first five years-from
the table
on page 174. The ratio of odds ratios for marital survival versus divorce dur-
tng the first five years of marriage was 2.7, comparing Class I to Class V.
9. In addition to the standard variables (age, parental socioeconomic status,
and IQ), we added "date of first marriage." We wished to add age at first
marriage as well, but it was so highly correlated with the date of first mar-
riage in the entire white sample (r = +.81) that the two variables could not
be used together. It was possible to use them together in some of the sub-
samples we analyzed. The pattern of results was unchanged.
10. Different subsets of white youths, both the entire sample of those who had
married and the subset of those who had reached the age of 30, and the
subset below the age of 30 all yielded similar results.
11. E.g. Raschke 1987; Sweet and Rumpass 1987.
12. Higher socioeconomic status is also associated with a lower probability of
divorce in the college sample, though the independent effect of parental
SES is much smaller than the independent effect of IQ. Socioeconomic
Socioeconomic Factors in Marital Stability
- Statistical analysis reveals a significant gap in marital survival rates between the highest and lowest social classes during the first five years of marriage.
- The relationship between IQ and divorce varies by education level, showing a strong correlation for college graduates but little impact for high school graduates.
- Research suggests a potential genetic component to divorce, noting that identical twins share more similar divorce outcomes than fraternal twins.
- The text highlights a massive increase in the number of never-married mothers between 1960 and 1980, growing from 73,000 to over one million.
- Methodological issues in tracking illegitimacy are discussed, specifically how shifting marital patterns can confound the calculation of birth rates versus ratios.
IQ makes a lot of difference in whether high school graduates get married but not in whether they get divorced.
698
NotestopagesJ62-165
party were given these fifteen job titles and told to rank them in terms of
potential accidents and the importance of physical fitness, it is unlikely
that the list would also be rank-ordered according to the job prestige in-
dex or even that the rank ordering would have much of a positive corre-
lation with the job prestige index.
Instead, the index was created based on the pay and training that the
jobs entail-both
of which would tend to give higher ratings to cognitively
more demanding jobs. And so indeed it works out. Here are the mean IQ
scores of white males in blue-collar jobs, subdivided by groups on the
Duncan scale, alongside the number per 1,000 who reported some fc~rm of
job-related health limitation in 1989:
Duncan Scale Score
(Limited to Blue Collar
Occupations)
0-9
10-19
20-29
30-39
40-49
No. per 1,000
Mean IQ
with Job-Related
Percentile
Health Disability
35th
5 2
40th
55
48th
3 2
56th
26
59th
16
In short, the results of the regression analysis indicating that IQ has an
important relationship to job disability even among blue-collar jobs, and
even after taking age and years of education into account, are not explained
away by the differences in the physical risks of these occupations. The same
conclusion holds true when the analysis is conducted only for blue-collar
workers and the variable "years of education" is added to the equatton. The
coefficient relating IQ to likelihood of disability is about four times the cn-
efficient for years of education (with age as the other independent variahle
constant). Intriguingly, the opposite is true when the analysis is conducted
just for white-collar workers: Years of education is important, wiplng out
any independent role for IQ. Interpreting this is difficult, both because
health disability is such a rare phenomenon among white-collar workers
and because IQ becomes so tightly linked to advanced education, whtch
in turn is associated with jobs in which physical disability is virtually ir-
relevant (short of a stroke or other accident causing a mental impairment).
5. Terman and Oden 1947.
6. H1ll1980; Mayerand Treat 1977; O'Toole 1990; Smithand Kirkham 1982.
7. Grossman 1976; K~tagawa and Hauser 1960.
8. Restriction of range (see Chapter 3) might also reduce the independent
role of IQ among college graduates.
Notes to pages 1 68-1 76
699
Chapter 8
1 . For a review of the literature about family decline, see Popenoe 1993.
2. U.S. Bureau of the Census 1992, Table 5 1 .
3. Retherford 1986.
4. Garrison 1968; James 1989.
5. The cognitive elite did get married at somewhat older ages than others,
and this difference will grow as the NLSY cohort gets older. Judging from
other data, almost all of those in the bottom half of the IQ distribution
who will ever marry have already married by 30, whereas many of that 29
percent unmarried in Class 1 will eventually marry, raising their mean age
of marriage by some unknown amount. If all of them married at, say, age
40, the average age at marriage would approach 30, which may be taken
;IS the highest mean that the NLSY could plausibly produce as it follows
its sample into middle age.
6. In his famous lifetime study of intellectually gifted children born around
1910, Lewis Terman found that, as of the 1930s and 1940, highly gifted
Inen eventually got married at higher rates than the national norms-
about 84 percent, compared to a national rate of 67 percent for men of sim-
ilar age. Gifted women married later than the average woman, but by their
mid-30s they too had higher marriage rates than the general population,
though the difference was not as great as for men: 84 percent compared to
78 percent (Terman and Oden 1947, p. 227).
7. Cherlin 1981, Figure 1-5. His estimation procedure suggests that the odds
of eventual divorce in 1980 were 54 percent. Also see Raschke 1987.
8. We are here calculating odds mtios-the
likelihood of marital survival di-
vided by the likelihood of divorce within the first five years-from
the table
on page 174. The ratio of odds ratios for marital survival versus divorce dur-
tng the first five years of marriage was 2.7, comparing Class I to Class V.
9. In addition to the standard variables (age, parental socioeconomic status,
and IQ), we added "date of first marriage." We wished to add age at first
marriage as well, but it was so highly correlated with the date of first mar-
riage in the entire white sample (r = +.81) that the two variables could not
be used together. It was possible to use them together in some of the sub-
samples we analyzed. The pattern of results was unchanged.
10. Different subsets of white youths, both the entire sample of those who had
married and the subset of those who had reached the age of 30, and the
subset below the age of 30 all yielded similar results.
11. E.g. Raschke 1987; Sweet and Rumpass 1987.
12. Higher socioeconomic status is also associated with a lower probability of
divorce in the college sample, though the independent effect of parental
SES is much smaller than the independent effect of IQ. Socioeconomic
700
Notes to pages 1 76-1 79
status had an insignificantly direct relationship with divorce for the high
school sample. Thinking back to the analysis of marriage, note a curious
contrast: IQ makes a lot of difference in whether high school graduates get
married but not in whether they get divorced. 1Q makes little difference
in whether college graduates get married by the age of 30 but a lot of dif-
ference in whether they get divorced. Why? We have no idea. In any case,
embedded in this complicated set of findings are intriguing possibilities,
which warrant a full-scale analysis.
13. Raschke 1987; Sweet and Bumpass 1987; Teachman et al. 1987.
14. Even a genetic component has been invoked to explain the fact that di-
vorce runs in families. Not only do children tend to follow their parents'
path toward divorce, but identical twins are more correlated in their like-
lihood of divorce than fraternal twins, a difference that often betrays some
genetic influence. McGue and Lykken 1992.
15. Those living with only the father did as well as those living with both hi-
ological parents.
16. See references in Raschke 1987; South 1985.
17. Bronislaw Malinowski, Sex, Culture, and Myth (1930), quoted in Moyni-
han 1986, p. 170.
18. The production of illegitimate babies per unit population has also in-
creased during this period, with the fastest growth occurring during the
1970s. In the jargon, the rate of illegitimate births has increased as well as
the ratio. The distinction between rate and ratio raises a technical issue
that has plagued the discussion of illegitimacy in recent years. Tradition-
ally, illegitimacy rates have been computed by dividing the number of il-
legitimate births by the number of unmarried women. In a period when
marital patterns are also shifting, this has the effect of confounding two
different phenomena: the number of illegitimate births in the numerator
of the ratio and the number of unmarried women in the denominator. To
estimate the rate of change in the production of illegitimate children per
unit population, it is essential to divide the number of illegitimate births
by the entire population (or, if one prefers, by the numher of women of
childbearing age). This is almost never done, however, in nontechnical
discussions (or in many of the technical ones, for that matter). For a dis-
cussion of the difference this makes in interpreting trends in illegitimacy,
see Murray 1993.
19. Sweet and Bumpass 1987, p. 95. In 1960, there were 73,000 never-married
mothers between the ages of 18 and 34; in 1980, there were 1,022,000.
20. Bachu 1991, Table 1. The figures for ages 18 to 34 are interpolated from
the published figures for ages 15 to 34.
2 1. Not to mention that IQ has changed in the wrong direction to explain in-
creasing illegitimacy (see the Flynn Effect, discussed in Chapters 13 and 15).
22. As In the case of school dropout, one may ask whether having a baby out
of wedlock as a teenager caused school dropout, therefore resulting in an
artificially low IQ score. As hefore, the cleanest way to test the hypothe-
sis is to select all the women who had their first baby after they took the
test in 1980 and repeat the analyses reported here, introducing a control
for age at first birth. When this is done, the relationships reported con-
tinue to apply as strongly as, and in some cases more strongly than, they
do for the entire sample.
A similar causal tangle is associated with the age at first birth. Age at
first birth is a powerful explanatory variable in a statistical sense. It can
drastically change the parameters, especially the importance of socioeco-
nomic status and IQ, in a regression equation. But, in the 1990s, what
causes a girl in her teens to have a baby? Probably the same things that
might cause her to have an illegitimate baby: She grew up in a low-status
household where having a baby young was an accepted thing to do; she is
not very hright and gets pregnant inadvertently or because she has not
thought through the consequences; or she is poor and has a baby because
it offers better rewards than not having a baby, whether those rewards are
tangible in the form of an income and apartment of her own through wel-
fare, or in the form of having someone to love. And in fact all three vari-
ables-parental
SES, IQ, and whether she was living in poverty prior to
the birth-are
powerful predictors of age at first birth, explaining 36 per-
cent of the variance. Furthermore, age at first birth cannot be a cause of
parental SES and poverty in the year prior to birth. Empirically, it can be
demonstrated not to be a "cause" of the AFQT score, using the same logic
applied to the case of illegitimacy.
23. Rindfuss et al. 1980.
24. Abrahamse et al. 1988. The analysis is based on a sample of 13,061 girls
who were sophomores in 1980 at the time of the High School and Beyond
(HSkB) baseline survey and also responded to the first follow-up ques-
tionnaire in 1982.
25. The exact figures, going from the bottom to the top quartile in socioeco-
nomic status, are 38.7 percent, 29.7 percent, 19.9 percent, and 11.7 per-
cent, based on weighted data, computed by the authors from the HS&R
database. Figures reported here and on other occasions when we refer to
the RAND study will sometimes show minor discrepancies with the pub-
lished account, because Abrahamse et al. used imputed figures for certain
variables, based on schoolwide measures, when individual data were miss-
ing. Our calculations do not use any imputed figures. As in the RAND
study, all results are based on weighted analyses using the HS&B popula-
tion weights.
26. For mothers of an illegitimate baby, the mean on the test of cognitive abil-
Causality in Teenage Motherhood
- The text examines whether early motherhood causes lower IQ scores or if low IQ is a preexisting predictor of early pregnancy.
- Data suggests that the relationship between cognitive ability and age at first birth remains strong even when testing women who gave birth after taking the IQ test.
- Three primary variables—parental socioeconomic status, IQ, and poverty—explain 36 percent of the variance in the age at which a woman first gives birth.
- The author argues that teenage pregnancy is often a result of low cognitive ability, lack of foresight, or the perceived rewards of welfare and emotional connection.
- Statistical analysis indicates that age at first birth is not a cause of parental status or prior poverty, but rather an outcome of those factors.
- The study utilizes data from the High School and Beyond (HS&B) survey to track the outcomes of over 13,000 girls over several years.
She is not very hright and gets pregnant inadvertently or because she has not thought through the consequences; or she is poor and has a baby because it offers better rewards than not having a baby, whether those rewards are tangible in the form of an income and apartment of her own through welfare, or in the form of having someone to love.
700
Notes to pages 1 76-1 79
status had an insignificantly direct relationship with divorce for the high
school sample. Thinking back to the analysis of marriage, note a curious
contrast: IQ makes a lot of difference in whether high school graduates get
married but not in whether they get divorced. 1Q makes little difference
in whether college graduates get married by the age of 30 but a lot of dif-
ference in whether they get divorced. Why? We have no idea. In any case,
embedded in this complicated set of findings are intriguing possibilities,
which warrant a full-scale analysis.
13. Raschke 1987; Sweet and Bumpass 1987; Teachman et al. 1987.
14. Even a genetic component has been invoked to explain the fact that di-
vorce runs in families. Not only do children tend to follow their parents'
path toward divorce, but identical twins are more correlated in their like-
lihood of divorce than fraternal twins, a difference that often betrays some
genetic influence. McGue and Lykken 1992.
15. Those living with only the father did as well as those living with both hi-
ological parents.
16. See references in Raschke 1987; South 1985.
17. Bronislaw Malinowski, Sex, Culture, and Myth (1930), quoted in Moyni-
han 1986, p. 170.
18. The production of illegitimate babies per unit population has also in-
creased during this period, with the fastest growth occurring during the
1970s. In the jargon, the rate of illegitimate births has increased as well as
the ratio. The distinction between rate and ratio raises a technical issue
that has plagued the discussion of illegitimacy in recent years. Tradition-
ally, illegitimacy rates have been computed by dividing the number of il-
legitimate births by the number of unmarried women. In a period when
marital patterns are also shifting, this has the effect of confounding two
different phenomena: the number of illegitimate births in the numerator
of the ratio and the number of unmarried women in the denominator. To
estimate the rate of change in the production of illegitimate children per
unit population, it is essential to divide the number of illegitimate births
by the entire population (or, if one prefers, by the numher of women of
childbearing age). This is almost never done, however, in nontechnical
discussions (or in many of the technical ones, for that matter). For a dis-
cussion of the difference this makes in interpreting trends in illegitimacy,
see Murray 1993.
19. Sweet and Bumpass 1987, p. 95. In 1960, there were 73,000 never-married
mothers between the ages of 18 and 34; in 1980, there were 1,022,000.
20. Bachu 1991, Table 1. The figures for ages 18 to 34 are interpolated from
the published figures for ages 15 to 34.
2 1. Not to mention that IQ has changed in the wrong direction to explain in-
creasing illegitimacy (see the Flynn Effect, discussed in Chapters 13 and 15).
22. As In the case of school dropout, one may ask whether having a baby out
of wedlock as a teenager caused school dropout, therefore resulting in an
artificially low IQ score. As hefore, the cleanest way to test the hypothe-
sis is to select all the women who had their first baby after they took the
test in 1980 and repeat the analyses reported here, introducing a control
for age at first birth. When this is done, the relationships reported con-
tinue to apply as strongly as, and in some cases more strongly than, they
do for the entire sample.
A similar causal tangle is associated with the age at first birth. Age at
first birth is a powerful explanatory variable in a statistical sense. It can
drastically change the parameters, especially the importance of socioeco-
nomic status and IQ, in a regression equation. But, in the 1990s, what
causes a girl in her teens to have a baby? Probably the same things that
might cause her to have an illegitimate baby: She grew up in a low-status
household where having a baby young was an accepted thing to do; she is
not very hright and gets pregnant inadvertently or because she has not
thought through the consequences; or she is poor and has a baby because
it offers better rewards than not having a baby, whether those rewards are
tangible in the form of an income and apartment of her own through wel-
fare, or in the form of having someone to love. And in fact all three vari-
ables-parental
SES, IQ, and whether she was living in poverty prior to
the birth-are
powerful predictors of age at first birth, explaining 36 per-
cent of the variance. Furthermore, age at first birth cannot be a cause of
parental SES and poverty in the year prior to birth. Empirically, it can be
demonstrated not to be a "cause" of the AFQT score, using the same logic
applied to the case of illegitimacy.
23. Rindfuss et al. 1980.
24. Abrahamse et al. 1988. The analysis is based on a sample of 13,061 girls
who were sophomores in 1980 at the time of the High School and Beyond
(HSkB) baseline survey and also responded to the first follow-up ques-
tionnaire in 1982.
25. The exact figures, going from the bottom to the top quartile in socioeco-
nomic status, are 38.7 percent, 29.7 percent, 19.9 percent, and 11.7 per-
cent, based on weighted data, computed by the authors from the HS&R
database. Figures reported here and on other occasions when we refer to
the RAND study will sometimes show minor discrepancies with the pub-
lished account, because Abrahamse et al. used imputed figures for certain
variables, based on schoolwide measures, when individual data were miss-
ing. Our calculations do not use any imputed figures. As in the RAND
study, all results are based on weighted analyses using the HS&B popula-
tion weights.
26. For mothers of an illegitimate baby, the mean on the test of cognitive abil-
702
Notes to pages 186-195
Notes to pages 197-199
703
ity was .73 SD below the mean for all girls who had babies, and .67 SL> be-
low the mean for all white girls (mothers and nonmothers).
27. Limiting the analysis to first births avoids a number of technical problems
associated with differential number of children per woman hy cognitive
and socioeconomic class. Analyses based on all children born by the 1990
interview show essentially the same results, however. We also conducted
a parallel set of analyses using as the dependent variable whether the
woman had ever given birth to a child out of wedlock (thereby adding
women without any children at all to the analysis). The interpretations of
the results were not markedly different for any of the analyses presented in
the text.
28. We are, as usual, comparing the effects of a shift equal to +2 SDs around
the mean for both independent variables, cognitive ability and socloeco-
nomic status.
29. Bachu 1993, Table J.
30. Bachu 1993, Table J.
3 1. The comparable probabilities given ~arental SES standard scores of -2 and
+2 were 31 percent and 19 percent.
32. The literature is extensive. Two recent reviews of the literature are Moffitt
1992 and Murray 1993. See also Murray 1994.
33. The writing on this topic is much more extensive for the black community
than the white. See, for example, Anderson 1989; Duncan and Hoffman
1990; Furstenberg et al. 1987; Hogan and Kitagawa 1985; Lundhera and
Plotnick 1990; Rowe and Rodgers 1992; Teachman 1985; Moffitt 1983.
34. For a detailed presentation of this argument, see Murray 1986b.
35. An analysis based not on the dichotomous variable, poverty, but on in-
come had essentially the same outcome.
36. When we repeat the analysis yet again, adding in the presence of the bio-
logical father, these results are sustained. Poverty and cognitive ability re-
main as important as before; the parents' poor socioeconomic status does
not increase the chances of illegitimate babies.
Chapter 9
1. Louchheim 1983, p. 175. See also Liebmann 1993.
2. Bane and Ellwood 1983; Ellwood 1986b; Hoffman 1987.
3. The studies are reviewed in Bendick and Cantu 1978.
4. Hopkins et al. 1987.
5. This figure includes women not reflected in the table who did not go on
AFDC within the first year after birth, received welfare at some later date,
but did not become chronic recipients.
6. In all cases, we limit the analysis to women for whom we have complete
data and whose child was born prior to January 1, 1989. We also conducted
this analysis with another definition of short-term recipiency, limiting the
sample to women whose children had been born prior to 1986, divided into
women who had never received welfare subsequently and women who had
received welfare up to half of the years that they were observed but did not
qualify as chronic welfare recipients. The results were similar to the ones
reported in the text, with a large negative effect of IQ and an insignificant
role for SES.
7. Rane and Ellwood 1983; Ellwood 1986a; Murray 1986a.
8. Ellwood 1986s; Murray 1986a.
9. We conducted a parallel analysis comparing chronic welfare recipients
with all other mothers, including those who had been on welfare hut did
not qualify as chronic. There are no important differences in interpreta-
tion for the results of the two sets of analyses.
10. Among all white women, only 16 percent had not gotten a high school
diploma, and 27 percent had achieved at least a bachelor's degree.
11. Once again, thls analysis has to be based on women with a high school
diploma because there was no way to analyze welfare recipiency among
white women with R.A.s. Only two white women with B.A.s in the NLSY
had become chronic recipients. But for the high school graduates, the ef-
fect of parental SES is modest-slightly
smaller than the independent ef-
fect of cognitive ability. This pattern was generally shared among women
who had gone on to get their GED (recall that people with a GED are not
included in the high school sample).
12. Some of the obvious explanations are not as important as one might ex-
pect. For example, most of the high school dropouts who became chronic
welfare recipients were not poor; only 36 percent of them had been below
the poverty line in the year before birth. Nor is it correct to assume that
all of them had babies out of wedlock; nearly half (46 percent) of their first
babies had been born within marriage. Rut 70 percent of the chronic wel-
fare recipients among the high school dropouts had had their first child be-
fore they turned 19, which means that some very large proportion of them
had the baby before they would normally have graduated. Among high
school dropouts who had not had a child before their nineteenth birthday,
the independent relationships of 1Q and socioeconomic ststus shift back
toward the familiar pattern, with the effects of 1Q being much larger than
those of socioeconomic status.
13. Indeed, the teenage mothers who did not become chronic welfare recipi-
ents had a slightly lower mean IQ than those who did (23d centile versus
26th centile). Meanwhile, the ones who did not become welfare recipients
at all had a fractionally higher mean socioeconomic status than the ones
who did (27th centile versus 26th).
Welfare Recipiency and Cognitive Ability
- Statistical analysis suggests that cognitive ability and poverty are more significant predictors of illegitimate births than parental socioeconomic status.
- Long-term welfare dependency among white women is strongly correlated with low IQ scores and lack of a high school diploma.
- The presence of a biological father does not diminish the statistical importance of cognitive ability in predicting social outcomes.
- Chronic welfare recipients often have their first child before age 19, significantly impacting their educational and economic trajectories.
- Among high school graduates, the independent effect of cognitive ability on welfare recipiency remains larger than the effect of parental background.
Only two white women with B.A.s in the NLSY had become chronic recipients.
702
Notes to pages 186-195
Notes to pages 197-199
703
ity was .73 SD below the mean for all girls who had babies, and .67 SL> be-
low the mean for all white girls (mothers and nonmothers).
27. Limiting the analysis to first births avoids a number of technical problems
associated with differential number of children per woman hy cognitive
and socioeconomic class. Analyses based on all children born by the 1990
interview show essentially the same results, however. We also conducted
a parallel set of analyses using as the dependent variable whether the
woman had ever given birth to a child out of wedlock (thereby adding
women without any children at all to the analysis). The interpretations of
the results were not markedly different for any of the analyses presented in
the text.
28. We are, as usual, comparing the effects of a shift equal to +2 SDs around
the mean for both independent variables, cognitive ability and socloeco-
nomic status.
29. Bachu 1993, Table J.
30. Bachu 1993, Table J.
3 1. The comparable probabilities given ~arental SES standard scores of -2 and
+2 were 31 percent and 19 percent.
32. The literature is extensive. Two recent reviews of the literature are Moffitt
1992 and Murray 1993. See also Murray 1994.
33. The writing on this topic is much more extensive for the black community
than the white. See, for example, Anderson 1989; Duncan and Hoffman
1990; Furstenberg et al. 1987; Hogan and Kitagawa 1985; Lundhera and
Plotnick 1990; Rowe and Rodgers 1992; Teachman 1985; Moffitt 1983.
34. For a detailed presentation of this argument, see Murray 1986b.
35. An analysis based not on the dichotomous variable, poverty, but on in-
come had essentially the same outcome.
36. When we repeat the analysis yet again, adding in the presence of the bio-
logical father, these results are sustained. Poverty and cognitive ability re-
main as important as before; the parents' poor socioeconomic status does
not increase the chances of illegitimate babies.
Chapter 9
1. Louchheim 1983, p. 175. See also Liebmann 1993.
2. Bane and Ellwood 1983; Ellwood 1986b; Hoffman 1987.
3. The studies are reviewed in Bendick and Cantu 1978.
4. Hopkins et al. 1987.
5. This figure includes women not reflected in the table who did not go on
AFDC within the first year after birth, received welfare at some later date,
but did not become chronic recipients.
6. In all cases, we limit the analysis to women for whom we have complete
data and whose child was born prior to January 1, 1989. We also conducted
this analysis with another definition of short-term recipiency, limiting the
sample to women whose children had been born prior to 1986, divided into
women who had never received welfare subsequently and women who had
received welfare up to half of the years that they were observed but did not
qualify as chronic welfare recipients. The results were similar to the ones
reported in the text, with a large negative effect of IQ and an insignificant
role for SES.
7. Rane and Ellwood 1983; Ellwood 1986a; Murray 1986a.
8. Ellwood 1986s; Murray 1986a.
9. We conducted a parallel analysis comparing chronic welfare recipients
with all other mothers, including those who had been on welfare hut did
not qualify as chronic. There are no important differences in interpreta-
tion for the results of the two sets of analyses.
10. Among all white women, only 16 percent had not gotten a high school
diploma, and 27 percent had achieved at least a bachelor's degree.
11. Once again, thls analysis has to be based on women with a high school
diploma because there was no way to analyze welfare recipiency among
white women with R.A.s. Only two white women with B.A.s in the NLSY
had become chronic recipients. But for the high school graduates, the ef-
fect of parental SES is modest-slightly
smaller than the independent ef-
fect of cognitive ability. This pattern was generally shared among women
who had gone on to get their GED (recall that people with a GED are not
included in the high school sample).
12. Some of the obvious explanations are not as important as one might ex-
pect. For example, most of the high school dropouts who became chronic
welfare recipients were not poor; only 36 percent of them had been below
the poverty line in the year before birth. Nor is it correct to assume that
all of them had babies out of wedlock; nearly half (46 percent) of their first
babies had been born within marriage. Rut 70 percent of the chronic wel-
fare recipients among the high school dropouts had had their first child be-
fore they turned 19, which means that some very large proportion of them
had the baby before they would normally have graduated. Among high
school dropouts who had not had a child before their nineteenth birthday,
the independent relationships of 1Q and socioeconomic ststus shift back
toward the familiar pattern, with the effects of 1Q being much larger than
those of socioeconomic status.
13. Indeed, the teenage mothers who did not become chronic welfare recipi-
ents had a slightly lower mean IQ than those who did (23d centile versus
26th centile). Meanwhile, the ones who did not become welfare recipients
at all had a fractionally higher mean socioeconomic status than the ones
who did (27th centile versus 26th).
Welfare, Education, and Child Welfare
- Data suggests that IQ and socioeconomic status are not the primary differentiators between teenage mothers who become chronic welfare recipients and those who do not.
- A high school diploma is a significant predictor of staying off welfare, independent of cognitive ability or family background.
- Researchers question whether the diploma itself provides necessary life skills or if the act of earning it simply signals pre-existing traits like persistence.
- The text transitions into a comprehensive bibliography regarding child neglect, defined as a failure to provide essential ingredients for a child's development.
- Historical and empirical studies highlight the complex relationship between poverty, intergenerational transmission, and child abuse.
- Literature reviews suggest that cognitive ability may be a stronger predictor of school dropout rates than socioeconomic status.
Does a high school education prepare the young woman for adulthood and the world of work, thereby tending to keep her off welfare? Or does the act of getting a high school diploma reflect the young woman's persistence and ability to cope that tend to keep her off welfare?
702
Notes to pages 186-195
Notes to pages 197-199
703
ity was .73 SD below the mean for all girls who had babies, and .67 SL> be-
low the mean for all white girls (mothers and nonmothers).
27. Limiting the analysis to first births avoids a number of technical problems
associated with differential number of children per woman hy cognitive
and socioeconomic class. Analyses based on all children born by the 1990
interview show essentially the same results, however. We also conducted
a parallel set of analyses using as the dependent variable whether the
woman had ever given birth to a child out of wedlock (thereby adding
women without any children at all to the analysis). The interpretations of
the results were not markedly different for any of the analyses presented in
the text.
28. We are, as usual, comparing the effects of a shift equal to +2 SDs around
the mean for both independent variables, cognitive ability and socloeco-
nomic status.
29. Bachu 1993, Table J.
30. Bachu 1993, Table J.
3 1. The comparable probabilities given ~arental SES standard scores of -2 and
+2 were 31 percent and 19 percent.
32. The literature is extensive. Two recent reviews of the literature are Moffitt
1992 and Murray 1993. See also Murray 1994.
33. The writing on this topic is much more extensive for the black community
than the white. See, for example, Anderson 1989; Duncan and Hoffman
1990; Furstenberg et al. 1987; Hogan and Kitagawa 1985; Lundhera and
Plotnick 1990; Rowe and Rodgers 1992; Teachman 1985; Moffitt 1983.
34. For a detailed presentation of this argument, see Murray 1986b.
35. An analysis based not on the dichotomous variable, poverty, but on in-
come had essentially the same outcome.
36. When we repeat the analysis yet again, adding in the presence of the bio-
logical father, these results are sustained. Poverty and cognitive ability re-
main as important as before; the parents' poor socioeconomic status does
not increase the chances of illegitimate babies.
Chapter 9
1. Louchheim 1983, p. 175. See also Liebmann 1993.
2. Bane and Ellwood 1983; Ellwood 1986b; Hoffman 1987.
3. The studies are reviewed in Bendick and Cantu 1978.
4. Hopkins et al. 1987.
5. This figure includes women not reflected in the table who did not go on
AFDC within the first year after birth, received welfare at some later date,
but did not become chronic recipients.
6. In all cases, we limit the analysis to women for whom we have complete
data and whose child was born prior to January 1, 1989. We also conducted
this analysis with another definition of short-term recipiency, limiting the
sample to women whose children had been born prior to 1986, divided into
women who had never received welfare subsequently and women who had
received welfare up to half of the years that they were observed but did not
qualify as chronic welfare recipients. The results were similar to the ones
reported in the text, with a large negative effect of IQ and an insignificant
role for SES.
7. Rane and Ellwood 1983; Ellwood 1986a; Murray 1986a.
8. Ellwood 1986s; Murray 1986a.
9. We conducted a parallel analysis comparing chronic welfare recipients
with all other mothers, including those who had been on welfare hut did
not qualify as chronic. There are no important differences in interpreta-
tion for the results of the two sets of analyses.
10. Among all white women, only 16 percent had not gotten a high school
diploma, and 27 percent had achieved at least a bachelor's degree.
11. Once again, thls analysis has to be based on women with a high school
diploma because there was no way to analyze welfare recipiency among
white women with R.A.s. Only two white women with B.A.s in the NLSY
had become chronic recipients. But for the high school graduates, the ef-
fect of parental SES is modest-slightly
smaller than the independent ef-
fect of cognitive ability. This pattern was generally shared among women
who had gone on to get their GED (recall that people with a GED are not
included in the high school sample).
12. Some of the obvious explanations are not as important as one might ex-
pect. For example, most of the high school dropouts who became chronic
welfare recipients were not poor; only 36 percent of them had been below
the poverty line in the year before birth. Nor is it correct to assume that
all of them had babies out of wedlock; nearly half (46 percent) of their first
babies had been born within marriage. Rut 70 percent of the chronic wel-
fare recipients among the high school dropouts had had their first child be-
fore they turned 19, which means that some very large proportion of them
had the baby before they would normally have graduated. Among high
school dropouts who had not had a child before their nineteenth birthday,
the independent relationships of 1Q and socioeconomic ststus shift back
toward the familiar pattern, with the effects of 1Q being much larger than
those of socioeconomic status.
13. Indeed, the teenage mothers who did not become chronic welfare recipi-
ents had a slightly lower mean IQ than those who did (23d centile versus
26th centile). Meanwhile, the ones who did not become welfare recipients
at all had a fractionally higher mean socioeconomic status than the ones
who did (27th centile versus 26th).
704
Notes to pages 199-208
Notes to pages 208-2 12
705
14. Having a high school diploma was an important variable in all of the analy-
ses of welfare, over and above the effects of either cognitive ability or so-
cioeconomic background, and regarding either short-term or chronic
welfare recipiency. The question is whether the high school diploma-and
we are referring specifically to the high school diploma, not an equivalency
degree-reflects
a cause or a symptom. Does a high school education pre-
pare the young woman for adulthood and the world of work, thereby tend-
ing to keep her off welfare? Or does the act of getting a high school diploma
reflect the young woman's persistence and ability to cope that tend to keep
her off welfare? It is an important question; unfortunately, we were unable
to think of a way to answer it with the data we have.
15. All are mutually exclusive groups. Criteria follow those for temporary and
chronic welfare recipiency defined earlier.
Chapter 1 0
1. Anderson 1936.
2. See Bronfenbrenner 1958, p. 424, for a review of the literature through the
mid-1950s. For a recent empirical test, see Luster et al. 1989.
3. Kohn 1959.
4 Kohn 1959.
5. Kohn 1959, p. 366.
6. Heath 1983.
7. The study also includes "Trackton," a black lower-class community.
8. Heath 1982, p. 54.
9. Heath 1981, p. 61.
10. Heath 1982, p. 62.
11. Heath 1982, p. 63.
12. Gottfried 1984, p. 330.
13. Kadushin 1988, p. 150.
14. Drawn from Kadushin, 1988, pp. 15CL151. Formally, neglect is defined hy
one of the leading authorities, Norman Polansky, as a situation in which
the caretaker "permits the child to experience avoidable present suffering
and/or fails to provide one or more ingredients generally deemed essential
for developing a person's physical, intellectual or emotional capacities."
Quoted in Kadushin, p. 150.
15. Kaplun, 1976; Smith and Adler, 1991; Steele 1987; Trickett et al. 1991.
16. E.g., Azar et al. 1984. For a discussion of weaknesses in the state of knowl-
edge about causes and an argument for continuing to treat abuse and ne-
glect separately, see Cicchetti and Ridey 1981. See also Bousha and
Twentyman 1984; Herrenkohl et al. 1983.
17. Some recent reviews of the evidence on causation are Hegar and Yung-
man 1989; Polansky 1981; Zuravin 1989. The intergenerational explana-
tion is one of the most widely known. For a review of the literature and
some important qualifications to assumptions about intergenerational
transmission, see Kaufman and Zigler 1987.
18. Besharov 1991.
19. D. Besharov and S. Besharov, quoted in Pelton 1978, p. 608.
20. Parke and Collmer 1975.
21. Coser 1965; Horowitz and Liebowitz 1969.
22. Jensen and Nicholas 1984; Osborne et al. 1988.
23. Leroy H. Pelton's literature review is still excellent on the studies through
the mid-1970s, as is Garbarino's. See Garbarino and Crouter 1978; Pelton
1978. Also see Straus and Gelles 1986; Straus et al. 1980; Trickett et al.
1991. Unless otherwise noted, the literature review in this section is not
restricted to whites.
24. U.S. Department of Health and Human Services 1988; Wolfe 1985.
25. Gil 1970.
26. Reported in Pelton 1978.
27. Young and Gately 1988, pp. 247, 248.
28. Reported in Pelton 1990-1991.
29. Klein and Stem 1971; Smith 1975.
30. Baldwin and Oliver 1975.
3 1. Cohen et al. 1966; Johnson and Morse 1968.
32. Smith et al. 1974.
33. Pelton 1978, pp. 612-613.
34. Gil 1970. Recall that Chapter 6 demonstrated that cognitive ability was a
stronger predictor of school dropout than socioeconomic status.
35. Brayden et al. 1992.
36. Crittenden 1988, p. 179.
37. Drotar and Sturm 1989.
38. Azar et al. 1984. See Steele 1987 for supporting evidence and Kravitz and
Driscoll 1983 for a contrary view.
39. Bennie 1969.
40. Dekovic and Gerris 1992. For findings in a similar vein, see Goodnow et
al. 1984; Keller et al. 1984; and Knight and Goodnow 1988. For studies
concluding that parental reasoning is not related to social class, see New-
berger and Cook 1983.
41. Polansky 1981, p. 43.
42. Most tantalizing of all was a prospective study in Minnesota that gave an
extensive battery of tests to young, socioeconomically disadvantaged
women before they gave birth. In following up these mothers, two groups
were identified: one consisting of thirty-eight young women with high-
stress life events and adequate care of their children (HS-AC), and the
Cognitive Factors in Parenting
- The text examines the correlation between parental IQ and the ability to provide adequate childcare under high-stress conditions.
- A Minnesota study suggests that mothers who provided adequate care despite high stress had higher IQ scores than those who provided inadequate care.
- The author critiques the omission of IQ testing in many sociological studies of abusive or neglectful parenting, despite the feasibility of such tests.
- Parental competence is defined by researchers as sensitivity to infant cues, quality of verbalization, and physical flexibility.
- The analysis of prenatal health behaviors, such as smoking and drinking, reveals complexities in how cognitive class influences maternal choices.
- Technical distinctions are made regarding low birth weight, separating premature births from infants who are underweight for their gestational age.
In the article, data on all the tests are presented in commendable detail, except for IQ.
704
Notes to pages 199-208
Notes to pages 208-2 12
705
14. Having a high school diploma was an important variable in all of the analy-
ses of welfare, over and above the effects of either cognitive ability or so-
cioeconomic background, and regarding either short-term or chronic
welfare recipiency. The question is whether the high school diploma-and
we are referring specifically to the high school diploma, not an equivalency
degree-reflects
a cause or a symptom. Does a high school education pre-
pare the young woman for adulthood and the world of work, thereby tend-
ing to keep her off welfare? Or does the act of getting a high school diploma
reflect the young woman's persistence and ability to cope that tend to keep
her off welfare? It is an important question; unfortunately, we were unable
to think of a way to answer it with the data we have.
15. All are mutually exclusive groups. Criteria follow those for temporary and
chronic welfare recipiency defined earlier.
Chapter 1 0
1. Anderson 1936.
2. See Bronfenbrenner 1958, p. 424, for a review of the literature through the
mid-1950s. For a recent empirical test, see Luster et al. 1989.
3. Kohn 1959.
4 Kohn 1959.
5. Kohn 1959, p. 366.
6. Heath 1983.
7. The study also includes "Trackton," a black lower-class community.
8. Heath 1982, p. 54.
9. Heath 1981, p. 61.
10. Heath 1982, p. 62.
11. Heath 1982, p. 63.
12. Gottfried 1984, p. 330.
13. Kadushin 1988, p. 150.
14. Drawn from Kadushin, 1988, pp. 15CL151. Formally, neglect is defined hy
one of the leading authorities, Norman Polansky, as a situation in which
the caretaker "permits the child to experience avoidable present suffering
and/or fails to provide one or more ingredients generally deemed essential
for developing a person's physical, intellectual or emotional capacities."
Quoted in Kadushin, p. 150.
15. Kaplun, 1976; Smith and Adler, 1991; Steele 1987; Trickett et al. 1991.
16. E.g., Azar et al. 1984. For a discussion of weaknesses in the state of knowl-
edge about causes and an argument for continuing to treat abuse and ne-
glect separately, see Cicchetti and Ridey 1981. See also Bousha and
Twentyman 1984; Herrenkohl et al. 1983.
17. Some recent reviews of the evidence on causation are Hegar and Yung-
man 1989; Polansky 1981; Zuravin 1989. The intergenerational explana-
tion is one of the most widely known. For a review of the literature and
some important qualifications to assumptions about intergenerational
transmission, see Kaufman and Zigler 1987.
18. Besharov 1991.
19. D. Besharov and S. Besharov, quoted in Pelton 1978, p. 608.
20. Parke and Collmer 1975.
21. Coser 1965; Horowitz and Liebowitz 1969.
22. Jensen and Nicholas 1984; Osborne et al. 1988.
23. Leroy H. Pelton's literature review is still excellent on the studies through
the mid-1970s, as is Garbarino's. See Garbarino and Crouter 1978; Pelton
1978. Also see Straus and Gelles 1986; Straus et al. 1980; Trickett et al.
1991. Unless otherwise noted, the literature review in this section is not
restricted to whites.
24. U.S. Department of Health and Human Services 1988; Wolfe 1985.
25. Gil 1970.
26. Reported in Pelton 1978.
27. Young and Gately 1988, pp. 247, 248.
28. Reported in Pelton 1990-1991.
29. Klein and Stem 1971; Smith 1975.
30. Baldwin and Oliver 1975.
3 1. Cohen et al. 1966; Johnson and Morse 1968.
32. Smith et al. 1974.
33. Pelton 1978, pp. 612-613.
34. Gil 1970. Recall that Chapter 6 demonstrated that cognitive ability was a
stronger predictor of school dropout than socioeconomic status.
35. Brayden et al. 1992.
36. Crittenden 1988, p. 179.
37. Drotar and Sturm 1989.
38. Azar et al. 1984. See Steele 1987 for supporting evidence and Kravitz and
Driscoll 1983 for a contrary view.
39. Bennie 1969.
40. Dekovic and Gerris 1992. For findings in a similar vein, see Goodnow et
al. 1984; Keller et al. 1984; and Knight and Goodnow 1988. For studies
concluding that parental reasoning is not related to social class, see New-
berger and Cook 1983.
41. Polansky 1981, p. 43.
42. Most tantalizing of all was a prospective study in Minnesota that gave an
extensive battery of tests to young, socioeconomically disadvantaged
women before they gave birth. In following up these mothers, two groups
were identified: one consisting of thirty-eight young women with high-
stress life events and adequate care of their children (HS-AC), and the
706
Notes to pages 2 1 2-2 14
Notes to pages 21 6-222
707
other of twelve young women with high-stress life events and inadequate
care (HS-NC). In the article, data on all the tests are presented in com-
mendable detail, except for IQ. In the "method" section that lists all the
tests, an IQ test is not mentioned. Subsequently, there is this passage, which
contains everything we are told about the mentioned test: "The only pre-
natal measure that was not given at 3 months [after birth] was the Shipley-
Hartford IQ measure. The mean scores on this measure were 26.9 for the
HS-AC group and 23.5 for the HS-NC group (p = .064)." Egeland 1980,
p. 201. A marginally statistically significant difference with samples of 12
and 38 suggests a sizable IQ difference.
43. Friedman and Morse 1974; Reid and Tablin 1976; Smith and Hanson 1975.
44. Wolfe 1985.
45. Berger 1980.
46. Young 1964, cited by Berger 1980.
47. Wolfe 1985, pp. 473-474.
48. It is understandable that many survey studies cannot obtain a measure of
IQ. But virtually all of the studies discussed called for extensive coopera-
tion by the abusive parents. The addition of a short intelligence test would
seem to have been readily feasible.
49. The actual quotation is dense but intriguing: "Moreover, they [the British
researchers] have shown that parental competence (defined as sensitivity
and responsiveness to infant cues, quality of verbalization, and physical
contact, and related skills) and adjustment (e.g., low anxiety and adequate
flexibility) were distinguishing abilities that moderated the impact of aver-
sive life events" (Wolfe 1985, p. 478).
50. Honesty of the respondents apart, the NLSY data do not address this is-
sue. The question about drinking asked how often a woman drank but not
how much at any one time. Since a single glass of wine or beer a few times
a week is not known to be harmful, the drinking data are not interpretable.
5 1. Roughly equal proportions of smokers in the low and high cognitive classes
told the interviewers that they had cut down during pregnancy-about
60
percent of smokers in each case.
52. Leonard et al. 1990; Hack and others 1991.
53. "Low birth weight" is operationally defined as infants weighing less than
5.5 pounds at birth. This definition, however, mixes children who are car-
ried to term and are nonetheless underweight with children who are born
prematurely (which usually occurs for reasons over which the woman has
no control) but who are otherwise of normal weight and development. In
the jargon, these babies have a weight "appropriate for gestational age"
(AGA). Babies who weighed less than 5.5 pounds but whose weight was
equal to or higher than the medical definition of AGA (using the Col-
orado Intrauterine Growth Charts) were excluded from the analysis.
54. The dip in the proportion for Class V could also be an artifact of small sam-
ple sizes. The proportion (computed using sample weights) is produced by
9 out of 116 babies. Sample sizes for the other cognitive classes-11,
111,
and IV-were
much larger: 573,2,059, and 737, respectively.
55. Hardy and Mellis 1977.
56. Cramer 1987. In a revealing sign of the unpopularity of intelligence as an
explanatory variable, Cramer treats years of education as a proxy measure
of socioeconomic status. For other studies showing the relationship of ed-
ucatlon to infant mortality, see Bross and Shapiro 1982; Keller and Fet-
terly 1978.
57. This is a persistent issue in infant mortality research. There are varying
opinions about how important the distinction between neonatal and in-
fant deaths may he. See Eherstein and Parker 1984.
58. Duncan 1993.
59. The calculation assumes that the mother has average socioeconomic back-
ground.
60. It measures, among other things, the emotional and verbal responsiveness
and involvement of the mother, provision of appropriate play materials,
variety in the daily routine, use of punishment, and organization of the
child's environment. The HOME index was created and tested by Bettye
Caldwell and Robert Bradley (Caldwell and Bradley 1984).
61. From Class IV to Class 11, they were the 48th, 60th, and 68th percentile,
respectively. For most of the assessments, including the HOME index, the
NLSY database contains raw scores, standardized scores, and centile scores.
For technical reasons, it is more accurate to work with standardized scores
than percentiles when computing group means, conducting regression
analyses, and so forth. On the other hand, centiles are much more readily
understood by the ordinary reader. We have conducted all analyses using
standardized scores, then converted the final results as reported in the ta-
bles back into centiles. Thus, the centiles in the table are not those that will
be produced by simply averaging the HOME centile scores in the NLSY.
62. We replicated all of these analyses using the HOME index as a continu-
ous variable, and the substantive conclusions from those replications are
consistent with the ones reported here.
63. The HOME index has different scoring for children younger than 3 years
old, children ages 3 through 5, and children ages 6 and older. We exarn-
ined the HOME results for the different age groups and found that they
could be combined without significant loss of precision for the interpreta-
tions we describe in the text. There is some evidence that the mother's IQ
was most important for the home environment of children ages 3 through
5 and least important for children ages 6 and older, but the differences are
not dramatic.
Methodology of the HOME Index
- The HOME index evaluates a child's environment through factors like maternal responsiveness, play materials, and daily routine organization.
- Researchers utilized standardized scores for regression analysis but converted results to centiles to make the data more accessible to general readers.
- Analysis suggests that a mother's IQ has a varying impact on the home environment depending on the child's age, peaking between ages three and five.
- The study highlights a scholarly tendency to use education as a proxy for socioeconomic status, often overlooking intelligence as an independent variable.
- Statistical modeling demonstrates that poverty and welfare receipt significantly increase the odds of a child being in the bottom decile of the HOME index.
- The researchers controlled for variables such as maternal age, socioeconomic background, and the specific year of testing to ensure data consistency.
In a revealing sign of the unpopularity of intelligence as an explanatory variable, Cramer treats years of education as a proxy measure of socioeconomic status.
706
Notes to pages 2 1 2-2 14
Notes to pages 21 6-222
707
other of twelve young women with high-stress life events and inadequate
care (HS-NC). In the article, data on all the tests are presented in com-
mendable detail, except for IQ. In the "method" section that lists all the
tests, an IQ test is not mentioned. Subsequently, there is this passage, which
contains everything we are told about the mentioned test: "The only pre-
natal measure that was not given at 3 months [after birth] was the Shipley-
Hartford IQ measure. The mean scores on this measure were 26.9 for the
HS-AC group and 23.5 for the HS-NC group (p = .064)." Egeland 1980,
p. 201. A marginally statistically significant difference with samples of 12
and 38 suggests a sizable IQ difference.
43. Friedman and Morse 1974; Reid and Tablin 1976; Smith and Hanson 1975.
44. Wolfe 1985.
45. Berger 1980.
46. Young 1964, cited by Berger 1980.
47. Wolfe 1985, pp. 473-474.
48. It is understandable that many survey studies cannot obtain a measure of
IQ. But virtually all of the studies discussed called for extensive coopera-
tion by the abusive parents. The addition of a short intelligence test would
seem to have been readily feasible.
49. The actual quotation is dense but intriguing: "Moreover, they [the British
researchers] have shown that parental competence (defined as sensitivity
and responsiveness to infant cues, quality of verbalization, and physical
contact, and related skills) and adjustment (e.g., low anxiety and adequate
flexibility) were distinguishing abilities that moderated the impact of aver-
sive life events" (Wolfe 1985, p. 478).
50. Honesty of the respondents apart, the NLSY data do not address this is-
sue. The question about drinking asked how often a woman drank but not
how much at any one time. Since a single glass of wine or beer a few times
a week is not known to be harmful, the drinking data are not interpretable.
5 1. Roughly equal proportions of smokers in the low and high cognitive classes
told the interviewers that they had cut down during pregnancy-about
60
percent of smokers in each case.
52. Leonard et al. 1990; Hack and others 1991.
53. "Low birth weight" is operationally defined as infants weighing less than
5.5 pounds at birth. This definition, however, mixes children who are car-
ried to term and are nonetheless underweight with children who are born
prematurely (which usually occurs for reasons over which the woman has
no control) but who are otherwise of normal weight and development. In
the jargon, these babies have a weight "appropriate for gestational age"
(AGA). Babies who weighed less than 5.5 pounds but whose weight was
equal to or higher than the medical definition of AGA (using the Col-
orado Intrauterine Growth Charts) were excluded from the analysis.
54. The dip in the proportion for Class V could also be an artifact of small sam-
ple sizes. The proportion (computed using sample weights) is produced by
9 out of 116 babies. Sample sizes for the other cognitive classes-11,
111,
and IV-were
much larger: 573,2,059, and 737, respectively.
55. Hardy and Mellis 1977.
56. Cramer 1987. In a revealing sign of the unpopularity of intelligence as an
explanatory variable, Cramer treats years of education as a proxy measure
of socioeconomic status. For other studies showing the relationship of ed-
ucatlon to infant mortality, see Bross and Shapiro 1982; Keller and Fet-
terly 1978.
57. This is a persistent issue in infant mortality research. There are varying
opinions about how important the distinction between neonatal and in-
fant deaths may he. See Eherstein and Parker 1984.
58. Duncan 1993.
59. The calculation assumes that the mother has average socioeconomic back-
ground.
60. It measures, among other things, the emotional and verbal responsiveness
and involvement of the mother, provision of appropriate play materials,
variety in the daily routine, use of punishment, and organization of the
child's environment. The HOME index was created and tested by Bettye
Caldwell and Robert Bradley (Caldwell and Bradley 1984).
61. From Class IV to Class 11, they were the 48th, 60th, and 68th percentile,
respectively. For most of the assessments, including the HOME index, the
NLSY database contains raw scores, standardized scores, and centile scores.
For technical reasons, it is more accurate to work with standardized scores
than percentiles when computing group means, conducting regression
analyses, and so forth. On the other hand, centiles are much more readily
understood by the ordinary reader. We have conducted all analyses using
standardized scores, then converted the final results as reported in the ta-
bles back into centiles. Thus, the centiles in the table are not those that will
be produced by simply averaging the HOME centile scores in the NLSY.
62. We replicated all of these analyses using the HOME index as a continu-
ous variable, and the substantive conclusions from those replications are
consistent with the ones reported here.
63. The HOME index has different scoring for children younger than 3 years
old, children ages 3 through 5, and children ages 6 and older. We exarn-
ined the HOME results for the different age groups and found that they
could be combined without significant loss of precision for the interpreta-
tions we describe in the text. There is some evidence that the mother's IQ
was most important for the home environment of children ages 3 through
5 and least important for children ages 6 and older, but the differences are
not dramatic.
708
Notes to pages 223-226
Notes to pages 229-237
709
64. E.g., Duncan 1993 and almost anything published by the Children's De-
fense Fund.
65. We also conducted analyses treating family income as a continuous vari-
able, which showed consistent results.
66. The poverty measure is based on whether the mother was below the
poverty line in the year prior to the HOME assessment. Independent vari-
ables were IQ, mother's socioeconomic background, mother's age, the test
year, and the chiid's age group (for scoring the HOME index).
67. The table on page 222 shows the predicted odds of being in the bottom
decile on the HOME index from a regression equation, using the child's
sample weights, in which the dependent variable is a binary repre-
sentation of whether an NLSY child had a HOME score in the bottom
decile, and the independent variables were mother's 14, mother's socioe-
conomic background, mother's age, and nominal variables representing
the test year, the age category for scoring the HOME index, poverty in the
calendar year prior to the administration of the HOME index, and receipt
of AFDC in the calendar year prior to the administration of the HOME
index.
Odds of Being in
Mother's
the Rottom Decile
Mother's
Socioeconomic
In
On
on the HOME
IQ
Background
Poverty!
Welfare?
Index
Average
Average
No
No
4%
Average
Average
Yes
No
8%
Average
Average
No
Yes
9%
Average
Average
Yes
Yes
16%
Average
Very low
No
No
7 %
Average
Very low
Yes
No
12%)
Average
Very low
No
Yes
14%
Average
Very low
Yes
Yes
24%
Very low
Average
No
No
10%
Very low
Average
Yes
No
18%
Very low
Average
No
Yes
21%
Very low
Average
Yes
Yes
34%
"Very low" is defined as two SDs below the mean. Poverty and welfare
refer to the calendar year prior to the scoring of the HOME index.
68. The NLSY reported scores on these indexes for infants under 1 year of age,
not analyzed here.
69. This statement applies to the full white sample. In the cross-sectional sam-
ple, used for the regression results in Appendix 4, the role of birth status
(legitimate or illegitimate) was not significant when entered along with
poverty and welfare receipt.
70. A technical note that applies to the means reported in the table on page
230 and in Chapter 15. In applying the national norms, the NLSY declined
to estimate scores for very low-scoring children not covered in the PPVT's
scoring tables, instead assigning them a score of zero. For purposes of com-
puting the means above and in Chapter 15, we assigned a score of 40 (four
SDs below the mean, and the lowest score assigned in the standard tables
for scoring the PPVT) to all children with scores under 40.
7 1. Careful readers may be wondering why white children, who have had less
than their fair share of the bottom decile for most of the other indicators,
account for fully 10 percent of all NLSY children in the bottom decile. The
reason is that the women of the NLSY sample (all races) have had a high
proportion of low-IQ children, based on the national norms for the
PPVT-fully
23 percent of all NLSY children ages 6 and older when they
took the test had 1Qs of 80 or lower. For whites, 10 percent of the children
who have been tested fall into the bottom decile. This news is not quite as
had as it looks. Just because the NLSY mothers were a nationally represen-
tative sample of women in acertain age group does not mean that their chil-
dren are a nationally representative sample of children. But the news is
nonetheless worrisome, with implications that are discussed in Chapter 15.
72. See Chapter 4 for the discussion of heritability of IQ.
Chapter I I
1. The proportional increases in property crime tracked more or less with the
increases in violent crime until the late 1970s. Since then, property crime
has moved within a narrow range and in 1992 was actually lower than it
had been ten years earlier. This divergence between violent and property
crimes is in itself a potentially significant phenomenon that has yet to be
adequately explored.
2. For citations of the extensive literature on this subject, see Chaiken and
Chaiken 1983; Wilson and Herrnstein 1985. The official statistics may
have understated the increase in these "crimes that people consider seri-
ous enough to warrant reporting to the police," insofar as many burglaries,
assaults, and street robberies that would have been reported in the 1950s
(when there was a reasonable chance that the police would conduct a gen-
uine investigation) are no longer reported in urban areas, where it is taken
for granted that they are too minor to compete for limited police resources.
3. A more traditional way to sort the theories is to contrast classical theories,
Statistical Nuances of Social Indicators
- The text details technical adjustments in scoring the PPVT, where extremely low scores were capped at 40 rather than zero to maintain statistical consistency.
- A significant discrepancy is noted in the NLSY sample, where 23 percent of children scored at or below an IQ of 80, far exceeding national norms.
- The data suggests that while NLSY mothers were a representative sample of their age group, their offspring do not necessarily mirror a nationally representative child population.
- The analysis of crime trends reveals a divergence between violent and property crime starting in the late 1970s, a phenomenon the authors find under-explored.
- The authors critique the 'rational agent' theory of crime, arguing that most criminal behavior is better explained by psychological and sociological 'positive' theories.
- Official crime statistics may be under-reported in urban areas because citizens believe police lack the resources to investigate 'minor' offenses like burglary or assault.
This divergence between violent and property crimes is in itself a potentially significant phenomenon that has yet to be adequately explored.
708
Notes to pages 223-226
Notes to pages 229-237
709
64. E.g., Duncan 1993 and almost anything published by the Children's De-
fense Fund.
65. We also conducted analyses treating family income as a continuous vari-
able, which showed consistent results.
66. The poverty measure is based on whether the mother was below the
poverty line in the year prior to the HOME assessment. Independent vari-
ables were IQ, mother's socioeconomic background, mother's age, the test
year, and the chiid's age group (for scoring the HOME index).
67. The table on page 222 shows the predicted odds of being in the bottom
decile on the HOME index from a regression equation, using the child's
sample weights, in which the dependent variable is a binary repre-
sentation of whether an NLSY child had a HOME score in the bottom
decile, and the independent variables were mother's 14, mother's socioe-
conomic background, mother's age, and nominal variables representing
the test year, the age category for scoring the HOME index, poverty in the
calendar year prior to the administration of the HOME index, and receipt
of AFDC in the calendar year prior to the administration of the HOME
index.
Odds of Being in
Mother's
the Rottom Decile
Mother's
Socioeconomic
In
On
on the HOME
IQ
Background
Poverty!
Welfare?
Index
Average
Average
No
No
4%
Average
Average
Yes
No
8%
Average
Average
No
Yes
9%
Average
Average
Yes
Yes
16%
Average
Very low
No
No
7 %
Average
Very low
Yes
No
12%)
Average
Very low
No
Yes
14%
Average
Very low
Yes
Yes
24%
Very low
Average
No
No
10%
Very low
Average
Yes
No
18%
Very low
Average
No
Yes
21%
Very low
Average
Yes
Yes
34%
"Very low" is defined as two SDs below the mean. Poverty and welfare
refer to the calendar year prior to the scoring of the HOME index.
68. The NLSY reported scores on these indexes for infants under 1 year of age,
not analyzed here.
69. This statement applies to the full white sample. In the cross-sectional sam-
ple, used for the regression results in Appendix 4, the role of birth status
(legitimate or illegitimate) was not significant when entered along with
poverty and welfare receipt.
70. A technical note that applies to the means reported in the table on page
230 and in Chapter 15. In applying the national norms, the NLSY declined
to estimate scores for very low-scoring children not covered in the PPVT's
scoring tables, instead assigning them a score of zero. For purposes of com-
puting the means above and in Chapter 15, we assigned a score of 40 (four
SDs below the mean, and the lowest score assigned in the standard tables
for scoring the PPVT) to all children with scores under 40.
7 1. Careful readers may be wondering why white children, who have had less
than their fair share of the bottom decile for most of the other indicators,
account for fully 10 percent of all NLSY children in the bottom decile. The
reason is that the women of the NLSY sample (all races) have had a high
proportion of low-IQ children, based on the national norms for the
PPVT-fully
23 percent of all NLSY children ages 6 and older when they
took the test had 1Qs of 80 or lower. For whites, 10 percent of the children
who have been tested fall into the bottom decile. This news is not quite as
had as it looks. Just because the NLSY mothers were a nationally represen-
tative sample of women in acertain age group does not mean that their chil-
dren are a nationally representative sample of children. But the news is
nonetheless worrisome, with implications that are discussed in Chapter 15.
72. See Chapter 4 for the discussion of heritability of IQ.
Chapter I I
1. The proportional increases in property crime tracked more or less with the
increases in violent crime until the late 1970s. Since then, property crime
has moved within a narrow range and in 1992 was actually lower than it
had been ten years earlier. This divergence between violent and property
crimes is in itself a potentially significant phenomenon that has yet to be
adequately explored.
2. For citations of the extensive literature on this subject, see Chaiken and
Chaiken 1983; Wilson and Herrnstein 1985. The official statistics may
have understated the increase in these "crimes that people consider seri-
ous enough to warrant reporting to the police," insofar as many burglaries,
assaults, and street robberies that would have been reported in the 1950s
(when there was a reasonable chance that the police would conduct a gen-
uine investigation) are no longer reported in urban areas, where it is taken
for granted that they are too minor to compete for limited police resources.
3. A more traditional way to sort the theories is to contrast classical theories,
7 10
Notes to pages 237-242
Notes to pages 242-245
7 1 1
which depict crime as the rational behavior of free agents, based on costs
and benefits, with positive theories, which look for the causes of crime in
society or in psychological makeup (for discussion of criminological
theory, see, for example, Gottfredson and Hirschi 1990; Wilson and
Hermstein 1985). We are distinguishing only among positive theories,
because the notion of criminals as rational agents seems to fit few actual
criminals and the role of costs and benefits can readily be absorbed by a
positive theory of criminal behavior (see Wilson and Hermstein 1985,
Chap. 2). A distinction similar to ours between psychological and socio-
logical theories is one between "psychiatric" and "criminological" theories
in Wessely and Taylor 1991.
4. Freeman 1983; Mayer and Jencks 1989; Wilson and Hermstein 1985,
Chaps. 11, 12.
5. Cleckley 1964; Colaizzi 1989.
6. Wilson and Hermstein 1985.
7. Wilson and Hermstein 1985.
8. In fact, within criminological theory, the distinction between being dis-
posed to break the law and being disposed to obey it has some resonance,
as illustrated in, for example, Gottfredson and Hirschi 1990. This is a fine
point of theory, which we cannot elaborate on here.
9. For more extended discussion of the logic of the link between IQ and com-
mitting crime, see Gottfredson and Hirschi 1990; Hirschi 1969; Wilson
and Hermstein 1985.
10. Goring 1913.
1 1 . Goddard 1914.
12. Murchison 1926. We know now that this was a peculiarity of a federal
prison like Leavenworth, which had relatively few of the run-of-the-mill
offenders typical in state prisons.
13. Sutherland 193 1.
14. Haskell and Yablonsky 1978, p. 268.
15. Reid 1979, p. 156.
16. Hirschi and Hindelang 1977.
17. Reid 1982.
18. A balanced, recent summary says, "At this juncture it seems reasonable to
conclude that the difference [between offenders and nonoffenders in in-
telligence] is real and not due to any of the possible methodological or con-
founding factors that have been noted in the literature" (Quay 1987 p.
107ff.).
19. The gap between offenders and nonoffenders is typically larger on verhal
than on performance (i.e., nonverbal) intelligence tests (Wilson and
Herrnstein 1985). It has been suggested that this is because the essential
difference between offenders and nonoffenders is the difference in g; it is
well known that verbal scores are more dependent on g than performance
scores (Gordon 1987; Jensen and Faulstich 1988). Another, not necessar-
ily inconsistent, interpretation is that verbal intelligence scores do better
at measuring the capacity for internalizing the prohibitions that help de-
ter crime in nonoffenders (Wilson and Hermstein 1985). Multiple of-
fenders, as distinguished from offenders in general, also have significant
deficits in logical reasoning ability per se (Reichel and Magnusson 1988).
Whatever the reason for these patterns of differences, the methodological
implications are clear: The rare study that fails to find much of an associ-
ation between IQ and offending may have used nonverbal scores or scores
that, for one reason or another, minimize individual differences in g.
20. E.g., Blumstein et al. 1985; Denno 1990. National studies of convicts who
get rearrested after release also show that those with low levels of educa-
tion (which are presumably correlated with low test scores) are at higher
risk for recidivism (Beck and ShiFley 1989).
21. Lipsitt et al. 1990.
22. Reichel and Magnusson 1988.
23. Hirschi 1969; Wilson and Hermstein 1985.
24. Nicholson and Kugler 1991.
25. The evidence in fact suggests that smart offenders pick crimes with lesser
likelihood of arrest and larger payoffs (Wilson and Hermstein 1985).
26. Moffitt and Silva 1988; Hindelang et al. 1981; Hirschi and Hindelang
1977; Wilson and Hermstein 1985.
27. Reichel and Magnusson 1988.
28. Kandel et al. 1988.
29. In this sample, there was no significant correlation between IQ and so-
cioeconomic status, and IQ remained a significant predictor of offending
even after the effects of parental SES and the sons' own level of education
were entered as covariates in an analysis of covariance.
30. White et al. 1989.
31. Werner and Smith 1982.
32. Werner 1989; Werner and Smith 1982.
33. For an entry into this literature, see Farrington and West 1990; Gottfred-
son and Hirschi 1990; Mednick and others 1987; Wilson and Herrnstein
1985.
34. In this regard, it is perhaps worth mentioning that we originally intended
for this book to be about individual differences generally and social policy,
with intelligence as the centerpiece. We narrowed the focus to intelligence
partly because it looms so much larger than any other individual trait in
explaining what is going on, but also out of necessity: Only for criminal
Intelligence and Criminal Propensity
- The text distinguishes between psychiatric and criminological theories regarding the disposition to obey or break the law.
- Historical research has shifted from viewing low IQ as a peculiarity of specific prison populations to recognizing a consistent gap between offenders and nonoffenders.
- Offenders typically show larger deficits in verbal intelligence compared to performance intelligence, which may reflect a lower capacity for internalizing social prohibitions.
- The concept of 'g' (general intelligence) is central to the link between cognitive ability and crime, with verbal scores being more dependent on this factor.
- Higher intelligence in offenders is associated with the selection of crimes that offer larger payoffs and a lower likelihood of arrest.
- Longitudinal studies suggest that IQ remains a significant predictor of offending even when controlling for socioeconomic status and education levels.
The evidence in fact suggests that smart offenders pick crimes with lesser likelihood of arrest and larger payoffs.
7 10
Notes to pages 237-242
Notes to pages 242-245
7 1 1
which depict crime as the rational behavior of free agents, based on costs
and benefits, with positive theories, which look for the causes of crime in
society or in psychological makeup (for discussion of criminological
theory, see, for example, Gottfredson and Hirschi 1990; Wilson and
Hermstein 1985). We are distinguishing only among positive theories,
because the notion of criminals as rational agents seems to fit few actual
criminals and the role of costs and benefits can readily be absorbed by a
positive theory of criminal behavior (see Wilson and Hermstein 1985,
Chap. 2). A distinction similar to ours between psychological and socio-
logical theories is one between "psychiatric" and "criminological" theories
in Wessely and Taylor 1991.
4. Freeman 1983; Mayer and Jencks 1989; Wilson and Hermstein 1985,
Chaps. 11, 12.
5. Cleckley 1964; Colaizzi 1989.
6. Wilson and Hermstein 1985.
7. Wilson and Hermstein 1985.
8. In fact, within criminological theory, the distinction between being dis-
posed to break the law and being disposed to obey it has some resonance,
as illustrated in, for example, Gottfredson and Hirschi 1990. This is a fine
point of theory, which we cannot elaborate on here.
9. For more extended discussion of the logic of the link between IQ and com-
mitting crime, see Gottfredson and Hirschi 1990; Hirschi 1969; Wilson
and Hermstein 1985.
10. Goring 1913.
1 1 . Goddard 1914.
12. Murchison 1926. We know now that this was a peculiarity of a federal
prison like Leavenworth, which had relatively few of the run-of-the-mill
offenders typical in state prisons.
13. Sutherland 193 1.
14. Haskell and Yablonsky 1978, p. 268.
15. Reid 1979, p. 156.
16. Hirschi and Hindelang 1977.
17. Reid 1982.
18. A balanced, recent summary says, "At this juncture it seems reasonable to
conclude that the difference [between offenders and nonoffenders in in-
telligence] is real and not due to any of the possible methodological or con-
founding factors that have been noted in the literature" (Quay 1987 p.
107ff.).
19. The gap between offenders and nonoffenders is typically larger on verhal
than on performance (i.e., nonverbal) intelligence tests (Wilson and
Herrnstein 1985). It has been suggested that this is because the essential
difference between offenders and nonoffenders is the difference in g; it is
well known that verbal scores are more dependent on g than performance
scores (Gordon 1987; Jensen and Faulstich 1988). Another, not necessar-
ily inconsistent, interpretation is that verbal intelligence scores do better
at measuring the capacity for internalizing the prohibitions that help de-
ter crime in nonoffenders (Wilson and Hermstein 1985). Multiple of-
fenders, as distinguished from offenders in general, also have significant
deficits in logical reasoning ability per se (Reichel and Magnusson 1988).
Whatever the reason for these patterns of differences, the methodological
implications are clear: The rare study that fails to find much of an associ-
ation between IQ and offending may have used nonverbal scores or scores
that, for one reason or another, minimize individual differences in g.
20. E.g., Blumstein et al. 1985; Denno 1990. National studies of convicts who
get rearrested after release also show that those with low levels of educa-
tion (which are presumably correlated with low test scores) are at higher
risk for recidivism (Beck and ShiFley 1989).
21. Lipsitt et al. 1990.
22. Reichel and Magnusson 1988.
23. Hirschi 1969; Wilson and Hermstein 1985.
24. Nicholson and Kugler 1991.
25. The evidence in fact suggests that smart offenders pick crimes with lesser
likelihood of arrest and larger payoffs (Wilson and Hermstein 1985).
26. Moffitt and Silva 1988; Hindelang et al. 1981; Hirschi and Hindelang
1977; Wilson and Hermstein 1985.
27. Reichel and Magnusson 1988.
28. Kandel et al. 1988.
29. In this sample, there was no significant correlation between IQ and so-
cioeconomic status, and IQ remained a significant predictor of offending
even after the effects of parental SES and the sons' own level of education
were entered as covariates in an analysis of covariance.
30. White et al. 1989.
31. Werner and Smith 1982.
32. Werner 1989; Werner and Smith 1982.
33. For an entry into this literature, see Farrington and West 1990; Gottfred-
son and Hirschi 1990; Mednick and others 1987; Wilson and Herrnstein
1985.
34. In this regard, it is perhaps worth mentioning that we originally intended
for this book to be about individual differences generally and social policy,
with intelligence as the centerpiece. We narrowed the focus to intelligence
partly because it looms so much larger than any other individual trait in
explaining what is going on, but also out of necessity: Only for criminal
Intelligence and Criminal Reporting
- Intelligence is used as a primary metric for explaining criminal behavior due to the extensive scientific literature available on intellectual differences.
- Self-report data on crime is often unreliable because serious offenders tend to underreport their actions while minor offenders frequently exaggerate them.
- A specific bias exists where individuals with lower intelligence are observed to be less candid in self-reports, potentially weakening the statistical correlation between IQ and crime.
- Research indicates that individuals who enter the criminal justice system at an earlier age tend to have lower intelligence scores than those who enter later in their teens.
- The concept of 'civility' is explored as a necessary trait for leaders to promote the public good, contrasting with the low priority the average person places on governance.
- The text notes a historical shift in American political life from representative government toward a more populist democracy, which some commentators viewed with concern.
At the other extreme, minor offenders brag about their criminal exploits.
7 10
Notes to pages 237-242
Notes to pages 242-245
7 1 1
which depict crime as the rational behavior of free agents, based on costs
and benefits, with positive theories, which look for the causes of crime in
society or in psychological makeup (for discussion of criminological
theory, see, for example, Gottfredson and Hirschi 1990; Wilson and
Hermstein 1985). We are distinguishing only among positive theories,
because the notion of criminals as rational agents seems to fit few actual
criminals and the role of costs and benefits can readily be absorbed by a
positive theory of criminal behavior (see Wilson and Hermstein 1985,
Chap. 2). A distinction similar to ours between psychological and socio-
logical theories is one between "psychiatric" and "criminological" theories
in Wessely and Taylor 1991.
4. Freeman 1983; Mayer and Jencks 1989; Wilson and Hermstein 1985,
Chaps. 11, 12.
5. Cleckley 1964; Colaizzi 1989.
6. Wilson and Hermstein 1985.
7. Wilson and Hermstein 1985.
8. In fact, within criminological theory, the distinction between being dis-
posed to break the law and being disposed to obey it has some resonance,
as illustrated in, for example, Gottfredson and Hirschi 1990. This is a fine
point of theory, which we cannot elaborate on here.
9. For more extended discussion of the logic of the link between IQ and com-
mitting crime, see Gottfredson and Hirschi 1990; Hirschi 1969; Wilson
and Hermstein 1985.
10. Goring 1913.
1 1 . Goddard 1914.
12. Murchison 1926. We know now that this was a peculiarity of a federal
prison like Leavenworth, which had relatively few of the run-of-the-mill
offenders typical in state prisons.
13. Sutherland 193 1.
14. Haskell and Yablonsky 1978, p. 268.
15. Reid 1979, p. 156.
16. Hirschi and Hindelang 1977.
17. Reid 1982.
18. A balanced, recent summary says, "At this juncture it seems reasonable to
conclude that the difference [between offenders and nonoffenders in in-
telligence] is real and not due to any of the possible methodological or con-
founding factors that have been noted in the literature" (Quay 1987 p.
107ff.).
19. The gap between offenders and nonoffenders is typically larger on verhal
than on performance (i.e., nonverbal) intelligence tests (Wilson and
Herrnstein 1985). It has been suggested that this is because the essential
difference between offenders and nonoffenders is the difference in g; it is
well known that verbal scores are more dependent on g than performance
scores (Gordon 1987; Jensen and Faulstich 1988). Another, not necessar-
ily inconsistent, interpretation is that verbal intelligence scores do better
at measuring the capacity for internalizing the prohibitions that help de-
ter crime in nonoffenders (Wilson and Hermstein 1985). Multiple of-
fenders, as distinguished from offenders in general, also have significant
deficits in logical reasoning ability per se (Reichel and Magnusson 1988).
Whatever the reason for these patterns of differences, the methodological
implications are clear: The rare study that fails to find much of an associ-
ation between IQ and offending may have used nonverbal scores or scores
that, for one reason or another, minimize individual differences in g.
20. E.g., Blumstein et al. 1985; Denno 1990. National studies of convicts who
get rearrested after release also show that those with low levels of educa-
tion (which are presumably correlated with low test scores) are at higher
risk for recidivism (Beck and ShiFley 1989).
21. Lipsitt et al. 1990.
22. Reichel and Magnusson 1988.
23. Hirschi 1969; Wilson and Hermstein 1985.
24. Nicholson and Kugler 1991.
25. The evidence in fact suggests that smart offenders pick crimes with lesser
likelihood of arrest and larger payoffs (Wilson and Hermstein 1985).
26. Moffitt and Silva 1988; Hindelang et al. 1981; Hirschi and Hindelang
1977; Wilson and Hermstein 1985.
27. Reichel and Magnusson 1988.
28. Kandel et al. 1988.
29. In this sample, there was no significant correlation between IQ and so-
cioeconomic status, and IQ remained a significant predictor of offending
even after the effects of parental SES and the sons' own level of education
were entered as covariates in an analysis of covariance.
30. White et al. 1989.
31. Werner and Smith 1982.
32. Werner 1989; Werner and Smith 1982.
33. For an entry into this literature, see Farrington and West 1990; Gottfred-
son and Hirschi 1990; Mednick and others 1987; Wilson and Herrnstein
1985.
34. In this regard, it is perhaps worth mentioning that we originally intended
for this book to be about individual differences generally and social policy,
with intelligence as the centerpiece. We narrowed the focus to intelligence
partly because it looms so much larger than any other individual trait in
explaining what is going on, but also out of necessity: Only for criminal
7 12
Notes to pages 245-254
Notes to pages 255-258
7 13
behavior is the scientific literature extensive enough to have permitted a
thoroughgoing presentation of individual differences other than intellec-
tual.
35. The most serious problem is the established and pronounced tendency of
black juveniles to underreport offenses (Hindelang 1978, 1981).
36. Not surprisingly, the most serious offenders are the ones who most often
underreport their crimes. Serious offenders are also the ones most likely to
go uninterviewed in survey research. At the other extreme, minor offend-
ers brag about their criminal exploits. They inflate the real level of "crime"
by putting minor incidents (for example, a school.yard fistfight, which can
easily fit the technical definition of "aggravated assault") in the same car-
egory with authentically felonious attacks.
Since we are focusing on the role of intelligence, self-report data pose
a special problem, for it has been observed that people of low intelligence
are less candid than brighter respondents. This bias would tend to weaken
the correlation between 1Q and crime in self-report data.
37. The authoritative source on self-report data for juveniles is still Hindelang
et al. 1981. See also Hindelang 1978, 1981; Smith and Davidson 1986.
38. Wolfang, Figlio, and Sellin 1972; Wilson and Herrnstein 1985.
39. These results for the entire age range are substantially the same when age
subgroups are examined, but some differences may be found. Those who
become involved with the criminal justice system at an early age tended
to have lower intelligence than those who first become involved later in
their teens.
40. This represents the top decile of white males. To use the same index across
racial groups is inadvisable because of the different reporting characteris-
tics of whites and blacks.
41. For a review of the literature, see Wilson and Hermstein 1985.
42. Elliott and Voss 1974.
43. Thornberry et al. 1985 uses the Philadelphia Cohort Study to demonstrate
rising crime after dropout for that well-known sample.
44. The sample includes those who got a GED-most
of whom had gotten it
at the correctional institution in which they were incarcerated at the time
of their interview. The results are shown in Appendix 4.
Chapter 12
1. Gove 1964. The definition is listed, sadly, as "obsolete." We can think of
no modem word doing that semantic job now.
2. More recently, Walter Lippmann used civility in his worrying book (Lipp-
mann 1955) about what he feared was disappearing with the rising
"Jacobinism" of American political life, the shift he saw early in the century
away from representative government toward populist democracy. Early in
his career as a journalist and social commentator (Lippmann 1922b), Lipp-
mann noted that the ordinary, private person sets the concerns of
governance very low on his or her list of priorities. To govern us, he said,
we needed a special breed of person, leaders with the capacity to fathom,
and the desire to promote, the public good. That capacity is what he called
civility. For a reflection on Lippmann's conception of civility by a social
scientist, see Burdick 1959.
3. There are other rationales for not voting, as, for example, the one pro-
moted on a T-shirt favored by libertarians: "Don't vote. It only encourages
them."
4. For an attempt to construe voting as a rational act from the economic
standpoint, see Downs 1957.
5. Aristotle 1905 ed., p. 1129.
6. Although the sample was not strictly representative of the American pop-
ulation, it was a broad cross-section, unlikely to be atypical except as a re-
sult of its underrepresentation of rural and minority children. Hess and
Torney 1967.
7. The second graders were excluded from some of the analyses because some
questionnaire items evoked too high a rate of meaningless or nonresponses.
8. A measure of political efficacy was based on the children's "agree" or "dis-
agree" responses to five statements, including: "I don't think public offi-
cials care much what people like me think." Or, "People like me don't have
any say about what the government does."
9. Harvey and Harvey 1970.
10. The exceptions included the measures for political efficacy and political
participation, both of which were barely correlated with intelligence, al-
though slightly correlated with socioeconomic status (primarily via
parental education, rather than family wealth). The authors speculated
that the rising cynicism of the young during the later 1960s may in part ac-
count for these deviant results.
1 I. Like other studies (e.g., Neuman 1986, see below), this one also found that
the more intelligent someone is, the more likely he or she is to be liberal
on social issues and conservative on economic ones. Chauvinistic, mili-
taristic, and anticommunistic attitude were inversely related to intelli-
gence.
12. For a brief summary of this literature as of the late 1960s, see White 1969,
who similarly concludes that political socialization, as he calls it, is highly
dependent on intelligence itself rather than on socioeconomic status.
13. Sidney Verba and Norman Nie ( 1972), leading scholars of American vot-
ing, distinguish cogently between the study of politics as a political scien-
Intelligence and Political Socialization
- Research indicates that intelligence is a stronger predictor of political socialization and attitudes than socioeconomic status.
- Higher intelligence levels correlate with liberal views on social issues and conservative views on economic ones, while being inversely related to militaristic and chauvinistic attitudes.
- Political efficacy and participation are notably linked to educational attainment rather than family wealth or income.
- The text distinguishes between political science, which focuses on community choices, and political psychology, which examines the motivations behind participation.
- Large-scale surveys like the CPS demonstrate that 'political sophistication' is primarily driven by education, which outweighs other demographic factors.
Chauvinistic, militaristic, and anticommunistic attitude were inversely related to intelligence.
7 12
Notes to pages 245-254
Notes to pages 255-258
7 13
behavior is the scientific literature extensive enough to have permitted a
thoroughgoing presentation of individual differences other than intellec-
tual.
35. The most serious problem is the established and pronounced tendency of
black juveniles to underreport offenses (Hindelang 1978, 1981).
36. Not surprisingly, the most serious offenders are the ones who most often
underreport their crimes. Serious offenders are also the ones most likely to
go uninterviewed in survey research. At the other extreme, minor offend-
ers brag about their criminal exploits. They inflate the real level of "crime"
by putting minor incidents (for example, a school.yard fistfight, which can
easily fit the technical definition of "aggravated assault") in the same car-
egory with authentically felonious attacks.
Since we are focusing on the role of intelligence, self-report data pose
a special problem, for it has been observed that people of low intelligence
are less candid than brighter respondents. This bias would tend to weaken
the correlation between 1Q and crime in self-report data.
37. The authoritative source on self-report data for juveniles is still Hindelang
et al. 1981. See also Hindelang 1978, 1981; Smith and Davidson 1986.
38. Wolfang, Figlio, and Sellin 1972; Wilson and Herrnstein 1985.
39. These results for the entire age range are substantially the same when age
subgroups are examined, but some differences may be found. Those who
become involved with the criminal justice system at an early age tended
to have lower intelligence than those who first become involved later in
their teens.
40. This represents the top decile of white males. To use the same index across
racial groups is inadvisable because of the different reporting characteris-
tics of whites and blacks.
41. For a review of the literature, see Wilson and Hermstein 1985.
42. Elliott and Voss 1974.
43. Thornberry et al. 1985 uses the Philadelphia Cohort Study to demonstrate
rising crime after dropout for that well-known sample.
44. The sample includes those who got a GED-most
of whom had gotten it
at the correctional institution in which they were incarcerated at the time
of their interview. The results are shown in Appendix 4.
Chapter 12
1. Gove 1964. The definition is listed, sadly, as "obsolete." We can think of
no modem word doing that semantic job now.
2. More recently, Walter Lippmann used civility in his worrying book (Lipp-
mann 1955) about what he feared was disappearing with the rising
"Jacobinism" of American political life, the shift he saw early in the century
away from representative government toward populist democracy. Early in
his career as a journalist and social commentator (Lippmann 1922b), Lipp-
mann noted that the ordinary, private person sets the concerns of
governance very low on his or her list of priorities. To govern us, he said,
we needed a special breed of person, leaders with the capacity to fathom,
and the desire to promote, the public good. That capacity is what he called
civility. For a reflection on Lippmann's conception of civility by a social
scientist, see Burdick 1959.
3. There are other rationales for not voting, as, for example, the one pro-
moted on a T-shirt favored by libertarians: "Don't vote. It only encourages
them."
4. For an attempt to construe voting as a rational act from the economic
standpoint, see Downs 1957.
5. Aristotle 1905 ed., p. 1129.
6. Although the sample was not strictly representative of the American pop-
ulation, it was a broad cross-section, unlikely to be atypical except as a re-
sult of its underrepresentation of rural and minority children. Hess and
Torney 1967.
7. The second graders were excluded from some of the analyses because some
questionnaire items evoked too high a rate of meaningless or nonresponses.
8. A measure of political efficacy was based on the children's "agree" or "dis-
agree" responses to five statements, including: "I don't think public offi-
cials care much what people like me think." Or, "People like me don't have
any say about what the government does."
9. Harvey and Harvey 1970.
10. The exceptions included the measures for political efficacy and political
participation, both of which were barely correlated with intelligence, al-
though slightly correlated with socioeconomic status (primarily via
parental education, rather than family wealth). The authors speculated
that the rising cynicism of the young during the later 1960s may in part ac-
count for these deviant results.
1 I. Like other studies (e.g., Neuman 1986, see below), this one also found that
the more intelligent someone is, the more likely he or she is to be liberal
on social issues and conservative on economic ones. Chauvinistic, mili-
taristic, and anticommunistic attitude were inversely related to intelli-
gence.
12. For a brief summary of this literature as of the late 1960s, see White 1969,
who similarly concludes that political socialization, as he calls it, is highly
dependent on intelligence itself rather than on socioeconomic status.
13. Sidney Verba and Norman Nie ( 1972), leading scholars of American vot-
ing, distinguish cogently between the study of politics as a political scien-
7 14
Notes to pages 258-260
Notes to pages 260-26 1
7 15
tist approaches it and political psychology. A political scientist mostly
wants to understand how ~olitical participation shapes the choices a com-
munity makes; a political psychologist tries to understand the participa-
tion itself. This chapter comes closer to political psychology than to
political science.
14. Campbell et al. 1960; Milbrath and Goel 1977; Verba and Nie 1972;
Wolfinger and Rosenstone 1980.
15. Wolfinger and Rosenstone 1980, p. 13.
16. Verba and Nie 1972.
17. The one exception, the frequency with which an individual contacted po-
litical officials for matters of ~ersonal concern, showed no such correla-
tion, but it is also the most ambiguously political. See Verba and Nie 1972.
18. There are hints, however, that, if socioeconomic status had been hroken
into components of educational level and income, educational level would
have ~redicted political participation better than income. See Figures 6-1
to 6-3 in Verba and Nie 1972.
19. Wolfinger and Rosenstone 1980. In even-numbered years, the CPS, a sur-
vey conducted monthly of a nationally representative sample of tens of
thousands of Americans, asks about voting in the November election.
These surveys also include data on income, occupation, education, and
other personal and regional variables. The Wolfinger and Rosenstone
analysis was based on the entire sample of almost 100,000 respondents in
the November surveys in 1972 and 1974 and a random suhsample used for
more detailed modeling. The main technique they used is the prohit analv-
sis, a form of multivariate analysis for estimating the changes in prohahil-
ity of some dependent variable-voting,
in this case-associated
with a
change in an independent variable-educational attainment, for exam-
ple-after
the effects of the other variables-say,
income or occupational
level-are
taken account of.
20. E.g., Peterson 1990.
21. Neuman 1986. This book aggregates data from nine studies of voting he-
tween 1948 and 1980 and comes up with a measure of "political sophisti-
cation," which seems to have considerable power in explaining much about
voting, including simple turnout. The "key causal factor" for political so-
phistication, Neuman found, is education, which explained four times as
much of the variance in sophistication as the next most influential factor
in a list that included age, race, sex, the other components of socioeco-
nomic status, parental behavior, and region of the country.
22. Wolfinger and Rosenstone 1980, p. 19.
23. Besides the works already cited, for other overviews coming to the same
basic conclusion, see Campbell et al. 1960; Milbrath and Goel 1977; Neu-
man 1986.
24. "It is difficult to find support in our data for notions that a generic status
variable plays any part in the motivational foundations of the decision to
vote" (Wolfinger and Rosenstone 1980, p. 35). Perhaps there is some ef-
fect of income on voting at the lowest levels but throughout the range of
income, it seems to have no independent predictive value of its own.
25. Verba and Nie 1972, p. 335.
26. How someone votes, rather than whether, can be more pla~~sibly
connected
to the outward benefits gained from the outcome of an election. And many
political scientists focus more on political preference than on level of en-
gagement. Political preferences, too, have their indtvidual correlates, hut
we will not try to summarize these results as well (but see, for example,
Fletcher and Forbes, 1990; Granberg and Holmberg 1990; Milbrath 1977;
Neuman 1986; Nie et al. 1976).
27. There is an indirect argument to be made by combining four observations:
(1) We know for sure that one of the traits roughly measured by educa-
tional attainment is intelligence. (2) As we showed in Chapter 1, Ameri-
can educational opportunities are more efficiently distributed by cognitive
ahility than they have ever been, here or elsewhere. (3) It is here and now
that we see the strongest correlations between voting and educational at-
tainment. (4) In countries where education and cognitive ability are not
so thoroughly enmeshed, education has less impact on voting. To fill in the
story: During the 1950s and 1960s, the level of political participation rose
more rapidly than the educational level of the population (Verba and Nie
1972, p. 252). Looking backward, we see the other side of the same coin.
In 1870, only 2 percent of the American populat~on had finished high
school; even fewer were going to college. Yet voting rates may have been
higher than they are now. Kleppner (1982) concludes that voting rates
were more than 11 percentage points above where they should have been,
had education had the same effects in the 1880s that they had in 1968.
Shortridge (1981) has a lower estimate of voter turnout in the late nine-
teenth century, but still one that exceeds expectations, given the educa-
tional levels of the period. Proper historical comparisons must, of course,
take into account changes in voting laws, in poll taxes, in registration
requirements, as well as the effects of the extension of suffrage to women
and to 18- to 20-year olds. However, after all those corrections are made,
scholars agree that past voting rates (post-Civil War, nineteenth century,
for example) are incommensurately high or present rates are incom-
mensurately low, given the changes in levels of formal education of the
general public. Except in the South of the Reconstruction, the correlation
between education and voting rate was negative from 1876 to 1892, just
the reverse of what it is now (see Kleppner 1982). The international data
indicating that education is less important in voting where education is
Education, Intelligence, and Voting Trends
- Research suggests that income has little to no independent predictive value on the decision to vote when compared to other socioeconomic factors.
- While education is currently a strong predictor of voting, historical data from the late 19th century shows high turnout despite very low formal education levels.
- The correlation between education and voting was actually negative in the late 1800s, contrasting sharply with modern political behavior.
- The text argues that the modern link between education and voting is actually an indirect measure of cognitive ability or intelligence.
- International data supports the theory that education impacts voting less in societies where education and cognitive ability are not as closely enmeshed.
Except in the South of the Reconstruction, the correlation between education and voting rate was negative from 1876 to 1892, just the reverse of what it is now.
7 14
Notes to pages 258-260
Notes to pages 260-26 1
7 15
tist approaches it and political psychology. A political scientist mostly
wants to understand how ~olitical participation shapes the choices a com-
munity makes; a political psychologist tries to understand the participa-
tion itself. This chapter comes closer to political psychology than to
political science.
14. Campbell et al. 1960; Milbrath and Goel 1977; Verba and Nie 1972;
Wolfinger and Rosenstone 1980.
15. Wolfinger and Rosenstone 1980, p. 13.
16. Verba and Nie 1972.
17. The one exception, the frequency with which an individual contacted po-
litical officials for matters of ~ersonal concern, showed no such correla-
tion, but it is also the most ambiguously political. See Verba and Nie 1972.
18. There are hints, however, that, if socioeconomic status had been hroken
into components of educational level and income, educational level would
have ~redicted political participation better than income. See Figures 6-1
to 6-3 in Verba and Nie 1972.
19. Wolfinger and Rosenstone 1980. In even-numbered years, the CPS, a sur-
vey conducted monthly of a nationally representative sample of tens of
thousands of Americans, asks about voting in the November election.
These surveys also include data on income, occupation, education, and
other personal and regional variables. The Wolfinger and Rosenstone
analysis was based on the entire sample of almost 100,000 respondents in
the November surveys in 1972 and 1974 and a random suhsample used for
more detailed modeling. The main technique they used is the prohit analv-
sis, a form of multivariate analysis for estimating the changes in prohahil-
ity of some dependent variable-voting,
in this case-associated
with a
change in an independent variable-educational attainment, for exam-
ple-after
the effects of the other variables-say,
income or occupational
level-are
taken account of.
20. E.g., Peterson 1990.
21. Neuman 1986. This book aggregates data from nine studies of voting he-
tween 1948 and 1980 and comes up with a measure of "political sophisti-
cation," which seems to have considerable power in explaining much about
voting, including simple turnout. The "key causal factor" for political so-
phistication, Neuman found, is education, which explained four times as
much of the variance in sophistication as the next most influential factor
in a list that included age, race, sex, the other components of socioeco-
nomic status, parental behavior, and region of the country.
22. Wolfinger and Rosenstone 1980, p. 19.
23. Besides the works already cited, for other overviews coming to the same
basic conclusion, see Campbell et al. 1960; Milbrath and Goel 1977; Neu-
man 1986.
24. "It is difficult to find support in our data for notions that a generic status
variable plays any part in the motivational foundations of the decision to
vote" (Wolfinger and Rosenstone 1980, p. 35). Perhaps there is some ef-
fect of income on voting at the lowest levels but throughout the range of
income, it seems to have no independent predictive value of its own.
25. Verba and Nie 1972, p. 335.
26. How someone votes, rather than whether, can be more pla~~sibly
connected
to the outward benefits gained from the outcome of an election. And many
political scientists focus more on political preference than on level of en-
gagement. Political preferences, too, have their indtvidual correlates, hut
we will not try to summarize these results as well (but see, for example,
Fletcher and Forbes, 1990; Granberg and Holmberg 1990; Milbrath 1977;
Neuman 1986; Nie et al. 1976).
27. There is an indirect argument to be made by combining four observations:
(1) We know for sure that one of the traits roughly measured by educa-
tional attainment is intelligence. (2) As we showed in Chapter 1, Ameri-
can educational opportunities are more efficiently distributed by cognitive
ahility than they have ever been, here or elsewhere. (3) It is here and now
that we see the strongest correlations between voting and educational at-
tainment. (4) In countries where education and cognitive ability are not
so thoroughly enmeshed, education has less impact on voting. To fill in the
story: During the 1950s and 1960s, the level of political participation rose
more rapidly than the educational level of the population (Verba and Nie
1972, p. 252). Looking backward, we see the other side of the same coin.
In 1870, only 2 percent of the American populat~on had finished high
school; even fewer were going to college. Yet voting rates may have been
higher than they are now. Kleppner (1982) concludes that voting rates
were more than 11 percentage points above where they should have been,
had education had the same effects in the 1880s that they had in 1968.
Shortridge (1981) has a lower estimate of voter turnout in the late nine-
teenth century, but still one that exceeds expectations, given the educa-
tional levels of the period. Proper historical comparisons must, of course,
take into account changes in voting laws, in poll taxes, in registration
requirements, as well as the effects of the extension of suffrage to women
and to 18- to 20-year olds. However, after all those corrections are made,
scholars agree that past voting rates (post-Civil War, nineteenth century,
for example) are incommensurately high or present rates are incom-
mensurately low, given the changes in levels of formal education of the
general public. Except in the South of the Reconstruction, the correlation
between education and voting rate was negative from 1876 to 1892, just
the reverse of what it is now (see Kleppner 1982). The international data
indicating that education is less important in voting where education is
7 16
Notes to pages 261-274
Notes to pages 274-278
7 17
not so enmeshed with cognitive ability come from Milbrath and Goel
(1977).
28. Exposure to political print media was another influential factor, but this,
too, turned out to be most strongly associated with rated intelligence (see
Luskin 1990).
29. The so-called Bay Area Survey, described in Neuman 1981, 1986.
30. See note 21.
31. Neuman 1986, p. 117.
32. Useful summaries can be found in Abramson and Claggett 199 1 ; Hill and
Luttbeg 1983; Kleppner 1982; Peterson 1990; Rothenberg and Licht 1982.
33. E.g., Milbrath and Goel 1977. Biological and social scientists have lately
tried to enrich our understanding of "political man" by showing the links
to social behavior in other species. For background to the huge literature
on the variety of influences on political behavior and attitudes, see Con-
verse 1964; Kinder and Sears 1985; Rokeach 1973.
34. Harvey and Harvey 1970.
35. Neuman 1986.
36. Luskin 1990.
Chapter 13
1. For a useful recent critique of the treatment of race by psychologists, also
demonstrating how difficult (impossible?) it is to he detached ahout this
issue, see Yee et al. 1993.
2. Lynn 1991c.
3. Lynn 1987a. For a critique of Lynn's early work, see Stevenson and Azuma
1983.
4. For those who want to reconstruct the debate, Lynn's 1987 and 1991 re-
view articles followed on earlier studies: Lynn 1977, 1978, 1982; Lynn and
Hampson 1986b. For his response to Flynn's 1987 critique, see Lynn 1987h.
5. Chan and Vernon 1988.
6. Lynn and Song 1994.
7. Iwawaki and Vernon 1988; Vernon 1982.
8. Flynn 1991; Sue and Okazaki 1990.
9. Flynn 1991.
10. Lynn 1993b.
11. Lynn 1987a, 1987b, 1989, 1990a, 1990b, 1991b, 1991c, 1992, 1993a,
199313; Lynn and Hattori 1990; Lynn, Pagliari, and Chan 1988.
12. Lynn, Hampson, and Iwawaki 1987.
13. Lynn 1991c.
14. Stevenson et al. 1985.
15. Lynn 1991a, p. 733. Lynn has noted that the mean white IQ in Minnesota
is approximately 105, well above the average for the American white pop-
ulation. On the other hand, it is possible that the cities chosen in Japan
and Taiwan were similarly elevated.
16. An excellent account of the literature may be found in Storfer 1990, pp.
3 14-321, from which our generalizations are taken. For Jews in Britain, see
also Lynn 1992.
17. Storfer 1990, pp. 321-323.
18. As reported in Jensen 1984b, p. 479.
19. Sattler 1988.
20. A detailed and comprehensive review of the literature through 1980 may
be found in Osbome and McGurk 1982; Shuey 1966. For an excellent one-
volume synthesis and analysis, see Loehlin, Lindzey, and Spuhler 1975.
2 1. Standard deviations are explained in Appendix 1.
22. To qualify, all studies had to report data for both a white and black sam-
ple, with a sample size of at least fifty in each group, drawn from compara-
ble populations that purported to be representative of the general
population of that age and geographic area (studies of special populations
such as delinquents were excluded). Socioeconomic status posed a special
problem. If a study explicitly matched subjects by SES, it was excluded. If
it simply drew its samples from a low-SES area, it was included, even though
some degree of matching had occurred. The study had to use a standard-
ized test of cognitive ability, although not all of them were IQ tests and not
all included a complete battery. If the scores were reported as IQs, a stan-
dard deviation of 15 was imputed if no standard deviations for that sample
were given.
23. To get the IQ equivalent of SD differences, multiply the SD difference by
15; hence, 1.08 X 15 = 16.2 IQ points.
24. This figure is based on non-Latino whites. The difference between blacks
and the combined white-Latino sample in the NLSY is 1.12 SDs. Because
the U.S. Latino population was proportionally very small until the 1970s,
the NLSY figure for non-Latino whites is more comparable to the earlier
tests, in terms of definition of the sample, than the figure for the combined
white-Latino sample, and we shall use it exclusively in discussions of the
NLSY data throughout the chapter.
25. The formula is o Diff = (z. - R,)/~N,oE + N~o:)/(N. t N,) , where N
is the sample size, X is the sample mean, a is the standard deviation, and
w and b stand for white and black, respectively (taken from Jensen and
Reynolds 1982, p. 425). Note that our white sample differs from the one
used in Office of the Assistant Secretary of Defense (Manpower) (1982).
The "white" sample in that report included all persons not identified as
Academic Citations on Intelligence
- The text provides an extensive bibliography of psychological and biological research regarding political behavior and human intelligence.
- A significant portion of the citations focuses on the controversial work of Richard Lynn and his critics regarding racial differences in IQ.
- Methodological criteria for comparative studies are outlined, requiring representative samples and standardized cognitive testing.
- The data highlights specific demographic comparisons, including IQ averages in Japan, Taiwan, and various American sub-populations.
- Statistical formulas and standard deviations are employed to calculate the 'IQ equivalent' of differences between racial and ethnic groups.
For a useful recent critique of the treatment of race by psychologists, also demonstrating how difficult (impossible?) it is to he detached ahout this issue, see Yee et al. 1993.
7 16
Notes to pages 261-274
Notes to pages 274-278
7 17
not so enmeshed with cognitive ability come from Milbrath and Goel
(1977).
28. Exposure to political print media was another influential factor, but this,
too, turned out to be most strongly associated with rated intelligence (see
Luskin 1990).
29. The so-called Bay Area Survey, described in Neuman 1981, 1986.
30. See note 21.
31. Neuman 1986, p. 117.
32. Useful summaries can be found in Abramson and Claggett 199 1 ; Hill and
Luttbeg 1983; Kleppner 1982; Peterson 1990; Rothenberg and Licht 1982.
33. E.g., Milbrath and Goel 1977. Biological and social scientists have lately
tried to enrich our understanding of "political man" by showing the links
to social behavior in other species. For background to the huge literature
on the variety of influences on political behavior and attitudes, see Con-
verse 1964; Kinder and Sears 1985; Rokeach 1973.
34. Harvey and Harvey 1970.
35. Neuman 1986.
36. Luskin 1990.
Chapter 13
1. For a useful recent critique of the treatment of race by psychologists, also
demonstrating how difficult (impossible?) it is to he detached ahout this
issue, see Yee et al. 1993.
2. Lynn 1991c.
3. Lynn 1987a. For a critique of Lynn's early work, see Stevenson and Azuma
1983.
4. For those who want to reconstruct the debate, Lynn's 1987 and 1991 re-
view articles followed on earlier studies: Lynn 1977, 1978, 1982; Lynn and
Hampson 1986b. For his response to Flynn's 1987 critique, see Lynn 1987h.
5. Chan and Vernon 1988.
6. Lynn and Song 1994.
7. Iwawaki and Vernon 1988; Vernon 1982.
8. Flynn 1991; Sue and Okazaki 1990.
9. Flynn 1991.
10. Lynn 1993b.
11. Lynn 1987a, 1987b, 1989, 1990a, 1990b, 1991b, 1991c, 1992, 1993a,
199313; Lynn and Hattori 1990; Lynn, Pagliari, and Chan 1988.
12. Lynn, Hampson, and Iwawaki 1987.
13. Lynn 1991c.
14. Stevenson et al. 1985.
15. Lynn 1991a, p. 733. Lynn has noted that the mean white IQ in Minnesota
is approximately 105, well above the average for the American white pop-
ulation. On the other hand, it is possible that the cities chosen in Japan
and Taiwan were similarly elevated.
16. An excellent account of the literature may be found in Storfer 1990, pp.
3 14-321, from which our generalizations are taken. For Jews in Britain, see
also Lynn 1992.
17. Storfer 1990, pp. 321-323.
18. As reported in Jensen 1984b, p. 479.
19. Sattler 1988.
20. A detailed and comprehensive review of the literature through 1980 may
be found in Osbome and McGurk 1982; Shuey 1966. For an excellent one-
volume synthesis and analysis, see Loehlin, Lindzey, and Spuhler 1975.
2 1. Standard deviations are explained in Appendix 1.
22. To qualify, all studies had to report data for both a white and black sam-
ple, with a sample size of at least fifty in each group, drawn from compara-
ble populations that purported to be representative of the general
population of that age and geographic area (studies of special populations
such as delinquents were excluded). Socioeconomic status posed a special
problem. If a study explicitly matched subjects by SES, it was excluded. If
it simply drew its samples from a low-SES area, it was included, even though
some degree of matching had occurred. The study had to use a standard-
ized test of cognitive ability, although not all of them were IQ tests and not
all included a complete battery. If the scores were reported as IQs, a stan-
dard deviation of 15 was imputed if no standard deviations for that sample
were given.
23. To get the IQ equivalent of SD differences, multiply the SD difference by
15; hence, 1.08 X 15 = 16.2 IQ points.
24. This figure is based on non-Latino whites. The difference between blacks
and the combined white-Latino sample in the NLSY is 1.12 SDs. Because
the U.S. Latino population was proportionally very small until the 1970s,
the NLSY figure for non-Latino whites is more comparable to the earlier
tests, in terms of definition of the sample, than the figure for the combined
white-Latino sample, and we shall use it exclusively in discussions of the
NLSY data throughout the chapter.
25. The formula is o Diff = (z. - R,)/~N,oE + N~o:)/(N. t N,) , where N
is the sample size, X is the sample mean, a is the standard deviation, and
w and b stand for white and black, respectively (taken from Jensen and
Reynolds 1982, p. 425). Note that our white sample differs from the one
used in Office of the Assistant Secretary of Defense (Manpower) (1982).
The "white" sample in that report included all persons not identified as
Statistical Nuances of Cognitive Testing
- The authors define their 'white' sample more strictly than other reports by excluding Hispanic, American Indian, and Asian or Pacific ethnic groups.
- Estimates suggest approximately 100,000 Black Americans possess an IQ of 125 or higher, based on a compromise between different statistical distribution models.
- The text asserts that major standardized tests like the SAT, GRE, and LSAT show no external evidence of bias against minority groups.
- In instances where bias is detected, the authors claim tests often 'overpredict' performance for Black students relative to their actual school outcomes.
- The 'oarsman:regatta' analogy is cited as a rare example of potential cultural bias that is frequently used because few other test items exhibit similar flaws.
- Research into reaction times and digit span tests is presented as evidence that cognitive differences persist even in tasks with minimal cultural content.
The reason why the 'oarsman:regatta' example has been used so often in descriptions of cultural bias is that it is one of the few items in the SAT that looks so obviously guilty.
7 18
Notes to pages 278-283
Notes to pages 283-288
7 19
Hispanic or black, whereas our "white" sample also excluded persons iden-
t~fying themselves as Amerlcan Indians or a member of an Asian or Pacific
ethnic group. The NLSY and the AFQT are described in the Introduction
to Part I1 and Appendlx 2.
26. This is a very rough estimate. As of 1994 there were approximately 32.8
million blacks in America. If the estimate is computed based on the mean
IQ (86.7) and standard deviation (12.4) of blacks in the NLSY, a table of
the normal distribution Indicates that only about 0.1 percent, or about
33,000, would have IQs of 125 or higher. If one applies the observed distri-
bution In the NLSY and asks what proportion of blacks are In the top five
percent of the AFQT distribution (roughly corresponding to an IQ of 125),
the result, 0.4 percent, implies that the answer IS about 13 1,000. There are
reasons to think that both estimates err In different directlons. We com-
promised with 100,000.
27. For example, no external evldence for bias has turned up with the WISC,
WAIS, Stanford-Binet, Iowa Test of Educational Development, California
Achievement Test, SAT, ACT, GRE, LSAT, MCAT, Wonderlic Person-
nel Test, GATB, and ASVAB (including the AFQT in particular).
28. If any bias has been found, it is primarily regarding performance in school,
and it shows that test scores for blacks often "overpredict" performance;
that is, the tests are biased "in favor" of blacks, tending for unknown rea-
sons to pred~ct higher performance than is actually observed. See Appen-
dix 5 for details.
29. Weiss 1987, p. 121. A separate argument, made ~n Zoref and Williams
(1980), adduced ev~dence that verbal items in IQ tests are disproportion^
ately based on white males "in role-stereotyped representations." The au-
thors do not present evldence that performance on these Items varies by
race or gender in ways that would Indicate bias but rather indlct the tests
as a whole on the basis of their sexism and racism.
30. The reason why the "oarsman:regattan example has been used so often in
descriptions of cultural blas is that it is one of the few Items in the SAT
that looks so obviously guilty. Perhaps if a test consisted exclustvely of items
that were equivalent to the example, it would be posslble to demonstrate
cultural bias stattstlcally, but no modern test has more than a few that come
close to "oarsman:regatta."
31. The definitive assessment of internal evidence of bias 1s In Jensen 1980.
32. E.g., Valencia and Rankin 1988; Munford and Munoz 1980.
33. For a revlew, see Jensen 1980.
34. The NLSY has higher scores for whltes than blacks on backward digit span
and virtually no difference at all for forward digit span. In a similar way,
SES differences within races are also greater for backward dlglt tests than
forward digit tests (Jensen and Figueroa 1975).
35. Gordon 1984. See Farrell1983, and the attached responses, for an attempt
to explain the difference in digit span results through cultural blas hy-
potheses.
36. Another commonly used apparatus involves a home button and a pair of
other buttons, for yes and no, tn response to tasks presented by a computer
console. The results from both types of apparatus are congruent.
37. The literature is extensive, and we are bypassing whlch aspect of reaction
time in fact covaries wtth g. For our purposes, it is only necessary thar some
aspects do so. For some of the issues, see, for example, Barrett, Eysenck,
and Lucking 1986; Matthews and Dorn 1989; Vernon 1983; Vernon et al.
1985.
38. Jensen and Munro 1979.
39. Jensen 199313.
40. The dependent variable is age-equated IQ score, and the independent vari-
ables are a binary variable for race (whtte or black) and the parental SES
index. The difference between the resultlngpredicted IQs is divided by the
pooled we~ghted standard devtation.
41. Among the young women in the RAND study of adolescent pregnancy de-
scribed in Chapter 8 (Abrahamse et al, 1988), drawn from the nationally
representative High School and Beyond sample, the same procedure re.
duced the B/W difference by 32 percent. See also Jensen and Reynolds
1982 and Jensen and Figueroa 1975.
42. For some people, controlling for status is a tacit way of isolattng the ge-
netic difference between the races. Thts logic is as fallacious as the logic
behind controlling for SES that ignores the ways in whtch IQ helps deter-
mine socioeconomic status. See later in the chapter for our views on ge-
netics and the B/W difference.
43. In other major studtes the B/W difference continues to widen even at the
highest SES levels. In 1975, for example, Jensen and Figueroa (1975) ob-
tained full-scale WISC IQ scores for 622 whites and 622 blacks, ages 5 to
12, from a random sample of ninety-e~ght California school distrtcts. They
broke down the scores into ten categories of SES, using Duncan's index of
socioeconomtc prestige based on occupation. They found a B/W discrep-
ancy that went from a mere .13 SD in the lowest SES decile up to 1.20 SD
in the htghest SES dectle. Going to the opposite type of test data, the
Scholastic Aptitude Test taken by millions, self-selected wlth a bias toward
the upper end of the cognitive dtstributton, the same pattern emerged. In
1991, to take a typical year, the B/W difference among students whose par-
ents had less than a high school diploma was .58 SD (averagmg verbal and
mathemattcal scores), while the B/W difference among students whose
parents had a graduate degree was .78 SD. (National Ethnic/Sex Data for
1991, unpublished data available by request from the College Board). In
Socioeconomic Status and IQ Gaps
- Statistical adjustments for socioeconomic status (SES) typically reduce the observed black-white IQ difference by approximately one-third.
- The authors argue that controlling for status is logically fallacious because it ignores how cognitive ability helps determine socioeconomic standing.
- Data from multiple studies suggest that the black-white IQ gap actually widens at higher levels of socioeconomic prestige and parental education.
- Research using the SAT shows a larger standard deviation gap between students of graduate-degree-holding parents than between those whose parents did not finish high school.
- Historical reviews of thirteen studies found that in twelve cases, the racial IQ discrepancy was more pronounced in high-SES groups than in low-SES groups.
- The text notes that certain tests, like the K-ABC, show smaller gaps because they are less saturated with 'g' (general intelligence) and rely more on memory.
This logic is as fallacious as the logic behind controlling for SES that ignores the ways in which IQ helps determine socioeconomic status.
7 18
Notes to pages 278-283
Notes to pages 283-288
7 19
Hispanic or black, whereas our "white" sample also excluded persons iden-
t~fying themselves as Amerlcan Indians or a member of an Asian or Pacific
ethnic group. The NLSY and the AFQT are described in the Introduction
to Part I1 and Appendlx 2.
26. This is a very rough estimate. As of 1994 there were approximately 32.8
million blacks in America. If the estimate is computed based on the mean
IQ (86.7) and standard deviation (12.4) of blacks in the NLSY, a table of
the normal distribution Indicates that only about 0.1 percent, or about
33,000, would have IQs of 125 or higher. If one applies the observed distri-
bution In the NLSY and asks what proportion of blacks are In the top five
percent of the AFQT distribution (roughly corresponding to an IQ of 125),
the result, 0.4 percent, implies that the answer IS about 13 1,000. There are
reasons to think that both estimates err In different directlons. We com-
promised with 100,000.
27. For example, no external evldence for bias has turned up with the WISC,
WAIS, Stanford-Binet, Iowa Test of Educational Development, California
Achievement Test, SAT, ACT, GRE, LSAT, MCAT, Wonderlic Person-
nel Test, GATB, and ASVAB (including the AFQT in particular).
28. If any bias has been found, it is primarily regarding performance in school,
and it shows that test scores for blacks often "overpredict" performance;
that is, the tests are biased "in favor" of blacks, tending for unknown rea-
sons to pred~ct higher performance than is actually observed. See Appen-
dix 5 for details.
29. Weiss 1987, p. 121. A separate argument, made ~n Zoref and Williams
(1980), adduced ev~dence that verbal items in IQ tests are disproportion^
ately based on white males "in role-stereotyped representations." The au-
thors do not present evldence that performance on these Items varies by
race or gender in ways that would Indicate bias but rather indlct the tests
as a whole on the basis of their sexism and racism.
30. The reason why the "oarsman:regattan example has been used so often in
descriptions of cultural blas is that it is one of the few Items in the SAT
that looks so obviously guilty. Perhaps if a test consisted exclustvely of items
that were equivalent to the example, it would be posslble to demonstrate
cultural bias stattstlcally, but no modern test has more than a few that come
close to "oarsman:regatta."
31. The definitive assessment of internal evidence of bias 1s In Jensen 1980.
32. E.g., Valencia and Rankin 1988; Munford and Munoz 1980.
33. For a revlew, see Jensen 1980.
34. The NLSY has higher scores for whltes than blacks on backward digit span
and virtually no difference at all for forward digit span. In a similar way,
SES differences within races are also greater for backward dlglt tests than
forward digit tests (Jensen and Figueroa 1975).
35. Gordon 1984. See Farrell1983, and the attached responses, for an attempt
to explain the difference in digit span results through cultural blas hy-
potheses.
36. Another commonly used apparatus involves a home button and a pair of
other buttons, for yes and no, tn response to tasks presented by a computer
console. The results from both types of apparatus are congruent.
37. The literature is extensive, and we are bypassing whlch aspect of reaction
time in fact covaries wtth g. For our purposes, it is only necessary thar some
aspects do so. For some of the issues, see, for example, Barrett, Eysenck,
and Lucking 1986; Matthews and Dorn 1989; Vernon 1983; Vernon et al.
1985.
38. Jensen and Munro 1979.
39. Jensen 199313.
40. The dependent variable is age-equated IQ score, and the independent vari-
ables are a binary variable for race (whtte or black) and the parental SES
index. The difference between the resultlngpredicted IQs is divided by the
pooled we~ghted standard devtation.
41. Among the young women in the RAND study of adolescent pregnancy de-
scribed in Chapter 8 (Abrahamse et al, 1988), drawn from the nationally
representative High School and Beyond sample, the same procedure re.
duced the B/W difference by 32 percent. See also Jensen and Reynolds
1982 and Jensen and Figueroa 1975.
42. For some people, controlling for status is a tacit way of isolattng the ge-
netic difference between the races. Thts logic is as fallacious as the logic
behind controlling for SES that ignores the ways in whtch IQ helps deter-
mine socioeconomic status. See later in the chapter for our views on ge-
netics and the B/W difference.
43. In other major studtes the B/W difference continues to widen even at the
highest SES levels. In 1975, for example, Jensen and Figueroa (1975) ob-
tained full-scale WISC IQ scores for 622 whites and 622 blacks, ages 5 to
12, from a random sample of ninety-e~ght California school distrtcts. They
broke down the scores into ten categories of SES, using Duncan's index of
socioeconomtc prestige based on occupation. They found a B/W discrep-
ancy that went from a mere .13 SD in the lowest SES decile up to 1.20 SD
in the htghest SES dectle. Going to the opposite type of test data, the
Scholastic Aptitude Test taken by millions, self-selected wlth a bias toward
the upper end of the cognitive dtstributton, the same pattern emerged. In
1991, to take a typical year, the B/W difference among students whose par-
ents had less than a high school diploma was .58 SD (averagmg verbal and
mathemattcal scores), while the B/W difference among students whose
parents had a graduate degree was .78 SD. (National Ethnic/Sex Data for
1991, unpublished data available by request from the College Board). In
720
Notes to pages 289-292
Notes to pages 292-293
72 1
their separate reviews of the literature, Audrey Shuey (whose review was
published in 1966) and John Loehlin and his colleagues (review published
in 1975) identified thirteen studies conducted from 1948 through the early
1970s that resented IQ means for low- and high-SES groups by race. In
twelve of the thirteen studies, the black-white difference in IQ was higher
for the higher-SES group than for the lower-SES group. For similar results
for the 1981 standardization of the WAIS-R, see Reynolds et al. 1987. A
final comment is that the NLSY also shows an increasing B/W difference
at the upper end of the socioeconomic scale when the 1980 AFQT scar-
ing system is used and the scores are not corrected for skew. See Appendix
2 for a discussion of the scoring issues.
44. Kendall, Verster, and Mollendorf 1988.
45. Kendall, Verster, and Mollendorf 1988. For another example, this time of
an entire book devoted to testing in the African setting that fails to men-
tion a single mean, see Schwarz and Krug 1972.
46. Lynn 199 1c.
47. Boissiere et al. 1985.
48. Owen 1992.
49. Reynolds et al. 1987.
50. Vincent 1991.
5 1. Vincent also cites two nonnormative studies of children in which the R/W
differences ranged from only one to nine points. These are the differences
after controlling for SES, which, as we explain in the text, shrinks the A/W
gap by about one-third.
52. Jensen 1984a; Jensen and Naglieri 1987; Naglieri 1986. They point out
that the K-ARC test is less saturated with g than a conventional IQ mea-
sure and more dependent on memory, both of which would tend to reduce
the B/W difference (Naglieri and Bardos 1987).
53. Jensen 1993b.
54. Rased on the white and black SDs for 1980, the first year that standard de-
viations by race were published.
55. Wainer 1988.
56. Our reasons for concluding that the narrowing of the B/W differences on
the SAT was real, despite the potential artifacts involved in SAT score, are
as follows. Regarding the self-selection problem, the key consideration is
that the proportion of blacks taking the test rose throughout the
1976-1993 period (including the subperiod 1980-1993). In 1976, blacks
who took the SAT represented 10 percent of black 17-year-olds; in 1980,
the proportion had risen to 13 percent; by 1993, it had risen to about 20
percent. While this does not necessarily mean that blacks taking the SAT
were coming from lower socioeconomic groups (the data on parental edu-
cation and income from 1980 to 1993 indicate they were not), the pool
probably became less selective insofar as it drew from lower portions of the
ability distribution. The improvement in black scores is therefore more
likely to be understated by the SAT data than exaggerated.
Howard Wainer (1988) has argued that changes in black test scores are
uninterpretable because of anomalies that could be inferred from the test
scores of students who did not disclose their ethnicity on the SAT back-
ground questionnaire (nonresponders). Apart from several technical ques-
tions about Wainer's conclusions that arise from his presentation, the key
point is that the nonresponder population has diminished substantially. As
it has diminished, there are no signs that the story told by the SAT is chang-
ing. The basic shape of the falling trendline for the black-white difference
cannot plausibly be affected by nonresponders (though the true means in
any given year might well be somewhat different from the means based on
those who identify their ethnicity).
57. The range of .15 to .25 SD takes the data in both the text and Appendix
5 into account. To calculate the narrowing in IQ terms, we need to esti-
mate the correlation between IQ and the various measures of educational
preparation. A lower correlation would shrink the estimate of the amount
of 1Q narrowing between blacks and whites, and vice versa for a higher es-
timate. The two- to three-point estimate in the text assumes that this cor-
relation is somewhere between .6 and .8. If we instead rely entirely on the
SAT data and consider it to be a measure of intelligence per se, then the
narrowing has been four points in IQ, but only for the population that ac-
tually takes the test.
58. A change of one IQ point in a generation for genetic reasons is not out of
the realm of possibility, given sufficient differential fertility. However, the
evidence on differential fertility (see Chapter 15) implies not a shrinking
hlack-white gap but a growing one.
59. Jaynes and Williams 1989; Jencks and Peterson 1991.
60. Linear extrapolations are not to be taken seriously in these situations. A
linear continuation of the black and white SAT trends from 1980 to 1990
would bring a convergence with the white mean in the year in 2035 on
the Verbal and 2053 on the Math. And when it occurs, racial differences
would not be ended, for if we apply the same logic to the Asian scores, in
that year of 2053 when blacks and whites both have a mean of 555 on the
Math test, the Asian mean would be 632. The Asian Verbal mean (again,
based on 1980-1990) would be 510 in the year 2053, forty-seven points
ahead of the white mean. But-such
is the logic of linear extrapolations
from a short time ~eriod-the black Verbal score would by that time have
surpassed the white mean by thirty-seven points and would be 500, only
Analyzing Black-White SAT Trends
- The proportion of black 17-year-olds taking the SAT doubled between 1976 and 1993, suggesting that score improvements occurred despite a less selective testing pool.
- Arguments that non-disclosed ethnicity data (nonresponders) invalidate these trends are dismissed as the nonresponder population has significantly diminished over time.
- The narrowing of the black-white gap is estimated at two to three IQ points, though this depends on the assumed correlation between educational preparation and intelligence.
- While some attribute changes to genetics, current evidence on differential fertility suggests the gap should be widening rather than shrinking, pointing toward environmental factors.
- Linear extrapolations of test score trends are criticized as unreliable, as they lead to mathematically improbable outcomes for different racial groups in the future.
- ACT data mirrors the SAT findings, showing rising mean scores for black students alongside increased participation rates.
Linear trends over short periods of time cannot be sensibly extrapolated much into the future, notwithstanding how often one sees such extrapolations in the media.
720
Notes to pages 289-292
Notes to pages 292-293
72 1
their separate reviews of the literature, Audrey Shuey (whose review was
published in 1966) and John Loehlin and his colleagues (review published
in 1975) identified thirteen studies conducted from 1948 through the early
1970s that resented IQ means for low- and high-SES groups by race. In
twelve of the thirteen studies, the black-white difference in IQ was higher
for the higher-SES group than for the lower-SES group. For similar results
for the 1981 standardization of the WAIS-R, see Reynolds et al. 1987. A
final comment is that the NLSY also shows an increasing B/W difference
at the upper end of the socioeconomic scale when the 1980 AFQT scar-
ing system is used and the scores are not corrected for skew. See Appendix
2 for a discussion of the scoring issues.
44. Kendall, Verster, and Mollendorf 1988.
45. Kendall, Verster, and Mollendorf 1988. For another example, this time of
an entire book devoted to testing in the African setting that fails to men-
tion a single mean, see Schwarz and Krug 1972.
46. Lynn 199 1c.
47. Boissiere et al. 1985.
48. Owen 1992.
49. Reynolds et al. 1987.
50. Vincent 1991.
5 1. Vincent also cites two nonnormative studies of children in which the R/W
differences ranged from only one to nine points. These are the differences
after controlling for SES, which, as we explain in the text, shrinks the A/W
gap by about one-third.
52. Jensen 1984a; Jensen and Naglieri 1987; Naglieri 1986. They point out
that the K-ARC test is less saturated with g than a conventional IQ mea-
sure and more dependent on memory, both of which would tend to reduce
the B/W difference (Naglieri and Bardos 1987).
53. Jensen 1993b.
54. Rased on the white and black SDs for 1980, the first year that standard de-
viations by race were published.
55. Wainer 1988.
56. Our reasons for concluding that the narrowing of the B/W differences on
the SAT was real, despite the potential artifacts involved in SAT score, are
as follows. Regarding the self-selection problem, the key consideration is
that the proportion of blacks taking the test rose throughout the
1976-1993 period (including the subperiod 1980-1993). In 1976, blacks
who took the SAT represented 10 percent of black 17-year-olds; in 1980,
the proportion had risen to 13 percent; by 1993, it had risen to about 20
percent. While this does not necessarily mean that blacks taking the SAT
were coming from lower socioeconomic groups (the data on parental edu-
cation and income from 1980 to 1993 indicate they were not), the pool
probably became less selective insofar as it drew from lower portions of the
ability distribution. The improvement in black scores is therefore more
likely to be understated by the SAT data than exaggerated.
Howard Wainer (1988) has argued that changes in black test scores are
uninterpretable because of anomalies that could be inferred from the test
scores of students who did not disclose their ethnicity on the SAT back-
ground questionnaire (nonresponders). Apart from several technical ques-
tions about Wainer's conclusions that arise from his presentation, the key
point is that the nonresponder population has diminished substantially. As
it has diminished, there are no signs that the story told by the SAT is chang-
ing. The basic shape of the falling trendline for the black-white difference
cannot plausibly be affected by nonresponders (though the true means in
any given year might well be somewhat different from the means based on
those who identify their ethnicity).
57. The range of .15 to .25 SD takes the data in both the text and Appendix
5 into account. To calculate the narrowing in IQ terms, we need to esti-
mate the correlation between IQ and the various measures of educational
preparation. A lower correlation would shrink the estimate of the amount
of 1Q narrowing between blacks and whites, and vice versa for a higher es-
timate. The two- to three-point estimate in the text assumes that this cor-
relation is somewhere between .6 and .8. If we instead rely entirely on the
SAT data and consider it to be a measure of intelligence per se, then the
narrowing has been four points in IQ, but only for the population that ac-
tually takes the test.
58. A change of one IQ point in a generation for genetic reasons is not out of
the realm of possibility, given sufficient differential fertility. However, the
evidence on differential fertility (see Chapter 15) implies not a shrinking
hlack-white gap but a growing one.
59. Jaynes and Williams 1989; Jencks and Peterson 1991.
60. Linear extrapolations are not to be taken seriously in these situations. A
linear continuation of the black and white SAT trends from 1980 to 1990
would bring a convergence with the white mean in the year in 2035 on
the Verbal and 2053 on the Math. And when it occurs, racial differences
would not be ended, for if we apply the same logic to the Asian scores, in
that year of 2053 when blacks and whites both have a mean of 555 on the
Math test, the Asian mean would be 632. The Asian Verbal mean (again,
based on 1980-1990) would be 510 in the year 2053, forty-seven points
ahead of the white mean. But-such
is the logic of linear extrapolations
from a short time ~eriod-the black Verbal score would by that time have
surpassed the white mean by thirty-seven points and would be 500, only
722
Notes to page 294
ten points behind the Asians. In 2069, the black Verbal mean would sur-
pass the Asian Verbal mean. Linear trends over short periods of time can-
not be sensibly extrapolated much into the future, notwithstanding how
often one sees such extrapolations in the media.
61. See Appendix 5 for ACT results. In short, the mean rose from 16.2 to in
1986 to 17.1 in 1993. The number of black ACT students also continued
to rise during this period, suggesting that the increase after 1986 was not
the result of a more selective pool.
62. Chapter 18 explores this line of thought further.
63. SAT trends are subject to a variety of questions relating to the changing
nature of the SAT pool. The discussion that follows is based on unreported
analyses checking out the possibility that the results reflect these poten-
tial artifacts (e.g., changes in the proportion of Asians using English as their
first language; changes in the proportion of students coming from homes
where the parents did not go to college). The discussion of these matters
may be found in Chapter 18.
64. The first year for which a frequency distribution of scores by ethnicity has
been published is 1980.
65. Trying to predict trends on the basis ofequivalent percentage changes from
different baselines is a treacherous proposition. A comparison with black
and Asian gains makes the point. For example, the percentage of hlacks
scoring in the 700s on the SAT-Verbal grew by 23 percent from 1980 to
1990, within a percentage point of the Asian proportional increase. For
students scoring in the 600s, the black increase was 37 percent, not far be-
low the Asian increase of 48 percent. The difficulty with using proportions
in this instance is that the baselines are so different. Take the case of stu-
dents scoring in the 600s on the SATV, for example. The proportions that
produced that 37 percent increase for blacks were eleven students out of a
thousand in 1980 versus fifteen students out of a thousand in 1990. The
Asian change, put in the same metric, was from fifty-five students in 1980
to eighty-one students in 1990. For every four students per thousand that
blacks gained in the 600 group, Asians gained twenty-six per thousand.
66. This statement is based on a calculation that assumes that the 1980 dis-
tribution of scores remained the same except for the categories of interest.
To illustrate, in 1980, 19.8 percent of black students scored from 200 to
249. In 1993, only 13.1 percent scored in that range. Suppose that we treat
the percentage distribution for 1980 as if it consisted of 1,000 students. In
that year, 198 of those students scored in the 200 to 249 range. We then
recompute the mean for the 1980 distribution, substituting 128 for 198 in
the 200 to 249 point category (assigning midpoint values to all the inter-
vals to reach a grouped mean), so in effect we are calculating a mean for a
fictitious population of 1000 - 198 + 128 = 930. (The actual calculations
used unrounded proportions based on the actual frequencies in each in-
terval.)
A technical note for those who might wish to reproduce this analysis:
When means are computed from grouped data, the midpoint of an inter-
val is not necessarily the actual mean of people in that interval, usually be-
cause more than 50 percent of the scores will tend to be found in the fatter
part of the distribution covered by the interval but also because scores may
be bunched at the extreme categories. In the SAT+Math, for example, a
disproportionate number of the people in the interval from 750 to 800 have
scores of 800 and of those in the interval from 200 to 249 have scores of
200 (because they guessed wrong so often that their score is driven down
to the minimum). Such effects can produce a noticeable bias in the esti-
mated mean. For example, the actual verbal mean d
black students in 1980
was 330. If one computes the mean based on the distribution published an-
nually by the College Board, which run in fifty-point intervals from 200
to 800, the result is 336.4. The actual mean in 1990 was 352; the grouped
mean is 357.9. The computed figure in the text is based on the surrogate
mean as described above compared to the grouped 1980 and 1990 means,
to provide a consistent framework.
67. The contrast with the Asian experience on the SATs is striking. The Asian
Math mean rose from 509 to 535. Of this increase, none of it was due to
decreases in students scoring less than 200 (compared to 22 percent for
blacks), while a remarkable 54 percent was due to gains in the 700 and up
group (compared to 3 percent for blacks). Meanwhile, on the Verbal test,
the Asian mean rose from 396 to 415 from 1980 to 1993. Of this, only 17
percent occurred because of reductions in Asians scoring in the 200s (com-
pared to 51 percent for blacks), while 9 percent occurred because of in-
creases in Asians scoring in the 700s (compared to 0.4 percent for blacks).
The Asian increase in test scores has been driven by improvements among
the best students, while the black increase has been driven by improve-
ments among the worst students. We are unable to find any artifacts in the
changing nature of the black and Asian SAT pools that would explain
these results. The continued Asian improvement makes it difficult to
blame the slowdown in black improvement in the last decade on events
that somehow made it impossible for any American students to make
progress. Explanations could be advanced based on events specific to
blacks.
68. Snyderman and Rothman 1988. The sample was based on random selec-
tions from the Members and Fellows of the American Educational Re-
search Association, National Council on Measurement in Education, six
divisions of the American Psychological Association (Developmental Psy-
chology, Educational Psychology, Evaluation and Measurement, School
Analyzing SAT Score Trends
- The text examines potential artifacts in SAT data, such as changes in the proportion of non-native English speakers or parental education levels.
- Statistical comparisons between ethnic groups are complicated by vastly different baseline numbers, making percentage-based growth misleading.
- While black and Asian students showed similar percentage increases in high scores, the absolute number of students added per thousand was significantly higher for Asians.
- Methodological challenges arise when calculating means from grouped data, as scores are often bunched at the extreme ends of the scale.
- A significant portion of the rise in black SAT scores was attributed to a decrease in students scoring in the lowest brackets.
- In contrast, over half of the increase in Asian SAT Math means was driven by gains in the highest scoring categories (700 and up).
Trying to predict trends on the basis of equivalent percentage changes from different baselines is a treacherous proposition.
722
Notes to page 294
ten points behind the Asians. In 2069, the black Verbal mean would sur-
pass the Asian Verbal mean. Linear trends over short periods of time can-
not be sensibly extrapolated much into the future, notwithstanding how
often one sees such extrapolations in the media.
61. See Appendix 5 for ACT results. In short, the mean rose from 16.2 to in
1986 to 17.1 in 1993. The number of black ACT students also continued
to rise during this period, suggesting that the increase after 1986 was not
the result of a more selective pool.
62. Chapter 18 explores this line of thought further.
63. SAT trends are subject to a variety of questions relating to the changing
nature of the SAT pool. The discussion that follows is based on unreported
analyses checking out the possibility that the results reflect these poten-
tial artifacts (e.g., changes in the proportion of Asians using English as their
first language; changes in the proportion of students coming from homes
where the parents did not go to college). The discussion of these matters
may be found in Chapter 18.
64. The first year for which a frequency distribution of scores by ethnicity has
been published is 1980.
65. Trying to predict trends on the basis ofequivalent percentage changes from
different baselines is a treacherous proposition. A comparison with black
and Asian gains makes the point. For example, the percentage of hlacks
scoring in the 700s on the SAT-Verbal grew by 23 percent from 1980 to
1990, within a percentage point of the Asian proportional increase. For
students scoring in the 600s, the black increase was 37 percent, not far be-
low the Asian increase of 48 percent. The difficulty with using proportions
in this instance is that the baselines are so different. Take the case of stu-
dents scoring in the 600s on the SATV, for example. The proportions that
produced that 37 percent increase for blacks were eleven students out of a
thousand in 1980 versus fifteen students out of a thousand in 1990. The
Asian change, put in the same metric, was from fifty-five students in 1980
to eighty-one students in 1990. For every four students per thousand that
blacks gained in the 600 group, Asians gained twenty-six per thousand.
66. This statement is based on a calculation that assumes that the 1980 dis-
tribution of scores remained the same except for the categories of interest.
To illustrate, in 1980, 19.8 percent of black students scored from 200 to
249. In 1993, only 13.1 percent scored in that range. Suppose that we treat
the percentage distribution for 1980 as if it consisted of 1,000 students. In
that year, 198 of those students scored in the 200 to 249 range. We then
recompute the mean for the 1980 distribution, substituting 128 for 198 in
the 200 to 249 point category (assigning midpoint values to all the inter-
vals to reach a grouped mean), so in effect we are calculating a mean for a
fictitious population of 1000 - 198 + 128 = 930. (The actual calculations
used unrounded proportions based on the actual frequencies in each in-
terval.)
A technical note for those who might wish to reproduce this analysis:
When means are computed from grouped data, the midpoint of an inter-
val is not necessarily the actual mean of people in that interval, usually be-
cause more than 50 percent of the scores will tend to be found in the fatter
part of the distribution covered by the interval but also because scores may
be bunched at the extreme categories. In the SAT+Math, for example, a
disproportionate number of the people in the interval from 750 to 800 have
scores of 800 and of those in the interval from 200 to 249 have scores of
200 (because they guessed wrong so often that their score is driven down
to the minimum). Such effects can produce a noticeable bias in the esti-
mated mean. For example, the actual verbal mean d
black students in 1980
was 330. If one computes the mean based on the distribution published an-
nually by the College Board, which run in fifty-point intervals from 200
to 800, the result is 336.4. The actual mean in 1990 was 352; the grouped
mean is 357.9. The computed figure in the text is based on the surrogate
mean as described above compared to the grouped 1980 and 1990 means,
to provide a consistent framework.
67. The contrast with the Asian experience on the SATs is striking. The Asian
Math mean rose from 509 to 535. Of this increase, none of it was due to
decreases in students scoring less than 200 (compared to 22 percent for
blacks), while a remarkable 54 percent was due to gains in the 700 and up
group (compared to 3 percent for blacks). Meanwhile, on the Verbal test,
the Asian mean rose from 396 to 415 from 1980 to 1993. Of this, only 17
percent occurred because of reductions in Asians scoring in the 200s (com-
pared to 51 percent for blacks), while 9 percent occurred because of in-
creases in Asians scoring in the 700s (compared to 0.4 percent for blacks).
The Asian increase in test scores has been driven by improvements among
the best students, while the black increase has been driven by improve-
ments among the worst students. We are unable to find any artifacts in the
changing nature of the black and Asian SAT pools that would explain
these results. The continued Asian improvement makes it difficult to
blame the slowdown in black improvement in the last decade on events
that somehow made it impossible for any American students to make
progress. Explanations could be advanced based on events specific to
blacks.
68. Snyderman and Rothman 1988. The sample was based on random selec-
tions from the Members and Fellows of the American Educational Re-
search Association, National Council on Measurement in Education, six
divisions of the American Psychological Association (Developmental Psy-
chology, Educational Psychology, Evaluation and Measurement, School
Divergent Trends in SAT Performance
- Asian American SAT score increases are primarily driven by gains among top-tier students, whereas Black score improvements are concentrated among the lowest-scoring students.
- The data suggests that the slowdown in Black academic progress cannot be attributed to general national trends, as Asian scores continued to rise during the same period.
- Statistical analysis of IQ variance indicates that significant environmental differences would be required to explain the observed gaps in group means.
- Research in Shanghai suggests a high density of top-tier math performance among Chinese students even when they lack familiarity with American standardized testing formats.
- The text highlights a persistent verbal-visuospatial performance gap within Asian American test results that remains largely undisputed in the literature.
The Asian increase in test scores has been driven by improvements among the best students, while the black increase has been driven by improvements among the worst students.
722
Notes to page 294
ten points behind the Asians. In 2069, the black Verbal mean would sur-
pass the Asian Verbal mean. Linear trends over short periods of time can-
not be sensibly extrapolated much into the future, notwithstanding how
often one sees such extrapolations in the media.
61. See Appendix 5 for ACT results. In short, the mean rose from 16.2 to in
1986 to 17.1 in 1993. The number of black ACT students also continued
to rise during this period, suggesting that the increase after 1986 was not
the result of a more selective pool.
62. Chapter 18 explores this line of thought further.
63. SAT trends are subject to a variety of questions relating to the changing
nature of the SAT pool. The discussion that follows is based on unreported
analyses checking out the possibility that the results reflect these poten-
tial artifacts (e.g., changes in the proportion of Asians using English as their
first language; changes in the proportion of students coming from homes
where the parents did not go to college). The discussion of these matters
may be found in Chapter 18.
64. The first year for which a frequency distribution of scores by ethnicity has
been published is 1980.
65. Trying to predict trends on the basis ofequivalent percentage changes from
different baselines is a treacherous proposition. A comparison with black
and Asian gains makes the point. For example, the percentage of hlacks
scoring in the 700s on the SAT-Verbal grew by 23 percent from 1980 to
1990, within a percentage point of the Asian proportional increase. For
students scoring in the 600s, the black increase was 37 percent, not far be-
low the Asian increase of 48 percent. The difficulty with using proportions
in this instance is that the baselines are so different. Take the case of stu-
dents scoring in the 600s on the SATV, for example. The proportions that
produced that 37 percent increase for blacks were eleven students out of a
thousand in 1980 versus fifteen students out of a thousand in 1990. The
Asian change, put in the same metric, was from fifty-five students in 1980
to eighty-one students in 1990. For every four students per thousand that
blacks gained in the 600 group, Asians gained twenty-six per thousand.
66. This statement is based on a calculation that assumes that the 1980 dis-
tribution of scores remained the same except for the categories of interest.
To illustrate, in 1980, 19.8 percent of black students scored from 200 to
249. In 1993, only 13.1 percent scored in that range. Suppose that we treat
the percentage distribution for 1980 as if it consisted of 1,000 students. In
that year, 198 of those students scored in the 200 to 249 range. We then
recompute the mean for the 1980 distribution, substituting 128 for 198 in
the 200 to 249 point category (assigning midpoint values to all the inter-
vals to reach a grouped mean), so in effect we are calculating a mean for a
fictitious population of 1000 - 198 + 128 = 930. (The actual calculations
used unrounded proportions based on the actual frequencies in each in-
terval.)
A technical note for those who might wish to reproduce this analysis:
When means are computed from grouped data, the midpoint of an inter-
val is not necessarily the actual mean of people in that interval, usually be-
cause more than 50 percent of the scores will tend to be found in the fatter
part of the distribution covered by the interval but also because scores may
be bunched at the extreme categories. In the SAT+Math, for example, a
disproportionate number of the people in the interval from 750 to 800 have
scores of 800 and of those in the interval from 200 to 249 have scores of
200 (because they guessed wrong so often that their score is driven down
to the minimum). Such effects can produce a noticeable bias in the esti-
mated mean. For example, the actual verbal mean d
black students in 1980
was 330. If one computes the mean based on the distribution published an-
nually by the College Board, which run in fifty-point intervals from 200
to 800, the result is 336.4. The actual mean in 1990 was 352; the grouped
mean is 357.9. The computed figure in the text is based on the surrogate
mean as described above compared to the grouped 1980 and 1990 means,
to provide a consistent framework.
67. The contrast with the Asian experience on the SATs is striking. The Asian
Math mean rose from 509 to 535. Of this increase, none of it was due to
decreases in students scoring less than 200 (compared to 22 percent for
blacks), while a remarkable 54 percent was due to gains in the 700 and up
group (compared to 3 percent for blacks). Meanwhile, on the Verbal test,
the Asian mean rose from 396 to 415 from 1980 to 1993. Of this, only 17
percent occurred because of reductions in Asians scoring in the 200s (com-
pared to 51 percent for blacks), while 9 percent occurred because of in-
creases in Asians scoring in the 700s (compared to 0.4 percent for blacks).
The Asian increase in test scores has been driven by improvements among
the best students, while the black increase has been driven by improve-
ments among the worst students. We are unable to find any artifacts in the
changing nature of the black and Asian SAT pools that would explain
these results. The continued Asian improvement makes it difficult to
blame the slowdown in black improvement in the last decade on events
that somehow made it impossible for any American students to make
progress. Explanations could be advanced based on events specific to
blacks.
68. Snyderman and Rothman 1988. The sample was based on random selec-
tions from the Members and Fellows of the American Educational Re-
search Association, National Council on Measurement in Education, six
divisions of the American Psychological Association (Developmental Psy-
chology, Educational Psychology, Evaluation and Measurement, School
Notes to pages 30 1-303
725
Psychology, Counseling Psychology, and Industrial and Organizaticlnal
Psychology), the Behavior Genetics Association, the Cognitive Science
Society, and the education division of the American Sociological Associ-
ation.
69. Brody 1992, p. 309.
70. Gould 1984, pp. 26-27.
71. Gould 1984, p. 32. See Lewontin, Rose, and Kamin 1984, p. 127, for a sim-
ilar argument.
72. Gould 1984, p. 33.
73. The ramifications for public policy are dealt with in detail in Chapters 19
and 20, concerning affirmative action.
74. We do not include in the text any discussion of Phillipe Rushton's intensely
controversial writings on the differences among Asian, white, and black
populations. For a brief account, see Appendix 5.
75. A similar example can be found in Lewontin 1970, one of the most out-
spoken critics of the IQ enterprise in all its manifestations.
76. The calculation proceeds as follows: The standard deviation of 1Q being
15, the variance is therefore 225. We are stipulating that environment ac-
counts for .4 of the variance, which equals 90. The standard deviation of
the distribution of the environmental component of IQ is the square root
of 90, or 9.49. The difference between group environments necessary to
produce a fifteen-point difference in group means is 1519.49, or 1.58, and
the difference necessary to produce a three-point difference is 319.49, or
.32. The comparable figures ifheritability is assigned the lower bound value
of .4 are 1.28 and .26. If heritability is assigned the upper-hound value of
.8, then the comparable figures are 2.24 and .45.
77. Stevenson et al. 1985.
78. Lynn 1987a.
79. Frydman and Lynn 1989.
80. Iwawaki and Vernon 1988; McShane and Berry 1988.
81. Vernon, 1982 p. 28. It has been argued that the 1 10 figure is too high, but
a verbal-visuospatial difference among Asian Americans is not disputed
(Flynn 1989).
82. Supplemental evidence has been found among Chinese students living in
China who were given the SAT. Several hundred Chinese students in
Shanghai between the ages of 11 and 14 scored extremely high on the Math
SAT, despite an almost total lack of familiarity with American cognitive
ability testing. As a proportion of the total population, this represented a
far greater density of high math scorers in Shanghai than in the United
States. Further attempts to find high scorers in Chinese schools confirmed
the original results in Shanghai (Stanley, Feng, and Zhu 1989).
83. The SAT data actually provide even more of a hint about genetic ortgins
for the test-score pattern, though a speculative one. The College Board re-
ports scores for persons whose first language learned is English and for those
whose first language is "English and another." It is plausible to assume that
Asian students whose only "first language" was English contain a dispro-
portionate number of children of mixed parentage, usually Asian and
white, compared to those in whose homes both English and an Asian lan-
guage were spoken from birth. With that hypothesis in mind, consider that
the discrepancy between the Verbal and Math SATs was (in IQ points)
only 1.7 points for the "English only" Asians and 5.3 points for the "Eng-
lish and another" first-language Asians. Nongenetic explanations are
available. For example, one may hypothesize that although English and an-
other language were both "first languages," English wasn't learned as well
in those homes; hence the Verbal scores for the "English and another"
homes were lower. But then one must also explain why the Math scores of
the "English and another" Asians were twenty-one SAT points higher than
the "English-only" homes. Here one could hypothesize that the "English-
only" Asians were second- and third-generation Americans, more assimi-
lated, and therefore didn't study math as hard as their less assimilated
friends (although somehow they did quite well in the Verbal test). But
while alternative hypotheses are avaitable, the consistency with a genetic
explanation suggests that it would be instructive to examine the scores of
children of full and mixed Asian parentage.
84. A related topic that we do not review here is the comparison of blacks and
whites on Level I and Level 11 abilities, using Jensen's two-level theory of
mental abilities (Jensen and Figueroa 1975; Jensen and Inouye 1980). The
findings are consistent with those presented under the discussion of WISC-
R profiles and Spearman's hypothesis.
85. "Spearman's hypothesisw is named after an observation made by Charles
Spearman in 1927. Noting that the black-white difference varied system-
atically for different kinds of tests, Spearman wrote that the mean differ-
ence "was most marked in just those [tests] which are known to be most
saturated withg" (Spearman 1927, p. 379). Spearman himself never tried
to develop his comment into a formal hypothesis or to test it.
86. Jensen and Reynolds 1982.
87. Jensen and Reynolds actually compared large sets of IQ scores with the
full-scale IQ score held constant statistically.
88. Jensen and Reynolds 1982, p. 427; Reynolds and Jensen 1983.
89. Jensen and Reynolds 1982, pp. 428-429.
90. Jensen 1985,1987a.
91. Jensen 1993b.
92. Braden 1989.
93. Jensen 1993b.
Cognitive Profiles and Spearman's Hypothesis
- The text examines the discrepancy between Verbal and Math SAT scores among Asian students, noting that those from 'English-only' homes show a smaller gap than those from bilingual homes.
- Alternative hypotheses for these score differences include varying levels of cultural assimilation and the potential impact of mixed-parentage backgrounds.
- The discussion references Spearman’s hypothesis, which suggests that the magnitude of racial differences in test performance is directly related to a test's 'g' loading, or its saturation with general intelligence.
- Research indicates that tests with smaller performance gaps between demographic groups, such as the K-ABC, are often found to be less valid measures of general intelligence (g).
- The author highlights that correlations between g loading and black-white performance differences typically fall within the .5 to .8 range.
- The text notes that while various technical arguments have been raised against these findings, many were resolved through academic debate and statistical analysis.
Spearman wrote that the mean difference 'was most marked in just those [tests] which are known to be most saturated with g'.
Notes to pages 30 1-303
725
Psychology, Counseling Psychology, and Industrial and Organizaticlnal
Psychology), the Behavior Genetics Association, the Cognitive Science
Society, and the education division of the American Sociological Associ-
ation.
69. Brody 1992, p. 309.
70. Gould 1984, pp. 26-27.
71. Gould 1984, p. 32. See Lewontin, Rose, and Kamin 1984, p. 127, for a sim-
ilar argument.
72. Gould 1984, p. 33.
73. The ramifications for public policy are dealt with in detail in Chapters 19
and 20, concerning affirmative action.
74. We do not include in the text any discussion of Phillipe Rushton's intensely
controversial writings on the differences among Asian, white, and black
populations. For a brief account, see Appendix 5.
75. A similar example can be found in Lewontin 1970, one of the most out-
spoken critics of the IQ enterprise in all its manifestations.
76. The calculation proceeds as follows: The standard deviation of 1Q being
15, the variance is therefore 225. We are stipulating that environment ac-
counts for .4 of the variance, which equals 90. The standard deviation of
the distribution of the environmental component of IQ is the square root
of 90, or 9.49. The difference between group environments necessary to
produce a fifteen-point difference in group means is 1519.49, or 1.58, and
the difference necessary to produce a three-point difference is 319.49, or
.32. The comparable figures ifheritability is assigned the lower bound value
of .4 are 1.28 and .26. If heritability is assigned the upper-hound value of
.8, then the comparable figures are 2.24 and .45.
77. Stevenson et al. 1985.
78. Lynn 1987a.
79. Frydman and Lynn 1989.
80. Iwawaki and Vernon 1988; McShane and Berry 1988.
81. Vernon, 1982 p. 28. It has been argued that the 1 10 figure is too high, but
a verbal-visuospatial difference among Asian Americans is not disputed
(Flynn 1989).
82. Supplemental evidence has been found among Chinese students living in
China who were given the SAT. Several hundred Chinese students in
Shanghai between the ages of 11 and 14 scored extremely high on the Math
SAT, despite an almost total lack of familiarity with American cognitive
ability testing. As a proportion of the total population, this represented a
far greater density of high math scorers in Shanghai than in the United
States. Further attempts to find high scorers in Chinese schools confirmed
the original results in Shanghai (Stanley, Feng, and Zhu 1989).
83. The SAT data actually provide even more of a hint about genetic ortgins
for the test-score pattern, though a speculative one. The College Board re-
ports scores for persons whose first language learned is English and for those
whose first language is "English and another." It is plausible to assume that
Asian students whose only "first language" was English contain a dispro-
portionate number of children of mixed parentage, usually Asian and
white, compared to those in whose homes both English and an Asian lan-
guage were spoken from birth. With that hypothesis in mind, consider that
the discrepancy between the Verbal and Math SATs was (in IQ points)
only 1.7 points for the "English only" Asians and 5.3 points for the "Eng-
lish and another" first-language Asians. Nongenetic explanations are
available. For example, one may hypothesize that although English and an-
other language were both "first languages," English wasn't learned as well
in those homes; hence the Verbal scores for the "English and another"
homes were lower. But then one must also explain why the Math scores of
the "English and another" Asians were twenty-one SAT points higher than
the "English-only" homes. Here one could hypothesize that the "English-
only" Asians were second- and third-generation Americans, more assimi-
lated, and therefore didn't study math as hard as their less assimilated
friends (although somehow they did quite well in the Verbal test). But
while alternative hypotheses are avaitable, the consistency with a genetic
explanation suggests that it would be instructive to examine the scores of
children of full and mixed Asian parentage.
84. A related topic that we do not review here is the comparison of blacks and
whites on Level I and Level 11 abilities, using Jensen's two-level theory of
mental abilities (Jensen and Figueroa 1975; Jensen and Inouye 1980). The
findings are consistent with those presented under the discussion of WISC-
R profiles and Spearman's hypothesis.
85. "Spearman's hypothesisw is named after an observation made by Charles
Spearman in 1927. Noting that the black-white difference varied system-
atically for different kinds of tests, Spearman wrote that the mean differ-
ence "was most marked in just those [tests] which are known to be most
saturated withg" (Spearman 1927, p. 379). Spearman himself never tried
to develop his comment into a formal hypothesis or to test it.
86. Jensen and Reynolds 1982.
87. Jensen and Reynolds actually compared large sets of IQ scores with the
full-scale IQ score held constant statistically.
88. Jensen and Reynolds 1982, p. 427; Reynolds and Jensen 1983.
89. Jensen and Reynolds 1982, pp. 428-429.
90. Jensen 1985,1987a.
91. Jensen 1993b.
92. Braden 1989.
93. Jensen 1993b.
726
Notes to pages 303-304
Notes to pages 304-306
727
94. The correlations between g loading and black-white difference are typi-
cally in the .5 to .8 range.
95. A concrete example is provided by the Kaufman Assessment Battery for
Children (K-ABC), a test that attained some visibility in part because
the separation between black and white children on it is smaller than on
more standard intelligence tests. It was later found that K-ABC is a less
valid measure of g than the standard tests (Jensen 1984a; Kaufman and
Kaufman 1983; Naglieri and Bardos 1987).
96. E.g., Pedersen et al. 1992. Jensen limits himself to discussing Spearman's
hypothesis on the phenotypic level.
97. Jensen 1977.
98. Some other studies suggest a systematic sibling difference for national
populations, but it goes the other way: Elder siblings outscore younger
siblings in some data sets. However, this "birth-order" effect, when it oc-
curs at all, is much smaller than the effect Jensen observed.
99. Jensen 1985,1987a.
100. Various technical arguments were advanced against Jensen's claim that
blacks and whites differ the most on tests that are the most highly loaded
ong. Many of these were effectively resolved within the forum. One critic
hypothesized that Jensen's findings resulted from an artifact of varying
reliabilities (Baron 1985). Jensen was able to demonstrate that correc-
tions for unreliability did not wash out the evidence for Spearman's hy-
pothesis and that some of the tests with low g loadings had high
reliabilities to begin with, contrary to the critic's assumption. Another
commentator suggested that Jensen had inadvertently built into his own
analysis the very correlation between g loading and black-white differ-
ence that he purported to discover (Schonemann 1985; see also Wilson
1985). In the next round (the forum occupied two issues of the journal),
after being apprised of a response by physicist William Shockley (Shock-
ley 1987), he withdrew his argument. A less serious criticism suggested
that black-white differences did indeed correlate with some general fac-
tor that turns up to varying degrees in different intelligence tests but that
the factor may not beg (Borkowski and Maxwell 1985). To this criticism,
Jensen was able to demonstrate that the g factor accounted for so large a
fraction of the total variance in test scores that no other general factor
could possibly be comparably correlated with black-white differences. A
still less serious criticism (indeed, barely a criticism at all), made by sev-
eral commentators, was that the g that turns up in one battery of tests is
likely to differ from the g that turns up in another (e.g., Kline 1985).
Jensen accepted this point, noting, however, that the variousg's are them-
selves intercorrelated.
A number of critics took a nontechnical tack. One set argued that
Jensen's analysis was conceptually circular. For example, if g is defined as
intelligence, then tests that are loaded ong will be cons~dered tests of in-
telligence. If these happen, coincidentally, to be the tests that black and
whites differ on, then Spearman's hypothesis will seem to be confirmed,
though the link between the tests and intelligence was simply postulated,
not proved (Brody 1987). For a related argument see Macphail 1985.
Jensen acknowledged that he had not tried to discuss the relationship of
g to intelligence in this particular article. Another set of critics made
what could be called meta-critical comments, wondering why Jensen
should want to uncover relationships that are not very interesting (Das
1985), hurtful to blacks (Das 1985), inimical to world peace (Bardis
1985), and likely to distract attention from the possibility of raising peo-
ple's g by educational means (Whimbey 1985). None of these commen-
taries disputed that the data show what Jensen said they show.
A few years later, the last paper written by the noted psychometrician,
Louis Guttman, before his death, attempted to demonstrate a mathe-
matical circularity in Jensen's argument, concluding that Spearman's hy-
pothesis is true by mathematical necessity (Guttman 1992). He argued
that the factor analytic procedures that are used to extract an estimate
of g cannot fail to produce a correlation between g and the B/W differ-
ence. If the correlation is present by necessity, concluded Guttman, it
can't be telling us anything about nature. The gist of Guttman's case is
that if g is the only source of correlation across tests, then the varying
B/W differences across tests must be correlated with g. Jensen and others
were quick to point out that no one now believes that g is the only source
of correlation between tests, just the largest one. We will not try to re-
produce Guttman's mathematical argument, not just because it would get
us deep into algebra but because it was decisively refuted by other psy-
chometricians who commented on it and seems to have found no other
support since its publication. See Jensen 1992; Loehlin 1992; Roskam
and Ellis 1992.
101. Gustafsson 1992.
102. Mercer 1984, pp. 297-310.
103. Mercer 1988.
104. Mercer 1988, p. 209.
105. It would be useful for the reader if we could present Mercer's results so
that they parallel the method we have been using, in which the socio-
cultural variables and ethnicity are treated as independent variables pre-
dicting IQ, but her presentation does not include that analysis.
106. Mercer 1988, p. 208.
Debating Spearman's Hypothesis
- Arthur Jensen defended his findings on g loadings against technical critiques regarding test reliability and mathematical circularity.
- Critics like Guttman argued that the correlation between g and racial differences was a mathematical necessity rather than a biological reality, though this was later refuted.
- Some commentators shifted the debate to conceptual grounds, arguing that defining intelligence as g creates a circular validation of racial disparities.
- Meta-critical arguments emerged questioning the social utility and morality of Jensen's research, citing potential harm to social harmony and education.
- Despite various technical and philosophical challenges, many critics did not dispute the underlying data, focusing instead on its interpretation or implications.
- Jensen maintained that while different test batteries produce slightly different g factors, these factors remain highly intercorrelated and dominant in variance.
Another set of critics made what could be called meta-critical comments, wondering why Jensen should want to uncover relationships that are not very interesting, hurtful to blacks, inimical to world peace, and likely to distract attention from the possibility of raising people's g by educational means.
726
Notes to pages 303-304
Notes to pages 304-306
727
94. The correlations between g loading and black-white difference are typi-
cally in the .5 to .8 range.
95. A concrete example is provided by the Kaufman Assessment Battery for
Children (K-ABC), a test that attained some visibility in part because
the separation between black and white children on it is smaller than on
more standard intelligence tests. It was later found that K-ABC is a less
valid measure of g than the standard tests (Jensen 1984a; Kaufman and
Kaufman 1983; Naglieri and Bardos 1987).
96. E.g., Pedersen et al. 1992. Jensen limits himself to discussing Spearman's
hypothesis on the phenotypic level.
97. Jensen 1977.
98. Some other studies suggest a systematic sibling difference for national
populations, but it goes the other way: Elder siblings outscore younger
siblings in some data sets. However, this "birth-order" effect, when it oc-
curs at all, is much smaller than the effect Jensen observed.
99. Jensen 1985,1987a.
100. Various technical arguments were advanced against Jensen's claim that
blacks and whites differ the most on tests that are the most highly loaded
ong. Many of these were effectively resolved within the forum. One critic
hypothesized that Jensen's findings resulted from an artifact of varying
reliabilities (Baron 1985). Jensen was able to demonstrate that correc-
tions for unreliability did not wash out the evidence for Spearman's hy-
pothesis and that some of the tests with low g loadings had high
reliabilities to begin with, contrary to the critic's assumption. Another
commentator suggested that Jensen had inadvertently built into his own
analysis the very correlation between g loading and black-white differ-
ence that he purported to discover (Schonemann 1985; see also Wilson
1985). In the next round (the forum occupied two issues of the journal),
after being apprised of a response by physicist William Shockley (Shock-
ley 1987), he withdrew his argument. A less serious criticism suggested
that black-white differences did indeed correlate with some general fac-
tor that turns up to varying degrees in different intelligence tests but that
the factor may not beg (Borkowski and Maxwell 1985). To this criticism,
Jensen was able to demonstrate that the g factor accounted for so large a
fraction of the total variance in test scores that no other general factor
could possibly be comparably correlated with black-white differences. A
still less serious criticism (indeed, barely a criticism at all), made by sev-
eral commentators, was that the g that turns up in one battery of tests is
likely to differ from the g that turns up in another (e.g., Kline 1985).
Jensen accepted this point, noting, however, that the variousg's are them-
selves intercorrelated.
A number of critics took a nontechnical tack. One set argued that
Jensen's analysis was conceptually circular. For example, if g is defined as
intelligence, then tests that are loaded ong will be cons~dered tests of in-
telligence. If these happen, coincidentally, to be the tests that black and
whites differ on, then Spearman's hypothesis will seem to be confirmed,
though the link between the tests and intelligence was simply postulated,
not proved (Brody 1987). For a related argument see Macphail 1985.
Jensen acknowledged that he had not tried to discuss the relationship of
g to intelligence in this particular article. Another set of critics made
what could be called meta-critical comments, wondering why Jensen
should want to uncover relationships that are not very interesting (Das
1985), hurtful to blacks (Das 1985), inimical to world peace (Bardis
1985), and likely to distract attention from the possibility of raising peo-
ple's g by educational means (Whimbey 1985). None of these commen-
taries disputed that the data show what Jensen said they show.
A few years later, the last paper written by the noted psychometrician,
Louis Guttman, before his death, attempted to demonstrate a mathe-
matical circularity in Jensen's argument, concluding that Spearman's hy-
pothesis is true by mathematical necessity (Guttman 1992). He argued
that the factor analytic procedures that are used to extract an estimate
of g cannot fail to produce a correlation between g and the B/W differ-
ence. If the correlation is present by necessity, concluded Guttman, it
can't be telling us anything about nature. The gist of Guttman's case is
that if g is the only source of correlation across tests, then the varying
B/W differences across tests must be correlated with g. Jensen and others
were quick to point out that no one now believes that g is the only source
of correlation between tests, just the largest one. We will not try to re-
produce Guttman's mathematical argument, not just because it would get
us deep into algebra but because it was decisively refuted by other psy-
chometricians who commented on it and seems to have found no other
support since its publication. See Jensen 1992; Loehlin 1992; Roskam
and Ellis 1992.
101. Gustafsson 1992.
102. Mercer 1984, pp. 297-310.
103. Mercer 1988.
104. Mercer 1988, p. 209.
105. It would be useful for the reader if we could present Mercer's results so
that they parallel the method we have been using, in which the socio-
cultural variables and ethnicity are treated as independent variables pre-
dicting IQ, but her presentation does not include that analysis.
106. Mercer 1988, p. 208.
IQ Variables and Historical Trends
- The text examines the relationship between sociocultural variables, ethnicity, and IQ, noting that some researchers treat these as independent predictors.
- It discusses the 'Flynn effect' and the historical rise in IQ scores, using a thought experiment to show the absurdity of projecting current norms back to the 18th century.
- The author uses a height analogy to explain how traits can remain hereditary within families even as the population average shifts significantly over time.
- A distinction is made between rising test scores and actual intelligence levels, suggesting that increased literacy can inflate IQ scores without a corresponding rise in cognitive ability.
- The text reviews adoption studies and racial ancestry, debating whether IQ differences are more strongly influenced by genetic hypotheses or environmental factors like parental education.
- Statistical data on high school completion rates among different ethnic groups is introduced to contextualize the impact of IQ on educational attainment.
If the mean IQ in 1776 had been 30 and the standard deviation was what it is today, then America in the Revolutionary period had only five men and women with IQs above 100.
726
Notes to pages 303-304
Notes to pages 304-306
727
94. The correlations between g loading and black-white difference are typi-
cally in the .5 to .8 range.
95. A concrete example is provided by the Kaufman Assessment Battery for
Children (K-ABC), a test that attained some visibility in part because
the separation between black and white children on it is smaller than on
more standard intelligence tests. It was later found that K-ABC is a less
valid measure of g than the standard tests (Jensen 1984a; Kaufman and
Kaufman 1983; Naglieri and Bardos 1987).
96. E.g., Pedersen et al. 1992. Jensen limits himself to discussing Spearman's
hypothesis on the phenotypic level.
97. Jensen 1977.
98. Some other studies suggest a systematic sibling difference for national
populations, but it goes the other way: Elder siblings outscore younger
siblings in some data sets. However, this "birth-order" effect, when it oc-
curs at all, is much smaller than the effect Jensen observed.
99. Jensen 1985,1987a.
100. Various technical arguments were advanced against Jensen's claim that
blacks and whites differ the most on tests that are the most highly loaded
ong. Many of these were effectively resolved within the forum. One critic
hypothesized that Jensen's findings resulted from an artifact of varying
reliabilities (Baron 1985). Jensen was able to demonstrate that correc-
tions for unreliability did not wash out the evidence for Spearman's hy-
pothesis and that some of the tests with low g loadings had high
reliabilities to begin with, contrary to the critic's assumption. Another
commentator suggested that Jensen had inadvertently built into his own
analysis the very correlation between g loading and black-white differ-
ence that he purported to discover (Schonemann 1985; see also Wilson
1985). In the next round (the forum occupied two issues of the journal),
after being apprised of a response by physicist William Shockley (Shock-
ley 1987), he withdrew his argument. A less serious criticism suggested
that black-white differences did indeed correlate with some general fac-
tor that turns up to varying degrees in different intelligence tests but that
the factor may not beg (Borkowski and Maxwell 1985). To this criticism,
Jensen was able to demonstrate that the g factor accounted for so large a
fraction of the total variance in test scores that no other general factor
could possibly be comparably correlated with black-white differences. A
still less serious criticism (indeed, barely a criticism at all), made by sev-
eral commentators, was that the g that turns up in one battery of tests is
likely to differ from the g that turns up in another (e.g., Kline 1985).
Jensen accepted this point, noting, however, that the variousg's are them-
selves intercorrelated.
A number of critics took a nontechnical tack. One set argued that
Jensen's analysis was conceptually circular. For example, if g is defined as
intelligence, then tests that are loaded ong will be cons~dered tests of in-
telligence. If these happen, coincidentally, to be the tests that black and
whites differ on, then Spearman's hypothesis will seem to be confirmed,
though the link between the tests and intelligence was simply postulated,
not proved (Brody 1987). For a related argument see Macphail 1985.
Jensen acknowledged that he had not tried to discuss the relationship of
g to intelligence in this particular article. Another set of critics made
what could be called meta-critical comments, wondering why Jensen
should want to uncover relationships that are not very interesting (Das
1985), hurtful to blacks (Das 1985), inimical to world peace (Bardis
1985), and likely to distract attention from the possibility of raising peo-
ple's g by educational means (Whimbey 1985). None of these commen-
taries disputed that the data show what Jensen said they show.
A few years later, the last paper written by the noted psychometrician,
Louis Guttman, before his death, attempted to demonstrate a mathe-
matical circularity in Jensen's argument, concluding that Spearman's hy-
pothesis is true by mathematical necessity (Guttman 1992). He argued
that the factor analytic procedures that are used to extract an estimate
of g cannot fail to produce a correlation between g and the B/W differ-
ence. If the correlation is present by necessity, concluded Guttman, it
can't be telling us anything about nature. The gist of Guttman's case is
that if g is the only source of correlation across tests, then the varying
B/W differences across tests must be correlated with g. Jensen and others
were quick to point out that no one now believes that g is the only source
of correlation between tests, just the largest one. We will not try to re-
produce Guttman's mathematical argument, not just because it would get
us deep into algebra but because it was decisively refuted by other psy-
chometricians who commented on it and seems to have found no other
support since its publication. See Jensen 1992; Loehlin 1992; Roskam
and Ellis 1992.
101. Gustafsson 1992.
102. Mercer 1984, pp. 297-310.
103. Mercer 1988.
104. Mercer 1988, p. 209.
105. It would be useful for the reader if we could present Mercer's results so
that they parallel the method we have been using, in which the socio-
cultural variables and ethnicity are treated as independent variables pre-
dicting IQ, but her presentation does not include that analysis.
106. Mercer 1988, p. 208.
7 28
Notes to pages 306-3 10
107. The critique of Mercer's position has been highly technical. Readers who
have the patience will find an extended exchange between Mercer,
Jensen, and Robert Gordon in Reynolds and Brown 1984.
108. Mercer 1984, Tables 6,9; Jensen 1984b, pp. 580-582.
109. Boykin 1986, p. 61.
110. For review, see Boykin 1986.
111. Ogbu 1986.
112. Flynn 1984,1987a, 1987b.
113. Merrill 1938.
114. Flynn 1984, 1987b; Lynn and Hampson 1986c.
115. Flynn 1987a, 1987b.
1 16. Lynn and Hampson 1986a.
1 17. Teasdale and Owen 1989.
118. For evidence that this is what has happened in the United States, see
Murray and Hermstein 1992.
1 19. If the mean IQ in 1776 had been 30 and the standard deviation was what
it is today, then America in the Revolutionary period had only five men
and women with IQs above 100.
E 20. Lynn and Hampson 1986a.
121. Consider the analogy of height. The average stature of Americans has
risen several inches since the Pilgrims landed at Plymouth, but height
has run in families nevertheless.
122. A shifting link between IQ and intelligence is not only possible but proh-
able under certain conditions. For example, when the literacy level of a
country rises rapidly, scores on conventional intelligence tests will also
rise because more people will be better able to read the test. This rise is
unlikely to be fully reflected in a rising intelligence level, at least with
equal rapidity. Flynn 1987b discusses this general measurement issue.
123. Scarr and Weinberg 1976, 1978, 1983; Weinberg, Scam and Waldman
1992.
124. Weinberg, Scarr, and Waldman 1992, Table 2. The progression of the IQ
means from two black parents to one blacklone white to two white par-
ents is not as neatly supportive of a genetic hypothesis as might first ap-
pear, because there is reason to suspect that the mixed-race biological
parents of the adopted children were disproportionately drawn from col-
lege students, which in turn would imply that the IQ of the black parent
was well above the black mean.
125. Weinberg, Scam, and Waldman 1992. For the technical debate, see Levin
in press; Lynn in press, with a response by Scarr and Weinberg in Wald-
man, Weinberg, and Scam in press.
126. Weinberg, Scarr, and Waldman 1992, Table 2. The overall decline in
scores for all groups was because a new test norm had been imposed in
the interim, vitiating the Flynn effect for this group.
127. Waldman, Weinberg, and Scarr in press.
128. Eyferth 1961 For accounts in English, see Loehlin, Lindzey, and Spuhler
1975; Flynn 1980.
129. Loehlin, Lindzey, and Spuhler 1975, Chap. 5.
130. An earlier study showed no significant association between the amount
of white ancestry in a sample of American blacks and their intelligence
test scores (Scarr et a!. 1977). If the whites who contributed this ances-
try were a random sample of all whites, then this would be strong evi-
dence of no genetic influence on black-white differences. There is no
evidence one way or another about the nature of the white ancestors.
131. Lewontin, Rose, and Kamin 1984.
132. Scarr and Weinberg 1976, Tahle 12.
Chapter 14
1. U.S. Department of Labor 1993, Table 3.
2. U.S. Bureau of the Census 1993, Table 1.
3. The NLSY sample does not include GEDs. Nationally, the 1991 high
school completion rate (signifying twelve years of school) was 87.0 per-
cent for whites, 72.5 percent for blacks, and 55.4 percent for Latinos (Na-
tional Center for Education Statistics 1993, p. 58).
4. These results refer to a logistic analysis in which the dependent variable
was a binary variable representing obtaining a normal high school diploma.
The independent variables were age and 1Q.
5. For persons ages 25 to 29 in 1992, the proportions with bachelor's degrees
were 26.7 percent for whites, 10.6 percent for blacks, and 11.4 percent for
Latinos (National Center for Education Statistics 1993, p. 62).
6. Welch 1973.
7. For example, given the mean years of education for people entering the
high-IQ occupations defined in Chapter 3 (16.6) and holding age constant
at the mean, the probability that whites would be in a high-lQ occupation
was 14.4 percent compared to 12.8 percent for blacks and 18.1 percent for
Latinos.
8. Gottfredson 1986.
9. Gottfredson 1986 leaves room for the possibility that blacks at the upper
end of the IQ distribution were disproportionately choosing medicine, en-
gineering, or the other professions she happened to examine. Perhaps if
she had examined other high-IQ occupations (one may hypothesize), she
would have found blacks represented at or below expectations. Our analy-
Demographic Disparities and IQ Controls
- Educational attainment data from 1992 shows significant gaps in bachelor's degree completion between white (26.7%), black (10.6%), and Latino (11.4%) populations.
- When controlling for IQ, the probability of being in a high-IQ occupation shifts significantly, with black and Latino representation exceeding white representation in these roles.
- Statistical analysis suggests that previous hypotheses regarding black underrepresentation in high-IQ fields are unlikely when a broad range of occupations is considered.
- Economic indicators such as wage income and poverty rates are analyzed through regression models that account for age and race within the NLSY sample.
- The text examines the 'lack-of-marriageable-males' thesis as a partial explanation for social discrepancies, though it remains largely unexplained by both that theory and IQ.
- Longitudinal data from 1960 to the early 1990s tracks the shifting proportions of marriage and birth rates across different racial demographics.
After controlling for IQ, the unrounded proportions in high-IQ occupations were 10.4 percent for whites, 24.5 percent for blacks, and 16.2 percent for Latinos.
7 28
Notes to pages 306-3 10
107. The critique of Mercer's position has been highly technical. Readers who
have the patience will find an extended exchange between Mercer,
Jensen, and Robert Gordon in Reynolds and Brown 1984.
108. Mercer 1984, Tables 6,9; Jensen 1984b, pp. 580-582.
109. Boykin 1986, p. 61.
110. For review, see Boykin 1986.
111. Ogbu 1986.
112. Flynn 1984,1987a, 1987b.
113. Merrill 1938.
114. Flynn 1984, 1987b; Lynn and Hampson 1986c.
115. Flynn 1987a, 1987b.
1 16. Lynn and Hampson 1986a.
1 17. Teasdale and Owen 1989.
118. For evidence that this is what has happened in the United States, see
Murray and Hermstein 1992.
1 19. If the mean IQ in 1776 had been 30 and the standard deviation was what
it is today, then America in the Revolutionary period had only five men
and women with IQs above 100.
E 20. Lynn and Hampson 1986a.
121. Consider the analogy of height. The average stature of Americans has
risen several inches since the Pilgrims landed at Plymouth, but height
has run in families nevertheless.
122. A shifting link between IQ and intelligence is not only possible but proh-
able under certain conditions. For example, when the literacy level of a
country rises rapidly, scores on conventional intelligence tests will also
rise because more people will be better able to read the test. This rise is
unlikely to be fully reflected in a rising intelligence level, at least with
equal rapidity. Flynn 1987b discusses this general measurement issue.
123. Scarr and Weinberg 1976, 1978, 1983; Weinberg, Scam and Waldman
1992.
124. Weinberg, Scarr, and Waldman 1992, Table 2. The progression of the IQ
means from two black parents to one blacklone white to two white par-
ents is not as neatly supportive of a genetic hypothesis as might first ap-
pear, because there is reason to suspect that the mixed-race biological
parents of the adopted children were disproportionately drawn from col-
lege students, which in turn would imply that the IQ of the black parent
was well above the black mean.
125. Weinberg, Scam, and Waldman 1992. For the technical debate, see Levin
in press; Lynn in press, with a response by Scarr and Weinberg in Wald-
man, Weinberg, and Scam in press.
126. Weinberg, Scarr, and Waldman 1992, Table 2. The overall decline in
scores for all groups was because a new test norm had been imposed in
the interim, vitiating the Flynn effect for this group.
127. Waldman, Weinberg, and Scarr in press.
128. Eyferth 1961 For accounts in English, see Loehlin, Lindzey, and Spuhler
1975; Flynn 1980.
129. Loehlin, Lindzey, and Spuhler 1975, Chap. 5.
130. An earlier study showed no significant association between the amount
of white ancestry in a sample of American blacks and their intelligence
test scores (Scarr et a!. 1977). If the whites who contributed this ances-
try were a random sample of all whites, then this would be strong evi-
dence of no genetic influence on black-white differences. There is no
evidence one way or another about the nature of the white ancestors.
131. Lewontin, Rose, and Kamin 1984.
132. Scarr and Weinberg 1976, Tahle 12.
Chapter 14
1. U.S. Department of Labor 1993, Table 3.
2. U.S. Bureau of the Census 1993, Table 1.
3. The NLSY sample does not include GEDs. Nationally, the 1991 high
school completion rate (signifying twelve years of school) was 87.0 per-
cent for whites, 72.5 percent for blacks, and 55.4 percent for Latinos (Na-
tional Center for Education Statistics 1993, p. 58).
4. These results refer to a logistic analysis in which the dependent variable
was a binary variable representing obtaining a normal high school diploma.
The independent variables were age and 1Q.
5. For persons ages 25 to 29 in 1992, the proportions with bachelor's degrees
were 26.7 percent for whites, 10.6 percent for blacks, and 11.4 percent for
Latinos (National Center for Education Statistics 1993, p. 62).
6. Welch 1973.
7. For example, given the mean years of education for people entering the
high-IQ occupations defined in Chapter 3 (16.6) and holding age constant
at the mean, the probability that whites would be in a high-lQ occupation
was 14.4 percent compared to 12.8 percent for blacks and 18.1 percent for
Latinos.
8. Gottfredson 1986.
9. Gottfredson 1986 leaves room for the possibility that blacks at the upper
end of the IQ distribution were disproportionately choosing medicine, en-
gineering, or the other professions she happened to examine. Perhaps if
she had examined other high-IQ occupations (one may hypothesize), she
would have found blacks represented at or below expectations. Our analy-
sis, incorporating a broad range of high-IQ occupations, makes this hy-
~othesis highly unlikely. The extension of the analysis in Chapter 20 rules
it out altogether.
10. The proportions in high-IQ occupations were 5.8 percent for whites, 3.1
percent for blacks, and 3.7 percent for Latinos.
11. After controlling for IQ, the unrounded proportions in high-IQ occupa-
tions were 10.4 percent for whites, 24.5 percent for blacks, and 16.2 per-
cent for Latinos.
12. "Year round" is defined as people who reported being employed for fifty-
two weeks in calendar 1989 and reported wage income greater than 0 (ex-
cluding a small number who apparently were self-employed and did not
pay themselves a wage).
13. This result is based on a regression analysis when the wage is the depen-
dent variable, age is the independent variable, and the analysis is run sep-
arately for each race. The figures reported reflect the mean for a black and
white of average age in the NLSY sample.
14. For a more detailed technical analysis of the NLSY experience, reaching
the same conclusions, see O'Neill1990. O'Neillls collateral findings about
the joint role of education and IQ are taken up in Chapter 19.
15. U.S. Bureau of the Census 1993, Table 29.
16. Precisely, 64.4 percent higher, computed using unrounded poverty rates.
17. For various approaches, see Bianchi and Farley 1980; Jargowsky 1993;
Massey and Eggers 1990; Smith and Welch 1987, Eggebeen and Llchter
1991. For a summary of the literature, see Jaynes and Williams 1989.
18. U S . Department of Labor 1993, Table 3.
19. For civilian males not in school and not prevented from working by health
problems.
20. Wilson 1987, Lemann 1991, Holzer 1986; Kasarda 1989; Topel 1993,
Jaynes and Williams 1989.
21. The proportions in 1960 were 66 percent (blacks) and 72 percent (whites).
Computed from Tables 1 and 16, National Center for Health Statistics
1993, and comparable tables in earlier editions.
22. William Julius Wilson is best known for the lack-of-marriageable-males
thesis (Wilson 1987), which is currently thought to have some explana-
tory power (like IQ) but leaves the bulk of the discrepancy unexplained
(as does IQ). See South 1993; Fossett and Kiecolt 1993; Bulcroft and Bul-
croft 1993; Schoen and Kleugel 1988; Lichter, LeClere, and McLaughlin
1991. For other empirical work bearing on the thesis, see Bennett, Bloom,
and Craig 1989; Tucker and Taylor 1989; South and Lloyd 1992; Spanier
and Glick 1980; Staples 1985.
23. National Center for Health Statistics, 1993, Table 26. Figures in the text
are for live births.
24. E.g., Anderson 1989; Bumpass and McLanahan 1989; Duncan and Laren
1990; Ellwood and Crane 1990; Furstenberg et al. 1987; Hogan and Kita-
gawa 1985; Lundberg and Plotnick 1990; Murray 1993; Rowe and Rodgers
1992; Teachman 1985.
25. Computed from Committee on Ways and Means and U S . House of Rep-
resentatives 1993, pp. 688,697; SAUS 1993, Table 23.
26. These figures, already high, are even higher when the analysis is limited
to mothers, The percentages of mothers who had ever been on welfare for
blacks, Latinos, and whites, were 65.0,40.5 and 21.8, respectively. We con-
ducted parallel analyses limited to women who had borne a child prior to
1986, giving at least five years' "chance" for a woman to show up on the
AFDC roles. This had the predictable effect of slightly increasing the per-
centages of women who had ever received AFDC, but yielded the same
substantive conclusions.
27. Intergenerational transmission has some role. See McLanahan and
Bumpass 1988; McLanahan 1988. For other discussions touching on racial
differences in welfare recipiency, see An, Haveman, and Wolfe 1990; Bem-
stam and Swan 1986; Bianchi and Farley 1980; Donnelly and Voydanoff
199 1; Duncan and Hoffman 1990; Hirschl and Rank 199 1; Hofferth 1984;
Hogan, Hao, and Paush 1990; Honig 1974; Hutchens, Jackson, and
Schwartz 1987; Smith and Welch 1989; Wiseman 1984, Hoffman 1987;
Rank 1988; Zabin et al. 1992.
28. National Center for Health Statistics 1993, Table 26.
29. Based on the Colorado Interuterine Growth Charts.
30. For discussions of reasons for the black-white gap in low-birth-weight ba-
bies see David 1990; Kempe et al. 1992; Mangold and Powell-Griner 1991.
31. U.S. Bureau of the Census 1993, Table 3. The Bureau of the Census does
not break out "non-Latino whites" in the official statistics. If one assumes
that all persons labeled as "Hispanic origin" were white, then 12.9 percent
of noneLatino white children were under the poverty line. This is an un-
derestimate for the actual figure, since many persons of Hispanic origin are
classified as black. The figure of 14 percent in the text is an estimate that
attempts to compensate roughly for the underestimate.
32. The reasons for the gap in black and white child poverty are discussed in
the same literature that deals with differences in marriage rates and ille-
gitimacy, which together account for much of the differing financial situ-
ations facing black and white mothers of young children.
33. Various approaches to ethnic differences in home environment are Heath
1982; Bardouille-Crema, Black, and Martin1986; Field et al. 1993; Kelley,
Power, and Wimbush 1992; McLoyd 1990; Moore 1985; Pearson et al.
1990; Radin 1971; Tolson and Wilson 1990; Wasserman et al. 1990. A use-
ful older account IS Davis and Havighurst 1946.
Demographic Disparities and Social Research
- Statistical analysis reveals significant racial disparities in welfare dependency, with 65% of black mothers having received AFDC compared to 21.8% of white mothers.
- The text highlights the role of intergenerational transmission in welfare recipiency and the impact of family structure on child poverty rates.
- Researchers note a persistent gap in low-birth-weight babies between black and white populations, citing various socioeconomic and health factors.
- Data collection challenges are identified, specifically the unreliability of self-report crime measures due to differing disclosure rates between racial groups.
- The section references historical and academic debates regarding the influence of home environments and the origins of the eugenics movement.
- Census data limitations are discussed, particularly the difficulty in accurately categorizing non-Latino white populations within official poverty statistics.
Self-report crime measures have consistently revealed marked differences in the willingness of black and white youths to disclose crimes.
sis, incorporating a broad range of high-IQ occupations, makes this hy-
~othesis highly unlikely. The extension of the analysis in Chapter 20 rules
it out altogether.
10. The proportions in high-IQ occupations were 5.8 percent for whites, 3.1
percent for blacks, and 3.7 percent for Latinos.
11. After controlling for IQ, the unrounded proportions in high-IQ occupa-
tions were 10.4 percent for whites, 24.5 percent for blacks, and 16.2 per-
cent for Latinos.
12. "Year round" is defined as people who reported being employed for fifty-
two weeks in calendar 1989 and reported wage income greater than 0 (ex-
cluding a small number who apparently were self-employed and did not
pay themselves a wage).
13. This result is based on a regression analysis when the wage is the depen-
dent variable, age is the independent variable, and the analysis is run sep-
arately for each race. The figures reported reflect the mean for a black and
white of average age in the NLSY sample.
14. For a more detailed technical analysis of the NLSY experience, reaching
the same conclusions, see O'Neill1990. O'Neillls collateral findings about
the joint role of education and IQ are taken up in Chapter 19.
15. U.S. Bureau of the Census 1993, Table 29.
16. Precisely, 64.4 percent higher, computed using unrounded poverty rates.
17. For various approaches, see Bianchi and Farley 1980; Jargowsky 1993;
Massey and Eggers 1990; Smith and Welch 1987, Eggebeen and Llchter
1991. For a summary of the literature, see Jaynes and Williams 1989.
18. U S . Department of Labor 1993, Table 3.
19. For civilian males not in school and not prevented from working by health
problems.
20. Wilson 1987, Lemann 1991, Holzer 1986; Kasarda 1989; Topel 1993,
Jaynes and Williams 1989.
21. The proportions in 1960 were 66 percent (blacks) and 72 percent (whites).
Computed from Tables 1 and 16, National Center for Health Statistics
1993, and comparable tables in earlier editions.
22. William Julius Wilson is best known for the lack-of-marriageable-males
thesis (Wilson 1987), which is currently thought to have some explana-
tory power (like IQ) but leaves the bulk of the discrepancy unexplained
(as does IQ). See South 1993; Fossett and Kiecolt 1993; Bulcroft and Bul-
croft 1993; Schoen and Kleugel 1988; Lichter, LeClere, and McLaughlin
1991. For other empirical work bearing on the thesis, see Bennett, Bloom,
and Craig 1989; Tucker and Taylor 1989; South and Lloyd 1992; Spanier
and Glick 1980; Staples 1985.
23. National Center for Health Statistics, 1993, Table 26. Figures in the text
are for live births.
24. E.g., Anderson 1989; Bumpass and McLanahan 1989; Duncan and Laren
1990; Ellwood and Crane 1990; Furstenberg et al. 1987; Hogan and Kita-
gawa 1985; Lundberg and Plotnick 1990; Murray 1993; Rowe and Rodgers
1992; Teachman 1985.
25. Computed from Committee on Ways and Means and U S . House of Rep-
resentatives 1993, pp. 688,697; SAUS 1993, Table 23.
26. These figures, already high, are even higher when the analysis is limited
to mothers, The percentages of mothers who had ever been on welfare for
blacks, Latinos, and whites, were 65.0,40.5 and 21.8, respectively. We con-
ducted parallel analyses limited to women who had borne a child prior to
1986, giving at least five years' "chance" for a woman to show up on the
AFDC roles. This had the predictable effect of slightly increasing the per-
centages of women who had ever received AFDC, but yielded the same
substantive conclusions.
27. Intergenerational transmission has some role. See McLanahan and
Bumpass 1988; McLanahan 1988. For other discussions touching on racial
differences in welfare recipiency, see An, Haveman, and Wolfe 1990; Bem-
stam and Swan 1986; Bianchi and Farley 1980; Donnelly and Voydanoff
199 1; Duncan and Hoffman 1990; Hirschl and Rank 199 1; Hofferth 1984;
Hogan, Hao, and Paush 1990; Honig 1974; Hutchens, Jackson, and
Schwartz 1987; Smith and Welch 1989; Wiseman 1984, Hoffman 1987;
Rank 1988; Zabin et al. 1992.
28. National Center for Health Statistics 1993, Table 26.
29. Based on the Colorado Interuterine Growth Charts.
30. For discussions of reasons for the black-white gap in low-birth-weight ba-
bies see David 1990; Kempe et al. 1992; Mangold and Powell-Griner 1991.
31. U.S. Bureau of the Census 1993, Table 3. The Bureau of the Census does
not break out "non-Latino whites" in the official statistics. If one assumes
that all persons labeled as "Hispanic origin" were white, then 12.9 percent
of noneLatino white children were under the poverty line. This is an un-
derestimate for the actual figure, since many persons of Hispanic origin are
classified as black. The figure of 14 percent in the text is an estimate that
attempts to compensate roughly for the underestimate.
32. The reasons for the gap in black and white child poverty are discussed in
the same literature that deals with differences in marriage rates and ille-
gitimacy, which together account for much of the differing financial situ-
ations facing black and white mothers of young children.
33. Various approaches to ethnic differences in home environment are Heath
1982; Bardouille-Crema, Black, and Martin1986; Field et al. 1993; Kelley,
Power, and Wimbush 1992; McLoyd 1990; Moore 1985; Pearson et al.
1990; Radin 1971; Tolson and Wilson 1990; Wasserman et al. 1990. A use-
ful older account IS Davis and Havighurst 1946.
Notes to pages 344-346
733
34. See Jones 1992 on abortion, Abramson and Claggett 1991 on voting, and
Elliott and Ageton 1980 on delinquency.
35. See the references (note 33) regarding ethnic differences in home envi-
ronment.
36. Refers to arrests for index crimes in 1992 relative to the size of the black
and white populations. Computed from Federal Bureau of lnvestigation
1993, Table 43, and SAUS 1993, Table 22. See also Wilson and Hermstein
1985, Chap. 18.
37. U.S. Bureau of the Census 1993b, Table 305.
38. R. Gordon 1976, 1987.
39. We cannot use the NLSY self-report data for inter-racial comparisons. Self-
report crime measures have consistently revealed marked differences in the
willingness of black and white youths to disclose crimes. See Elliott and
Ageton 1980; Hindelang 1981; Hindelang, Hirschi, and Weis 1981.
40. See the sixteen studies reviewed in Osbome and McGurk, 1982. See also
the results from the Philadelphia delinquency cohort (Wolfgang, Figlio,
and Sellin 1972).
Chapter 15
1. We would, of course, need to know something about the fathers' scores too.
The more complete account comes later in the chapter.
2. Also see Ghiselin and Scudo 1986; Ingle 1973.
3. Soloway 1982.
4. Francis Galton's coined the term eugenic. See Galton 1883.
5. The eugenicists were active, but, as we noted in the Introduction, the in-
telligence testers were not. For an account of what happened prior to the
passage of the xenophobic and nativist Immigration Restriction Act of
1924 and how it has gotten distorted in the retelling, see Snyderman and
Hermstein 1983.
6. "Entrinsic birth rates" are birth rates corrected for age distributions. Death
rates also decline during the demographic transition, hut they will not he
discussed in any detail here. Demographers generally believe that differ-
ential death rates cease to he a major factor in population growth in mod-
ernized societies like ours. This is a supposition that needs to be reassessed,
given the probable differential impact of infant mortalities, homicide rates,
and AIDS in relation to tested intelligence. Of all the studies we summarize
below, only Retherford and Sewell 1988 takes mortality rates into account,
but it did not have a nationally representative sample to analyze. We may
surmise that the intergenerational decline in intelligence is heing
mitigated somewhat by differential intrinsic death rates.
7. Retherford 1986; Retherford and Sewell 1988; Vining 1986; Wrong 1980.
8. Retherford 1986; Retherford and Sewell 1988.
9. Becker 1981.
10. E.g., Retherford and Sewell 1988; Rindfuss, Bumpass, and John 1980.
1 1. Vining 1982a, Vining 1986.
12. Vining 1986.
13. For a sampling of studies that indicate the importance of attitudinal vari-
ahles for motherhood in many nations, see Booth and Duvall 1981; Hass
1972; Krishnan 1990; Mason and Palan 1981; Youssef 1978.
14. Estimating the phenotypic, as distinguished from the genotypic, change in
intelligence across generations is conceptually little more than a matter of
toting up the population yielded across the distribution of intelligence,
then aggregating the subtotals to get the overall distribution of scores in
the next generation, after first taking account of regression to the mean
(Andrews 1990; Falconer 1966; Retherford and Sewell 1988). It is not nec-
essary to include any estimate for the heritability of intelligence. This sim-
plicity in conception should not he confused with simplicity in actually
making these calculations. Parents in, say, successive deciles of intelligence
may have differing intrinsic rates of population growth (or decline) be-
cause of varying lifetime fertilities, varying ages at reproduction, and vary-
ing mortality rates. Assortative mating by the parents (see Chapter 4)
matters in calculation only insofar as it influences the correlation between
parents and children. Hence, if fertility is lower at higher levels of intelli-
gence, then assortative mating for intelligence will speed the decline of the
population intelligence because it increases the correlation between par-
ents and children. Some of the studies that we cite focus on the genotypic
decline rather than the phenotypic (e.g., Retherford and Sewell 1988).
Since children resemble the parents who rear them for environmental rea-
sons as well as genetic, the population phenotype will change more rapidly
than the population genotype.
15. The hest review of the early studies is Anastasi 1956. See also Duncan
1952; Olneck, Wolfe, and Dean 1980; Retherford and Sewell 1988; Van-
Court and Bean 1985; Vining 1986.
16. Cattell 1936, Cattell 1937.
17. Retherford and Sewell 1988.
18. Cook, 195 1 p. 6.
19. As Osbom and Bajema (1972) stated, "The distribution of births in an in-
dustrial welfare-state democracy would become more eugenic as the envi-
ronment improved with respect to health, educational, and occupational
opportunities, and particularly with respect to the spread of birth control
to the point where freedom of parenthood became a reality for all citizens"
(p. 344). The Eugenic Hypothesis was first stated in Osborn 1940.
Demographics and Intelligence Trends
- The text explores how differential birth and death rates across intelligence levels influence the overall cognitive distribution of future generations.
- Demographers suggest that while death rates are often overlooked in modern population studies, factors like infant mortality and homicide may still impact population growth relative to intelligence.
- Calculating phenotypic changes in intelligence involves aggregating population yields across distributions while accounting for regression to the mean.
- Assortative mating is identified as a catalyst that can accelerate the decline of population intelligence if higher intelligence levels correlate with lower fertility.
- The 'Eugenic Hypothesis' suggests that industrial welfare states might see more favorable birth distributions as birth control and educational opportunities become universal.
- The 'Flynn Effect' is noted as a phenomenon that may mask underlying demographic declines in IQ scores over time.
Hence, if fertility is lower at higher levels of intelligence, then assortative mating for intelligence will speed the decline of the population intelligence because it increases the correlation between parents and children.
Notes to pages 344-346
733
34. See Jones 1992 on abortion, Abramson and Claggett 1991 on voting, and
Elliott and Ageton 1980 on delinquency.
35. See the references (note 33) regarding ethnic differences in home envi-
ronment.
36. Refers to arrests for index crimes in 1992 relative to the size of the black
and white populations. Computed from Federal Bureau of lnvestigation
1993, Table 43, and SAUS 1993, Table 22. See also Wilson and Hermstein
1985, Chap. 18.
37. U.S. Bureau of the Census 1993b, Table 305.
38. R. Gordon 1976, 1987.
39. We cannot use the NLSY self-report data for inter-racial comparisons. Self-
report crime measures have consistently revealed marked differences in the
willingness of black and white youths to disclose crimes. See Elliott and
Ageton 1980; Hindelang 1981; Hindelang, Hirschi, and Weis 1981.
40. See the sixteen studies reviewed in Osbome and McGurk, 1982. See also
the results from the Philadelphia delinquency cohort (Wolfgang, Figlio,
and Sellin 1972).
Chapter 15
1. We would, of course, need to know something about the fathers' scores too.
The more complete account comes later in the chapter.
2. Also see Ghiselin and Scudo 1986; Ingle 1973.
3. Soloway 1982.
4. Francis Galton's coined the term eugenic. See Galton 1883.
5. The eugenicists were active, but, as we noted in the Introduction, the in-
telligence testers were not. For an account of what happened prior to the
passage of the xenophobic and nativist Immigration Restriction Act of
1924 and how it has gotten distorted in the retelling, see Snyderman and
Hermstein 1983.
6. "Entrinsic birth rates" are birth rates corrected for age distributions. Death
rates also decline during the demographic transition, hut they will not he
discussed in any detail here. Demographers generally believe that differ-
ential death rates cease to he a major factor in population growth in mod-
ernized societies like ours. This is a supposition that needs to be reassessed,
given the probable differential impact of infant mortalities, homicide rates,
and AIDS in relation to tested intelligence. Of all the studies we summarize
below, only Retherford and Sewell 1988 takes mortality rates into account,
but it did not have a nationally representative sample to analyze. We may
surmise that the intergenerational decline in intelligence is heing
mitigated somewhat by differential intrinsic death rates.
7. Retherford 1986; Retherford and Sewell 1988; Vining 1986; Wrong 1980.
8. Retherford 1986; Retherford and Sewell 1988.
9. Becker 1981.
10. E.g., Retherford and Sewell 1988; Rindfuss, Bumpass, and John 1980.
1 1. Vining 1982a, Vining 1986.
12. Vining 1986.
13. For a sampling of studies that indicate the importance of attitudinal vari-
ahles for motherhood in many nations, see Booth and Duvall 1981; Hass
1972; Krishnan 1990; Mason and Palan 1981; Youssef 1978.
14. Estimating the phenotypic, as distinguished from the genotypic, change in
intelligence across generations is conceptually little more than a matter of
toting up the population yielded across the distribution of intelligence,
then aggregating the subtotals to get the overall distribution of scores in
the next generation, after first taking account of regression to the mean
(Andrews 1990; Falconer 1966; Retherford and Sewell 1988). It is not nec-
essary to include any estimate for the heritability of intelligence. This sim-
plicity in conception should not he confused with simplicity in actually
making these calculations. Parents in, say, successive deciles of intelligence
may have differing intrinsic rates of population growth (or decline) be-
cause of varying lifetime fertilities, varying ages at reproduction, and vary-
ing mortality rates. Assortative mating by the parents (see Chapter 4)
matters in calculation only insofar as it influences the correlation between
parents and children. Hence, if fertility is lower at higher levels of intelli-
gence, then assortative mating for intelligence will speed the decline of the
population intelligence because it increases the correlation between par-
ents and children. Some of the studies that we cite focus on the genotypic
decline rather than the phenotypic (e.g., Retherford and Sewell 1988).
Since children resemble the parents who rear them for environmental rea-
sons as well as genetic, the population phenotype will change more rapidly
than the population genotype.
15. The hest review of the early studies is Anastasi 1956. See also Duncan
1952; Olneck, Wolfe, and Dean 1980; Retherford and Sewell 1988; Van-
Court and Bean 1985; Vining 1986.
16. Cattell 1936, Cattell 1937.
17. Retherford and Sewell 1988.
18. Cook, 195 1 p. 6.
19. As Osbom and Bajema (1972) stated, "The distribution of births in an in-
dustrial welfare-state democracy would become more eugenic as the envi-
ronment improved with respect to health, educational, and occupational
opportunities, and particularly with respect to the spread of birth control
to the point where freedom of parenthood became a reality for all citizens"
(p. 344). The Eugenic Hypothesis was first stated in Osborn 1940.
734
Notes to pages 346-349
20. Maxwell 1954; Scottish Council for Research in Education 1949.
21. Cattell 195 1. See also Tuddenharn 1948.
22. Higgins, Reed, and Reed 1962.
23. Baje~ni~
1963, 1971; Olneck, Wolfe, and 1)ean 1980; Waller 1971. In ad-
dition, as we explained in Chapter 11, the Flynn Effect would hilve m;~sk~d
any decline in IQ by demographic processes.
24. Cattell 1974; Osborne 1975.
25. Retherford and Sewell 1988.
26. Vining 1982h.
27. VanC:ourt and Bean 1985.
28. Retherford and Sewell 1988.
29. Ree anct Earles I991 a.
30. The simplest way to get around the e5timi1tcs that scholars have derive-d
would he to measure the 1Qs of successive generations, following pilrents
and thcir children, but surprisingly few studies of any size meL1surc cogni-
tive ahility in both parents and children, and those few hitvt, alwi~ys Iwcn
s~nall studies cclnlluctsd for specific purpuses; none has mcL the crucii~l csi-
terion of national representativeness. In the Unitcti Statch, the NLSY ha5
the potential to yielcl such estimates, if the stildy c o n t i ~ ~ u ~ s
long enoitgll,
because it has already initiilted a program of testing thc children of the
NLSY ~uothers. As of now, however, it provides no intcrprctable d ; ~ t i ~
i l l ~ o ~ r
thc nationill population as a whole. The wolllen of the NLSY are only 1>,1rl-
way through their childbei~rin~
years (ages 25 to 3 3 as of ollr last c~hscrva-
tion), and the children of the sit~nple ;ire i~typicill in that they wc.re
disproportionately horn to young mothers, who may differ in the-ir child-
rearing practices from older mothers. The sample is still missing altogcrller
many of the children of women who delay chilclh~nrin~,
\vho ill turn iirc
disproportionately wornen with advanceci education-and
high 1Qs. Wt.
can usc the mother-child testing dilt;i to extract ;I few clttcs i~bout cthn~c.
differences, described later in this chapter.
3 1. See Chi~pter 17.
32. Not everyone Llgrees that ir is worrisome. In ;I rccent cc?ntribution to rile
fertility clehste, S:unuel Preston and Chmeron Camphell ( 199 3 ) c h i ~ l l c ~ l ~ c
thc premise that negative differrntial fertility on the microlcvcl mlrst ruciln
tillling national i~ltclli~ence
on the ~nacrolevel. Such ~~cgiitivc
Jiffercntials
are comp;ttible, they argue, with a constant, improving, or detcrior;~ting
intelligence distribution in the popul:~rion as a whole. It all depends on
how the current differentials rclatc ro past and future fertilit). piltterns. The
;lrgulncnt is densely mathcniatic;il, and neither the ;~rticlc nor thc two ;IC-
companying co~nmentarics lend themselves to e;\sy sumrllav. Interpreting
the argument is co~nplicated by the fact that tht: authors oper;~tic,n;llizc~l
their model with one of the only data sets in which the fertility differen-
rial is i u ~ t negi~tive. However, the narrowest n~athe~natical
implication of
their model remains accurate: It is possible to postulate conditions rhar
procluce ;I consrant or even rising IQ in the face of negative fertility dif-
tcrentiiils. Thcrc is no reason to sl~pposc t h a ~
those special conditions prc-
vail now or 11;lve in rhe recent pilst.]ames Coleman (1993) simil;uly points
out In his commentary that these hypothocical cunclitions do not have
nluch to do with what is known about the history of fertility, concluding
that "thcir rejection of the common belief i~hout the e&ct of fertility dif-
ferences is not warranted. What they have done is not to answer the ques-
tions invol\lecl, hut to frame thc problem in a most i~sefill way" (11 1012).
33. A pop~~l;~tion
has ;I limited numhcr of ov;~ i ~ n J
~III unlimited numher t)f
sperm. Theref(>re, wh:~t matters for replacement (net of migr;ltion) is how
many femiales are horn and what their fertilities are. Hence, since slightly
murc than 50 pcrcent of births are males and since a few of the fe~nalcs clo
nor rei~ch the age of reproduction, the avcrage woman needs to have ap-
prc>ximately 2.1 births to attain replacement fertility.
34. Sweet and Kindfuss 1983, Fig. 2. Other countries similarly show the im-
pact of education on fertility. A study of Mexican women in which ur-
haniziltion, occupation, migration, and education were examined for their
etfects on fertility found that education was the main ~lepressant. See Pick,
Butler, and Pavgi 1988.
35. B;lsed on co~nplctcd fer~ility for women ilges 35 to 44 in the Buretlu of the
<:ensus's Current Population Survey, a nationally rcpresent;~rivc sample,
in June 1992 (Rachu 1993, Xthle 2). The mean 1Q represents the aggre-
gated means by educational level. This c;~lculation assumes rhat the mean
1Q ofwomen ; ~ t
various edr~cational lrvcls is the same for women horn from
1948 to 1957 (the national sample represented in the figure on page 349)
as it was for the NLSY women born frorn 1957 to 1964. [s this plausible?
Women horn from 1948 to 1957 grililuated from high school from 1966 to
1975, after the percentage ofstudents finishing highschool had hit its peak,
after the major shifts in educational recruitment to college had already
chilngeil for whites, and after aggressive affirmative action had hcgun for
blacks and to some extent for Latinos. We can think of' no reasun to its-
sumc th;~t the mean IQ of NLSY women (born from 1957 to 1964) at dif-
ferent levels of educi~t.ional attainment was systc~nirtically different than
ft)r rhe cohort of women born from 1948 to 1957, though it could have
heen.
36. The data report the educat~on of the mt)ther at the time she hab a child,
but a very young mother may later go back to f ~ n ~ s h
high \chool, '~nd it
wornan with a bachelor's degree may return for a master's or a Ph.11. In as-
cribing 1Qs based on educational attainment, it is irnporti~nt to base them
on the finial attainment, not just on the years of education at the timr of
Fertility and Cognitive Trends
- Scholars face significant challenges in measuring intergenerational IQ changes due to a lack of nationally representative studies tracking both parents and children.
- The National Longitudinal Survey of Youth (NLSY) offers potential data, but current results are skewed because the sample primarily includes children of younger mothers.
- Mathematical models by Preston and Campbell suggest that negative fertility differentials do not strictly guarantee a decline in national intelligence, though this is debated.
- James Coleman argues that while these theoretical models are useful for framing the problem, they do not align with historical fertility patterns.
- Replacement fertility requires an average of 2.1 births per woman, a rate significantly influenced by maternal education levels across different cultures.
- Education is identified as a primary depressant of fertility rates, as seen in studies of both the United States and international populations like Mexico.
The argument is densely mathematical, and neither the article nor the two accompanying commentaries lend themselves to easy summary.
734
Notes to pages 346-349
20. Maxwell 1954; Scottish Council for Research in Education 1949.
21. Cattell 195 1. See also Tuddenharn 1948.
22. Higgins, Reed, and Reed 1962.
23. Baje~ni~
1963, 1971; Olneck, Wolfe, and 1)ean 1980; Waller 1971. In ad-
dition, as we explained in Chapter 11, the Flynn Effect would hilve m;~sk~d
any decline in IQ by demographic processes.
24. Cattell 1974; Osborne 1975.
25. Retherford and Sewell 1988.
26. Vining 1982h.
27. VanC:ourt and Bean 1985.
28. Retherford and Sewell 1988.
29. Ree anct Earles I991 a.
30. The simplest way to get around the e5timi1tcs that scholars have derive-d
would he to measure the 1Qs of successive generations, following pilrents
and thcir children, but surprisingly few studies of any size meL1surc cogni-
tive ahility in both parents and children, and those few hitvt, alwi~ys Iwcn
s~nall studies cclnlluctsd for specific purpuses; none has mcL the crucii~l csi-
terion of national representativeness. In the Unitcti Statch, the NLSY ha5
the potential to yielcl such estimates, if the stildy c o n t i ~ ~ u ~ s
long enoitgll,
because it has already initiilted a program of testing thc children of the
NLSY ~uothers. As of now, however, it provides no intcrprctable d ; ~ t i ~
i l l ~ o ~ r
thc nationill population as a whole. The wolllen of the NLSY are only 1>,1rl-
way through their childbei~rin~
years (ages 25 to 3 3 as of ollr last c~hscrva-
tion), and the children of the sit~nple ;ire i~typicill in that they wc.re
disproportionately horn to young mothers, who may differ in the-ir child-
rearing practices from older mothers. The sample is still missing altogcrller
many of the children of women who delay chilclh~nrin~,
\vho ill turn iirc
disproportionately wornen with advanceci education-and
high 1Qs. Wt.
can usc the mother-child testing dilt;i to extract ;I few clttcs i~bout cthn~c.
differences, described later in this chapter.
3 1. See Chi~pter 17.
32. Not everyone Llgrees that ir is worrisome. In ;I rccent cc?ntribution to rile
fertility clehste, S:unuel Preston and Chmeron Camphell ( 199 3 ) c h i ~ l l c ~ l ~ c
thc premise that negative differrntial fertility on the microlcvcl mlrst ruciln
tillling national i~ltclli~ence
on the ~nacrolevel. Such ~~cgiitivc
Jiffercntials
are comp;ttible, they argue, with a constant, improving, or detcrior;~ting
intelligence distribution in the popul:~rion as a whole. It all depends on
how the current differentials rclatc ro past and future fertilit). piltterns. The
;lrgulncnt is densely mathcniatic;il, and neither the ;~rticlc nor thc two ;IC-
companying co~nmentarics lend themselves to e;\sy sumrllav. Interpreting
the argument is co~nplicated by the fact that tht: authors oper;~tic,n;llizc~l
their model with one of the only data sets in which the fertility differen-
rial is i u ~ t negi~tive. However, the narrowest n~athe~natical
implication of
their model remains accurate: It is possible to postulate conditions rhar
procluce ;I consrant or even rising IQ in the face of negative fertility dif-
tcrentiiils. Thcrc is no reason to sl~pposc t h a ~
those special conditions prc-
vail now or 11;lve in rhe recent pilst.]ames Coleman (1993) simil;uly points
out In his commentary that these hypothocical cunclitions do not have
nluch to do with what is known about the history of fertility, concluding
that "thcir rejection of the common belief i~hout the e&ct of fertility dif-
ferences is not warranted. What they have done is not to answer the ques-
tions invol\lecl, hut to frame thc problem in a most i~sefill way" (11 1012).
33. A pop~~l;~tion
has ;I limited numhcr of ov;~ i ~ n J
~III unlimited numher t)f
sperm. Theref(>re, wh:~t matters for replacement (net of migr;ltion) is how
many femiales are horn and what their fertilities are. Hence, since slightly
murc than 50 pcrcent of births are males and since a few of the fe~nalcs clo
nor rei~ch the age of reproduction, the avcrage woman needs to have ap-
prc>ximately 2.1 births to attain replacement fertility.
34. Sweet and Kindfuss 1983, Fig. 2. Other countries similarly show the im-
pact of education on fertility. A study of Mexican women in which ur-
haniziltion, occupation, migration, and education were examined for their
etfects on fertility found that education was the main ~lepressant. See Pick,
Butler, and Pavgi 1988.
35. B;lsed on co~nplctcd fer~ility for women ilges 35 to 44 in the Buretlu of the
<:ensus's Current Population Survey, a nationally rcpresent;~rivc sample,
in June 1992 (Rachu 1993, Xthle 2). The mean 1Q represents the aggre-
gated means by educational level. This c;~lculation assumes rhat the mean
1Q ofwomen ; ~ t
various edr~cational lrvcls is the same for women horn from
1948 to 1957 (the national sample represented in the figure on page 349)
as it was for the NLSY women born frorn 1957 to 1964. [s this plausible?
Women horn from 1948 to 1957 grililuated from high school from 1966 to
1975, after the percentage ofstudents finishing highschool had hit its peak,
after the major shifts in educational recruitment to college had already
chilngeil for whites, and after aggressive affirmative action had hcgun for
blacks and to some extent for Latinos. We can think of' no reasun to its-
sumc th;~t the mean IQ of NLSY women (born from 1957 to 1964) at dif-
ferent levels of educi~t.ional attainment was systc~nirtically different than
ft)r rhe cohort of women born from 1948 to 1957, though it could have
heen.
36. The data report the educat~on of the mt)ther at the time she hab a child,
but a very young mother may later go back to f ~ n ~ s h
high \chool, '~nd it
wornan with a bachelor's degree may return for a master's or a Ph.11. In as-
cribing 1Qs based on educational attainment, it is irnporti~nt to base them
on the finial attainment, not just on the years of education at the timr of
Estimating Maternal IQ and Education
- Researchers utilized the National Longitudinal Survey of Youth (NLSY) to estimate the mean IQ of mothers based on their eventual educational attainment.
- The study assumes that the relationship between IQ and education levels remained stable for women born between 1948 and 1964 despite shifts in educational recruitment.
- A complex adjustment process was required to account for young mothers who return to school to finish high school or earn advanced degrees after giving birth.
- Calculations were performed separately by race to account for observed discrepancies in IQ scores among different racial groups with equivalent years of education.
- The final estimated mean IQ for the 1991 U.S. birth cohort of mothers was calculated to be approximately 98.0 based on these adjusted educational trajectories.
In ascribing IQs based on educational attainment, it is important to base them on the final attainment, not just on the years of education at the time of birth.
734
Notes to pages 346-349
20. Maxwell 1954; Scottish Council for Research in Education 1949.
21. Cattell 195 1. See also Tuddenharn 1948.
22. Higgins, Reed, and Reed 1962.
23. Baje~ni~
1963, 1971; Olneck, Wolfe, and 1)ean 1980; Waller 1971. In ad-
dition, as we explained in Chapter 11, the Flynn Effect would hilve m;~sk~d
any decline in IQ by demographic processes.
24. Cattell 1974; Osborne 1975.
25. Retherford and Sewell 1988.
26. Vining 1982h.
27. VanC:ourt and Bean 1985.
28. Retherford and Sewell 1988.
29. Ree anct Earles I991 a.
30. The simplest way to get around the e5timi1tcs that scholars have derive-d
would he to measure the 1Qs of successive generations, following pilrents
and thcir children, but surprisingly few studies of any size meL1surc cogni-
tive ahility in both parents and children, and those few hitvt, alwi~ys Iwcn
s~nall studies cclnlluctsd for specific purpuses; none has mcL the crucii~l csi-
terion of national representativeness. In the Unitcti Statch, the NLSY ha5
the potential to yielcl such estimates, if the stildy c o n t i ~ ~ u ~ s
long enoitgll,
because it has already initiilted a program of testing thc children of the
NLSY ~uothers. As of now, however, it provides no intcrprctable d ; ~ t i ~
i l l ~ o ~ r
thc nationill population as a whole. The wolllen of the NLSY are only 1>,1rl-
way through their childbei~rin~
years (ages 25 to 3 3 as of ollr last c~hscrva-
tion), and the children of the sit~nple ;ire i~typicill in that they wc.re
disproportionately horn to young mothers, who may differ in the-ir child-
rearing practices from older mothers. The sample is still missing altogcrller
many of the children of women who delay chilclh~nrin~,
\vho ill turn iirc
disproportionately wornen with advanceci education-and
high 1Qs. Wt.
can usc the mother-child testing dilt;i to extract ;I few clttcs i~bout cthn~c.
differences, described later in this chapter.
3 1. See Chi~pter 17.
32. Not everyone Llgrees that ir is worrisome. In ;I rccent cc?ntribution to rile
fertility clehste, S:unuel Preston and Chmeron Camphell ( 199 3 ) c h i ~ l l c ~ l ~ c
thc premise that negative differrntial fertility on the microlcvcl mlrst ruciln
tillling national i~ltclli~ence
on the ~nacrolevel. Such ~~cgiitivc
Jiffercntials
are comp;ttible, they argue, with a constant, improving, or detcrior;~ting
intelligence distribution in the popul:~rion as a whole. It all depends on
how the current differentials rclatc ro past and future fertilit). piltterns. The
;lrgulncnt is densely mathcniatic;il, and neither the ;~rticlc nor thc two ;IC-
companying co~nmentarics lend themselves to e;\sy sumrllav. Interpreting
the argument is co~nplicated by the fact that tht: authors oper;~tic,n;llizc~l
their model with one of the only data sets in which the fertility differen-
rial is i u ~ t negi~tive. However, the narrowest n~athe~natical
implication of
their model remains accurate: It is possible to postulate conditions rhar
procluce ;I consrant or even rising IQ in the face of negative fertility dif-
tcrentiiils. Thcrc is no reason to sl~pposc t h a ~
those special conditions prc-
vail now or 11;lve in rhe recent pilst.]ames Coleman (1993) simil;uly points
out In his commentary that these hypothocical cunclitions do not have
nluch to do with what is known about the history of fertility, concluding
that "thcir rejection of the common belief i~hout the e&ct of fertility dif-
ferences is not warranted. What they have done is not to answer the ques-
tions invol\lecl, hut to frame thc problem in a most i~sefill way" (11 1012).
33. A pop~~l;~tion
has ;I limited numhcr of ov;~ i ~ n J
~III unlimited numher t)f
sperm. Theref(>re, wh:~t matters for replacement (net of migr;ltion) is how
many femiales are horn and what their fertilities are. Hence, since slightly
murc than 50 pcrcent of births are males and since a few of the fe~nalcs clo
nor rei~ch the age of reproduction, the avcrage woman needs to have ap-
prc>ximately 2.1 births to attain replacement fertility.
34. Sweet and Kindfuss 1983, Fig. 2. Other countries similarly show the im-
pact of education on fertility. A study of Mexican women in which ur-
haniziltion, occupation, migration, and education were examined for their
etfects on fertility found that education was the main ~lepressant. See Pick,
Butler, and Pavgi 1988.
35. B;lsed on co~nplctcd fer~ility for women ilges 35 to 44 in the Buretlu of the
<:ensus's Current Population Survey, a nationally rcpresent;~rivc sample,
in June 1992 (Rachu 1993, Xthle 2). The mean 1Q represents the aggre-
gated means by educational level. This c;~lculation assumes rhat the mean
1Q ofwomen ; ~ t
various edr~cational lrvcls is the same for women horn from
1948 to 1957 (the national sample represented in the figure on page 349)
as it was for the NLSY women born frorn 1957 to 1964. [s this plausible?
Women horn from 1948 to 1957 grililuated from high school from 1966 to
1975, after the percentage ofstudents finishing highschool had hit its peak,
after the major shifts in educational recruitment to college had already
chilngeil for whites, and after aggressive affirmative action had hcgun for
blacks and to some extent for Latinos. We can think of' no reasun to its-
sumc th;~t the mean IQ of NLSY women (born from 1957 to 1964) at dif-
ferent levels of educi~t.ional attainment was systc~nirtically different than
ft)r rhe cohort of women born from 1948 to 1957, though it could have
heen.
36. The data report the educat~on of the mt)ther at the time she hab a child,
but a very young mother may later go back to f ~ n ~ s h
high \chool, '~nd it
wornan with a bachelor's degree may return for a master's or a Ph.11. In as-
cribing 1Qs based on educational attainment, it is irnporti~nt to base them
on the finial attainment, not just on the years of education at the timr of
Notes to pages 352-356
737
birth. Our procedure for doing so was as follows: Using the NLSY, we first
established the difference between education at the time of birth and ed-
ucation as of 1990, when the youngest woman in the NLSY was reaching
26. In the first version of our procedure, it was assumed that the propor-
tion of women who gave birth at ages 26 to 33 (the age range of 98 per-
cent of NLSY women by the 1990 interview) who would subsequently
move into a new educational category (the categories were 0-1 1, 12,
13-15, 16, and 17 or more years of education) was extremely small. We
then computed an adjusted version of the table showing births by age by
race in National Center for Health Statistics 1993, Table 20, assuming
eventual educational attainment equal to that observed in the NLSY (for
example, 36.1 percent of NLSY women who had ten years of education
when they first gave birth reported twelve years of education by 1990; we
recomputed the NCHS cell assuming that 36.1 percent of the women in
the NCHS figures who were shown as having ten years of education would
eventually get twelve). We then used the adjusted matrix of births by age
by race to estimate IQs, using the NLSY mean IQs for women with equiv-
alent years of education. Note that this computation must be done using
separate estimates by race, because of the large discrepancy between the
IQs of blacks and whites of equivalent years of education. This first itera-
tion yielded an estimated mean IQ of mothers for the 1991 U.S. birth co-
hort of 97.9. We then repeated the process, uslng a sample limited to births
that occurred by the end of 1986, meaning that each mother had at least
four years of postbirth observation to see if she went back to school. This
version avoided the assumption that women ages 26 and over seldom go
hack to school, at the cost of reducing sample sizes and perhaps introduc-
ing some unrepresentativeness into the truncated sample. The estimated
1Q for the mothers of 1991 US. birth cohort using this procedure was 98.0.
3 7. The actual figure, based on all births through 1990, was 95.7. It is produced
by taking the mean (using sample weights as always) of the 1Q associated
with the mother of each child born to an NLSY mother.
38. Out of every 100 women ages 30 to 34 in 1990, only 2 had their first hirth
that year; after age 34, the proportion fell rapidly to near zero. See Bachu
1991, Table 4. We realize that many readers know personally of numerous
women who had their first babies in their late thirties. It is one more use-
ful example of the difference between the world in which most of our read-
ers live and the rest of the country.
39. Women of the NLSY who had reached ages 32 to 33 may be expected to
have borne about 83 percent of all the babies they will ever bear (inter-
polated from National Center for Health Statistics 1991, Table 2).
40. The biases will understate the age differential by cognitive class because
(based on known patterns of childbearing by women of different educa-
tional groups) the largest change in the final mean age of births will occur
among the brightest women.
41. Bachu 1993, Table 2.
42. This finding echoes points made in other places. We showed earlier (see
Chapter 8) that it is not IQ per se that depresses fertility but the things
that a higher IQ results in, such as more education (see Retherford and
Sewell 1989; Rindfuss, Morgan, and Spicegood 1980). At given IQ scores,
blacks get more schooling than either whites or Latinos (Chapters 13, 18).
Hence we should not be surprised that, at given IQ scores, blacks have
lower fertility than either of the other groups; they are more likely to be
still in school.
43. Rindfuss, Morgan, and Spicegood 1980; Osbome 1973; Chen and Morgan
1991b.
44. Chen and Morgan 1991a; Rindfuss, Morgan, and Spicegood 1988.
45. The quotation is taken from Baker and Mott 1989, p. 24.
46. To mention just one of the most important reasons to hedge, the partici-
pation of Latino mothers in the NLSY testing program was comparatively
low, making the white-Latino comparison quite tentative. And as we cau-
tioned in Chapter 14, the PPVT is probably less valid for Latinos than for
other groups. This may bear on the comparison between Latino-white dif-
ferences among mothers and among children. In any case, the figure for
the apparent dysgenic effect for the Latino-white comparison is small
enough to deter strong conclusions.
In contrast, the black-white apparent dysgenic effect is large, and we
examined it using several methods to see if it might be spurious. The table
on page 356 reports the results using the children's sample weights, and
comparing tested children with the mothers of those children, counting a
mother more than once if she had more than one child and counting the
same child more than once if he or she had been tested in more than one
year (after turning 6). If we repeat the same calculation but including all
children who were tested (including those under the age of 6), the black-
white difference among the mothers is 13.9 points, compared to a differ.
ence among the children of 20.0 points, an even larger dysgenic difference
than the one produced by the children ages 6 and older. Another approach
is to discard the sample weights (which are problematic in several respects,
when comparing across test
and instead restrict the sample to chil-
dren born to mothers who were in the cross-sectional NLSY sample. Do-
ing so for all children who took the PPVT after the age of 6 produces a
B/W difference of 14.8 points for the mothers and 18.1 points for the chil-
dren, or a dysgenic difference of 3.3 points. Doing so for all children who
took the PPVT produces a B/W difference of 14.9 points for the mothers
and 19.4 for the children, or a dysgenic difference of 4.5 points.
Cognitive Class and Fertility Patterns
- The text highlights a disconnect between the social circles of the readers and the broader national trends regarding the age of first-time mothers.
- Data suggests that by ages 32 to 33, women in the NLSY study have likely completed over 80 percent of their lifetime childbearing.
- Higher IQ is linked to lower fertility primarily through mediating factors like increased education rather than intelligence itself.
- The authors observe a 'dysgenic effect' where the IQ gap between black and white children appears larger than the gap between their respective mothers.
- Methodological challenges are noted regarding Latino data, including lower participation rates and potential validity issues with the PPVT test for that group.
- Statistical adjustments and different sampling methods consistently point toward a significant widening of racial cognitive differences across generations in the study.
It is one more useful example of the difference between the world in which most of our readers live and the rest of the country.
Notes to pages 352-356
737
birth. Our procedure for doing so was as follows: Using the NLSY, we first
established the difference between education at the time of birth and ed-
ucation as of 1990, when the youngest woman in the NLSY was reaching
26. In the first version of our procedure, it was assumed that the propor-
tion of women who gave birth at ages 26 to 33 (the age range of 98 per-
cent of NLSY women by the 1990 interview) who would subsequently
move into a new educational category (the categories were 0-1 1, 12,
13-15, 16, and 17 or more years of education) was extremely small. We
then computed an adjusted version of the table showing births by age by
race in National Center for Health Statistics 1993, Table 20, assuming
eventual educational attainment equal to that observed in the NLSY (for
example, 36.1 percent of NLSY women who had ten years of education
when they first gave birth reported twelve years of education by 1990; we
recomputed the NCHS cell assuming that 36.1 percent of the women in
the NCHS figures who were shown as having ten years of education would
eventually get twelve). We then used the adjusted matrix of births by age
by race to estimate IQs, using the NLSY mean IQs for women with equiv-
alent years of education. Note that this computation must be done using
separate estimates by race, because of the large discrepancy between the
IQs of blacks and whites of equivalent years of education. This first itera-
tion yielded an estimated mean IQ of mothers for the 1991 U.S. birth co-
hort of 97.9. We then repeated the process, uslng a sample limited to births
that occurred by the end of 1986, meaning that each mother had at least
four years of postbirth observation to see if she went back to school. This
version avoided the assumption that women ages 26 and over seldom go
hack to school, at the cost of reducing sample sizes and perhaps introduc-
ing some unrepresentativeness into the truncated sample. The estimated
1Q for the mothers of 1991 US. birth cohort using this procedure was 98.0.
3 7. The actual figure, based on all births through 1990, was 95.7. It is produced
by taking the mean (using sample weights as always) of the 1Q associated
with the mother of each child born to an NLSY mother.
38. Out of every 100 women ages 30 to 34 in 1990, only 2 had their first hirth
that year; after age 34, the proportion fell rapidly to near zero. See Bachu
1991, Table 4. We realize that many readers know personally of numerous
women who had their first babies in their late thirties. It is one more use-
ful example of the difference between the world in which most of our read-
ers live and the rest of the country.
39. Women of the NLSY who had reached ages 32 to 33 may be expected to
have borne about 83 percent of all the babies they will ever bear (inter-
polated from National Center for Health Statistics 1991, Table 2).
40. The biases will understate the age differential by cognitive class because
(based on known patterns of childbearing by women of different educa-
tional groups) the largest change in the final mean age of births will occur
among the brightest women.
41. Bachu 1993, Table 2.
42. This finding echoes points made in other places. We showed earlier (see
Chapter 8) that it is not IQ per se that depresses fertility but the things
that a higher IQ results in, such as more education (see Retherford and
Sewell 1989; Rindfuss, Morgan, and Spicegood 1980). At given IQ scores,
blacks get more schooling than either whites or Latinos (Chapters 13, 18).
Hence we should not be surprised that, at given IQ scores, blacks have
lower fertility than either of the other groups; they are more likely to be
still in school.
43. Rindfuss, Morgan, and Spicegood 1980; Osbome 1973; Chen and Morgan
1991b.
44. Chen and Morgan 1991a; Rindfuss, Morgan, and Spicegood 1988.
45. The quotation is taken from Baker and Mott 1989, p. 24.
46. To mention just one of the most important reasons to hedge, the partici-
pation of Latino mothers in the NLSY testing program was comparatively
low, making the white-Latino comparison quite tentative. And as we cau-
tioned in Chapter 14, the PPVT is probably less valid for Latinos than for
other groups. This may bear on the comparison between Latino-white dif-
ferences among mothers and among children. In any case, the figure for
the apparent dysgenic effect for the Latino-white comparison is small
enough to deter strong conclusions.
In contrast, the black-white apparent dysgenic effect is large, and we
examined it using several methods to see if it might be spurious. The table
on page 356 reports the results using the children's sample weights, and
comparing tested children with the mothers of those children, counting a
mother more than once if she had more than one child and counting the
same child more than once if he or she had been tested in more than one
year (after turning 6). If we repeat the same calculation but including all
children who were tested (including those under the age of 6), the black-
white difference among the mothers is 13.9 points, compared to a differ.
ence among the children of 20.0 points, an even larger dysgenic difference
than the one produced by the children ages 6 and older. Another approach
is to discard the sample weights (which are problematic in several respects,
when comparing across test
and instead restrict the sample to chil-
dren born to mothers who were in the cross-sectional NLSY sample. Do-
ing so for all children who took the PPVT after the age of 6 produces a
B/W difference of 14.8 points for the mothers and 18.1 points for the chil-
dren, or a dysgenic difference of 3.3 points. Doing so for all children who
took the PPVT produces a B/W difference of 14.9 points for the mothers
and 19.4 for the children, or a dysgenic difference of 4.5 points.
738
Notes to pages 356-357
Notes to pages 358-367
739
Our next step was to examine separately the results from the three test
years (1986, 1988, and 1990). For the children who were 6 or older when
they took the test (which again shows a smaller difference than when the
test includes all children), the B/W differences for the three test years,
using sample weights, were 5.9, 1.9, and 3.0 points, respectively. The dif-
ferences across test year did not affect the conclusion that a significant
dysgenic effect exists, but the reasons for the differences are worth inves-
tigating.
In our attempt to see whether the dysgenic effect could be attenuated,
we repeated all of these analyses with one difference: Instead of using the
national norms for the PPVT (normed to a mean of 100 and SD of 15), we
let the NLSY children be their own reference group, comparing the black
and white scores using the observed mean and standard deviation for all
NLSY children who took the test. This procedure reduces the estimate of
the dyssenic effect. For example, the results, using sample weights, for the
children who were 6 and older, showed an increasing B/W gap of 1.9 points
instead of the 3.9 points produced by using the national norms. The diffi-
culty in interpreting this finding is that the procedure itself has no good
rationale. The PPVT national norms seem to have been properly deter-
mined. If anything, the Flynn effect should mean that the NLSY children,
taking the test anywhere from seven to eleven years after the norms were
established, should have a 2- to 3-point 1Q edge when compared to the na-
tional norms. So we have no reason to think that the lower estimate is the
correct one, but it does represent the best way we could concoct to mini-
mize the B/W dysgenic effect.
Finally, we explored how the births to NLSY women might affect these
findings by comparing black and white women who had not borne a child
as of 1990. The mean IQ for the childless white women was 106.6, com-
pared to 100.3 for childless black women. That black women without chil-
dren have a mean of 100 is in itself striking evidence of the low fertility
among the top part of the black IQ distribution, but even if subsequent fer-
tility for the two groups is the same, the B/W gap in the next generation
will presumably continue to diverge as the NLSY women complete their
fertility.
47. New York Xrnes. "Slighting words, fighting words." Feb. 13, 1990, p. A24.
48. The computation in the text counts each mother as many times as she had
children who were tested. If instead each mother is counted only once, the
white-black difference among mothers is 1.12 SDs. The white-Latino dif-
ference is 1.05 SDs.
49. Auster 1990; Bouvier 1991; Gould 1981; Simon 1989; Wattenberg 1987;
Wattenberg and Zinsmeister 1990.
50. Holden 1988.
51. E.g., Higham 1973; Lukacs 1986.
52. Simon 1989. For a symposium, see Simon et al. 1993.
53. Auster 1990, and various contributors in Simon et al. 1993.
54. Bouvier and Davis 1982. This particular estimate is based on annual im-
migration of 1 million.
55. The figures for the 1950s, 1960s, and 1970s were 11 percent, 16 percent
and 18 percent respectively. SAUS 1992, Table 14 (SAUS 1971, Table 4).
56. Lynn 1991.
57. SAUS 1992, Table 8. The figures also includes once-illegal immigrants who
were granted permanent residence under the Immigration Reform and
Control Act of 1986.
58. Sowell 1981.
59. A first, elementary consideration is that the NLSY data refer almost ex-
clusively to the children of the adults who decided to immigrate. What-
ever self-selection for IQ mlght have existed in the elders will he less visible
in their offspring.
60. Carliner 1980; Chiswick 1978; Gabriel 1991.
61. Rorjas 1987. Borjas's formulation also draws on Roy 1951 and Sjaastad
1962. In forthcoming papers, Borjas has since extended his analysis
through the 1990 census, showing a continuation of the trends from 1970
to 1980. Borjas 1993, 1994.
62. Borjas 1987, Table 3.
63. Sowell 1981, p. 220.
64. Rorjas 1987, Table 3.
65. Rorjas 1987, p. 552.
66. The procedure is limited to the NLSY's cross-sectional sample (i.e., omit-
ting the supplemental samples), so that sample weights are no longer an
issue. Using random numbers, subjects with l Q scores above 97 had an
equal chance of being discarded. Because different subsamples could yield
different results, we created two separate samples with a mean of 97 and
replicated all of the analyses. The data reported in the table on page 368
represent the average produced by the two replications, compared to the
national mean as represented by unweighted calculations using the entire
cross-sectional sample.
67. Cattell 1938, as reprinted in Cattell 1983.
68. Cattell 1983, pp. 167, 168.
69. Cattell 1983, pp. 167, 175.
70. Cattell 1983, pp. 167, 169.
7 1. The procedures parallel those used for the preceding analysis of a mean of
97.
72. In effect, our sample with a mean of 97 shows what happens when people
with above-average IQs decrease their fertility, and our sample of 103 shows
Analyzing Dysgenic Fertility Trends
- Researchers attempted to attenuate the estimated dysgenic effect by using NLSY children as their own reference group rather than national norms.
- Adjusting the reference group reduced the estimated black/white IQ gap increase from 3.9 points to 1.9 points, though the authors admit this method lacks a solid rationale.
- The Flynn effect suggests that NLSY children should actually have a slight IQ edge over older national norms, making the lower estimates potentially inaccurate.
- Data on childless women shows a significant IQ gap (106.6 for whites vs 100.3 for blacks), suggesting low fertility among high-IQ black women.
- The authors conclude that the IQ gap between groups will likely continue to diverge as the NLSY generation completes its fertility cycle.
That black women without children have a mean of 100 is in itself striking evidence of the low fertility among the top part of the black IQ distribution.
738
Notes to pages 356-357
Notes to pages 358-367
739
Our next step was to examine separately the results from the three test
years (1986, 1988, and 1990). For the children who were 6 or older when
they took the test (which again shows a smaller difference than when the
test includes all children), the B/W differences for the three test years,
using sample weights, were 5.9, 1.9, and 3.0 points, respectively. The dif-
ferences across test year did not affect the conclusion that a significant
dysgenic effect exists, but the reasons for the differences are worth inves-
tigating.
In our attempt to see whether the dysgenic effect could be attenuated,
we repeated all of these analyses with one difference: Instead of using the
national norms for the PPVT (normed to a mean of 100 and SD of 15), we
let the NLSY children be their own reference group, comparing the black
and white scores using the observed mean and standard deviation for all
NLSY children who took the test. This procedure reduces the estimate of
the dyssenic effect. For example, the results, using sample weights, for the
children who were 6 and older, showed an increasing B/W gap of 1.9 points
instead of the 3.9 points produced by using the national norms. The diffi-
culty in interpreting this finding is that the procedure itself has no good
rationale. The PPVT national norms seem to have been properly deter-
mined. If anything, the Flynn effect should mean that the NLSY children,
taking the test anywhere from seven to eleven years after the norms were
established, should have a 2- to 3-point 1Q edge when compared to the na-
tional norms. So we have no reason to think that the lower estimate is the
correct one, but it does represent the best way we could concoct to mini-
mize the B/W dysgenic effect.
Finally, we explored how the births to NLSY women might affect these
findings by comparing black and white women who had not borne a child
as of 1990. The mean IQ for the childless white women was 106.6, com-
pared to 100.3 for childless black women. That black women without chil-
dren have a mean of 100 is in itself striking evidence of the low fertility
among the top part of the black IQ distribution, but even if subsequent fer-
tility for the two groups is the same, the B/W gap in the next generation
will presumably continue to diverge as the NLSY women complete their
fertility.
47. New York Xrnes. "Slighting words, fighting words." Feb. 13, 1990, p. A24.
48. The computation in the text counts each mother as many times as she had
children who were tested. If instead each mother is counted only once, the
white-black difference among mothers is 1.12 SDs. The white-Latino dif-
ference is 1.05 SDs.
49. Auster 1990; Bouvier 1991; Gould 1981; Simon 1989; Wattenberg 1987;
Wattenberg and Zinsmeister 1990.
50. Holden 1988.
51. E.g., Higham 1973; Lukacs 1986.
52. Simon 1989. For a symposium, see Simon et al. 1993.
53. Auster 1990, and various contributors in Simon et al. 1993.
54. Bouvier and Davis 1982. This particular estimate is based on annual im-
migration of 1 million.
55. The figures for the 1950s, 1960s, and 1970s were 11 percent, 16 percent
and 18 percent respectively. SAUS 1992, Table 14 (SAUS 1971, Table 4).
56. Lynn 1991.
57. SAUS 1992, Table 8. The figures also includes once-illegal immigrants who
were granted permanent residence under the Immigration Reform and
Control Act of 1986.
58. Sowell 1981.
59. A first, elementary consideration is that the NLSY data refer almost ex-
clusively to the children of the adults who decided to immigrate. What-
ever self-selection for IQ mlght have existed in the elders will he less visible
in their offspring.
60. Carliner 1980; Chiswick 1978; Gabriel 1991.
61. Rorjas 1987. Borjas's formulation also draws on Roy 1951 and Sjaastad
1962. In forthcoming papers, Borjas has since extended his analysis
through the 1990 census, showing a continuation of the trends from 1970
to 1980. Borjas 1993, 1994.
62. Borjas 1987, Table 3.
63. Sowell 1981, p. 220.
64. Rorjas 1987, Table 3.
65. Rorjas 1987, p. 552.
66. The procedure is limited to the NLSY's cross-sectional sample (i.e., omit-
ting the supplemental samples), so that sample weights are no longer an
issue. Using random numbers, subjects with l Q scores above 97 had an
equal chance of being discarded. Because different subsamples could yield
different results, we created two separate samples with a mean of 97 and
replicated all of the analyses. The data reported in the table on page 368
represent the average produced by the two replications, compared to the
national mean as represented by unweighted calculations using the entire
cross-sectional sample.
67. Cattell 1938, as reprinted in Cattell 1983.
68. Cattell 1983, pp. 167, 168.
69. Cattell 1983, pp. 167, 175.
70. Cattell 1983, pp. 167, 169.
7 1. The procedures parallel those used for the preceding analysis of a mean of
97.
72. In effect, our sample with a mean of 97 shows what happens when people
with above-average IQs decrease their fertility, and our sample of 103 shows
Statistical Modeling of IQ and Fertility
- Researchers simulated demographic shifts by manipulating NLSY sample means to observe the impact of IQ distribution on social problems.
- Lowering the sample mean to 97 primarily diminished the 'supply' of people without social problems rather than removing those with them.
- Raising the sample mean to 103 involved deleting individuals from the bottom of the distribution, significantly reducing the prevalence of social issues.
- The data reveals an inverse relationship between maternal IQ and the number of illegitimate children or children from broken homes.
- Heritability estimates suggest that even if all environmental variation were eliminated, a significant portion of IQ variance would remain.
- The text references historical and nutritional studies linking physical health and diet to cognitive performance and antisocial behavior.
This did not do much to get rid of people who had the problems; most of its effect was to diminish the supply of people without problems.
738
Notes to pages 356-357
Notes to pages 358-367
739
Our next step was to examine separately the results from the three test
years (1986, 1988, and 1990). For the children who were 6 or older when
they took the test (which again shows a smaller difference than when the
test includes all children), the B/W differences for the three test years,
using sample weights, were 5.9, 1.9, and 3.0 points, respectively. The dif-
ferences across test year did not affect the conclusion that a significant
dysgenic effect exists, but the reasons for the differences are worth inves-
tigating.
In our attempt to see whether the dysgenic effect could be attenuated,
we repeated all of these analyses with one difference: Instead of using the
national norms for the PPVT (normed to a mean of 100 and SD of 15), we
let the NLSY children be their own reference group, comparing the black
and white scores using the observed mean and standard deviation for all
NLSY children who took the test. This procedure reduces the estimate of
the dyssenic effect. For example, the results, using sample weights, for the
children who were 6 and older, showed an increasing B/W gap of 1.9 points
instead of the 3.9 points produced by using the national norms. The diffi-
culty in interpreting this finding is that the procedure itself has no good
rationale. The PPVT national norms seem to have been properly deter-
mined. If anything, the Flynn effect should mean that the NLSY children,
taking the test anywhere from seven to eleven years after the norms were
established, should have a 2- to 3-point 1Q edge when compared to the na-
tional norms. So we have no reason to think that the lower estimate is the
correct one, but it does represent the best way we could concoct to mini-
mize the B/W dysgenic effect.
Finally, we explored how the births to NLSY women might affect these
findings by comparing black and white women who had not borne a child
as of 1990. The mean IQ for the childless white women was 106.6, com-
pared to 100.3 for childless black women. That black women without chil-
dren have a mean of 100 is in itself striking evidence of the low fertility
among the top part of the black IQ distribution, but even if subsequent fer-
tility for the two groups is the same, the B/W gap in the next generation
will presumably continue to diverge as the NLSY women complete their
fertility.
47. New York Xrnes. "Slighting words, fighting words." Feb. 13, 1990, p. A24.
48. The computation in the text counts each mother as many times as she had
children who were tested. If instead each mother is counted only once, the
white-black difference among mothers is 1.12 SDs. The white-Latino dif-
ference is 1.05 SDs.
49. Auster 1990; Bouvier 1991; Gould 1981; Simon 1989; Wattenberg 1987;
Wattenberg and Zinsmeister 1990.
50. Holden 1988.
51. E.g., Higham 1973; Lukacs 1986.
52. Simon 1989. For a symposium, see Simon et al. 1993.
53. Auster 1990, and various contributors in Simon et al. 1993.
54. Bouvier and Davis 1982. This particular estimate is based on annual im-
migration of 1 million.
55. The figures for the 1950s, 1960s, and 1970s were 11 percent, 16 percent
and 18 percent respectively. SAUS 1992, Table 14 (SAUS 1971, Table 4).
56. Lynn 1991.
57. SAUS 1992, Table 8. The figures also includes once-illegal immigrants who
were granted permanent residence under the Immigration Reform and
Control Act of 1986.
58. Sowell 1981.
59. A first, elementary consideration is that the NLSY data refer almost ex-
clusively to the children of the adults who decided to immigrate. What-
ever self-selection for IQ mlght have existed in the elders will he less visible
in their offspring.
60. Carliner 1980; Chiswick 1978; Gabriel 1991.
61. Rorjas 1987. Borjas's formulation also draws on Roy 1951 and Sjaastad
1962. In forthcoming papers, Borjas has since extended his analysis
through the 1990 census, showing a continuation of the trends from 1970
to 1980. Borjas 1993, 1994.
62. Borjas 1987, Table 3.
63. Sowell 1981, p. 220.
64. Rorjas 1987, Table 3.
65. Rorjas 1987, p. 552.
66. The procedure is limited to the NLSY's cross-sectional sample (i.e., omit-
ting the supplemental samples), so that sample weights are no longer an
issue. Using random numbers, subjects with l Q scores above 97 had an
equal chance of being discarded. Because different subsamples could yield
different results, we created two separate samples with a mean of 97 and
replicated all of the analyses. The data reported in the table on page 368
represent the average produced by the two replications, compared to the
national mean as represented by unweighted calculations using the entire
cross-sectional sample.
67. Cattell 1938, as reprinted in Cattell 1983.
68. Cattell 1983, pp. 167, 168.
69. Cattell 1983, pp. 167, 175.
70. Cattell 1983, pp. 167, 169.
7 1. The procedures parallel those used for the preceding analysis of a mean of
97.
72. In effect, our sample with a mean of 97 shows what happens when people
with above-average IQs decrease their fertility, and our sample of 103 shows
740
Notes to pages 367-390
Notes to pages 391-393
741
what happens when people with below-average IQs decrease theirs. When
we changed the NLSY sample so that the mean fell to 97, we used a ran-
dom variable to delete people with IQs above 97 until the average reached
97. This did not do much to get rid of people who had the problems; most
of its effect was to diminish the supply of people without problems. When
we changed the NLSY sample so that the mean rose to 103, we were ran-
domly deleting people with IQs below 103. In the course of that random
deletion, a significant number of people toward the bottom of the distrih-
ution--our Classes IV and V-were
deleted. Suppose instead we had low-
ered the IQ to 97 by randomly duplicating subjects with 1Qs helow 97. In
that case, we would have been simulating what happens when people with
below-average IQs increase their fertility, and the results would have heen
more closely symmetrical with the effects shown for the 103 sample.
73. These figures continue to be based on the cross-sectional NLSY sample,
used throughout this exercise. The 1989 poverty rate for the entire NLSY
sample, calculated using sample weights, was 10.9 percent.
Chapter 1 6
1. A woman was classified as a chronic welfare recipient if she had received
welfare for at least five years by the 1990 interview. Women with incom-
plete data on AFDC in the years following the birth of the first child or
whose first child was born after 1985 were not scored on this variahle.
2. We do not weight the computations for the overrepresentation of helow-
average IQ mothers, but we continue to use sample weights.
3. This represents the mean of the mothers of the NLSY children, with each
mother counted once for each illegitimate child. Because of the inverse re-
lationship between IQ and the number of illegitimate children, the mean
counting each mother of an illegitimate child only once was higher: 89.
4. As in the case of illegitimacy, IQ and the number of children of divorced
and separated mothers were inversely related. When the mother is counted
only once regardless of the number of children, the mean is 94.
5. See Chapter 10 for a description of this intelligence test (the PPVT).
1. A brief refresher (see Chapter 4): A heritability of 60 percent (a mid-range
estimate) says that 40 percent of the observed variation in intelligence
would disappear if a magic wand wiped out the differences in those aspects
of the environment that bear on intelligence. Given that variance is the
standard deviation squared and that the standard deviation of IQ is 15, this
means that 40 percent of 15' is due to environmental variation, which is
to say that the variance would drop from 225 to 135 and the standard de-
v~ation would contract to 11.6 instead of 15 if all the environmental
sources of variation disappeared.
2. "A healthy mind in a healthy body." Some of the history is recounted in
Lynn 1990h. Abstracts of a series of studies by Stephen Schoenthaler and
h ~ s
associates on the effects of diet on intelligence and on antisocial, crim-
inal behavior are in Schoenthaler 1991.
3. Stein et al. 1972.
4. Lynn 1990b.
5. Renton and Roberts 1988.
6. At the age of 12 and 13, youngsters' scores rise during an eight-month pe-
riod in the natural course of events. The dietary supplement, then, is af-
fecting the rate of increase of the nonverbal, but not the verbal, scores.
7. Schoenthaler et al. 1991.
8. WISC-R. Block Design, a highly g-loaded subtest of WISC-R, showed lit-
tle or no henefit of the food supplement.
9. Earlier work suggesting that reductions in refined sugar increase intelli-
gence are now being reinterpreted as the effect not of sugar per se but of
shifting the diet away from foods with little in the way of vitamins and
minerals to more nutritious foods; see Schoenthaler et al. 1991; Schoen-
thaler Doraz, and Wakefield 1986. The basic point is that we have almost
no idea of the pathway between diet or food supplements and intellectual
development; assuming there is a path, it could be long and winding.
10. A child taking a pill that gives, say, one RDA is getting more than the rec-
ommended daily allowances, since the rest of his diet cannot be utterly de-
void of vitamins and minerals.
11. For a failure to confirm an effect of vitamin-mineral supplements, see
Crombie et al. 1990, and for a failure to find an effect on intelligence of
diet short of chronic malnutrition, see Church and Katigbak 1991. For
more general discussion of the issue, see Eysenck 1991; Lynn 1990; Yudkin
1991.
12. Later children are on the average born into larger families, which tend to
be of lower average IQ. Hence, there is a decline with successive births
that is a by-product of family size in and of itself. However, even after the
family size effect is extracted, there may be a decline with birth order. The
classic demonstration of declining scores with successive births indepen-
dent of family size is a study based on a large sample of Dutch men (Bel-
mont and Marolla 1973; Belmont, Stein, and Zybert 1978). Since then,
subsequent studies have both confirmed and failed to confirm the hasic re-
lationship (e.g., Blake 1989; Retherford and Sewell 1991; Zajonc 1976).
At present, there is no resolution of the varying findings.
13. Representative findings, on Japanese twins, are in Takuma 1966, described
in Iwawaki and Vernon 1988.
Environmental Influences on Intelligence
- Dietary supplements appear to influence the rate of increase in nonverbal intelligence scores, though the specific biological pathways remain poorly understood.
- The perceived benefits of reducing refined sugar may actually result from replacing empty calories with vitamin-rich foods rather than the absence of sugar itself.
- Research into the relationship between birth order and IQ remains inconclusive, with conflicting studies regarding whether birth order affects intelligence independently of family size.
- Uterine environments and birth weight are significant factors in cognitive development, though early intervention training for mothers may help forestall potential deficits.
- Large-scale educational studies, such as the Coleman Report, highlight the complexities of measuring how school quality and 'aptitude' impact standardized test scores.
The basic point is that we have almost no idea of the pathway between diet or food supplements and intellectual development; assuming there is a path, it could be long and winding.
740
Notes to pages 367-390
Notes to pages 391-393
741
what happens when people with below-average IQs decrease theirs. When
we changed the NLSY sample so that the mean fell to 97, we used a ran-
dom variable to delete people with IQs above 97 until the average reached
97. This did not do much to get rid of people who had the problems; most
of its effect was to diminish the supply of people without problems. When
we changed the NLSY sample so that the mean rose to 103, we were ran-
domly deleting people with IQs below 103. In the course of that random
deletion, a significant number of people toward the bottom of the distrih-
ution--our Classes IV and V-were
deleted. Suppose instead we had low-
ered the IQ to 97 by randomly duplicating subjects with 1Qs helow 97. In
that case, we would have been simulating what happens when people with
below-average IQs increase their fertility, and the results would have heen
more closely symmetrical with the effects shown for the 103 sample.
73. These figures continue to be based on the cross-sectional NLSY sample,
used throughout this exercise. The 1989 poverty rate for the entire NLSY
sample, calculated using sample weights, was 10.9 percent.
Chapter 1 6
1. A woman was classified as a chronic welfare recipient if she had received
welfare for at least five years by the 1990 interview. Women with incom-
plete data on AFDC in the years following the birth of the first child or
whose first child was born after 1985 were not scored on this variahle.
2. We do not weight the computations for the overrepresentation of helow-
average IQ mothers, but we continue to use sample weights.
3. This represents the mean of the mothers of the NLSY children, with each
mother counted once for each illegitimate child. Because of the inverse re-
lationship between IQ and the number of illegitimate children, the mean
counting each mother of an illegitimate child only once was higher: 89.
4. As in the case of illegitimacy, IQ and the number of children of divorced
and separated mothers were inversely related. When the mother is counted
only once regardless of the number of children, the mean is 94.
5. See Chapter 10 for a description of this intelligence test (the PPVT).
1. A brief refresher (see Chapter 4): A heritability of 60 percent (a mid-range
estimate) says that 40 percent of the observed variation in intelligence
would disappear if a magic wand wiped out the differences in those aspects
of the environment that bear on intelligence. Given that variance is the
standard deviation squared and that the standard deviation of IQ is 15, this
means that 40 percent of 15' is due to environmental variation, which is
to say that the variance would drop from 225 to 135 and the standard de-
v~ation would contract to 11.6 instead of 15 if all the environmental
sources of variation disappeared.
2. "A healthy mind in a healthy body." Some of the history is recounted in
Lynn 1990h. Abstracts of a series of studies by Stephen Schoenthaler and
h ~ s
associates on the effects of diet on intelligence and on antisocial, crim-
inal behavior are in Schoenthaler 1991.
3. Stein et al. 1972.
4. Lynn 1990b.
5. Renton and Roberts 1988.
6. At the age of 12 and 13, youngsters' scores rise during an eight-month pe-
riod in the natural course of events. The dietary supplement, then, is af-
fecting the rate of increase of the nonverbal, but not the verbal, scores.
7. Schoenthaler et al. 1991.
8. WISC-R. Block Design, a highly g-loaded subtest of WISC-R, showed lit-
tle or no henefit of the food supplement.
9. Earlier work suggesting that reductions in refined sugar increase intelli-
gence are now being reinterpreted as the effect not of sugar per se but of
shifting the diet away from foods with little in the way of vitamins and
minerals to more nutritious foods; see Schoenthaler et al. 1991; Schoen-
thaler Doraz, and Wakefield 1986. The basic point is that we have almost
no idea of the pathway between diet or food supplements and intellectual
development; assuming there is a path, it could be long and winding.
10. A child taking a pill that gives, say, one RDA is getting more than the rec-
ommended daily allowances, since the rest of his diet cannot be utterly de-
void of vitamins and minerals.
11. For a failure to confirm an effect of vitamin-mineral supplements, see
Crombie et al. 1990, and for a failure to find an effect on intelligence of
diet short of chronic malnutrition, see Church and Katigbak 1991. For
more general discussion of the issue, see Eysenck 1991; Lynn 1990; Yudkin
1991.
12. Later children are on the average born into larger families, which tend to
be of lower average IQ. Hence, there is a decline with successive births
that is a by-product of family size in and of itself. However, even after the
family size effect is extracted, there may be a decline with birth order. The
classic demonstration of declining scores with successive births indepen-
dent of family size is a study based on a large sample of Dutch men (Bel-
mont and Marolla 1973; Belmont, Stein, and Zybert 1978). Since then,
subsequent studies have both confirmed and failed to confirm the hasic re-
lationship (e.g., Blake 1989; Retherford and Sewell 1991; Zajonc 1976).
At present, there is no resolution of the varying findings.
13. Representative findings, on Japanese twins, are in Takuma 1966, described
in Iwawaki and Vernon 1988.
742
Notes to pages 393-395
Notes to pages 395-399
743
14. For a review of the literature on twin differences in birth weight in rela-
tion to IQ as well as of other evidence that the uterine environment af-
fects intelligence, see Storfer 1990.
15. Achenbach et al. 1990. This study compared two dozen low-birth-weight
babies whose mothers received training in mothering with comparably
small groups of normal-weight babies and lowpbirth-weight babies whose
mothers did not receive the training. The encouraging outcome is that
when the children were 7 years old, the usual deficit seems to have been
forestalled by having trained the mothers in infant nurturing. However,
the small scale of the study, the lack of random assignment to the three
groups, and the ~uzzling near identity in scores for the underweight chil-
dren whose mothers had been trained and the normal children suggest that
the next step should to attempt to replicate the finding, as the authors
themselves say.
16. For a helpful and balanced introduction to aptitude-treatment interac-
tions, see Snow 1982.
17. Hativa 1988.
18. Atkinson 1974.
19. Cook et al. 1975.
20. Coleman et al. 1966. The report talked about educational "aptitude," but
the measures used-vocabulary
scores, reading comprehension, mathe-
matical reasoning tasks, etc.-were
taken from standard group tests of IQ.
21. See Mosteiler and Moynihan 1972 for a collection of more or less crit~cal
articles; included also is Coleman's response to the most intense method-
ological criticisms (Coleman 1972). The combatants were often trying to
answer different questions, with Coleman mostly interested in whether the
objective differences among schools were responsible for the observed dif-
ferences in abilities and his critics more interested in characterizing the
objective differences in the schools. We cannot do justice to the range of
issues that surfaced in the report and the subsequent commentary, hut one
of them deserves mention: The report uncovered evidence that the ethnic
and socioeconomic mix of students in a school had a larger impact than
the more standard investments in per pupil expenditures, teacher salaries,
quality of physical plant, and the like. This, in turn, became a major argu-
ment for school busing. Soon after, school busing itself became a battle-
ground for social researchers, a tale we will not tell here except to say that
having a beneficial effect on intelligence is no longer used as an argument
in favor of busing.
22. Coleman and Hoffer 1987.
23. It isn't hard to find what seems to be the opposite conclusion in educational
writings (e.g., the Coleman report is "no longer taken seriously," Zigler and
Muenchow 1992, p. 62) but no one has been able to show that the variables
examined in the report account for much of the variation in cognitive abil-
ity among American public school students. If they are in any sense not
taken seriously, it is presumably because educational variables other than
the ones that Coleman studied have been found to be significant. This
chapter reviews the evidence about those other variables as well.
24. See Kozol 1992 for a passionate argument that disparities in school fund-
ing are a major cause of disparities in educational outcomes.
25. Hush and Tuijnman 199 1.
26. The quantitative details of the study are not germane to contemporary
times, but even then, when schooling varied so broadly, the direct link be-
tween IQ at the age of 10 and at 20 was a minimum of five times stronger
than that between amount of schooling and IQ at 20, in terms of variance
accounted for in a path analysis.
27. Flynn himself does not believe that educational equalization per se ac-
counts for much of the rise in IQ in some countries such as Holland (Flynn
1987a), but then Flynn also does not believe that the rising national av-
erages in IQ really reflect rising intelligence.
28. Stephen Ceci (1991) has summarized evidence, much of it from earlier in
the century, for an impact of schooling on intelligence.
29. National Center for Education Statistics 1981, Table 161,1992, Table 347.
30. McLaughlin 1977, p. 55.
3 1. McLaughlin 1977, p. 53 The failure of such compensatory efforts antedated
the Great Society by many years, however. An early educational researcher
writing of similar compensatory efforts in 1938 concluded that "whatever
the number of years over which powth was studied; whatever the number
of cases in the several groups used for comparisons; whatever the grade
groups in which the IQs were obtained; whatever the length of the inter-
val between initial and final testing; in short, whatever the comparison,
no significant change in IQs has been found" (Lamson 1938, p. 70).
32. Office of Policy and Planning 1993.
33. For more on this distinction, see Adams 1989; Brown and Campione 1982;
Jensen 1993a; Nickerson, Perkins, and Smith 1985.
34. "Chicago educator ~ushes common sense," St. Louis Post Dispatch, Dec. 2,
1990, p. 5D; "Marva Collins still expects, gets much," St. Petersburg Times,
July 23, 1989, p. 6A; "Pioneering educator does not want post in a Clin-
ton cabinet," Minneapolis Star Tribune, Oct. 25, 1992, p. 22A.
35. Spitz 1986. See also "Chicago schools get an education in muckraking,"
Chicago Tribune, May 8, 1989, p. 1C.
36. "Fairfax principal, 4 other educators disciplined in test-coaching," Wash-
ington Post, Aug. 7, 1987, p. C1.
37. "Pressure for high scores blamed in test cheating," Los Angeles Times, Sept.
18, 1988, p. 1.
The Coleman Report and Schooling
- The Coleman Report found that a school's ethnic and socioeconomic mix influenced student outcomes more than standard investments like teacher salaries or physical plant quality.
- These findings initially served as a primary justification for school busing policies, though the argument that busing improves intelligence has since been abandoned.
- Critics argue that while standard funding variables may not account for cognitive variation, other unexamined educational variables might still be significant.
- Historical data suggests that the correlation between childhood IQ and adult IQ is significantly stronger than the correlation between years of schooling and adult IQ.
- Research into compensatory education programs has frequently shown a lack of significant long-term impact on student IQ scores.
- The text highlights a tension between passionate arguments for school funding equalization and statistical evidence that such funding has limited impact on cognitive ability.
Soon after, school busing itself became a battleground for social researchers, a tale we will not tell here except to say that having a beneficial effect on intelligence is no longer used as an argument in favor of busing.
742
Notes to pages 393-395
Notes to pages 395-399
743
14. For a review of the literature on twin differences in birth weight in rela-
tion to IQ as well as of other evidence that the uterine environment af-
fects intelligence, see Storfer 1990.
15. Achenbach et al. 1990. This study compared two dozen low-birth-weight
babies whose mothers received training in mothering with comparably
small groups of normal-weight babies and lowpbirth-weight babies whose
mothers did not receive the training. The encouraging outcome is that
when the children were 7 years old, the usual deficit seems to have been
forestalled by having trained the mothers in infant nurturing. However,
the small scale of the study, the lack of random assignment to the three
groups, and the ~uzzling near identity in scores for the underweight chil-
dren whose mothers had been trained and the normal children suggest that
the next step should to attempt to replicate the finding, as the authors
themselves say.
16. For a helpful and balanced introduction to aptitude-treatment interac-
tions, see Snow 1982.
17. Hativa 1988.
18. Atkinson 1974.
19. Cook et al. 1975.
20. Coleman et al. 1966. The report talked about educational "aptitude," but
the measures used-vocabulary
scores, reading comprehension, mathe-
matical reasoning tasks, etc.-were
taken from standard group tests of IQ.
21. See Mosteiler and Moynihan 1972 for a collection of more or less crit~cal
articles; included also is Coleman's response to the most intense method-
ological criticisms (Coleman 1972). The combatants were often trying to
answer different questions, with Coleman mostly interested in whether the
objective differences among schools were responsible for the observed dif-
ferences in abilities and his critics more interested in characterizing the
objective differences in the schools. We cannot do justice to the range of
issues that surfaced in the report and the subsequent commentary, hut one
of them deserves mention: The report uncovered evidence that the ethnic
and socioeconomic mix of students in a school had a larger impact than
the more standard investments in per pupil expenditures, teacher salaries,
quality of physical plant, and the like. This, in turn, became a major argu-
ment for school busing. Soon after, school busing itself became a battle-
ground for social researchers, a tale we will not tell here except to say that
having a beneficial effect on intelligence is no longer used as an argument
in favor of busing.
22. Coleman and Hoffer 1987.
23. It isn't hard to find what seems to be the opposite conclusion in educational
writings (e.g., the Coleman report is "no longer taken seriously," Zigler and
Muenchow 1992, p. 62) but no one has been able to show that the variables
examined in the report account for much of the variation in cognitive abil-
ity among American public school students. If they are in any sense not
taken seriously, it is presumably because educational variables other than
the ones that Coleman studied have been found to be significant. This
chapter reviews the evidence about those other variables as well.
24. See Kozol 1992 for a passionate argument that disparities in school fund-
ing are a major cause of disparities in educational outcomes.
25. Hush and Tuijnman 199 1.
26. The quantitative details of the study are not germane to contemporary
times, but even then, when schooling varied so broadly, the direct link be-
tween IQ at the age of 10 and at 20 was a minimum of five times stronger
than that between amount of schooling and IQ at 20, in terms of variance
accounted for in a path analysis.
27. Flynn himself does not believe that educational equalization per se ac-
counts for much of the rise in IQ in some countries such as Holland (Flynn
1987a), but then Flynn also does not believe that the rising national av-
erages in IQ really reflect rising intelligence.
28. Stephen Ceci (1991) has summarized evidence, much of it from earlier in
the century, for an impact of schooling on intelligence.
29. National Center for Education Statistics 1981, Table 161,1992, Table 347.
30. McLaughlin 1977, p. 55.
3 1. McLaughlin 1977, p. 53 The failure of such compensatory efforts antedated
the Great Society by many years, however. An early educational researcher
writing of similar compensatory efforts in 1938 concluded that "whatever
the number of years over which powth was studied; whatever the number
of cases in the several groups used for comparisons; whatever the grade
groups in which the IQs were obtained; whatever the length of the inter-
val between initial and final testing; in short, whatever the comparison,
no significant change in IQs has been found" (Lamson 1938, p. 70).
32. Office of Policy and Planning 1993.
33. For more on this distinction, see Adams 1989; Brown and Campione 1982;
Jensen 1993a; Nickerson, Perkins, and Smith 1985.
34. "Chicago educator ~ushes common sense," St. Louis Post Dispatch, Dec. 2,
1990, p. 5D; "Marva Collins still expects, gets much," St. Petersburg Times,
July 23, 1989, p. 6A; "Pioneering educator does not want post in a Clin-
ton cabinet," Minneapolis Star Tribune, Oct. 25, 1992, p. 22A.
35. Spitz 1986. See also "Chicago schools get an education in muckraking,"
Chicago Tribune, May 8, 1989, p. 1C.
36. "Fairfax principal, 4 other educators disciplined in test-coaching," Wash-
ington Post, Aug. 7, 1987, p. C1.
37. "Pressure for high scores blamed in test cheating," Los Angeles Times, Sept.
18, 1988, p. 1.
744
Notes to pages 399-403
Notes to pages 404-405
745
38. "S.I. principal said to fudge school scores," New Ymk Times, July 19, 1991,
p. B1.
39. For a sense of the magnitude of the cheating problem, see "Schools for
Scandal," U.S. News B World Report, April 27, 1992, p. 66.
40. The minister was Luis Alberto Machado, a high official in the ruling party
at the time.
41. Based on estimates in the preceding years, the children in the two groups
were chosen to be of comparable cognitive ability. For descriptions of the
experiment, see Hermstein et al. 1986; Nickerson 1986.
42. The teachers' manual for most of the lessons, translated into English, is
available as Adams 1986.
43. See Brigham 1932 for the relevant background. Briefly, the SAT was orig-
inally designed to be an intelligence test targeted for the college-going pop-
ulation and was originally validated against existing intelligence tests. For
a modem source showing how carefully the College b a r d avoids saying
the SAT measures intelligence while presenting the evidence that it does,
see Donlon 1984.
44. Fallows 1980; Slack and Porter 1980; Messick 1980; DerSimonian and
Laird 1983; Dyer 1987; Becker 1990.
45. Messick and Jungeblut 1981.
46. From 1980 to 1992, the SAT-V standard deviation varied from 109 to 1 12
and the SAT-M standard deviation varied from 1 17 to 123. For the calcu-
lations, we assumed SDs of 110 and 120, respectively.
47. McCall 1979.
48. McCall 1987.
49. Alexander Pope (in his Moral Essays) is the poet, and the entire couplet
is "Tis education forms the common mind; /Just as the twig is bent the
tree's inclined."
50. See Mastropieri 1987 for a review of the expert consensus on this point.
51. For a sympathetic rendition of the program and its history, see Zigler and
Muenchow 1992. For a more critical account, see Spitz 1986. We try to
keep our account as close to what: these two have in common as we can.
52. "Project Rush-Rush" was what Head Start was called by those in Wash-
ington who thought that it was plunging ahead with more speed than de-
liberation (quoted in Cantso, Taylor, and Detterman 1982, p. 52).
53. Zigler and Muenchow 1992, reporting the conclusions of Leon Eisenberg
and C. Keith Connors after the first summer program. Only slightly less
grandiose were the claims of raising IQ scores "a point a month" that were
often cited by enthusiasts.
54. Sargent Shriver, brother-in-law of the late president, John Kennedy, and
former head of the Peace Corps.
55. The first comprehensive evaluation was the so-called Westinghouse study,
which the Office of Economic Opportunity sponsored. Its conclusion
was that there were few or no cognitive benefits of Head Start within
three years after the child completed it (Cicarelli, Evans, and Schiller
1969). Soon there was a mini-industry picking over the Westinghouse
study, in addition to the one picking over Head Start. The consensus
is now clear: Cognitive gains vanish before the end of primary school,
e.g., Haskins 1989; McKey 1985; Spitz 1986; Zigler and Muenchow 1992.
The new consensus has recently surfaced in the popular media (e.g.,
J. DeParle, "Sharp criticism for Head Start, even by friends," New Ymk
Tmes, Mar. 19, 1993, p. Al).
56. For a range of views, see Gamble and Zigler 1989; McKey 1985; Zigler and
Muenchow 1992.
57. E.g. Haskins 1989.
58. Zigler and Muenchow 1992. Edward Zigler, one of the early research di-
rectors of Head Start and a professor at Yale, argues in his book that it was
a mistake from the beginning to promise gains in intelligence to the pub-
lic. The more general shift away from making increases in IQ the target of
preschool programs is discussed in Garber and Hodge 1991; Locurto 1991;
Schweinhart and Weikart 1991, pro and con.
59. Among the people promising gains in the 300 percent range is the presi-
dent of the United States, as reported by Jason DeParle ("Sharp criticism
for Head Start, even by friends," New Ymk Tmes, Mar. 19, 1993). Even
more of an optimist is economist Alan Blinder, who once promised a re-
turn of $4.75 for every dollar spent on preschool education (Blinder 1987).
60. For a review of such henefits from Head Start programs, see Haskins 1989,
who concludes that the results "call for humility" (p. 280). The Head Start
literature, he says, "will not support the claim that a program of national
scope would yield lasting impacts on children's school performance nor
substantial returns on the investment of public dollars" (p. 280). In short,
there are no sleeper effects from Head Start. Even the evidence of cost-ef-
fective returns in the more intensive educational programs is highly re-
stricted, For a literature review, see Barnett and Escobar 1987.
61. Most of the children were 3 years old and spent two years in the program;
the 22 percent who were 4 spent only one year in it (Barnett 1985;
Berrueta-Clement et al. 1984.
62. Half a school day, or about two and a half hours.
63. The lack of effect was indirectly confirmed in a subsequent study by the
same group of workers. They failed to find any differential effect on IQ of
three different forms of preschool: their own cognitive enrichment pro-
gram, a language-enhancing program, and a conventional nursery schor
program (Weikart et al. 1978). There was no control group in this follol
up, so we cannot say how much, if at all, preschool per se influenced
Educational Interventions and IQ Realities
- The SAT was originally designed as an intelligence test for college-bound students, though modern administrators carefully avoid this explicit label.
- Early Head Start programs were launched with grandiose expectations, including claims of raising IQ scores by a point every month.
- The 'Project Rush-Rush' moniker reflected internal concerns that Head Start was being implemented with more speed than deliberation.
- Comprehensive evaluations, such as the Westinghouse study, indicate that cognitive gains from Head Start typically vanish by the end of primary school.
- Experts and early directors now argue that promising permanent intelligence gains to the public was a fundamental mistake for preschool programs.
- There is a documented shift in educational policy away from targeting IQ increases toward more general developmental goals.
The consensus is now clear: Cognitive gains vanish before the end of primary school.
744
Notes to pages 399-403
Notes to pages 404-405
745
38. "S.I. principal said to fudge school scores," New Ymk Times, July 19, 1991,
p. B1.
39. For a sense of the magnitude of the cheating problem, see "Schools for
Scandal," U.S. News B World Report, April 27, 1992, p. 66.
40. The minister was Luis Alberto Machado, a high official in the ruling party
at the time.
41. Based on estimates in the preceding years, the children in the two groups
were chosen to be of comparable cognitive ability. For descriptions of the
experiment, see Hermstein et al. 1986; Nickerson 1986.
42. The teachers' manual for most of the lessons, translated into English, is
available as Adams 1986.
43. See Brigham 1932 for the relevant background. Briefly, the SAT was orig-
inally designed to be an intelligence test targeted for the college-going pop-
ulation and was originally validated against existing intelligence tests. For
a modem source showing how carefully the College b a r d avoids saying
the SAT measures intelligence while presenting the evidence that it does,
see Donlon 1984.
44. Fallows 1980; Slack and Porter 1980; Messick 1980; DerSimonian and
Laird 1983; Dyer 1987; Becker 1990.
45. Messick and Jungeblut 1981.
46. From 1980 to 1992, the SAT-V standard deviation varied from 109 to 1 12
and the SAT-M standard deviation varied from 1 17 to 123. For the calcu-
lations, we assumed SDs of 110 and 120, respectively.
47. McCall 1979.
48. McCall 1987.
49. Alexander Pope (in his Moral Essays) is the poet, and the entire couplet
is "Tis education forms the common mind; /Just as the twig is bent the
tree's inclined."
50. See Mastropieri 1987 for a review of the expert consensus on this point.
51. For a sympathetic rendition of the program and its history, see Zigler and
Muenchow 1992. For a more critical account, see Spitz 1986. We try to
keep our account as close to what: these two have in common as we can.
52. "Project Rush-Rush" was what Head Start was called by those in Wash-
ington who thought that it was plunging ahead with more speed than de-
liberation (quoted in Cantso, Taylor, and Detterman 1982, p. 52).
53. Zigler and Muenchow 1992, reporting the conclusions of Leon Eisenberg
and C. Keith Connors after the first summer program. Only slightly less
grandiose were the claims of raising IQ scores "a point a month" that were
often cited by enthusiasts.
54. Sargent Shriver, brother-in-law of the late president, John Kennedy, and
former head of the Peace Corps.
55. The first comprehensive evaluation was the so-called Westinghouse study,
which the Office of Economic Opportunity sponsored. Its conclusion
was that there were few or no cognitive benefits of Head Start within
three years after the child completed it (Cicarelli, Evans, and Schiller
1969). Soon there was a mini-industry picking over the Westinghouse
study, in addition to the one picking over Head Start. The consensus
is now clear: Cognitive gains vanish before the end of primary school,
e.g., Haskins 1989; McKey 1985; Spitz 1986; Zigler and Muenchow 1992.
The new consensus has recently surfaced in the popular media (e.g.,
J. DeParle, "Sharp criticism for Head Start, even by friends," New Ymk
Tmes, Mar. 19, 1993, p. Al).
56. For a range of views, see Gamble and Zigler 1989; McKey 1985; Zigler and
Muenchow 1992.
57. E.g. Haskins 1989.
58. Zigler and Muenchow 1992. Edward Zigler, one of the early research di-
rectors of Head Start and a professor at Yale, argues in his book that it was
a mistake from the beginning to promise gains in intelligence to the pub-
lic. The more general shift away from making increases in IQ the target of
preschool programs is discussed in Garber and Hodge 1991; Locurto 1991;
Schweinhart and Weikart 1991, pro and con.
59. Among the people promising gains in the 300 percent range is the presi-
dent of the United States, as reported by Jason DeParle ("Sharp criticism
for Head Start, even by friends," New Ymk Tmes, Mar. 19, 1993). Even
more of an optimist is economist Alan Blinder, who once promised a re-
turn of $4.75 for every dollar spent on preschool education (Blinder 1987).
60. For a review of such henefits from Head Start programs, see Haskins 1989,
who concludes that the results "call for humility" (p. 280). The Head Start
literature, he says, "will not support the claim that a program of national
scope would yield lasting impacts on children's school performance nor
substantial returns on the investment of public dollars" (p. 280). In short,
there are no sleeper effects from Head Start. Even the evidence of cost-ef-
fective returns in the more intensive educational programs is highly re-
stricted, For a literature review, see Barnett and Escobar 1987.
61. Most of the children were 3 years old and spent two years in the program;
the 22 percent who were 4 spent only one year in it (Barnett 1985;
Berrueta-Clement et al. 1984.
62. Half a school day, or about two and a half hours.
63. The lack of effect was indirectly confirmed in a subsequent study by the
same group of workers. They failed to find any differential effect on IQ of
three different forms of preschool: their own cognitive enrichment pro-
gram, a language-enhancing program, and a conventional nursery schor
program (Weikart et al. 1978). There was no control group in this follol
up, so we cannot say how much, if at all, preschool per se influenced
The Limits of Early Intervention
- Economists and optimists have historically promised high returns on investment for preschool programs like Head Start, with some predicting nearly five dollars back for every dollar spent.
- Critical reviews of Head Start literature suggest that national programs fail to produce lasting impacts on school performance or significant public financial returns.
- Research indicates a lack of 'sleeper effects,' meaning early gains often dissipate rather than reappearing as long-term benefits in later childhood.
- Studies comparing different preschool models, such as cognitive enrichment versus conventional nursery school, found no differential effect on IQ scores.
- The phenomenon of 'teaching to the test' complicates results, as it is possible to artificially inflate test scores without improving the underlying trait of intelligence.
- Adoption studies provide a separate lens for evaluating environmental impacts on IQ, though adopted children often score lower than biological children in similar socioeconomic environments.
It is based on the test's being less than a perfect measure of intelligence (org), so that it is possible to change the score without changing the underlying trait.
744
Notes to pages 399-403
Notes to pages 404-405
745
38. "S.I. principal said to fudge school scores," New Ymk Times, July 19, 1991,
p. B1.
39. For a sense of the magnitude of the cheating problem, see "Schools for
Scandal," U.S. News B World Report, April 27, 1992, p. 66.
40. The minister was Luis Alberto Machado, a high official in the ruling party
at the time.
41. Based on estimates in the preceding years, the children in the two groups
were chosen to be of comparable cognitive ability. For descriptions of the
experiment, see Hermstein et al. 1986; Nickerson 1986.
42. The teachers' manual for most of the lessons, translated into English, is
available as Adams 1986.
43. See Brigham 1932 for the relevant background. Briefly, the SAT was orig-
inally designed to be an intelligence test targeted for the college-going pop-
ulation and was originally validated against existing intelligence tests. For
a modem source showing how carefully the College b a r d avoids saying
the SAT measures intelligence while presenting the evidence that it does,
see Donlon 1984.
44. Fallows 1980; Slack and Porter 1980; Messick 1980; DerSimonian and
Laird 1983; Dyer 1987; Becker 1990.
45. Messick and Jungeblut 1981.
46. From 1980 to 1992, the SAT-V standard deviation varied from 109 to 1 12
and the SAT-M standard deviation varied from 1 17 to 123. For the calcu-
lations, we assumed SDs of 110 and 120, respectively.
47. McCall 1979.
48. McCall 1987.
49. Alexander Pope (in his Moral Essays) is the poet, and the entire couplet
is "Tis education forms the common mind; /Just as the twig is bent the
tree's inclined."
50. See Mastropieri 1987 for a review of the expert consensus on this point.
51. For a sympathetic rendition of the program and its history, see Zigler and
Muenchow 1992. For a more critical account, see Spitz 1986. We try to
keep our account as close to what: these two have in common as we can.
52. "Project Rush-Rush" was what Head Start was called by those in Wash-
ington who thought that it was plunging ahead with more speed than de-
liberation (quoted in Cantso, Taylor, and Detterman 1982, p. 52).
53. Zigler and Muenchow 1992, reporting the conclusions of Leon Eisenberg
and C. Keith Connors after the first summer program. Only slightly less
grandiose were the claims of raising IQ scores "a point a month" that were
often cited by enthusiasts.
54. Sargent Shriver, brother-in-law of the late president, John Kennedy, and
former head of the Peace Corps.
55. The first comprehensive evaluation was the so-called Westinghouse study,
which the Office of Economic Opportunity sponsored. Its conclusion
was that there were few or no cognitive benefits of Head Start within
three years after the child completed it (Cicarelli, Evans, and Schiller
1969). Soon there was a mini-industry picking over the Westinghouse
study, in addition to the one picking over Head Start. The consensus
is now clear: Cognitive gains vanish before the end of primary school,
e.g., Haskins 1989; McKey 1985; Spitz 1986; Zigler and Muenchow 1992.
The new consensus has recently surfaced in the popular media (e.g.,
J. DeParle, "Sharp criticism for Head Start, even by friends," New Ymk
Tmes, Mar. 19, 1993, p. Al).
56. For a range of views, see Gamble and Zigler 1989; McKey 1985; Zigler and
Muenchow 1992.
57. E.g. Haskins 1989.
58. Zigler and Muenchow 1992. Edward Zigler, one of the early research di-
rectors of Head Start and a professor at Yale, argues in his book that it was
a mistake from the beginning to promise gains in intelligence to the pub-
lic. The more general shift away from making increases in IQ the target of
preschool programs is discussed in Garber and Hodge 1991; Locurto 1991;
Schweinhart and Weikart 1991, pro and con.
59. Among the people promising gains in the 300 percent range is the presi-
dent of the United States, as reported by Jason DeParle ("Sharp criticism
for Head Start, even by friends," New Ymk Tmes, Mar. 19, 1993). Even
more of an optimist is economist Alan Blinder, who once promised a re-
turn of $4.75 for every dollar spent on preschool education (Blinder 1987).
60. For a review of such henefits from Head Start programs, see Haskins 1989,
who concludes that the results "call for humility" (p. 280). The Head Start
literature, he says, "will not support the claim that a program of national
scope would yield lasting impacts on children's school performance nor
substantial returns on the investment of public dollars" (p. 280). In short,
there are no sleeper effects from Head Start. Even the evidence of cost-ef-
fective returns in the more intensive educational programs is highly re-
stricted, For a literature review, see Barnett and Escobar 1987.
61. Most of the children were 3 years old and spent two years in the program;
the 22 percent who were 4 spent only one year in it (Barnett 1985;
Berrueta-Clement et al. 1984.
62. Half a school day, or about two and a half hours.
63. The lack of effect was indirectly confirmed in a subsequent study by the
same group of workers. They failed to find any differential effect on IQ of
three different forms of preschool: their own cognitive enrichment pro-
gram, a language-enhancing program, and a conventional nursery schor
program (Weikart et al. 1978). There was no control group in this follol
up, so we cannot say how much, if at all, preschool per se influenced
746
Notes to pages 405-41 2
Notes to pages 41 2-415
747
64. For a critical reading of just how minimal these other effects of preschool
may have been, see Spitz 1986.
65. Lazar and Darlington 1982.
66. Similar estimates can be found in a study of the early effects of Head Start
and the consortium sample (Lee et al. 1990).
67. Lazar and Darlington 1982, p. 47 The people who do these studies often
argue that other positive effects are not being picked up in the formal mea-
surements (e.g., Ramey, MacPhee, and Yeates 1982).
68. Many publications have flowed from the project; useful summaries are in
Ramey 1992; Ramey, MacPhee, and Yeates 1982.
69. Personal communication from Ron Haskins.
70. Ramey 1992.
7 1. These differences are clearer in the critical accounts of the project in Spit:
1986 and 1992 than in the report by Ramey, MacPhee, and Yeates 1982.
72. Hermstein 1982; Sommer and Sommer 1983.
73. Page 1972; Page and Grandon 1981.
74. Garber 1988; Garber and Hodge 1991.
75. Jensen 1989; Locurto 1991. The problem of "teaching to the test" recurs
in educational interventions. It is based on the test's being less than a per-
fect measure of intelligence (org), so that it is possible to change the score
without changing the underlying trait (see further discussion in Jensen
1993a).
76. Our topic here is the effect of adoption on raising IQ, not the implications
of adoption data for estimating the heritability of 1Q. For reviews of the
adoption literature, see Hermstein 1973; Locurto 1990; Munsinger 1975;
Plomin and DeFries 1985. A comprehensive theoretical analysis of adop-
tion studies of intelligence is in Turkheimer 1991.
77. Brown 1958, Chap. 5; Lane 1976; Lane and Pillard 1978.
78. Among others inspired by this evidence from "wild children" of the power
over the mind of the human environment was an ltalian physician trained
at the end of the nineteenth century whose approach to education has sur-
vived the twentieth, Maria Montessori.
79. Locurto 1990; Plomin and DeFries 1985. In a refinement of this ohserva-
tion, it has been found that adopted children also score lower than the chil-
dren in other homes that are socioeconomically the same as those of their
adoptive parents but have no adopted children (thereby controlling for
possible ways in which adoptive parents might be distinctive from non-
adoptive parents).
80. Locurto 1990.
81. Dumaret and Stewart 1985; Schiff et al. 1982; Schiff and Lewontin 1986.
82. We will disregard in our analysis a number of considerations that would re-
duce estimates of the impact of home environment, such as that the IQ of
the schoolmates of the nonadopted half-siblings (who presumably share
comparable lower-class surroundings) averaged only seven points less than
the adopted children, not twelve. This difference raises the possibility that
the adopted-away child seemed brighter in infancy or had better intellec-
tual prospects than the half-sibling who stayed at home because of the par-
ent they did not share, or that the shift in home environments was even
more extreme than the estimates below assume it was, as if the adopted
child's biological family home was atypically poor, even for the poor neigh-
borhoods they were in. This, as we explain below, would reduce the over-
all estimate of the impact of home environment.
83. The cell sizes in the 2 x 2 table of high. and low-SES adopting and bio-
logical parent families were only ten children or fewer.
84. Capron and Duyme 1989. This study showed an even larger benefit-
equivalent to sixteen IQ points--of having high-SES biological parents,
even when the child was not reared by them, which again points to a her-
itability greater than .5.
85. This, it should be remembered, is for childhood IQ, which is more sub-
ject to the influence of home environment than adult IQ. Recent work
has also indicated that how a parent treats a child (presumably also an
adopted child) is in part determined by the child's inherited charac-
teristics. To that extent, speaking of home environment as if it were purely
an environmental source of variation is incorrect (see Plomin and Ber-
geman 1991).
86. A twenty-point swing is easily reconciled with a heritability of .6 for IQ.
Suppose the high- and low-SES homes in the French studies represent the
90th and 10th centile of environmental quality, as the text says. A twenty-
point swing in IQ from the 2d to the 98th centile of environmental qual-
ity would then imply that the standard deviation of home environment
effects on IQ is 4.69. Squared, this means a variance of 22 attributable to
home environment. But as we noted in note 1, a heritability of .6 implies
that there is a variance of 225 - 135, or 90, attributable to environmental
sources. The French adoption studies, in short, are consistent with the con-
clusion that about a quarter of environmental variance is the variance
across homes (if our guesses about the adopting and biological home en-
vironments are not way off). Three-quarters of the environmental influ-
ence on intelligence must be uncorrelated with the family SES, according
to the present analysis. Note again that the balance tips toward environ-
mental factors outside families as being the more relevant than those pro-
vided by families in affecting IQ, as mentioned in Chapter 4.
87. For a discussion of cost-benefit considerations, see Haskins, 1989.
Environmental Impact on IQ
- French adoption studies suggest that while home environment influences IQ, biological factors remain a significant predictor of intellectual outcomes.
- The data indicates that children from high-SES biological parents retain an IQ advantage even when raised in different environments, suggesting heritability exceeds 0.5.
- A child's inherited characteristics may actually influence how parents treat them, blurring the line between purely environmental and genetic factors.
- Statistical analysis suggests that three-quarters of environmental influence on intelligence is uncorrelated with family socioeconomic status.
- The findings imply that environmental factors outside the family unit may be more relevant to IQ development than the home environment itself.
To that extent, speaking of home environment as if it were purely an environmental source of variation is incorrect.
746
Notes to pages 405-41 2
Notes to pages 41 2-415
747
64. For a critical reading of just how minimal these other effects of preschool
may have been, see Spitz 1986.
65. Lazar and Darlington 1982.
66. Similar estimates can be found in a study of the early effects of Head Start
and the consortium sample (Lee et al. 1990).
67. Lazar and Darlington 1982, p. 47 The people who do these studies often
argue that other positive effects are not being picked up in the formal mea-
surements (e.g., Ramey, MacPhee, and Yeates 1982).
68. Many publications have flowed from the project; useful summaries are in
Ramey 1992; Ramey, MacPhee, and Yeates 1982.
69. Personal communication from Ron Haskins.
70. Ramey 1992.
7 1. These differences are clearer in the critical accounts of the project in Spit:
1986 and 1992 than in the report by Ramey, MacPhee, and Yeates 1982.
72. Hermstein 1982; Sommer and Sommer 1983.
73. Page 1972; Page and Grandon 1981.
74. Garber 1988; Garber and Hodge 1991.
75. Jensen 1989; Locurto 1991. The problem of "teaching to the test" recurs
in educational interventions. It is based on the test's being less than a per-
fect measure of intelligence (org), so that it is possible to change the score
without changing the underlying trait (see further discussion in Jensen
1993a).
76. Our topic here is the effect of adoption on raising IQ, not the implications
of adoption data for estimating the heritability of 1Q. For reviews of the
adoption literature, see Hermstein 1973; Locurto 1990; Munsinger 1975;
Plomin and DeFries 1985. A comprehensive theoretical analysis of adop-
tion studies of intelligence is in Turkheimer 1991.
77. Brown 1958, Chap. 5; Lane 1976; Lane and Pillard 1978.
78. Among others inspired by this evidence from "wild children" of the power
over the mind of the human environment was an ltalian physician trained
at the end of the nineteenth century whose approach to education has sur-
vived the twentieth, Maria Montessori.
79. Locurto 1990; Plomin and DeFries 1985. In a refinement of this ohserva-
tion, it has been found that adopted children also score lower than the chil-
dren in other homes that are socioeconomically the same as those of their
adoptive parents but have no adopted children (thereby controlling for
possible ways in which adoptive parents might be distinctive from non-
adoptive parents).
80. Locurto 1990.
81. Dumaret and Stewart 1985; Schiff et al. 1982; Schiff and Lewontin 1986.
82. We will disregard in our analysis a number of considerations that would re-
duce estimates of the impact of home environment, such as that the IQ of
the schoolmates of the nonadopted half-siblings (who presumably share
comparable lower-class surroundings) averaged only seven points less than
the adopted children, not twelve. This difference raises the possibility that
the adopted-away child seemed brighter in infancy or had better intellec-
tual prospects than the half-sibling who stayed at home because of the par-
ent they did not share, or that the shift in home environments was even
more extreme than the estimates below assume it was, as if the adopted
child's biological family home was atypically poor, even for the poor neigh-
borhoods they were in. This, as we explain below, would reduce the over-
all estimate of the impact of home environment.
83. The cell sizes in the 2 x 2 table of high. and low-SES adopting and bio-
logical parent families were only ten children or fewer.
84. Capron and Duyme 1989. This study showed an even larger benefit-
equivalent to sixteen IQ points--of having high-SES biological parents,
even when the child was not reared by them, which again points to a her-
itability greater than .5.
85. This, it should be remembered, is for childhood IQ, which is more sub-
ject to the influence of home environment than adult IQ. Recent work
has also indicated that how a parent treats a child (presumably also an
adopted child) is in part determined by the child's inherited charac-
teristics. To that extent, speaking of home environment as if it were purely
an environmental source of variation is incorrect (see Plomin and Ber-
geman 1991).
86. A twenty-point swing is easily reconciled with a heritability of .6 for IQ.
Suppose the high- and low-SES homes in the French studies represent the
90th and 10th centile of environmental quality, as the text says. A twenty-
point swing in IQ from the 2d to the 98th centile of environmental qual-
ity would then imply that the standard deviation of home environment
effects on IQ is 4.69. Squared, this means a variance of 22 attributable to
home environment. But as we noted in note 1, a heritability of .6 implies
that there is a variance of 225 - 135, or 90, attributable to environmental
sources. The French adoption studies, in short, are consistent with the con-
clusion that about a quarter of environmental variance is the variance
across homes (if our guesses about the adopting and biological home en-
vironments are not way off). Three-quarters of the environmental influ-
ence on intelligence must be uncorrelated with the family SES, according
to the present analysis. Note again that the balance tips toward environ-
mental factors outside families as being the more relevant than those pro-
vided by families in affecting IQ, as mentioned in Chapter 4.
87. For a discussion of cost-benefit considerations, see Haskins, 1989.
748
Notes to pages 4 19-421
Notes to pages 421-423
749
Chapter 18
1. "Sharpen your pencil, and begin now," Wall Street Journal, June 9, 1992, p.
A16.
2. National Commission on Excellence in Education 1983, p. 5.
3. National Commission on Excellence in Education 1984, p. 58.
4. For an example of an alarmist view and a discussion of the various esti-
mates, see Kozol 1985.
5. National Center for Education Statistics 1992, Tahle 12-4.
6. DES 1992, Table 95.
7. Ravitch and Finn 1987, p. 49.
8. Congressional Budget Office 1987, p. 16.
9. Congressional Budget Office 1987, p. 16.
10. Quoted in Kozol 1985, p. 9.
I I. Four of the studies were conducted by the International Association for
the Evaluation of Educational Achievement, known as the IEA. They were
the First International Mathematics Study (FIMS), mid-1960s; the First
International Science Study (FISS), 1966-1973; the Second Internaticmal
Mathematics Study (SIMS), 1981-1 982; and the Second Internat ions1
Science Study (SISS), 1981-1982. The fifth study was initiated hy the
United States as a spin-off from NAEP. It was conducted in 1988 and is
known as the First International Assessment of Educationill Progress
(IAEP-I) (Medrich and Griffith 1992).
12. Medrich and Griffith 1992, Appendix B.
13. National Center for Education Statistics 1992, pp. 208-21 5.
14. The best single source for understanding complexities of internatic)naI
comparisons is the summary and synthesis produced by National Center
for Educational Statistics (Medrich and Griffith 1992). Other h,
C I ~ I C
- ' sot~rces
in this literature are Walker 1976; McKnight et al. 1989; Keeves 1991.
There are culti~ral factors too. In his vigorous defense of American educil-
tion, Gerald Bracey tells of the scene in a Korean classrtwm during one
such international test: "As each Korean student's name was called to come
to the testing area, that child stood and exited the classroom to loud ap-
plause. What a personal honor to he chosen to perform for the honor of
the nation!" American children seldom react that way, Bracey ohserves
(Bracey 1991, p. 113).
15. Bishop 1993b, National Center for Education Statistics 1992a, pp. 60-61.
16. In addition to Bishop 1989, reviewed below, see especially Carlson, Huel-
skamp, and Woodall 1993; Bracey 1991.
17. Bishop 1989.
18. The Flynn effect refers to gradually rising scores over time on cognitive
ability tests, discussed in Chapter 13.
19. NAEP periodically tests representative samples of students at different age
levels in mathematics, reading, science, and, more recently, in writing and
in history and literature.
20. National Center for Education Statistics, 1991, Fig. 1. The tests were de-
signed to have a mean of 250 and a standard deviation of 50 when taken
across all three age groups. The exception to flat trend lines was science
performance among 17-year-olds, which shows a fifteen-point decline from
1969 to 1990, somewhat more than .3 SD (we do not know the specific
standard deviations for 17-year-olds on the science test; probably it is less
than 50). Note also that science among 17-year-olds reflects dispropor-
tionately the performance of the above-average students who tend to take
high school science--consistent with our broader theme that educational
performance deteriorated primarily among the gifted.
21. Two large questions about the tahle on page 422 immediately present
themselves. First, are the five studies accurate representations of the na-
tional samples that they purported to select, and are the five tests compa-
rahle with each other? The answer to the first half of the question is a
qualified yes. The studies were not perfect, but all appear to have been well
designed and executed. The qualification is that the data exclude young-
sters who did not reach the junior year in high school. The answer to the
second half of the question is cloudier, if only because sets of tests admin-
istered at different times to different samples always introduce incompara-
hilities with effects that cannot be assessed precisely. The prudent
conclusion regarding the math scores is to discount the modest fall and rise
from 1955 to 1983 and assume instead that math aptitude over that period
was steady. Regarding the Verbal scores, it seems likely that they rose from
1955 to 1966 and dropped from sometime after 1966 to sometime between
1974 and 1983, with the magnitude and precise timing of those shifts still
open to question. Before leaving the norm studies, we must add a proviso:
the SAT scales got easier during 1963 to 1973 by about eight to thirteen
points on the Verbal and perhaps ten to seventeen points on the Math.
They seem to have been stable before and following this period (Modu and
Stem 1975, 1977). The same person would, in other words, have earned a
higher score on the later SATs than the earlier ones, owing purely to
changes in the test scales themselves. Whether the PSAT, a much shorter
test, experienced the same degree of drift is unknown, but it is a good idea
to adjust mentally the 1974 and 1983 scores downward a bit, though this
does not change the overall interpretation of the results.
22. Grades 10 and 11 show a similar pattern. Grade 12 remained slightly un-
der its high (1965-1967) as of 1992, but it is likely that the deficit is ex-
plained by increases in the proportion of 17-year-olds retained in school.
International Assessments and Cultural Context
- The text outlines the history of international educational assessments, including the SISS and the IAEP-I, which emerged as a spin-off from the NAEP.
- Cultural factors significantly influence test performance, as evidenced by the high national honor Korean students associate with being selected for testing.
- Longitudinal data suggests that while math aptitude remained relatively steady from 1955 to 1983, verbal scores experienced a notable rise and subsequent decline.
- A specific decline in science performance among 17-year-olds between 1969 and 1990 suggests a deterioration in performance among gifted students.
- The validity of long-term score comparisons is complicated by shifting SAT scales, which became easier between 1963 and 1973.
- Methodological challenges, such as the exclusion of high school dropouts and inherent test incomparability, require a prudent interpretation of historical data.
As each Korean student's name was called to come to the testing area, that child stood and exited the classroom to loud applause.
748
Notes to pages 4 19-421
Notes to pages 421-423
749
Chapter 18
1. "Sharpen your pencil, and begin now," Wall Street Journal, June 9, 1992, p.
A16.
2. National Commission on Excellence in Education 1983, p. 5.
3. National Commission on Excellence in Education 1984, p. 58.
4. For an example of an alarmist view and a discussion of the various esti-
mates, see Kozol 1985.
5. National Center for Education Statistics 1992, Tahle 12-4.
6. DES 1992, Table 95.
7. Ravitch and Finn 1987, p. 49.
8. Congressional Budget Office 1987, p. 16.
9. Congressional Budget Office 1987, p. 16.
10. Quoted in Kozol 1985, p. 9.
I I. Four of the studies were conducted by the International Association for
the Evaluation of Educational Achievement, known as the IEA. They were
the First International Mathematics Study (FIMS), mid-1960s; the First
International Science Study (FISS), 1966-1973; the Second Internaticmal
Mathematics Study (SIMS), 1981-1 982; and the Second Internat ions1
Science Study (SISS), 1981-1982. The fifth study was initiated hy the
United States as a spin-off from NAEP. It was conducted in 1988 and is
known as the First International Assessment of Educationill Progress
(IAEP-I) (Medrich and Griffith 1992).
12. Medrich and Griffith 1992, Appendix B.
13. National Center for Education Statistics 1992, pp. 208-21 5.
14. The best single source for understanding complexities of internatic)naI
comparisons is the summary and synthesis produced by National Center
for Educational Statistics (Medrich and Griffith 1992). Other h,
C I ~ I C
- ' sot~rces
in this literature are Walker 1976; McKnight et al. 1989; Keeves 1991.
There are culti~ral factors too. In his vigorous defense of American educil-
tion, Gerald Bracey tells of the scene in a Korean classrtwm during one
such international test: "As each Korean student's name was called to come
to the testing area, that child stood and exited the classroom to loud ap-
plause. What a personal honor to he chosen to perform for the honor of
the nation!" American children seldom react that way, Bracey ohserves
(Bracey 1991, p. 113).
15. Bishop 1993b, National Center for Education Statistics 1992a, pp. 60-61.
16. In addition to Bishop 1989, reviewed below, see especially Carlson, Huel-
skamp, and Woodall 1993; Bracey 1991.
17. Bishop 1989.
18. The Flynn effect refers to gradually rising scores over time on cognitive
ability tests, discussed in Chapter 13.
19. NAEP periodically tests representative samples of students at different age
levels in mathematics, reading, science, and, more recently, in writing and
in history and literature.
20. National Center for Education Statistics, 1991, Fig. 1. The tests were de-
signed to have a mean of 250 and a standard deviation of 50 when taken
across all three age groups. The exception to flat trend lines was science
performance among 17-year-olds, which shows a fifteen-point decline from
1969 to 1990, somewhat more than .3 SD (we do not know the specific
standard deviations for 17-year-olds on the science test; probably it is less
than 50). Note also that science among 17-year-olds reflects dispropor-
tionately the performance of the above-average students who tend to take
high school science--consistent with our broader theme that educational
performance deteriorated primarily among the gifted.
21. Two large questions about the tahle on page 422 immediately present
themselves. First, are the five studies accurate representations of the na-
tional samples that they purported to select, and are the five tests compa-
rahle with each other? The answer to the first half of the question is a
qualified yes. The studies were not perfect, but all appear to have been well
designed and executed. The qualification is that the data exclude young-
sters who did not reach the junior year in high school. The answer to the
second half of the question is cloudier, if only because sets of tests admin-
istered at different times to different samples always introduce incompara-
hilities with effects that cannot be assessed precisely. The prudent
conclusion regarding the math scores is to discount the modest fall and rise
from 1955 to 1983 and assume instead that math aptitude over that period
was steady. Regarding the Verbal scores, it seems likely that they rose from
1955 to 1966 and dropped from sometime after 1966 to sometime between
1974 and 1983, with the magnitude and precise timing of those shifts still
open to question. Before leaving the norm studies, we must add a proviso:
the SAT scales got easier during 1963 to 1973 by about eight to thirteen
points on the Verbal and perhaps ten to seventeen points on the Math.
They seem to have been stable before and following this period (Modu and
Stem 1975, 1977). The same person would, in other words, have earned a
higher score on the later SATs than the earlier ones, owing purely to
changes in the test scales themselves. Whether the PSAT, a much shorter
test, experienced the same degree of drift is unknown, but it is a good idea
to adjust mentally the 1974 and 1983 scores downward a bit, though this
does not change the overall interpretation of the results.
22. Grades 10 and 11 show a similar pattern. Grade 12 remained slightly un-
der its high (1965-1967) as of 1992, but it is likely that the deficit is ex-
plained by increases in the proportion of 17-year-olds retained in school.
Analyzing SAT Score Trends
- The text examines potential 'drift' in test scales, suggesting that certain historical scores may need downward adjustment for accurate comparison.
- Educational improvements in the post-slump era appear more pronounced in lower grade levels than in higher ones.
- Researchers investigated 'cognitive democratization'—the theory that the SAT pool expanded to include students with lower academic standing.
- Data shows that while scores for specific class-rank subgroups rose, the overall average for the white SAT pool remained relatively flat.
- Discrepancies in the data suggest that changes in how students report class rank or the meaning of those ranks may skew results.
- The authors conclude that cognitive democratization likely accounts for only a negligible portion of the observed test score trends.
We are aware of Simpson's paradox, which shows how scores in each interval can go up when scores in the aggregated group go down, hut in this case the explanation appears to lie in changes either in the way that students report their class rank, the meaning of class rank, or both.
748
Notes to pages 4 19-421
Notes to pages 421-423
749
Chapter 18
1. "Sharpen your pencil, and begin now," Wall Street Journal, June 9, 1992, p.
A16.
2. National Commission on Excellence in Education 1983, p. 5.
3. National Commission on Excellence in Education 1984, p. 58.
4. For an example of an alarmist view and a discussion of the various esti-
mates, see Kozol 1985.
5. National Center for Education Statistics 1992, Tahle 12-4.
6. DES 1992, Table 95.
7. Ravitch and Finn 1987, p. 49.
8. Congressional Budget Office 1987, p. 16.
9. Congressional Budget Office 1987, p. 16.
10. Quoted in Kozol 1985, p. 9.
I I. Four of the studies were conducted by the International Association for
the Evaluation of Educational Achievement, known as the IEA. They were
the First International Mathematics Study (FIMS), mid-1960s; the First
International Science Study (FISS), 1966-1973; the Second Internaticmal
Mathematics Study (SIMS), 1981-1 982; and the Second Internat ions1
Science Study (SISS), 1981-1982. The fifth study was initiated hy the
United States as a spin-off from NAEP. It was conducted in 1988 and is
known as the First International Assessment of Educationill Progress
(IAEP-I) (Medrich and Griffith 1992).
12. Medrich and Griffith 1992, Appendix B.
13. National Center for Education Statistics 1992, pp. 208-21 5.
14. The best single source for understanding complexities of internatic)naI
comparisons is the summary and synthesis produced by National Center
for Educational Statistics (Medrich and Griffith 1992). Other h,
C I ~ I C
- ' sot~rces
in this literature are Walker 1976; McKnight et al. 1989; Keeves 1991.
There are culti~ral factors too. In his vigorous defense of American educil-
tion, Gerald Bracey tells of the scene in a Korean classrtwm during one
such international test: "As each Korean student's name was called to come
to the testing area, that child stood and exited the classroom to loud ap-
plause. What a personal honor to he chosen to perform for the honor of
the nation!" American children seldom react that way, Bracey ohserves
(Bracey 1991, p. 113).
15. Bishop 1993b, National Center for Education Statistics 1992a, pp. 60-61.
16. In addition to Bishop 1989, reviewed below, see especially Carlson, Huel-
skamp, and Woodall 1993; Bracey 1991.
17. Bishop 1989.
18. The Flynn effect refers to gradually rising scores over time on cognitive
ability tests, discussed in Chapter 13.
19. NAEP periodically tests representative samples of students at different age
levels in mathematics, reading, science, and, more recently, in writing and
in history and literature.
20. National Center for Education Statistics, 1991, Fig. 1. The tests were de-
signed to have a mean of 250 and a standard deviation of 50 when taken
across all three age groups. The exception to flat trend lines was science
performance among 17-year-olds, which shows a fifteen-point decline from
1969 to 1990, somewhat more than .3 SD (we do not know the specific
standard deviations for 17-year-olds on the science test; probably it is less
than 50). Note also that science among 17-year-olds reflects dispropor-
tionately the performance of the above-average students who tend to take
high school science--consistent with our broader theme that educational
performance deteriorated primarily among the gifted.
21. Two large questions about the tahle on page 422 immediately present
themselves. First, are the five studies accurate representations of the na-
tional samples that they purported to select, and are the five tests compa-
rahle with each other? The answer to the first half of the question is a
qualified yes. The studies were not perfect, but all appear to have been well
designed and executed. The qualification is that the data exclude young-
sters who did not reach the junior year in high school. The answer to the
second half of the question is cloudier, if only because sets of tests admin-
istered at different times to different samples always introduce incompara-
hilities with effects that cannot be assessed precisely. The prudent
conclusion regarding the math scores is to discount the modest fall and rise
from 1955 to 1983 and assume instead that math aptitude over that period
was steady. Regarding the Verbal scores, it seems likely that they rose from
1955 to 1966 and dropped from sometime after 1966 to sometime between
1974 and 1983, with the magnitude and precise timing of those shifts still
open to question. Before leaving the norm studies, we must add a proviso:
the SAT scales got easier during 1963 to 1973 by about eight to thirteen
points on the Verbal and perhaps ten to seventeen points on the Math.
They seem to have been stable before and following this period (Modu and
Stem 1975, 1977). The same person would, in other words, have earned a
higher score on the later SATs than the earlier ones, owing purely to
changes in the test scales themselves. Whether the PSAT, a much shorter
test, experienced the same degree of drift is unknown, but it is a good idea
to adjust mentally the 1974 and 1983 scores downward a bit, though this
does not change the overall interpretation of the results.
22. Grades 10 and 11 show a similar pattern. Grade 12 remained slightly un-
der its high (1965-1967) as of 1992, but it is likely that the deficit is ex-
plained by increases in the proportion of 17-year-olds retained in school.
750
Notes to pages 424-426
Notes to pages 427-429
75 1
The possibility remains open, however, that education in the post-slump
period improved more in the lower grades than in the higher ones.
23. Congressional Budget Office 1986.
24. Medrich and Griffith 1992.
25. The College Board added new method of reporting test scores in 1967
based on seniors instead of all tests administered, and continued to report
the means for both types of samples through 1977. During the years when
both scores were available, the trends were visually almost inclistinguish-
able. In the year when we employed the new measure in the graph on page
425, 1970, the scores for the two methods were identical.
26. Based on the 1963 standard deviations, .49 and -32 SD reductions respec-
tively.
27. For a technical statement of this argument, see Carlson, Huelskamp, and
Woodall 1993.
28. Readers can follow the journey through the numbers in Murray and
Hermstein 1992.
29. It is possible that the SAT pool was not getting democratized in the usual
socioeconomic sense but was nevertheless beginning to dig deeper into the
cognitive distribution. Responses in the SAT student questionnaire indi-
cate that somewhat more students from the bottom of the class were tak-
ing the test in 1992 than in 1976, but this effect was extremely small for
whites. In 1980,72.2 percent of whites reported that they were in the top
two-fifths of their high school class, compared to 7 1.5 percent in 1992. We
nonetheless explored the possibility that the pool had become cognitively
democratized, by looking at the scores of students who reported that they
were in the top tenth, the second tenth, and the second fifth of their classes.
If their scores went up while those for the entire SAT sample went down,
that would be suggestive evidence (if we make certain assumptions about
the consistency with which students reported their true class rank) that
the pool was drawing from a cognitively broader segment of the popula-
tion. Using 1980 (the end of the decline) to 1992 as the period of com-
parison, the Verbal scores of whites who reported they were in the top
tenth, 2d tenth, and 2d fifth went up by five, seven, and eight pnints re-
spectively, while that of the entire white SAT pool remained flat. In Math,
the scores of the top tenth, 2d tenth, and 2d fifth went up by nine, thir-
teen, and fourteen points, respectively, while that of the p o l rose by nine
points. At first glance, this would seem to he evidence for a strong effect
of cognitive democratization. But then we looked at what happened to the
scores of white students reporting that they were in the 3d, 4th, and low-
est fifths of their classes. Their scores went up hy much more: nine, eleven,
and ten points, respectively, in the Verbal; seventeen, seventeen, and nine
in the Math. We are aware of Simpson's paradox, which shows how scores
in each interval can go up when scores in the aggregated group go down,
hut in this case the explanation appears to lie in changes either in the way
that students report their class rank, the meaning of class rank, or both.
We give "cognitive democratization" credit for two points each in the Ver-
ha1 and Math, but it is not certain that even that much is warranted.
30. For an argument that the test score decline does in fact represent falling
intelligence, see Itzkoff 1993.
3 1. For a broader discussion of falling SAT scores in the high-scoring segment
of the pool, see Singal 199 1.
32. From 1967, scores were reported for all test takers; from 1972 through 1976,
ETS reported scores for all test takers and for college-hound seniors. To es-
timate college-bound seniors for 1967-1972, we cc>mputed the ratio of col-
lege-hound seniors to total test takers for the overlapping years of
1972-1976. For Verbal, the mean ratio was .82, with a high of .88 and a
low of .77. For Math, the mean ratio was .78, with a high of .85 and a low
of .71. The mean ratios were applied to the data from 1967 to 1972 to ob-
tain an estimate of the number of college-bound seniors.
33. ETS keeps careful watch on changes in item difficulty, which are called
"scale drift." It finds that scores of 650 and above were little affected by
scale drift (Modu and Stern 1975; 1977).
34. The remaining possibility is that the increase in the SAT pool during the
1980s brought students into the pool who could score 700 but had not been
taking the test hefore. This possibility is not subject to examination. It must
he set against the evidence that extremely high proportions of the top stu-
dents have been going to college since the early 1960s and that the hest-
of-the-best, represented by those who score more than 700 on the SAT,
have been avidly seeking, and heing sought by, elite colleges since the
1950s, which means that they have been taking the SAT. Note also that
the proportion of SAT students who identify themselves as being in the
top tenth of their high school class-where
700 scorers are almost certain
to be-was
virtually unchanged from 1981 to 1992. Finally, if highly tal-
ented new students were being drawn from some mysterious source, why
did we see no improvement on the SAT-Verbal? It seems unlikely that the
increase in the overall proportion of high school students taking the SAT
can account for more than a small proportion, if any, of the remarkable im-
provement in Math scores among the most gifted during the 1980s.
35. Once again, the changes are not caused by changes in the ethnic cornpo-
sition of the pool (for example, by an influx of test takers who do not speak
English as their native language). The trendline for whites since 1980 par-
allels that for the entire test population.
36. National Center for Education Statistics 1992, p. 57. We also examined
the SAT achievement test results. They are harder to interpret than the
Analyzing SAT Score Trends
- Researchers used statistical ratios to estimate the number of college-bound seniors from 1967 to 1972 to maintain data consistency.
- The Educational Testing Service (ETS) monitors 'scale drift' to ensure that high-end scores remain comparable over time.
- The study argues that the 1980s surge in high Math scores cannot be explained by new, previously untested students entering the pool.
- Demographic shifts, such as changes in ethnic composition or native language, do not appear to be the primary drivers of these specific score trends.
- Achievement test data is increasingly difficult to interpret because the test-taking population has become highly unrepresentative of the general student body.
Finally, if highly talented new students were being drawn from some mysterious source, why did we see no improvement on the SAT-Verbal?
750
Notes to pages 424-426
Notes to pages 427-429
75 1
The possibility remains open, however, that education in the post-slump
period improved more in the lower grades than in the higher ones.
23. Congressional Budget Office 1986.
24. Medrich and Griffith 1992.
25. The College Board added new method of reporting test scores in 1967
based on seniors instead of all tests administered, and continued to report
the means for both types of samples through 1977. During the years when
both scores were available, the trends were visually almost inclistinguish-
able. In the year when we employed the new measure in the graph on page
425, 1970, the scores for the two methods were identical.
26. Based on the 1963 standard deviations, .49 and -32 SD reductions respec-
tively.
27. For a technical statement of this argument, see Carlson, Huelskamp, and
Woodall 1993.
28. Readers can follow the journey through the numbers in Murray and
Hermstein 1992.
29. It is possible that the SAT pool was not getting democratized in the usual
socioeconomic sense but was nevertheless beginning to dig deeper into the
cognitive distribution. Responses in the SAT student questionnaire indi-
cate that somewhat more students from the bottom of the class were tak-
ing the test in 1992 than in 1976, but this effect was extremely small for
whites. In 1980,72.2 percent of whites reported that they were in the top
two-fifths of their high school class, compared to 7 1.5 percent in 1992. We
nonetheless explored the possibility that the pool had become cognitively
democratized, by looking at the scores of students who reported that they
were in the top tenth, the second tenth, and the second fifth of their classes.
If their scores went up while those for the entire SAT sample went down,
that would be suggestive evidence (if we make certain assumptions about
the consistency with which students reported their true class rank) that
the pool was drawing from a cognitively broader segment of the popula-
tion. Using 1980 (the end of the decline) to 1992 as the period of com-
parison, the Verbal scores of whites who reported they were in the top
tenth, 2d tenth, and 2d fifth went up by five, seven, and eight pnints re-
spectively, while that of the entire white SAT pool remained flat. In Math,
the scores of the top tenth, 2d tenth, and 2d fifth went up by nine, thir-
teen, and fourteen points, respectively, while that of the p o l rose by nine
points. At first glance, this would seem to he evidence for a strong effect
of cognitive democratization. But then we looked at what happened to the
scores of white students reporting that they were in the 3d, 4th, and low-
est fifths of their classes. Their scores went up hy much more: nine, eleven,
and ten points, respectively, in the Verbal; seventeen, seventeen, and nine
in the Math. We are aware of Simpson's paradox, which shows how scores
in each interval can go up when scores in the aggregated group go down,
hut in this case the explanation appears to lie in changes either in the way
that students report their class rank, the meaning of class rank, or both.
We give "cognitive democratization" credit for two points each in the Ver-
ha1 and Math, but it is not certain that even that much is warranted.
30. For an argument that the test score decline does in fact represent falling
intelligence, see Itzkoff 1993.
3 1. For a broader discussion of falling SAT scores in the high-scoring segment
of the pool, see Singal 199 1.
32. From 1967, scores were reported for all test takers; from 1972 through 1976,
ETS reported scores for all test takers and for college-hound seniors. To es-
timate college-bound seniors for 1967-1972, we cc>mputed the ratio of col-
lege-hound seniors to total test takers for the overlapping years of
1972-1976. For Verbal, the mean ratio was .82, with a high of .88 and a
low of .77. For Math, the mean ratio was .78, with a high of .85 and a low
of .71. The mean ratios were applied to the data from 1967 to 1972 to ob-
tain an estimate of the number of college-bound seniors.
33. ETS keeps careful watch on changes in item difficulty, which are called
"scale drift." It finds that scores of 650 and above were little affected by
scale drift (Modu and Stern 1975; 1977).
34. The remaining possibility is that the increase in the SAT pool during the
1980s brought students into the pool who could score 700 but had not been
taking the test hefore. This possibility is not subject to examination. It must
he set against the evidence that extremely high proportions of the top stu-
dents have been going to college since the early 1960s and that the hest-
of-the-best, represented by those who score more than 700 on the SAT,
have been avidly seeking, and heing sought by, elite colleges since the
1950s, which means that they have been taking the SAT. Note also that
the proportion of SAT students who identify themselves as being in the
top tenth of their high school class-where
700 scorers are almost certain
to be-was
virtually unchanged from 1981 to 1992. Finally, if highly tal-
ented new students were being drawn from some mysterious source, why
did we see no improvement on the SAT-Verbal? It seems unlikely that the
increase in the overall proportion of high school students taking the SAT
can account for more than a small proportion, if any, of the remarkable im-
provement in Math scores among the most gifted during the 1980s.
35. Once again, the changes are not caused by changes in the ethnic cornpo-
sition of the pool (for example, by an influx of test takers who do not speak
English as their native language). The trendline for whites since 1980 par-
allels that for the entire test population.
36. National Center for Education Statistics 1992, p. 57. We also examined
the SAT achievement test results. They are harder to interpret than the
752
Notes to page 430
SAT' because the test is regularly rescaled as the population of students
taking the test changes. For a description of the equating and rescaling pro-
cedures used for the achievement tests, see Donlon 1984, p p 21-27. The
effects of these rescalings, which are too complex to descrihe here, are suh-
stantial. For example the average student who took the Biology achieve-
ment test in 1976 had an SAT-Math score that was 71 points above the
national mean; by 1992, that gap had increased to 126 points. The same
phenomenon has occurred with most of the other achievement tests (Math
11, the more advanced of the two math achievement tests, is an exception).
Put roughly, the students who take them are increasingly unrepresentative
of the college-bound seniors who take the SAT, let alone of the national
population. We focused on the students scoring 700 or higher by a ~ a i n
as-
suming that since the 1960s, a very high proportion of the nation's stu-
dents who could score higher than 700 on any given achievement test took
the test. We examined trends on the English Composition, American His-
tory, Biology, and Math I1 tests from three perspectives: the students scor-
ing above 700 as a proportion of (1) all students who took that achievement
test; (2) all students who took the SAT; and (3) all 17.year-olds. Method
1 (as a proportion of students taking the achievement test) revealed flat
trendlines-not
surprisingly, given the nature of the rescaling. Methods 2
and 3 revealed similar patterns. With all the reservations appropriate to
this way ofexamining what has happened, we find that the proportion scor-
ing above 700 on English Composition and Math I1 mirrored the contrast
we showed for Verbal and Math scores on the SAT a sharp drop in the
English Composition in the 1970s, with no recovery in the 1980s; an
equally sharp and steep rise in the Math I1 scores beginninn in the 1980s
and continuing through the 1992 test. The results for American History
and Biology were much flatter. Method 2 showed no consistent trend up
or down, and only minor movement in either direction at any time.
Method 3 showed similar shallow howl-shaped curves: reductions during
the 1970s, recovery during the 1980s that brought the American History
results close to the first year of 1972, and brought Biology to a new high,
although one that was only fractionally higher than the 1972 results. This
is consistent with a broad theme that the sciencesand math improved more
in the 1980s than the humanities and social sciences did.
Diane Ravitch's account, one of the first, is still the hest (Ravitch 1983),
with Finn 1991; Sowell 1992; Ravitch 1985; Boyer 1983; and Porter 1990
providing perspectives on different pieces of the puzzle and guidance to the
voluminous literature in magazines and journals regarding the educational
changes in elementary and secondary schools. For basic texts hy advocates
of the reforms, see Goodman 1962; Kohl 1967; Silberman 1970; Kozol
1967; Featherstone 1971; Illich 1970; and the one that in some respects
started it all, Neil1 1960.
38. Fiske 1984; Gionfriddo 1985.
39. Sowell 1992, p. 7.
40. Bishop 199313.
41. Bejar and Blew 1981; Breland 1976; Etzioni 1975; Walsh 1979.
42. By the early 1980s, when the worst of the educational crisis had already
passed, the High School and Beyond survey found that students averaged
only three and a half hours per week on homework (Bishop 1993b).
43. DES 1992b, Table 132.
44. DES 1992b, Table 129. The picture is not unambiguous, however. Mea-
sured in "Carnegie units," representing one credit for the completion of a
one-hour, one-year course, high school graduates were still getting a smaller
proportion of their education from academic units than from vocational
or "personal" units (National Center for Education Statistics 1992, p. 69).
45. We do not exempt colleges altogether, but there are far more exceptions
to the corruption as we mean it at the university level than at the high
school level, in large part because high schools are so much more shaped
by a few standardued textbooks.
46. Gionfriddo 1985.
47. Irwin 1992, Table 1. The programs we designated as for the disadvantaged
were the Title 1 basic and concentration grants, Even Start, the programs
for migratory children, handicapped children, neglected and delinquent
children, the rural technical assistance centers, the state block grants, in-
expensive book distribution, the Ellender fellowships, emergency immi-
grant education, the Title V (drug and alcohol abuse) state grants, national
programs, and emergency grants, Title V1 (dropout), and bilingual program
grants.
48. DES 199213, Table 347.
49. Calvin Lockridge, quoted in "Old debate haunts Banneker's future," Wash-
ington Post, March 29, 1993, p. A10.
50. Ihid.
51. Bishop 1993b.
52. For a coherent and attractive list of such reforms, see Bishop 1990b.
53. Stevenson et al. 1990.
54. E.g., 63 percent of respondents in a recent poll conducted by Mellman-
I
Lazarus-Lake for the American Association of School Administrators
thought that the nation's schools needed "major reform," compared to only
I
33 percent who thought their neighborhood schools needed major reform.
Roper Organization 1993.
I
55. E.g., Powell, Farrar, and Cohen 1985.
I
Divergent Trends in Academic Achievement
- Standardized test data from the 1970s and 1980s reveals a significant performance gap between math and humanities.
- English Composition scores experienced a sharp decline in the 1970s with no subsequent recovery in the following decade.
- Math II scores saw a steep and continuous rise beginning in the 1980s and lasting through the early 1990s.
- Subjects like American History and Biology showed flatter, shallow recovery curves compared to the robust gains in mathematics.
- The text suggests that high school curricula became increasingly diluted with vocational and 'personal' units over academic ones.
- A disconnect exists in public perception where citizens favor national school reform while remaining satisfied with their local neighborhood schools.
This is consistent with a broad theme that the sciences and math improved more in the 1980s than the humanities and social sciences did.
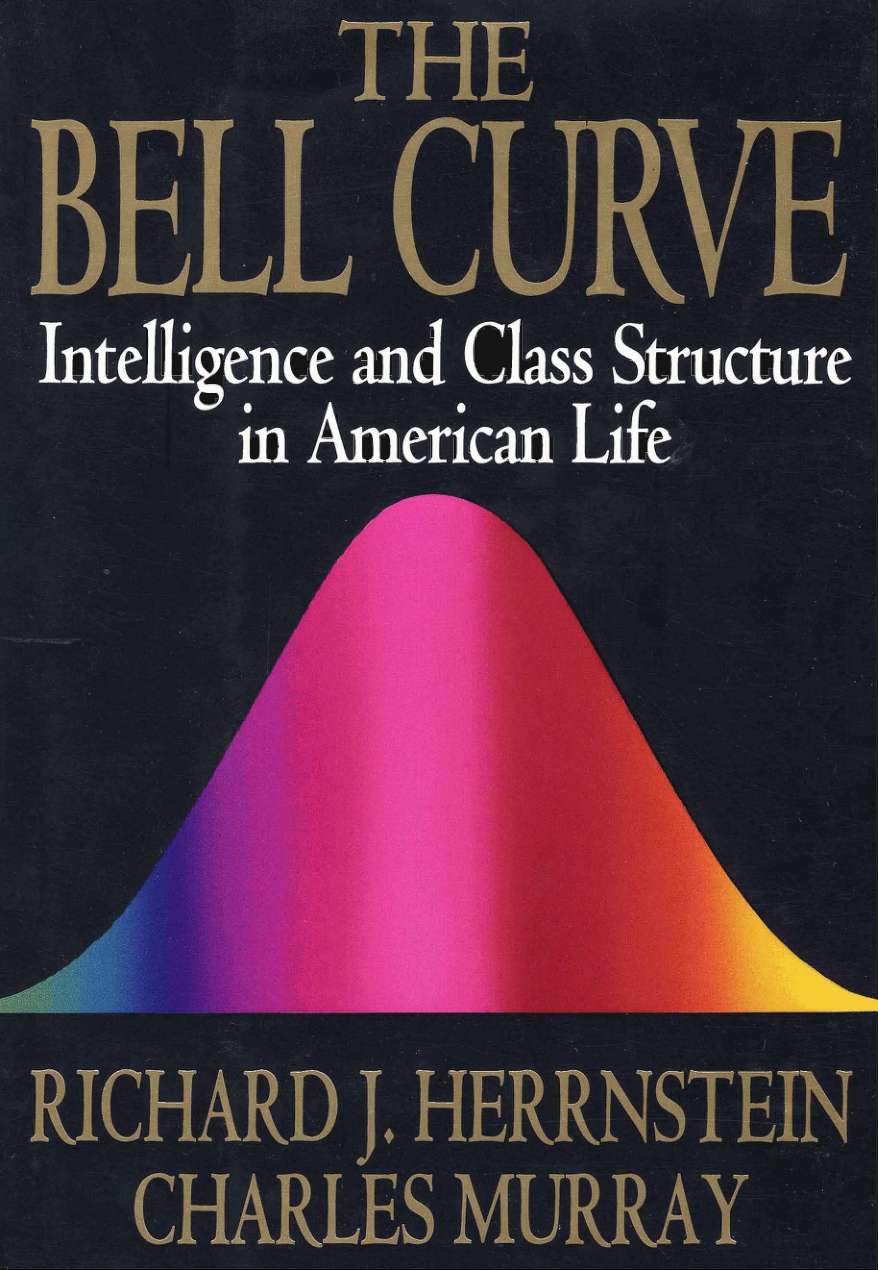
752
Notes to page 430
SAT' because the test is regularly rescaled as the population of students
taking the test changes. For a description of the equating and rescaling pro-
cedures used for the achievement tests, see Donlon 1984, p p 21-27. The
effects of these rescalings, which are too complex to descrihe here, are suh-
stantial. For example the average student who took the Biology achieve-
ment test in 1976 had an SAT-Math score that was 71 points above the
national mean; by 1992, that gap had increased to 126 points. The same
phenomenon has occurred with most of the other achievement tests (Math
11, the more advanced of the two math achievement tests, is an exception).
Put roughly, the students who take them are increasingly unrepresentative
of the college-bound seniors who take the SAT, let alone of the national
population. We focused on the students scoring 700 or higher by a ~ a i n
as-
suming that since the 1960s, a very high proportion of the nation's stu-
dents who could score higher than 700 on any given achievement test took
the test. We examined trends on the English Composition, American His-
tory, Biology, and Math I1 tests from three perspectives: the students scor-
ing above 700 as a proportion of (1) all students who took that achievement
test; (2) all students who took the SAT; and (3) all 17.year-olds. Method
1 (as a proportion of students taking the achievement test) revealed flat
trendlines-not
surprisingly, given the nature of the rescaling. Methods 2
and 3 revealed similar patterns. With all the reservations appropriate to
this way ofexamining what has happened, we find that the proportion scor-
ing above 700 on English Composition and Math I1 mirrored the contrast
we showed for Verbal and Math scores on the SAT a sharp drop in the
English Composition in the 1970s, with no recovery in the 1980s; an
equally sharp and steep rise in the Math I1 scores beginninn in the 1980s
and continuing through the 1992 test. The results for American History
and Biology were much flatter. Method 2 showed no consistent trend up
or down, and only minor movement in either direction at any time.
Method 3 showed similar shallow howl-shaped curves: reductions during
the 1970s, recovery during the 1980s that brought the American History
results close to the first year of 1972, and brought Biology to a new high,
although one that was only fractionally higher than the 1972 results. This
is consistent with a broad theme that the sciencesand math improved more
in the 1980s than the humanities and social sciences did.

Diane Ravitch's account, one of the first, is still the hest (Ravitch 1983),
with Finn 1991; Sowell 1992; Ravitch 1985; Boyer 1983; and Porter 1990
providing perspectives on different pieces of the puzzle and guidance to the
voluminous literature in magazines and journals regarding the educational
changes in elementary and secondary schools. For basic texts hy advocates
of the reforms, see Goodman 1962; Kohl 1967; Silberman 1970; Kozol
1967; Featherstone 1971; Illich 1970; and the one that in some respects
started it all, Neil1 1960.
38. Fiske 1984; Gionfriddo 1985.
39. Sowell 1992, p. 7.
40. Bishop 199313.
41. Bejar and Blew 1981; Breland 1976; Etzioni 1975; Walsh 1979.
42. By the early 1980s, when the worst of the educational crisis had already
passed, the High School and Beyond survey found that students averaged
only three and a half hours per week on homework (Bishop 1993b).
43. DES 1992b, Table 132.
44. DES 1992b, Table 129. The picture is not unambiguous, however. Mea-
sured in "Carnegie units," representing one credit for the completion of a
one-hour, one-year course, high school graduates were still getting a smaller
proportion of their education from academic units than from vocational
or "personal" units (National Center for Education Statistics 1992, p. 69).
45. We do not exempt colleges altogether, but there are far more exceptions
to the corruption as we mean it at the university level than at the high
school level, in large part because high schools are so much more shaped
by a few standardued textbooks.
46. Gionfriddo 1985.
47. Irwin 1992, Table 1. The programs we designated as for the disadvantaged
were the Title 1 basic and concentration grants, Even Start, the programs
for migratory children, handicapped children, neglected and delinquent
children, the rural technical assistance centers, the state block grants, in-
expensive book distribution, the Ellender fellowships, emergency immi-
grant education, the Title V (drug and alcohol abuse) state grants, national
programs, and emergency grants, Title V1 (dropout), and bilingual program
grants.
48. DES 199213, Table 347.
49. Calvin Lockridge, quoted in "Old debate haunts Banneker's future," Wash-
ington Post, March 29, 1993, p. A10.
50. Ihid.
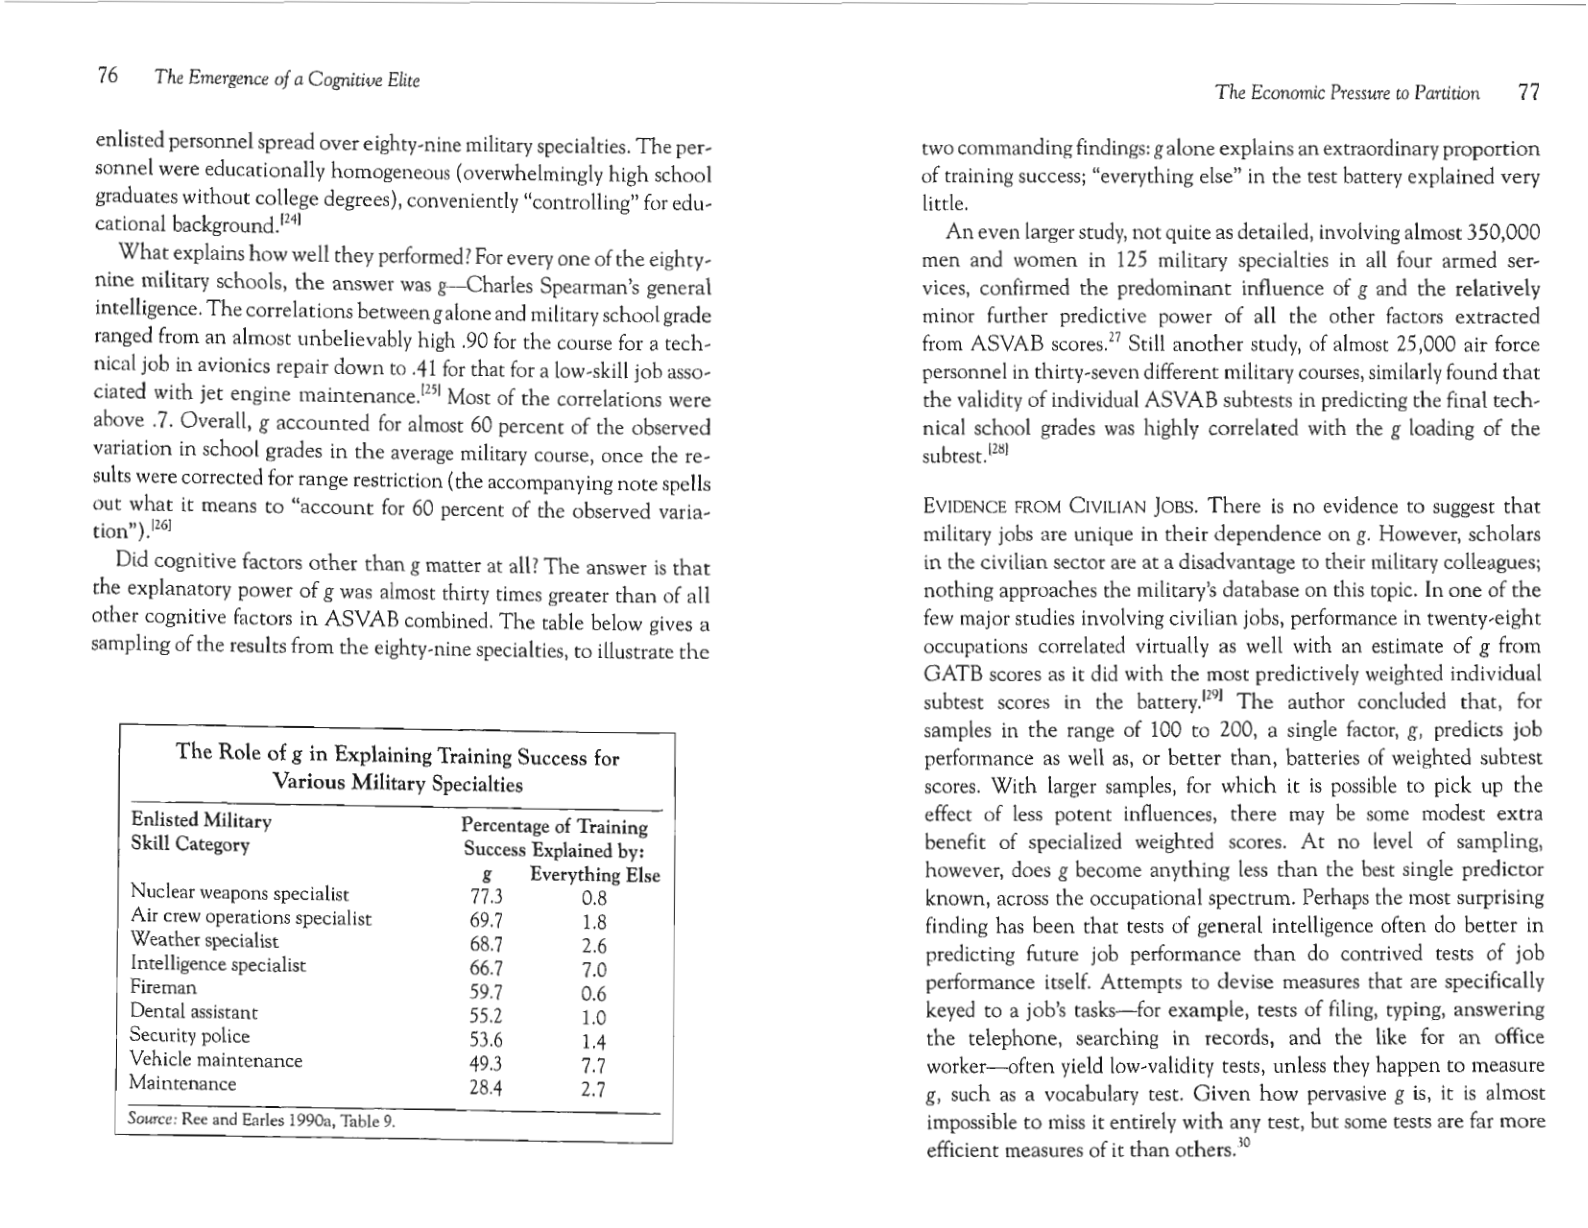
51. Bishop 1993b.
52. For a coherent and attractive list of such reforms, see Bishop 1990b.
53. Stevenson et al. 1990.
54. E.g., 63 percent of respondents in a recent poll conducted by Mellman-
I
Lazarus-Lake for the American Association of School Administrators
thought that the nation's schools needed "major reform," compared to only
I
33 percent who thought their neighborhood schools needed major reform.
Roper Organization 1993.
I
55. E.g., Powell, Farrar, and Cohen 1985.
I
Academic Credentials and Admissions Data
- Research by Bishop highlights the disconnect between high school performance and employer interest, noting that insurance companies rarely receive requested transcripts.
- High school transcripts are primarily useful for first-time job seekers to gauge reliability, whereas subsequent employment relies on professional references.
- Proposed federal programs for academic excellence aim to support middle-class families rather than significantly increasing college attendance among high scorers.
- The Supreme Court's Bakke decision established the illegality of quotas, shifting the focus to affirmative action and admissions data.
- Statistical analysis of SAT scores at elite COFHE schools reveals significant ethnic differences in the academic profiles of admitted students.
- Methodological challenges exist in estimating standard deviations for SAT scores at elite institutions due to varying correlations between verbal and math results.
Nationwide Insurance, which in the single year of 1982 sent out over 1,200 requests for high school transcripts and got 93 responses.
754
Notes to pages 437-45 1
56. Bishop has developed these arguments in several studies: Bishop 1988b,
1990a, 1990b, 1993a, 199313.
57. Bishop 1993b (p. 20) cites the example of Nationwide Insurance, which
in the single year of 1982 sent out over 1,200 requests for high school tran-
scripts and got 93 responses.
58. Bishop 1988a, 1988b, 1990a, 1993a, 1993b.
59. Bishop 1990b.
60. Ibid.
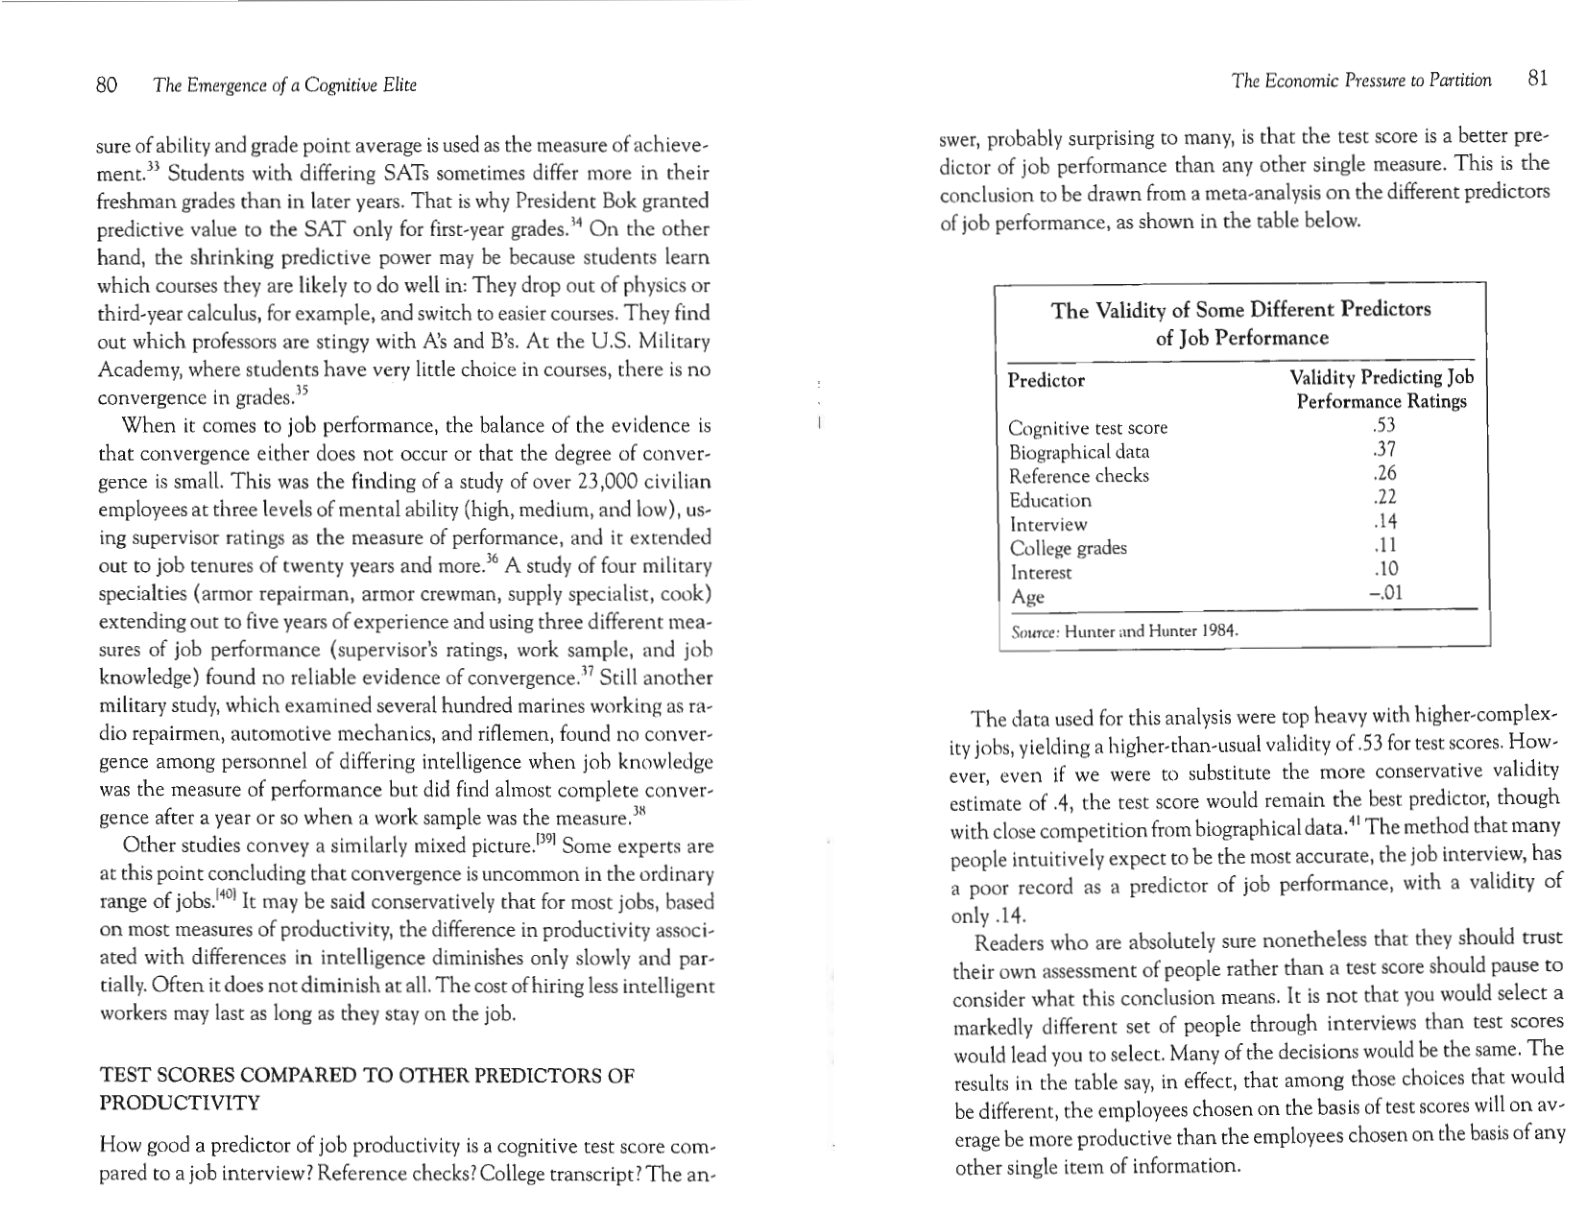
61. The Wonderlic Personnel Test fits this description. For a description, see
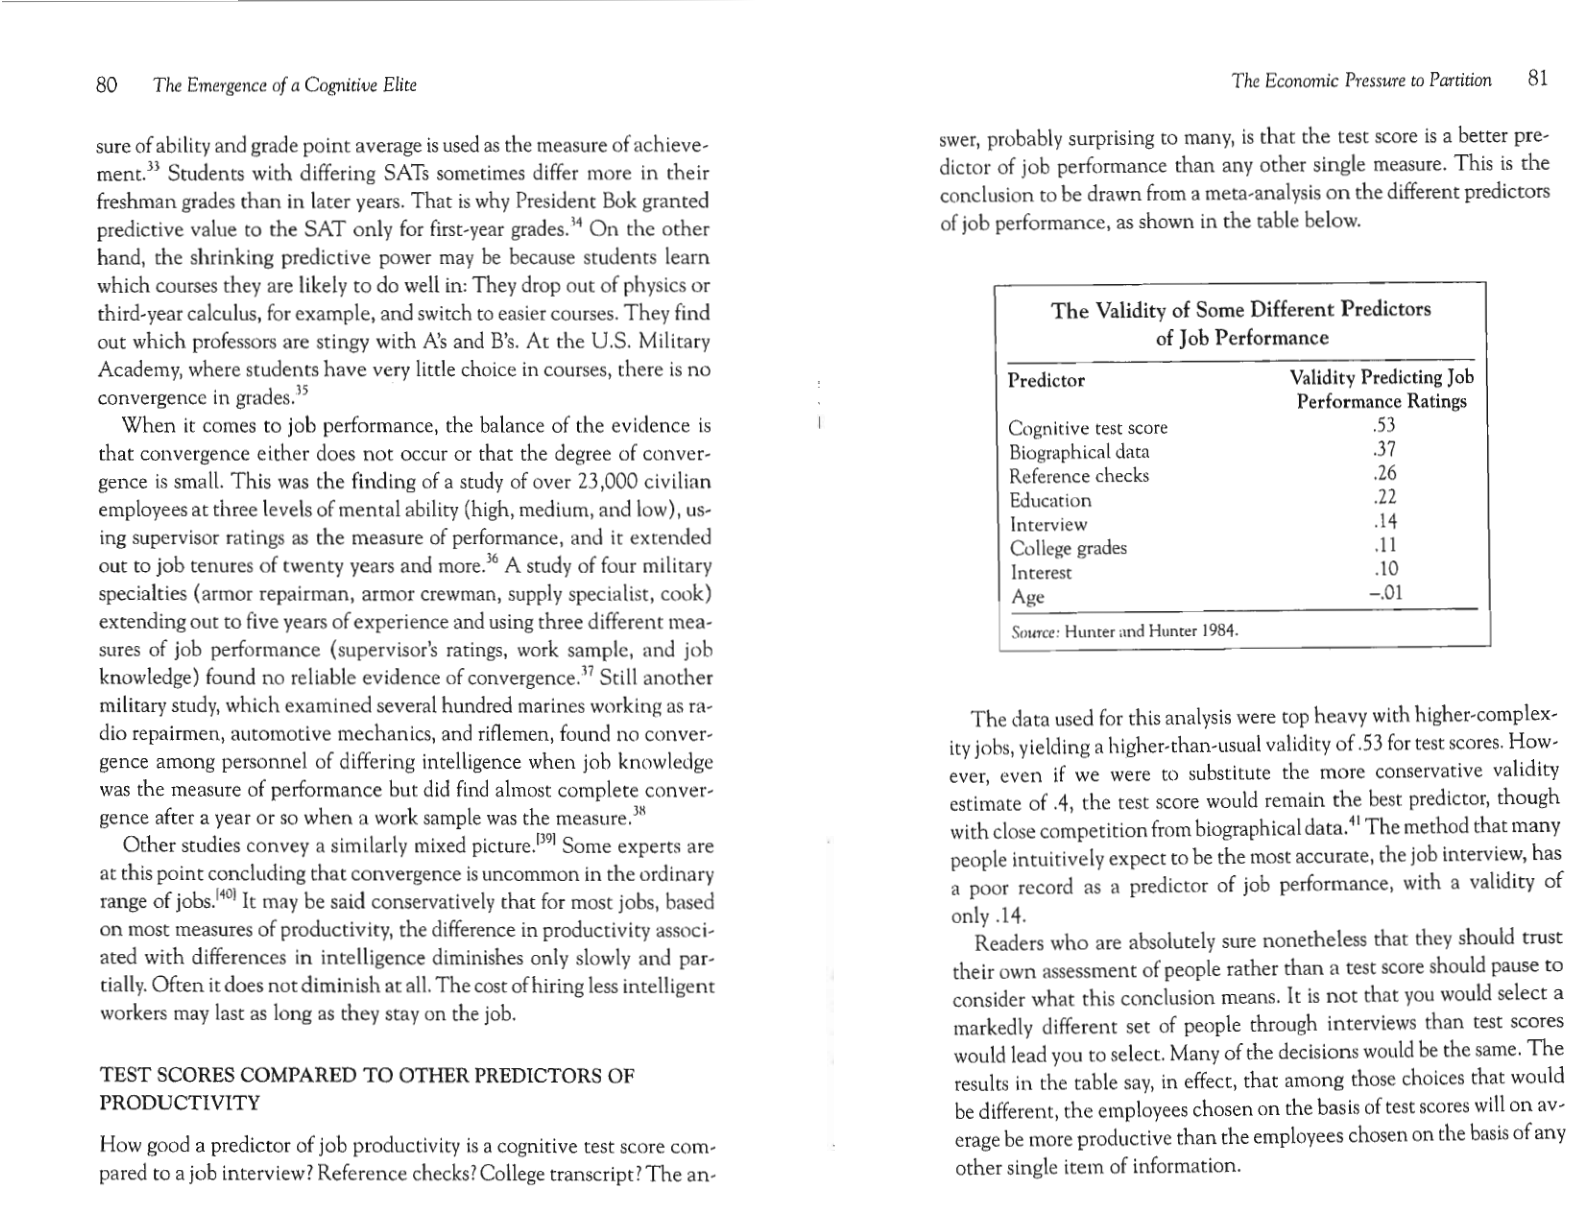
E. E Wonderlic & Associates 1983. The value of a high school transcript
applies mainly to recent high school graduates who have never held a joh,
so that employers can get a sense of whether this person is likely to come
to work every day, on time. But after the first job, it is the job reference
that will count, not what the student did in high school.
62. The purposes of such a program are primarily to put the federal govern-
ment four-square on the side of academic excellence. It would not appre-
ciably increase the number of high-scoring students going to college.
Almost all of them already go. But one positive side effect would he to ease
the financial burden on many middle-class and lower-middle-class parents
who are too rich to qualify for most scholarships and too poor to send their
children to private colleges.
Chapter 19
1. Quotas as such were ruled illegal by the Supreme Court in the famous Bakke
case.
2. Except as otherwise noted, our account is taken from Maguire, 1992.
3. A. Pierce et al., "Degrees of success," Washington Post ,May 8,199 1, p. A3 1.
4. Seven COFHE schools provided data on appl~cants and admitted students,
but not on matriculated students. Those schools were Barnard, Rryn Mawr,
Carleton, Mount Holyoke, Pomona, and Smith. The ethnic differences in
scores of admitted students for these schools were in the same range as the
differences for the schools shown in the figure on page 452. Yale did not
supply any data by ethnicity. Data are taken from Consortium on Financ-
ing Higher Education 1992, Appendix D.
5. "Best Colleges," U.S. News B World Report, Oct. 4, 1993, pp. 107-27.
6. Data for the University of Virginia and University of California at Rerke-
ley are for 1988 and were obtained from Sarich 1990 and L. Feinherg,
"Black freshman enrollment rises 46% at U-Va," Washinnon Post, De-
cember 26, 1988, p. C l .
7. The figures for standard deviations and percentiles are based on the
COFHE schools, omitting Virginia and Berkeley. The COFHE Redbook
provides the SAT scores for the mean, 25th percentile, and 75th percentile
by school. We computed the estimated standard deviation for the com-
bined SATs as follows:
Estimated standard deviation for each test (Verbal and Math): given the
scores for the mean and any percentile, the corresponding SD is given by
(x-m)/z, where x is the score for the percentile, m is the mean, and z is
the standardized score for that percentile in a normal distribution. Two
separate estimates were computed for each school, based on the 25th and
75th percentiles. These two estimates were averaged to reach the esti-
mated standard deviation for each test.
The formula for estimating
--
the standard deviation of combined tests is
JF+i
+ 2 o, +, , where r is the correlation between the two tests
and a represents the standard deviation of the two tests. The correlation
of the verbal and math SATs as administered to the entire SAT popula-
tion is .67 (Donlon 1984, p. 55). The correlation for elite schools is much
smaller. For purposes of this exercise, we err on the conservative side by
continuing to use the correlation of .67. We further err on the safe side
by using the standard deviation for the entire student population, which
is inflated by the very affirmative action admissions that we are analyz-
ing. If instead we were to use the more appropriate baseline measure, the
standard deviation for the white students, the Haward standard devia-
tion (known from unpublished data povided by the Admissions OFfice)
would be 105 instead of 122. For both reasons, the analysis of the gap be-
tween minority and white students in the COFHE data is understated.
To give an idea of the magnitude, our procedure underestimated the
known black-white gap at Harvard by 14 percent.
8. The Berkeley figure for Latinos is an unweighted average of Chicanos and
other Latino means.
9. Scholars who have tried to do work in this area have had a tough time ob-
taining data, up to and including researchers from the Office for Civil
Rights in the Department of Education (Chun and Zalokar 1992, note, p.
108).
10. The Berkeley figure for Latinos is an unweighted average of Chicanos and
other Latino means. For Davis, only a Chicano category is broken out. Vir-
ginia had no figure for Latino students.
11. Chun and Zalokar 1992.
12. Committee on Minority Affairs 1984, p. 2.
13. Chan and Wang 1991; Hsia 1988; Li 1988; Takagi 1990; Bunzel and Au
1987.
Admissions Disparities and Data Gaps
- Statistical analysis suggests that the academic gap between minority and white students in elite university data is often understated due to reporting methodologies.
- Researchers face significant challenges in obtaining transparent admissions data, even when working for federal civil rights offices.
- At certain institutions, the SAT score gap between white and Latino students widened significantly over a ten-year period despite affirmative action efforts.
- Multivariate analysis of medical school admissions shows a dramatic increase in the probability of acceptance for minority applicants compared to white applicants with identical credentials.
- While legacy status provides an admissions advantage, data from Harvard suggests the test score discrepancy for alumni children is minimal compared to racial preferences.
- Comparative studies indicate that a minority student with a 50 percent chance of admission might have only a 5 percent chance if they were white with the same qualifications.
A study of ten medical schools by the Rand Corporation found that a minority student with a 50 percent chance of admission would have had about a 5 percent chance of admission if he were white with the same qualifications.
754
Notes to pages 437-45 1
56. Bishop has developed these arguments in several studies: Bishop 1988b,
1990a, 1990b, 1993a, 199313.
57. Bishop 1993b (p. 20) cites the example of Nationwide Insurance, which
in the single year of 1982 sent out over 1,200 requests for high school tran-
scripts and got 93 responses.
58. Bishop 1988a, 1988b, 1990a, 1993a, 1993b.
59. Bishop 1990b.
60. Ibid.
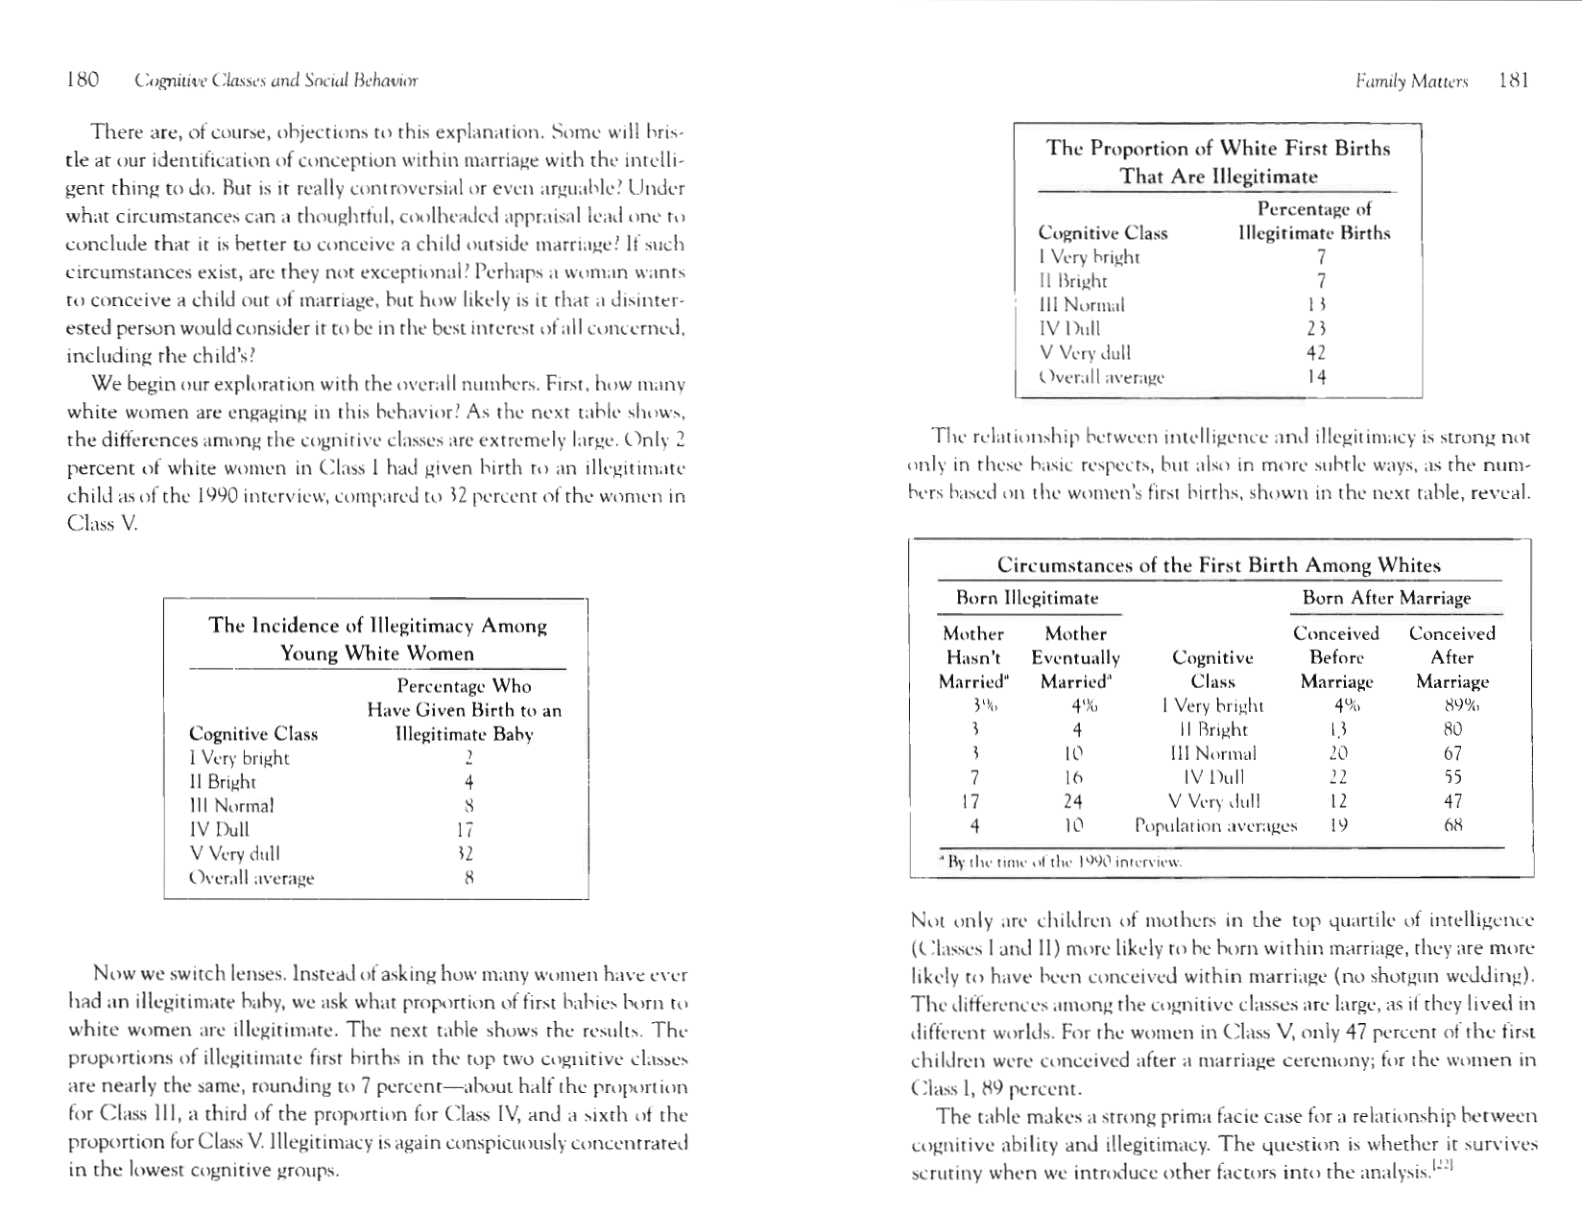
61. The Wonderlic Personnel Test fits this description. For a description, see
E. E Wonderlic & Associates 1983. The value of a high school transcript
applies mainly to recent high school graduates who have never held a joh,
so that employers can get a sense of whether this person is likely to come
to work every day, on time. But after the first job, it is the job reference
that will count, not what the student did in high school.
62. The purposes of such a program are primarily to put the federal govern-
ment four-square on the side of academic excellence. It would not appre-
ciably increase the number of high-scoring students going to college.
Almost all of them already go. But one positive side effect would he to ease
the financial burden on many middle-class and lower-middle-class parents
who are too rich to qualify for most scholarships and too poor to send their
children to private colleges.
Chapter 19
1. Quotas as such were ruled illegal by the Supreme Court in the famous Bakke
case.
2. Except as otherwise noted, our account is taken from Maguire, 1992.
3. A. Pierce et al., "Degrees of success," Washington Post ,May 8,199 1, p. A3 1.
4. Seven COFHE schools provided data on appl~cants and admitted students,
but not on matriculated students. Those schools were Barnard, Rryn Mawr,
Carleton, Mount Holyoke, Pomona, and Smith. The ethnic differences in
scores of admitted students for these schools were in the same range as the
differences for the schools shown in the figure on page 452. Yale did not
supply any data by ethnicity. Data are taken from Consortium on Financ-
ing Higher Education 1992, Appendix D.
5. "Best Colleges," U.S. News B World Report, Oct. 4, 1993, pp. 107-27.
6. Data for the University of Virginia and University of California at Rerke-
ley are for 1988 and were obtained from Sarich 1990 and L. Feinherg,
"Black freshman enrollment rises 46% at U-Va," Washinnon Post, De-
cember 26, 1988, p. C l .
7. The figures for standard deviations and percentiles are based on the
COFHE schools, omitting Virginia and Berkeley. The COFHE Redbook
provides the SAT scores for the mean, 25th percentile, and 75th percentile
by school. We computed the estimated standard deviation for the com-
bined SATs as follows:
Estimated standard deviation for each test (Verbal and Math): given the
scores for the mean and any percentile, the corresponding SD is given by
(x-m)/z, where x is the score for the percentile, m is the mean, and z is
the standardized score for that percentile in a normal distribution. Two
separate estimates were computed for each school, based on the 25th and
75th percentiles. These two estimates were averaged to reach the esti-
mated standard deviation for each test.
The formula for estimating
--
the standard deviation of combined tests is
JF+i
+ 2 o, +, , where r is the correlation between the two tests
and a represents the standard deviation of the two tests. The correlation
of the verbal and math SATs as administered to the entire SAT popula-
tion is .67 (Donlon 1984, p. 55). The correlation for elite schools is much
smaller. For purposes of this exercise, we err on the conservative side by
continuing to use the correlation of .67. We further err on the safe side
by using the standard deviation for the entire student population, which
is inflated by the very affirmative action admissions that we are analyz-
ing. If instead we were to use the more appropriate baseline measure, the
standard deviation for the white students, the Haward standard devia-
tion (known from unpublished data povided by the Admissions OFfice)
would be 105 instead of 122. For both reasons, the analysis of the gap be-
tween minority and white students in the COFHE data is understated.
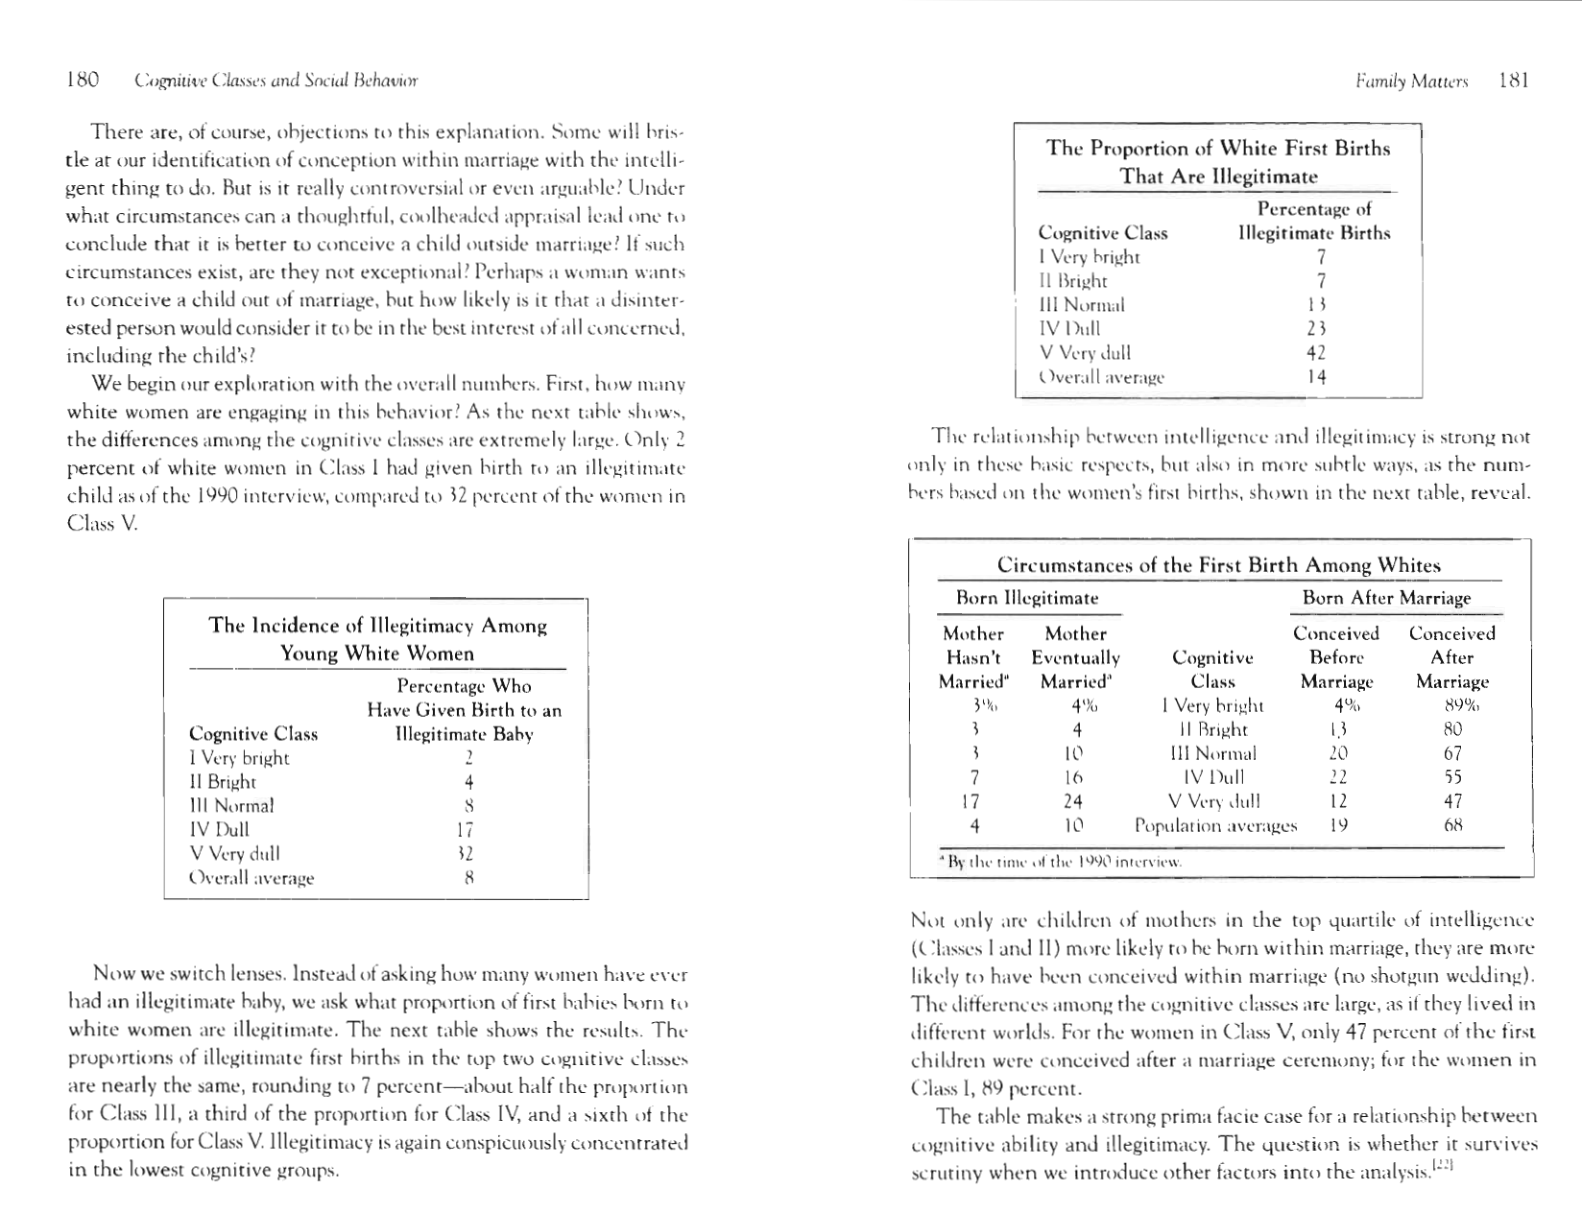
To give an idea of the magnitude, our procedure underestimated the
known black-white gap at Harvard by 14 percent.
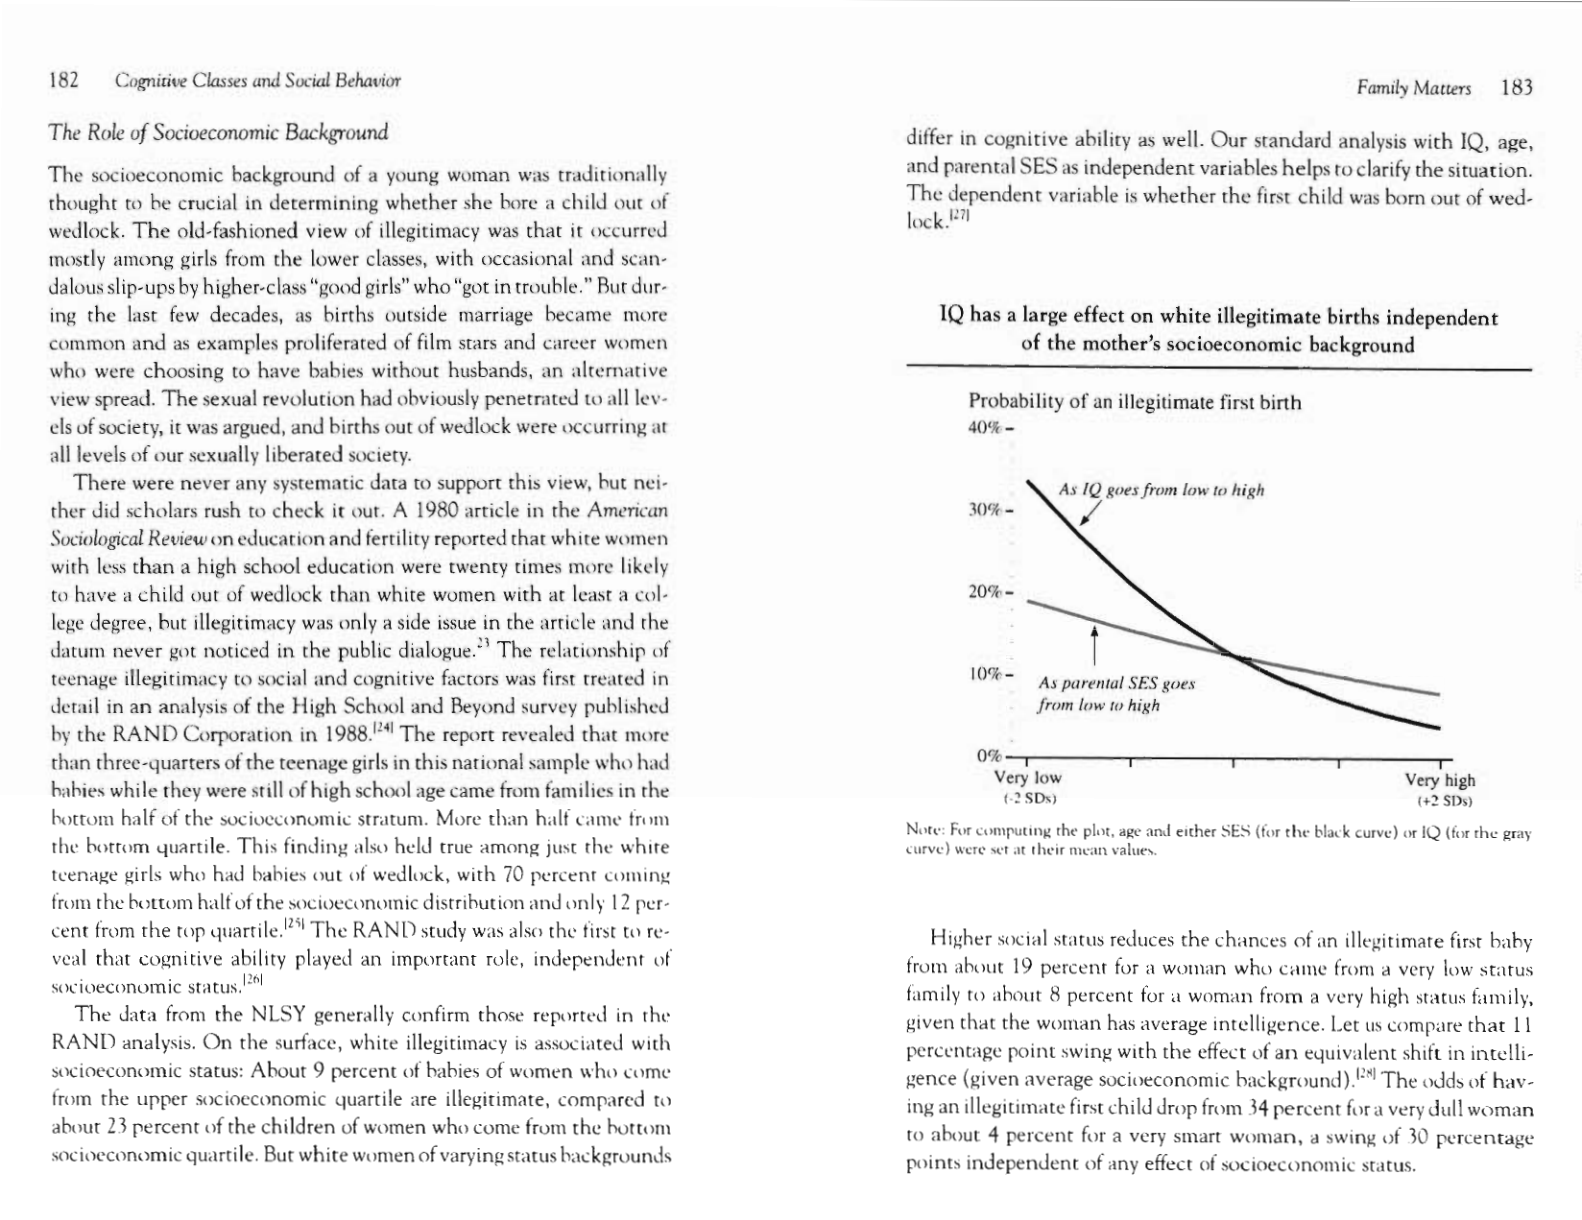
8. The Berkeley figure for Latinos is an unweighted average of Chicanos and
other Latino means.
9. Scholars who have tried to do work in this area have had a tough time ob-
taining data, up to and including researchers from the Office for Civil
Rights in the Department of Education (Chun and Zalokar 1992, note, p.
108).
10. The Berkeley figure for Latinos is an unweighted average of Chicanos and
other Latino means. For Davis, only a Chicano category is broken out. Vir-
ginia had no figure for Latino students.
11. Chun and Zalokar 1992.
12. Committee on Minority Affairs 1984, p. 2.
13. Chan and Wang 1991; Hsia 1988; Li 1988; Takagi 1990; Bunzel and Au
1987.
756
Notes to pages 454-459
Notes to pages 461 4 6 6
757
14. K. Gewertz, "Acceptance rate increases to 76% for class of 1996," Harvard
University Gazette,May 15, 1992, p. 1.
15. F. Butterfield, "Colleges luring black students with incentives," New Yurk
Times, Feb. 28, 1993, p. 1
16. For Chicano and other Latino students at Berkeley, the comparative posi-
tion with whites also got worse. SAT scores did not rise significantly for
Latino students during the 1978-1988 ~eriod, and the net gap increased
from 165 to 254 points for the Chicanos and from 117 points to 2 14 points
for other Latinos.
17. Powers 1977, as reported with supplementary analysis in Klitgaard 1985,
Table A1.6, p. 205.
18. The 12-15 range cuts off the upper 1 1.5 percent, 14.9 percent, and 7.5 per-
cent of matriculants with known MCAT scores for the biological sciences,
physical sciences, and verbal reasoning tests respectively. By way of com-
parison, the top 10 percent in the SAT-Math in 1993 was a little ahove
650; in the SAT-Verbal, in the high 500s.
19. Shea and Fullilove 1985, Table 4, reporting 1979 and 1983 data, indicate
that blacks with MCAT scores in the 5-7 range had approximately twice
the chance of admission of white students. In another glimpse, a multi-
variate analysis of applicants to medical school from among the under-
graduates at two University of California campuses (Berkeley and Davis)
during the last half of the 1970s began with the average white male appli-
cant, who had a 17.8 percent chance of being admitted. Holding other
characteristics constant, being black raised the probability of admission to
94.6 percent. Being an American Indian or Chicano raised the probnhil-
ity to 95.0 percent (Olmstead and Sheffrin, 1980a). An Asian with iden-
tical age and academic credentials had a 25 percent chance of admission,
higher than the white probability but not statistically significantly so.
Williams, Cooper, and Lee 1979 present the odds from the opposite per-
spective: A study of ten medical schools by the Rand Corporation found
that a minority student with a 50 percent chance of admission would have
had about a 5 percent chance of admission if he were white with the same
qualifications.
20. Klitgaard 1985.
21. Proponents of affirmative action commonly cite preference for children of
the alumni and students from distant states as a justification for affirma-
tive action. Given the size of the racial discrepancies we have reported, it
would be useful to have an open comparison of the discrepancies associ-
ated with these other forms of preference. We have found data from only
one school, Harvard, where the legacy of having a Harvard parent con-
tinues to be a plus in the admissions process but small in terms of test scores.
For the decade starting in 1983, the average Verbal score of alumni chil-
dren admitted to Harvard was 674 compared to 687 earned by the adrnit-
ted children of nonalumni; for Math scores, the comparable scores were
695 versus 718, respectively. Office of Civil Rights 1990.
22. Higham 1984. The arguments against admitting Jews were likely to rnen-
tion that gentile families might not send their children to a college with
"too many" Jews (institutional self-interest) or that anti-Semitism would
make it hard for Jewish alumni to use their college education for society's
welfare (social utility).
23. Berger 1987.
24. Lloyd 1990; Peller 1991.
25. The formal explication of this standard is Thorndike 1971. For a discus-
sion of how slippery the notion of "acceptable" performance can be, see
Brown 1980.
26. The comparisons are based on NLSY subjects who went to the same four-
year colleges and universities (again, excluding historically black schools).
Excluding junior colleges eliminates problems of interpretation if different
proportions of different ethnic groups attended junior colleges rather than
four-year institutions. Since the framework for the analysis assumes a mul-
tiracial campus, it seemed appropriate to exclude the 103 NLSY subjects
(all hut 6 of whom were black) who attended historically black institu-
tions. For the record, the mean AFQT score of black students who first at-
tended historically black institutions and blacks who first attended other
four-year institutions were within two IQ points of each other.
27. We used the top and bottom half of socioeconomic status rather than a
more restrictive definition (such as the top and bottom quartile) to give
large enough sample sizes for us to have confidence in the results. When
we used the more restrictive definitions, the results showed admissions de-
cisions that were even farther out of line with the rationale, but with small
samples numbering just 15 pairs for two of the cells. The procedure for the
analysis was as follows: The NLSY includes the FlCE (Federal Interagency
Committee on Education) code for each institution the NLSY subjects at-
tended. This analysis is based on the first such institution attended after
high school. The matching procedure sometimes creates multiple lines for
one member of the pair. For example, suppose that three whites and one
black have attended the same school. One may either enter the black score
three times or eliminate duplicates, entering the black score only once. We
consider that the elimination of duplicates is likely to introduce more er-
ror, on the assumption that the differences among colleges can be large.
Imagine a sample consisting of two schools: an unassuming state teachers'
college, with three whites and three blacks in the NLSY sample, and Yale,
with three whites and one black. The Yale scores are much higher than the
teachers college scores. Eliminating duplicates-entering just one (high)
Admissions Data and Methodology
- Statistical comparisons reveal a significant gap in SAT scores between admitted children of alumni and non-alumni.
- Historical arguments against Jewish admissions were often framed as institutional self-interest or social utility rather than merit.
- The analysis of racial and socioeconomic status in higher education excludes junior colleges and historically black institutions to maintain a consistent multiracial framework.
- Researchers utilized NLSY data and FICE codes to match students within the same four-year institutions to control for institutional effects.
- The study's findings on admissions decisions remained consistent even when varying the definitions of high and low socioeconomic status.
- Methodological choices, such as counting certain subjects multiple times to preserve institutional weighting, did not significantly alter the final results.
The arguments against admitting Jews were likely to mention that gentile families might not send their children to a college with 'too many' Jews (institutional self-interest) or that anti-Semitism would make it hard for Jewish alumni to use their college education for society's welfare (social utility).
756
Notes to pages 454-459
Notes to pages 461 4 6 6
757
14. K. Gewertz, "Acceptance rate increases to 76% for class of 1996," Harvard
University Gazette,May 15, 1992, p. 1.
15. F. Butterfield, "Colleges luring black students with incentives," New Yurk
Times, Feb. 28, 1993, p. 1
16. For Chicano and other Latino students at Berkeley, the comparative posi-
tion with whites also got worse. SAT scores did not rise significantly for
Latino students during the 1978-1988 ~eriod, and the net gap increased
from 165 to 254 points for the Chicanos and from 117 points to 2 14 points
for other Latinos.
17. Powers 1977, as reported with supplementary analysis in Klitgaard 1985,
Table A1.6, p. 205.
18. The 12-15 range cuts off the upper 1 1.5 percent, 14.9 percent, and 7.5 per-
cent of matriculants with known MCAT scores for the biological sciences,
physical sciences, and verbal reasoning tests respectively. By way of com-
parison, the top 10 percent in the SAT-Math in 1993 was a little ahove
650; in the SAT-Verbal, in the high 500s.
19. Shea and Fullilove 1985, Table 4, reporting 1979 and 1983 data, indicate
that blacks with MCAT scores in the 5-7 range had approximately twice
the chance of admission of white students. In another glimpse, a multi-
variate analysis of applicants to medical school from among the under-
graduates at two University of California campuses (Berkeley and Davis)
during the last half of the 1970s began with the average white male appli-
cant, who had a 17.8 percent chance of being admitted. Holding other
characteristics constant, being black raised the probability of admission to
94.6 percent. Being an American Indian or Chicano raised the probnhil-
ity to 95.0 percent (Olmstead and Sheffrin, 1980a). An Asian with iden-
tical age and academic credentials had a 25 percent chance of admission,
higher than the white probability but not statistically significantly so.
Williams, Cooper, and Lee 1979 present the odds from the opposite per-
spective: A study of ten medical schools by the Rand Corporation found
that a minority student with a 50 percent chance of admission would have
had about a 5 percent chance of admission if he were white with the same
qualifications.
20. Klitgaard 1985.
21. Proponents of affirmative action commonly cite preference for children of
the alumni and students from distant states as a justification for affirma-
tive action. Given the size of the racial discrepancies we have reported, it
would be useful to have an open comparison of the discrepancies associ-
ated with these other forms of preference. We have found data from only
one school, Harvard, where the legacy of having a Harvard parent con-
tinues to be a plus in the admissions process but small in terms of test scores.
For the decade starting in 1983, the average Verbal score of alumni chil-
dren admitted to Harvard was 674 compared to 687 earned by the adrnit-
ted children of nonalumni; for Math scores, the comparable scores were
695 versus 718, respectively. Office of Civil Rights 1990.
22. Higham 1984. The arguments against admitting Jews were likely to rnen-
tion that gentile families might not send their children to a college with
"too many" Jews (institutional self-interest) or that anti-Semitism would
make it hard for Jewish alumni to use their college education for society's
welfare (social utility).
23. Berger 1987.
24. Lloyd 1990; Peller 1991.
25. The formal explication of this standard is Thorndike 1971. For a discus-
sion of how slippery the notion of "acceptable" performance can be, see
Brown 1980.
26. The comparisons are based on NLSY subjects who went to the same four-
year colleges and universities (again, excluding historically black schools).
Excluding junior colleges eliminates problems of interpretation if different
proportions of different ethnic groups attended junior colleges rather than
four-year institutions. Since the framework for the analysis assumes a mul-
tiracial campus, it seemed appropriate to exclude the 103 NLSY subjects
(all hut 6 of whom were black) who attended historically black institu-
tions. For the record, the mean AFQT score of black students who first at-
tended historically black institutions and blacks who first attended other
four-year institutions were within two IQ points of each other.
27. We used the top and bottom half of socioeconomic status rather than a
more restrictive definition (such as the top and bottom quartile) to give
large enough sample sizes for us to have confidence in the results. When
we used the more restrictive definitions, the results showed admissions de-
cisions that were even farther out of line with the rationale, but with small
samples numbering just 15 pairs for two of the cells. The procedure for the
analysis was as follows: The NLSY includes the FlCE (Federal Interagency
Committee on Education) code for each institution the NLSY subjects at-
tended. This analysis is based on the first such institution attended after
high school. The matching procedure sometimes creates multiple lines for
one member of the pair. For example, suppose that three whites and one
black have attended the same school. One may either enter the black score
three times or eliminate duplicates, entering the black score only once. We
consider that the elimination of duplicates is likely to introduce more er-
ror, on the assumption that the differences among colleges can be large.
Imagine a sample consisting of two schools: an unassuming state teachers'
college, with three whites and three blacks in the NLSY sample, and Yale,
with three whites and one black. The Yale scores are much higher than the
teachers college scores. Eliminating duplicates-entering just one (high)
758
Notes to pages 466-467
Notes to pages 469475
759
black score for Yale instead of the same score three times-would
defeat
the purpose of matching schools. The figures reported in the text are thus
based on means that have counted some people more than once but con-
trol for institutional effects. The mean used to compute a cell entry is the
intercept of a regression in which the dependent variable is IQ score and
the independent variables are the institutions, coded as a vector of nomi-
nal variables. Note that we also reproduced this analysis eliminating du-
plicates. The results are so similar that the alternative numbers could be
inserted in the text without requiting the change of any of the surround-
ing discussion.
In addition to this form of the analysis, we examined other ways of cut.
ting off low and high socioeconomic status, ranging from the most general,
which divided the deciles into the top and bottom five, to the most ex-
treme, which considered only the top and bottom deciles. For the latter
analyses, we used the entire sample of NLSY students who attended four-
year institutions, to preserve large enough sample sizes to analyze. Those
results were consistent with the ones presented in the text. A positive
weight attached to being black until reaching the most extreme compari-
son, of a white student in the bottom socioeconomic status decile com-
pared to a black student in the top decile, at which point the edge for the
black student fell to close to zero (but never actually reached zero). We fur-
ther examined the results when the sample consisted of NLSY subjects who
had received a bachelor's degree (not just attended a four-year college).
The pattern was identical for both blacks and Latinos, and even the mag-
nitudes of the differences were similar except that, as in other replications,
the gap between the disadvantaged white and disadvantaged black grew
substantially over the one reported in the text.
28. The computation, using IQ scores, was (black mean - white mean)/(SD
of all whites who attended a four-year institution as their first college). In
understanding the way that affirmative action operates, we take it that the
reference point is the white student population, which indeed squares with
most qualitative discussions of the issue, pro and con.
29. Perhaps "low SES" for blacks meant a much worse backgrouncl than "low
SES for whites? Not by much; the means for both groups were close (3 1st
percentile for whites, 25th for blacks), and controlling for the difference
did not appreciably change the story. Nor did it do any good to try to de-
fine "high" and "low" SES more strictly, such as people in the top and hot-
tom quartiles. In that case, the disadvantaged blacks were admitted with
even lower lower scores than disadvantaged whites, in the region of 1.5
standard deviations (depending on the specific form of the analysis)-and
so on through the cells in the table.
30. We use this indirect measure because other more direct measures (e.g., the
number of blacks enrolling in college out of high school, or the number of
persons ages 20 to 2 1 enrolled in school) do not go back to the 1960s and
1950s.
From 1950-1969, data are available only for "blacks and others." Over-
lapping data indicate that the figure for "blacks only" in the early 1970s
was stable at approximately 95 percent of the "'blacks and other" figure.
The data for 1950-69 represent the "blacks and other" numbers multiplied
by .95. If one assumes that the proportion was somewhat higher in the
1950s and early 1960s, this produces a fractional overestimate of the up-
ward black trendline, hut so small as to be visually imperceptible in the
graph on page 469.
31. Carter 1991; D'Souza 1991; Sowell 1989; Sowell 1992; Steele 1991.
32. See, for example, Sarich 1990; Lynch 199 1.
33. For a review of this literature through the 1970s, see Breland 1979. Re-
search since then has not changed the picture. See also Linn 1983; Don-
Ion 1984, pp. 155-159.
34. As in so many matters involving affirmative actlon, this indirect reason-
ing would be unnecessary if colleges and universities were to open their
data on grades to researchers.
35. Altbach and Lomotey 1991; Bunzel 1992; D'Souza 1991.
36. E.g., Carter 1991; Steele 1991.
37. National Center for Education Statistics 1992, Tables 170, 249. In the
NLSY sample, among all students who first entered a four-year nonhlack
university, 27 percent of the whites failed to get a bachelor's degree
compared to 57 percent of the blacks and 55 percent of Latinos. "Dropout"
in the NLSY is defined as having failed to have completed a bachelor's
degree by the 1990 interview, despite having once entered a four-year
college. By that time, the youngest members of the NLSY were 25 years
old.
38. The real discrepancy in dropout rates involved Latinos. Using the same
analysis, the probability that a Latino student with an IQ of 110 would get
a bachelor's degree was only 49 percent. These results are produced when
the analysis is run separately for each race.
39. A. Hu, "Hu's on first," Asian Week, May 12, 1989, p. 7; Consortium on Fi-
nancing Higher Education 1992.
40. A. Hu, "Minorities need more support," The Tech, Mar. 17, 1987, p. 1.
41. Carter 1991; Sowell 1992; Steele 1991; D'Souza 1991; Murray 1984.
42. There should probably also be some contraints on the spread of the abil-
ity distributions in various groups, but such specificity would be out of place
Affirmative Action and Educational Outcomes
- Statistical analysis shows a consistent preference for black and Latino applicants in college admissions across various socioeconomic levels.
- The admissions advantage for black students remains positive even when comparing high-socioeconomic black students to low-socioeconomic white students.
- Data indicates a significant disparity in college completion rates, with black and Latino students dropping out at roughly double the rate of white students.
- The authors note that researchers must rely on indirect reasoning because universities often refuse to release internal data on student grades.
- Adjustments for socioeconomic status (SES) do not significantly alter the observed gap in standardized test scores between admitted groups.
- Long-term trends in black college enrollment since the 1950s were estimated using 'blacks and others' data due to historical reporting limitations.
As in so many matters involving affirmative action, this indirect reasoning would be unnecessary if colleges and universities were to open their data on grades to researchers.
758
Notes to pages 466-467
Notes to pages 469475
759
black score for Yale instead of the same score three times-would
defeat
the purpose of matching schools. The figures reported in the text are thus
based on means that have counted some people more than once but con-
trol for institutional effects. The mean used to compute a cell entry is the
intercept of a regression in which the dependent variable is IQ score and
the independent variables are the institutions, coded as a vector of nomi-
nal variables. Note that we also reproduced this analysis eliminating du-
plicates. The results are so similar that the alternative numbers could be
inserted in the text without requiting the change of any of the surround-
ing discussion.
In addition to this form of the analysis, we examined other ways of cut.
ting off low and high socioeconomic status, ranging from the most general,
which divided the deciles into the top and bottom five, to the most ex-
treme, which considered only the top and bottom deciles. For the latter
analyses, we used the entire sample of NLSY students who attended four-
year institutions, to preserve large enough sample sizes to analyze. Those
results were consistent with the ones presented in the text. A positive
weight attached to being black until reaching the most extreme compari-
son, of a white student in the bottom socioeconomic status decile com-
pared to a black student in the top decile, at which point the edge for the
black student fell to close to zero (but never actually reached zero). We fur-
ther examined the results when the sample consisted of NLSY subjects who
had received a bachelor's degree (not just attended a four-year college).
The pattern was identical for both blacks and Latinos, and even the mag-
nitudes of the differences were similar except that, as in other replications,
the gap between the disadvantaged white and disadvantaged black grew
substantially over the one reported in the text.
28. The computation, using IQ scores, was (black mean - white mean)/(SD
of all whites who attended a four-year institution as their first college). In
understanding the way that affirmative action operates, we take it that the
reference point is the white student population, which indeed squares with
most qualitative discussions of the issue, pro and con.
29. Perhaps "low SES" for blacks meant a much worse backgrouncl than "low
SES for whites? Not by much; the means for both groups were close (3 1st
percentile for whites, 25th for blacks), and controlling for the difference
did not appreciably change the story. Nor did it do any good to try to de-
fine "high" and "low" SES more strictly, such as people in the top and hot-
tom quartiles. In that case, the disadvantaged blacks were admitted with
even lower lower scores than disadvantaged whites, in the region of 1.5
standard deviations (depending on the specific form of the analysis)-and
so on through the cells in the table.
30. We use this indirect measure because other more direct measures (e.g., the
number of blacks enrolling in college out of high school, or the number of
persons ages 20 to 2 1 enrolled in school) do not go back to the 1960s and
1950s.
From 1950-1969, data are available only for "blacks and others." Over-
lapping data indicate that the figure for "blacks only" in the early 1970s
was stable at approximately 95 percent of the "'blacks and other" figure.
The data for 1950-69 represent the "blacks and other" numbers multiplied
by .95. If one assumes that the proportion was somewhat higher in the
1950s and early 1960s, this produces a fractional overestimate of the up-
ward black trendline, hut so small as to be visually imperceptible in the
graph on page 469.
31. Carter 1991; D'Souza 1991; Sowell 1989; Sowell 1992; Steele 1991.
32. See, for example, Sarich 1990; Lynch 199 1.
33. For a review of this literature through the 1970s, see Breland 1979. Re-
search since then has not changed the picture. See also Linn 1983; Don-
Ion 1984, pp. 155-159.
34. As in so many matters involving affirmative actlon, this indirect reason-
ing would be unnecessary if colleges and universities were to open their
data on grades to researchers.
35. Altbach and Lomotey 1991; Bunzel 1992; D'Souza 1991.
36. E.g., Carter 1991; Steele 1991.
37. National Center for Education Statistics 1992, Tables 170, 249. In the
NLSY sample, among all students who first entered a four-year nonhlack
university, 27 percent of the whites failed to get a bachelor's degree
compared to 57 percent of the blacks and 55 percent of Latinos. "Dropout"
in the NLSY is defined as having failed to have completed a bachelor's
degree by the 1990 interview, despite having once entered a four-year
college. By that time, the youngest members of the NLSY were 25 years
old.
38. The real discrepancy in dropout rates involved Latinos. Using the same
analysis, the probability that a Latino student with an IQ of 110 would get
a bachelor's degree was only 49 percent. These results are produced when
the analysis is run separately for each race.
39. A. Hu, "Hu's on first," Asian Week, May 12, 1989, p. 7; Consortium on Fi-
nancing Higher Education 1992.
40. A. Hu, "Minorities need more support," The Tech, Mar. 17, 1987, p. 1.
41. Carter 1991; Sowell 1992; Steele 1991; D'Souza 1991; Murray 1984.
42. There should probably also be some contraints on the spread of the abil-
ity distributions in various groups, but such specificity would be out of place
Legal Nuances of Employment Testing
- The text examines the 80 percent rule in hiring and its statistical significance in small sample sizes.
- It highlights the Supreme Court case Connecticut v. Teal, which ruled that meeting hiring quotas does not excuse tests that produce disparate impact.
- The ruling suggests that hiring based on high test scores can be legally riskier than hiring without testing at all.
- Some scholars argue that testing 'stigmatizes' certain groups by validating assessments where average scores differ by race.
- The data analysis for job categories like professional-technical and clerical requires complex adjustments for historical census classification changes.
Under this ruling, an employer who hires a given number of blacks will be violating the law if the blacks have high ability test scores, but not violating the law if the same number of blacks are hired without recourse to the scores at all.
758
Notes to pages 466-467
Notes to pages 469475
759
black score for Yale instead of the same score three times-would
defeat
the purpose of matching schools. The figures reported in the text are thus
based on means that have counted some people more than once but con-
trol for institutional effects. The mean used to compute a cell entry is the
intercept of a regression in which the dependent variable is IQ score and
the independent variables are the institutions, coded as a vector of nomi-
nal variables. Note that we also reproduced this analysis eliminating du-
plicates. The results are so similar that the alternative numbers could be
inserted in the text without requiting the change of any of the surround-
ing discussion.
In addition to this form of the analysis, we examined other ways of cut.
ting off low and high socioeconomic status, ranging from the most general,
which divided the deciles into the top and bottom five, to the most ex-
treme, which considered only the top and bottom deciles. For the latter
analyses, we used the entire sample of NLSY students who attended four-
year institutions, to preserve large enough sample sizes to analyze. Those
results were consistent with the ones presented in the text. A positive
weight attached to being black until reaching the most extreme compari-
son, of a white student in the bottom socioeconomic status decile com-
pared to a black student in the top decile, at which point the edge for the
black student fell to close to zero (but never actually reached zero). We fur-
ther examined the results when the sample consisted of NLSY subjects who
had received a bachelor's degree (not just attended a four-year college).
The pattern was identical for both blacks and Latinos, and even the mag-
nitudes of the differences were similar except that, as in other replications,
the gap between the disadvantaged white and disadvantaged black grew
substantially over the one reported in the text.
28. The computation, using IQ scores, was (black mean - white mean)/(SD
of all whites who attended a four-year institution as their first college). In
understanding the way that affirmative action operates, we take it that the
reference point is the white student population, which indeed squares with
most qualitative discussions of the issue, pro and con.
29. Perhaps "low SES" for blacks meant a much worse backgrouncl than "low
SES for whites? Not by much; the means for both groups were close (3 1st
percentile for whites, 25th for blacks), and controlling for the difference
did not appreciably change the story. Nor did it do any good to try to de-
fine "high" and "low" SES more strictly, such as people in the top and hot-
tom quartiles. In that case, the disadvantaged blacks were admitted with
even lower lower scores than disadvantaged whites, in the region of 1.5
standard deviations (depending on the specific form of the analysis)-and
so on through the cells in the table.
30. We use this indirect measure because other more direct measures (e.g., the
number of blacks enrolling in college out of high school, or the number of
persons ages 20 to 2 1 enrolled in school) do not go back to the 1960s and
1950s.
From 1950-1969, data are available only for "blacks and others." Over-
lapping data indicate that the figure for "blacks only" in the early 1970s
was stable at approximately 95 percent of the "'blacks and other" figure.
The data for 1950-69 represent the "blacks and other" numbers multiplied
by .95. If one assumes that the proportion was somewhat higher in the
1950s and early 1960s, this produces a fractional overestimate of the up-
ward black trendline, hut so small as to be visually imperceptible in the
graph on page 469.
31. Carter 1991; D'Souza 1991; Sowell 1989; Sowell 1992; Steele 1991.
32. See, for example, Sarich 1990; Lynch 199 1.
33. For a review of this literature through the 1970s, see Breland 1979. Re-
search since then has not changed the picture. See also Linn 1983; Don-
Ion 1984, pp. 155-159.
34. As in so many matters involving affirmative actlon, this indirect reason-
ing would be unnecessary if colleges and universities were to open their
data on grades to researchers.
35. Altbach and Lomotey 1991; Bunzel 1992; D'Souza 1991.
36. E.g., Carter 1991; Steele 1991.
37. National Center for Education Statistics 1992, Tables 170, 249. In the
NLSY sample, among all students who first entered a four-year nonhlack
university, 27 percent of the whites failed to get a bachelor's degree
compared to 57 percent of the blacks and 55 percent of Latinos. "Dropout"
in the NLSY is defined as having failed to have completed a bachelor's
degree by the 1990 interview, despite having once entered a four-year
college. By that time, the youngest members of the NLSY were 25 years
old.
38. The real discrepancy in dropout rates involved Latinos. Using the same
analysis, the probability that a Latino student with an IQ of 110 would get
a bachelor's degree was only 49 percent. These results are produced when
the analysis is run separately for each race.
39. A. Hu, "Hu's on first," Asian Week, May 12, 1989, p. 7; Consortium on Fi-
nancing Higher Education 1992.
40. A. Hu, "Minorities need more support," The Tech, Mar. 17, 1987, p. 1.
41. Carter 1991; Sowell 1992; Steele 1991; D'Souza 1991; Murray 1984.
42. There should probably also be some contraints on the spread of the abil-
ity distributions in various groups, but such specificity would be out of place
760
Notes to pages 482-486
Notes to pages 486-490
761
Chapter 20
1. This statement assumes that the violation of the 80 percent rule is statis-
tically significant. With sufficiently small numbers ofhirees or promotions,
these percentages will fluctuate widely by chance.
2. The Uniform Guidelines are just guidelines, not laws. In one notable 1982
case (Connecticut v. Teal), the Supreme Court ruled that even the practice
of meeting the 80 percent rule by hiring larger numbers of test passers from
the protected than from the unprotected groups still falls short if the test
produces disparate impact. Disparate impact, in and of itself, saicl the Court
in Teal, deprives protected applicants of equal opportunity, even if the dis-
proportionate numbers are corrected at the bottom line. Under this ruling,
an employer who hires a given number of blacks will be violating the law
if the blacks have high ability test scores, but not violating the law if the
same number of blacks are hired without recourse to the scores at all, and
thus are hound to have lower scores on average. This eventu a 1' ~ t y was
lauded by Kelman 1991, who argues (p. 1169) that hiring a larger propor-
tion of test-passing blacks than test-failing blacks "stigmatizes" hlacks he-
cause it implicitly validates a test on which hlacks on average score below
whites. Better, he suggests, not to test at all, tacitly assuming that the test
has no predictive power worth considering. For another view of Teal, see
Epstein 1992.
3. The Hartigan Report is discussed in Chapter 3.
4. E.g., Kelman 1991.
5. Heckman and Payner 1989, p. 138.
6. The categories are based on those defined by the federal government. The
professional-technical category was chosen to represent high-status jobs.
The clerical category was chosen both to represent lower-status skilled johs
and also because, among those categories (others are sales workers and the
craft workers), clerical is the only category that shows a visibly steeper in-
crease after 1959 than before it. Two technical points about the graph on
page 485 are important. First, the job classification system used hy the Cen-
sus Bureau was altered in 1983. Figures for 1983-1990 conform to the clas-
sification system in use from 1959-1982. The professional-technical
category for 1983-1990 consists of the sum of the headings of "professional
specialty," "technical, sales, and administrative support," "accountants and
auditors," and "personnel, training, and labor relations specialists." The
clerical category consists of the sum of "administrative support, including
clerical," and "cashiers." Second, the data in the graph are for blacks only,
corrected for the "blacks and others" enumeration that was used until 1973.
The correction is based on the known ratio of jobs held by the "others" in
"blacks and others" for overlapping data as of 1973. T h ~ s
assumes that the
"others" (mostly Asian) held a constant proportion of clerical and profes-
sional jobs held by "blacks and others" from 1959-1973. If in fact the pro-
portion went down (blacks acquired these jobs disproportionately), then
the pre-1973 line in the graph slightly underestimates the slope of the black
increase. If in fact the proportion went up (the "others" acquired these jobs
disproportionately), then the pre-1973 line in the graph slightly overesti-
mates the slope of the black increase. Note, however, that even as of 1973,
blacks constituted 87.9 percent of the "black and other" population ages
18 and over, compared to 91.9 percent in 1960, so the degree of error is
unltkely to be visually perceptible in the graph. The alternative was to show
"blacks and others" consistently from 1959 into the 1990s, but from a tech-
nical perspective this becomes increasingly inaccurate as the percentage
of "others" increases rapidly in the 1970s and 1980. Visually, graphs pre-
pared under either method show the same story.
7. The main complications are, first, that the affirmatwe action policies
evolved over a period of time, so that the landmark events are not as de-
cisive as they may appear to be (see Appendix 7). Second, laws and regu-
lations often institutionalize changes that were already under way for other
reasons. This seems to be clearly the case with the h~ring of minorities, and
it, too, tends to blunt the impact of the laws and regulations when they
come along. Third, different regions of the country probably reacted to the
laws and regulations differently, thereby diluting their Impact in national
statistics.
8. Donohue and Heckman 1991; Epstein 1990; Freeman 1984; Heckman and
Payner 1989; Heckman and Verkerke 1990; Leonard 1986; Welch 1981.
9. Brown and Erie, 1981 concluded that about 55 percent of the increase in
black managerial, professional, and technical employment from 1960 to
1976 occurred in the public sector.
10. The classic exchange on this topic is Epstein 1992, Chap. 12; Heckman
and Payner 1989.
1 1. The normative 1 standard deviation difference is assumed for this exercise.
The observed difference in the NLSY is larger, hence would only exacer-
bate the conclusion suggested by the graphic on page 485.
12. Obviously, there will be employees who fall outside the range. But insofar
as the tails at both ends are small and roughly equivalent, the calculation
is not much affected. These particular numbers are based on the observed
distribution of NLSY whites in these job categories. For clerical jobs, 90
percent of all white employees had IQs between 85.7 and 122.7, with a
standard deviation of 11.3. For professional and technical jobs, 90 percent
of all white employees had IQs of 98.0 and above, with a standard devia-
tion of 11.8.
Statistical Nuances of Affirmative Action
- The author addresses the technical challenges of categorizing racial demographics in longitudinal data as the 'other' population grew significantly after 1970.
- Affirmative action's impact is difficult to isolate because laws often institutionalized hiring trends that were already occurring naturally.
- Regional differences and the gradual evolution of regulations further dilute the visible impact of affirmative action in national statistics.
- Data suggests a significant portion of black professional growth between 1960 and 1976 was concentrated in the public sector.
- The text uses IQ distribution models to argue that black-white ratios in specific job categories are highly sensitive to how 'eligibility' ranges are defined.
- Conservative statistical assumptions, such as using a wider IQ range, may actually understate the disparities in the pool of eligible candidates for technical roles.
Second, laws and regulations often institutionalize changes that were already under way for other reasons.
760
Notes to pages 482-486
Notes to pages 486-490
761
Chapter 20
1. This statement assumes that the violation of the 80 percent rule is statis-
tically significant. With sufficiently small numbers ofhirees or promotions,
these percentages will fluctuate widely by chance.
2. The Uniform Guidelines are just guidelines, not laws. In one notable 1982
case (Connecticut v. Teal), the Supreme Court ruled that even the practice
of meeting the 80 percent rule by hiring larger numbers of test passers from
the protected than from the unprotected groups still falls short if the test
produces disparate impact. Disparate impact, in and of itself, saicl the Court
in Teal, deprives protected applicants of equal opportunity, even if the dis-
proportionate numbers are corrected at the bottom line. Under this ruling,
an employer who hires a given number of blacks will be violating the law
if the blacks have high ability test scores, but not violating the law if the
same number of blacks are hired without recourse to the scores at all, and
thus are hound to have lower scores on average. This eventu a 1' ~ t y was
lauded by Kelman 1991, who argues (p. 1169) that hiring a larger propor-
tion of test-passing blacks than test-failing blacks "stigmatizes" hlacks he-
cause it implicitly validates a test on which hlacks on average score below
whites. Better, he suggests, not to test at all, tacitly assuming that the test
has no predictive power worth considering. For another view of Teal, see
Epstein 1992.
3. The Hartigan Report is discussed in Chapter 3.
4. E.g., Kelman 1991.
5. Heckman and Payner 1989, p. 138.
6. The categories are based on those defined by the federal government. The
professional-technical category was chosen to represent high-status jobs.
The clerical category was chosen both to represent lower-status skilled johs
and also because, among those categories (others are sales workers and the
craft workers), clerical is the only category that shows a visibly steeper in-
crease after 1959 than before it. Two technical points about the graph on
page 485 are important. First, the job classification system used hy the Cen-
sus Bureau was altered in 1983. Figures for 1983-1990 conform to the clas-
sification system in use from 1959-1982. The professional-technical
category for 1983-1990 consists of the sum of the headings of "professional
specialty," "technical, sales, and administrative support," "accountants and
auditors," and "personnel, training, and labor relations specialists." The
clerical category consists of the sum of "administrative support, including
clerical," and "cashiers." Second, the data in the graph are for blacks only,
corrected for the "blacks and others" enumeration that was used until 1973.
The correction is based on the known ratio of jobs held by the "others" in
"blacks and others" for overlapping data as of 1973. T h ~ s
assumes that the
"others" (mostly Asian) held a constant proportion of clerical and profes-
sional jobs held by "blacks and others" from 1959-1973. If in fact the pro-
portion went down (blacks acquired these jobs disproportionately), then
the pre-1973 line in the graph slightly underestimates the slope of the black
increase. If in fact the proportion went up (the "others" acquired these jobs
disproportionately), then the pre-1973 line in the graph slightly overesti-
mates the slope of the black increase. Note, however, that even as of 1973,
blacks constituted 87.9 percent of the "black and other" population ages
18 and over, compared to 91.9 percent in 1960, so the degree of error is
unltkely to be visually perceptible in the graph. The alternative was to show
"blacks and others" consistently from 1959 into the 1990s, but from a tech-
nical perspective this becomes increasingly inaccurate as the percentage
of "others" increases rapidly in the 1970s and 1980. Visually, graphs pre-
pared under either method show the same story.
7. The main complications are, first, that the affirmatwe action policies
evolved over a period of time, so that the landmark events are not as de-
cisive as they may appear to be (see Appendix 7). Second, laws and regu-
lations often institutionalize changes that were already under way for other
reasons. This seems to be clearly the case with the h~ring of minorities, and
it, too, tends to blunt the impact of the laws and regulations when they
come along. Third, different regions of the country probably reacted to the
laws and regulations differently, thereby diluting their Impact in national
statistics.
8. Donohue and Heckman 1991; Epstein 1990; Freeman 1984; Heckman and
Payner 1989; Heckman and Verkerke 1990; Leonard 1986; Welch 1981.
9. Brown and Erie, 1981 concluded that about 55 percent of the increase in
black managerial, professional, and technical employment from 1960 to
1976 occurred in the public sector.
10. The classic exchange on this topic is Epstein 1992, Chap. 12; Heckman
and Payner 1989.
1 1. The normative 1 standard deviation difference is assumed for this exercise.
The observed difference in the NLSY is larger, hence would only exacer-
bate the conclusion suggested by the graphic on page 485.
12. Obviously, there will be employees who fall outside the range. But insofar
as the tails at both ends are small and roughly equivalent, the calculation
is not much affected. These particular numbers are based on the observed
distribution of NLSY whites in these job categories. For clerical jobs, 90
percent of all white employees had IQs between 85.7 and 122.7, with a
standard deviation of 11.3. For professional and technical jobs, 90 percent
of all white employees had IQs of 98.0 and above, with a standard devia-
tion of 11.8.
Notes to pages 493-501
763
13. The assumptions used for the figure are extremely conservative. Most oh-
viously, the standard deviation of 15 is too high. People within an occu-
pational category will always tend to have a smaller dispersion than the
general population. If we change nothing except reduce the standard de-
viations to 12 for both blacks and whites, in line with the observed stan-
dard deviations in the NLSY, the black-white ratios rise from 1.7
(professional-technical) and 1.6 (clerical) to 2.5 and 1.9 respectively. In
addition, however, the graph on page 490 is conservative in using an IQ
range that encompasses 90 percent of the white workers in an occupational
category. The lower the bottom end of the range is, the more it Jispropor-
tionately inflates the eligible portion of the black population (changes in
the top end of the range are at the tail of the distrihution and add very lit-
tle to the eligible pool). Visualize the hell curve: By lowering the bottom
cutoff for professional-technical professions from 100 to 98 (for example),
everyone in that very fat part of the curve is treated as being just as cligi-
ble for a professional-technical occupation as anyone else--even though,
in reality, they are much less likely than persons with higher 1Qs to get
such jobs. If, for example, we base the range on the IQs that ernhrace 80
percent of the white workers in an occupation-more realistic in many re-
spects-the
black-white ratio in 1990 grows to 2.3 for professional-
technical occupations and 1.8 for clerical. Rut the conclusions still hold
even if we broaden the range still further than in the graph, to ernhrace 95
percent of all people in those occupations. In that case-which
assumes,
implausibly, that all people with IQs higher than 89.8 are equally likely tc\
be hired for technical-professional johs and that all people with IQs he-
tween 82.0 and 130.3 are equally likely to be hired for clerical johs-the
black-white ratio as of 1990 is still greater than 1 in both instances: 1 .,? for
professional-technical, 1.5 for clerical. In short, the differences produced
by altering the assumptions can make substantial differences in the si:e of
the estimates ofdisproportionate hiring, but even assumptions that go well
beyond common sense and the available data do not change the overall
conclusions drawn in the text.
14. The observations using the CPS and the NLSY are not completely inde-
pendent, insofar as we took our estimate of the IQ range for clerical and
professional-technical occupations from the data on NLSY whites. Rut
those parameters did not constrain the results for blacks.
15. The sample in these analyses excluded persons who were still in school in
1990.
16. Jaynes and Williams 1989, Tables 4-1,6-1.
17. Hartigan and Wigdor 1989. See also Chapters 3 and 13.
18. As of 1987, states had such a certification process. See Rudner 1988.
19. Straus and Sawyer 1986.
20. Lerner 1991.
21. In Pennsylvania, with the highest pass rates, the state commissioner of
higher education openly acknowledged that Pennsylvania sought to avoid
lawsuits alleging racial bias in the test by establishing a low cutoff score
that they would subsequently try to raise. See H. Collins, "Minority groups
are still lagging on teacher's exam," Philadelphia Inquirer, Aug. 5, 1989, p.
B1.
22. The answer to the question of how such large differences can show up in
otherwise credentialed teachers is, in effect, the topic of the preceding
chapter, on affirmative action in higher education.
23. If we make the empirically more likely assumption that IQ does have a pos-
itive correlation with the nonintellectual skills, then the people with low
intellectual skills will, on average, also have depressed nonintellectual job
skills.
24. For examples of affirmative action programs in public bureaucracies, see
Lynch 1991, pp. 24-32; Taylor 1992, Chaps. 4,5.
25. Carlson 1993.
26. Carlson 1993, p. 28.
27. Carlson 1993, p. 30.
28. Washington Post, October 24-28, 1993.
29. Delattre 1989; Sechrest and Bums 1992.
30. Among the other stories we have located linking poor worker performance
to hiring under affirmative action requirements are one reporting an in-
crease in collisions and other accidents on the New York public trans-
portation system (K. Foran, "TA lax on Safety," Newsday, Sept. 19, 1990,
p. 5), another describing the rise in criminal behavior among Detroit's po-
lice officers (E. Salholz, "Going After Detroit's rogue cops," Newsweek,
Sept. 5, 1988, p. 37), and one discussing the much higher rate of firings
among Boston's black postal workers, compared to white workers (B.
McAllister, "Researchers say Postal Service tried to block article on fir.
ings," Washington Post, Oct. 17, 1992, p. A3).
31. Silberberg 1985. See also Ford et al. 1986; Kraiger and Ford 1985.
32. Silherherg has his own interesting hypotheses about these differences,
which we do not elaborate here. Nothing in his account is at variance with
our conclusion that affirmative action procedures are exacting a cost in
worker performance.
33. Hacker 1992, p. 25.
34. In fact, that was pecisely the excuse often given by the major leagues for
not hiring blacks.
35. For a detailed statement of this perspective, see Kelman 1991.
36. Quoted in Bolick 1988, p. 49. See also Taylor 1992, p. 126.
37. There is a presumption that if we cannot explain a group difference, it is
Affirmative Action and Performance Costs
- The text argues that even when adjusting statistical assumptions about IQ ranges, black-white hiring ratios in professional and clerical jobs remain disproportionately high.
- State certification processes for teachers have occasionally used low cutoff scores specifically to avoid lawsuits alleging racial bias.
- The authors suggest a positive correlation between IQ and nonintellectual job skills, implying that lower cognitive scores may correlate with lower overall job performance.
- Various case studies are cited to link affirmative action hiring requirements to increased accidents in public transportation and criminal behavior in police forces.
- The text posits that affirmative action procedures in public bureaucracies and the private sector are exacting a measurable cost in worker performance.
- The authors reject the idea that unexplained group differences in performance are solely the result of external societal factors or discrimination.
In Pennsylvania, with the highest pass rates, the state commissioner of higher education openly acknowledged that Pennsylvania sought to avoid lawsuits alleging racial bias in the test by establishing a low cutoff score that they would subsequently try to raise.
Notes to pages 493-501
763
13. The assumptions used for the figure are extremely conservative. Most oh-
viously, the standard deviation of 15 is too high. People within an occu-
pational category will always tend to have a smaller dispersion than the
general population. If we change nothing except reduce the standard de-
viations to 12 for both blacks and whites, in line with the observed stan-
dard deviations in the NLSY, the black-white ratios rise from 1.7
(professional-technical) and 1.6 (clerical) to 2.5 and 1.9 respectively. In
addition, however, the graph on page 490 is conservative in using an IQ
range that encompasses 90 percent of the white workers in an occupational
category. The lower the bottom end of the range is, the more it Jispropor-
tionately inflates the eligible portion of the black population (changes in
the top end of the range are at the tail of the distrihution and add very lit-
tle to the eligible pool). Visualize the hell curve: By lowering the bottom
cutoff for professional-technical professions from 100 to 98 (for example),
everyone in that very fat part of the curve is treated as being just as cligi-
ble for a professional-technical occupation as anyone else--even though,
in reality, they are much less likely than persons with higher 1Qs to get
such jobs. If, for example, we base the range on the IQs that ernhrace 80
percent of the white workers in an occupation-more realistic in many re-
spects-the
black-white ratio in 1990 grows to 2.3 for professional-
technical occupations and 1.8 for clerical. Rut the conclusions still hold
even if we broaden the range still further than in the graph, to ernhrace 95
percent of all people in those occupations. In that case-which
assumes,
implausibly, that all people with IQs higher than 89.8 are equally likely tc\
be hired for technical-professional johs and that all people with IQs he-
tween 82.0 and 130.3 are equally likely to be hired for clerical johs-the
black-white ratio as of 1990 is still greater than 1 in both instances: 1 .,? for
professional-technical, 1.5 for clerical. In short, the differences produced
by altering the assumptions can make substantial differences in the si:e of
the estimates ofdisproportionate hiring, but even assumptions that go well
beyond common sense and the available data do not change the overall
conclusions drawn in the text.
14. The observations using the CPS and the NLSY are not completely inde-
pendent, insofar as we took our estimate of the IQ range for clerical and
professional-technical occupations from the data on NLSY whites. Rut
those parameters did not constrain the results for blacks.
15. The sample in these analyses excluded persons who were still in school in
1990.
16. Jaynes and Williams 1989, Tables 4-1,6-1.
17. Hartigan and Wigdor 1989. See also Chapters 3 and 13.
18. As of 1987, states had such a certification process. See Rudner 1988.
19. Straus and Sawyer 1986.
20. Lerner 1991.
21. In Pennsylvania, with the highest pass rates, the state commissioner of
higher education openly acknowledged that Pennsylvania sought to avoid
lawsuits alleging racial bias in the test by establishing a low cutoff score
that they would subsequently try to raise. See H. Collins, "Minority groups
are still lagging on teacher's exam," Philadelphia Inquirer, Aug. 5, 1989, p.
B1.
22. The answer to the question of how such large differences can show up in
otherwise credentialed teachers is, in effect, the topic of the preceding
chapter, on affirmative action in higher education.
23. If we make the empirically more likely assumption that IQ does have a pos-
itive correlation with the nonintellectual skills, then the people with low
intellectual skills will, on average, also have depressed nonintellectual job
skills.
24. For examples of affirmative action programs in public bureaucracies, see
Lynch 1991, pp. 24-32; Taylor 1992, Chaps. 4,5.
25. Carlson 1993.
26. Carlson 1993, p. 28.
27. Carlson 1993, p. 30.
28. Washington Post, October 24-28, 1993.
29. Delattre 1989; Sechrest and Bums 1992.
30. Among the other stories we have located linking poor worker performance
to hiring under affirmative action requirements are one reporting an in-
crease in collisions and other accidents on the New York public trans-
portation system (K. Foran, "TA lax on Safety," Newsday, Sept. 19, 1990,
p. 5), another describing the rise in criminal behavior among Detroit's po-
lice officers (E. Salholz, "Going After Detroit's rogue cops," Newsweek,
Sept. 5, 1988, p. 37), and one discussing the much higher rate of firings
among Boston's black postal workers, compared to white workers (B.
McAllister, "Researchers say Postal Service tried to block article on fir.
ings," Washington Post, Oct. 17, 1992, p. A3).
31. Silberberg 1985. See also Ford et al. 1986; Kraiger and Ford 1985.
32. Silherherg has his own interesting hypotheses about these differences,
which we do not elaborate here. Nothing in his account is at variance with
our conclusion that affirmative action procedures are exacting a cost in
worker performance.
33. Hacker 1992, p. 25.
34. In fact, that was pecisely the excuse often given by the major leagues for
not hiring blacks.
35. For a detailed statement of this perspective, see Kelman 1991.
36. Quoted in Bolick 1988, p. 49. See also Taylor 1992, p. 126.
37. There is a presumption that if we cannot explain a group difference, it is
Institutional Logic and Affirmative Action
- The text distinguishes between the institutional goals of universities and businesses, arguing that universities may benefit from admitting less academically qualified students while businesses generally do not benefit from hiring less productive workers.
- It critiques the logical fallacy that not knowing a reason for a difference is equivalent to knowing that no valid reason exists.
- The author cites specific examples of civil service testing modifications, such as the New York Sanitation Department's test where nearly all applicants received perfect scores.
- The text references significant statistical gaps in test scores across different demographics, noting that advanced degree holders showed the largest standard deviation differences.
- It discusses the 'Wonderlic' test's sensitivity to language, suggesting that lower scores for Asian immigrants may be due to English being a second language rather than a lack of cognitive ability.
- The section transitions into a discussion on social stratification, referencing the 'Herrnstein syllogism' and the influence of intelligence on class structure.
Not knowing a good reason for a difference is not the same as knowing that there is no good reason.
764
Notes to Pages 50 1-5 12
Notes to pages 5 1 2-525
765
appropriate to assume that there is no good reason for it. This is bad logic.
Not knowing a good reason for a difference is not the same as knowing that
there is no good reason.
38. We understand the argument that, in the long term, and taking the broad-
est possible view, if all businesses were to behave in "socially responsihle"
ways, there would result a better society that would provide a healthy cli-
mate for the businesses themselves. Our argument is somewhat more direct:
Can a university president, thinking realistically about the foreseeable fil-
ture, see that his university will be better qua university by admitting some
students who are academically less qualified than their competitors? Gen-
erally, yes. Can theowner ofa business, thinking realistically ahout the fore-
seeable future, see that his business will be better qua business hy hiring
people who are less productive than their competitors? Generally, no.
39. D. Pitt, "Despite revisions, few blacks passed police sergeant test," New
York Times, January 13, 1989, p. 1.
40. See Taylor 1992, pp. 129-137, for an account of some of the more egre-
gious examples.
41. The largest difference, 1.6 SDs, was for persons with advanced dek~ees. For
Latinos, the gap with whites ranged from .6 to 1 .O SDs.
42. Other approaches for contending with affirmative action constraints have
surfaced. For example, New York's Sanitation Department used a test on
which 23,078 applicants out of 24,000 got perfect scores, and its Fire L)e-
partment used a test with multiple choice questions for which a point of
credit was given if the first choice is correct, a half-point if the second
choice is correct, or a quarter-point if the third choice is correct, thereby
inflating the grades for people who get lots of items wrong (Taylor 1992).
43. Hartigan and Wigdor 1989; Hunter and Hunter 1984.
44. For an account, see Hartigan and Wigdor 1989.
45. E. F. Wonderlic & Associates, 1983, Table 18, p. 25. The scores of Asians
are lower than the national mean (in contrast to results of IQ studies) proh-
ably hecause the Wonderlic, a pencil-and-paper test, is language sensitive
and is widely used for lower-level jobs. It seems likely that suhstantial pro-
portions of Asians who take the Wonderlic are recent immigrants for whom
English is a second and often newly acquired language.
46. Summarized in Lynch 1991. See also Detlefsen 1991.
Chapter 21
1. Kaus 1992. Kaus's analysis runs parallel with our own in many respects-
among other things, in his use of the Hermstein syllogism (Herrnstein
1971, 1973) to think about the stratifying influence of intelligence.
2. The remark appeared in the manuscript of The End of Equality. It is used
here with permission of the author.
3. Quoted in Novak 1992, p. 24.
4. Surveys by the Roper Organization (Roper Reports 92-5), as reported in
American Enterprise (May-June 1993): 86.
5. U.S. Bureau of the Census 1992, Table B-6, 1975.
6. U.S. Bureau of the Census, 1991, Table R.3. All data are based on pretax
income, so the tax reforms of the 1980s are not implicated.
7. Reich 1991.
8. Voting estimated from Jennings 1991, Tables 7, 10, 13.
9. Overall, 19.2 percent of children born to NLSY women from the
mid-1970s through 1990 were horn to unmarried mothers with below-
average IQs. The national illegitimacy ratio grew steadily throughout that
period.
10. "White" includes births to Caucasian Latinos. The National Center for
Health Statistics has provided Latinolnon-Latino breakdowns only since
1986. During that period, the non-Latino white illegitimacy ratio in-
creased from 13.2 percent to 18.0 percent in 1991, the latest figures as we
write.
11. Data refer to poverty in the year prior to birth, and to non-Latino and
Latino whites comhined, to be consistent with the use of "white" in this
discussion. The proportions for nun-Latino white women above and be-
low the poverty line were quite similar, however: 6 percent and 44 percent
respectively.
12. Unpublished detailed tables for Bachu 1993, available from the Rureau of
the Census.
1 3. These continue to be figures for Latino and non-latino whites comhined.
The figures for non-Latino whites may be found in Chapter 8. They are
not so different (because non-Latino whites so dominate the total).
Seventy-two percent of illegitimate children of non-Latino white mothers
in the NLSY had IQs below 100, and 39 percent had 1Qs helow 90.
14. Wilson 1987. For a complementary view, see Massey and Denton 1993.
15. In the NLSY, blacks from the lowest quartile ofsocioeconomic background
had a mean IQ equivalent of 82.
16. For an early statement of this argument, see Murray 1988a.
17. Jencks and Peterson 1991.
18. Chapter 16 discussed some of these efforts with regard to intelligence. For
hroader-ranging assessments, see Murray 1984; Stromsdorfer 1987; Rossi
1987; Glazer 1988.
Scholarly Citations and Social Theory
- The text provides a dense collection of bibliographic notes linking socioeconomic status and IQ to broader political philosophy.
- It references classical thinkers like Hobbes, Locke, and Aristotle to contextualize modern debates on liberty and human nature.
- Statistical data is cited regarding the stagnation of real wages for low-skilled laborers between 1958 and 1991.
- The notes suggest a correlation between cognitive ability and the capacity to navigate increasingly complex legal and social systems.
- A radical policy proposal is mentioned: replacing the entire federal welfare state with a negative income tax as envisioned by Milton Friedman.
And the life of man [would be] solitary, poore, nasty, brutish and short.
764
Notes to Pages 50 1-5 12
Notes to pages 5 1 2-525
765
appropriate to assume that there is no good reason for it. This is bad logic.
Not knowing a good reason for a difference is not the same as knowing that
there is no good reason.
38. We understand the argument that, in the long term, and taking the broad-
est possible view, if all businesses were to behave in "socially responsihle"
ways, there would result a better society that would provide a healthy cli-
mate for the businesses themselves. Our argument is somewhat more direct:
Can a university president, thinking realistically about the foreseeable fil-
ture, see that his university will be better qua university by admitting some
students who are academically less qualified than their competitors? Gen-
erally, yes. Can theowner ofa business, thinking realistically ahout the fore-
seeable future, see that his business will be better qua business hy hiring
people who are less productive than their competitors? Generally, no.
39. D. Pitt, "Despite revisions, few blacks passed police sergeant test," New
York Times, January 13, 1989, p. 1.
40. See Taylor 1992, pp. 129-137, for an account of some of the more egre-
gious examples.
41. The largest difference, 1.6 SDs, was for persons with advanced dek~ees. For
Latinos, the gap with whites ranged from .6 to 1 .O SDs.
42. Other approaches for contending with affirmative action constraints have
surfaced. For example, New York's Sanitation Department used a test on
which 23,078 applicants out of 24,000 got perfect scores, and its Fire L)e-
partment used a test with multiple choice questions for which a point of
credit was given if the first choice is correct, a half-point if the second
choice is correct, or a quarter-point if the third choice is correct, thereby
inflating the grades for people who get lots of items wrong (Taylor 1992).
43. Hartigan and Wigdor 1989; Hunter and Hunter 1984.
44. For an account, see Hartigan and Wigdor 1989.
45. E. F. Wonderlic & Associates, 1983, Table 18, p. 25. The scores of Asians
are lower than the national mean (in contrast to results of IQ studies) proh-
ably hecause the Wonderlic, a pencil-and-paper test, is language sensitive
and is widely used for lower-level jobs. It seems likely that suhstantial pro-
portions of Asians who take the Wonderlic are recent immigrants for whom
English is a second and often newly acquired language.
46. Summarized in Lynch 1991. See also Detlefsen 1991.
Chapter 21
1. Kaus 1992. Kaus's analysis runs parallel with our own in many respects-
among other things, in his use of the Hermstein syllogism (Herrnstein
1971, 1973) to think about the stratifying influence of intelligence.
2. The remark appeared in the manuscript of The End of Equality. It is used
here with permission of the author.
3. Quoted in Novak 1992, p. 24.
4. Surveys by the Roper Organization (Roper Reports 92-5), as reported in
American Enterprise (May-June 1993): 86.
5. U.S. Bureau of the Census 1992, Table B-6, 1975.
6. U.S. Bureau of the Census, 1991, Table R.3. All data are based on pretax
income, so the tax reforms of the 1980s are not implicated.
7. Reich 1991.
8. Voting estimated from Jennings 1991, Tables 7, 10, 13.
9. Overall, 19.2 percent of children born to NLSY women from the
mid-1970s through 1990 were horn to unmarried mothers with below-
average IQs. The national illegitimacy ratio grew steadily throughout that
period.
10. "White" includes births to Caucasian Latinos. The National Center for
Health Statistics has provided Latinolnon-Latino breakdowns only since
1986. During that period, the non-Latino white illegitimacy ratio in-
creased from 13.2 percent to 18.0 percent in 1991, the latest figures as we
write.
11. Data refer to poverty in the year prior to birth, and to non-Latino and
Latino whites comhined, to be consistent with the use of "white" in this
discussion. The proportions for nun-Latino white women above and be-
low the poverty line were quite similar, however: 6 percent and 44 percent
respectively.
12. Unpublished detailed tables for Bachu 1993, available from the Rureau of
the Census.
1 3. These continue to be figures for Latino and non-latino whites comhined.
The figures for non-Latino whites may be found in Chapter 8. They are
not so different (because non-Latino whites so dominate the total).
Seventy-two percent of illegitimate children of non-Latino white mothers
in the NLSY had IQs below 100, and 39 percent had 1Qs helow 90.
14. Wilson 1987. For a complementary view, see Massey and Denton 1993.
15. In the NLSY, blacks from the lowest quartile ofsocioeconomic background
had a mean IQ equivalent of 82.
16. For an early statement of this argument, see Murray 1988a.
17. Jencks and Peterson 1991.
18. Chapter 16 discussed some of these efforts with regard to intelligence. For
hroader-ranging assessments, see Murray 1984; Stromsdorfer 1987; Rossi
1987; Glazer 1988.
766
Notes to pages 527-538
Notes to pages 538-569
767
Chapter 22
1. The phrasing draws from Rawls 1971, pp. 14-15.
2. For discussion of this transformation, see, for example, Brown 1988.
3. Thomas Hobbes postulated an axiom-Hohhes
saw it as literally an ax-
iom, in the mathematical sense-for
governing people with equal rights
to liberty: "That a man be willing, when others are so too . . . to lay down
this right to all things; and be contented with so much liberty against other
men, as he would allow other men against himself." Hohhes 1651, Chap.
14.
4. Hobbes expressed the gloomy prospect of perfect anarchy in the one sen-
tence for which he is best remembered: "And the life of man [would he]
solitary, poore, nasty, brutish and short." Hobbes 1651, Chap. 13.
5. Locke 1689, Second Treatise, sec. 4.
6. Locke 1689 Bk. IV, Chap. XX.
7. See, for example, Wills 1978; Beer 1993.
8. Mayo 1942, pp. 77-78.
9. Costopoulos 1990, p. 50.
10. Costopoulos 1990, p. 47.
1 1. Mayo 1942, p. 78.
12. Costopoulos 1990, p. 47.
13. Quoted in Diamond 1976, p. 16.
14. Costopoulos 1990, p. 48.
15. That fact, comhined with the "irresistihle corruption" that Adams saw as
infecting all political systems, caused him to be deeply pessimistic ahout
the survival of the experiment in human government that he had heen so
instrumental in founding. He sometimes wondered gloomily whether a
hereditary aristocracy on the British model might be necessary to offset the
unrestrained avarice and factiousness of Jefferson's natural aristocracy.
16. Aristotle 1905 ed., p. 207.
17. Hamilton et al. 1787, No. 10.
18. White 1958, p. 122.
19. Huber 1988; Olson 1991.
20. Bureau of Labor Statistics 1982, Table C-23, 1989, Tahle 42.
21. In 1990 dollars in all cases: the annual income of male year-round, full-
time nonfarm, non-mine laborers was $16,843 in 1958. (SAUS 1970, Table
347). The comparable eamings for "handlers, equipment cleaners, helpers,
and laborers" in 1991 was $16,777. U.S. Bureau of the Census, 1992, Tahle
32. The full-time weekly earnings of "lower-skilled labor" in 1920 was $169
in 1990 dollars, or $8,459 for a fifty-week year (U.S. Bureau of the Census
1975, Series D 765.778).
22. For a full presentation of the following argument, see Murray 1988b, Chap.
12.
23. Wilson 1993.
24. It is doubtless harder even for bright people to lead law-abiding lives when
the laws become more complex, but the marginal effects will be smaller on
them than on the less bright.
25. Ellwood 1988.
26. For an accessible discussion of the pros and cons of the EITC, see Kosters
1993. A more ambitious approach that we think deserves consideration
would replace the entire structure of federal transfers to individuals-in-
come supplements, welfare, in-kind benefits, farm subsidies, and even so-
c~al
security-with
a negative income tax of the kind proposed by Milton
Fr~edman In Friedman 1962. Like Friedman, we are attracted to this strat-
egy only if it replaces everything else, a possibility so unlikely that it is hard
to talk about seriously. This does not diminish its potential merit.
Appendix I
1. The figure depicts 250 18-year-old males drawn randomly from the NLSY
sample.
2. Rased on the NLSY subjects, born from 1957 through 1964, as of 1982,
when the youngest was 18 years old, the mean height of contemporary
Americans is a little over 5 feet 7 inches, with a standard deviationof about
4 inches.
3. Rased on the 1983 ETS norm study (Rraun and King 1987) and dropout
rates in the 1980s, we estimate the mean for all 18eyear-olds (including
dropouts) at 325, with an standard deviation of 105. This would indicate
that the 99th centile hegins at a score of 569. The example in the text is
phrased conservatively.
4. The Pearson's r is ,501 in both cases. The number 3,068 refers to males
wlth weight and height data in 1982.
5. For simplicity's sake, we are assuming that the variables can have only lin-
ear relationships with each other.
~
Appendix 2
I
1. The NLSY on CD-ROM disk is available for a nominal fee from the Cen-
ter for Human Resource Research, Ohio State University.
2. Inquiries should be directed to Prof. Richard J. Hemstein, Department of
Psychology, William James Hall, Harvard University, Cambridge, MA
02138, or to Dr. Charles Murray, American Enterprise Institute, 1150 17th
I
St. NW, Washington, DC 20036.
I
Methodological Appendices and Data Sources
- The text provides technical documentation for the National Longitudinal Survey of Youth (NLSY) dataset, including sample sizes and demographic characteristics.
- Statistical norms for height and cognitive test scores among 18-year-old Americans are established using the 1983 ETS study and NLSY subjects.
- The authors explain their decision to exclude 1991 data to maintain the inclusion of a low-income white supplementary sample for longitudinal consistency.
- The AFQT scoring methodology is detailed, including the use of subtests like General Science and Arithmetic Reasoning to extract cognitive factors.
- Psychometric analysis reveals that a single general factor accounts for a significant portion of variance, while minor factors contribute negligibly.
- Contact information for the primary researchers, Richard J. Herrnstein and Charles Murray, is provided for further inquiries regarding the data.
We decided that the advantages of including low-income whites in the analysis outweighed the advantages of an additional year of data.
766
Notes to pages 527-538
Notes to pages 538-569
767
Chapter 22
1. The phrasing draws from Rawls 1971, pp. 14-15.
2. For discussion of this transformation, see, for example, Brown 1988.
3. Thomas Hobbes postulated an axiom-Hohhes
saw it as literally an ax-
iom, in the mathematical sense-for
governing people with equal rights
to liberty: "That a man be willing, when others are so too . . . to lay down
this right to all things; and be contented with so much liberty against other
men, as he would allow other men against himself." Hohhes 1651, Chap.
14.
4. Hobbes expressed the gloomy prospect of perfect anarchy in the one sen-
tence for which he is best remembered: "And the life of man [would he]
solitary, poore, nasty, brutish and short." Hobbes 1651, Chap. 13.
5. Locke 1689, Second Treatise, sec. 4.
6. Locke 1689 Bk. IV, Chap. XX.
7. See, for example, Wills 1978; Beer 1993.
8. Mayo 1942, pp. 77-78.
9. Costopoulos 1990, p. 50.
10. Costopoulos 1990, p. 47.
1 1. Mayo 1942, p. 78.
12. Costopoulos 1990, p. 47.
13. Quoted in Diamond 1976, p. 16.
14. Costopoulos 1990, p. 48.
15. That fact, comhined with the "irresistihle corruption" that Adams saw as
infecting all political systems, caused him to be deeply pessimistic ahout
the survival of the experiment in human government that he had heen so
instrumental in founding. He sometimes wondered gloomily whether a
hereditary aristocracy on the British model might be necessary to offset the
unrestrained avarice and factiousness of Jefferson's natural aristocracy.
16. Aristotle 1905 ed., p. 207.
17. Hamilton et al. 1787, No. 10.
18. White 1958, p. 122.
19. Huber 1988; Olson 1991.
20. Bureau of Labor Statistics 1982, Table C-23, 1989, Tahle 42.
21. In 1990 dollars in all cases: the annual income of male year-round, full-
time nonfarm, non-mine laborers was $16,843 in 1958. (SAUS 1970, Table
347). The comparable eamings for "handlers, equipment cleaners, helpers,
and laborers" in 1991 was $16,777. U.S. Bureau of the Census, 1992, Tahle
32. The full-time weekly earnings of "lower-skilled labor" in 1920 was $169
in 1990 dollars, or $8,459 for a fifty-week year (U.S. Bureau of the Census
1975, Series D 765.778).
22. For a full presentation of the following argument, see Murray 1988b, Chap.
12.
23. Wilson 1993.
24. It is doubtless harder even for bright people to lead law-abiding lives when
the laws become more complex, but the marginal effects will be smaller on
them than on the less bright.
25. Ellwood 1988.
26. For an accessible discussion of the pros and cons of the EITC, see Kosters
1993. A more ambitious approach that we think deserves consideration
would replace the entire structure of federal transfers to individuals-in-
come supplements, welfare, in-kind benefits, farm subsidies, and even so-
c~al
security-with
a negative income tax of the kind proposed by Milton
Fr~edman In Friedman 1962. Like Friedman, we are attracted to this strat-
egy only if it replaces everything else, a possibility so unlikely that it is hard
to talk about seriously. This does not diminish its potential merit.
Appendix I
1. The figure depicts 250 18-year-old males drawn randomly from the NLSY
sample.
2. Rased on the NLSY subjects, born from 1957 through 1964, as of 1982,
when the youngest was 18 years old, the mean height of contemporary
Americans is a little over 5 feet 7 inches, with a standard deviationof about
4 inches.
3. Rased on the 1983 ETS norm study (Rraun and King 1987) and dropout
rates in the 1980s, we estimate the mean for all 18eyear-olds (including
dropouts) at 325, with an standard deviation of 105. This would indicate
that the 99th centile hegins at a score of 569. The example in the text is
phrased conservatively.
4. The Pearson's r is ,501 in both cases. The number 3,068 refers to males
wlth weight and height data in 1982.
5. For simplicity's sake, we are assuming that the variables can have only lin-
ear relationships with each other.
~
Appendix 2
I
1. The NLSY on CD-ROM disk is available for a nominal fee from the Cen-
ter for Human Resource Research, Ohio State University.
2. Inquiries should be directed to Prof. Richard J. Hemstein, Department of
Psychology, William James Hall, Harvard University, Cambridge, MA
02138, or to Dr. Charles Murray, American Enterprise Institute, 1150 17th
I
St. NW, Washington, DC 20036.
I
768
Notes to pages 569-579
Notes to pages 583-59 1
769
3. Data for 1991 had become available in time to be used for the analysis, but
for budgetary reasons, the NLSY had to cut the supplementary sample of
low-income whites as of 1991. We decided that the advantages of includ-
ing low-income whites in the analysis outweighed the advantages of an ad-
ditional year of data.
4. We followed the armed forces' convention of limiting suhtest scores to a
maximum of three standard deviations from the mean. We gratefully
acknowledge the assistance of Dr. Malcolm J. Ree, who led the rev~sion of
the AFQT, in computing the revised scores for the NLSY.
5. This procedure is facilitated by the large sample sizes (at least 1,265 wlth
valid AFQT scores in each birth year, which are as large as the samples
commonly used for national norms m tests such as the WISC and WAIS),
and the fact that the NLSY sample was balanced for ethnic group and gen-
der within birth years.
6. We also experimented with groupings based not on the calendar year, hut
the school year. The differences in centile produced by the two procedures
were never as much as two, so we remained with calendar year as the ha-
sis.
7. See Users Guide 1993, pp. 157-162.
Appendix 3
1. The subtests are General Science (GS), Arithmetic Reasoning (AR),
Work Knowledge (WK), Paragraph Comprehension (PC), Numerical Op-
erations (NO), Coding Speed (CS), Auto/Shop Information (AS), Math-
ematics Knowledge (MK), Mechanical Comprehension (MC), and
Electronics Information (EL). Two subtests (Numerical Operations and
Coding Speed) are highly speeded; the other eight are "power" rather than
speed tests.
2. Ree and Earles 1990a, 1990b, 1991c.
3. We use the term factor in a generic sense. Within psychometrics, terms
like factor and component are used selectively, depending on the particular
method of analysis used to extract the measures.
4. E.g., Could 1981.
5. Jensen 1987a, 1987b; Ree and Earles 1991c; Welsh, Watson, and Ree 1990.
6. To account for literally 100 percent of the variance takes ten factors (he-
cause there are ten subtests), with the final few of them making increas-
ingly negligible contributions. In the case of ASVAR, the final five factors
collectively account for only 10 percent of the total variance in scores.
7. Sperl, Ree and Steuck 1990.
8. Carroll 1988; Jensen 1987a.
9. Ree and Earles, 1990a, 1990b, 1991c.
10. Gordon 1984; Jensen and Figueroa 1975.
11, Note that the General Science subtest and the Electronics Information
subtest are as highly g-loaded as the subtests used in the AFQT. Why not
use them as well! Because they draw on knowledge that is specific to cer-
tain courses that many youths might not have taken, whereas the mathe-
matics and reading subtests require only material that is ordinarily covered
in the courses taken by every student who goes to elementary and sec-
ondary school. Rut this is a good illustration of a phenomenon associated
with IQ tests: People who acquire knowledge about electronics and sci-
ence also tend to have high mathematics and verbal ability.
12. Jensen 1980, Table 6.10.
13. Within a single test, the test score might mean any of several percentile
scores, depending on the age of the student; hence the reason for using per-
centiles. For the analyses in the text, scores were used only if both a test
score and a percentile were recorded. Anomalous scores were discarded as
follows: For the California Test of Mental Maturity, one test score of 700.
For the Otis-Lennon Mental Ability Test, eight cases in which the test
score was under 30 and the percentile was over 70; one case in which the
test score was 176 and the percentile was only 84. For the Henmon-Nel-
son Test of Mental Maturity, one test score of 374. For the Differential
Aptitude Test, sixteen test scores over 100. For the Lorge-Thomdtke In-
telligence Test and the Kuhlmann-Anderson Intelligence Test, w h ~ h
showed uninterpretable scatter plots of test scores against percentiles, cases
were retained if the test score normed according to a mean of 100 and a
standard deviation of 15 was within 10 centiles of the reported percentile
score. The number of eligible scores on the Stanford-Binet and the Wechs-
ler Intelligence Scale for Children (18 and 16, respectively) was too small
to analyze.
14. Jensen 1980, Table 8.5.
15. This list is taken from Jensen 1980, p. 72. Jensen devotes a chapter (Chap.
4) to the distribution of mental ability, which we recommend as an excel-
lent single source for readers who want to pursue this issue.
16. For an exploration of the relationships as of the late 1960s, see Jencks et
al. 1972, Appendix B. For separate studies, see Rutter 1985; Hale, Ray-
mond, and Gajar 1982; Wolfe 1982; Schiff and Lewontin, 1986.
17. Hustn and Tuijnman, 1991. See also Ceci 1991, for a case that schooling
has a greater influence on IQ than has generally been accepted, drawing
heavily on data from earlier decades when the natural variation in school-
ing was large.
Psychometric Validity and Data Methodology
- The AFQT prioritizes mathematics and reading subtests because they cover universal educational material rather than specialized knowledge.
- A strong correlation exists between specialized knowledge acquisition and general verbal and mathematical abilities.
- Rigorous data cleaning was required for historical intelligence tests to resolve anomalies between raw scores and reported percentiles.
- Extensive academic literature consistently finds no inherent bias against minority groups in the predictive validity of standardized tests for education or jobs.
- Schooling is recognized as a significant influence on IQ scores, particularly in historical contexts where educational access varied greatly.
People who acquire knowledge about electronics and science also tend to have high mathematics and verbal ability.
768
Notes to pages 569-579
Notes to pages 583-59 1
769
3. Data for 1991 had become available in time to be used for the analysis, but
for budgetary reasons, the NLSY had to cut the supplementary sample of
low-income whites as of 1991. We decided that the advantages of includ-
ing low-income whites in the analysis outweighed the advantages of an ad-
ditional year of data.
4. We followed the armed forces' convention of limiting suhtest scores to a
maximum of three standard deviations from the mean. We gratefully
acknowledge the assistance of Dr. Malcolm J. Ree, who led the rev~sion of
the AFQT, in computing the revised scores for the NLSY.
5. This procedure is facilitated by the large sample sizes (at least 1,265 wlth
valid AFQT scores in each birth year, which are as large as the samples
commonly used for national norms m tests such as the WISC and WAIS),
and the fact that the NLSY sample was balanced for ethnic group and gen-
der within birth years.
6. We also experimented with groupings based not on the calendar year, hut
the school year. The differences in centile produced by the two procedures
were never as much as two, so we remained with calendar year as the ha-
sis.
7. See Users Guide 1993, pp. 157-162.
Appendix 3
1. The subtests are General Science (GS), Arithmetic Reasoning (AR),
Work Knowledge (WK), Paragraph Comprehension (PC), Numerical Op-
erations (NO), Coding Speed (CS), Auto/Shop Information (AS), Math-
ematics Knowledge (MK), Mechanical Comprehension (MC), and
Electronics Information (EL). Two subtests (Numerical Operations and
Coding Speed) are highly speeded; the other eight are "power" rather than
speed tests.
2. Ree and Earles 1990a, 1990b, 1991c.
3. We use the term factor in a generic sense. Within psychometrics, terms
like factor and component are used selectively, depending on the particular
method of analysis used to extract the measures.
4. E.g., Could 1981.
5. Jensen 1987a, 1987b; Ree and Earles 1991c; Welsh, Watson, and Ree 1990.
6. To account for literally 100 percent of the variance takes ten factors (he-
cause there are ten subtests), with the final few of them making increas-
ingly negligible contributions. In the case of ASVAR, the final five factors
collectively account for only 10 percent of the total variance in scores.
7. Sperl, Ree and Steuck 1990.
8. Carroll 1988; Jensen 1987a.
9. Ree and Earles, 1990a, 1990b, 1991c.
10. Gordon 1984; Jensen and Figueroa 1975.
11, Note that the General Science subtest and the Electronics Information
subtest are as highly g-loaded as the subtests used in the AFQT. Why not
use them as well! Because they draw on knowledge that is specific to cer-
tain courses that many youths might not have taken, whereas the mathe-
matics and reading subtests require only material that is ordinarily covered
in the courses taken by every student who goes to elementary and sec-
ondary school. Rut this is a good illustration of a phenomenon associated
with IQ tests: People who acquire knowledge about electronics and sci-
ence also tend to have high mathematics and verbal ability.
12. Jensen 1980, Table 6.10.
13. Within a single test, the test score might mean any of several percentile
scores, depending on the age of the student; hence the reason for using per-
centiles. For the analyses in the text, scores were used only if both a test
score and a percentile were recorded. Anomalous scores were discarded as
follows: For the California Test of Mental Maturity, one test score of 700.
For the Otis-Lennon Mental Ability Test, eight cases in which the test
score was under 30 and the percentile was over 70; one case in which the
test score was 176 and the percentile was only 84. For the Henmon-Nel-
son Test of Mental Maturity, one test score of 374. For the Differential
Aptitude Test, sixteen test scores over 100. For the Lorge-Thomdtke In-
telligence Test and the Kuhlmann-Anderson Intelligence Test, w h ~ h
showed uninterpretable scatter plots of test scores against percentiles, cases
were retained if the test score normed according to a mean of 100 and a
standard deviation of 15 was within 10 centiles of the reported percentile
score. The number of eligible scores on the Stanford-Binet and the Wechs-
ler Intelligence Scale for Children (18 and 16, respectively) was too small
to analyze.
14. Jensen 1980, Table 8.5.
15. This list is taken from Jensen 1980, p. 72. Jensen devotes a chapter (Chap.
4) to the distribution of mental ability, which we recommend as an excel-
lent single source for readers who want to pursue this issue.
16. For an exploration of the relationships as of the late 1960s, see Jencks et
al. 1972, Appendix B. For separate studies, see Rutter 1985; Hale, Ray-
mond, and Gajar 1982; Wolfe 1982; Schiff and Lewontin, 1986.
17. Hustn and Tuijnman, 1991. See also Ceci 1991, for a case that schooling
has a greater influence on IQ than has generally been accepted, drawing
heavily on data from earlier decades when the natural variation in school-
ing was large.
770
Notes to pages 626-63 1
Notes to pages 63 1-638
77 1
Appendix 5
1. Validity is measured by the correlation between predictor and outcome,
which, multiplied by the ratio of the standard deviations of the outcome
to the predictor, gives the regression coefficient of the outcome on the pre-
dictor. To keep this discussion simple, we assume an increasing monotonic
relationship between the validity and the regression coefficient here. For
a discussion that does not make this simplifying assumption, see Jensen
1980.
2. In the following sources, one can find varying estimates of the magnitude
of pedictive validity of intelligence tests and varying opinions ahout
whether the tests are a net benefit to society, hut they unanimously accept
the conclusion that no bias against blacks in educational or occupational
prediction has been found: Breland, 1979; Crouse and Trusheim 1988; Har-
tigan and Wigdor 1989; Hunter and Schmidt 1990; Jensen 1980; Klitgaard
1985; Reynolds and Brown 1984; Schmidt 1988.
3. For a discussion of the sources of error and their relevance to meta-
analyses of occupational outcomes in particular, see Hunter and Schmidt
1990. For a more general discussion, including educational outcomes, see
Jensen 1980.
4. Jensen 1984h, p. 523.
5. Occasionally, one may find a study that finds differential predictive valid-
ity for one ethnic group or another for a particular test--e.g., the K-ARC
test for Latinos and non-latino whites (Valencia and Rankin 1988). But
even for Latinos, validity ,generalization has generally been confirmed (e.g.,
Reynolds and Gutkin 1980; Valdez and Valdez 1983).
6. Jensen 1980, Table 10.4.
7. Rreland 1979, Table 3b.
8. Ibid.
9. Hartigan and Wigdor 1989, Table 9.5.
10. Ibid.
1 1. The example given here is a special case of a more general phenomenon:
As long as the product of the regression coefficient (which is assumed not
to differ for the groups) and the mean difference between groups in the pre-
dictor is smaller than the mean difference in the outcome, there will be
overprediction for the lower-scoring group.
12. For a review of the literature through the early 1980s, see Jensen 1985, also
discussed in Chapter 13. For studies since then, see Rraden 1989; Jensen
1992, 1993b. The single contrary study extant is Gustafsson 1992.
13. McGurk 1951. Also in 195 1, Kenneth Eells's doctoral thesis at the Uni-
versity ofchicago showed that test item difficulty did not vary much across
white ethnics of different types, thereby failing to support the intuition
that cultural factors are dominant (Eells et al. 1951). See Jensen 1980,
Chap. 1 1, for more on McGurk's and Eells's work and on other early stud-
ies of test item bias.
14. For a review of the literature through the late 1970s, see Jensen 1980,
Chap. 11. For studies since 1980, see Bart et al. 1986; Ross-Reynolds and
Reschly 1983; Sandoval et al. 1983; Jensen and McGi~rk 1987; Cook 1987;
Koh, Abbatiello, and Mcloughlin 1984; Reschly and Ross-Reynolds 1982;
Mishra 1983. All found no item differences, or differences that explained
only a fraction of the differences in group scores. Are there any exceptions?
We identified one such study for blacks (Montie and Fagan 1988), based
on 3-year-olds. There may very well be other studies of similar size (the
sample in Montie and Fagan was 86) that are lurking in the literature, but
we know of no studies using large-scale representative samples that estab-
lish item bias against blacks. Some studies of Latinos have found evidence
of bias, mostly associated with Spanish and English language characteris-
tics. See Valencia and Rankin 1988; Whitworth and Chrisman 1987, Mun-
ford and Munoz 1980. But the factor structure of the test results has
generally been found to be the same for Latino and non-Latinos (e.g., see
Mishra 1981 ).
15. See Jensen 1980, Table 11.12. Also see Miele 1979.
16. Scheuneman 1987.
17. For a literature review, see Jensen 1980, Chap. 12.
18. Dyer 1970.
19. For studies specifically dealing with differential racial effects of coaching
and practice through the late 1970s, see Baughrnan and Dahistrom 1968;
Costello 1970; Dubin, Osburn, and Winick 1969; Jensen 1980. For stud-
ies bearing on the issue since 1980 (but not addressing it as directly as the
earlier ones), see Powers 1987; Terrell and Terrell1983; Johnson and Wal-
lace 1989; Cole 1987.
20. For literature reviews, see Sattler and Gwynne 1982; Jensen 1980.
21. For a literature review, see Jensen 1980, Chap. 12.
22. For a literature review, see Jensen 1980, Chap. 12.
23. Jensen 1980, Chap. 12. See also note 14 regarding item bias for Latinos.
24. Jensen 1980, Chap. 12.
25. Quay 1971, 1972, 1974.
26. Farrell 1983 and the attached responses.
27. Johnson et al. 1984; Frederiksen 1986; Johnson 1988; Kerr et al. 1986;
Madhere 1989; Scheuneman 1987; White et al. 1988
28. Rocket al. 1985 details the changes between the two administrations, con-
cluding that "the cautious position would he that neither administration
had an advantage. A less cautious conclusion is that the 1980 subjects prob-
ably had some small advantage" (p. 18).
Analyzing Test Bias and Validity
- The text reviews extensive literature suggesting that validity generalization for standardized tests is largely confirmed across different ethnic groups, including Latinos and whites.
- Statistical analysis indicates that overprediction for lower-scoring groups occurs when the regression coefficient is consistent but the predictor-outcome mean difference varies.
- Research into test item difficulty suggests that cultural factors are not dominant, as item difficulty remains relatively consistent across different white ethnic backgrounds.
- Large-scale studies generally fail to find significant item bias against Black test-takers, with most differences explaining only a small fraction of score gaps.
- While some studies of Latino populations found bias related to language characteristics, the underlying factor structure of the tests remained consistent with non-Latino results.
- The text cites numerous studies from the 1950s through the 1980s to argue that coaching, practice, and examiner demographics have minimal differential racial effects on scores.
There may very well be other studies of similar size (the sample in Montie and Fagan was 86) that are lurking in the literature, but we know of no studies using large-scale representative samples that establish item bias against blacks.
770
Notes to pages 626-63 1
Notes to pages 63 1-638
77 1
Appendix 5
1. Validity is measured by the correlation between predictor and outcome,
which, multiplied by the ratio of the standard deviations of the outcome
to the predictor, gives the regression coefficient of the outcome on the pre-
dictor. To keep this discussion simple, we assume an increasing monotonic
relationship between the validity and the regression coefficient here. For
a discussion that does not make this simplifying assumption, see Jensen
1980.
2. In the following sources, one can find varying estimates of the magnitude
of pedictive validity of intelligence tests and varying opinions ahout
whether the tests are a net benefit to society, hut they unanimously accept
the conclusion that no bias against blacks in educational or occupational
prediction has been found: Breland, 1979; Crouse and Trusheim 1988; Har-
tigan and Wigdor 1989; Hunter and Schmidt 1990; Jensen 1980; Klitgaard
1985; Reynolds and Brown 1984; Schmidt 1988.
3. For a discussion of the sources of error and their relevance to meta-
analyses of occupational outcomes in particular, see Hunter and Schmidt
1990. For a more general discussion, including educational outcomes, see
Jensen 1980.
4. Jensen 1984h, p. 523.
5. Occasionally, one may find a study that finds differential predictive valid-
ity for one ethnic group or another for a particular test--e.g., the K-ARC
test for Latinos and non-latino whites (Valencia and Rankin 1988). But
even for Latinos, validity ,generalization has generally been confirmed (e.g.,
Reynolds and Gutkin 1980; Valdez and Valdez 1983).
6. Jensen 1980, Table 10.4.
7. Rreland 1979, Table 3b.
8. Ibid.
9. Hartigan and Wigdor 1989, Table 9.5.
10. Ibid.
1 1. The example given here is a special case of a more general phenomenon:
As long as the product of the regression coefficient (which is assumed not
to differ for the groups) and the mean difference between groups in the pre-
dictor is smaller than the mean difference in the outcome, there will be
overprediction for the lower-scoring group.
12. For a review of the literature through the early 1980s, see Jensen 1985, also
discussed in Chapter 13. For studies since then, see Rraden 1989; Jensen
1992, 1993b. The single contrary study extant is Gustafsson 1992.
13. McGurk 1951. Also in 195 1, Kenneth Eells's doctoral thesis at the Uni-
versity ofchicago showed that test item difficulty did not vary much across
white ethnics of different types, thereby failing to support the intuition
that cultural factors are dominant (Eells et al. 1951). See Jensen 1980,
Chap. 1 1, for more on McGurk's and Eells's work and on other early stud-
ies of test item bias.
14. For a review of the literature through the late 1970s, see Jensen 1980,
Chap. 11. For studies since 1980, see Bart et al. 1986; Ross-Reynolds and
Reschly 1983; Sandoval et al. 1983; Jensen and McGi~rk 1987; Cook 1987;
Koh, Abbatiello, and Mcloughlin 1984; Reschly and Ross-Reynolds 1982;
Mishra 1983. All found no item differences, or differences that explained
only a fraction of the differences in group scores. Are there any exceptions?
We identified one such study for blacks (Montie and Fagan 1988), based
on 3-year-olds. There may very well be other studies of similar size (the
sample in Montie and Fagan was 86) that are lurking in the literature, but
we know of no studies using large-scale representative samples that estab-
lish item bias against blacks. Some studies of Latinos have found evidence
of bias, mostly associated with Spanish and English language characteris-
tics. See Valencia and Rankin 1988; Whitworth and Chrisman 1987, Mun-
ford and Munoz 1980. But the factor structure of the test results has
generally been found to be the same for Latino and non-Latinos (e.g., see
Mishra 1981 ).
15. See Jensen 1980, Table 11.12. Also see Miele 1979.
16. Scheuneman 1987.
17. For a literature review, see Jensen 1980, Chap. 12.
18. Dyer 1970.
19. For studies specifically dealing with differential racial effects of coaching
and practice through the late 1970s, see Baughrnan and Dahistrom 1968;
Costello 1970; Dubin, Osburn, and Winick 1969; Jensen 1980. For stud-
ies bearing on the issue since 1980 (but not addressing it as directly as the
earlier ones), see Powers 1987; Terrell and Terrell1983; Johnson and Wal-
lace 1989; Cole 1987.
20. For literature reviews, see Sattler and Gwynne 1982; Jensen 1980.
21. For a literature review, see Jensen 1980, Chap. 12.
22. For a literature review, see Jensen 1980, Chap. 12.
23. Jensen 1980, Chap. 12. See also note 14 regarding item bias for Latinos.
24. Jensen 1980, Chap. 12.
25. Quay 1971, 1972, 1974.
26. Farrell 1983 and the attached responses.
27. Johnson et al. 1984; Frederiksen 1986; Johnson 1988; Kerr et al. 1986;
Madhere 1989; Scheuneman 1987; White et al. 1988
28. Rocket al. 1985 details the changes between the two administrations, con-
cluding that "the cautious position would he that neither administration
had an advantage. A less cautious conclusion is that the 1980 subjects prob-
ably had some small advantage" (p. 18).
7 72
Notes to pages 638-657
Notes to pages 657-663
773
29. Based on the white standard deviation for 1980, the first year that stan-
dard deviations by race were published.
30. Congressional Budget Office, 1986, Fig. E-3.
31. Contrary to popular belief, on the proposition whether brain size is cor-
related with IQ, the evidence strongly favors the pros over the cons,
even after correcting for stature. A sampling of contemporary positions
in this mini-controversy is Cain and Vanderwolf 1990; Gould 1978,
1981; Lynn 1989; Michael 1988; Passingham 1982; Rushton 1990d, in
press; Valen 1974. Brain size is, however, not necessarily wholly determined
by the genes; it could also be associated with nutrition or general health.
32. The Rushton controversy has unfolded in a rapidly expanding scholarly
literature. Some of the papers, pro and con, are Cain and Vanderwolf 1990;
Lynn 1989h; Roberts and Gabor 1990; Rushton 1985,1987, 1988, 1990a,
1990h, 1990c, 1990d, 1991a, 1991b; Rushtonand Rogaen, 1978,1988; Sil-
verman 1990; Weitzmann et al. 1990; Zuckerman and Brody 1988. For fur-
ther substantiation of some of the race differences that Rushton invokes,
see Ellis and Nyborg 1992; Lynn 1990c; Mangold and Powell-Griner 199 1 ;
Rowe, Rodgers, and Meseck-Bushey 1988; Valen 1974.
33. Almost as all encompassing a thesis as Rushton's is Richard Lynn's account
of the evolution of racial differences in intelligence in terms of the ances-
tral migrations of groups of early hominids from the relatively benign en-
vironments of Africa to the harsher and more demanding Eurasian
latitudes (Lynn 1991c), where they branched into the Caucasoids and
Mongoloids. Such theories were not uncommon among anthropologists
and biologists of a generation or two ago (e.~., Darlington 1969). As the
biological outlook on human behavior hecame controversial, this kind of
theorizing has almost vanished. The modem version relies much more on
psychological measurements of contemporary populations than the earlier
version.
Appendix 7
1. For a comprehensive discussion, see Epstein 1992.
2. Any one of these court cases may involve heroic efforts: "Some courts have
expressed concern at the spectacle of trials lasting for weeks, following years
of discovery, and involving a multitude of statistical and other experts and
seemingly endless testimony about the credentials of a single [job] candi-
date." Bartholet 1982, p. 1002.
3. Quoted in Patterson 1989, p. 87.
4. Patterson 1989.
5. Patterson 1989.
6. 401 U. S. 424 (1971 ).
7. Lynch 1991; Murray 1984; Patterson 1989.
8. For a clear account, see Patterson 1989.
9. 401 U.S. 432.
10. Ihid.
11. There is good evidence that the Duke Power Co. had no discriminatory
intent in using the test or the educational credential; it was using the same
criteria at a time when it was frankly pursuing a race-segregationist hiring
policy. This earlier conduct gives credence to its claim that it wanted to
improve its employees' intellectual level.
12. Some legal scholars criticize the Court for not having interpreted the Con-
stitution itself, in the Fourteenth Amendment, as providing protection
agatnst disparate impact (e.g., Tribe 1988).
13. Iron~cally, the particular wording in the relevant part of T~tle VII was an
accommodation to one of the act's most uneasy opponents, Senator John
Tower of Texas, who was concerned that the law not be used in precisely
the manner that, in Griggs, the court ruled that it should be used (Wilson
1972).
14. For an excellent discussion, see Epstein 1992, whose reading of the record
strongly confirms ours. Epstein makes the point that had the Congress
known in 1964 what interpretation the Court was to place on Title VII in
Gnggs, it "would have gone down to thundering defeat" (p. 197). From the
legislative record, that appears to us to be a fair assessment.
15. Quoted in Wilson 1972, pp. 854ff.
16. Quotes attributed to S. Rep. 92-415,92d Cong., 1st sess. 5 (1971), the re-
port of the Senate Committee on Labor and Public Welfare, in Patterson
1989.
17. Wilson 1972.
18. Bartholet 1982, p. 958.
19. 422 U.S. 405 (1975).
20. Our discussion here has drawn on Braun 1992.
21. Courts other than the Supreme Court have imposed on the employer it-
self the burden of seeking less discriminatory alternatives (Patterson,
1989).
22. For references to the relevant government documents, see Patterson 1989.
23. For a similar conclusion, and some detail to back it up, see Potter 1986.
24. 490 U.S. 642 (1989).
25. 490 U.S. 659.
26. Cathcart and Snyderman 1992.
Intelligence, Evolution, and Legal Precedent
- The text asserts that evidence generally supports a correlation between brain size and IQ, even when controlling for physical stature.
- Brain size is noted to be influenced by environmental factors such as nutrition and general health rather than being purely genetic.
- Richard Lynn's evolutionary theory suggests that racial differences in intelligence emerged as hominids migrated from benign African climates to harsher Eurasian environments.
- The document highlights a shift from traditional biological theorizing to modern approaches based on psychological measurements of contemporary populations.
- Legal analysis of Title VII and the Griggs v. Duke Power Co. case reveals a conflict between original legislative intent and judicial interpretation regarding disparate impact.
- Scholars argue that if Congress had anticipated the court's interpretation of employment testing, the Civil Rights Act of 1964 might have faced total defeat.
Some courts have expressed concern at the spectacle of trials lasting for weeks, following years of discovery, and involving a multitude of statistical and other experts and seemingly endless testimony about the credentials of a single [job] candidate.
7 72
Notes to pages 638-657
Notes to pages 657-663
773
29. Based on the white standard deviation for 1980, the first year that stan-
dard deviations by race were published.
30. Congressional Budget Office, 1986, Fig. E-3.
31. Contrary to popular belief, on the proposition whether brain size is cor-
related with IQ, the evidence strongly favors the pros over the cons,
even after correcting for stature. A sampling of contemporary positions
in this mini-controversy is Cain and Vanderwolf 1990; Gould 1978,
1981; Lynn 1989; Michael 1988; Passingham 1982; Rushton 1990d, in
press; Valen 1974. Brain size is, however, not necessarily wholly determined
by the genes; it could also be associated with nutrition or general health.
32. The Rushton controversy has unfolded in a rapidly expanding scholarly
literature. Some of the papers, pro and con, are Cain and Vanderwolf 1990;
Lynn 1989h; Roberts and Gabor 1990; Rushton 1985,1987, 1988, 1990a,
1990h, 1990c, 1990d, 1991a, 1991b; Rushtonand Rogaen, 1978,1988; Sil-
verman 1990; Weitzmann et al. 1990; Zuckerman and Brody 1988. For fur-
ther substantiation of some of the race differences that Rushton invokes,
see Ellis and Nyborg 1992; Lynn 1990c; Mangold and Powell-Griner 199 1 ;
Rowe, Rodgers, and Meseck-Bushey 1988; Valen 1974.
33. Almost as all encompassing a thesis as Rushton's is Richard Lynn's account
of the evolution of racial differences in intelligence in terms of the ances-
tral migrations of groups of early hominids from the relatively benign en-
vironments of Africa to the harsher and more demanding Eurasian
latitudes (Lynn 1991c), where they branched into the Caucasoids and
Mongoloids. Such theories were not uncommon among anthropologists
and biologists of a generation or two ago (e.~., Darlington 1969). As the
biological outlook on human behavior hecame controversial, this kind of
theorizing has almost vanished. The modem version relies much more on
psychological measurements of contemporary populations than the earlier
version.
Appendix 7
1. For a comprehensive discussion, see Epstein 1992.
2. Any one of these court cases may involve heroic efforts: "Some courts have
expressed concern at the spectacle of trials lasting for weeks, following years
of discovery, and involving a multitude of statistical and other experts and
seemingly endless testimony about the credentials of a single [job] candi-
date." Bartholet 1982, p. 1002.
3. Quoted in Patterson 1989, p. 87.
4. Patterson 1989.
5. Patterson 1989.
6. 401 U. S. 424 (1971 ).
7. Lynch 1991; Murray 1984; Patterson 1989.
8. For a clear account, see Patterson 1989.
9. 401 U.S. 432.
10. Ihid.
11. There is good evidence that the Duke Power Co. had no discriminatory
intent in using the test or the educational credential; it was using the same
criteria at a time when it was frankly pursuing a race-segregationist hiring
policy. This earlier conduct gives credence to its claim that it wanted to
improve its employees' intellectual level.
12. Some legal scholars criticize the Court for not having interpreted the Con-
stitution itself, in the Fourteenth Amendment, as providing protection
agatnst disparate impact (e.g., Tribe 1988).
13. Iron~cally, the particular wording in the relevant part of T~tle VII was an
accommodation to one of the act's most uneasy opponents, Senator John
Tower of Texas, who was concerned that the law not be used in precisely
the manner that, in Griggs, the court ruled that it should be used (Wilson
1972).
14. For an excellent discussion, see Epstein 1992, whose reading of the record
strongly confirms ours. Epstein makes the point that had the Congress
known in 1964 what interpretation the Court was to place on Title VII in
Gnggs, it "would have gone down to thundering defeat" (p. 197). From the
legislative record, that appears to us to be a fair assessment.
15. Quoted in Wilson 1972, pp. 854ff.
16. Quotes attributed to S. Rep. 92-415,92d Cong., 1st sess. 5 (1971), the re-
port of the Senate Committee on Labor and Public Welfare, in Patterson
1989.
17. Wilson 1972.
18. Bartholet 1982, p. 958.
19. 422 U.S. 405 (1975).
20. Our discussion here has drawn on Braun 1992.
21. Courts other than the Supreme Court have imposed on the employer it-
self the burden of seeking less discriminatory alternatives (Patterson,
1989).
22. For references to the relevant government documents, see Patterson 1989.
23. For a similar conclusion, and some detail to back it up, see Potter 1986.
24. 490 U.S. 642 (1989).
25. 490 U.S. 659.
26. Cathcart and Snyderman 1992.
Legal Precedents and Academic Bibliography
- The text highlights a legal shift where courts placed the burden on employers to find less discriminatory alternatives in hiring practices.
- A significant portion of the document serves as a bibliography covering diverse topics such as teenage motherhood, racial differences in voter turnout, and skill learning.
- The references include longitudinal studies on intervention programs for low-birthweight infants and the cognitive impacts of dropping out of school.
- The bibliography spans a wide chronological range, citing works from Aristotle's Politics to late 20th-century sociological and psychological research.
- Key themes in the cited literature include the intersection of intelligence, family size, socioeconomic status, and educational attainment.
Courts other than the Supreme Court have imposed on the employer itself the burden of seeking less discriminatory alternatives.
7 72
Notes to pages 638-657
Notes to pages 657-663
773
29. Based on the white standard deviation for 1980, the first year that stan-
dard deviations by race were published.
30. Congressional Budget Office, 1986, Fig. E-3.
31. Contrary to popular belief, on the proposition whether brain size is cor-
related with IQ, the evidence strongly favors the pros over the cons,
even after correcting for stature. A sampling of contemporary positions
in this mini-controversy is Cain and Vanderwolf 1990; Gould 1978,
1981; Lynn 1989; Michael 1988; Passingham 1982; Rushton 1990d, in
press; Valen 1974. Brain size is, however, not necessarily wholly determined
by the genes; it could also be associated with nutrition or general health.
32. The Rushton controversy has unfolded in a rapidly expanding scholarly
literature. Some of the papers, pro and con, are Cain and Vanderwolf 1990;
Lynn 1989h; Roberts and Gabor 1990; Rushton 1985,1987, 1988, 1990a,
1990h, 1990c, 1990d, 1991a, 1991b; Rushtonand Rogaen, 1978,1988; Sil-
verman 1990; Weitzmann et al. 1990; Zuckerman and Brody 1988. For fur-
ther substantiation of some of the race differences that Rushton invokes,
see Ellis and Nyborg 1992; Lynn 1990c; Mangold and Powell-Griner 199 1 ;
Rowe, Rodgers, and Meseck-Bushey 1988; Valen 1974.
33. Almost as all encompassing a thesis as Rushton's is Richard Lynn's account
of the evolution of racial differences in intelligence in terms of the ances-
tral migrations of groups of early hominids from the relatively benign en-
vironments of Africa to the harsher and more demanding Eurasian
latitudes (Lynn 1991c), where they branched into the Caucasoids and
Mongoloids. Such theories were not uncommon among anthropologists
and biologists of a generation or two ago (e.~., Darlington 1969). As the
biological outlook on human behavior hecame controversial, this kind of
theorizing has almost vanished. The modem version relies much more on
psychological measurements of contemporary populations than the earlier
version.
Appendix 7
1. For a comprehensive discussion, see Epstein 1992.
2. Any one of these court cases may involve heroic efforts: "Some courts have
expressed concern at the spectacle of trials lasting for weeks, following years
of discovery, and involving a multitude of statistical and other experts and
seemingly endless testimony about the credentials of a single [job] candi-
date." Bartholet 1982, p. 1002.
3. Quoted in Patterson 1989, p. 87.
4. Patterson 1989.
5. Patterson 1989.
6. 401 U. S. 424 (1971 ).
7. Lynch 1991; Murray 1984; Patterson 1989.
8. For a clear account, see Patterson 1989.
9. 401 U.S. 432.
10. Ihid.
11. There is good evidence that the Duke Power Co. had no discriminatory
intent in using the test or the educational credential; it was using the same
criteria at a time when it was frankly pursuing a race-segregationist hiring
policy. This earlier conduct gives credence to its claim that it wanted to
improve its employees' intellectual level.
12. Some legal scholars criticize the Court for not having interpreted the Con-
stitution itself, in the Fourteenth Amendment, as providing protection
agatnst disparate impact (e.g., Tribe 1988).
13. Iron~cally, the particular wording in the relevant part of T~tle VII was an
accommodation to one of the act's most uneasy opponents, Senator John
Tower of Texas, who was concerned that the law not be used in precisely
the manner that, in Griggs, the court ruled that it should be used (Wilson
1972).
14. For an excellent discussion, see Epstein 1992, whose reading of the record
strongly confirms ours. Epstein makes the point that had the Congress
known in 1964 what interpretation the Court was to place on Title VII in
Gnggs, it "would have gone down to thundering defeat" (p. 197). From the
legislative record, that appears to us to be a fair assessment.
15. Quoted in Wilson 1972, pp. 854ff.
16. Quotes attributed to S. Rep. 92-415,92d Cong., 1st sess. 5 (1971), the re-
port of the Senate Committee on Labor and Public Welfare, in Patterson
1989.
17. Wilson 1972.
18. Bartholet 1982, p. 958.
19. 422 U.S. 405 (1975).
20. Our discussion here has drawn on Braun 1992.
21. Courts other than the Supreme Court have imposed on the employer it-
self the burden of seeking less discriminatory alternatives (Patterson,
1989).
22. For references to the relevant government documents, see Patterson 1989.
23. For a similar conclusion, and some detail to back it up, see Potter 1986.
24. 490 U.S. 642 (1989).
25. 490 U.S. 659.
26. Cathcart and Snyderman 1992.
Bibliography
Ahrahamse, A. F., Morrison, P. A., and Waite, L. J. 1988. Beyond Stereotypes:
Who Becomes a Single Teenage Mother? R-3489-HHS/NICHD. Santa Mon-
ica, Cal.: Rand Corporation.
Abramson, P. R., and Claggett, W. 1991. Racial differences in self-reported and
validated turnout in the 1988 presidential election. J. of Politics 53:186-197.
Achenbach, T. M., Phares, V., Howell, C. T., and Rauh, V. A. 1990. Seven-
year outcome of the Vermont Intervention Program for low-birthweight in-
fants. Child Development 6 1 : 1672-168 1.
Ackerman, P. L. 1987. Individual differences in skill learning: An integration
of psychometric and information processing perspectives. Psychological Bull.
102:3-27.
Adams, M. J. 1986. Odyssey: A Curriculum for Thinking. Watertown, Mass.:
Mastery Education Corporation.
Adams, M. J. 1989. Thinking skills curricula: Their promise and progress. Ed-
ucational Psychologist 24:25-77.
Ahern, F. M., Johnson, R. C., and Cole, R. E. 1983. Generational differences
in spouse similarity in educational attainment. Behavior Genetics 13:95-98.
Alderman, D. L., and Powers, D. E. 1979. The Effects of Special Preparation on
SAT-Verbal Scores. Princeton, N.J.: Educational Testing Service.
Alexander, K. L., Natriello, G., and Pallas, A. M. 1985. For whom the school
bell tolls: The impact of dropping out on cognitive performance. Am. Soci-
ological Rev. 50:409-420.
Althach, P. G., and Lomotey, K. (eds.). 1991. The Racial Crisis in Anwrican
Higher Education. Albany: State University of New York Press.
An, C.-B., Haveman, R., and Wolfe, B. 1990. Teen out-of-wedlock births and
welfare receipt: The role of childhood events and economic circumstances.
Rev. of Economics and Statistics 75:195-208.
Anastasi, A. 1956. Intelligence and family size. Psychological Bull. 53:187-209.
Anderson, E. 1989. Sex codes and family life among poor inner-city youths.
Annals of the Am. Academy of Political and Social Science 501:59-78.
Anderson, J. E. 1936. The Young Child in the Home. White House Conference
on Child Health and Protection. Washington, D.C.: Government Printing
Office.
Andrews, W. J. 1990. Eugenics revisited. Mankind Quarterly 30:235-302.
Angoff, W. H., and Ford, S. F. 1973. Item-race interaction on a test of scholas-
tic aptitude. J. of Educational Measurement 10:95-106.
Bibliography
777
Angrist, J. D., and Krueger, A. B. 1991a. Does compulsory school attendance
affect schooling and earnings? Quarterly J. of Economics 106:979-1014.
Angrist, J. D., and Krueger, A. B. 1991b. Estimating the Payoff to Schooling Us-
ing the Vietnam-Era Draft Lottery. Industrial Relations Section,Working Pa-
per 290. Princeton, N.J.: Princeton University.
Aristotle. Politics. Translated by Benjamin Jowett. 1905 ed. Oxford: Clarendon
Press.
Arrow, K. 1973. Higher education as a filter. J. of Public Economics 2:193-216.
Atkinson, A. B., Maynard, A. K., and Trinder, C. 0.
1983. Parents and Chil-
dren: Incomes in Two Generatiom. London: Heinemann.
Atkinson, R. C. 1974. Teaching children to read using a computer. Am. Psy-
chologist 29: 169-178.
Auster, L. 1990. The Path to National Suicide: An Essay on Immigration and Mul-
ticulturalism. Monterey, Va.: American Immigration Control Foundation.
Azar, S. T., Robinson, D. R., Hekiman, E., and Twentyman, C. T. 1984. Un-
realistic expectations and problem-solving ability in maltreating and com-
parison mothers. J. of Consulting and Clinical Psych. 52:687-69 I.
Bachman, 1. G. 111, Green, S., and Wirtanen, I. D. 1971. Dropping Out-Prob-
lem or Symptom? Youth in Transition, vol. 3. Ann Arbor, Mich.: Institute for
Social Research.
Bachu, A. 1991. Fertility of American Women: June 1990. U.S. Bureau of the
Census. Current Population Report Series P-20, No. 454. Washington,
D.C.: Government Printing Office.
Bachu, A. 1993. Fertility of American Women: June 1992. U.S. Bureau of the
Census. Current Population Report Series P-20, No. 470. Washington,
D.C.: Government Printing Office.
Bajema, C. J. 1963. Estimation of the direction and intensity of natural selec-
tion in relation to human intelligence by means of the intrinsic rate of nat-
ural increase. Eugenics Quarterly 10: 175-187.
Bajema, C. J. 1971. Natural selection and intelligence: The relationship be-
tween intelligence and completed fertility among Third Harvard Growth
Study participants. Am. I. of Physical Anthropobgy 31:273.
Baker, P. C., and Mott, E L. 1989. NLSY Child Handbook 1989. Columbus,
Ohio: Center for Human Resource Research.
Baldwin, J. A., and Oliver, J. E. 1975. Epidemiology and family characteristics
of severely abused children. British J. of Preventive Social Medicine
29:205-22 1.
Bangert-Drowns, R. L. 1986. Review of developments in meta-analytic
method. Psychological Bull. 99:388-399.
Bank, L., Forgatch, M. S., Patterson, G. R., and Fetrow, R. A. 1993. Parenting
practices of single mothers: Mediators of negative contextual factors. j. of
Maniage and the Family 55:371-384.
Bardis, P. D. 1985. Jensen, Spearman's g, and Ghazali's dates: A comment on
interracial peace. Behavioral and Brain Sciences 8:219-220.
Bardouille-Crema, A., Black, K. B., and Martin, H. P. 1986. Performance on
Piagetian tasks of black children of differing socioeconomic levels. Deoel-
opmental Psych. 22:841-44.
Barnes, B. J., and Carr, R. A. 1993. 1991-92 National Decision Profiles. New-
town, Pa.: Law School Admission Services.
Barnes, V., Potter, E. H., and Fiedler,
E. 1983. Effect of interpersonal stress
on the prediction of academic performance. J. of Applied Psych. 68:686-697.
Barnett, W. S. 1985. The Perry Preschool Program and Its Long-Term Effects: A
Benefit-Cost Analysis. Ypsilanti, Mich.: High/Scope Educational Research
Foundation.
Barnett, W. S., and Escobar, C. M. 1987. The economics of early educational
intervention: A review. Rev. ofEducationa1 Research 57:387-414.
Baron, J. 1985. Reliability and g. Behavioral and Brain Sciences 8:220-221.
Barrett, P., Eysenck, H. J., and Lucking, S. 1986. Reaction time and intelli-
gence: A replicated study. Intelligence 10:9-40.
Barro, S. M., and Kolstad, A. 1987. Who Drops Out of High School? Wash-
ington, D.C.: Center for Education Statistics, U.S. Department of Educa-
tion.
Bart, W., et al. 1986. An ordering-analytic approach to the study of group dif-
ferences in intelligence. Educational and Psychological Measurement
46:799-810.
Bartholet, E. 1982. Application ofTitle VII to jobs in high places. Harvard Law
Rev. 95:945-1027.
Raughman, E. E., and Dahlstrom, W. G. 1968. Negro and White Children: A Psy-
chological Study in the Rural South. New York: Academic Press.
Beck, A. J., and Shipley, B. E. 1989. Recidivism of Prisoners Released in 1983. Bu-
reau of Justice Statistics Special Report NCJ-116261. Washington, D.C.:
U.S. Department of Justice.
Becker, B. E., and Huselid, M. A. 1992. Direct estimates of SD, and the im-
plications for utility analysis. 1. of Applied Psych. 77:227-233.
Becker, B. J. 1990. Coaching for the Scholastic Aptitude Test: Further synthesis
and appraisal. Rev. of Educational Research 60:373-417.
Becker, G. S. 1981. A Treatise on the Family. Cambridge, Mass.: Harvard Uni-
versity Press.
Beer, S. H. 1993. To Make a Nation: The Rediscovery of American Federalism.
Cambridge, Mass.: Harvard University Press.
Bejar, I. I., and Blew, E. 0.1981. Grade inflation and the validity of the Scholas-
tic Aptitude Test. Am. Educational Research Journal 18:143.
Relmont, L., and Marolla, E A. 1973. Birth order, family size, and intelligence.
Science 182:1096-1101.
Scholarly References on Social Dynamics
- The bibliography lists extensive research on the correlation between intelligence, fertility rates, and natural selection.
- Several entries focus on the socioeconomic and developmental outcomes of children, including those in the Perry Preschool Program.
- The text includes citations regarding the psychological and academic performance of different racial and socioeconomic groups.
- Legal and institutional factors are addressed through references to high-level job applications and law school admission profiles.
- Methodological developments in meta-analysis and psychological measurement are documented through various academic journals.
- The collection covers diverse social issues ranging from high school dropout rates to the recidivism of released prisoners.
Bajema, C. J. 1963. Estimation of the direction and intensity of natural selection in relation to human intelligence by means of the intrinsic rate of natural increase.
Bibliography
777
Angrist, J. D., and Krueger, A. B. 1991a. Does compulsory school attendance
affect schooling and earnings? Quarterly J. of Economics 106:979-1014.
Angrist, J. D., and Krueger, A. B. 1991b. Estimating the Payoff to Schooling Us-
ing the Vietnam-Era Draft Lottery. Industrial Relations Section,Working Pa-
per 290. Princeton, N.J.: Princeton University.
Aristotle. Politics. Translated by Benjamin Jowett. 1905 ed. Oxford: Clarendon
Press.
Arrow, K. 1973. Higher education as a filter. J. of Public Economics 2:193-216.
Atkinson, A. B., Maynard, A. K., and Trinder, C. 0.
1983. Parents and Chil-
dren: Incomes in Two Generatiom. London: Heinemann.
Atkinson, R. C. 1974. Teaching children to read using a computer. Am. Psy-
chologist 29: 169-178.
Auster, L. 1990. The Path to National Suicide: An Essay on Immigration and Mul-
ticulturalism. Monterey, Va.: American Immigration Control Foundation.
Azar, S. T., Robinson, D. R., Hekiman, E., and Twentyman, C. T. 1984. Un-
realistic expectations and problem-solving ability in maltreating and com-
parison mothers. J. of Consulting and Clinical Psych. 52:687-69 I.
Bachman, 1. G. 111, Green, S., and Wirtanen, I. D. 1971. Dropping Out-Prob-
lem or Symptom? Youth in Transition, vol. 3. Ann Arbor, Mich.: Institute for
Social Research.
Bachu, A. 1991. Fertility of American Women: June 1990. U.S. Bureau of the
Census. Current Population Report Series P-20, No. 454. Washington,
D.C.: Government Printing Office.
Bachu, A. 1993. Fertility of American Women: June 1992. U.S. Bureau of the
Census. Current Population Report Series P-20, No. 470. Washington,
D.C.: Government Printing Office.
Bajema, C. J. 1963. Estimation of the direction and intensity of natural selec-
tion in relation to human intelligence by means of the intrinsic rate of nat-
ural increase. Eugenics Quarterly 10: 175-187.
Bajema, C. J. 1971. Natural selection and intelligence: The relationship be-
tween intelligence and completed fertility among Third Harvard Growth
Study participants. Am. I. of Physical Anthropobgy 31:273.
Baker, P. C., and Mott, E L. 1989. NLSY Child Handbook 1989. Columbus,
Ohio: Center for Human Resource Research.
Baldwin, J. A., and Oliver, J. E. 1975. Epidemiology and family characteristics
of severely abused children. British J. of Preventive Social Medicine
29:205-22 1.
Bangert-Drowns, R. L. 1986. Review of developments in meta-analytic
method. Psychological Bull. 99:388-399.
Bank, L., Forgatch, M. S., Patterson, G. R., and Fetrow, R. A. 1993. Parenting
practices of single mothers: Mediators of negative contextual factors. j. of
Maniage and the Family 55:371-384.
Bardis, P. D. 1985. Jensen, Spearman's g, and Ghazali's dates: A comment on
interracial peace. Behavioral and Brain Sciences 8:219-220.
Bardouille-Crema, A., Black, K. B., and Martin, H. P. 1986. Performance on
Piagetian tasks of black children of differing socioeconomic levels. Deoel-
opmental Psych. 22:841-44.
Barnes, B. J., and Carr, R. A. 1993. 1991-92 National Decision Profiles. New-
town, Pa.: Law School Admission Services.
Barnes, V., Potter, E. H., and Fiedler,
E. 1983. Effect of interpersonal stress
on the prediction of academic performance. J. of Applied Psych. 68:686-697.
Barnett, W. S. 1985. The Perry Preschool Program and Its Long-Term Effects: A
Benefit-Cost Analysis. Ypsilanti, Mich.: High/Scope Educational Research
Foundation.
Barnett, W. S., and Escobar, C. M. 1987. The economics of early educational
intervention: A review. Rev. ofEducationa1 Research 57:387-414.
Baron, J. 1985. Reliability and g. Behavioral and Brain Sciences 8:220-221.
Barrett, P., Eysenck, H. J., and Lucking, S. 1986. Reaction time and intelli-
gence: A replicated study. Intelligence 10:9-40.
Barro, S. M., and Kolstad, A. 1987. Who Drops Out of High School? Wash-
ington, D.C.: Center for Education Statistics, U.S. Department of Educa-
tion.
Bart, W., et al. 1986. An ordering-analytic approach to the study of group dif-
ferences in intelligence. Educational and Psychological Measurement
46:799-810.
Bartholet, E. 1982. Application ofTitle VII to jobs in high places. Harvard Law
Rev. 95:945-1027.
Raughman, E. E., and Dahlstrom, W. G. 1968. Negro and White Children: A Psy-
chological Study in the Rural South. New York: Academic Press.
Beck, A. J., and Shipley, B. E. 1989. Recidivism of Prisoners Released in 1983. Bu-
reau of Justice Statistics Special Report NCJ-116261. Washington, D.C.:
U.S. Department of Justice.
Becker, B. E., and Huselid, M. A. 1992. Direct estimates of SD, and the im-
plications for utility analysis. 1. of Applied Psych. 77:227-233.
Becker, B. J. 1990. Coaching for the Scholastic Aptitude Test: Further synthesis
and appraisal. Rev. of Educational Research 60:373-417.
Becker, G. S. 1981. A Treatise on the Family. Cambridge, Mass.: Harvard Uni-
versity Press.
Beer, S. H. 1993. To Make a Nation: The Rediscovery of American Federalism.
Cambridge, Mass.: Harvard University Press.
Bejar, I. I., and Blew, E. 0.1981. Grade inflation and the validity of the Scholas-
tic Aptitude Test. Am. Educational Research Journal 18:143.
Relmont, L., and Marolla, E A. 1973. Birth order, family size, and intelligence.
Science 182:1096-1101.
Academic Bibliography of Social Research
- This section provides a comprehensive list of academic references spanning sociology, education, and economics.
- Key themes include the relationship between family structure, birth order, and intellectual development.
- Several citations address the validity of standardized testing and the phenomenon of grade inflation.
- The list includes significant research on racial disparities in marriage patterns and economic well-being.
- A notable focus is placed on the impact of vocational education and the decline of test scores on national productivity.
Is the test score decline responsible for the productivity growth decline?
Bibliography
777
Angrist, J. D., and Krueger, A. B. 1991a. Does compulsory school attendance
affect schooling and earnings? Quarterly J. of Economics 106:979-1014.
Angrist, J. D., and Krueger, A. B. 1991b. Estimating the Payoff to Schooling Us-
ing the Vietnam-Era Draft Lottery. Industrial Relations Section,Working Pa-
per 290. Princeton, N.J.: Princeton University.
Aristotle. Politics. Translated by Benjamin Jowett. 1905 ed. Oxford: Clarendon
Press.
Arrow, K. 1973. Higher education as a filter. J. of Public Economics 2:193-216.
Atkinson, A. B., Maynard, A. K., and Trinder, C. 0.
1983. Parents and Chil-
dren: Incomes in Two Generatiom. London: Heinemann.
Atkinson, R. C. 1974. Teaching children to read using a computer. Am. Psy-
chologist 29: 169-178.
Auster, L. 1990. The Path to National Suicide: An Essay on Immigration and Mul-
ticulturalism. Monterey, Va.: American Immigration Control Foundation.
Azar, S. T., Robinson, D. R., Hekiman, E., and Twentyman, C. T. 1984. Un-
realistic expectations and problem-solving ability in maltreating and com-
parison mothers. J. of Consulting and Clinical Psych. 52:687-69 I.
Bachman, 1. G. 111, Green, S., and Wirtanen, I. D. 1971. Dropping Out-Prob-
lem or Symptom? Youth in Transition, vol. 3. Ann Arbor, Mich.: Institute for
Social Research.
Bachu, A. 1991. Fertility of American Women: June 1990. U.S. Bureau of the
Census. Current Population Report Series P-20, No. 454. Washington,
D.C.: Government Printing Office.
Bachu, A. 1993. Fertility of American Women: June 1992. U.S. Bureau of the
Census. Current Population Report Series P-20, No. 470. Washington,
D.C.: Government Printing Office.
Bajema, C. J. 1963. Estimation of the direction and intensity of natural selec-
tion in relation to human intelligence by means of the intrinsic rate of nat-
ural increase. Eugenics Quarterly 10: 175-187.
Bajema, C. J. 1971. Natural selection and intelligence: The relationship be-
tween intelligence and completed fertility among Third Harvard Growth
Study participants. Am. I. of Physical Anthropobgy 31:273.
Baker, P. C., and Mott, E L. 1989. NLSY Child Handbook 1989. Columbus,
Ohio: Center for Human Resource Research.
Baldwin, J. A., and Oliver, J. E. 1975. Epidemiology and family characteristics
of severely abused children. British J. of Preventive Social Medicine
29:205-22 1.
Bangert-Drowns, R. L. 1986. Review of developments in meta-analytic
method. Psychological Bull. 99:388-399.
Bank, L., Forgatch, M. S., Patterson, G. R., and Fetrow, R. A. 1993. Parenting
practices of single mothers: Mediators of negative contextual factors. j. of
Maniage and the Family 55:371-384.
Bardis, P. D. 1985. Jensen, Spearman's g, and Ghazali's dates: A comment on
interracial peace. Behavioral and Brain Sciences 8:219-220.
Bardouille-Crema, A., Black, K. B., and Martin, H. P. 1986. Performance on
Piagetian tasks of black children of differing socioeconomic levels. Deoel-
opmental Psych. 22:841-44.
Barnes, B. J., and Carr, R. A. 1993. 1991-92 National Decision Profiles. New-
town, Pa.: Law School Admission Services.
Barnes, V., Potter, E. H., and Fiedler,
E. 1983. Effect of interpersonal stress
on the prediction of academic performance. J. of Applied Psych. 68:686-697.
Barnett, W. S. 1985. The Perry Preschool Program and Its Long-Term Effects: A
Benefit-Cost Analysis. Ypsilanti, Mich.: High/Scope Educational Research
Foundation.
Barnett, W. S., and Escobar, C. M. 1987. The economics of early educational
intervention: A review. Rev. ofEducationa1 Research 57:387-414.
Baron, J. 1985. Reliability and g. Behavioral and Brain Sciences 8:220-221.
Barrett, P., Eysenck, H. J., and Lucking, S. 1986. Reaction time and intelli-
gence: A replicated study. Intelligence 10:9-40.
Barro, S. M., and Kolstad, A. 1987. Who Drops Out of High School? Wash-
ington, D.C.: Center for Education Statistics, U.S. Department of Educa-
tion.
Bart, W., et al. 1986. An ordering-analytic approach to the study of group dif-
ferences in intelligence. Educational and Psychological Measurement
46:799-810.
Bartholet, E. 1982. Application ofTitle VII to jobs in high places. Harvard Law
Rev. 95:945-1027.
Raughman, E. E., and Dahlstrom, W. G. 1968. Negro and White Children: A Psy-
chological Study in the Rural South. New York: Academic Press.
Beck, A. J., and Shipley, B. E. 1989. Recidivism of Prisoners Released in 1983. Bu-
reau of Justice Statistics Special Report NCJ-116261. Washington, D.C.:
U.S. Department of Justice.
Becker, B. E., and Huselid, M. A. 1992. Direct estimates of SD, and the im-
plications for utility analysis. 1. of Applied Psych. 77:227-233.
Becker, B. J. 1990. Coaching for the Scholastic Aptitude Test: Further synthesis
and appraisal. Rev. of Educational Research 60:373-417.
Becker, G. S. 1981. A Treatise on the Family. Cambridge, Mass.: Harvard Uni-
versity Press.
Beer, S. H. 1993. To Make a Nation: The Rediscovery of American Federalism.
Cambridge, Mass.: Harvard University Press.
Bejar, I. I., and Blew, E. 0.1981. Grade inflation and the validity of the Scholas-
tic Aptitude Test. Am. Educational Research Journal 18:143.
Relmont, L., and Marolla, E A. 1973. Birth order, family size, and intelligence.
Science 182:1096-1101.
Bibliography
7 79
Aelmont, L., Stein, Z., and Zybert, P. 1978. Child spacing and birth order: Ef-
fect on intellectual ability in two-child families. Science 202:995-996.
Bender, W. J. 1960. Final Report of W. J. Bender, Chairman of the Admission and
Scholarship Committee and Dean of Admissions and Financial Aid$, 1952-1 960.
Cambridge, Mass.: Harvard University.
Bendick, M. J., and Cantu, M. G. 1978. The literacy of welfare clients. Social
Science Rev. 52:56-68.
Bendix, R. 1949. Higher Civil Servants in American Society: A Study of the Social
Origins, the Careers, and the Power-Position of Higher Federal Administrators.
Westport, Conn.: Greenwood Press.
Bennett, N. G., Bloom, D. E., and Craig, P. H. 1989. The divergence of hlack
and white marriage patterns. Am. J. of Sociology 95:692-722.
Bennie, E. H. 1969. The battered child syndrome. Am. J. of Psychiaq
125:975-979.
Benton, D., and Roberts, G. 1988. Effect of vitamin and mineral sup-
plementation on intelligence of a sample of schoolchildren. Lancet
1:140-144.
Berger, A. M. 1980. The child abusing family: 11. Child and child-rearing vari-
ables, environmental factors and typologies of abusing families. Am. J. of
Family Therapy 852-68.
Bernal, E. M. 1984a. Bias in mental testing: Evidence for an alternative to the
heredity-environment controversy. In Perspectives on "Bias in Mental Test-
ing." C. R. Reynolds and R.
Brown (eds.). New York: Plenum Press, pp.
171-187.
Bernal, E. M. 1984b. Postscript: Bernal replies. In Perspectives on "Bias in Men-
tal Testing." C. R. Reynolds and R. T. Brown (eds.). New York: Plenum Press,
pp. 587-593.
Rernstam, M. S., and Swan, P. L. 1986. The State as Marriage Partner of Last Re-
sort: A Labor Market Approach to Illegitimacy in the United States, 1960-1 980.
University of New South Wales, Australia. Photocopy.
Berrueta-Clement, J. R., Schweinhart, L. J., Bamett, W. S., Epstein, A. S., and
Weikart, D. P. 1984. Changed Lives: The Effects of the Perry Preschool Propam
through Age 19. Ypsilanti, Mich.: HighIScope Educational Research Foun-
dation.
Bianchi, S. M., and Farley, R. 1979. Racial differences in family l~ving arrange-
ments and economic well-being: An analysis of recent trends. J. of Mawia~e
and the Family 4 1:537-55 1.
Ringham, W. V. D. 1937. Aptitudes and Aptitude Testing. New York: H a ~ e r
&
Bros.
Rishop, J. H. 1988a. Employment testing and incentives to learn. I . of Voca-
tional Behavior 33:404-423.
Bishop, J. H. 198813. The skills shortage and the payoff to vocational educa-
tion. Working Paper 90-08. lthaca, N.Y.: Center for Advanced Human Re-
source Studies, Comell University.
Rishop, J. H. 1989. Is the test score decline responsible for the productivity
growth decline? Am. Econ. Rev. 79:178-194.
Bishop, J. H. 1990a. The productivity consequences of what is learned in high
school. 1, of Cuniculum Studies 22:lOl-126.
Bishop, J . H. 1990h. What's wrong with American secondary schools: Can state
governments fix it? Working Paper 90-17. Ithaca, N.Y.: Center for Ad-
vanced Human Resource Studies, Cornell University.
Bishop, J. H. 1993a. Educational reform and technical education. Working Pa-
per 93-04. Ithaca, N.Y.: Center for Advanced Human Resource Studies,
Cornell University.
Bishop, 1. H. 1993h. Incentives to study and the organization of secondary in-
struction. Working Paper 93-08. Ithaca, N.Y.:
Center for Advanced Human
Resource Studies, Comell University.
Blackburn, M. L., Bloom, D. E., and Freeman, R. B. 1990. The declining eco-
nomic position of less skilled men. In A Future of Lowy Jobs? The Changing
Structure of U.S. Wages. G. Burtless (ed.). Washington, D.C.: Brookings In-
stitution, pp. 31-76.
Blackbum, M., and Neumark, D. 1991a. Unobserved Ability, Efficiency Wages,
and interindustry Wage Differentials. Cambridge, Mass.: National Bureau of
Economic Research.
Blackbum, M. L., and Neumark, D. 1991b. Omitted-ability bias and the in-
crease in the retum to schooling. J. of Labor Economics 11:521-544.
Blake, J. 1989. Family Size and Achievement. Berkeley, Cal.: University of Cal-
ifornia Press.
Blankenship, A. B., and Taylor, H. R. 1938. Prediction of vocational profi-
ciency in three machine operations. J. of Applied Psych. 22:5 18-526.
Blinder, A. S. 1987. Improving the chances of our weakest underdogs-poor
children. Business Week, December 14, p. 20.
Block, N. J., and Dworkin, G. 1974. IQ: Heritability and Inequality, Part I. Phi-
losophy and Public Affairs 3 :33 1-409.
Bloom, B. S. 1964. Stability and Change in Human Characteristics. New York:
Wiley.
Bluestone, B., and Harrison, B. 1988. The growth of low-wage employment:
1963-86. AEA Papers and Proceedings 78:124-128.
Blumstein, A., Farrington, D. P., and Moitra, S. 1985. Delinquency careers: In-
nocents, desisters, and persisters. In Crime and Jwtice: An Annual Review of
Research. Vol. 6. M. Tonry and N. Morris (eds.). Chicago: University of
Chicago Press, pp. 187-2 19.
Academic Bibliography on Socioeconomics
- The text provides a comprehensive list of academic references focusing on the economic decline of less-skilled workers and the changing structure of U.S. wages.
- Several citations explore the relationship between intelligence, schooling, and earnings, including studies on omitted-ability bias and cognitive skills.
- The bibliography includes significant research on immigration, specifically regarding self-selection, welfare usage, and the long-term assimilation of immigrant cohorts.
- Sociological factors such as family size, delinquency careers, and mother-child interactional styles in abusive versus control environments are documented.
- The collection highlights the intersection of education and capitalism, referencing critical works on educational reform and the contradictions of economic life.
Sources of human psychological differences: The Minnesota study of twins reared apart.
Bibliography
7 79
Aelmont, L., Stein, Z., and Zybert, P. 1978. Child spacing and birth order: Ef-
fect on intellectual ability in two-child families. Science 202:995-996.
Bender, W. J. 1960. Final Report of W. J. Bender, Chairman of the Admission and
Scholarship Committee and Dean of Admissions and Financial Aid$, 1952-1 960.
Cambridge, Mass.: Harvard University.
Bendick, M. J., and Cantu, M. G. 1978. The literacy of welfare clients. Social
Science Rev. 52:56-68.
Bendix, R. 1949. Higher Civil Servants in American Society: A Study of the Social
Origins, the Careers, and the Power-Position of Higher Federal Administrators.
Westport, Conn.: Greenwood Press.
Bennett, N. G., Bloom, D. E., and Craig, P. H. 1989. The divergence of hlack
and white marriage patterns. Am. J. of Sociology 95:692-722.
Bennie, E. H. 1969. The battered child syndrome. Am. J. of Psychiaq
125:975-979.
Benton, D., and Roberts, G. 1988. Effect of vitamin and mineral sup-
plementation on intelligence of a sample of schoolchildren. Lancet
1:140-144.
Berger, A. M. 1980. The child abusing family: 11. Child and child-rearing vari-
ables, environmental factors and typologies of abusing families. Am. J. of
Family Therapy 852-68.
Bernal, E. M. 1984a. Bias in mental testing: Evidence for an alternative to the
heredity-environment controversy. In Perspectives on "Bias in Mental Test-
ing." C. R. Reynolds and R.
Brown (eds.). New York: Plenum Press, pp.
171-187.
Bernal, E. M. 1984b. Postscript: Bernal replies. In Perspectives on "Bias in Men-
tal Testing." C. R. Reynolds and R. T. Brown (eds.). New York: Plenum Press,
pp. 587-593.
Rernstam, M. S., and Swan, P. L. 1986. The State as Marriage Partner of Last Re-
sort: A Labor Market Approach to Illegitimacy in the United States, 1960-1 980.
University of New South Wales, Australia. Photocopy.
Berrueta-Clement, J. R., Schweinhart, L. J., Bamett, W. S., Epstein, A. S., and
Weikart, D. P. 1984. Changed Lives: The Effects of the Perry Preschool Propam
through Age 19. Ypsilanti, Mich.: HighIScope Educational Research Foun-
dation.
Bianchi, S. M., and Farley, R. 1979. Racial differences in family l~ving arrange-
ments and economic well-being: An analysis of recent trends. J. of Mawia~e
and the Family 4 1:537-55 1.
Ringham, W. V. D. 1937. Aptitudes and Aptitude Testing. New York: H a ~ e r
&
Bros.
Rishop, J. H. 1988a. Employment testing and incentives to learn. I . of Voca-
tional Behavior 33:404-423.
Bishop, J. H. 198813. The skills shortage and the payoff to vocational educa-
tion. Working Paper 90-08. lthaca, N.Y.: Center for Advanced Human Re-
source Studies, Comell University.
Rishop, J. H. 1989. Is the test score decline responsible for the productivity
growth decline? Am. Econ. Rev. 79:178-194.
Bishop, J. H. 1990a. The productivity consequences of what is learned in high
school. 1, of Cuniculum Studies 22:lOl-126.
Bishop, J . H. 1990h. What's wrong with American secondary schools: Can state
governments fix it? Working Paper 90-17. Ithaca, N.Y.: Center for Ad-
vanced Human Resource Studies, Cornell University.
Bishop, J. H. 1993a. Educational reform and technical education. Working Pa-
per 93-04. Ithaca, N.Y.: Center for Advanced Human Resource Studies,
Cornell University.
Bishop, 1. H. 1993h. Incentives to study and the organization of secondary in-
struction. Working Paper 93-08. Ithaca, N.Y.:
Center for Advanced Human
Resource Studies, Comell University.
Blackburn, M. L., Bloom, D. E., and Freeman, R. B. 1990. The declining eco-
nomic position of less skilled men. In A Future of Lowy Jobs? The Changing
Structure of U.S. Wages. G. Burtless (ed.). Washington, D.C.: Brookings In-
stitution, pp. 31-76.
Blackbum, M., and Neumark, D. 1991a. Unobserved Ability, Efficiency Wages,
and interindustry Wage Differentials. Cambridge, Mass.: National Bureau of
Economic Research.
Blackbum, M. L., and Neumark, D. 1991b. Omitted-ability bias and the in-
crease in the retum to schooling. J. of Labor Economics 11:521-544.
Blake, J. 1989. Family Size and Achievement. Berkeley, Cal.: University of Cal-
ifornia Press.
Blankenship, A. B., and Taylor, H. R. 1938. Prediction of vocational profi-
ciency in three machine operations. J. of Applied Psych. 22:5 18-526.
Blinder, A. S. 1987. Improving the chances of our weakest underdogs-poor
children. Business Week, December 14, p. 20.
Block, N. J., and Dworkin, G. 1974. IQ: Heritability and Inequality, Part I. Phi-
losophy and Public Affairs 3 :33 1-409.
Bloom, B. S. 1964. Stability and Change in Human Characteristics. New York:
Wiley.
Bluestone, B., and Harrison, B. 1988. The growth of low-wage employment:
1963-86. AEA Papers and Proceedings 78:124-128.
Blumstein, A., Farrington, D. P., and Moitra, S. 1985. Delinquency careers: In-
nocents, desisters, and persisters. In Crime and Jwtice: An Annual Review of
Research. Vol. 6. M. Tonry and N. Morris (eds.). Chicago: University of
Chicago Press, pp. 187-2 19.
Bibliography
781
Bock, R. D., and Moore, E. G. J. 1986. Advantage and Disadvantage: A Profik
of American Youth. Hillsdale, N.J.: Lawrence Erlbaum Associates.
Boissiere, M., Knight, J. B., and Sabot, R. H. 1985. Earnings, school~ng, ahil-
ity, and cognitive skills. Am. Econ. Rev. 75:1016-1029.
Bok, D. 1985a. Admitting success. New Republic, February 4, pp. 14-16
Bok, D. 1985b. A view from the top: An interview with Derek Bok. Harvard
Political Rev. (Spring): 9.
Bolick, C. 1988. ChangingCourse: Civil Rights at the Crossroads. New Brunswick,
N.J.: Transaction Books.
Booth, A., and Duvall, D. 1981. Sex roles and the link between fert~lity and
employment. Sex Roks 7:847-856.
Borjas, G. J. 1987. Self-selection and the earnings of immigrants. Am. Econ.
Rev. 77:53 1-553.
Borjas, G. J. 1993. Immigration and welfare, 1970-1990. University of San
Diego. Photocopy.
Borjas, G. J. 1994. Assimilation and changes in cohort quality revisitell: What
happened to immigrant earnings in the 1980s? University of San I)iego.
Photocopy
Borkowski, J. G., and Maxwell, S. E. 1985. Looking for Mr. Good-g: Gener;~l
intelligence and processing speed. Behavioral and Bruin Sciences X:22 1-222.
Bouchard, T. J., Jr. 1981. Familial studies of intelligence: A review. Science.
212:1055-1059.
Bouchard, T. J., Jr., Lykken, D. T., McGue, M., Segal, N. L., and Tellegen, A.
1990. Sources of human psychological differences: The Minnesota stltdy of
twins reared apart. Science 250:223-228.
Bousha, D. M., and Twentyman, C. T. 1984. Mother-child interactional style
in abuse, neglect, and control groups: Naturalistic ohservatic)ns in the home.
I. of Abnormal Psych. 93:106-114.
Rouvier, L. E, and Davis, C. B. 1982, lmmigration and the Future Raciul Comb-
sition of the United States. Alexandria, Va.: Center for Immigration Research
and Education.
Bouvier, L. J. 1991. Fifty Million Californians. Washington, D.C.: Center for Im-
migration Studies.
Bowles, S.,
and Gintis, H. 1976. Schooling in Capitalist America: Educational Re-
form and the Contradictions of Economic Life. New York: Basic Rooks.
Boyer, E. L. 1983. High School: A Report on Secondaq Education in America. New
York: Harper & Row.
Boykin, A. W. 1986. The triple quandary and the schooling of Afro-American
children. In The School Achievement of Minority Children. U. Neisser (ed.).
Hillsdale, N.J.: Lawrence Erlbaum Associates, pp. 57-92.
Bracey, G. W. 1991, The hig lie ahout U.S. education. Phi Delta Kappan (Oc-
toher): 105-1 17.
Braden, J. P. 1989. Fact or artifact? A n empirical test of Spearman's hypothe-
sis. intelligence 13: 149-1 55.
Bradley, R. H., et al. 1977. Home environment, social status, and mental test
performance. J. of Educational Psych. 69:697-701.
Rr~nclt, E. A. 1984. The cognitive functioning of American Indian children:
A critique of McShane and Plas. School Psych. Rev. 13:74-82.
Rraun, H. I., Centra,]., and King, R. F. 1987. Verbal and Mathematical Ability of
High School Juniors and Seniors in 1983: A Nonn Study of the PSATINMSQT
and the SAT. Princeton, N.J.: Educational Testing Service.
Braun, L. W. 1992. Psychologists v. the law: The debate over employment testing.
Third-year paper. Harvard Law School.
Rrayden, R. M., Altemeier, W. A., Tucker, D. D., Dietrich, M. S., and Vietze,
P. 1992. Antecedents of child neglect in the first two years of life. I. of Pe-
diatrics 120:426-429.
Brelancl, H. M. 1976. Grade Inflation and Declining SAT Scures: A Research View-
point. Princeton, N.J.: Educational Testing Service.
Brelatid, H. M. 1979. Population Validity and College Entrance Meawes. New
York: College Board.
Brigham, C. C. 1923. A Study of American Intelligence. Princeton, N.J.: Prince-
ton University Press.
Rrigham, C. C. 1932. A Study of Error: A Summary and Evaluation of Methods
Used in Six Years of Study of the Scholastic A p t i t d Test of the College Entrance
Examination Board. New York: College Entrance Examination Board.
Rrodnick, R. J., and Ree, M. J. 1993. A structural model of academic perfor-
mance, socioeconomic status, and Spearman's g. San Antonio: St. Mary's
University of Texas. Photocopy.
Rrody, N. 1987. Jensen, Gottfredson, and the black-white difference in intel-
ligence test scores. Behavioral and Brain Sciences 10:507-508.
Rrody, N. 1992. Intelligence. 2d ed., San Diego: Academic Press.
Rrogden, H. E. 1949. When testing pays off. Personnel Psych. 2:171-183.
Rronfenhrenner, U. 1958. Socialization and social class through time and
space. In Readings in Social Psychology. Eleanor E. Maccoby, T. M. Newcomh,
and E. L. Hartley (eds.). New York: Holt, pp. 400-425.
Brooks-Gunn, I., Liaw, F., and Klebanov,
K. 1992. Effects of early interven-
tion on cognitive function of low hirth weight preterm infants. J. of Pedi-
atrics 120:350-359.
Bross, D. S., and Shapiro, S. 1982. Direct and indirect association of five fac-
tors with infant mortality. Am. J, of Epidemiology 115:78-'$1.
Brown, A. L., and Campione, J. C. 1982. Modifying intelligence or modifying
cognitive skills: More than a semantic uyibhle? In How and How Much Can
Intelligence Be Increased. D. K. Detterman and R. J. Stemherg (eds.). Nor-
wood, N.J.: Ablex Publishing Corp., pp. 215-230.
Academic Bibliography on Intelligence
- The text provides a comprehensive list of academic citations focusing on the intersection of intelligence, education, and socioeconomic status.
- Several entries examine the performance of minority groups, including American Indian and Mexican-American students, within the U.S. education system.
- The bibliography highlights historical and contemporary research on standardized testing, specifically the SAT and PSAT, and the phenomenon of grade inflation.
- Citations include studies on the early development of children, covering topics like infant mortality, child neglect, and the effects of early intervention on low birth weight infants.
- The list features influential psychological theories and debates, such as Spearman's hypothesis and the 'black-white difference' in intelligence test scores.
Brown, A. L., and Campione, J. C. 1982. Modifying intelligence or modifying cognitive skills: More than a semantic uyibhle?
Bibliography
781
Bock, R. D., and Moore, E. G. J. 1986. Advantage and Disadvantage: A Profik
of American Youth. Hillsdale, N.J.: Lawrence Erlbaum Associates.
Boissiere, M., Knight, J. B., and Sabot, R. H. 1985. Earnings, school~ng, ahil-
ity, and cognitive skills. Am. Econ. Rev. 75:1016-1029.
Bok, D. 1985a. Admitting success. New Republic, February 4, pp. 14-16
Bok, D. 1985b. A view from the top: An interview with Derek Bok. Harvard
Political Rev. (Spring): 9.
Bolick, C. 1988. ChangingCourse: Civil Rights at the Crossroads. New Brunswick,
N.J.: Transaction Books.
Booth, A., and Duvall, D. 1981. Sex roles and the link between fert~lity and
employment. Sex Roks 7:847-856.
Borjas, G. J. 1987. Self-selection and the earnings of immigrants. Am. Econ.
Rev. 77:53 1-553.
Borjas, G. J. 1993. Immigration and welfare, 1970-1990. University of San
Diego. Photocopy.
Borjas, G. J. 1994. Assimilation and changes in cohort quality revisitell: What
happened to immigrant earnings in the 1980s? University of San I)iego.
Photocopy
Borkowski, J. G., and Maxwell, S. E. 1985. Looking for Mr. Good-g: Gener;~l
intelligence and processing speed. Behavioral and Bruin Sciences X:22 1-222.
Bouchard, T. J., Jr. 1981. Familial studies of intelligence: A review. Science.
212:1055-1059.
Bouchard, T. J., Jr., Lykken, D. T., McGue, M., Segal, N. L., and Tellegen, A.
1990. Sources of human psychological differences: The Minnesota stltdy of
twins reared apart. Science 250:223-228.
Bousha, D. M., and Twentyman, C. T. 1984. Mother-child interactional style
in abuse, neglect, and control groups: Naturalistic ohservatic)ns in the home.
I. of Abnormal Psych. 93:106-114.
Rouvier, L. E, and Davis, C. B. 1982, lmmigration and the Future Raciul Comb-
sition of the United States. Alexandria, Va.: Center for Immigration Research
and Education.
Bouvier, L. J. 1991. Fifty Million Californians. Washington, D.C.: Center for Im-
migration Studies.
Bowles, S.,
and Gintis, H. 1976. Schooling in Capitalist America: Educational Re-
form and the Contradictions of Economic Life. New York: Basic Rooks.
Boyer, E. L. 1983. High School: A Report on Secondaq Education in America. New
York: Harper & Row.
Boykin, A. W. 1986. The triple quandary and the schooling of Afro-American
children. In The School Achievement of Minority Children. U. Neisser (ed.).
Hillsdale, N.J.: Lawrence Erlbaum Associates, pp. 57-92.
Bracey, G. W. 1991, The hig lie ahout U.S. education. Phi Delta Kappan (Oc-
toher): 105-1 17.
Braden, J. P. 1989. Fact or artifact? A n empirical test of Spearman's hypothe-
sis. intelligence 13: 149-1 55.
Bradley, R. H., et al. 1977. Home environment, social status, and mental test
performance. J. of Educational Psych. 69:697-701.
Rr~nclt, E. A. 1984. The cognitive functioning of American Indian children:
A critique of McShane and Plas. School Psych. Rev. 13:74-82.
Rraun, H. I., Centra,]., and King, R. F. 1987. Verbal and Mathematical Ability of
High School Juniors and Seniors in 1983: A Nonn Study of the PSATINMSQT
and the SAT. Princeton, N.J.: Educational Testing Service.
Braun, L. W. 1992. Psychologists v. the law: The debate over employment testing.
Third-year paper. Harvard Law School.
Rrayden, R. M., Altemeier, W. A., Tucker, D. D., Dietrich, M. S., and Vietze,
P. 1992. Antecedents of child neglect in the first two years of life. I. of Pe-
diatrics 120:426-429.
Brelancl, H. M. 1976. Grade Inflation and Declining SAT Scures: A Research View-
point. Princeton, N.J.: Educational Testing Service.
Brelatid, H. M. 1979. Population Validity and College Entrance Meawes. New
York: College Board.
Brigham, C. C. 1923. A Study of American Intelligence. Princeton, N.J.: Prince-
ton University Press.
Rrigham, C. C. 1932. A Study of Error: A Summary and Evaluation of Methods
Used in Six Years of Study of the Scholastic A p t i t d Test of the College Entrance
Examination Board. New York: College Entrance Examination Board.
Rrodnick, R. J., and Ree, M. J. 1993. A structural model of academic perfor-
mance, socioeconomic status, and Spearman's g. San Antonio: St. Mary's
University of Texas. Photocopy.
Rrody, N. 1987. Jensen, Gottfredson, and the black-white difference in intel-
ligence test scores. Behavioral and Brain Sciences 10:507-508.
Rrody, N. 1992. Intelligence. 2d ed., San Diego: Academic Press.
Rrogden, H. E. 1949. When testing pays off. Personnel Psych. 2:171-183.
Rronfenhrenner, U. 1958. Socialization and social class through time and
space. In Readings in Social Psychology. Eleanor E. Maccoby, T. M. Newcomh,
and E. L. Hartley (eds.). New York: Holt, pp. 400-425.
Brooks-Gunn, I., Liaw, F., and Klebanov,
K. 1992. Effects of early interven-
tion on cognitive function of low hirth weight preterm infants. J. of Pedi-
atrics 120:350-359.
Bross, D. S., and Shapiro, S. 1982. Direct and indirect association of five fac-
tors with infant mortality. Am. J, of Epidemiology 115:78-'$1.
Brown, A. L., and Campione, J. C. 1982. Modifying intelligence or modifying
cognitive skills: More than a semantic uyibhle? In How and How Much Can
Intelligence Be Increased. D. K. Detterman and R. J. Stemherg (eds.). Nor-
wood, N.J.: Ablex Publishing Corp., pp. 215-230.
782
Bibliography
Bibliography
783
Brown, C. 1980. A note on the determination of "acceptable" performance in
Thorndike's standard of fair selection. J. of Educational Measurement
17:203-209.
Brown, H. P. 1988. Egalitarianism and the Generation of Inequality. Oxford:
Clarendon Press.
Brown, M. K., and Erie, S. P. 1981. Blacks and the legacy of the Great Society.
Public Policy 12:299-330.
Brown, R. 1958. Words and Things: An Introduction to Language. New York: Free
Press.
Buenning, M., and Tollefson, N. 1987. The cultural gap hypothesis as an ex-
planation for the achievement patterns of Mexican-American students.
Psych. in the Schools 24:264-272.
Rulcroft, R. A., and Bulcroft, K. A. 1993. Race differences in attitudinal and
motivational factors in the decision to marry. J, of Marriage and the Family
55:338-355.
Bumpass, L., and McLanahan, S. 1989. Unmarried motherhood: Recent trends,
composition, and black-white differences. Demography 26:279-286.
Bundy, M. 1955. Four subjects and four hopes. College Board Rev. 27:17-20.
Buntel, J . H. 1992. Race Relations on Campus: Stanford Students Speak. The
Portable Stanford. Stanford: Stanford Alumni Association.
Buntel, J. H., and Au, J. K. D. 1987. Diversity or discriminat~on-Asian Amer-
icans in college. Public Interest 87:49-62.
Rurck, C. G. 1976. A group profile of the Fortune 500 chief executive. Fortune
(May): 173-177.
Rurdick, E. 1959. Political theory and the voting studies. In American Voting
Behavior. E. Burdick and A. J. Brodbeck (eds.). Glencoe, Ill.: Free Press, pp.
136-149.
Bureau of Lahor Statistics. 1982. Labor Force Statistics Denvedfrom the Cunent
Population Survey: A Databook. Vol. 1. U.S. Department of Lahor Bulletin
2096. Washington, D.C.: Government Printing Office.
Bureau of Labor Statistics. 1983. Handbook of Labor Statistics. U.S. Depart-
ment of Labor, Bulletin 2175. Washington, D.C.: Government Printing
Office.
Bureau of Labr Statistics. 1989. Handbook of Labor Statistics. U.S. Depart-
ment of Labor, Bulletin 2340. Washington, D.C.: Government Printing Of-
fice.
Burgess, E. W., and Wallin, P. 1943. Homogamy in social characteristics. Am.
J. of Sociology 49:109-124.
Burke, M. J., and Frederick, J. T. 1984. Two modified procedures for estimat-
ing standard deviations in utility analyses. 1, of Applied Psych. 69:482-489.
Burt, C. 1963. Is intelligence distributed normally? British]. ofSmtistical Psych.
16:175-190.
Buss. D. M. 1987. Sex differences in human mate selection criteria: An evolu-
tionary perspective. In Sociobiology and Psychology: Ideas, Issues and Appli-
cations. C. C., M. Smith, and D. Krebs (eds.). Hillsdale, N.J.: Lawrence
Erlhaum Associates, pp. 335-35 1.
Buss, D. M. 1989. Sex differences in human mate preferences: Evolutionary hy-
potheses tested in 37 cultures. Behavioral and Brain Sciences 12:1-49.
Butler, R. P., and McCauley, C. 1987. Extraordinary stability and ordinary pre-
dictability of academic success at the United States Military Academy. J. of
Educational Psych. 79:83-86.
Cain, D. P., and Vanderwolf, C. H. 1990. A critique of Rushton on race, brain
site, and intelligence. Personality and Individual Differences 1 1 :777-784.
Caldwell, B. M., and Bradley, R. H. 1984. Home Observation for Measurement
of the Environment. Little Rock, Ark.: University of Arkansas Press.
Camayd-Freixas, Y., and Horst, L. 1987. Dropouts in 1987. Boston: School
Committee of the City of Boston, Office of Research and Development.
Cameron, S. V., and Heckman, J. J. 1992. The nonequivalence of high school equiv-
alents. University of Chicago, Chicago, Ill. Photocopy.
Cameron, S. V., and Heckman, J. 1. 1993. Determinants of young male school-
ing and training choices. Working Paper 4327. Cambridge, Mass.: National
Bureau of Economic Research.
Campbell, A., Converse, P. E., Miller, W. E., and Stokes, D. E. 1960. The Amer-
ican Voter. New York: Wiley.
Capron, C., and Duyme, M. 1989. Assessment of effects of socioeconomic sta-
tus on IQ in a full cross-fostering study. Nature 340:552-553.
Card, D., and Kreuger, A. B. 1993. Trends in relative black-white eamings re-
visited. Am. Econ. Rev. 83:85-91.
Carliner, G. 1980. Wages, earnings, and hours of first, second and third gener-
ation American males. Econ. Inquiry 18:87-102.
Carlson, C. C., Huelskamp, R. M., and Woodall, T. D. 1993. Perspectives on
education in America: An annotated briefing. J. of Educational Research
86:259-310.
Carlson, T. 1993. D.C. blues: The rap sheet on the Washington police. Policy
Rev. (Winter): 26-33.
Carroll, J. B. 1988. Individual differences in cognitive functioning. In Stevens'
Handbook of Experimental Psych.. R. C. Atkinson, R. J. Herrnstein, G.
Lindzey, and R. D. Luce (eds.). New York: Wiley-Interscience, 2:813-862.
Carter, S. 1991. Refictions of an Affirmative Action Baby. New York: Basic
Books.
Caruso, D. R., Taylor, J. J., and Detterman, D. K. 1982. Intelligence research
and intelligent policy. In How and How Much C a n Intelligence Be Increased.
D. K. Detterman and R. 1. Stemberg (eds.). Norwood, N.J.: Ablex Publish-
ing Corp., pp. 45-65.
Academic and Sociological Bibliography
- The text provides a comprehensive list of academic citations covering race relations, intelligence, and educational outcomes.
- Several entries focus on the intersection of socioeconomic status and cognitive development, including cross-fostering studies.
- The bibliography includes significant research on evolutionary psychology, specifically regarding sex differences in mate selection across cultures.
- Labor statistics and economic analyses of earnings gaps between different racial and generational groups are prominently featured.
- The collection highlights institutional studies ranging from the United States Military Academy to the Fortune 500 executive profile.
Buss, D. M. 1989. Sex differences in human mate preferences: Evolutionary hypotheses tested in 37 cultures.
782
Bibliography
Bibliography
783
Brown, C. 1980. A note on the determination of "acceptable" performance in
Thorndike's standard of fair selection. J. of Educational Measurement
17:203-209.
Brown, H. P. 1988. Egalitarianism and the Generation of Inequality. Oxford:
Clarendon Press.
Brown, M. K., and Erie, S. P. 1981. Blacks and the legacy of the Great Society.
Public Policy 12:299-330.
Brown, R. 1958. Words and Things: An Introduction to Language. New York: Free
Press.
Buenning, M., and Tollefson, N. 1987. The cultural gap hypothesis as an ex-
planation for the achievement patterns of Mexican-American students.
Psych. in the Schools 24:264-272.
Rulcroft, R. A., and Bulcroft, K. A. 1993. Race differences in attitudinal and
motivational factors in the decision to marry. J, of Marriage and the Family
55:338-355.
Bumpass, L., and McLanahan, S. 1989. Unmarried motherhood: Recent trends,
composition, and black-white differences. Demography 26:279-286.
Bundy, M. 1955. Four subjects and four hopes. College Board Rev. 27:17-20.
Buntel, J . H. 1992. Race Relations on Campus: Stanford Students Speak. The
Portable Stanford. Stanford: Stanford Alumni Association.
Buntel, J. H., and Au, J. K. D. 1987. Diversity or discriminat~on-Asian Amer-
icans in college. Public Interest 87:49-62.
Rurck, C. G. 1976. A group profile of the Fortune 500 chief executive. Fortune
(May): 173-177.
Rurdick, E. 1959. Political theory and the voting studies. In American Voting
Behavior. E. Burdick and A. J. Brodbeck (eds.). Glencoe, Ill.: Free Press, pp.
136-149.
Bureau of Lahor Statistics. 1982. Labor Force Statistics Denvedfrom the Cunent
Population Survey: A Databook. Vol. 1. U.S. Department of Lahor Bulletin
2096. Washington, D.C.: Government Printing Office.
Bureau of Labor Statistics. 1983. Handbook of Labor Statistics. U.S. Depart-
ment of Labor, Bulletin 2175. Washington, D.C.: Government Printing
Office.
Bureau of Labr Statistics. 1989. Handbook of Labor Statistics. U.S. Depart-
ment of Labor, Bulletin 2340. Washington, D.C.: Government Printing Of-
fice.
Burgess, E. W., and Wallin, P. 1943. Homogamy in social characteristics. Am.
J. of Sociology 49:109-124.
Burke, M. J., and Frederick, J. T. 1984. Two modified procedures for estimat-
ing standard deviations in utility analyses. 1, of Applied Psych. 69:482-489.
Burt, C. 1963. Is intelligence distributed normally? British]. ofSmtistical Psych.
16:175-190.
Buss. D. M. 1987. Sex differences in human mate selection criteria: An evolu-
tionary perspective. In Sociobiology and Psychology: Ideas, Issues and Appli-
cations. C. C., M. Smith, and D. Krebs (eds.). Hillsdale, N.J.: Lawrence
Erlhaum Associates, pp. 335-35 1.
Buss, D. M. 1989. Sex differences in human mate preferences: Evolutionary hy-
potheses tested in 37 cultures. Behavioral and Brain Sciences 12:1-49.
Butler, R. P., and McCauley, C. 1987. Extraordinary stability and ordinary pre-
dictability of academic success at the United States Military Academy. J. of
Educational Psych. 79:83-86.
Cain, D. P., and Vanderwolf, C. H. 1990. A critique of Rushton on race, brain
site, and intelligence. Personality and Individual Differences 1 1 :777-784.
Caldwell, B. M., and Bradley, R. H. 1984. Home Observation for Measurement
of the Environment. Little Rock, Ark.: University of Arkansas Press.
Camayd-Freixas, Y., and Horst, L. 1987. Dropouts in 1987. Boston: School
Committee of the City of Boston, Office of Research and Development.
Cameron, S. V., and Heckman, J. J. 1992. The nonequivalence of high school equiv-
alents. University of Chicago, Chicago, Ill. Photocopy.
Cameron, S. V., and Heckman, J. 1. 1993. Determinants of young male school-
ing and training choices. Working Paper 4327. Cambridge, Mass.: National
Bureau of Economic Research.
Campbell, A., Converse, P. E., Miller, W. E., and Stokes, D. E. 1960. The Amer-
ican Voter. New York: Wiley.
Capron, C., and Duyme, M. 1989. Assessment of effects of socioeconomic sta-
tus on IQ in a full cross-fostering study. Nature 340:552-553.
Card, D., and Kreuger, A. B. 1993. Trends in relative black-white eamings re-
visited. Am. Econ. Rev. 83:85-91.
Carliner, G. 1980. Wages, earnings, and hours of first, second and third gener-
ation American males. Econ. Inquiry 18:87-102.
Carlson, C. C., Huelskamp, R. M., and Woodall, T. D. 1993. Perspectives on
education in America: An annotated briefing. J. of Educational Research
86:259-310.
Carlson, T. 1993. D.C. blues: The rap sheet on the Washington police. Policy
Rev. (Winter): 26-33.
Carroll, J. B. 1988. Individual differences in cognitive functioning. In Stevens'
Handbook of Experimental Psych.. R. C. Atkinson, R. J. Herrnstein, G.
Lindzey, and R. D. Luce (eds.). New York: Wiley-Interscience, 2:813-862.
Carter, S. 1991. Refictions of an Affirmative Action Baby. New York: Basic
Books.
Caruso, D. R., Taylor, J. J., and Detterman, D. K. 1982. Intelligence research
and intelligent policy. In How and How Much C a n Intelligence Be Increased.
D. K. Detterman and R. 1. Stemberg (eds.). Norwood, N.J.: Ablex Publish-
ing Corp., pp. 45-65.
Bibliography of Intelligence and Policy
- The text provides a comprehensive list of academic references focusing on the intersection of intelligence research and public policy.
- A significant portion of the citations features Raymond B. Cattell, exploring themes of national intelligence decline and the structure of cognitive abilities.
- Several entries examine the relationship between IQ, expertise, and real-world outcomes, such as criminal behavior and occupational choice.
- The bibliography includes studies on the impact of environmental factors, such as schooling, nutrition, and the Head Start program, on intellectual development.
- References also address social and legal issues, including the Civil Rights Act of 1991 and the experiences of Asian Americans in higher education.
Cattell, R. B. 1937. The Fight for Our National Intelligence. London: King & Sons.
782
Bibliography
Bibliography
783
Brown, C. 1980. A note on the determination of "acceptable" performance in
Thorndike's standard of fair selection. J. of Educational Measurement
17:203-209.
Brown, H. P. 1988. Egalitarianism and the Generation of Inequality. Oxford:
Clarendon Press.
Brown, M. K., and Erie, S. P. 1981. Blacks and the legacy of the Great Society.
Public Policy 12:299-330.
Brown, R. 1958. Words and Things: An Introduction to Language. New York: Free
Press.
Buenning, M., and Tollefson, N. 1987. The cultural gap hypothesis as an ex-
planation for the achievement patterns of Mexican-American students.
Psych. in the Schools 24:264-272.
Rulcroft, R. A., and Bulcroft, K. A. 1993. Race differences in attitudinal and
motivational factors in the decision to marry. J, of Marriage and the Family
55:338-355.
Bumpass, L., and McLanahan, S. 1989. Unmarried motherhood: Recent trends,
composition, and black-white differences. Demography 26:279-286.
Bundy, M. 1955. Four subjects and four hopes. College Board Rev. 27:17-20.
Buntel, J . H. 1992. Race Relations on Campus: Stanford Students Speak. The
Portable Stanford. Stanford: Stanford Alumni Association.
Buntel, J. H., and Au, J. K. D. 1987. Diversity or discriminat~on-Asian Amer-
icans in college. Public Interest 87:49-62.
Rurck, C. G. 1976. A group profile of the Fortune 500 chief executive. Fortune
(May): 173-177.
Rurdick, E. 1959. Political theory and the voting studies. In American Voting
Behavior. E. Burdick and A. J. Brodbeck (eds.). Glencoe, Ill.: Free Press, pp.
136-149.
Bureau of Lahor Statistics. 1982. Labor Force Statistics Denvedfrom the Cunent
Population Survey: A Databook. Vol. 1. U.S. Department of Lahor Bulletin
2096. Washington, D.C.: Government Printing Office.
Bureau of Labor Statistics. 1983. Handbook of Labor Statistics. U.S. Depart-
ment of Labor, Bulletin 2175. Washington, D.C.: Government Printing
Office.
Bureau of Labr Statistics. 1989. Handbook of Labor Statistics. U.S. Depart-
ment of Labor, Bulletin 2340. Washington, D.C.: Government Printing Of-
fice.
Burgess, E. W., and Wallin, P. 1943. Homogamy in social characteristics. Am.
J. of Sociology 49:109-124.
Burke, M. J., and Frederick, J. T. 1984. Two modified procedures for estimat-
ing standard deviations in utility analyses. 1, of Applied Psych. 69:482-489.
Burt, C. 1963. Is intelligence distributed normally? British]. ofSmtistical Psych.
16:175-190.
Buss. D. M. 1987. Sex differences in human mate selection criteria: An evolu-
tionary perspective. In Sociobiology and Psychology: Ideas, Issues and Appli-
cations. C. C., M. Smith, and D. Krebs (eds.). Hillsdale, N.J.: Lawrence
Erlhaum Associates, pp. 335-35 1.
Buss, D. M. 1989. Sex differences in human mate preferences: Evolutionary hy-
potheses tested in 37 cultures. Behavioral and Brain Sciences 12:1-49.
Butler, R. P., and McCauley, C. 1987. Extraordinary stability and ordinary pre-
dictability of academic success at the United States Military Academy. J. of
Educational Psych. 79:83-86.
Cain, D. P., and Vanderwolf, C. H. 1990. A critique of Rushton on race, brain
site, and intelligence. Personality and Individual Differences 1 1 :777-784.
Caldwell, B. M., and Bradley, R. H. 1984. Home Observation for Measurement
of the Environment. Little Rock, Ark.: University of Arkansas Press.
Camayd-Freixas, Y., and Horst, L. 1987. Dropouts in 1987. Boston: School
Committee of the City of Boston, Office of Research and Development.
Cameron, S. V., and Heckman, J. J. 1992. The nonequivalence of high school equiv-
alents. University of Chicago, Chicago, Ill. Photocopy.
Cameron, S. V., and Heckman, J. 1. 1993. Determinants of young male school-
ing and training choices. Working Paper 4327. Cambridge, Mass.: National
Bureau of Economic Research.
Campbell, A., Converse, P. E., Miller, W. E., and Stokes, D. E. 1960. The Amer-
ican Voter. New York: Wiley.
Capron, C., and Duyme, M. 1989. Assessment of effects of socioeconomic sta-
tus on IQ in a full cross-fostering study. Nature 340:552-553.
Card, D., and Kreuger, A. B. 1993. Trends in relative black-white eamings re-
visited. Am. Econ. Rev. 83:85-91.
Carliner, G. 1980. Wages, earnings, and hours of first, second and third gener-
ation American males. Econ. Inquiry 18:87-102.
Carlson, C. C., Huelskamp, R. M., and Woodall, T. D. 1993. Perspectives on
education in America: An annotated briefing. J. of Educational Research
86:259-310.
Carlson, T. 1993. D.C. blues: The rap sheet on the Washington police. Policy
Rev. (Winter): 26-33.
Carroll, J. B. 1988. Individual differences in cognitive functioning. In Stevens'
Handbook of Experimental Psych.. R. C. Atkinson, R. J. Herrnstein, G.
Lindzey, and R. D. Luce (eds.). New York: Wiley-Interscience, 2:813-862.
Carter, S. 1991. Refictions of an Affirmative Action Baby. New York: Basic
Books.
Caruso, D. R., Taylor, J. J., and Detterman, D. K. 1982. Intelligence research
and intelligent policy. In How and How Much C a n Intelligence Be Increased.
D. K. Detterman and R. 1. Stemberg (eds.). Norwood, N.J.: Ablex Publish-
ing Corp., pp. 45-65.
Bibliography
7 85
Cathcart, D. A., and Snyderman, M. 1992. The Civil Rights Act of 1991. The
Labor Lawyer 8:849-922.
Cattell, R. B. 1936. Is our national intelligence declining? Eugenics Rev.
28:181-203.
Cattell, R. B. 1937. The Fight for Our National Intelligence. London: King &
Sons.
Cattell, R. B. 1938. Some changes in social life in a community with a falling
intelligence quotient. British]. of Psych. 28:430450.
Cattell, R. B. 1951. The fate of national intelligence: Test of a thirteen-year
prediction. Eugenics Rev. 42: 136148.
Cattell, R. B. 1971. Abilities: Their Structure, Growth, and Action. Boston:
Houghton Mifflin.
Cattell, R. B. 1974. Differential fertility and normal selection for IQ: Some re-
quired conditions in their investigation. Social Biology 21:168-177.
Cattell, R. B. 1979. Are culture fair intelligence tests possible and necessary!
J . of Research and Development in Education 12:3-13.
Cattell, R. B. 1983. Intelligence and National Achievement. Washington, D.C.:
Institute for the Study of Man.
Ceci, S. J. 1991. How much does schooling influence general intelligence and
its cognitive components? A reassessment of the evidence. Developmental
Psych. 27:703-722.
Ceci, S. J., and Liker,]. K. 1986. A day at the races: A study of IQ, expertise,
and cognitive complexity. 1. of Experimental Psych. 1 15:25 5-266.
Chaiken, J. M., and Chaiken, M. R. 1983. Crime rates and the active crimi-
nal. In Crime and Public Policy. J. Q. Wilson (ed.). San Francisco: ICS Press,
pp. 11-30.
Chan, J. W. C., and Vernon, P. E. 1988. Individual differences among the peo-
ples of China. In Human Abilities in Cultural Context. S. H. lrvine and J. W.
Berry (eds.). New York: Cambridge University Press, pp. 340-357.
Chan, S., and Wang, L.-C. 1991. Racism and the model minority: Asian-Amer-
icans in higher education. In The Racial Crisis in American Higher Education.
P. G. Altbach and K. Lomotey (eds.). Albany, N.Y.: State University of New
York Press, pp. 43-68.
Chen, R., and Morgan, S. P. 1991. Recent trends in the timing of first births
in the United States. Demography 28:513-533.
Cherlin, A. J. 1981. Marriage, Divorce, Remarriage. Cambridge, Mass.: Harvard
University Press.
Chipuer, H. M., Rovine. M. J.. and Plomin. R 1990. LISREL modeling:
Genetic and environmental influences on IQ revisited. intelligence
14:ll-21.
Chiswick. B R. 1978. The effect of Americanization on the earnings of for-
eign-born men. ]. of Political Econ. 86:897-92 1.
Chun, K.-T., and Zalokar, N. 1992. Civil Rights Issues Facing Asian Americans
in the 1990s. Washington, D.C.: U.S. Commission on Civil Rights.
Church, A. T., and Katigbak, M. S. 1991. Home environment, nutritional sta-
tus, and maternal intelligence as determinants of intellectual development
in rural Philippine preschool children. Intelligence 1549-78.
Cicarelli, V. G., Evans, J. W., and Schiller, J. S. 1969. The Impact of Head Start:
An Evaluation of the Effects of Head Start on Children's Cognitive and Affective
Development. Athens, Ohio: Westinghouse Learning Corporation and Ohio
University.
Cicchetti, D., and Rizley, R. 1981. Developmental perspectives on the etiol-
ogy, intergenerational transmission, and sequelae of child maltreatment.
New Directions for Child Development 1 1:3 1-55.
Clark, C. D., and Gist, N. P. 1938. Intelligence as a factor in occupational
choice. Am. Sociological Rev. 3683-694.
Cleckley, H. 1964. The Mask of Sanity. St. Louis: Mosby.
Clews, H. 1908. Fifty Years in Wall Street. New York: Irving Publishing Co.
Clignet, R. 1974. Liberty and Equality in the Educational Process: A Comparative
Sociology of Education. New York: Wiley.
Clotfelter, C. T. 1990. Undergraduate Enrollments in the 1980s. Working Pa-
per. Cambridge, Mass.: National Bureau for Economic Research.
Cogan, J. 1982. The decline in black teenage employment: 1950-70. Am.
Econ. Rev. 72:621-638.
Cohen, M. I., Raphling, D. L., and Green, P. E. 1966. Psychological aspects of
the maltreatment syndrome in childhood. J. of Pediatrics 69:279-284.
Colaizzi, J. 1989. Homicidal Insanity. 1800-1 985. Tuscaloosa, Ala.: University
of Alabama Press.
Cole, B. P. 1987. College admissions and coaching. Negro Educational Rev.
38:125-135.
Cole, C. C., Jr. 1955. Who's going to college? Colkge Board Rev. 27:13-16.
Coleman, J. S. 1972. The evaluation of Equality of Educational Opportunity.
In On Equality of Educational Opportunity. F. Mosteller and D. P. Moynihan
(eds.). New York: Random House, pp. 146-167.
Coleman, 1. S. 1993. Comment on Preston and Campbell's "Differential fer-
tility and the distribution of traits." Am. J. of Sociology 98:1020-1032.
Coleman, J. S., and Hoffer, T. 1987. Public and Private Schools: The Impact of
Communities. New York: Basic Books.
Coleman, J. S., et al. 1966. Equality of Educational Opportunity, Suppkmental
Appendix 9.10. Washington, D.C.: U.S. Office of Education.
Coles, R. 1967. Migrants, Sharecroppers, and Mountaineers. Children of Crisis,
vol. 2. Boston: Little, Brown.
College Entrance Examination Board. 1961. College Profiks. New York: Col-
lege Entrance Examination Board.
Scholarly Bibliography on Social Inequality
- The text provides a comprehensive list of academic citations focusing on educational attainment and socioeconomic disparities in the mid-to-late 20th century.
- Several entries examine the 'Equality of Educational Opportunity' and the impact of community on public versus private schooling.
- A significant portion of the research addresses racial disparities, specifically regarding black teenage employment, neonatal mortality, and minority admissions in higher education.
- The bibliography highlights the growing concentration of high-achieving students at elite institutions and the role of coaching in college admissions.
- Broader sociological and psychological themes are represented, including the maltreatment syndrome in childhood, the nature of belief systems, and the sociology of poverty.
Cook, P. J., and Frank, R. H. 1991. The growing concentration of top students at elite schools.
Bibliography
7 85
Cathcart, D. A., and Snyderman, M. 1992. The Civil Rights Act of 1991. The
Labor Lawyer 8:849-922.
Cattell, R. B. 1936. Is our national intelligence declining? Eugenics Rev.
28:181-203.
Cattell, R. B. 1937. The Fight for Our National Intelligence. London: King &
Sons.
Cattell, R. B. 1938. Some changes in social life in a community with a falling
intelligence quotient. British]. of Psych. 28:430450.
Cattell, R. B. 1951. The fate of national intelligence: Test of a thirteen-year
prediction. Eugenics Rev. 42: 136148.
Cattell, R. B. 1971. Abilities: Their Structure, Growth, and Action. Boston:
Houghton Mifflin.
Cattell, R. B. 1974. Differential fertility and normal selection for IQ: Some re-
quired conditions in their investigation. Social Biology 21:168-177.
Cattell, R. B. 1979. Are culture fair intelligence tests possible and necessary!
J . of Research and Development in Education 12:3-13.
Cattell, R. B. 1983. Intelligence and National Achievement. Washington, D.C.:
Institute for the Study of Man.
Ceci, S. J. 1991. How much does schooling influence general intelligence and
its cognitive components? A reassessment of the evidence. Developmental
Psych. 27:703-722.
Ceci, S. J., and Liker,]. K. 1986. A day at the races: A study of IQ, expertise,
and cognitive complexity. 1. of Experimental Psych. 1 15:25 5-266.
Chaiken, J. M., and Chaiken, M. R. 1983. Crime rates and the active crimi-
nal. In Crime and Public Policy. J. Q. Wilson (ed.). San Francisco: ICS Press,
pp. 11-30.
Chan, J. W. C., and Vernon, P. E. 1988. Individual differences among the peo-
ples of China. In Human Abilities in Cultural Context. S. H. lrvine and J. W.
Berry (eds.). New York: Cambridge University Press, pp. 340-357.
Chan, S., and Wang, L.-C. 1991. Racism and the model minority: Asian-Amer-
icans in higher education. In The Racial Crisis in American Higher Education.
P. G. Altbach and K. Lomotey (eds.). Albany, N.Y.: State University of New
York Press, pp. 43-68.
Chen, R., and Morgan, S. P. 1991. Recent trends in the timing of first births
in the United States. Demography 28:513-533.
Cherlin, A. J. 1981. Marriage, Divorce, Remarriage. Cambridge, Mass.: Harvard
University Press.
Chipuer, H. M., Rovine. M. J.. and Plomin. R 1990. LISREL modeling:
Genetic and environmental influences on IQ revisited. intelligence
14:ll-21.
Chiswick. B R. 1978. The effect of Americanization on the earnings of for-
eign-born men. ]. of Political Econ. 86:897-92 1.
Chun, K.-T., and Zalokar, N. 1992. Civil Rights Issues Facing Asian Americans
in the 1990s. Washington, D.C.: U.S. Commission on Civil Rights.
Church, A. T., and Katigbak, M. S. 1991. Home environment, nutritional sta-
tus, and maternal intelligence as determinants of intellectual development
in rural Philippine preschool children. Intelligence 1549-78.
Cicarelli, V. G., Evans, J. W., and Schiller, J. S. 1969. The Impact of Head Start:
An Evaluation of the Effects of Head Start on Children's Cognitive and Affective
Development. Athens, Ohio: Westinghouse Learning Corporation and Ohio
University.
Cicchetti, D., and Rizley, R. 1981. Developmental perspectives on the etiol-
ogy, intergenerational transmission, and sequelae of child maltreatment.
New Directions for Child Development 1 1:3 1-55.
Clark, C. D., and Gist, N. P. 1938. Intelligence as a factor in occupational
choice. Am. Sociological Rev. 3683-694.
Cleckley, H. 1964. The Mask of Sanity. St. Louis: Mosby.
Clews, H. 1908. Fifty Years in Wall Street. New York: Irving Publishing Co.
Clignet, R. 1974. Liberty and Equality in the Educational Process: A Comparative
Sociology of Education. New York: Wiley.
Clotfelter, C. T. 1990. Undergraduate Enrollments in the 1980s. Working Pa-
per. Cambridge, Mass.: National Bureau for Economic Research.
Cogan, J. 1982. The decline in black teenage employment: 1950-70. Am.
Econ. Rev. 72:621-638.
Cohen, M. I., Raphling, D. L., and Green, P. E. 1966. Psychological aspects of
the maltreatment syndrome in childhood. J. of Pediatrics 69:279-284.
Colaizzi, J. 1989. Homicidal Insanity. 1800-1 985. Tuscaloosa, Ala.: University
of Alabama Press.
Cole, B. P. 1987. College admissions and coaching. Negro Educational Rev.
38:125-135.
Cole, C. C., Jr. 1955. Who's going to college? Colkge Board Rev. 27:13-16.
Coleman, J. S. 1972. The evaluation of Equality of Educational Opportunity.
In On Equality of Educational Opportunity. F. Mosteller and D. P. Moynihan
(eds.). New York: Random House, pp. 146-167.
Coleman, 1. S. 1993. Comment on Preston and Campbell's "Differential fer-
tility and the distribution of traits." Am. J. of Sociology 98:1020-1032.
Coleman, J. S., and Hoffer, T. 1987. Public and Private Schools: The Impact of
Communities. New York: Basic Books.
Coleman, J. S., et al. 1966. Equality of Educational Opportunity, Suppkmental
Appendix 9.10. Washington, D.C.: U.S. Office of Education.
Coles, R. 1967. Migrants, Sharecroppers, and Mountaineers. Children of Crisis,
vol. 2. Boston: Little, Brown.
College Entrance Examination Board. 1961. College Profiks. New York: Col-
lege Entrance Examination Board.
Bibliography
787
Collins, J. W. 1992. Disparate black and white neonatal mortality rates among
infants of normal birth weight in Chicago: A population study. 1. of Pedi-
atrics 120:954-960.
Committee on Minority Affairs. 1984. Report to the Corporation Committee on
Minority Affairs from Its Subcommittee on Asian American Admissions. Provi-
dence, R.I.: Brown University Corporation.
Committee on Ways and Means and U.S. House of Representatives. 1993.1993
Green Book: Background Material and Data on Programs within the Jurisdiction
of the Committee on Ways and Means, WMCP 103-18. Washingon, D.C.:
Govemment Printing Office.
Congressional Budget Office. 1986. Trends in Educational Achievement.
Congress of the United States. Washington, D.C.: Govemment Printing
Office.
Congressional Budget Office. 1987. Educational Achievement: Explanations and
Implications of Recent Trends. Congress of the United States. Washington,
D.C.: Government Printing Office.
Consortium on Financing Higher Education. 1992. COFHE Admissions Statis-
tics: Classes Entering 1991 and 1992 (RedbookXVlI).Cambridge, Mass.: Con-
sortium on Financing Higher Education.
Converse, P. E. 1964. The nature of belief systems in mass publics. In ldeolop
and Discontent D. E. Apter (ed.). New York: Free Press, pp. 206-261.
Cook, P. C. 1987. Cultural bias in the California Achievement Tests: A focus
on internal indices. Dissertations Abstracts International 48(2-A):339.
Cook, P. J., and Frank, R. H. 1991. The growing concentration of top students
at elite schools. In The Economics of Higher Education. C. Clotfelter and
M. Rothschild (eds.) Chicago: NBER-University of Chicago Press.
Cook, R. C. 1951. Human Fertility: The Modern Dikmma. New York: Sloane.
Cook, T. K., Appleton, H., Conner, R. F., Shaffer, A., Tamkin, G., and Weber,
S. J. 1975. "Sesame Street" Revisited. New York: Russell Sage Foundation.
Cooksey, E. C. 1990. Factors in the resolution of adolescent premarital preg-
nancies. Demography 27:207-218.
Coser, L. 1965. The sociology of poverty. Social Probkms 13: 140-148.
Costello, J. 1970. Effects of pretesting and examiner characteristics on test per-
formance of young disadvantaged children. Proceedings of the 78th Annual
Convention, Am. Psychological Assoc. 5:309-3 10.
Costopoulos, P. J. 1990. Jefferson, Adams, and the natural aristocracy. First
Things 1:46-52.
Cramer, J. C. 1987. Social factors and infant mortality: Identifying high-risk
groups and proximate causes. Demography 24:299-322.
Crawford-Nutt, D. H. 1976. Are black scores on Raven's Standard Progressive
Matrices an artifact of method of test presentation? Psycholo*
Aficana
16:201-206.
Crittenden, P. 1988. Family and dyadic patterns of functioning in maltreating
families. In Early Prediction and Prevention of Child Abuse. K. Browne, C.
Davies, and P. Stratton (eds.). New York: Wiley, pp. 161-189.
Crombie, 1. K., Todman, J., McNeill, G., Florey, C. D. V., Menzies, I., and
Kennedy, R. A. 1990. Effect of vitamin and mineral supplementation on
verbal and non-verbal reasoning of school children. Lancet 335:744-747.
Cronbach, L. I., and Gleser, G. C. 1965. Psychological Tests and Personnel Deci-
sions. 2d ed., Urbana, Ill.: University of Illinois Press.
Crouse, J., and Trusheim, D. 1988. The Case against t k SAT. Chicago: Uni-
versity of Chicago Press.
Cutler, D. M., and Katz, L. E 1991. Macroeconomic Performance and the Disad-
vantaged. Cambridge, Mass.: Harvard University and NEBR.
Cyphers, L. H., Fulker, D. W., Plomin, R., and DeFries, J. C. 1989. Cognitive
abilities in the early school years: No effects of shared environment between
parents and offspring. Intelligence 13:369-386.
D'Souza, D. 1991. Illiberal Education. New York: Free Press.
Darlington, C. D. 1969. The Evolution of Man and Society. New York: Simon
and Schuster.
Das, J. P. 1985. Interpretations for a class on minority assessment. Behavioral
and Brain Sciences 8:228.
David, R. 1990. Race, birth weight, and mortality rates. J. of Pediamcs
116:lOl-102.
Davis, A., and Havighurst, R. J. 1946. Social class and color differences in child-
rearing. Am. Sociological Rev. 11:69&7 10.
DeFries,]. C., Johnson, R. C., Kuse, A. R., McCleam, G. E., Polovina, J., Van-
denberg, S. G., and Wilson, J. R. 1979. Familial resemblance for specific
cognitive abilities. Behavior Genetics 9:2313.
Dekovic, M., and Gerris, 1. R. M. 1992. Parental reasoning complexity, social
class, and child-rearing behaviors. J. of Marriage and the Family 54675485.
Delattre, E. J. 1989. Character and Cops: Ethics in Policing. Washington, D. C.:
American Enterprise Institute.
Denno, D. W. 1990. Biology and Vioknce: From Birth to Adulthood. New York:
Cambridge University Press.
DerSimonian, R., and Laird, N. M. Evaluating the effect of coaching on SAT
scores: A meta-analysis. Harvard Educational Rev. 53:l-15.
Detlefsen, R. R. 1991. Civil Rights under Reagan. San Francisco: ICS Press.
Diamond, M. 1976. The American idea of man: The view from the founding.
In The Americans: 1976. An Inquiry into Fundamental Concepts of Man Un-
derlyingvariow U.S. Institutions. Vol. 2. I. Kristol and P. Weaver (eds.). Lex-
ington, Mass.: Lexington Books, pp. 1-23.
Dillon, H.J. 1949. Early School Lavers: A Major Educational Probkm. New York:
National Child Labor Committee.
Bibliography of Cognitive and Social Research
- The text provides a comprehensive list of academic citations focusing on intelligence testing, cognitive development, and social class.
- Several entries examine the impact of environmental factors, such as vitamin supplementation and child-rearing practices, on reasoning abilities.
- The bibliography highlights research into racial and socioeconomic disparities in standardized testing, including the SAT and Raven's Progressive Matrices.
- Citations include longitudinal studies on child abuse, adoption, and the long-term biological influences on violence and behavior.
- The collection references significant works on civil rights policy and its economic impact on disadvantaged populations.
- Legal and ethical frameworks are addressed through works on policing ethics and the American founding concepts of man.
Are black scores on Raven's Standard Progressive Matrices an artifact of method of test presentation?
Bibliography
787
Collins, J. W. 1992. Disparate black and white neonatal mortality rates among
infants of normal birth weight in Chicago: A population study. 1. of Pedi-
atrics 120:954-960.
Committee on Minority Affairs. 1984. Report to the Corporation Committee on
Minority Affairs from Its Subcommittee on Asian American Admissions. Provi-
dence, R.I.: Brown University Corporation.
Committee on Ways and Means and U.S. House of Representatives. 1993.1993
Green Book: Background Material and Data on Programs within the Jurisdiction
of the Committee on Ways and Means, WMCP 103-18. Washingon, D.C.:
Govemment Printing Office.
Congressional Budget Office. 1986. Trends in Educational Achievement.
Congress of the United States. Washington, D.C.: Govemment Printing
Office.
Congressional Budget Office. 1987. Educational Achievement: Explanations and
Implications of Recent Trends. Congress of the United States. Washington,
D.C.: Government Printing Office.
Consortium on Financing Higher Education. 1992. COFHE Admissions Statis-
tics: Classes Entering 1991 and 1992 (RedbookXVlI).Cambridge, Mass.: Con-
sortium on Financing Higher Education.
Converse, P. E. 1964. The nature of belief systems in mass publics. In ldeolop
and Discontent D. E. Apter (ed.). New York: Free Press, pp. 206-261.
Cook, P. C. 1987. Cultural bias in the California Achievement Tests: A focus
on internal indices. Dissertations Abstracts International 48(2-A):339.
Cook, P. J., and Frank, R. H. 1991. The growing concentration of top students
at elite schools. In The Economics of Higher Education. C. Clotfelter and
M. Rothschild (eds.) Chicago: NBER-University of Chicago Press.
Cook, R. C. 1951. Human Fertility: The Modern Dikmma. New York: Sloane.
Cook, T. K., Appleton, H., Conner, R. F., Shaffer, A., Tamkin, G., and Weber,
S. J. 1975. "Sesame Street" Revisited. New York: Russell Sage Foundation.
Cooksey, E. C. 1990. Factors in the resolution of adolescent premarital preg-
nancies. Demography 27:207-218.
Coser, L. 1965. The sociology of poverty. Social Probkms 13: 140-148.
Costello, J. 1970. Effects of pretesting and examiner characteristics on test per-
formance of young disadvantaged children. Proceedings of the 78th Annual
Convention, Am. Psychological Assoc. 5:309-3 10.
Costopoulos, P. J. 1990. Jefferson, Adams, and the natural aristocracy. First
Things 1:46-52.
Cramer, J. C. 1987. Social factors and infant mortality: Identifying high-risk
groups and proximate causes. Demography 24:299-322.
Crawford-Nutt, D. H. 1976. Are black scores on Raven's Standard Progressive
Matrices an artifact of method of test presentation? Psycholo*
Aficana
16:201-206.
Crittenden, P. 1988. Family and dyadic patterns of functioning in maltreating
families. In Early Prediction and Prevention of Child Abuse. K. Browne, C.
Davies, and P. Stratton (eds.). New York: Wiley, pp. 161-189.
Crombie, 1. K., Todman, J., McNeill, G., Florey, C. D. V., Menzies, I., and
Kennedy, R. A. 1990. Effect of vitamin and mineral supplementation on
verbal and non-verbal reasoning of school children. Lancet 335:744-747.
Cronbach, L. I., and Gleser, G. C. 1965. Psychological Tests and Personnel Deci-
sions. 2d ed., Urbana, Ill.: University of Illinois Press.
Crouse, J., and Trusheim, D. 1988. The Case against t k SAT. Chicago: Uni-
versity of Chicago Press.
Cutler, D. M., and Katz, L. E 1991. Macroeconomic Performance and the Disad-
vantaged. Cambridge, Mass.: Harvard University and NEBR.
Cyphers, L. H., Fulker, D. W., Plomin, R., and DeFries, J. C. 1989. Cognitive
abilities in the early school years: No effects of shared environment between
parents and offspring. Intelligence 13:369-386.
D'Souza, D. 1991. Illiberal Education. New York: Free Press.
Darlington, C. D. 1969. The Evolution of Man and Society. New York: Simon
and Schuster.
Das, J. P. 1985. Interpretations for a class on minority assessment. Behavioral
and Brain Sciences 8:228.
David, R. 1990. Race, birth weight, and mortality rates. J. of Pediamcs
116:lOl-102.
Davis, A., and Havighurst, R. J. 1946. Social class and color differences in child-
rearing. Am. Sociological Rev. 11:69&7 10.
DeFries,]. C., Johnson, R. C., Kuse, A. R., McCleam, G. E., Polovina, J., Van-
denberg, S. G., and Wilson, J. R. 1979. Familial resemblance for specific
cognitive abilities. Behavior Genetics 9:2313.
Dekovic, M., and Gerris, 1. R. M. 1992. Parental reasoning complexity, social
class, and child-rearing behaviors. J. of Marriage and the Family 54675485.
Delattre, E. J. 1989. Character and Cops: Ethics in Policing. Washington, D. C.:
American Enterprise Institute.
Denno, D. W. 1990. Biology and Vioknce: From Birth to Adulthood. New York:
Cambridge University Press.
DerSimonian, R., and Laird, N. M. Evaluating the effect of coaching on SAT
scores: A meta-analysis. Harvard Educational Rev. 53:l-15.
Detlefsen, R. R. 1991. Civil Rights under Reagan. San Francisco: ICS Press.
Diamond, M. 1976. The American idea of man: The view from the founding.
In The Americans: 1976. An Inquiry into Fundamental Concepts of Man Un-
derlyingvariow U.S. Institutions. Vol. 2. I. Kristol and P. Weaver (eds.). Lex-
ington, Mass.: Lexington Books, pp. 1-23.
Dillon, H.J. 1949. Early School Lavers: A Major Educational Probkm. New York:
National Child Labor Committee.
788
Bibliography
Dilts, S. W. (ed.). 1991. Peterson's Guide to Four-Year CoUqes. 2lst ed. Prince-
ton, N.J.: Peterson's Guides.
Donlon, T. E (ed.). 1984. The College Board Technical Handbook for the Scholas-
tic Aptitude Test and Achievement Tests. New York: College Entrance Exam-
ination Board.
Donnelly, B. W., and Vo~danoff, P. 1991. Factors associated with releasing for
adoption among adolescent mothers. Family Relations 40:404-410.
Donohue, J. J., 111, and Heckman, J. 1991. Continuous versus episodic change:
The impact of civil rights policy on the economic status of blacks. J. of Econ.
Literature 29: 1603-1643.
Downs, A. 1957. An Economic Theory of Democracy. New York: Harper.
Drotar, D., and Sturm, L. 1989. Influences on the home environment of
preschool children with early histories of nonorganic failure-to-thrive. De-
velopmental and Behavioral Pedianics 10: 2 29-23 5.
Dubin, J. A., Osbum, H., and Winick, D. M. 1969. Speed and practice: Effects
on Negro and white test performance. 1. of Applied Psych. 53: 19-23.
Dumaret, A., and Stewart, J. T. 1985. IQ, scholastic performance and behav-
iour of sibs raised in contrasting environments. 1. of Child Psych., and Psy-
chiatry and AUied Disciplines 26553-580.
Duncan, G. J. 1993. Economic defmfmvation
and early-childhood development. Ann
Arbor, Mich.: Social Science Research Center. Photocopy.
Duncan, G. J., and Hoffman, S. D. 1990. Welfare benefits, economic opportu-
nities, and out-of-wedlock births among black teenage girls. Demography
27:519-535.
Duncan, G. I., and Laren, D. 1990. Neighborhood Correlates of Teen Birth5 and
Dropping Out: Preliminary Results f70m the PSID-Geocode Fife. Ann Arbor,
Mich.: SSRC Working Group on Communities and Neighborhmds, Fam-
ily Processes and Individual Development. Social Science Research Center.
Duncan, 0.
D. 1952. Is the intelligence of the general population declining?
Am. Sociological Rev. 17:40 1-407.
Duncan, 0.
D. 1968. Ability and achievement. Eugenics Quarterly 15:1-11.
Dunnette, M. D. 1976. Aptitudes, abilities, and skills. In Handbook of Indus-
t
d
and Organizational Psychology. M. D. Dunnette (ed.). Chicago: Rand
McNally College Publishing Company, pp. 473-520.
Dyer, H. S. 1987. The effects of coaching for Scholastic Aptitude. NASSP Bull.
71 46-53.
Dyer, P. J. 1970. Effects of test conditions on Negro-white differences in rest scores.
Ph.D. dissertation, Columbia University.
E. E Wonderlic & Associates, I. 1983. Wonderlic Personnel Test Manual. North-
field, 111.: E. E Wonderlic & Associates.
Eagle, E. 1988a. High School and Beyond: Educational Ewences
o f t k 1980 Se-
nior Clars. Berkeley, Cal.: MPR Associates.
Eagle, E. 1988b. National Longitudinal Study 1972: Educational Experiences ofthe
1972 Senior Class. Berkeley, Cal.: MPR Associates.
Eberstein, I. W., and Parker, J. R. 1984. Racial differences in infant mortality
by cause of death: The impact of birth weight and maternal age. Demogra-
phy 21:309-321.
Eells, K., et a1. 1951. Intelligence and Cultural Differences. Chicago: University
of Chicago Press.
Egeland, R., Rreitenbucher, M., and Rosenberg, D. 1980. Prospective study of
the significance of life stress in the etiology of child abuse. J, of Consulting
and Clinical Psych. 48: 195-205.
Eggeheen, D. J., and Lichter, D. T. 1991. Race, famiIy structure, and changing
poverty among American children. Am. Sociological Rev. 56:801-817.
Elliot, R. 1988. Tests, abilities, race, and conflict. Intelligence 12333-350.
Elliott, D. S., and Ageton, S. S. 1980. Reconciling race and class differences
in self-reported and official estimates of delinquency. Am. Sociological Rev.
4595-1 10.
Elliott, D. S., and Voss, H. 1974. Delinquency and Dropout. Lexington Mass.:
Lexington Rooks.
Elliott, R. 1987. Litigating Intelligence: IQ Tests, Special Education, and Social Sci-
ence in the Courtroom. Dover, Mass.: Auburn House.
Ellis, L., and Nyborg, H. 1992. Raciallethnic variations in male testosterone
levels: A pobable contributor to groupdifferences in health. Steroid5 57:1-4.
Ellwood, D. 1986a. Targeting the "Would-Be" Long-Term Recipient: Who Should
Be Served? Princeton, N.J.: Mathematica Policy Research.
Ellwood, D. T. 1986b. The spatial mismatch hypothesis. In The Black Youth Em-
ployment Crisis. R. B. Freeman and H, J. Holzer (eds.). Chicago: University
of Chicago Press.
Ellwood, D. T. 1988. Porn S u p p t : Poverty in the American Family. New York:
Basic Books.
Ellwood, D., and Bane, M. J. 1985. The impact of AFDC on family structure
and living arrangements. In Research in Labor Economics, Vol. 7. R. G. Ehren-
berg (ed.). Greenwich, Conn.: JAI Press, pp. 137-207.
Ellwood, D. T., and Crane, J. 1990. Family change among black Americans:
What do we know? J. of Econ. Perspectives 4:65-84.
Epstein, R. A. 1990. The paradox of civil rights. Yale Law and Policy Rev.
8:299-3 19.
Epstein, R. A. 1992. Forbidden Grounds: The Case against Employment Discrim-
ination Laws. Cambridge, Mass.: Harvard University Press.
Ervin, L., Hogrebe, M. C., Dwinell, P. L., and Newman, I. 1984. Comparison
of the prediction of academic performance for college developmental stu-
dents and regularly admitted students. Psychological Repmts 54:319-327.
Etzioni, A. 1975. Grade inflation. Science 190: 101.
Sociological and Psychological Bibliography
- The text consists of a dense bibliographic list of academic sources focusing on the intersection of race, intelligence, and socioeconomic outcomes.
- Several entries examine the impact of welfare benefits and neighborhood correlates on teenage pregnancy and high school dropout rates.
- A significant portion of the research addresses the validity of intelligence testing and its historical role in legal and educational settings.
- The citations include studies on biological and environmental factors, such as testosterone levels and infant mortality, as potential contributors to group differences.
- The collection highlights the debate over employment discrimination laws and the 'spatial mismatch' hypothesis regarding black youth employment.
Elliott, R. 1987. Litigating Intelligence: IQ Tests, Special Education, and Social Science in the Courtroom.
788
Bibliography
Dilts, S. W. (ed.). 1991. Peterson's Guide to Four-Year CoUqes. 2lst ed. Prince-
ton, N.J.: Peterson's Guides.
Donlon, T. E (ed.). 1984. The College Board Technical Handbook for the Scholas-
tic Aptitude Test and Achievement Tests. New York: College Entrance Exam-
ination Board.
Donnelly, B. W., and Vo~danoff, P. 1991. Factors associated with releasing for
adoption among adolescent mothers. Family Relations 40:404-410.
Donohue, J. J., 111, and Heckman, J. 1991. Continuous versus episodic change:
The impact of civil rights policy on the economic status of blacks. J. of Econ.
Literature 29: 1603-1643.
Downs, A. 1957. An Economic Theory of Democracy. New York: Harper.
Drotar, D., and Sturm, L. 1989. Influences on the home environment of
preschool children with early histories of nonorganic failure-to-thrive. De-
velopmental and Behavioral Pedianics 10: 2 29-23 5.
Dubin, J. A., Osbum, H., and Winick, D. M. 1969. Speed and practice: Effects
on Negro and white test performance. 1. of Applied Psych. 53: 19-23.
Dumaret, A., and Stewart, J. T. 1985. IQ, scholastic performance and behav-
iour of sibs raised in contrasting environments. 1. of Child Psych., and Psy-
chiatry and AUied Disciplines 26553-580.
Duncan, G. J. 1993. Economic defmfmvation
and early-childhood development. Ann
Arbor, Mich.: Social Science Research Center. Photocopy.
Duncan, G. J., and Hoffman, S. D. 1990. Welfare benefits, economic opportu-
nities, and out-of-wedlock births among black teenage girls. Demography
27:519-535.
Duncan, G. I., and Laren, D. 1990. Neighborhood Correlates of Teen Birth5 and
Dropping Out: Preliminary Results f70m the PSID-Geocode Fife. Ann Arbor,
Mich.: SSRC Working Group on Communities and Neighborhmds, Fam-
ily Processes and Individual Development. Social Science Research Center.
Duncan, 0.
D. 1952. Is the intelligence of the general population declining?
Am. Sociological Rev. 17:40 1-407.
Duncan, 0.
D. 1968. Ability and achievement. Eugenics Quarterly 15:1-11.
Dunnette, M. D. 1976. Aptitudes, abilities, and skills. In Handbook of Indus-
t
d
and Organizational Psychology. M. D. Dunnette (ed.). Chicago: Rand
McNally College Publishing Company, pp. 473-520.
Dyer, H. S. 1987. The effects of coaching for Scholastic Aptitude. NASSP Bull.
71 46-53.
Dyer, P. J. 1970. Effects of test conditions on Negro-white differences in rest scores.
Ph.D. dissertation, Columbia University.
E. E Wonderlic & Associates, I. 1983. Wonderlic Personnel Test Manual. North-
field, 111.: E. E Wonderlic & Associates.
Eagle, E. 1988a. High School and Beyond: Educational Ewences
o f t k 1980 Se-
nior Clars. Berkeley, Cal.: MPR Associates.
Eagle, E. 1988b. National Longitudinal Study 1972: Educational Experiences ofthe
1972 Senior Class. Berkeley, Cal.: MPR Associates.
Eberstein, I. W., and Parker, J. R. 1984. Racial differences in infant mortality
by cause of death: The impact of birth weight and maternal age. Demogra-
phy 21:309-321.
Eells, K., et a1. 1951. Intelligence and Cultural Differences. Chicago: University
of Chicago Press.
Egeland, R., Rreitenbucher, M., and Rosenberg, D. 1980. Prospective study of
the significance of life stress in the etiology of child abuse. J, of Consulting
and Clinical Psych. 48: 195-205.
Eggeheen, D. J., and Lichter, D. T. 1991. Race, famiIy structure, and changing
poverty among American children. Am. Sociological Rev. 56:801-817.
Elliot, R. 1988. Tests, abilities, race, and conflict. Intelligence 12333-350.
Elliott, D. S., and Ageton, S. S. 1980. Reconciling race and class differences
in self-reported and official estimates of delinquency. Am. Sociological Rev.
4595-1 10.
Elliott, D. S., and Voss, H. 1974. Delinquency and Dropout. Lexington Mass.:
Lexington Rooks.
Elliott, R. 1987. Litigating Intelligence: IQ Tests, Special Education, and Social Sci-
ence in the Courtroom. Dover, Mass.: Auburn House.
Ellis, L., and Nyborg, H. 1992. Raciallethnic variations in male testosterone
levels: A pobable contributor to groupdifferences in health. Steroid5 57:1-4.
Ellwood, D. 1986a. Targeting the "Would-Be" Long-Term Recipient: Who Should
Be Served? Princeton, N.J.: Mathematica Policy Research.
Ellwood, D. T. 1986b. The spatial mismatch hypothesis. In The Black Youth Em-
ployment Crisis. R. B. Freeman and H, J. Holzer (eds.). Chicago: University
of Chicago Press.
Ellwood, D. T. 1988. Porn S u p p t : Poverty in the American Family. New York:
Basic Books.
Ellwood, D., and Bane, M. J. 1985. The impact of AFDC on family structure
and living arrangements. In Research in Labor Economics, Vol. 7. R. G. Ehren-
berg (ed.). Greenwich, Conn.: JAI Press, pp. 137-207.
Ellwood, D. T., and Crane, J. 1990. Family change among black Americans:
What do we know? J. of Econ. Perspectives 4:65-84.
Epstein, R. A. 1990. The paradox of civil rights. Yale Law and Policy Rev.
8:299-3 19.
Epstein, R. A. 1992. Forbidden Grounds: The Case against Employment Discrim-
ination Laws. Cambridge, Mass.: Harvard University Press.
Ervin, L., Hogrebe, M. C., Dwinell, P. L., and Newman, I. 1984. Comparison
of the prediction of academic performance for college developmental stu-
dents and regularly admitted students. Psychological Repmts 54:319-327.
Etzioni, A. 1975. Grade inflation. Science 190: 101.
Academic and Social Bibliography
- The text provides a comprehensive list of academic references spanning intelligence testing, educational policy, and socioeconomic outcomes.
- Several citations focus on the predictive validity of standardized testing for diverse racial and socioeconomic groups.
- The bibliography includes significant research on the 'Flynn Effect,' documenting massive IQ gains across different nations and generations.
- References address the intersection of cognitive ability with social issues such as delinquency, labor force behavior, and wealth distribution.
- The list highlights historical debates regarding credentialism, grade inflation, and the 'dumbing down' of educational materials.
Flynn, J. R. 1987a. Massive IQ gains in 14 nations: What IQ tests really measure.
788
Bibliography
Dilts, S. W. (ed.). 1991. Peterson's Guide to Four-Year CoUqes. 2lst ed. Prince-
ton, N.J.: Peterson's Guides.
Donlon, T. E (ed.). 1984. The College Board Technical Handbook for the Scholas-
tic Aptitude Test and Achievement Tests. New York: College Entrance Exam-
ination Board.
Donnelly, B. W., and Vo~danoff, P. 1991. Factors associated with releasing for
adoption among adolescent mothers. Family Relations 40:404-410.
Donohue, J. J., 111, and Heckman, J. 1991. Continuous versus episodic change:
The impact of civil rights policy on the economic status of blacks. J. of Econ.
Literature 29: 1603-1643.
Downs, A. 1957. An Economic Theory of Democracy. New York: Harper.
Drotar, D., and Sturm, L. 1989. Influences on the home environment of
preschool children with early histories of nonorganic failure-to-thrive. De-
velopmental and Behavioral Pedianics 10: 2 29-23 5.
Dubin, J. A., Osbum, H., and Winick, D. M. 1969. Speed and practice: Effects
on Negro and white test performance. 1. of Applied Psych. 53: 19-23.
Dumaret, A., and Stewart, J. T. 1985. IQ, scholastic performance and behav-
iour of sibs raised in contrasting environments. 1. of Child Psych., and Psy-
chiatry and AUied Disciplines 26553-580.
Duncan, G. J. 1993. Economic defmfmvation
and early-childhood development. Ann
Arbor, Mich.: Social Science Research Center. Photocopy.
Duncan, G. J., and Hoffman, S. D. 1990. Welfare benefits, economic opportu-
nities, and out-of-wedlock births among black teenage girls. Demography
27:519-535.
Duncan, G. I., and Laren, D. 1990. Neighborhood Correlates of Teen Birth5 and
Dropping Out: Preliminary Results f70m the PSID-Geocode Fife. Ann Arbor,
Mich.: SSRC Working Group on Communities and Neighborhmds, Fam-
ily Processes and Individual Development. Social Science Research Center.
Duncan, 0.
D. 1952. Is the intelligence of the general population declining?
Am. Sociological Rev. 17:40 1-407.
Duncan, 0.
D. 1968. Ability and achievement. Eugenics Quarterly 15:1-11.
Dunnette, M. D. 1976. Aptitudes, abilities, and skills. In Handbook of Indus-
t
d
and Organizational Psychology. M. D. Dunnette (ed.). Chicago: Rand
McNally College Publishing Company, pp. 473-520.
Dyer, H. S. 1987. The effects of coaching for Scholastic Aptitude. NASSP Bull.
71 46-53.
Dyer, P. J. 1970. Effects of test conditions on Negro-white differences in rest scores.
Ph.D. dissertation, Columbia University.
E. E Wonderlic & Associates, I. 1983. Wonderlic Personnel Test Manual. North-
field, 111.: E. E Wonderlic & Associates.
Eagle, E. 1988a. High School and Beyond: Educational Ewences
o f t k 1980 Se-
nior Clars. Berkeley, Cal.: MPR Associates.
Eagle, E. 1988b. National Longitudinal Study 1972: Educational Experiences ofthe
1972 Senior Class. Berkeley, Cal.: MPR Associates.
Eberstein, I. W., and Parker, J. R. 1984. Racial differences in infant mortality
by cause of death: The impact of birth weight and maternal age. Demogra-
phy 21:309-321.
Eells, K., et a1. 1951. Intelligence and Cultural Differences. Chicago: University
of Chicago Press.
Egeland, R., Rreitenbucher, M., and Rosenberg, D. 1980. Prospective study of
the significance of life stress in the etiology of child abuse. J, of Consulting
and Clinical Psych. 48: 195-205.
Eggeheen, D. J., and Lichter, D. T. 1991. Race, famiIy structure, and changing
poverty among American children. Am. Sociological Rev. 56:801-817.
Elliot, R. 1988. Tests, abilities, race, and conflict. Intelligence 12333-350.
Elliott, D. S., and Ageton, S. S. 1980. Reconciling race and class differences
in self-reported and official estimates of delinquency. Am. Sociological Rev.
4595-1 10.
Elliott, D. S., and Voss, H. 1974. Delinquency and Dropout. Lexington Mass.:
Lexington Rooks.
Elliott, R. 1987. Litigating Intelligence: IQ Tests, Special Education, and Social Sci-
ence in the Courtroom. Dover, Mass.: Auburn House.
Ellis, L., and Nyborg, H. 1992. Raciallethnic variations in male testosterone
levels: A pobable contributor to groupdifferences in health. Steroid5 57:1-4.
Ellwood, D. 1986a. Targeting the "Would-Be" Long-Term Recipient: Who Should
Be Served? Princeton, N.J.: Mathematica Policy Research.
Ellwood, D. T. 1986b. The spatial mismatch hypothesis. In The Black Youth Em-
ployment Crisis. R. B. Freeman and H, J. Holzer (eds.). Chicago: University
of Chicago Press.
Ellwood, D. T. 1988. Porn S u p p t : Poverty in the American Family. New York:
Basic Books.
Ellwood, D., and Bane, M. J. 1985. The impact of AFDC on family structure
and living arrangements. In Research in Labor Economics, Vol. 7. R. G. Ehren-
berg (ed.). Greenwich, Conn.: JAI Press, pp. 137-207.
Ellwood, D. T., and Crane, J. 1990. Family change among black Americans:
What do we know? J. of Econ. Perspectives 4:65-84.
Epstein, R. A. 1990. The paradox of civil rights. Yale Law and Policy Rev.
8:299-3 19.
Epstein, R. A. 1992. Forbidden Grounds: The Case against Employment Discrim-
ination Laws. Cambridge, Mass.: Harvard University Press.
Ervin, L., Hogrebe, M. C., Dwinell, P. L., and Newman, I. 1984. Comparison
of the prediction of academic performance for college developmental stu-
dents and regularly admitted students. Psychological Repmts 54:319-327.
Etzioni, A. 1975. Grade inflation. Science 190: 101.
790
Bibliography
Bibliography
79 1
Eyferth, K. 1961. Leistungen verschiedener Gruppen von Besatzungskindem
in Hamburg-WechsEer Intelligenztest fiir Kinder (HAWIK). Archiv fiir die
gesamte Psychologie 1 13:222-241.
Eysenck, H. J. 1991. Raising I.Q. through vitamin and mineral supplementa-
tion: An introduction. Personality and lndividual Differences 12:329-333.
Faculty of Arts and Sciences. 1960. Admission to Harvard College. Report by the
Special Committee on College Admission Policy. Cambridge, Mass.: Har-
vard University.
Falconer, D. S. 1966. Genetic consequences of selection pressure. In Genetic
and Environmental Factors in Human Ability. J. E. Meade and A. S. Parkes
(eds.). Edinburgh: Oliver & Boyd, pp. 219-232.
Falconer, D. S. 1989. An Introduction to Quantitative Genetics. 3d ed. New York:
Wiley.
Fallows, J. 1980. The tests and the brightest: How fair are the College Boards?
Atlantic Monthly (February): 37-48.
Fallows, J. 1985. The case against credentialism. Atlantic Monthly (December):
49-67.
Farrell, T. 1. 1983. 1Q and standard English. College Composition and Commu-
nication 34:470-484.
Farrington, D. l?, and West, D. J. 1990. The Cambridge Study in Delinquent
Development: A long-term follow-up of 41 1 London males. In Criminality:
Personality, Behavior, Life History. H. J. Kemer and G. Kaiser (eds.). New
York: Springer-Verlag, pp. 1 15-1 38.
Farver, A. S., Sedlacek, W. E., and Brooks, G. C. 1975. Longitudinal predic-
tions of university grades for blacks and whites. Measurement and Evaluation
in Guidance 7:243-250.
Featherstone, J. 1971. Schools Where Children Learn. New York: Liveright.
Federal Bureau of Investigation. 1993. Crime in the United States 1992: Uniform
Crime Reports. Washington, D.C.: Government Printing Office.
Feinberg, L. 1988. Black freshman enrollment rises 46% at U-Va. The Wash-
ington Post, Dec. 26, p. C1.
Field, T. M., Widmayer, S. M., Stringer, S., and Ignatoff, E. 1993. Teenage,
lower-class, black mothers and their preterm infants: An intervention and
developmental follow-up. Child Development 5 1:42W36.
Fierman, J. 1987. What it takes to be rich in America. Fortune, April 13, pp.
22-29.
Figueroa, R. A. 1983. Test bias and Hispanic children. 1. of Special Education
17:43 1-440.
Figueroa, R. A., and Sassenrath, 1. M. 1989. A Longitudinal Study of the Pre-
dictive Validity of the System of Multicultural Pluralistic Assessment
(SOMPA). Psych. in the Schools 265-15.
Filer, R. K. 1981. The influence of affective human capital on the wage equa-
tion. In Research in Labor Economics, vol. IV. R. Ehrenberg (ed.). Greenwich,
Conn.: JAI Press, pp. 367-409.
Finch, E E. 1946. Enrollment increases and Changes in the Mental Level of the High
School Population. Stanford, Cal.: Stanford University Press.
Finn, C. E., Jr. 1991. We Must T a k Charge: Our Schools and Our Future. New
York: Free Press.
Fisher, A. B. 1992. The new debate over the very rich. Fortune, June 29, pp.
42-54.
Fiske, E. B. 1984. Are they "dumbing down" the textbooks? Principal 64:44.
Fletcher, J. F., and Forbes, H. D. 1990. Education, occupation and vote in
Canada, 1965-1984. Canadian Rev. of Sociology and Anthropology
27:441461.
Fletcher, R. 1991. Intelligence, equality, character, and education. Intelligence
15:139-149.
Flinn, C. J., and Heckman, J. J. 1983. Are unemployment and out of the labor
force behaviorally distinct labor force states? J. of Labor Economics 1:2842.
Flynn, 1. R. 1980. Race, IQ, and Jensen. London: Routledge and Kegan Paul.
Flynn, J. R. 1984. The mean IQ of Americans: Massive gains 1932 to 1978.
Psychological Bull. 95:29-5 1.
Flynn, 1. R. 1987a. Massive IQ gains in 14 nations: What IQ tests really mea-
sure. Psychological Bull. 101:171-191.
Flynn, J. R. 1987b. The ontology of intelligence. In Measurement, Realism, and
Objectivity. J. Forge (ed.). New York: D. Retdel, pp. 1-40.
Flynn, J. R. 1989. Rushton, evolution and race: An essay on intelligence and
virtue. Psychologist 2:363-366.
Flynn, J. R. 1991. Asian Americans: Achievement beyond IQ. Hillsdale, N.J.:
Lawrence Erlbaum Associates.
Flynn, T. M. 1984. Counterstatement: Responses to Thomas J. Farrell, "IQ and
standard English" (with a reply by Thomas J. Farrell). College Composition
and Communication 35:455479.
Fogel, R. W. 1992. Egalitarianism: The economic revolution of the twentieth
century. New Haven, Conn.: Yale University. Photocopy.
Ford, J. K., Kraiger, K., and Schechtman, S. L. 1986. Study of race effects in
objective indices and subjective evaluations of performance: A meta-analy-
sis of performance criteria. Psychological Bull. 99:330-337.
Forrest, D. W. 1974. Francis Galton: The Life and Work of a Victorian Geniw.
New York: Taplinger.
Fossett, M. A,, and Kiecolt, K. J. 1993. Mate availability and family structure
among African Americans in U.S. metropolitan areas. 1. of Marriage and the
Family 55288-302.
Frederiksen, N. 1986. Toward a broader conception of human intelligence. Am.
Psychologist 41:445-452.
Academic Foundations of Intelligence Research
- The bibliography documents James R. Flynn’s extensive work on the ontology of intelligence and the achievement levels of Asian Americans.
- It highlights significant 20th-century economic perspectives, including Milton Friedman’s 'Capitalism and Freedom' and Richard Freeman’s analysis of affirmative action.
- The list includes foundational texts in psychometrics and heredity, specifically the 19th-century works of Francis Galton such as 'Hereditary Genius'.
- Research on social outcomes is represented through studies on child abuse, crime, unemployment, and the timing of adolescent intercourse.
- The collection features critiques of educational interventions, notably the Head Start synthesis project and the Milwaukee Project for preventing mental retardation.
Galton, F. 1869. Hereditary Genius: An Inquiry into Its Laws and Consequences.
790
Bibliography
Bibliography
79 1
Eyferth, K. 1961. Leistungen verschiedener Gruppen von Besatzungskindem
in Hamburg-WechsEer Intelligenztest fiir Kinder (HAWIK). Archiv fiir die
gesamte Psychologie 1 13:222-241.
Eysenck, H. J. 1991. Raising I.Q. through vitamin and mineral supplementa-
tion: An introduction. Personality and lndividual Differences 12:329-333.
Faculty of Arts and Sciences. 1960. Admission to Harvard College. Report by the
Special Committee on College Admission Policy. Cambridge, Mass.: Har-
vard University.
Falconer, D. S. 1966. Genetic consequences of selection pressure. In Genetic
and Environmental Factors in Human Ability. J. E. Meade and A. S. Parkes
(eds.). Edinburgh: Oliver & Boyd, pp. 219-232.
Falconer, D. S. 1989. An Introduction to Quantitative Genetics. 3d ed. New York:
Wiley.
Fallows, J. 1980. The tests and the brightest: How fair are the College Boards?
Atlantic Monthly (February): 37-48.
Fallows, J. 1985. The case against credentialism. Atlantic Monthly (December):
49-67.
Farrell, T. 1. 1983. 1Q and standard English. College Composition and Commu-
nication 34:470-484.
Farrington, D. l?, and West, D. J. 1990. The Cambridge Study in Delinquent
Development: A long-term follow-up of 41 1 London males. In Criminality:
Personality, Behavior, Life History. H. J. Kemer and G. Kaiser (eds.). New
York: Springer-Verlag, pp. 1 15-1 38.
Farver, A. S., Sedlacek, W. E., and Brooks, G. C. 1975. Longitudinal predic-
tions of university grades for blacks and whites. Measurement and Evaluation
in Guidance 7:243-250.
Featherstone, J. 1971. Schools Where Children Learn. New York: Liveright.
Federal Bureau of Investigation. 1993. Crime in the United States 1992: Uniform
Crime Reports. Washington, D.C.: Government Printing Office.
Feinberg, L. 1988. Black freshman enrollment rises 46% at U-Va. The Wash-
ington Post, Dec. 26, p. C1.
Field, T. M., Widmayer, S. M., Stringer, S., and Ignatoff, E. 1993. Teenage,
lower-class, black mothers and their preterm infants: An intervention and
developmental follow-up. Child Development 5 1:42W36.
Fierman, J. 1987. What it takes to be rich in America. Fortune, April 13, pp.
22-29.
Figueroa, R. A. 1983. Test bias and Hispanic children. 1. of Special Education
17:43 1-440.
Figueroa, R. A., and Sassenrath, 1. M. 1989. A Longitudinal Study of the Pre-
dictive Validity of the System of Multicultural Pluralistic Assessment
(SOMPA). Psych. in the Schools 265-15.
Filer, R. K. 1981. The influence of affective human capital on the wage equa-
tion. In Research in Labor Economics, vol. IV. R. Ehrenberg (ed.). Greenwich,
Conn.: JAI Press, pp. 367-409.
Finch, E E. 1946. Enrollment increases and Changes in the Mental Level of the High
School Population. Stanford, Cal.: Stanford University Press.
Finn, C. E., Jr. 1991. We Must T a k Charge: Our Schools and Our Future. New
York: Free Press.
Fisher, A. B. 1992. The new debate over the very rich. Fortune, June 29, pp.
42-54.
Fiske, E. B. 1984. Are they "dumbing down" the textbooks? Principal 64:44.
Fletcher, J. F., and Forbes, H. D. 1990. Education, occupation and vote in
Canada, 1965-1984. Canadian Rev. of Sociology and Anthropology
27:441461.
Fletcher, R. 1991. Intelligence, equality, character, and education. Intelligence
15:139-149.
Flinn, C. J., and Heckman, J. J. 1983. Are unemployment and out of the labor
force behaviorally distinct labor force states? J. of Labor Economics 1:2842.
Flynn, 1. R. 1980. Race, IQ, and Jensen. London: Routledge and Kegan Paul.
Flynn, J. R. 1984. The mean IQ of Americans: Massive gains 1932 to 1978.
Psychological Bull. 95:29-5 1.
Flynn, 1. R. 1987a. Massive IQ gains in 14 nations: What IQ tests really mea-
sure. Psychological Bull. 101:171-191.
Flynn, J. R. 1987b. The ontology of intelligence. In Measurement, Realism, and
Objectivity. J. Forge (ed.). New York: D. Retdel, pp. 1-40.
Flynn, J. R. 1989. Rushton, evolution and race: An essay on intelligence and
virtue. Psychologist 2:363-366.
Flynn, J. R. 1991. Asian Americans: Achievement beyond IQ. Hillsdale, N.J.:
Lawrence Erlbaum Associates.
Flynn, T. M. 1984. Counterstatement: Responses to Thomas J. Farrell, "IQ and
standard English" (with a reply by Thomas J. Farrell). College Composition
and Communication 35:455479.
Fogel, R. W. 1992. Egalitarianism: The economic revolution of the twentieth
century. New Haven, Conn.: Yale University. Photocopy.
Ford, J. K., Kraiger, K., and Schechtman, S. L. 1986. Study of race effects in
objective indices and subjective evaluations of performance: A meta-analy-
sis of performance criteria. Psychological Bull. 99:330-337.
Forrest, D. W. 1974. Francis Galton: The Life and Work of a Victorian Geniw.
New York: Taplinger.
Fossett, M. A,, and Kiecolt, K. J. 1993. Mate availability and family structure
among African Americans in U.S. metropolitan areas. 1. of Marriage and the
Family 55288-302.
Frederiksen, N. 1986. Toward a broader conception of human intelligence. Am.
Psychologist 41:445-452.
792
Bibliography
Bibliography
793
Freeman, R. B. 1976. The Overeducated American. New York: Academic Press.
Freeman, R. B. 1983. Crime and unemployment. In Crime and Public Policy.
J. Q. Wilson (ed.). San Francisco: Institute for Contemporary Studies, pp.
89-106.
Freeman, R. B. 1984. Affirmative action: Good, bad, or irrelevant? New Per-
spectives 16:23-27.
Friedman, M. 1962. Capitalism and Freedom. Chicago: University of Chicago
Press.
Friedman, S. B., and Morse, C. W. 1974. Child abuse: A 5-year follow-up of
early case finding in the emergency department. Pediamcs 54:404410.
Friedman, T., and Williams, E. B. 1982. Current use of tests for employment.
In Ability Testing: Uses, Consequences, and Controversies, Vol. 2. A. K. Wig-
dor and W. R. Gamer (eds.). Washington, D.C.: National Academy Press,
pp. 99-169.
Frydman, M., and Lynn, R. 1989. The intelligence of Korean children adopted
in Belgium. Personality and Individual Differences 10: 1323-1 325.
Fryer, D. 1922. Occupational-intelligence standards. School and Society
16:273-276.
Fuchs, D., and Fuchs, L. S. 1986. Test procedure bias: A meta-analysis of ex-
aminer familiarity effects. Rev. of Educational Research 56:243-262.
Furstenberg, F. F., Jr., Morgan, S. P., Moore, K. A., and Peterson, 1. L. 1987.
Race differences in the timing of adolescent intercourse. Am. Sociological
Rev. 5251 1-5 18.
Gabriel, P. E. 1991. A comparison of the occupational distributions of native-
and foreign-bom males: An immigration consideration. Am. J. of Econ. and
Sociology 50:35 1-364.
Galton, F. 1869. Hereditary Genius: An Inquiry into Its Laws and Consequences.
1892 ed. London: Macmillan.
Galton, F, 1883. Inquiries into Human Faculty and Its Development. London:
Macmillan.
Galton, E 1888. Co-relations and their measurement, chiefly from anthropo-
logical data. Proceedings of the Royal Society of London 45:135-145.
Gamble, T. I., and Zigler, E. 1989. The Head Start synthesis project: A critique.
I . of Applied Developmental Psych. 10:267-274.
Garbarino,]., and Crouter, A. 1978. Defining the community context for par-
ent-child relations: The correlates of child maltreatment. Child Development
49:604-616.
Garber, H. 1. 1988. The Milwaukee Project: Preventing Mental Retardation in Chil-
drenat Risk. Washington, D.C.: American Association on Mental Retardation.
Garher, H. L., and Hodge, J. D. 1991. Understanding intervention, ~nocula-
tion, and risk for intellectual deceleration: A reply to Locurto. lntellrgence
15:317-325.
Gardner, H. 1983. Frames of Mind: The Theory of Multipk Intelligences. New
York: Basic Books.
Gergen, K. I., and Ullman, M. 1977. Socialization and the characterological
basis of political activism. In Handbook of Political Socialization. S. A. Ren-
shon (ed.). New York: Free Press, pp. 41 1-442.
Ghiselin, M. T., and Scudo, F. M. 1986. The bioeconomics of phenotypic se-
lection. Behavioral and Brain Sciences 9: 194-195.
Ghiselli, E. E. 1966. The Validity of Occupational A p t i d Tests. New York: Wiley.
Ghiselli, E. E. 1973. The validity of aptitude tests in personnel selection. Per-
sonnel Psych. 26:461-477.
Ghiselli, E. E., and Brown, C. W. 1947. Learning in accident reduction. J, of
Applied Psych. 3 1:580-582.
Gifford, B. R. (ed.). 1989. Test Policy and the Politics of Opportunity Allocation:
The Workplace and the Law. Boston: Kluwer Academic.
Gil, D. 1970. Vioknce Against Children. Cambridge, Mass.: Harvard University
Press.
Gilder, G. 1986. Men and Marriage. Gretna, La.: Pelican Publishing.
Gionfriddo, 1. J. 1985. The Dumbing Down of Textbooks: An Analysis of
Six Textbook Editions during a Twelve Year Span. Ph.D. dissertation, Kean
College.
Glass, G. V. 1976. Primary, secondary, and meta-analytic research. Educational
Researcher 5:3-8.
Glass, G. V., McGaw, B., and Smith, M. 1. 1982. Meta-Analysis in Social Re-
search. Beverly Hills, Cal.: Sage Publications.
Glazer, N. 1988. The Limits of Social Policy. Cambridge, Mass.: Harvard Uni-
versity Press.
Goddard, H. H. 1914. Feeble-Mindedness. Its Causes and Consequences. New
York: Macmillan.
Goldman, R. D., and Hewitt, B. N. 1976. Predicting the success of black, Chi-
cano, Oriental and white college students. ]. of Educational Measurement
13:107-117.
Goldman, R. D., and Richards, R. 1974. The SAT prediction of grades for Mex-
ican-American versus Anglo-American students at the University of Cali-
fornia, Riverside. J, of Educational Measurement 1 1: 129-135.
Goldman, R. D., and Widawski, M. H. 1976. An analysis of types of errors in
the selection of minority college students. J. of Educational Measurement
13:185-200.
Goodman, P. 1962. Growing Up Absurd: Probkm of Youth in the Organized So-
ciety. New York: Vintage Books.
Goodnow, J. J., Cashmore, J., Cotton, S., and Knight, R. 1984. Mothers' de-
velopmental timetables in two cultural groups. International J. of Psych.
19:193-205.
Academic Bibliography on Social Science
- The text provides a comprehensive list of academic citations focusing on the intersection of psychology, sociology, and public policy.
- Several entries examine the validity and political implications of aptitude and occupational testing in the workplace and education.
- The bibliography highlights significant research into the relationship between IQ, socioeconomic status, and social outcomes like delinquency.
- Works by prominent critics and theorists, such as Stephen Jay Gould and Nathan Glazer, are included to represent diverse perspectives on human equality and social policy.
- The collection covers a broad range of sensitive topics including racial differences in test scores, child violence, and the 'dumbing down' of educational materials.
Gould, S. J. 1984. Human equality is a contingent fact of history.
792
Bibliography
Bibliography
793
Freeman, R. B. 1976. The Overeducated American. New York: Academic Press.
Freeman, R. B. 1983. Crime and unemployment. In Crime and Public Policy.
J. Q. Wilson (ed.). San Francisco: Institute for Contemporary Studies, pp.
89-106.
Freeman, R. B. 1984. Affirmative action: Good, bad, or irrelevant? New Per-
spectives 16:23-27.
Friedman, M. 1962. Capitalism and Freedom. Chicago: University of Chicago
Press.
Friedman, S. B., and Morse, C. W. 1974. Child abuse: A 5-year follow-up of
early case finding in the emergency department. Pediamcs 54:404410.
Friedman, T., and Williams, E. B. 1982. Current use of tests for employment.
In Ability Testing: Uses, Consequences, and Controversies, Vol. 2. A. K. Wig-
dor and W. R. Gamer (eds.). Washington, D.C.: National Academy Press,
pp. 99-169.
Frydman, M., and Lynn, R. 1989. The intelligence of Korean children adopted
in Belgium. Personality and Individual Differences 10: 1323-1 325.
Fryer, D. 1922. Occupational-intelligence standards. School and Society
16:273-276.
Fuchs, D., and Fuchs, L. S. 1986. Test procedure bias: A meta-analysis of ex-
aminer familiarity effects. Rev. of Educational Research 56:243-262.
Furstenberg, F. F., Jr., Morgan, S. P., Moore, K. A., and Peterson, 1. L. 1987.
Race differences in the timing of adolescent intercourse. Am. Sociological
Rev. 5251 1-5 18.
Gabriel, P. E. 1991. A comparison of the occupational distributions of native-
and foreign-bom males: An immigration consideration. Am. J. of Econ. and
Sociology 50:35 1-364.
Galton, F. 1869. Hereditary Genius: An Inquiry into Its Laws and Consequences.
1892 ed. London: Macmillan.
Galton, F, 1883. Inquiries into Human Faculty and Its Development. London:
Macmillan.
Galton, E 1888. Co-relations and their measurement, chiefly from anthropo-
logical data. Proceedings of the Royal Society of London 45:135-145.
Gamble, T. I., and Zigler, E. 1989. The Head Start synthesis project: A critique.
I . of Applied Developmental Psych. 10:267-274.
Garbarino,]., and Crouter, A. 1978. Defining the community context for par-
ent-child relations: The correlates of child maltreatment. Child Development
49:604-616.
Garber, H. 1. 1988. The Milwaukee Project: Preventing Mental Retardation in Chil-
drenat Risk. Washington, D.C.: American Association on Mental Retardation.
Garher, H. L., and Hodge, J. D. 1991. Understanding intervention, ~nocula-
tion, and risk for intellectual deceleration: A reply to Locurto. lntellrgence
15:317-325.
Gardner, H. 1983. Frames of Mind: The Theory of Multipk Intelligences. New
York: Basic Books.
Gergen, K. I., and Ullman, M. 1977. Socialization and the characterological
basis of political activism. In Handbook of Political Socialization. S. A. Ren-
shon (ed.). New York: Free Press, pp. 41 1-442.
Ghiselin, M. T., and Scudo, F. M. 1986. The bioeconomics of phenotypic se-
lection. Behavioral and Brain Sciences 9: 194-195.
Ghiselli, E. E. 1966. The Validity of Occupational A p t i d Tests. New York: Wiley.
Ghiselli, E. E. 1973. The validity of aptitude tests in personnel selection. Per-
sonnel Psych. 26:461-477.
Ghiselli, E. E., and Brown, C. W. 1947. Learning in accident reduction. J, of
Applied Psych. 3 1:580-582.
Gifford, B. R. (ed.). 1989. Test Policy and the Politics of Opportunity Allocation:
The Workplace and the Law. Boston: Kluwer Academic.
Gil, D. 1970. Vioknce Against Children. Cambridge, Mass.: Harvard University
Press.
Gilder, G. 1986. Men and Marriage. Gretna, La.: Pelican Publishing.
Gionfriddo, 1. J. 1985. The Dumbing Down of Textbooks: An Analysis of
Six Textbook Editions during a Twelve Year Span. Ph.D. dissertation, Kean
College.
Glass, G. V. 1976. Primary, secondary, and meta-analytic research. Educational
Researcher 5:3-8.
Glass, G. V., McGaw, B., and Smith, M. 1. 1982. Meta-Analysis in Social Re-
search. Beverly Hills, Cal.: Sage Publications.
Glazer, N. 1988. The Limits of Social Policy. Cambridge, Mass.: Harvard Uni-
versity Press.
Goddard, H. H. 1914. Feeble-Mindedness. Its Causes and Consequences. New
York: Macmillan.
Goldman, R. D., and Hewitt, B. N. 1976. Predicting the success of black, Chi-
cano, Oriental and white college students. ]. of Educational Measurement
13:107-117.
Goldman, R. D., and Richards, R. 1974. The SAT prediction of grades for Mex-
ican-American versus Anglo-American students at the University of Cali-
fornia, Riverside. J, of Educational Measurement 1 1: 129-135.
Goldman, R. D., and Widawski, M. H. 1976. An analysis of types of errors in
the selection of minority college students. J. of Educational Measurement
13:185-200.
Goodman, P. 1962. Growing Up Absurd: Probkm of Youth in the Organized So-
ciety. New York: Vintage Books.
Goodnow, J. J., Cashmore, J., Cotton, S., and Knight, R. 1984. Mothers' de-
velopmental timetables in two cultural groups. International J. of Psych.
19:193-205.
794
Bibliography
Bibliography
795
Gordon, R. A. 1984. Digits backward and the Mercer-Kamin Law: An empir-
ical response to Mercer's treatment of internal validity of IQ tests. In Per-
spectives on "Bias in Mental Testing." C. R. Reynolds and R. T. Brown (eds.).
New York: Plenum Press, pp. 357-506.
Gordon, R. A. 1987. SES versus IQ in the race-IQ-delinquency model. lnter-
national J . of Sociology and Social Policy 7:30-96.
Gordon, R. A. 1976. Prevalence: The rare datum in delinquency measurement
and its implications for the theory of delinquency. In The Juvenile Justice Sys-
tem. M. W. Klein (ed.). Beverly Hills, Cal.: Sage Publications, pp. 201-284.
Goring, C. 1913. The English Convict: A Statistical Study. London: Darling and
Son.
Gottfredson, L. S. 1986. Societal consequences of the g factor in employment.
J, of Vocational Behavior 29:379410.
Gottfredson, M. R., and Hirschi, T. 1990. A General Theory of Cnme. Stanford,
Cal.: Stanford University Press.
Gottfried, A. W. 1984. Home environment and early cognitive development:
Integration, meta-analyses, and conclusions. In Home Environment and Early
Cognitive Development. A. W. Gottfried (ed.). Orlando, Fla.: Academic
Press, pp. 329-342.
Gould, S. J. 1978. Morton's ranking of races by cranial capacity. Sctence
200503-509.
Gould, S. J. 1981. The Mismeasure of Man. New York: W. W. Norton.
Gould, S. J. 1984. Human equality is a contingent fact of history. Natural His-
tory, November, pp. 26-33.
Gove, P, B. (ed.). 1964. Webster's Third New International Dicnonary ofthe Eng-
lish Lanpge Unabdged. Springfield, Mass.: G. & C. Merriam.
Granberg, D., and Holmberg, S. 1990. The intention-hehavior relationship
among U.S., and Swedish voters. Social Psych. Quarterly 53:44-54.
Griliches, Z. 1970. Notes on the role of education in production functions
and growth accounting. Education, lncome and Human Capital 35:71-
127.
Grossman, M. 1975. The correlation between health and schooling. In House-
hold Production and Consumption. N. E. Terleckyj (ed.). New York: Colum-
bia University Press, pp. 147-21 1.
Guilford, J. l? 1967. The Nature of Human Intelligence. New York: McGraw-
Hill.
Guion, R. M. 1983. Comments on Hunter. In Pe~fonnance Measurement and
Theory. Frank Landy, S. Zedeck, and J. Cleveland (eds.). Hillsdale, N.J.:
Lawrence Erlbaum Associates, pp. 267-275.
Gustafsson, J.-E. 1992. The "Spearman hypothesis" is false. Multivariate Be-
havioral Research 27:265-267.
Guterman, S. S. 1979. 1Q tests in research on social stratification: The cross-
class validity of the tests. Sociology of Education 52: 163-1 73.
Guttman, L. 1992. The irrelevance of factor analysis for the study of group dif-
ferences. Multivariate Behavioral Research 27:175-204.
Hack, M., Breslau, N., Weissman, B., Aram, D., Klein, N., and Borawski, E.
1991. Effect of very low birth weight and subnormal head size on cognitive
abilities at school age. New EnghndJ. of Medicine 325:231-237.
Hacker, A. 1992. An affirmative vote for affirmative action. Academic Ques-
tions 5:24-28.
Hahn, A., and Lefkowitz, J. 1987. Dropouts in America: Enough Is Known for
Action. Washington, D.C.: Institute for Educational Leadership.
Hale, R. L. 1983. An examination for construct bias in the WISC-R across so-
cioeconomic status. l. of School Psych. 21:153-156.
Hale, R. L., Raymond, M. R., and Gajar, A. H. 1982. Evaluatingsocioeconomic
status bias in the WISC-R. J. of School Psych. 20:145-149.
Hall, V. C., and Turner, R. R. 1974. The validity of the "different language ex-
planation" for poor scholastic performance by black students. Rev. of Edu-
cational Research 44:69-81.
Hamilton, A., Madison, J., and Jay, J. 1787. The Federalist Papers. New York:
New American Library, 1982.
Hanson, S. L., Morrison, D. R., and Ginsburg, A. L. 1989. The antecedents of
teenage fatherhood. Demopaphy 26579-596.
Hartigan, 1. A., and Wigdor, A. K. (eds.). 1989. Fairness in Employment Test-
ing: Validity Generalization, Minority Issues, and the General Aptitude Test Bat-
tery. Washington, D.C.: National Academy Press.
Harvey, S. K., and Harvey, T. G. 1970. Adolescent political outlook: The ef-
fects of intelligence as an independent variable. Midwest J. of Political Sci-
ence 14565-595.
Haskell, M. R., and Yablonsky, L. 1978. Criminobm: Crime and Criminality. 2d
ed. Chicago: Rand McNally.
Haskins, R. 1989. Beyond metaphor: The efficacy of early childhood educa-
tion. Am. Psychologist 44:274-282.
Hass, P. H. 1972. Maternal role incompatibility and fertility in urban Latin
America. 1. of Social Issues 28:lll-127.
Hativa, N. 1988. Computer-based drill and practice in arithmetic: Widening
the gap between high- and low-achieving students. Am. Educational Re-
search Journal 25:366397.
Hawk, J. 1970. Linearity of criterion-GATB aptitude relationships. Measure-
ment and Evaluation in Guidance 2:249-251.
Hawk, J. 1986. Real world implications of g. J. of Vocational Behavior
2941 1-414.
Scholarly References on Human Capital
- The bibliography lists foundational research on the intersection of education, intelligence, and economic productivity.
- Several entries focus on the validity of standardized testing across different socioeconomic and racial groups.
- The text includes studies on the long-term effects of early childhood education and birth weight on cognitive development.
- Research on social stratification and assortative mating highlights how educational levels influence societal structures.
- The collection spans diverse fields including psychometrics, sociology, criminology, and political science.
Social inequality and assortative mating: Cause or consequence?
794
Bibliography
Bibliography
795
Gordon, R. A. 1984. Digits backward and the Mercer-Kamin Law: An empir-
ical response to Mercer's treatment of internal validity of IQ tests. In Per-
spectives on "Bias in Mental Testing." C. R. Reynolds and R. T. Brown (eds.).
New York: Plenum Press, pp. 357-506.
Gordon, R. A. 1987. SES versus IQ in the race-IQ-delinquency model. lnter-
national J . of Sociology and Social Policy 7:30-96.
Gordon, R. A. 1976. Prevalence: The rare datum in delinquency measurement
and its implications for the theory of delinquency. In The Juvenile Justice Sys-
tem. M. W. Klein (ed.). Beverly Hills, Cal.: Sage Publications, pp. 201-284.
Goring, C. 1913. The English Convict: A Statistical Study. London: Darling and
Son.
Gottfredson, L. S. 1986. Societal consequences of the g factor in employment.
J, of Vocational Behavior 29:379410.
Gottfredson, M. R., and Hirschi, T. 1990. A General Theory of Cnme. Stanford,
Cal.: Stanford University Press.
Gottfried, A. W. 1984. Home environment and early cognitive development:
Integration, meta-analyses, and conclusions. In Home Environment and Early
Cognitive Development. A. W. Gottfried (ed.). Orlando, Fla.: Academic
Press, pp. 329-342.
Gould, S. J. 1978. Morton's ranking of races by cranial capacity. Sctence
200503-509.
Gould, S. J. 1981. The Mismeasure of Man. New York: W. W. Norton.
Gould, S. J. 1984. Human equality is a contingent fact of history. Natural His-
tory, November, pp. 26-33.
Gove, P, B. (ed.). 1964. Webster's Third New International Dicnonary ofthe Eng-
lish Lanpge Unabdged. Springfield, Mass.: G. & C. Merriam.
Granberg, D., and Holmberg, S. 1990. The intention-hehavior relationship
among U.S., and Swedish voters. Social Psych. Quarterly 53:44-54.
Griliches, Z. 1970. Notes on the role of education in production functions
and growth accounting. Education, lncome and Human Capital 35:71-
127.
Grossman, M. 1975. The correlation between health and schooling. In House-
hold Production and Consumption. N. E. Terleckyj (ed.). New York: Colum-
bia University Press, pp. 147-21 1.
Guilford, J. l? 1967. The Nature of Human Intelligence. New York: McGraw-
Hill.
Guion, R. M. 1983. Comments on Hunter. In Pe~fonnance Measurement and
Theory. Frank Landy, S. Zedeck, and J. Cleveland (eds.). Hillsdale, N.J.:
Lawrence Erlbaum Associates, pp. 267-275.
Gustafsson, J.-E. 1992. The "Spearman hypothesis" is false. Multivariate Be-
havioral Research 27:265-267.
Guterman, S. S. 1979. 1Q tests in research on social stratification: The cross-
class validity of the tests. Sociology of Education 52: 163-1 73.
Guttman, L. 1992. The irrelevance of factor analysis for the study of group dif-
ferences. Multivariate Behavioral Research 27:175-204.
Hack, M., Breslau, N., Weissman, B., Aram, D., Klein, N., and Borawski, E.
1991. Effect of very low birth weight and subnormal head size on cognitive
abilities at school age. New EnghndJ. of Medicine 325:231-237.
Hacker, A. 1992. An affirmative vote for affirmative action. Academic Ques-
tions 5:24-28.
Hahn, A., and Lefkowitz, J. 1987. Dropouts in America: Enough Is Known for
Action. Washington, D.C.: Institute for Educational Leadership.
Hale, R. L. 1983. An examination for construct bias in the WISC-R across so-
cioeconomic status. l. of School Psych. 21:153-156.
Hale, R. L., Raymond, M. R., and Gajar, A. H. 1982. Evaluatingsocioeconomic
status bias in the WISC-R. J. of School Psych. 20:145-149.
Hall, V. C., and Turner, R. R. 1974. The validity of the "different language ex-
planation" for poor scholastic performance by black students. Rev. of Edu-
cational Research 44:69-81.
Hamilton, A., Madison, J., and Jay, J. 1787. The Federalist Papers. New York:
New American Library, 1982.
Hanson, S. L., Morrison, D. R., and Ginsburg, A. L. 1989. The antecedents of
teenage fatherhood. Demopaphy 26579-596.
Hartigan, 1. A., and Wigdor, A. K. (eds.). 1989. Fairness in Employment Test-
ing: Validity Generalization, Minority Issues, and the General Aptitude Test Bat-
tery. Washington, D.C.: National Academy Press.
Harvey, S. K., and Harvey, T. G. 1970. Adolescent political outlook: The ef-
fects of intelligence as an independent variable. Midwest J. of Political Sci-
ence 14565-595.
Haskell, M. R., and Yablonsky, L. 1978. Criminobm: Crime and Criminality. 2d
ed. Chicago: Rand McNally.
Haskins, R. 1989. Beyond metaphor: The efficacy of early childhood educa-
tion. Am. Psychologist 44:274-282.
Hass, P. H. 1972. Maternal role incompatibility and fertility in urban Latin
America. 1. of Social Issues 28:lll-127.
Hativa, N. 1988. Computer-based drill and practice in arithmetic: Widening
the gap between high- and low-achieving students. Am. Educational Re-
search Journal 25:366397.
Hawk, J. 1970. Linearity of criterion-GATB aptitude relationships. Measure-
ment and Evaluation in Guidance 2:249-251.
Hawk, J. 1986. Real world implications of g. J. of Vocational Behavior
2941 1-414.
Bibliography
797
Heath, A. C.. et al. 1985. No decline in assortative mating for eilucational
level. Behavim Genetics 15:349-369.
Heath, A. C., Eaves, L. J., Nance, W. E., and Corey, L. A. 1987. Social in-
equality and assortative mating: Cause or consequence? Behavior Genetics
17:9-17.
Heath, S. 1983. Ways with Words. New York: Cambridge University Press.
Heath, S. B. 1982. What no bedtime story means: Narrative skills at home and
school. Language and Society 11:49-76.
Heckman, J. J. 1993. What have we learned about labor supply in the past
twenty years?Am. Econ. Rev. 83:116-126.
Heckman, J. J., and Payner, B. 1989. Determining the impact of federal an-
tidiscrimination policy on the economic status of blacks: A stuciy of South
Carolina. Am. Econ. Rev. 79: 138-1 77.
Heckman, J. J., and Verkerke, J. H. 1990. Racial disparity and employment dis-
crimination law: An economic perspective. Yale Lnw and Policv Rev. 8:
276-298.
Hegar, R. L., and Yungman, J. J. 1989. Toward a causal typology of child ne-
glect. Children and Youth Services Rev. 11:203-220.
Heilman. M. E.. Block. C. J.. and Lucas. J. A. 1992 Presumed incompetent?
Stigmatization and affirmative action efforts. I. of Applied P~vch.
77536-544.
Helms, J. E. 1992. Why is there no study of cultural equivalence in standard-
ized cognitive ability testing? Am. Psychologist 47:1083-1101.
Herrenkohl, R. C., Herrenkohl, E. C., and Egolf, B. P. 1983. Circumstances
surrounding the occurrence of child maltreatment.). of Consultingand Clin-
ical Psych. 51:424-43 1.
Hermstein, R. J. 1971. I.Q. Atlantic Monthly (Septemher): 43-64.
Hermstein, R. J. 1973. ZQ in the Meritocracy. Boston: Atlantic-Little Brown.
Hemstein, R. J. 1982. IQ testing and the media. Atlantic Monthly (August):
68-74.
Hermstein. R. J.. Belke. T, and Taylor, J. 1990. New York City Police
Dept. Class of June 1940: A Preliminary Report. Harvard University.
Photocopy.
Herrnstein. R. J.. and Boring, E. G. 1965. A Source Book in the H ~ s t q
of Pry-
cholom. Cambridge, Mass.: Harvard University Press.
Hermstein, R. J., Nickerson, R. S.. De Sanchez, M., and Swets, J. A. 1986.
Teaching thinking skills. Am. Psychologist 41: 1279-1 289.
Hess, R. D., and Tomey, J. V. 1967. The Development of Political Attitudes in Chil-
dren. Chicago: Aldine.
Hickman, J. A.. and Reynolds. C. R 1987. Are race differences in mental test
scores an artifact of psychometric methods? A test of Harrington's experi-
mental model. 1. of Special Education 20:409-430.
Higgins, J. V., Reed, E. W., and Reed, S. C. 1962. Intelligence and family size:
A paradox resolved. Social Biology 934-90.
Higham, J. 1973. Strangers in the Land. New York: Atheneum.
Higharn, J. 1984. Send These to Me: lmmipants in Urban America. Rev. ed. Bal-
timore: Johns Hopkins University Press.
Hill, C. R. 1979. Capacities, opportunities and educaticlnal investments: The
case of the high school dropout. Rev. of Economics and Statistics 61:9-20.
Hill, D. R., and Luttbeg, N. R. 1983. Trends in American Electoral Behavior. 2d
ed. Itasca, Ill.: E E. Peacock Publishers.
Hilliard, A. G., 111. 1979. Standardization and cultural bias impediments to the
scientific study and validation of "intelligence."). of Research and Develop-
ment in Education 12:47-58.
Hilliard, A. G. 111. 1984. 1Q Testing as the emperor's new clothes: A critique
of Jensen's "Bias in Mental Testing." In Perspectives on "Bias in Mental Test-
ing." C. R. Reynolds and R. T. Brown (eds.). New York: Plenum Press, pp.
139-169.
Hills, B. J. 1980. Vision, visibility, and perception in driving Perception
9: 183-2 16.
Himtnelfarh, G. 1984. The ldea of Poverty: England in the Early Industrial Age.
New York: Alfred A. Knopf.
Hindelang, M. J. 1978. Race and involvement in common law personal crimes.
Am. Sociological Rev. 43:93-109.
Hindelang, M. J. 1981. Variations in sex-race-age-specific incidence rates of
offknding. Am. Sociological Rev. 4646 1-474.
Hindelang, M. J., Hirschi, T., and Weis,]. G. 1981. Measuring Delinquency. Bev-
erly Hills, Cal.: Sage Publications.
Hirsch, J. 1975. The bankruptcy of "science" without scholarship. Educational
Theow 25:3-28.
Hirschi, T. 1969. Causes of Delinquency. Berkeley, Cal.: University of Califor-
nia Press.
Hirschi, T., and Hindelang, M. J. 1977. Intelligence and delinquency: A revi-
sionist review. Am. Sociological Rev. 42571-587.
Hirschl, T. A., and Rank, M. R. 1991. The effect of population density on wel-
fare participation. Social Forces 70:225-235.
Hohbes, T. 165 1. Leviathan. 1950 ed., New York: Dutton.
Hofferth, S. L. 1984. Kin networks, race, and family structure. J. of Marriage
and the Family 46:791-801.
Hoffman, S. D. 1987. Correlates of welfare receipt and dependency. In Welfare
Dependency: Behavior, Culture and Public Policy. K. R. Hopkins (ed.).
Alexandria, Va.: Hudson Institute, pp. 3.1-3.30.
Hogan, D. P., Hao, L.-X., and Parish, W. L. 1990. Race, kin networks, and as-
sistance to mother-headed families. Social Forces 68:797-812.
Scholarly References on Intelligence and Society
- The text provides a comprehensive bibliography of academic sources focusing on the intersection of intelligence (IQ), race, and socioeconomic outcomes.
- Significant attention is given to the works of R. J. Herrnstein, exploring the role of IQ in meritocracy and its portrayal in the media.
- Several citations address the legal and social implications of racial disparity, employment discrimination, and affirmative action efforts.
- The list includes research into the psychological and environmental factors of child neglect, maltreatment, and family structure.
- Multiple entries critique the validity of standardized testing, specifically examining potential cultural bias and psychometric artifacts.
- The bibliography spans diverse fields including economics, sociology, criminology, and political science to contextualize human behavior.
Hilliard, A. G. 111. 1984. 1Q Testing as the emperor's new clothes: A critique of Jensen's "Bias in Mental Testing."
Bibliography
797
Heath, A. C.. et al. 1985. No decline in assortative mating for eilucational
level. Behavim Genetics 15:349-369.
Heath, A. C., Eaves, L. J., Nance, W. E., and Corey, L. A. 1987. Social in-
equality and assortative mating: Cause or consequence? Behavior Genetics
17:9-17.
Heath, S. 1983. Ways with Words. New York: Cambridge University Press.
Heath, S. B. 1982. What no bedtime story means: Narrative skills at home and
school. Language and Society 11:49-76.
Heckman, J. J. 1993. What have we learned about labor supply in the past
twenty years?Am. Econ. Rev. 83:116-126.
Heckman, J. J., and Payner, B. 1989. Determining the impact of federal an-
tidiscrimination policy on the economic status of blacks: A stuciy of South
Carolina. Am. Econ. Rev. 79: 138-1 77.
Heckman, J. J., and Verkerke, J. H. 1990. Racial disparity and employment dis-
crimination law: An economic perspective. Yale Lnw and Policv Rev. 8:
276-298.
Hegar, R. L., and Yungman, J. J. 1989. Toward a causal typology of child ne-
glect. Children and Youth Services Rev. 11:203-220.
Heilman. M. E.. Block. C. J.. and Lucas. J. A. 1992 Presumed incompetent?
Stigmatization and affirmative action efforts. I. of Applied P~vch.
77536-544.
Helms, J. E. 1992. Why is there no study of cultural equivalence in standard-
ized cognitive ability testing? Am. Psychologist 47:1083-1101.
Herrenkohl, R. C., Herrenkohl, E. C., and Egolf, B. P. 1983. Circumstances
surrounding the occurrence of child maltreatment.). of Consultingand Clin-
ical Psych. 51:424-43 1.
Hermstein, R. J. 1971. I.Q. Atlantic Monthly (Septemher): 43-64.
Hermstein, R. J. 1973. ZQ in the Meritocracy. Boston: Atlantic-Little Brown.
Hemstein, R. J. 1982. IQ testing and the media. Atlantic Monthly (August):
68-74.
Hermstein. R. J.. Belke. T, and Taylor, J. 1990. New York City Police
Dept. Class of June 1940: A Preliminary Report. Harvard University.
Photocopy.
Herrnstein. R. J.. and Boring, E. G. 1965. A Source Book in the H ~ s t q
of Pry-
cholom. Cambridge, Mass.: Harvard University Press.
Hermstein, R. J., Nickerson, R. S.. De Sanchez, M., and Swets, J. A. 1986.
Teaching thinking skills. Am. Psychologist 41: 1279-1 289.
Hess, R. D., and Tomey, J. V. 1967. The Development of Political Attitudes in Chil-
dren. Chicago: Aldine.
Hickman, J. A.. and Reynolds. C. R 1987. Are race differences in mental test
scores an artifact of psychometric methods? A test of Harrington's experi-
mental model. 1. of Special Education 20:409-430.
Higgins, J. V., Reed, E. W., and Reed, S. C. 1962. Intelligence and family size:
A paradox resolved. Social Biology 934-90.
Higham, J. 1973. Strangers in the Land. New York: Atheneum.
Higharn, J. 1984. Send These to Me: lmmipants in Urban America. Rev. ed. Bal-
timore: Johns Hopkins University Press.
Hill, C. R. 1979. Capacities, opportunities and educaticlnal investments: The
case of the high school dropout. Rev. of Economics and Statistics 61:9-20.
Hill, D. R., and Luttbeg, N. R. 1983. Trends in American Electoral Behavior. 2d
ed. Itasca, Ill.: E E. Peacock Publishers.
Hilliard, A. G., 111. 1979. Standardization and cultural bias impediments to the
scientific study and validation of "intelligence."). of Research and Develop-
ment in Education 12:47-58.
Hilliard, A. G. 111. 1984. 1Q Testing as the emperor's new clothes: A critique
of Jensen's "Bias in Mental Testing." In Perspectives on "Bias in Mental Test-
ing." C. R. Reynolds and R. T. Brown (eds.). New York: Plenum Press, pp.
139-169.
Hills, B. J. 1980. Vision, visibility, and perception in driving Perception
9: 183-2 16.
Himtnelfarh, G. 1984. The ldea of Poverty: England in the Early Industrial Age.
New York: Alfred A. Knopf.
Hindelang, M. J. 1978. Race and involvement in common law personal crimes.
Am. Sociological Rev. 43:93-109.
Hindelang, M. J. 1981. Variations in sex-race-age-specific incidence rates of
offknding. Am. Sociological Rev. 4646 1-474.
Hindelang, M. J., Hirschi, T., and Weis,]. G. 1981. Measuring Delinquency. Bev-
erly Hills, Cal.: Sage Publications.
Hirsch, J. 1975. The bankruptcy of "science" without scholarship. Educational
Theow 25:3-28.
Hirschi, T. 1969. Causes of Delinquency. Berkeley, Cal.: University of Califor-
nia Press.
Hirschi, T., and Hindelang, M. J. 1977. Intelligence and delinquency: A revi-
sionist review. Am. Sociological Rev. 42571-587.
Hirschl, T. A., and Rank, M. R. 1991. The effect of population density on wel-
fare participation. Social Forces 70:225-235.
Hohbes, T. 165 1. Leviathan. 1950 ed., New York: Dutton.
Hofferth, S. L. 1984. Kin networks, race, and family structure. J. of Marriage
and the Family 46:791-801.
Hoffman, S. D. 1987. Correlates of welfare receipt and dependency. In Welfare
Dependency: Behavior, Culture and Public Policy. K. R. Hopkins (ed.).
Alexandria, Va.: Hudson Institute, pp. 3.1-3.30.
Hogan, D. P., Hao, L.-X., and Parish, W. L. 1990. Race, kin networks, and as-
sistance to mother-headed families. Social Forces 68:797-812.
Sociological and Psychometric Bibliography
- The text provides a comprehensive list of academic references focusing on the intersection of social policy, race, and family structure.
- Several citations explore the dynamics of welfare dependency, AFDC income, and their effects on family dissolution and kin networks.
- A significant portion of the bibliography is dedicated to psychometric research regarding cognitive ability and job performance predictors.
- The entries include studies on the validity of standardized testing in employment contexts, specifically the General Aptitude Test Battery (GATB).
- Research on educational attainment and the limits of affirmative action in higher education is also represented.
- The collection highlights the work of prominent researchers like J. E. Hunter and L. G. Humphreys in the field of vocational behavior.
Social deviance and political marginality: Toward a redefinition of the relation between sociology and politics.
Bibliography
797
Heath, A. C.. et al. 1985. No decline in assortative mating for eilucational
level. Behavim Genetics 15:349-369.
Heath, A. C., Eaves, L. J., Nance, W. E., and Corey, L. A. 1987. Social in-
equality and assortative mating: Cause or consequence? Behavior Genetics
17:9-17.
Heath, S. 1983. Ways with Words. New York: Cambridge University Press.
Heath, S. B. 1982. What no bedtime story means: Narrative skills at home and
school. Language and Society 11:49-76.
Heckman, J. J. 1993. What have we learned about labor supply in the past
twenty years?Am. Econ. Rev. 83:116-126.
Heckman, J. J., and Payner, B. 1989. Determining the impact of federal an-
tidiscrimination policy on the economic status of blacks: A stuciy of South
Carolina. Am. Econ. Rev. 79: 138-1 77.
Heckman, J. J., and Verkerke, J. H. 1990. Racial disparity and employment dis-
crimination law: An economic perspective. Yale Lnw and Policv Rev. 8:
276-298.
Hegar, R. L., and Yungman, J. J. 1989. Toward a causal typology of child ne-
glect. Children and Youth Services Rev. 11:203-220.
Heilman. M. E.. Block. C. J.. and Lucas. J. A. 1992 Presumed incompetent?
Stigmatization and affirmative action efforts. I. of Applied P~vch.
77536-544.
Helms, J. E. 1992. Why is there no study of cultural equivalence in standard-
ized cognitive ability testing? Am. Psychologist 47:1083-1101.
Herrenkohl, R. C., Herrenkohl, E. C., and Egolf, B. P. 1983. Circumstances
surrounding the occurrence of child maltreatment.). of Consultingand Clin-
ical Psych. 51:424-43 1.
Hermstein, R. J. 1971. I.Q. Atlantic Monthly (Septemher): 43-64.
Hermstein, R. J. 1973. ZQ in the Meritocracy. Boston: Atlantic-Little Brown.
Hemstein, R. J. 1982. IQ testing and the media. Atlantic Monthly (August):
68-74.
Hermstein. R. J.. Belke. T, and Taylor, J. 1990. New York City Police
Dept. Class of June 1940: A Preliminary Report. Harvard University.
Photocopy.
Herrnstein. R. J.. and Boring, E. G. 1965. A Source Book in the H ~ s t q
of Pry-
cholom. Cambridge, Mass.: Harvard University Press.
Hermstein, R. J., Nickerson, R. S.. De Sanchez, M., and Swets, J. A. 1986.
Teaching thinking skills. Am. Psychologist 41: 1279-1 289.
Hess, R. D., and Tomey, J. V. 1967. The Development of Political Attitudes in Chil-
dren. Chicago: Aldine.
Hickman, J. A.. and Reynolds. C. R 1987. Are race differences in mental test
scores an artifact of psychometric methods? A test of Harrington's experi-
mental model. 1. of Special Education 20:409-430.
Higgins, J. V., Reed, E. W., and Reed, S. C. 1962. Intelligence and family size:
A paradox resolved. Social Biology 934-90.
Higham, J. 1973. Strangers in the Land. New York: Atheneum.
Higharn, J. 1984. Send These to Me: lmmipants in Urban America. Rev. ed. Bal-
timore: Johns Hopkins University Press.
Hill, C. R. 1979. Capacities, opportunities and educaticlnal investments: The
case of the high school dropout. Rev. of Economics and Statistics 61:9-20.
Hill, D. R., and Luttbeg, N. R. 1983. Trends in American Electoral Behavior. 2d
ed. Itasca, Ill.: E E. Peacock Publishers.
Hilliard, A. G., 111. 1979. Standardization and cultural bias impediments to the
scientific study and validation of "intelligence."). of Research and Develop-
ment in Education 12:47-58.
Hilliard, A. G. 111. 1984. 1Q Testing as the emperor's new clothes: A critique
of Jensen's "Bias in Mental Testing." In Perspectives on "Bias in Mental Test-
ing." C. R. Reynolds and R. T. Brown (eds.). New York: Plenum Press, pp.
139-169.
Hills, B. J. 1980. Vision, visibility, and perception in driving Perception
9: 183-2 16.
Himtnelfarh, G. 1984. The ldea of Poverty: England in the Early Industrial Age.
New York: Alfred A. Knopf.
Hindelang, M. J. 1978. Race and involvement in common law personal crimes.
Am. Sociological Rev. 43:93-109.
Hindelang, M. J. 1981. Variations in sex-race-age-specific incidence rates of
offknding. Am. Sociological Rev. 4646 1-474.
Hindelang, M. J., Hirschi, T., and Weis,]. G. 1981. Measuring Delinquency. Bev-
erly Hills, Cal.: Sage Publications.
Hirsch, J. 1975. The bankruptcy of "science" without scholarship. Educational
Theow 25:3-28.
Hirschi, T. 1969. Causes of Delinquency. Berkeley, Cal.: University of Califor-
nia Press.
Hirschi, T., and Hindelang, M. J. 1977. Intelligence and delinquency: A revi-
sionist review. Am. Sociological Rev. 42571-587.
Hirschl, T. A., and Rank, M. R. 1991. The effect of population density on wel-
fare participation. Social Forces 70:225-235.
Hohbes, T. 165 1. Leviathan. 1950 ed., New York: Dutton.
Hofferth, S. L. 1984. Kin networks, race, and family structure. J. of Marriage
and the Family 46:791-801.
Hoffman, S. D. 1987. Correlates of welfare receipt and dependency. In Welfare
Dependency: Behavior, Culture and Public Policy. K. R. Hopkins (ed.).
Alexandria, Va.: Hudson Institute, pp. 3.1-3.30.
Hogan, D. P., Hao, L.-X., and Parish, W. L. 1990. Race, kin networks, and as-
sistance to mother-headed families. Social Forces 68:797-812.
798
Bibliography
Hogan, D. P., and Kitagawa, E. M. 1985. The impact of social status, family
structure, and neighborhood on the fertility of black adolescents. Am. J. of
Sociology 90:825-855.
Holden, C. 1988. Debate warming up on legal immigration policy. Science
241:288-290.
Holzer, H. J. 1986. Reservation wages and their labor market effects for hlack
and white male ~0~1th.
J. of Human Resources 2 1 :157-178.
Honig, M. 1974. AFDC income, recipient rates, and family dissolution. J. of
Human Resources 9:303-322.
Hopkins, K. R., Newitt, J., and Doyle, D. 1987. Educational performance and
attainment. In Welfare Dependency: Behavior, Culture and Public Policy.
K, R. Hopkins (ed.). Alexandria, Va.: Hudson Institute, pp. 8.1-8.68.
Horowitz, I. L., and Liehowitz, L. 1969. Social deviance and political margin-
ality: Toward a redefinition of the relation between sociology and politics.
Social Problems 25:280-296.
Hsia, J. 1988. Limits of affirmative action: Asian American access to higher
education. Educational Policy 2:117-136.
Huber, P. W. 1988. Liability: The Legal Revolution and Its Consequences. New
York: Basic Books.
Humphreys, L. G. 1968. The fleeting nature of the prediction of college acad-
emic success. J. of Educational Psych. 59:375-380.
Humphreys, L. G. 1973. Postdiction study of the graduate record examination
and eight semesters of college grades. J. of Educational Measurement
10:179-184.
Humphreys, L. 0. 1986. Commentary on "The g factor in employment." J. of
Vocational Behavior 29:42 1-437.
Humphreys, L. G., and Taber, T. 1973. Ability factors as a function of advan-
taged and disadvantaged groups. J. of Educational Measurement 10: 107-1 1 5.
Hunter, J. E. 1979. An Analysis of Validity, Djferential Validity, Test Fairness, and
Utility for the Philadelphia Police Officers Sekction Examination Prepared by the
Educational Testing Service. Report to the Philadelphia Federal District
Court, Alvarez v. City of Philadelphia.
Hunter, 1. E. 1980. Test Validation for J2,000]obs: An Application of Synthetic
Validity and Validity Generalization to the General Aptitude Batter?, (GATB).
U.S. Employment Service, U.S. Department of Labor. Washington, D.C.:
Government Printing Office.
Hunter, J. E. 1983. A causal analysis of cognitive ability, job knowledge, joh
performance, and supervisor ratings. In Pe.fmnce Measurement and The-
ory. E Landy, S. Zedeck, and J. Cleveland (eds.). Hillsdale, N.J.: Lawrence
Erlbaum Associates, pp. 257-266.
Hunter, J. E. 1985. Differential validity across jobs in the military. Rockville, Md.:
Research Applications.
Hunter, J. E. 1986. Cognitive ability, cognitive aptitudes, job knowledge, and
joh performance. J. of Vocational Behavior 29:340-362.
Hunter, J. E. 1989. The Wonderlic Personnel Test as a Predictor of Training Suc-
cess and Job Performance. Northfield, Ill.: E. F, Wonderlic Personnel Test.
Hunter, J. E., and Hunter, R.
1984. Validity and utility of alternative pre-
dictors of job performance. Psychological Bull. 96:72-98.
Hunter, J. E., and Schmidt, F. L. 1982. Fitting people to jobs: The impact of
personnel selection on national productivity. In Human Performance and
Productivity: Human Capability Assessment, vol. 1. M. D. Dunnette and E. A.
Fleishman (eds.). Hillsdale, N.J.: Lawrence Erlbaum Associates, pp.
233-284.
Hunter, J. E., and Schmidt, F. L. 1990. Methods of Meta-Analysis: Correcting Er-
rm and Bias in Research Findings. Newhury Park, Cal.: Sage Publications.
Hunter, J. E., Schmidt, F. L., and Judiesch, M. K. 1990. Individual differences
in output variability as a function of job complexity. J , of Applied Psych.
75328-42.
Hushy, R. D. 1993. The minimum wage, wage subsidies, and poverty. Contem-
ptvrary Policy Issues 1 1 :30-38.
Hush, T., and Tuijnman, A. 1991. The contrihution of formal schooling to
the increase in intellectual capital. Educational Researcher 20:17-25.
Hutchens, R.,Jakubson, G., and Schwartz, S. 1987. AFLX: and the formation
of subfamilies. Discussion Paper 832-87. Madison, Wis.: Institute for Re.
search on Poverty.
Ilai, D., and Willerman, L. 1989. Sex differences in MAIS-R item performance.
Intelligence 13:225-234.
Illich, 1. 1970. Deschooling Society. New York: Harper & Row.
lngle, D. 1.1973. Who Should Have Children? An Environmental and Genetic Ap-
proach. New York: Bobbs.Merril1.
Iowa State Department of Public Instruction. 1965. Dropouts: Iowa Public
Schools. Des Moines, Iowa: State of Iowa.
Irwin, P. M. 1992. Elementay and Secondary Education Act of 1965: FY 1993
Guide To Programs. Congressional Research Service. Washington, D.C.:
Government Printing Office.
Itzkoff, S. W. 1993. America's unspoken economic dilemma: Falling intelli-
gence levels. J. of Social, Econ., and Political Studies 18:3 1 1-3 26.
lwawaki, S., and Vernon, P. E. 1988. Japanese abilities and achievements. In
Human Abilities in Cultural Context. S. H. Irvine and J. W. Berry (eds.). New
York: Cambridge University Press, pp. 358-384.
Jargowsky. P, 1993. Ghetto poverty among blacks in the 1980's. University of
Texas at Dallas. Photocopy.
Jaynes, G. D., and R. M. Williams (eds.). 1989. A Common Destiny: Blacks and
American Society. Washington, D.C.: National Academy Press.
Scholarly Bibliography on Intelligence
- The text consists of a comprehensive bibliographic list of academic sources focusing on psychometrics, intelligence, and socio-economic outcomes.
- A significant portion of the citations explores the relationship between IQ, job complexity, and economic success in America.
- Multiple entries address controversial topics including racial differences in test performance and the genetic versus environmental influences on intelligence.
- The list includes seminal works by Arthur Jensen, Christopher Jencks, and Hunter & Schmidt, highlighting key debates in educational psychology.
- Several sources examine the impact of public policy, such as the minimum wage and the Elementary and Secondary Education Act, on social mobility.
Itzkoff, S. W. 1993. America's unspoken economic dilemma: Falling intelligence levels.
798
Bibliography
Hogan, D. P., and Kitagawa, E. M. 1985. The impact of social status, family
structure, and neighborhood on the fertility of black adolescents. Am. J. of
Sociology 90:825-855.
Holden, C. 1988. Debate warming up on legal immigration policy. Science
241:288-290.
Holzer, H. J. 1986. Reservation wages and their labor market effects for hlack
and white male ~0~1th.
J. of Human Resources 2 1 :157-178.
Honig, M. 1974. AFDC income, recipient rates, and family dissolution. J. of
Human Resources 9:303-322.
Hopkins, K. R., Newitt, J., and Doyle, D. 1987. Educational performance and
attainment. In Welfare Dependency: Behavior, Culture and Public Policy.
K, R. Hopkins (ed.). Alexandria, Va.: Hudson Institute, pp. 8.1-8.68.
Horowitz, I. L., and Liehowitz, L. 1969. Social deviance and political margin-
ality: Toward a redefinition of the relation between sociology and politics.
Social Problems 25:280-296.
Hsia, J. 1988. Limits of affirmative action: Asian American access to higher
education. Educational Policy 2:117-136.
Huber, P. W. 1988. Liability: The Legal Revolution and Its Consequences. New
York: Basic Books.
Humphreys, L. G. 1968. The fleeting nature of the prediction of college acad-
emic success. J. of Educational Psych. 59:375-380.
Humphreys, L. G. 1973. Postdiction study of the graduate record examination
and eight semesters of college grades. J. of Educational Measurement
10:179-184.
Humphreys, L. 0. 1986. Commentary on "The g factor in employment." J. of
Vocational Behavior 29:42 1-437.
Humphreys, L. G., and Taber, T. 1973. Ability factors as a function of advan-
taged and disadvantaged groups. J. of Educational Measurement 10: 107-1 1 5.
Hunter, J. E. 1979. An Analysis of Validity, Djferential Validity, Test Fairness, and
Utility for the Philadelphia Police Officers Sekction Examination Prepared by the
Educational Testing Service. Report to the Philadelphia Federal District
Court, Alvarez v. City of Philadelphia.
Hunter, 1. E. 1980. Test Validation for J2,000]obs: An Application of Synthetic
Validity and Validity Generalization to the General Aptitude Batter?, (GATB).
U.S. Employment Service, U.S. Department of Labor. Washington, D.C.:
Government Printing Office.
Hunter, J. E. 1983. A causal analysis of cognitive ability, job knowledge, joh
performance, and supervisor ratings. In Pe.fmnce Measurement and The-
ory. E Landy, S. Zedeck, and J. Cleveland (eds.). Hillsdale, N.J.: Lawrence
Erlbaum Associates, pp. 257-266.
Hunter, J. E. 1985. Differential validity across jobs in the military. Rockville, Md.:
Research Applications.
Hunter, J. E. 1986. Cognitive ability, cognitive aptitudes, job knowledge, and
joh performance. J. of Vocational Behavior 29:340-362.
Hunter, J. E. 1989. The Wonderlic Personnel Test as a Predictor of Training Suc-
cess and Job Performance. Northfield, Ill.: E. F, Wonderlic Personnel Test.
Hunter, J. E., and Hunter, R.
1984. Validity and utility of alternative pre-
dictors of job performance. Psychological Bull. 96:72-98.
Hunter, J. E., and Schmidt, F. L. 1982. Fitting people to jobs: The impact of
personnel selection on national productivity. In Human Performance and
Productivity: Human Capability Assessment, vol. 1. M. D. Dunnette and E. A.
Fleishman (eds.). Hillsdale, N.J.: Lawrence Erlbaum Associates, pp.
233-284.
Hunter, J. E., and Schmidt, F. L. 1990. Methods of Meta-Analysis: Correcting Er-
rm and Bias in Research Findings. Newhury Park, Cal.: Sage Publications.
Hunter, J. E., Schmidt, F. L., and Judiesch, M. K. 1990. Individual differences
in output variability as a function of job complexity. J , of Applied Psych.
75328-42.
Hushy, R. D. 1993. The minimum wage, wage subsidies, and poverty. Contem-
ptvrary Policy Issues 1 1 :30-38.
Hush, T., and Tuijnman, A. 1991. The contrihution of formal schooling to
the increase in intellectual capital. Educational Researcher 20:17-25.
Hutchens, R.,Jakubson, G., and Schwartz, S. 1987. AFLX: and the formation
of subfamilies. Discussion Paper 832-87. Madison, Wis.: Institute for Re.
search on Poverty.
Ilai, D., and Willerman, L. 1989. Sex differences in MAIS-R item performance.
Intelligence 13:225-234.
Illich, 1. 1970. Deschooling Society. New York: Harper & Row.
lngle, D. 1.1973. Who Should Have Children? An Environmental and Genetic Ap-
proach. New York: Bobbs.Merril1.
Iowa State Department of Public Instruction. 1965. Dropouts: Iowa Public
Schools. Des Moines, Iowa: State of Iowa.
Irwin, P. M. 1992. Elementay and Secondary Education Act of 1965: FY 1993
Guide To Programs. Congressional Research Service. Washington, D.C.:
Government Printing Office.
Itzkoff, S. W. 1993. America's unspoken economic dilemma: Falling intelli-
gence levels. J. of Social, Econ., and Political Studies 18:3 1 1-3 26.
lwawaki, S., and Vernon, P. E. 1988. Japanese abilities and achievements. In
Human Abilities in Cultural Context. S. H. Irvine and J. W. Berry (eds.). New
York: Cambridge University Press, pp. 358-384.
Jargowsky. P, 1993. Ghetto poverty among blacks in the 1980's. University of
Texas at Dallas. Photocopy.
Jaynes, G. D., and R. M. Williams (eds.). 1989. A Common Destiny: Blacks and
American Society. Washington, D.C.: National Academy Press.
800
Bibliography
Bibliography
80 1
Jencks, C. 1979. Who Gets Ahead? The Determinants of Economic Success in
America. New York: Basic Books.
Jencks, C., and Peterson, P. E. (eds.). 1991. The Urban Underclass. Washing-
ton, D.C.: Brookings Institution.
Jencks, C., Smith, M., Acland, H., Bane, M. J., Cohen, D., Gintis, H., Heyns,
B., and Michelson, S. 1972. Inequality: A Reassessment of the Effect of Fam-
ily and Schooling in America. New York: Basic Books.
Jennings, J. T. 1991. Voting and Registration in the Election of Nov. 1990. Cur-
rent Population Report Series P-20, No. 453. U.S. Bureau of the Census.
Washington, D.C.: Government Printing Office.
Jensen, A. R. 1969. How much can we boost lQ and scholastic achievement?
Harvard Educational Rev. 39: 1- 1 23.
Jensen, A. R. 1974. How biased are culture-loaded tests? Genetic Psych. Mono-
graphs 90: 185-244.
Jensen, A. R. 1977. Cumulative deficit in IQ of blacks in the rural South. De-
velopmental Psych. 13: 184-191.
Jensen, A. R. 1978. Genetic and behavioral effects of nonrandom mating. In
Human Variation: Biopsychology of Age, Race, and Sex. R. T. Osborne, C. E.
Noble, and N. Weyl (eds.). New York: Academic Press, pp. 5-105.
Jensen, A. R. 1980. Bias in Mental Testing. New York: Free Press.
Jensen, A. R. 1984a. The black-white difference on the K-ABC: Implicat~ons
for future tests. J . of Special Education 18:377408.
Jensen, A. R. 1984b. Test bias: Concepts and criticisms. In Perspectives on "Bias
in Mental Testing." C. R. Reynolds and R. T. Brown (eds.). New York:
Plenum Press, pp. 507-586.
Jensen, A. R. 1985. The nature of the black-white d~fference on various psy-
chometric tests: Spearman's hypothesis. The Behavioral and Brain Sciences.
8:193-258.
Jensen, A. R. 1986. g: Artifact or reality?]. of Vocational Behavior 29:301-33 1.
Jensen, A. R. 1987a. Continuing commentary on "The nature of the black-
white difference on various psychometric tests: Spearman's hypothesis." The
Behavioral and Brain Sciences. 10307-53 7.
Jensen, A. R. 1987b. The g beyond factor analysis. In The Influence of Cogni-
tive Psych. on Testing. Royce R. Ronning, J. A. Glover, J. C. Conoley, and J.
C. Witt (eds.). Hillsdale, N.J.: Lawrence Erlbaum Associates, pp. 87-142.
Jensen, A. R. 1989. Raising IQ without increasing g? A review of "The Mil-
waukee Project: Preventing Mental Retardation in Children at Risk." De-
velopmental Review 9:234-258.
Jensen, A. R. 1990. Speed of information processing in a calculating prodigy.
lntelligence 14:259-274.
Jensen, A. R. 1992. Spearman's hypothesis: Methodology and evidence. Mul-
tivariate Behavioral Research 27:22 5-233.
Jensen, A. R. 1993a. Psychometric g and achievement. In Policy Perspectives on
Educational Testing. R. R. Gifford (ed.). Roston: Kluwer Academic Publish-
ers, pp. 1 17-227.
Jensen, A. R. 1993b. Spearman's hypothesis tested with chronometric infor-
mation-processing tasks. Intelligence 17:44-7 7.
Jensen, A. R., and Faulstich, M. E. 1988. Difference between prisoners and the
general population in psychometric g. Personality and Individual Differences
9:925-928.
Jensen, A. R., and Figueroa, R. A. 1975. Forward and backward digit span in-
teraction with race and IQ: Predictions from Jenscn's theory. ]. of Educa-
tional Psych. 67:882-893.
Jensen, A. R., and Inouye, A. R. 1980. Level 1 and Level I1 abilities in Asian,
white, and black children. Intelligence 44149.
Jensen, A. R., and McGurk, E C. J. 1987. Black-white bias in "cultural" and
"nonc~~ltural"
test items. Personality and Individual Differences. 8:295-301.
Jensen, A. R., and Munro, E. 1979. Reaction time, movement time, and in-
telligence. Intelligence 3:121-126.
Jensen, A. R., and Naglieri, 1. A. 1987. Comparison of black-white differences
on the WISC-R and the K-ABC: Spearman's hypothesis. Intelligence 11:21.
Jensen, A. R., and Reynolds, C. R. 1982. Race, social class and ability patterns
on the WISC-R. Personality and individual Differences 3:423-438.
Jensen, R. F., and Nicholas, K. B. 1984. Influence of the social characteristics
of both father and child on the tendency to report child abuse. Professional
Psych.: Research and Practice 15: 121-1 28.
Johnson, B., and Morse, H. A. 1968. Injured children and their parents. Chil-
dren 15:147-152.
Johnson, K.M., et al. 1984. The nature of human ability: An historical per-
spective on intelligence. Paper presented at the annual meeting of the
American Educational Research Association, New Orleans.
Johnson, R. C., Ahern, E M., and Cole, R. E. 1980. Seci~lar change in degree
of assortative mating for ability? Behavioral Genetics 10: 1-8.
Johnson, R. C., Nagoshi, C. T., and Ahern, E M. 1987. A reply to Heath et al.
on assortatwe mating for educational level. Behavioral Genetics 17:1-7.
Johnson, S. T. 1988. Test fairness and bias: Measuring academic achievement
among black youth. Urban League Rev. 1 1 :76-92.
Johnson, S. T., and Wallace, M. B. 1989. Characteristics of SAT quantitative
items showing improvement after coaching among black students from low-
income families: An exploratory study. Special Issue: The test item.]. of Ed-
ucational Measurement 26:133-145.
Jones, E. E and Forrest, J. D. 1992. Underreporting of abortion in surveys of
U.S. women: 1976 to 1988. Demogyaphy 29:113-126.
Jones, G. E. 1988. Investigation of the efficacy of general ability versus specific
Bibliography of Intelligence Research
- The text provides a comprehensive list of academic citations focusing on psychometric g and cognitive testing.
- A significant portion of the references highlights the work of Arthur R. Jensen and his theories on intelligence.
- The citations cover diverse topics including reaction time, racial differences in IQ, and the prediction of occupational success.
- Several entries explore the social implications of intelligence, such as its relationship to criminal behavior and child abuse reporting.
- The bibliography includes studies on the effectiveness of coaching for standardized tests like the SAT among low-income students.
- Methodological debates are represented through papers on assortative mating and the historical perspective of human ability.
Jensen, A. R. 1989. Raising IQ without increasing g? A review of "The Milwaukee Project: Preventing Mental Retardation in Children at Risk."
800
Bibliography
Bibliography
80 1
Jencks, C. 1979. Who Gets Ahead? The Determinants of Economic Success in
America. New York: Basic Books.
Jencks, C., and Peterson, P. E. (eds.). 1991. The Urban Underclass. Washing-
ton, D.C.: Brookings Institution.
Jencks, C., Smith, M., Acland, H., Bane, M. J., Cohen, D., Gintis, H., Heyns,
B., and Michelson, S. 1972. Inequality: A Reassessment of the Effect of Fam-
ily and Schooling in America. New York: Basic Books.
Jennings, J. T. 1991. Voting and Registration in the Election of Nov. 1990. Cur-
rent Population Report Series P-20, No. 453. U.S. Bureau of the Census.
Washington, D.C.: Government Printing Office.
Jensen, A. R. 1969. How much can we boost lQ and scholastic achievement?
Harvard Educational Rev. 39: 1- 1 23.
Jensen, A. R. 1974. How biased are culture-loaded tests? Genetic Psych. Mono-
graphs 90: 185-244.
Jensen, A. R. 1977. Cumulative deficit in IQ of blacks in the rural South. De-
velopmental Psych. 13: 184-191.
Jensen, A. R. 1978. Genetic and behavioral effects of nonrandom mating. In
Human Variation: Biopsychology of Age, Race, and Sex. R. T. Osborne, C. E.
Noble, and N. Weyl (eds.). New York: Academic Press, pp. 5-105.
Jensen, A. R. 1980. Bias in Mental Testing. New York: Free Press.
Jensen, A. R. 1984a. The black-white difference on the K-ABC: Implicat~ons
for future tests. J . of Special Education 18:377408.
Jensen, A. R. 1984b. Test bias: Concepts and criticisms. In Perspectives on "Bias
in Mental Testing." C. R. Reynolds and R. T. Brown (eds.). New York:
Plenum Press, pp. 507-586.
Jensen, A. R. 1985. The nature of the black-white d~fference on various psy-
chometric tests: Spearman's hypothesis. The Behavioral and Brain Sciences.
8:193-258.
Jensen, A. R. 1986. g: Artifact or reality?]. of Vocational Behavior 29:301-33 1.
Jensen, A. R. 1987a. Continuing commentary on "The nature of the black-
white difference on various psychometric tests: Spearman's hypothesis." The
Behavioral and Brain Sciences. 10307-53 7.
Jensen, A. R. 1987b. The g beyond factor analysis. In The Influence of Cogni-
tive Psych. on Testing. Royce R. Ronning, J. A. Glover, J. C. Conoley, and J.
C. Witt (eds.). Hillsdale, N.J.: Lawrence Erlbaum Associates, pp. 87-142.
Jensen, A. R. 1989. Raising IQ without increasing g? A review of "The Mil-
waukee Project: Preventing Mental Retardation in Children at Risk." De-
velopmental Review 9:234-258.
Jensen, A. R. 1990. Speed of information processing in a calculating prodigy.
lntelligence 14:259-274.
Jensen, A. R. 1992. Spearman's hypothesis: Methodology and evidence. Mul-
tivariate Behavioral Research 27:22 5-233.
Jensen, A. R. 1993a. Psychometric g and achievement. In Policy Perspectives on
Educational Testing. R. R. Gifford (ed.). Roston: Kluwer Academic Publish-
ers, pp. 1 17-227.
Jensen, A. R. 1993b. Spearman's hypothesis tested with chronometric infor-
mation-processing tasks. Intelligence 17:44-7 7.
Jensen, A. R., and Faulstich, M. E. 1988. Difference between prisoners and the
general population in psychometric g. Personality and Individual Differences
9:925-928.
Jensen, A. R., and Figueroa, R. A. 1975. Forward and backward digit span in-
teraction with race and IQ: Predictions from Jenscn's theory. ]. of Educa-
tional Psych. 67:882-893.
Jensen, A. R., and Inouye, A. R. 1980. Level 1 and Level I1 abilities in Asian,
white, and black children. Intelligence 44149.
Jensen, A. R., and McGurk, E C. J. 1987. Black-white bias in "cultural" and
"nonc~~ltural"
test items. Personality and Individual Differences. 8:295-301.
Jensen, A. R., and Munro, E. 1979. Reaction time, movement time, and in-
telligence. Intelligence 3:121-126.
Jensen, A. R., and Naglieri, 1. A. 1987. Comparison of black-white differences
on the WISC-R and the K-ABC: Spearman's hypothesis. Intelligence 11:21.
Jensen, A. R., and Reynolds, C. R. 1982. Race, social class and ability patterns
on the WISC-R. Personality and individual Differences 3:423-438.
Jensen, R. F., and Nicholas, K. B. 1984. Influence of the social characteristics
of both father and child on the tendency to report child abuse. Professional
Psych.: Research and Practice 15: 121-1 28.
Johnson, B., and Morse, H. A. 1968. Injured children and their parents. Chil-
dren 15:147-152.
Johnson, K.M., et al. 1984. The nature of human ability: An historical per-
spective on intelligence. Paper presented at the annual meeting of the
American Educational Research Association, New Orleans.
Johnson, R. C., Ahern, E M., and Cole, R. E. 1980. Seci~lar change in degree
of assortative mating for ability? Behavioral Genetics 10: 1-8.
Johnson, R. C., Nagoshi, C. T., and Ahern, E M. 1987. A reply to Heath et al.
on assortatwe mating for educational level. Behavioral Genetics 17:1-7.
Johnson, S. T. 1988. Test fairness and bias: Measuring academic achievement
among black youth. Urban League Rev. 1 1 :76-92.
Johnson, S. T., and Wallace, M. B. 1989. Characteristics of SAT quantitative
items showing improvement after coaching among black students from low-
income families: An exploratory study. Special Issue: The test item.]. of Ed-
ucational Measurement 26:133-145.
Jones, E. E and Forrest, J. D. 1992. Underreporting of abortion in surveys of
U.S. women: 1976 to 1988. Demogyaphy 29:113-126.
Jones, G. E. 1988. Investigation of the efficacy of general ability versus specific
802
Bibliography
Bibliography
803
ability as predictors of occupational success. Master's thesis, St. Mary's Uni-
versity.
Joynson, R. B. 1989. The Burt Affair. London: Routledge.
Juhn, C., Murphy, K. M., and Pierce, B. 1990. Wage inequality and the rise in
returns to skill. University of Chicago. Photocopy.
Kadushin, A. 1988. Neglect in families. In Mental Illness, Delinquency, Addic-
tions, and Neglect. E. W. Nunnally, C. S. Chilman, and EM. Cox (eds.).
Newbury Park, Calif.: Sage, pp. 147-166.
Karnin, L. 1974. The Science and Politics of IQ. Hillsdale, N.J.: Lawrence Erl-
baum Associates.
Kandel, E., Mednick, S. A., Kirkegaard-Sorensen, L., Hutchings, B., Knop, J.,
Rosenberg, R., and Schulsinger, E 1988. IQ as a protective factor for sub-
jects at high risk for antisocial behavior. ]. of Consulting and Clinical Psych.
56224-226.
Karen, D. 1991. "Achievement" and "ascription" in admission to an elite
college: A political.organizational analysis. Sociological Forum 6:349-380.
Karrnel, L. J., and Karmel, M. 0. 1978. Measurement and Evalmtion in the
School?. 2d ed. New York: Macmillan.
Kasarda, J. D. 1989. Urhan industrial transition and the underclass. Annah of
the Am. Academy of Political and Social Science 501 :26-47.
Katz, L. E, and Murphy, K. M. 1990. Changes in Relative Wages, 1963-1987:
Supply and Demand Factors. Cambridge, Mass.: National Bureau of Eco-
nomic Research.
Kaufman, A. S., and Kaufrnan, N. L. 1983. Kaufi7lan Assessment Butte? for Chil-
dren: interpretive Manual. Circle Pines, Minn.: American Guidance Service.
Kaufrnan, J., and Zigler, E. 1987. Do abused children become abusive parents?
Am. I. ofOrthopsychiatry 57:186-192.
Kaus, M. 1992. The End of Equality. New York: Basic Books.
Keene, K., and Ladd, E. C. 1991. Politics of the professoriate. Am. Enterprise
(July/August): 8687.
Keeves, J. (ed.). 1991. The IEA Study of Science III: C k e s in Science Educa-
tion and Achievement 197044. Oxford: Pergamon Press.
Keller, C., and Fetterly, K. 1978. Legitimacy and mother's education as risk fac-
tors in post neonatal mortality. Paper presented at the American Public
Health Association Annual Meeting, Los Angeles.
Keller, H., Miranda, D., and Gauda, G. 1984. The naive theory of the infant
and some maternal attitudes. I. of Cross-Cultwral Psych. 15:165-179.
Kelley, M. L., Power, T,
G., and Wimbush, D. D. 1992. Determinants of disci-
plinary practices in low-income black mothers. Child Develomnt
63:573-582.
Kelman, M. 1991. Concepts of discrimination in "general ability" job testing.
Harvard Law Rev. 104:1158-1247.
Kempe, A., et al. 1992. Clinical determinants of the racial disparity in very low
birth weight. New England]. of Medicine 327:969-973.
Kendall, I. M., Verster, M. A., and Mollendorf, J. W. V. 1988. Test performance
of blacks in Southern Africa. In Human Abilities in Cultural Context. S. H.
Irvine and J. W. Berry (eds.). Cambridge: Camhridge University Press, pp.
299-339.
Keogh, B. K., and MacMillan, D. L. 1970. Effects of motivational and presen-
tation conditions on digit recall of children of differing socioeconomic,
racial, and intelligence groups. Am. Educational Research J. 8:27-38.
Kevles, D. J. 1985. In the Name of Eugenics: Genetics and the Uses of Human
Heredity. New York: Alfred A. Knopf.
Kinder, D. R., and Sears, D. 0. 1985. Public opinion and political action. In
Handbook of Social Psychology, vol. 2. G. Lindzey and E. Aronson (eds.). New
York: Random House, pp. 659-741.
Kitagawa, E., and Hauser,
M. 1960. Education differences in mortality by
cause of death. Demography 5:3 18-353.
Klein, M., and Stem, L. 1971. Low birth weight and the battered child syn-
drome. Am. j. of Diseases of Children 122: 15-18.
Kleppner, P. 1982. Who Voted? The Dynamics of Ekctoral Turnout, 1870-1980.
New York: Praeger.
Kline, P. 1985. The nature of psychometric g. Behavioral and Brain Sciences
8:234.
Klitgaard, R. 1985. Choosing Elites: Selecting "The Best and the Brightest" at Tot,
Universities and Elsewhere. New York: Basic Books.
Knight, R. A., and Goodnow, J. 1,1988. Parents' beliefs about influences over
cognitive and social development. international]. of Behavioral Development
11:517-527.
Koh, T., Abbatiello, A., and McLoughlin, C. S. 1984. Cultural bias in WISC
subtest items: A response to Judge Grady's suggestion in relation to the PASE
case. School Psych. Rev. 13:89-94.
Kohl, H. 1967.36 Childrep. New York: New American Library.
Kohn, M. L. 1959. Social class and ~arental values. Am. 1. of Sociology
64337-351.
Kominski, R. 1990. Estimating the national high school dropout rate. Demop
raphy 27:303-3 11.
Kosters, M. H. 1993. The earned income tax credit and the working poor. Am.
Enterprise (May-June): 64-72.
Kozol, J. 1967. Death at an Early Age: The Destruction of the Hearts and Minds
of Negro Children. Boston: Houghton Mifflin.
Kozol, J. 1985, illiterate America. Garden City, N.Y.: Anchor Press/Douhleday.
Kozol, J. 1992. Savage Inequalities: Children in America's Schools. New York:
HarperCollins.
Academic Bibliography of Social Sciences
- The text provides a comprehensive list of academic citations focusing on the intersection of intelligence, socioeconomic status, and social outcomes.
- Several entries examine IQ as a protective factor against antisocial behavior and its role in educational achievement.
- The bibliography highlights research into racial and socioeconomic disparities in health, specifically regarding birth weight and mortality rates.
- Multiple sources address the political and organizational dynamics of elite college admissions and the selection of 'the best and the brightest.'
- The collection includes studies on parenting practices, child abuse, and the developmental influences within low-income environments.
IQ as a protective factor for subjects at high risk for antisocial behavior.
802
Bibliography
Bibliography
803
ability as predictors of occupational success. Master's thesis, St. Mary's Uni-
versity.
Joynson, R. B. 1989. The Burt Affair. London: Routledge.
Juhn, C., Murphy, K. M., and Pierce, B. 1990. Wage inequality and the rise in
returns to skill. University of Chicago. Photocopy.
Kadushin, A. 1988. Neglect in families. In Mental Illness, Delinquency, Addic-
tions, and Neglect. E. W. Nunnally, C. S. Chilman, and EM. Cox (eds.).
Newbury Park, Calif.: Sage, pp. 147-166.
Karnin, L. 1974. The Science and Politics of IQ. Hillsdale, N.J.: Lawrence Erl-
baum Associates.
Kandel, E., Mednick, S. A., Kirkegaard-Sorensen, L., Hutchings, B., Knop, J.,
Rosenberg, R., and Schulsinger, E 1988. IQ as a protective factor for sub-
jects at high risk for antisocial behavior. ]. of Consulting and Clinical Psych.
56224-226.
Karen, D. 1991. "Achievement" and "ascription" in admission to an elite
college: A political.organizational analysis. Sociological Forum 6:349-380.
Karrnel, L. J., and Karmel, M. 0. 1978. Measurement and Evalmtion in the
School?. 2d ed. New York: Macmillan.
Kasarda, J. D. 1989. Urhan industrial transition and the underclass. Annah of
the Am. Academy of Political and Social Science 501 :26-47.
Katz, L. E, and Murphy, K. M. 1990. Changes in Relative Wages, 1963-1987:
Supply and Demand Factors. Cambridge, Mass.: National Bureau of Eco-
nomic Research.
Kaufman, A. S., and Kaufrnan, N. L. 1983. Kaufi7lan Assessment Butte? for Chil-
dren: interpretive Manual. Circle Pines, Minn.: American Guidance Service.
Kaufrnan, J., and Zigler, E. 1987. Do abused children become abusive parents?
Am. I. ofOrthopsychiatry 57:186-192.
Kaus, M. 1992. The End of Equality. New York: Basic Books.
Keene, K., and Ladd, E. C. 1991. Politics of the professoriate. Am. Enterprise
(July/August): 8687.
Keeves, J. (ed.). 1991. The IEA Study of Science III: C k e s in Science Educa-
tion and Achievement 197044. Oxford: Pergamon Press.
Keller, C., and Fetterly, K. 1978. Legitimacy and mother's education as risk fac-
tors in post neonatal mortality. Paper presented at the American Public
Health Association Annual Meeting, Los Angeles.
Keller, H., Miranda, D., and Gauda, G. 1984. The naive theory of the infant
and some maternal attitudes. I. of Cross-Cultwral Psych. 15:165-179.
Kelley, M. L., Power, T,
G., and Wimbush, D. D. 1992. Determinants of disci-
plinary practices in low-income black mothers. Child Develomnt
63:573-582.
Kelman, M. 1991. Concepts of discrimination in "general ability" job testing.
Harvard Law Rev. 104:1158-1247.
Kempe, A., et al. 1992. Clinical determinants of the racial disparity in very low
birth weight. New England]. of Medicine 327:969-973.
Kendall, I. M., Verster, M. A., and Mollendorf, J. W. V. 1988. Test performance
of blacks in Southern Africa. In Human Abilities in Cultural Context. S. H.
Irvine and J. W. Berry (eds.). Cambridge: Camhridge University Press, pp.
299-339.
Keogh, B. K., and MacMillan, D. L. 1970. Effects of motivational and presen-
tation conditions on digit recall of children of differing socioeconomic,
racial, and intelligence groups. Am. Educational Research J. 8:27-38.
Kevles, D. J. 1985. In the Name of Eugenics: Genetics and the Uses of Human
Heredity. New York: Alfred A. Knopf.
Kinder, D. R., and Sears, D. 0. 1985. Public opinion and political action. In
Handbook of Social Psychology, vol. 2. G. Lindzey and E. Aronson (eds.). New
York: Random House, pp. 659-741.
Kitagawa, E., and Hauser,
M. 1960. Education differences in mortality by
cause of death. Demography 5:3 18-353.
Klein, M., and Stem, L. 1971. Low birth weight and the battered child syn-
drome. Am. j. of Diseases of Children 122: 15-18.
Kleppner, P. 1982. Who Voted? The Dynamics of Ekctoral Turnout, 1870-1980.
New York: Praeger.
Kline, P. 1985. The nature of psychometric g. Behavioral and Brain Sciences
8:234.
Klitgaard, R. 1985. Choosing Elites: Selecting "The Best and the Brightest" at Tot,
Universities and Elsewhere. New York: Basic Books.
Knight, R. A., and Goodnow, J. 1,1988. Parents' beliefs about influences over
cognitive and social development. international]. of Behavioral Development
11:517-527.
Koh, T., Abbatiello, A., and McLoughlin, C. S. 1984. Cultural bias in WISC
subtest items: A response to Judge Grady's suggestion in relation to the PASE
case. School Psych. Rev. 13:89-94.
Kohl, H. 1967.36 Childrep. New York: New American Library.
Kohn, M. L. 1959. Social class and ~arental values. Am. 1. of Sociology
64337-351.
Kominski, R. 1990. Estimating the national high school dropout rate. Demop
raphy 27:303-3 11.
Kosters, M. H. 1993. The earned income tax credit and the working poor. Am.
Enterprise (May-June): 64-72.
Kozol, J. 1967. Death at an Early Age: The Destruction of the Hearts and Minds
of Negro Children. Boston: Houghton Mifflin.
Kozol, J. 1985, illiterate America. Garden City, N.Y.: Anchor Press/Douhleday.
Kozol, J. 1992. Savage Inequalities: Children in America's Schools. New York:
HarperCollins.
Academic Bibliography on Inequality
- The text consists of a dense bibliographic list of academic sources focusing on educational psychology, sociology, and economics.
- Key themes include the impact of race and social class on intelligence testing (WISC, K-ABC) and academic performance.
- Several entries address the long-term effects of early childhood interventions like Head Start and the consequences of school dropouts.
- The list highlights significant works on systemic inequality, such as Jonathan Kozol's 'Savage Inequalities' and Nicholas Lemann's 'The Promised Land'.
- Economic perspectives are represented through studies on affirmative action, the earned income tax credit, and national earnings inequality trends.
Kozol, J. 1967. Death at an Early Age: The Destruction of the Hearts and Minds of Negro Children.
802
Bibliography
Bibliography
803
ability as predictors of occupational success. Master's thesis, St. Mary's Uni-
versity.
Joynson, R. B. 1989. The Burt Affair. London: Routledge.
Juhn, C., Murphy, K. M., and Pierce, B. 1990. Wage inequality and the rise in
returns to skill. University of Chicago. Photocopy.
Kadushin, A. 1988. Neglect in families. In Mental Illness, Delinquency, Addic-
tions, and Neglect. E. W. Nunnally, C. S. Chilman, and EM. Cox (eds.).
Newbury Park, Calif.: Sage, pp. 147-166.
Karnin, L. 1974. The Science and Politics of IQ. Hillsdale, N.J.: Lawrence Erl-
baum Associates.
Kandel, E., Mednick, S. A., Kirkegaard-Sorensen, L., Hutchings, B., Knop, J.,
Rosenberg, R., and Schulsinger, E 1988. IQ as a protective factor for sub-
jects at high risk for antisocial behavior. ]. of Consulting and Clinical Psych.
56224-226.
Karen, D. 1991. "Achievement" and "ascription" in admission to an elite
college: A political.organizational analysis. Sociological Forum 6:349-380.
Karrnel, L. J., and Karmel, M. 0. 1978. Measurement and Evalmtion in the
School?. 2d ed. New York: Macmillan.
Kasarda, J. D. 1989. Urhan industrial transition and the underclass. Annah of
the Am. Academy of Political and Social Science 501 :26-47.
Katz, L. E, and Murphy, K. M. 1990. Changes in Relative Wages, 1963-1987:
Supply and Demand Factors. Cambridge, Mass.: National Bureau of Eco-
nomic Research.
Kaufman, A. S., and Kaufrnan, N. L. 1983. Kaufi7lan Assessment Butte? for Chil-
dren: interpretive Manual. Circle Pines, Minn.: American Guidance Service.
Kaufrnan, J., and Zigler, E. 1987. Do abused children become abusive parents?
Am. I. ofOrthopsychiatry 57:186-192.
Kaus, M. 1992. The End of Equality. New York: Basic Books.
Keene, K., and Ladd, E. C. 1991. Politics of the professoriate. Am. Enterprise
(July/August): 8687.
Keeves, J. (ed.). 1991. The IEA Study of Science III: C k e s in Science Educa-
tion and Achievement 197044. Oxford: Pergamon Press.
Keller, C., and Fetterly, K. 1978. Legitimacy and mother's education as risk fac-
tors in post neonatal mortality. Paper presented at the American Public
Health Association Annual Meeting, Los Angeles.
Keller, H., Miranda, D., and Gauda, G. 1984. The naive theory of the infant
and some maternal attitudes. I. of Cross-Cultwral Psych. 15:165-179.
Kelley, M. L., Power, T,
G., and Wimbush, D. D. 1992. Determinants of disci-
plinary practices in low-income black mothers. Child Develomnt
63:573-582.
Kelman, M. 1991. Concepts of discrimination in "general ability" job testing.
Harvard Law Rev. 104:1158-1247.
Kempe, A., et al. 1992. Clinical determinants of the racial disparity in very low
birth weight. New England]. of Medicine 327:969-973.
Kendall, I. M., Verster, M. A., and Mollendorf, J. W. V. 1988. Test performance
of blacks in Southern Africa. In Human Abilities in Cultural Context. S. H.
Irvine and J. W. Berry (eds.). Cambridge: Camhridge University Press, pp.
299-339.
Keogh, B. K., and MacMillan, D. L. 1970. Effects of motivational and presen-
tation conditions on digit recall of children of differing socioeconomic,
racial, and intelligence groups. Am. Educational Research J. 8:27-38.
Kevles, D. J. 1985. In the Name of Eugenics: Genetics and the Uses of Human
Heredity. New York: Alfred A. Knopf.
Kinder, D. R., and Sears, D. 0. 1985. Public opinion and political action. In
Handbook of Social Psychology, vol. 2. G. Lindzey and E. Aronson (eds.). New
York: Random House, pp. 659-741.
Kitagawa, E., and Hauser,
M. 1960. Education differences in mortality by
cause of death. Demography 5:3 18-353.
Klein, M., and Stem, L. 1971. Low birth weight and the battered child syn-
drome. Am. j. of Diseases of Children 122: 15-18.
Kleppner, P. 1982. Who Voted? The Dynamics of Ekctoral Turnout, 1870-1980.
New York: Praeger.
Kline, P. 1985. The nature of psychometric g. Behavioral and Brain Sciences
8:234.
Klitgaard, R. 1985. Choosing Elites: Selecting "The Best and the Brightest" at Tot,
Universities and Elsewhere. New York: Basic Books.
Knight, R. A., and Goodnow, J. 1,1988. Parents' beliefs about influences over
cognitive and social development. international]. of Behavioral Development
11:517-527.
Koh, T., Abbatiello, A., and McLoughlin, C. S. 1984. Cultural bias in WISC
subtest items: A response to Judge Grady's suggestion in relation to the PASE
case. School Psych. Rev. 13:89-94.
Kohl, H. 1967.36 Childrep. New York: New American Library.
Kohn, M. L. 1959. Social class and ~arental values. Am. 1. of Sociology
64337-351.
Kominski, R. 1990. Estimating the national high school dropout rate. Demop
raphy 27:303-3 11.
Kosters, M. H. 1993. The earned income tax credit and the working poor. Am.
Enterprise (May-June): 64-72.
Kozol, J. 1967. Death at an Early Age: The Destruction of the Hearts and Minds
of Negro Children. Boston: Houghton Mifflin.
Kozol, J. 1985, illiterate America. Garden City, N.Y.: Anchor Press/Douhleday.
Kozol, J. 1992. Savage Inequalities: Children in America's Schools. New York:
HarperCollins.
804
Bibliography
Bibliography
805
Kraiger, K., and Ford, J. K. 1985. A meta-analysis of race effects in performance
ratings. J. of Applied Psych. 70:56-65.
Kravitz, R. I., and Driscoll, J. M. 1983. Expectations for childhood develop-
ment among child-abusing and nonabusing parents. Am. J. of Orthopsychi-
a q 53:345-352.
Krishnan, V. 1990. A causal approach to the study of fertility and familism. So-
cial Biology 3759-68.
Krohn, E. J., Lamp, R. E., and Phelps, C. G. 1988. Validity of the K-ABC for
a black preschool population. Psych. in the Schools 25:15-21.
Kronick, R. E, and Hargis, C. H. 1990. Dropouts: Who Drops Out and Why-
and the Recommended Action. Springfield, 111.: Charles C. Thomas.
Lam, D. A., and Miron,]. A. 1991. Seasonality ofhirths in human populations.
Social Biology 38:5 1-78.
Lambert, C. 1993. Desperately seeking summa. Harvard Maga~ne (May-June):
36-30.
Lamsan, E. E. 1938. To what extent are intelligence quotients increased hy
children who participate in a rich vital school curriculum? J. of Educational
Psych. 29:67-70.
Lane, H. 1976. The Wild Boy of Aveyron. Cambridge, Mass.: Harvard Univer-
sity Press.
Lane, H., and Pillard, R. 1978. The Wild Boy of Burundi: A Study ofan Outcast
Child. New York: Random House.
Lazar, I., and Darlington, R. 1982. Lasting effects of early education: A report
from the consortium for longitudinal studies. Monographs of the Soc~ety for
Research in Child Development 47, issues 2-3.
Learned, W. S., and Wood, B. D. 1938. The Student and His Knowledge, A Re-
port to the Carnegie Foundation on the Results of the High School and College
Examinations of 1928, 1930, and 1932. New York: Camegie Foundation for
the Advancement of Teaching.
Lee, V. E., Rrooks-Gunn, J., Schnur, E., and Liaw, E-R. 1990. Are Head Start
effects sustained? A longitudinal follow-up comparison of disadvantaged
children attending Head Start, no preschool, and other preschool programs.
Child Development 61 :495-507.
Lemann, N. 199 1. The Promised Land: The Great Black Migration and How It
Changed America. New York: Alfred A. Knopf.
Leonard, C. H., et al. 1990. Effect of medical and social risk factors on outcome
of prematurity and very low birth weight. I. of Pediamcs 116:620-626.
Leonard, J. S. 1984. Employment and occupational advance under affirmative
action. Rew. of Economics and Statistics 66:377-385.
Leonard, J. S. 1986. The effectiveness of equal employment law and affirma-
tive action regubations. In Research in Labor Economics, vol. 8, Part B. R. G.
Ehrenberg (ed.). Greenwich, Conn.: JAI Press, pp. 85-140.
Lerner, B. 1991. Good news about American education. Commentary (March):
19-25.
Levin, H. M. 1989. Economics of investment in educationally disadvantaged
students. Am. Econ. Rev. 79:52-56.
Levin, M. In press. Comment on Minnesota transracial adoption study. lntelli-
gence .
Levy, F., and Murnane, R. J. 1992. U.S. earnings levels and earnings inequal-
ity: A review of recent trends and proposed explanations. J. of Econ. Liter-
ature 30: 133-1381.
Lewontin, R. C. 1970. Race and intelligence. Bull. of the Atomic Scientists
26:2-8.
Lewontin, R., Rose, S., and Kamin, L. 1984. Not in Our Genes. New York: Pan-
theon Rooks.
Li, V. H. 1988. Asian discrimination: Fact or fiction? College Board Rev. 149:
20-32.
Lichter, D. T., LeClere, E B., and McLaughlin, D. K. 1991. Local marriage mar-
kets and the marital hehavior of black and white women. Am. j , of Sociol-
om 96:843-867.
Liehmann, G. W. 1993. The AFDC conundrum: A new look at an old insti-
tution. Social Work 38:36-43.
Linn, R. L. 1983. Predictive bias as an, artifact of selection procedures. In Prin-
ciples of Modern Psychological Measurement: A Festschrift for Frederic M. Lord.
H. Wainer and S. Messick (eds.). Hillsdale, N.J.: Lawrence Erlbaum Asso-
ciates, pp. 27-40.
Linn, R. L. 1986. Comments on the g factor in employment testing. J. of Vo-
cational Behavior 29:438-44.
Lippmann, W. 1922a. A future for the tests. New Republic (November 29): 9-10.
Lippmann, W. 1922b. Public Opinion. New York: Macmillan.
Lippmann, W. 1923. The great confusion. New Republic (January 3):145-
146.
Lippmann, W. 1955. Essays in the Public Philosophy. Boston: Little, Brown.
Lipsitt, P. D., Buka, S. L., and Lipsitt, L. P. 1990. Early intelligence scores and
subsequent delinquency: A prospective study. Am. I . of Family Therapy
18: 197-208.
Lloyd, D. 1990. Throwing stones in glass houses. California Monthly (Septem-
ber): 17, 19.
Locke, J. 1689. Two Treatises of Government.. 1960 ed. Cambridge: Cambridge
University Press, 1960.
Locke, 1. Essays. 1975 ed. Oxford: Oxford University Press.
Locurto, C. 1990. The malleability of IQ as judged from adoption studies. In-
telligence 14:275-292.
Locurto, C. 1991. Beyond IQ in preschool programs? Intelligence 15:295-3 12.
Scholarly Bibliography on Intelligence
- A comprehensive list of academic references focusing on psychometrics, intelligence testing, and socioeconomic outcomes.
- Includes seminal works by Walter Lippmann regarding public opinion and the early critique of intelligence tests.
- Features research on the relationship between IQ scores and social behaviors such as delinquency and marital patterns.
- Cites controversial studies regarding international and racial disparities in cognitive testing results.
- Documents the intersection of intelligence research with public policy issues like affirmative action and welfare.
- References historical philosophical foundations from John Locke alongside modern behavioral genetics.
Lippmann, W. 1923. The great confusion. New Republic (January 3):145-146.
804
Bibliography
Bibliography
805
Kraiger, K., and Ford, J. K. 1985. A meta-analysis of race effects in performance
ratings. J. of Applied Psych. 70:56-65.
Kravitz, R. I., and Driscoll, J. M. 1983. Expectations for childhood develop-
ment among child-abusing and nonabusing parents. Am. J. of Orthopsychi-
a q 53:345-352.
Krishnan, V. 1990. A causal approach to the study of fertility and familism. So-
cial Biology 3759-68.
Krohn, E. J., Lamp, R. E., and Phelps, C. G. 1988. Validity of the K-ABC for
a black preschool population. Psych. in the Schools 25:15-21.
Kronick, R. E, and Hargis, C. H. 1990. Dropouts: Who Drops Out and Why-
and the Recommended Action. Springfield, 111.: Charles C. Thomas.
Lam, D. A., and Miron,]. A. 1991. Seasonality ofhirths in human populations.
Social Biology 38:5 1-78.
Lambert, C. 1993. Desperately seeking summa. Harvard Maga~ne (May-June):
36-30.
Lamsan, E. E. 1938. To what extent are intelligence quotients increased hy
children who participate in a rich vital school curriculum? J. of Educational
Psych. 29:67-70.
Lane, H. 1976. The Wild Boy of Aveyron. Cambridge, Mass.: Harvard Univer-
sity Press.
Lane, H., and Pillard, R. 1978. The Wild Boy of Burundi: A Study ofan Outcast
Child. New York: Random House.
Lazar, I., and Darlington, R. 1982. Lasting effects of early education: A report
from the consortium for longitudinal studies. Monographs of the Soc~ety for
Research in Child Development 47, issues 2-3.
Learned, W. S., and Wood, B. D. 1938. The Student and His Knowledge, A Re-
port to the Carnegie Foundation on the Results of the High School and College
Examinations of 1928, 1930, and 1932. New York: Camegie Foundation for
the Advancement of Teaching.
Lee, V. E., Rrooks-Gunn, J., Schnur, E., and Liaw, E-R. 1990. Are Head Start
effects sustained? A longitudinal follow-up comparison of disadvantaged
children attending Head Start, no preschool, and other preschool programs.
Child Development 61 :495-507.
Lemann, N. 199 1. The Promised Land: The Great Black Migration and How It
Changed America. New York: Alfred A. Knopf.
Leonard, C. H., et al. 1990. Effect of medical and social risk factors on outcome
of prematurity and very low birth weight. I. of Pediamcs 116:620-626.
Leonard, J. S. 1984. Employment and occupational advance under affirmative
action. Rew. of Economics and Statistics 66:377-385.
Leonard, J. S. 1986. The effectiveness of equal employment law and affirma-
tive action regubations. In Research in Labor Economics, vol. 8, Part B. R. G.
Ehrenberg (ed.). Greenwich, Conn.: JAI Press, pp. 85-140.
Lerner, B. 1991. Good news about American education. Commentary (March):
19-25.
Levin, H. M. 1989. Economics of investment in educationally disadvantaged
students. Am. Econ. Rev. 79:52-56.
Levin, M. In press. Comment on Minnesota transracial adoption study. lntelli-
gence .
Levy, F., and Murnane, R. J. 1992. U.S. earnings levels and earnings inequal-
ity: A review of recent trends and proposed explanations. J. of Econ. Liter-
ature 30: 133-1381.
Lewontin, R. C. 1970. Race and intelligence. Bull. of the Atomic Scientists
26:2-8.
Lewontin, R., Rose, S., and Kamin, L. 1984. Not in Our Genes. New York: Pan-
theon Rooks.
Li, V. H. 1988. Asian discrimination: Fact or fiction? College Board Rev. 149:
20-32.
Lichter, D. T., LeClere, E B., and McLaughlin, D. K. 1991. Local marriage mar-
kets and the marital hehavior of black and white women. Am. j , of Sociol-
om 96:843-867.
Liehmann, G. W. 1993. The AFDC conundrum: A new look at an old insti-
tution. Social Work 38:36-43.
Linn, R. L. 1983. Predictive bias as an, artifact of selection procedures. In Prin-
ciples of Modern Psychological Measurement: A Festschrift for Frederic M. Lord.
H. Wainer and S. Messick (eds.). Hillsdale, N.J.: Lawrence Erlbaum Asso-
ciates, pp. 27-40.
Linn, R. L. 1986. Comments on the g factor in employment testing. J. of Vo-
cational Behavior 29:438-44.
Lippmann, W. 1922a. A future for the tests. New Republic (November 29): 9-10.
Lippmann, W. 1922b. Public Opinion. New York: Macmillan.
Lippmann, W. 1923. The great confusion. New Republic (January 3):145-
146.
Lippmann, W. 1955. Essays in the Public Philosophy. Boston: Little, Brown.
Lipsitt, P. D., Buka, S. L., and Lipsitt, L. P. 1990. Early intelligence scores and
subsequent delinquency: A prospective study. Am. I . of Family Therapy
18: 197-208.
Lloyd, D. 1990. Throwing stones in glass houses. California Monthly (Septem-
ber): 17, 19.
Locke, J. 1689. Two Treatises of Government.. 1960 ed. Cambridge: Cambridge
University Press, 1960.
Locke, 1. Essays. 1975 ed. Oxford: Oxford University Press.
Locurto, C. 1990. The malleability of IQ as judged from adoption studies. In-
telligence 14:275-292.
Locurto, C. 1991. Beyond IQ in preschool programs? Intelligence 15:295-3 12.
806
Bibliography
Bibliography
807
Loehlin, J. C. 1992. Guttman on factor analysis and group differences: A com-
ment. Multivariate Behavioral Research 27:235-237.
Loehlin, 1. C., Lindzey, G., and Spuhler, J. N. 1975. Race Differences in Intelli-
gence. San Francisco: W. H. Freeman and Company.
Lorge, I. 1942. The "last school grade completed" as an index of intellectual
level. School and Society 56529-531.
Louchheim, K. (ed.). 1983. The Making of the New Deal: The Insiders Speak.
Cambridge, Mass.: Harvard University Press.
Loury, L. D., and Garman, D. 1993a. Affirmative action in higher education.
Am. Econ. Rev. 83:99-103.
Loury, L. D., and Garman, D. 1993b. College selectivity and earnings. Med-
ford, Mass.: Tufts University. Photocopy.
Lukacs, J. 1986. Immigration and Migration-A
Histmica Perspective. Mono-
graph Series, Paper 5. Monterey, Va.: American lmmigration Control Foun-
dation.
Lundberg, S., and Plotnick, R. D. 1990. Adolescent premarital childbearing:
Do opportunity costs matter? Discussion Paper 90-23. Seattle, Wash.: In-
stitute for Economic Research, University of Washington.
Luskin, R. C. 1990. Explaining political sophistication. Political Behavior
4:331-361.
Luster, T., Rhoades, K., and Haas, B. 1989. The relation between ~arental val-
ues and parenting behavior: A test of the Kohn hypothesis. J. of Marriage
and the Family 5 1: 138-147.
Lynch, E R. 1991. Invisible Victims: White Maks and the Crisis of Affirmative Ac-
tion. New York: Praeger.
Lynn, M. 1989. Race differences in sexual behavior: A critique of Rushton and
Bogaert's evolutionary hypothesis. J. of Research in Personality 23: 1-6.
Lynn, R. 1977. The intelligence of the Japanese. Bull. ofthe British Psychologi-
cal Society 30:69-72.
Lynn, R. 1978. Ethnic and racial differences in intelligence: International com-
parisons. In Human Variation: The Biopsycholog of Age, Race, and Sex. R. T.
Osbome, C. E. Noble, and N. Weyl (eds.). New York: Academic Press, pp.
261-286.
Lynn, R. 1982. IQ in Japan and the United States shows a growing disparity.
Nature 297:222-223.
Lynn, R. 1987a. The intelligence of the mongoloids: A psychometric, evolu-
tionary and neurological theory. Personality and Individual Differences
8:8 13-844.
Lynn, R. 198713. Japan: Land of the rising IQ: A reply to Flynn. Bull. of the
British Psychological Society 40:464-468.
Lynn, R. 1989. Positive correlations between head size and IQ. BritishI. of Ed-
ucational Psych. 59:372-377.
Lynn, R. 1990a. Differential rates of secular increase of five major primary abil-
ities. Social Biology 37:137-141.
Lynn, R. 1990h. The role of nutrition in secular increases in intelligence. Per-
sonality and Individual Differences 3:273-285.
Lynn, R. 1990c. Testosterone and gonadotropin levels and r/K reproductive
strategies. Psychological Report 67: 1203-1206.
Lynn, R. 1991a. Comment on "Educational achievements of Asian Ameri.
cans." Am. Psycholo@st 46875-876.
Lynn, R. 1991b. The evolution of racial differences in intelligence. Mankind
Quarterly 32:99-12 1.
Lynn, R. 1991c. Race differences in intelligence: A glohalperspective. Mankind
Quarterly 3 1 :254-296.
Lynn, R. 1992. Intelligence: Ethnicity and culture. In Cultural Diversity and the
Schools. 1. Lynch and C. Modgil (eds.). London: Falmer Press, pp. 361-387.
Lynn, R. 1993a. Further evidence for the existence of race and sex differences
in cranial capacity. Social Behavior and Personality 2139-92.
Lynn, R. 1993b. Oriental Americans: Their IQ, educational attainment and
socio-economic status. Personality and Individual Differences 15:237-
242.
Lynn, R. In press. Some reinterpretations of the Minnesota Transracial Adop-
tion study. Intelligence.
Lynn, R., and Hampson, S. 1986a. Further evidence for secular increases in in-
telligence in Britain, Japan, and the United States. Behavioral and Brain Sci-
ences 9:203-204.
Lynn, R., and Hampson, S. 198613. Intellectual abilities of Japanese children:
An assessment of 2 112-8 1/2-year-olds derived from the McCarthy Scales
of Children's Abilities. Intelligence 10:41.
Lynn, R., and Hampson, S. 1986c. The rise of national intelligence: Evidence
from Britain, Japan, and the U.S.A. Personality and individual Differences
7:23-32.
Lynn, R., Hampson, S. L., and Iwawaki, S. 1987. Abstract reasoning and spa-
tial abilities in American, British and Japanese adolescents. Mankind Qmr-
terly 27:379-405.
Lynn, R., and Hattori, K. 1990. The heritability of intelligence in Japan. Be-
havior Genetics 20545-546.
Lynn, R., Pagliari, C., and Chan, J. 1988. Intelligence in Hong Kong measured
for Spearman's g and the visuospatial and verbal primaries. Intelligence
12:423-433.
Lynn, R., and Song, M. J. 1994. General intelligence, visuospatial and verbal
abilities in Korean children. Personality and Individual Differences 16:363-364.
McCall, R. B. 1977. Childhood IQ's as predictors of adult educational and oc-
cupational status. Science 197:482483.
Bibliography of Intelligence Research
- This section provides an extensive list of academic citations primarily focused on the work of Richard Lynn regarding intelligence and demographics.
- The references explore the 'Flynn Effect' and secular increases in IQ across different nations including Japan, Britain, and the United States.
- Several citations investigate the biological and evolutionary theories of intelligence, including head size, nutrition, and reproductive strategies.
- The bibliography includes comparative studies on the intellectual abilities and educational achievements of various ethnic and racial groups.
- Additional entries by authors like McCall and McClelland address the predictability of adult success based on childhood IQ and the concept of competence testing.
- The text highlights a period of intense psychological research into the heritability and environmental plasticity of cognitive functions.
Lynn, R. 198713. Japan: Land of the rising IQ: A reply to Flynn.
806
Bibliography
Bibliography
807
Loehlin, J. C. 1992. Guttman on factor analysis and group differences: A com-
ment. Multivariate Behavioral Research 27:235-237.
Loehlin, 1. C., Lindzey, G., and Spuhler, J. N. 1975. Race Differences in Intelli-
gence. San Francisco: W. H. Freeman and Company.
Lorge, I. 1942. The "last school grade completed" as an index of intellectual
level. School and Society 56529-531.
Louchheim, K. (ed.). 1983. The Making of the New Deal: The Insiders Speak.
Cambridge, Mass.: Harvard University Press.
Loury, L. D., and Garman, D. 1993a. Affirmative action in higher education.
Am. Econ. Rev. 83:99-103.
Loury, L. D., and Garman, D. 1993b. College selectivity and earnings. Med-
ford, Mass.: Tufts University. Photocopy.
Lukacs, J. 1986. Immigration and Migration-A
Histmica Perspective. Mono-
graph Series, Paper 5. Monterey, Va.: American lmmigration Control Foun-
dation.
Lundberg, S., and Plotnick, R. D. 1990. Adolescent premarital childbearing:
Do opportunity costs matter? Discussion Paper 90-23. Seattle, Wash.: In-
stitute for Economic Research, University of Washington.
Luskin, R. C. 1990. Explaining political sophistication. Political Behavior
4:331-361.
Luster, T., Rhoades, K., and Haas, B. 1989. The relation between ~arental val-
ues and parenting behavior: A test of the Kohn hypothesis. J. of Marriage
and the Family 5 1: 138-147.
Lynch, E R. 1991. Invisible Victims: White Maks and the Crisis of Affirmative Ac-
tion. New York: Praeger.
Lynn, M. 1989. Race differences in sexual behavior: A critique of Rushton and
Bogaert's evolutionary hypothesis. J. of Research in Personality 23: 1-6.
Lynn, R. 1977. The intelligence of the Japanese. Bull. ofthe British Psychologi-
cal Society 30:69-72.
Lynn, R. 1978. Ethnic and racial differences in intelligence: International com-
parisons. In Human Variation: The Biopsycholog of Age, Race, and Sex. R. T.
Osbome, C. E. Noble, and N. Weyl (eds.). New York: Academic Press, pp.
261-286.
Lynn, R. 1982. IQ in Japan and the United States shows a growing disparity.
Nature 297:222-223.
Lynn, R. 1987a. The intelligence of the mongoloids: A psychometric, evolu-
tionary and neurological theory. Personality and Individual Differences
8:8 13-844.
Lynn, R. 198713. Japan: Land of the rising IQ: A reply to Flynn. Bull. of the
British Psychological Society 40:464-468.
Lynn, R. 1989. Positive correlations between head size and IQ. BritishI. of Ed-
ucational Psych. 59:372-377.
Lynn, R. 1990a. Differential rates of secular increase of five major primary abil-
ities. Social Biology 37:137-141.
Lynn, R. 1990h. The role of nutrition in secular increases in intelligence. Per-
sonality and Individual Differences 3:273-285.
Lynn, R. 1990c. Testosterone and gonadotropin levels and r/K reproductive
strategies. Psychological Report 67: 1203-1206.
Lynn, R. 1991a. Comment on "Educational achievements of Asian Ameri.
cans." Am. Psycholo@st 46875-876.
Lynn, R. 1991b. The evolution of racial differences in intelligence. Mankind
Quarterly 32:99-12 1.
Lynn, R. 1991c. Race differences in intelligence: A glohalperspective. Mankind
Quarterly 3 1 :254-296.
Lynn, R. 1992. Intelligence: Ethnicity and culture. In Cultural Diversity and the
Schools. 1. Lynch and C. Modgil (eds.). London: Falmer Press, pp. 361-387.
Lynn, R. 1993a. Further evidence for the existence of race and sex differences
in cranial capacity. Social Behavior and Personality 2139-92.
Lynn, R. 1993b. Oriental Americans: Their IQ, educational attainment and
socio-economic status. Personality and Individual Differences 15:237-
242.
Lynn, R. In press. Some reinterpretations of the Minnesota Transracial Adop-
tion study. Intelligence.
Lynn, R., and Hampson, S. 1986a. Further evidence for secular increases in in-
telligence in Britain, Japan, and the United States. Behavioral and Brain Sci-
ences 9:203-204.
Lynn, R., and Hampson, S. 198613. Intellectual abilities of Japanese children:
An assessment of 2 112-8 1/2-year-olds derived from the McCarthy Scales
of Children's Abilities. Intelligence 10:41.
Lynn, R., and Hampson, S. 1986c. The rise of national intelligence: Evidence
from Britain, Japan, and the U.S.A. Personality and individual Differences
7:23-32.
Lynn, R., Hampson, S. L., and Iwawaki, S. 1987. Abstract reasoning and spa-
tial abilities in American, British and Japanese adolescents. Mankind Qmr-
terly 27:379-405.
Lynn, R., and Hattori, K. 1990. The heritability of intelligence in Japan. Be-
havior Genetics 20545-546.
Lynn, R., Pagliari, C., and Chan, J. 1988. Intelligence in Hong Kong measured
for Spearman's g and the visuospatial and verbal primaries. Intelligence
12:423-433.
Lynn, R., and Song, M. J. 1994. General intelligence, visuospatial and verbal
abilities in Korean children. Personality and Individual Differences 16:363-364.
McCall, R. B. 1977. Childhood IQ's as predictors of adult educational and oc-
cupational status. Science 197:482483.
808
Bibliography
Bibliography
809
McCall, R. B. 1979. The development of intellectual functioning in infancy
and the re diction of later IQ. In Handbook of Infant Development. J. D.
Osofsky (ed.). New York: Wiley, pp. 707-741.
McCall, R. B. 1987. Developmental function, individual differences, and the
plasticity of intelligence. In The Malleability of Children. J. J. Gallagher and
C. T. Ramey (eds.). Baltimore: Paul H. Brookes, pp. 25-35.
McClelland, D. C. 1973. Testing for competence rather than for "intelligence."
Am. Psychologist 28:l-14.
McCornack, R. L. 1983. Bias in the validity of predicted college grades in
four ethnic minority groups. Educational and Psychobgical Measurement
18:54-58.
McDaniel, M. A., Schmidt, F. L., and Hunter, J. E. 1986. The Evaluation of a
Causal Model ofJob Performance: The Relationship ofJob Experience and Gen-
eral Mental Ability to Job Performance. U.S. Office of Personnel Management,
Washington, D.C.: Government Printing Office.
McGue, M., and Lykken, D. T. 1992. Genetic influence on risk of divorce. Psy-
chological Science 3:368-3 73.
McGurk, F. C. J. 1951. Comparison of the Performance of Negro and White High
School Seniors on Cultural and Noncultural Psychological Test Qwstions. Wash-
ington, D.C.: Catholic University Press.
McGurk, E C. J. 1953a. On white and Negro test performance and socioeco-
nomic factors. J. of Abnormal Soclal Psych. 48:448450.
McGurk, E C. J. 195313. Socioeconomic status and culturally we~ghted test
scores of Negro subjects. J. of Applied Psych. 37:276-277.
McGurk, E C. J. 1967. The culture hypothesis and psychological tests. In Race
and Modern Science, vol. 37. R. E. Kuttner (ed.). New York: Social Science
Press, pp. 367-381.
McKey, R. H. 1985. The Impact of Head Start on Children, Families, and Com-
munities. A. N. Smith and S. S. Aitken (eds.). Washington, D.C.: U.S. De-
partment of Health and Human Services.
McKnight, C., et al. 1989. The UnderachievingCuwiculum: Assessing U.S. Math-
ematics from an International Perspective. Champaign, Ill.: Stipes.
McLanahan, S. S. 1988. Family structure and dependency: Early transitions to
female household headship. Demopaphy 25:l-16.
McLanahan, S., and Bumpass, L. 1988. Intergenerational consequences of fam-
ily disruption. Am. 1. of Sociology 94:130-152.
McLaughlin, D. H. 1977. 'Title I, 1965-1975: A Synthesis ofthe Findings of Fed-
eral Studies. Palo Alto, Cal.: American Institutes for Research.
McLoyd, V. 1990. The impact of economic hardship on black families and chil-
dren: Psychological distress, parenting, and socioemotional development.
Child Development 61 :3 1 1-346.
MacMahon, A. W., and Millett, J. D. 1939. Federal Administrators: A Bio-
graphical Approach to the Problem of Departmental Management. New York:
Columbia University Press.
Macphail, E. M. 1985. Comparative studies of animal intelligence: Is Spear-
man's g really Hull's D? Behavioral and Brain Sciences 8:234-235.
McShane, D., and Berry, J. W. 1988. Native North Americans: Indians and
Inuit ahilities. In Human Abilities in Cultural Context. S. H. Irvine and J. W.
Berry (eds.). Cambridge: Cambridge University Press, pp. 385-426.
Madhere, S. 1989. Models of intelligence and the black intellect. J. of Negro
Education 58: 189-202.
Maguire, T. 1992. My bout with affirmative action. Commentary (April):
50-52.
Maier, M. H., and Hiatt, C. M. 1985. On the Content and Measurement Validity
of Hands-On Job Performance Tests. CRM 85-79.Washington, D.C.: Center
for Naval Analyses.
Maier, N. R. F., and Schneirla, T. C. 1935. Principles of Animal Psychology. New
York: McGraw-Hill.
Manchester, W. 1983. The Last Lion: Wimton Spencer Churchill. Boston: Little,
Brown.
Mangold, W. D., and Powell-Griner, E. 1991. Race of parents and infant birth-
weight in the United States. Social Biology 38:13-27.
Mare, R. D. 1991. Five decades of educational assortative mating. Am. Socio-
logical Rev. 56: 15-32.
Mascie.Taylor, C. G. N. 1989. Spouse similarity for 1Q and personality and
convergence. Behavior Genetics 19:223-227.
Mascie-Taylor, C. G. N. 1990. The biology of social class. In Biosocial Aspects
of Social Class. C. G. N. Mascie-Taylor (ed.). New York: Oxford University
Press, pp. 117-142.
Mascie-Taylor, C. G. N., and Vandenberg, S. G. 1988. Assortative mating for
1Q and personality due to propinquity and personal preference. Behavior Ge-
netics 18:339-345.
Mason, K. O., and Palan, V. T. 1981. Female employment and fertility in penin-
sular Malaysia: The maternal role incompatibility hypothesis reconsidered.
Demography 18549-575.
Massey, D. S., and Denton, N. A. 1993. American Apartheid: Segregation and the
Making of the Underclass. Cambridge, Mass.: Harvard University Press.
Massey, D. S., and Eggers, M. L. 1990. The ecology of inequality: Minorities
and the concentration of poverty, 1970-1980. Am. J. of Sociologj
95:1153-1188.
Mastropieri, M. A. 1987. Age at start as a correlate of intervention effectiv
ness. Psych. in the Schools 24:59-62.
Matarazzo, J. D. 1972. Wechsler's Measurement and Appraisal of Adult lntellige
New York: Oxford University Press.
Academic Bibliography on Intelligence
- The text consists of a dense bibliographic list of academic sources focusing on psychology, sociology, and education.
- Several entries examine the relationship between socioeconomic factors, race, and performance on standardized tests.
- A significant portion of the citations addresses family structures, including the impact of economic hardship and household headship on child development.
- The list includes comparative studies on intelligence, ranging from animal psychology to cultural contexts of Native North Americans.
- Social dynamics such as assortative mating, social class biology, and urban segregation are represented through various sociological studies.
- The references span several decades, from the late 1930s to the early 1990s, indicating a broad historical survey of these topics.
Macphail, E. M. 1985. Comparative studies of animal intelligence: Is Spearman's g really Hull's D?
808
Bibliography
Bibliography
809
McCall, R. B. 1979. The development of intellectual functioning in infancy
and the re diction of later IQ. In Handbook of Infant Development. J. D.
Osofsky (ed.). New York: Wiley, pp. 707-741.
McCall, R. B. 1987. Developmental function, individual differences, and the
plasticity of intelligence. In The Malleability of Children. J. J. Gallagher and
C. T. Ramey (eds.). Baltimore: Paul H. Brookes, pp. 25-35.
McClelland, D. C. 1973. Testing for competence rather than for "intelligence."
Am. Psychologist 28:l-14.
McCornack, R. L. 1983. Bias in the validity of predicted college grades in
four ethnic minority groups. Educational and Psychobgical Measurement
18:54-58.
McDaniel, M. A., Schmidt, F. L., and Hunter, J. E. 1986. The Evaluation of a
Causal Model ofJob Performance: The Relationship ofJob Experience and Gen-
eral Mental Ability to Job Performance. U.S. Office of Personnel Management,
Washington, D.C.: Government Printing Office.
McGue, M., and Lykken, D. T. 1992. Genetic influence on risk of divorce. Psy-
chological Science 3:368-3 73.
McGurk, F. C. J. 1951. Comparison of the Performance of Negro and White High
School Seniors on Cultural and Noncultural Psychological Test Qwstions. Wash-
ington, D.C.: Catholic University Press.
McGurk, E C. J. 1953a. On white and Negro test performance and socioeco-
nomic factors. J. of Abnormal Soclal Psych. 48:448450.
McGurk, E C. J. 195313. Socioeconomic status and culturally we~ghted test
scores of Negro subjects. J. of Applied Psych. 37:276-277.
McGurk, E C. J. 1967. The culture hypothesis and psychological tests. In Race
and Modern Science, vol. 37. R. E. Kuttner (ed.). New York: Social Science
Press, pp. 367-381.
McKey, R. H. 1985. The Impact of Head Start on Children, Families, and Com-
munities. A. N. Smith and S. S. Aitken (eds.). Washington, D.C.: U.S. De-
partment of Health and Human Services.
McKnight, C., et al. 1989. The UnderachievingCuwiculum: Assessing U.S. Math-
ematics from an International Perspective. Champaign, Ill.: Stipes.
McLanahan, S. S. 1988. Family structure and dependency: Early transitions to
female household headship. Demopaphy 25:l-16.
McLanahan, S., and Bumpass, L. 1988. Intergenerational consequences of fam-
ily disruption. Am. 1. of Sociology 94:130-152.
McLaughlin, D. H. 1977. 'Title I, 1965-1975: A Synthesis ofthe Findings of Fed-
eral Studies. Palo Alto, Cal.: American Institutes for Research.
McLoyd, V. 1990. The impact of economic hardship on black families and chil-
dren: Psychological distress, parenting, and socioemotional development.
Child Development 61 :3 1 1-346.
MacMahon, A. W., and Millett, J. D. 1939. Federal Administrators: A Bio-
graphical Approach to the Problem of Departmental Management. New York:
Columbia University Press.
Macphail, E. M. 1985. Comparative studies of animal intelligence: Is Spear-
man's g really Hull's D? Behavioral and Brain Sciences 8:234-235.
McShane, D., and Berry, J. W. 1988. Native North Americans: Indians and
Inuit ahilities. In Human Abilities in Cultural Context. S. H. Irvine and J. W.
Berry (eds.). Cambridge: Cambridge University Press, pp. 385-426.
Madhere, S. 1989. Models of intelligence and the black intellect. J. of Negro
Education 58: 189-202.
Maguire, T. 1992. My bout with affirmative action. Commentary (April):
50-52.
Maier, M. H., and Hiatt, C. M. 1985. On the Content and Measurement Validity
of Hands-On Job Performance Tests. CRM 85-79.Washington, D.C.: Center
for Naval Analyses.
Maier, N. R. F., and Schneirla, T. C. 1935. Principles of Animal Psychology. New
York: McGraw-Hill.
Manchester, W. 1983. The Last Lion: Wimton Spencer Churchill. Boston: Little,
Brown.
Mangold, W. D., and Powell-Griner, E. 1991. Race of parents and infant birth-
weight in the United States. Social Biology 38:13-27.
Mare, R. D. 1991. Five decades of educational assortative mating. Am. Socio-
logical Rev. 56: 15-32.
Mascie.Taylor, C. G. N. 1989. Spouse similarity for 1Q and personality and
convergence. Behavior Genetics 19:223-227.
Mascie-Taylor, C. G. N. 1990. The biology of social class. In Biosocial Aspects
of Social Class. C. G. N. Mascie-Taylor (ed.). New York: Oxford University
Press, pp. 117-142.
Mascie-Taylor, C. G. N., and Vandenberg, S. G. 1988. Assortative mating for
1Q and personality due to propinquity and personal preference. Behavior Ge-
netics 18:339-345.
Mason, K. O., and Palan, V. T. 1981. Female employment and fertility in penin-
sular Malaysia: The maternal role incompatibility hypothesis reconsidered.
Demography 18549-575.
Massey, D. S., and Denton, N. A. 1993. American Apartheid: Segregation and the
Making of the Underclass. Cambridge, Mass.: Harvard University Press.
Massey, D. S., and Eggers, M. L. 1990. The ecology of inequality: Minorities
and the concentration of poverty, 1970-1980. Am. J. of Sociologj
95:1153-1188.
Mastropieri, M. A. 1987. Age at start as a correlate of intervention effectiv
ness. Psych. in the Schools 24:59-62.
Matarazzo, J. D. 1972. Wechsler's Measurement and Appraisal of Adult lntellige
New York: Oxford University Press.
Bibliography of Intelligence Research
- This section provides a comprehensive list of academic references focusing on the intersection of IQ and various social outcomes.
- Key topics include the relationship between intelligence and choice reaction time, fertility trends, and high-risk driving behaviors.
- Several citations address the causes of crime through biological lenses and the predictive validity of mental ability tests in classrooms.
- A significant portion of the references explores cultural and ethnic biases in standardized testing, specifically the WISC and SAT.
- The list includes economic analyses of the U.S. welfare system and the psychological factors influencing political participation.
- Research on the effectiveness of coaching for the SAT and the stability of score scales over time is also documented.
What is a racially and culturally nondiscriminatory test? A sociological and pluralistic perspective.
8 10
Bibliography
Bibliography
81 1
Matthews, G., and Dorn, L. 1989. IQ and choice reaction time: An informa-
tion processing analysis. Intelligence 13:299-3 17.
Maxwell, J. 1954. Intelligence, fertility, and the future: A report on the 1947
Scottish Mental Survey. Eugenics Quarterly 1:244-247.
Mayer, R. E., and Treat, J. R. 1977. Psychological, social and cognitive char-
acteristics of high-risk drivers: A pilot study. Accident Analysis and Preven-
tion 9:l-8.
Mayo, B. 1942. Jefferson Himself. New York: Houghton Mifflin.
Mednick, S. A., Moffitt, T. E., and Stack, S. A. (eds.). 1987. The Cawes
of Crime: New Biological Approaches. New York: Camhriclge Universiry
Press.
Medrich, E. A., and Griffith, J. E. 1992. lntemational Mathematics and Science
Assessments: What Have We Learned? NCES 92-01 1. Office of Educational
Research and Improvement, National Center for Education Statistics.
Washington, D.C.: Government Printing Office.
Mercer, J. R. 1984. What is a racially and culturally nondiscriminatory test? A
sociological and pluralistic perspective. In Perspectives on "Ria$ in Mental
Testing." C. R. Reynolds and R. T. Brown (eds.). New York: Plenum Press,
pp. 293-356.
Mercer, J. R. 1988. Ethnic differences in IQ scores: What do they mean? (A re-
sponse to Lloyd Dunn). Hispanic J. of Behavioral Sciences 10: 199-2 18.
Merrill, M. A. 1938. The significance of IQ's on the revised Stanford-Binet
scales. J. of Educational Psych. 29:641-65 1.
Mess6, L. A., Crano, W. D., Messi, S. R., and Rice, W. 1979. Evaluation of the
predictive validity of tests of mental ahility for classroom performance in
elementary grades. 1. of Educational Psych. 71:233-241.
Messick, S. 1980. The Effectiveness of Coaching for the SAT: Review, and Re-
analysis of Research born the Fifties to the FTC. Princeton, N.J.: Educational
Testing Service.
Messick, S., and Jungeblut, A. 1981. Time and method incoaching for the SAT.
Psychological Bull. 89:191-216.
Michael, J. S. 1988. A new look at Morton's craniological research. Current
Anthropology 29:349-354.
Miele, E 1979. Cultural bias in the WISC. Intelligence 3:149-164.
Milhrath, L. W., and Goel, M. L. 1977. Political Participation: How and Why Do
People Get Involved in Politics? 2d ed. Chicago: Rand McNally.
Miller, B. C. 1993. Families, science, and values: Alternative views of parent-
ing effects and adolescent pregnancy. 1. of Mam'age and the Famil? 55:7-2 1.
Miller, J. J. 1993. The U Mass morass. Am. Experiment 1:6-7.
Miller-Jones, D. 1989. Culture and testing. Am. Psychologist 44:360-366.
Mishra, S. P. 1981. Factor analysis of the McCarthy scales for groups of white
and Mexican-American children. J. of School Psych. 19: 178-1 82.
Mishra, S. P. 1982. The WISC-R and evidence of item bias for native-Ameri-
can Navajos. Psych. in the Schools 19:458460.
Mishra, S. P. 1983. Ethnic group bias in WISC-R verbal items. Paper presented
at the annual meeting of the American Psychological Association, Ana-
heim, Cal.
Modu, C. C., and Stem, J. 1975. The Stability of the SAT Score Scale. College
Entrance Examination Board Research and Development Report 74-75,
No. 3. Princeton, N.J.: Educational Testing Service.
Modu, C. C., and Stem, J. 1977. The stahility of the SAT-Verbal score scale.
In the appendixes to On Further Examination: Report of the Advisory Panel on
the Scholastic Aptitude Test Score Decline. Princeton, N.J.: College Board, pp.
1-17.
Moffitt, R. 1983. An economic model of welfare stigma. Am. Econ. Rev.
73:1023-1035.
Moffitt, R. 1992. Incentive effects of the U.S. welfare system: A review. J. of
Econ. Literature 30: 1-61.
Moffitt, T. E., and Silva, P. A. 1988. IQ and delinquency: A direct test of the
differential detection hypothesis.]. of Abnormal Psych. 97:330-333.
Moffitt, T. E., et al. 1981. Socioeconomic status, IQ, and delinquency. J. of Ab-
normal Psych. 90: 152-56.
Montie, J. E., and Fagan, J. F. 1. 1988. Racial differences in 1Q Item analysis of
the Stanford-Rinet at three years. lntelligence 12:315-332.
Moore, E. G. 1. 1985. Ethnicity as a variable in child development. In Begin-
nings: The Social and Affective Development of Black Children. M. B. Spencer,
G. K. Brookins, and W. R. Allen (eds.). Hillsdale, N.J.: Lawrence Erlbaum
Associates, pp. 101-1 15.
Moore, E. G. 1. 1986. Family socialization and the 1Q test performance of tra-
ditionally and transracially adopted black children. Developmental Psych.
22:317-326.
Mordechai, M. 1975. A study of cross-cultural factorial structure of intelli-
gence. Psychologia: An Intemtional]. of Psych. in the Orient 18:92-94.
Mosteller, F., and Moynihan, D. P. (eds.). 1972. On Equality of Educational Op-
portunity. New York: Random House.
Moynihan, D. P. 1986. Family andNotion. New York: Hatcourt BraceJovanovich.
Munford, P. R., and Munoz, A. 1980. A comparison of the WISC and
WISC-R on Hispanic children. J. of Clinical Psych. 36452458.
Munsinger, H. 1975. The adopted child's IQ: A critical review. Psychologica
Bull. 82:623-659.
Murchison, C. 1926. Criminal Intelligence. Worcester, Mass.: Clark Universit~
Murphy, K. M., and Welch, F. 1989. Wage differentials in the 1980s: The rc
of international trade. Applied Econometrics Discussion Paper 23. Chicag
University of Chicago.
Academic Bibliography on Intelligence
- The text consists of a bibliographic list of academic sources focusing on the intersection of IQ, delinquency, and socioeconomic status.
- Several entries examine racial and ethnic differences in intelligence testing, including studies on transracially adopted children and Hispanic youth.
- The list includes significant economic research on wage differentials, inequality, and the demand for skilled labor in the late 20th century.
- A substantial portion of the citations covers social policy, welfare, and family structure, particularly the works of Charles Murray.
- National educational and health statistics reports are cited to provide empirical data on academic progress and natality trends.
Family socialization and the 1Q test performance of traditionally and transracially adopted black children.
8 10
Bibliography
Bibliography
81 1
Matthews, G., and Dorn, L. 1989. IQ and choice reaction time: An informa-
tion processing analysis. Intelligence 13:299-3 17.
Maxwell, J. 1954. Intelligence, fertility, and the future: A report on the 1947
Scottish Mental Survey. Eugenics Quarterly 1:244-247.
Mayer, R. E., and Treat, J. R. 1977. Psychological, social and cognitive char-
acteristics of high-risk drivers: A pilot study. Accident Analysis and Preven-
tion 9:l-8.
Mayo, B. 1942. Jefferson Himself. New York: Houghton Mifflin.
Mednick, S. A., Moffitt, T. E., and Stack, S. A. (eds.). 1987. The Cawes
of Crime: New Biological Approaches. New York: Camhriclge Universiry
Press.
Medrich, E. A., and Griffith, J. E. 1992. lntemational Mathematics and Science
Assessments: What Have We Learned? NCES 92-01 1. Office of Educational
Research and Improvement, National Center for Education Statistics.
Washington, D.C.: Government Printing Office.
Mercer, J. R. 1984. What is a racially and culturally nondiscriminatory test? A
sociological and pluralistic perspective. In Perspectives on "Ria$ in Mental
Testing." C. R. Reynolds and R. T. Brown (eds.). New York: Plenum Press,
pp. 293-356.
Mercer, J. R. 1988. Ethnic differences in IQ scores: What do they mean? (A re-
sponse to Lloyd Dunn). Hispanic J. of Behavioral Sciences 10: 199-2 18.
Merrill, M. A. 1938. The significance of IQ's on the revised Stanford-Binet
scales. J. of Educational Psych. 29:641-65 1.
Mess6, L. A., Crano, W. D., Messi, S. R., and Rice, W. 1979. Evaluation of the
predictive validity of tests of mental ahility for classroom performance in
elementary grades. 1. of Educational Psych. 71:233-241.
Messick, S. 1980. The Effectiveness of Coaching for the SAT: Review, and Re-
analysis of Research born the Fifties to the FTC. Princeton, N.J.: Educational
Testing Service.
Messick, S., and Jungeblut, A. 1981. Time and method incoaching for the SAT.
Psychological Bull. 89:191-216.
Michael, J. S. 1988. A new look at Morton's craniological research. Current
Anthropology 29:349-354.
Miele, E 1979. Cultural bias in the WISC. Intelligence 3:149-164.
Milhrath, L. W., and Goel, M. L. 1977. Political Participation: How and Why Do
People Get Involved in Politics? 2d ed. Chicago: Rand McNally.
Miller, B. C. 1993. Families, science, and values: Alternative views of parent-
ing effects and adolescent pregnancy. 1. of Mam'age and the Famil? 55:7-2 1.
Miller, J. J. 1993. The U Mass morass. Am. Experiment 1:6-7.
Miller-Jones, D. 1989. Culture and testing. Am. Psychologist 44:360-366.
Mishra, S. P. 1981. Factor analysis of the McCarthy scales for groups of white
and Mexican-American children. J. of School Psych. 19: 178-1 82.
Mishra, S. P. 1982. The WISC-R and evidence of item bias for native-Ameri-
can Navajos. Psych. in the Schools 19:458460.
Mishra, S. P. 1983. Ethnic group bias in WISC-R verbal items. Paper presented
at the annual meeting of the American Psychological Association, Ana-
heim, Cal.
Modu, C. C., and Stem, J. 1975. The Stability of the SAT Score Scale. College
Entrance Examination Board Research and Development Report 74-75,
No. 3. Princeton, N.J.: Educational Testing Service.
Modu, C. C., and Stem, J. 1977. The stahility of the SAT-Verbal score scale.
In the appendixes to On Further Examination: Report of the Advisory Panel on
the Scholastic Aptitude Test Score Decline. Princeton, N.J.: College Board, pp.
1-17.
Moffitt, R. 1983. An economic model of welfare stigma. Am. Econ. Rev.
73:1023-1035.
Moffitt, R. 1992. Incentive effects of the U.S. welfare system: A review. J. of
Econ. Literature 30: 1-61.
Moffitt, T. E., and Silva, P. A. 1988. IQ and delinquency: A direct test of the
differential detection hypothesis.]. of Abnormal Psych. 97:330-333.
Moffitt, T. E., et al. 1981. Socioeconomic status, IQ, and delinquency. J. of Ab-
normal Psych. 90: 152-56.
Montie, J. E., and Fagan, J. F. 1. 1988. Racial differences in 1Q Item analysis of
the Stanford-Rinet at three years. lntelligence 12:315-332.
Moore, E. G. 1. 1985. Ethnicity as a variable in child development. In Begin-
nings: The Social and Affective Development of Black Children. M. B. Spencer,
G. K. Brookins, and W. R. Allen (eds.). Hillsdale, N.J.: Lawrence Erlbaum
Associates, pp. 101-1 15.
Moore, E. G. 1. 1986. Family socialization and the 1Q test performance of tra-
ditionally and transracially adopted black children. Developmental Psych.
22:317-326.
Mordechai, M. 1975. A study of cross-cultural factorial structure of intelli-
gence. Psychologia: An Intemtional]. of Psych. in the Orient 18:92-94.
Mosteller, F., and Moynihan, D. P. (eds.). 1972. On Equality of Educational Op-
portunity. New York: Random House.
Moynihan, D. P. 1986. Family andNotion. New York: Hatcourt BraceJovanovich.
Munford, P. R., and Munoz, A. 1980. A comparison of the WISC and
WISC-R on Hispanic children. J. of Clinical Psych. 36452458.
Munsinger, H. 1975. The adopted child's IQ: A critical review. Psychologica
Bull. 82:623-659.
Murchison, C. 1926. Criminal Intelligence. Worcester, Mass.: Clark Universit~
Murphy, K. M., and Welch, F. 1989. Wage differentials in the 1980s: The rc
of international trade. Applied Econometrics Discussion Paper 23. Chicag
University of Chicago.
Bibliography
813
Murphy, K. M., and Welch, E 1993a. Inequality and relative wages. Am. Econ.
Rev. 83: 104-109.
Murphy, K. M., and Welch, F. 1993b. Occupational change and the demand
for skill, 1940-1990. Am. Econ. Rev. 83:122-126.
Murphy, K. R. 1986. When your top choice turns you down: Effect of rejected
offers on the utility of selection tests. Psychological Bull. 99:133-138.
Murray, C. 1984. Losing Ground: American Social Policy, 1950-1 980. New York:
Basic Books.
Murray, C. 1986a. According to age: Longitudinal profiles of AFDC recipients and
the pour by age group. Working seminar on the Family and American Wel-
fare Policy. Washington, D.C.: American Enterprise Institute.
Murray, C. 198613. No, welfare isn't really the problem. Public Interest no.
84:3-11.
Murray, C. 1988a. The coming of custodial democracy. Commentary 86: 19-24.
Murray, C. 198813. In Pursuit: Of Happiness and Good Government. New York:
Simon & Schuster.
Murray, C. 1993. Welfare and the family: The American experience. J. of La-
bor Economics 1 1:224-262.
Murray, C. 1994. Does welfare bring more babies? Public Interest, no. 1 15: 17-30.
Murray, C., and Herrnstein, R. J. 1992. What's really behind the SAT-score de-
cline? Public Interest, no. 106:32-56.
Naglieri, J. A. 1986. WISC-R and K-ARC comparison for matched samples of
black and white children. J. of School Psych. 2431-88.
National Center for Education Statistics. 1991. Trends in Academic Propess:
Achievement of American Students in Science, 1970-90, Mathematics,
1 973-90, Reading, 1971 -90, and Writing, 1984-90. Washington, D.C.: Na-
tional Center for Education Statistics.
National Center for Education Statistics. 1992. The Condition of Education
1992. Washington, D.C.: Government Printing Office.
National Center for Education Statistics. Digest of Education Statistics. Annual.
Washington, D.C.: Government Printing Office.
National Center for Health Statistics. 1991. Advance report of final natality
statistics, 1989. Monthly Vital Statistics Report 40, no. 8.
National Center for Health Statistics. 1993. Advance report of final natality
statistics, 1991. Monthly Vital Statistics Repmt 42, no. 3.
National Commission on Excellence in Education. 1983. A Nation at Risk: The
Imperative for Educational Reform. Washington, D.C.: Government Printing
Office.
National Commission on Excellence in Education. 1984. A Nation at Risk: The
Full Account. Cambridge, Mass.: U.S.A. Research.
Neale, M. C., and McArdle, J. J. 1990. The analysis of assortative mating: A
LISREL model. Behavior Genetics 20:287-296.
Neill, A. S. 1960. Summerhill: A Radical Approach to Child Rearing. New York:
Hart.
Neuman, W. R. 1981. Differentiation and integration: Two Jimensions of po-
litical thinking. Am. J. of Sociolo~y 86:1236-1268.
Neuman, W. R. 1986. The Paradox of Mass Politics: Knowledge and Opinion in
the American Electorate. Camhridge, Mass.: Harvard University Press.
Newherger, C. M., and Cook, S. L. 1983. Parental awareness and child abuse:
A cognitive developmental analysis of urban and rural samples. Am. J. of
Orthopsychiatry 535 12-524.
Newcomer, M. 1955. The Big Business Executive: The Factors That Made Him,
1900-1 950. New York: Columhia University Press.
Nicholson, R. A., and Kugler, K. E. 199 1. Competent and incompetent crim-
inal defendants: A quantitative review of comparative research. Psycholog-
ical Bull. 109:355-370.
Nickerson, R. S. 1986. Project intelligence: An account and some reflections.
In Facilitating Development: fntemational Perspectives, Programs, and Practices.
M. Schwebcl andC. A. Maher (eds.). New York: Haworth Press, pp. 83-102.
Nickerson, R. S., Perkins, D. N., and Smith, E. E. 1985. The Teaching of Think-
ing. Hillsdale, N .] .: Lawrence Erlbaum Associates.
Nie, N. H., Verba, S., and Petrocik, J. R. 1976. The Changing American Voter.
Cambridge, Mass.: Harvard University Press.
Novak, M. 1992. The longtime-Democrat blues. National Rev., July 20, pp.
24-26.
Oakland, T., and Feigenbaum, D. 1979. Multiple sources of test bias on the
WISC-R and Render-Gestalt Test. 1. of Consulting and Clinical Psych.
47:968-974.
O'Brien, F. P. 1928. Mental ability with reference to selection and retention of
college students. J. of Educational Research 18: 136-143.
O'Connor, N., and Hermelin, B. 1987. Visual memory and motor programmes:
Their use by idiot+savant artists and controls. British J. of Psych. 78:307-323.
Mice of Civil Rights. 1990. Statement of Findings (for Compliance Rev. No.
01-88-6009 on Harvard University). Washington, D.C.: U.S. Departmenf
of Education.
Office of Policy and Planning. 1993. Reinventing Chapter I : The Current C
ter 1 Program and New Directions. Washington, D.C.: U.S. Departme1
Education.
Office of the Assistant Secretary of Defense (Manpower, R. A., and Logi
1980. Implementation of New Armed Services Vocational Aptitude Ratte
Actions to Improve the Enlistment Standarh Process. Report to the Hou
Senate Committees on Armed Services.Washington, D.C.: Departn
Defense.
Office of the Assistant Secretary of Defense (Manpower, R. A., and Lo
Multidisciplinary Academic Bibliography
- The text consists of a comprehensive bibliography covering diverse fields such as education, psychology, sociology, and political science.
- Significant focus is placed on military standards and performance, specifically regarding the Armed Services Vocational Aptitude Battery (ASVAB).
- Several entries address the intersection of intelligence, cognitive development, and social issues like child abuse and criminal competency.
- The list includes seminal reports on the American education system, notably 'A Nation at Risk' and studies on the 'idiot-savant' phenomenon.
- Political behavior and voter demographics are represented through works analyzing mass politics and the changing American electorate.
- Legal and ethical debates regarding affirmative action in medical school admissions and the American caste system are documented.
Visual memory and motor programmes: Their use by idiot-savant artists and controls.
Bibliography
813
Murphy, K. M., and Welch, E 1993a. Inequality and relative wages. Am. Econ.
Rev. 83: 104-109.
Murphy, K. M., and Welch, F. 1993b. Occupational change and the demand
for skill, 1940-1990. Am. Econ. Rev. 83:122-126.
Murphy, K. R. 1986. When your top choice turns you down: Effect of rejected
offers on the utility of selection tests. Psychological Bull. 99:133-138.
Murray, C. 1984. Losing Ground: American Social Policy, 1950-1 980. New York:
Basic Books.
Murray, C. 1986a. According to age: Longitudinal profiles of AFDC recipients and
the pour by age group. Working seminar on the Family and American Wel-
fare Policy. Washington, D.C.: American Enterprise Institute.
Murray, C. 198613. No, welfare isn't really the problem. Public Interest no.
84:3-11.
Murray, C. 1988a. The coming of custodial democracy. Commentary 86: 19-24.
Murray, C. 198813. In Pursuit: Of Happiness and Good Government. New York:
Simon & Schuster.
Murray, C. 1993. Welfare and the family: The American experience. J. of La-
bor Economics 1 1:224-262.
Murray, C. 1994. Does welfare bring more babies? Public Interest, no. 1 15: 17-30.
Murray, C., and Herrnstein, R. J. 1992. What's really behind the SAT-score de-
cline? Public Interest, no. 106:32-56.
Naglieri, J. A. 1986. WISC-R and K-ARC comparison for matched samples of
black and white children. J. of School Psych. 2431-88.
National Center for Education Statistics. 1991. Trends in Academic Propess:
Achievement of American Students in Science, 1970-90, Mathematics,
1 973-90, Reading, 1971 -90, and Writing, 1984-90. Washington, D.C.: Na-
tional Center for Education Statistics.
National Center for Education Statistics. 1992. The Condition of Education
1992. Washington, D.C.: Government Printing Office.
National Center for Education Statistics. Digest of Education Statistics. Annual.
Washington, D.C.: Government Printing Office.
National Center for Health Statistics. 1991. Advance report of final natality
statistics, 1989. Monthly Vital Statistics Report 40, no. 8.
National Center for Health Statistics. 1993. Advance report of final natality
statistics, 1991. Monthly Vital Statistics Repmt 42, no. 3.
National Commission on Excellence in Education. 1983. A Nation at Risk: The
Imperative for Educational Reform. Washington, D.C.: Government Printing
Office.
National Commission on Excellence in Education. 1984. A Nation at Risk: The
Full Account. Cambridge, Mass.: U.S.A. Research.
Neale, M. C., and McArdle, J. J. 1990. The analysis of assortative mating: A
LISREL model. Behavior Genetics 20:287-296.
Neill, A. S. 1960. Summerhill: A Radical Approach to Child Rearing. New York:
Hart.
Neuman, W. R. 1981. Differentiation and integration: Two Jimensions of po-
litical thinking. Am. J. of Sociolo~y 86:1236-1268.
Neuman, W. R. 1986. The Paradox of Mass Politics: Knowledge and Opinion in
the American Electorate. Camhridge, Mass.: Harvard University Press.
Newherger, C. M., and Cook, S. L. 1983. Parental awareness and child abuse:
A cognitive developmental analysis of urban and rural samples. Am. J. of
Orthopsychiatry 535 12-524.
Newcomer, M. 1955. The Big Business Executive: The Factors That Made Him,
1900-1 950. New York: Columhia University Press.
Nicholson, R. A., and Kugler, K. E. 199 1. Competent and incompetent crim-
inal defendants: A quantitative review of comparative research. Psycholog-
ical Bull. 109:355-370.
Nickerson, R. S. 1986. Project intelligence: An account and some reflections.
In Facilitating Development: fntemational Perspectives, Programs, and Practices.
M. Schwebcl andC. A. Maher (eds.). New York: Haworth Press, pp. 83-102.
Nickerson, R. S., Perkins, D. N., and Smith, E. E. 1985. The Teaching of Think-
ing. Hillsdale, N .] .: Lawrence Erlbaum Associates.
Nie, N. H., Verba, S., and Petrocik, J. R. 1976. The Changing American Voter.
Cambridge, Mass.: Harvard University Press.
Novak, M. 1992. The longtime-Democrat blues. National Rev., July 20, pp.
24-26.
Oakland, T., and Feigenbaum, D. 1979. Multiple sources of test bias on the
WISC-R and Render-Gestalt Test. 1. of Consulting and Clinical Psych.
47:968-974.
O'Brien, F. P. 1928. Mental ability with reference to selection and retention of
college students. J. of Educational Research 18: 136-143.
O'Connor, N., and Hermelin, B. 1987. Visual memory and motor programmes:
Their use by idiot+savant artists and controls. British J. of Psych. 78:307-323.
Mice of Civil Rights. 1990. Statement of Findings (for Compliance Rev. No.
01-88-6009 on Harvard University). Washington, D.C.: U.S. Departmenf
of Education.
Office of Policy and Planning. 1993. Reinventing Chapter I : The Current C
ter 1 Program and New Directions. Washington, D.C.: U.S. Departme1
Education.
Office of the Assistant Secretary of Defense (Manpower, R. A., and Logi
1980. Implementation of New Armed Services Vocational Aptitude Ratte
Actions to Improve the Enlistment Standarh Process. Report to the Hou
Senate Committees on Armed Services.Washington, D.C.: Departn
Defense.
Office of the Assistant Secretary of Defense (Manpower, R. A., and Lo
8 14
Bibliography
Bibliography
81 5
1982. Profile of American Youth: 1980 Nationwide Administration of the Armed
Services Vocational Aptitude Battery. Washington, D.C.: Department of
Defense.
Office of the Assistant Secretary of Defense for Force Management and Per-
sonnel. 1989. Ioint-Service Efforts to Link Enlistment Standards to Job Perfor-
mance: Recruit Quality and Militay Readiness. Report to the House
Committee on Appropriations. Washington, D.C.: Department of Defense.
Ogbu, J. U. 1986. The consequences of the American caste system. In The
School Achievement of Minority Children. U . Neisser (ed.). Hillsdale, N.J.:
Lawrence Erlbaum Associates, pp. 19-56.
Olasky, M. 1992. The Tragedy ofAmerican Compassion. Washington, D.C.: Reg-
nery Gateway.
Olasky, M. 1993. The war on adoption. National Rev., June 7, pp. 38-44.
Olmstead, A. L., and Sheffrin, S. M. 1980a. Affirmative action in medical
schools: Econometric evidence and legal doctrine. In Research in Law and
Economics, vol. 3. Greenwich, Conn.: JAI Press, pp. 207-223.
Olmstead, A. L., and Sheffrin, S. M. 1980b. Medical school admission and af-
firmative action. Working Paper 146. Davis, Cal.: Department of Econom-
ics, University of California at Davis.
Olneck, M. R., Wolfe, B. L., and Dean, C. 1980. Intelligence and family size:
Another look. Rev. of Economics and Statistics 62:241-247.
Olson, W. K. 1991. The Litigation Explosion: What Happened When America Un-
leashed the Lawsuit. New York: Dutton.
O'Neill, J. 1990. The role of human capital in earnings differences between
black and white men. 1. of Econ. Perspectives 4:25-45.
Oppenheimer, V. K. 1988. A theory of marriage timing: Assortative mating un-
der varying degrees of uncertainty. Am. 1. of Sociolom 94:563-591.
Orr, D. E, et al. 1992. Factors associated with condom use among sexually ac-
tive female adolescents. 1. of Pediamcs 120:3 11-3 17.
Oshom, F. 1940. Preface to Eugenics. New York: Harper & Row.
Osborn, E, and Rajema, C. J. 1972. The eugenic hypothesis. Social Biolom
19:337-345.
Osborne, R. T. 1973. Fertility ratio: Its relationship to mental ability, school
achievement, and race. 1. of Psych. 84: 159-164.
Oshorne, R. T. 1975. Fertility, IQ, and school achievement. PsycholoRical Re-
ports 37:1067-1073.
Osbome, R. T., and McGurk, E C. J. (eds.). 1982. The Testing of Neqo Intelli-
gnce, vol. 2. Athens, Ga.: Foundation for Human Understanding.
Osbome, Y. H., Hinz, L. D., Rappaport, N. R., Williams, H. S., and Tuma, J.
M. 1988. Parent social attractiveness, parent sex, child temperament, and
socioeconomic status as predictors of tendency to report child abuse. J. of
Social and Clinical Psych. 6:69-76.
O'Toole, R. I. 1990. Intelligence and behaviour and motor vehicle accident
mortality. Accident Analysis and Prevention 22:211-221.
Owen, D. 1985. None of the Above: Behind the Myth of Schofastic Aptitude.
Boston: Houghton Mifflin.
Page, E. A. 1972. Miracle in Milwaukee: Raising the IQ. Educational Researcher
1:8-15.
Page, E. R., and Grandon, G. M. 1981. Massive intervention and child intel-
ligence: The Milwaukee Project in critical perspective. I. of Special Educa-
tion 15:239-256.
Parke, R., and Collmer, C. W. 1975. Child abuse: An interdiscipliwary analy-
sis. In Review of Child Development Research, vol. 5. E. M. Hetherington (ed.).
Chicago: University of Chicago Press, pp. 150-184.
Parker, S. J., Zahr, L. K., Cole, J. G., and Rrecht, M.-L. 1992. Outcome after
developmental intervention in the neonatal intensive care unit for moth-
ers of preterm infants with low socioeconomic status. J. of Pediatrics
120:780-785.
Passingham, R. E. 1982. Thc Human Primate. San Francisco: Freeman.
Patterson, P. 0. 1989. Employment testing and Ttle VI1 of the Civil Rights
Act ($ 1964. In Test Policy and the Politics of Opportunity Allocation: The
Workplace and the Law. B. R. Gifford (ed.). Boston: Kluwer Academic Pub-
lishers.
Pearson, J., Hunder, A., Ensminger, M., and Kellam, S. 1990. Black grand-
mothers in m~lti~enerational
households: Diversity in family structure and
parenting involvement in Woodlawn community. Child Development
61:434-442.
Pearson, R. (ed.). 1992. Shockley on Eugenics and Race. Washington, D.C.:
Scott-Townsend.
Pedersen, N. L., Plomin, R., Nesselroade, J. R., and McClearn, G. E. 1992. A
quantitative genetic analysis of cognitive abilities during the second half of
the life span. Psychological Science 3:346-353.
Peller, G. 1991. Espousing a positive vision of affirmative-action policies.
Chronicle of Higher Education, December 18, sec. 2.
Pelton, L. H. 1978. Child abuse and neglect: The myth of classlessness. Am. J.
of Orthopsychiatry 48:608-617.
Pelton, L. H. 1990-1991. Poverty and child protection. Protecting Children
(Winter): 3-5.
Peterson, S. A. 1990. Political Behavior: Patterns in Everyday Life. Newbury Park,
Cal.: Sage Publications.
Phillips, K., Fulker, D. W., Carey, G., and Nagoshi, C. T. 1988. Direct marital
assortment for cognitive and personality variables. Behavim Genetics
18:347-356.
Piaget, J. 1952. Autobiographical essay. In A History of Psychology in Autobiog-
Scholarly Bibliography on Intelligence
- This section provides a comprehensive list of academic references focusing on the intersection of intelligence, genetics, and socioeconomic outcomes.
- Key topics include the relationship between IQ and fertility, family size, and educational achievement.
- Several citations address the social implications of human capital, including child abuse, motor vehicle accidents, and marriage timing.
- The bibliography highlights controversial themes such as eugenics, race-based intelligence testing, and the effectiveness of early childhood interventions like the Milwaukee Project.
- Legal and political dimensions are explored through references to affirmative action, litigation trends, and civil rights law in employment testing.
Olson, W. K. 1991. The Litigation Explosion: What Happened When America Unleashed the Lawsuit.
8 14
Bibliography
Bibliography
81 5
1982. Profile of American Youth: 1980 Nationwide Administration of the Armed
Services Vocational Aptitude Battery. Washington, D.C.: Department of
Defense.
Office of the Assistant Secretary of Defense for Force Management and Per-
sonnel. 1989. Ioint-Service Efforts to Link Enlistment Standards to Job Perfor-
mance: Recruit Quality and Militay Readiness. Report to the House
Committee on Appropriations. Washington, D.C.: Department of Defense.
Ogbu, J. U. 1986. The consequences of the American caste system. In The
School Achievement of Minority Children. U . Neisser (ed.). Hillsdale, N.J.:
Lawrence Erlbaum Associates, pp. 19-56.
Olasky, M. 1992. The Tragedy ofAmerican Compassion. Washington, D.C.: Reg-
nery Gateway.
Olasky, M. 1993. The war on adoption. National Rev., June 7, pp. 38-44.
Olmstead, A. L., and Sheffrin, S. M. 1980a. Affirmative action in medical
schools: Econometric evidence and legal doctrine. In Research in Law and
Economics, vol. 3. Greenwich, Conn.: JAI Press, pp. 207-223.
Olmstead, A. L., and Sheffrin, S. M. 1980b. Medical school admission and af-
firmative action. Working Paper 146. Davis, Cal.: Department of Econom-
ics, University of California at Davis.
Olneck, M. R., Wolfe, B. L., and Dean, C. 1980. Intelligence and family size:
Another look. Rev. of Economics and Statistics 62:241-247.
Olson, W. K. 1991. The Litigation Explosion: What Happened When America Un-
leashed the Lawsuit. New York: Dutton.
O'Neill, J. 1990. The role of human capital in earnings differences between
black and white men. 1. of Econ. Perspectives 4:25-45.
Oppenheimer, V. K. 1988. A theory of marriage timing: Assortative mating un-
der varying degrees of uncertainty. Am. 1. of Sociolom 94:563-591.
Orr, D. E, et al. 1992. Factors associated with condom use among sexually ac-
tive female adolescents. 1. of Pediamcs 120:3 11-3 17.
Oshom, F. 1940. Preface to Eugenics. New York: Harper & Row.
Osborn, E, and Rajema, C. J. 1972. The eugenic hypothesis. Social Biolom
19:337-345.
Osborne, R. T. 1973. Fertility ratio: Its relationship to mental ability, school
achievement, and race. 1. of Psych. 84: 159-164.
Oshorne, R. T. 1975. Fertility, IQ, and school achievement. PsycholoRical Re-
ports 37:1067-1073.
Osbome, R. T., and McGurk, E C. J. (eds.). 1982. The Testing of Neqo Intelli-
gnce, vol. 2. Athens, Ga.: Foundation for Human Understanding.
Osbome, Y. H., Hinz, L. D., Rappaport, N. R., Williams, H. S., and Tuma, J.
M. 1988. Parent social attractiveness, parent sex, child temperament, and
socioeconomic status as predictors of tendency to report child abuse. J. of
Social and Clinical Psych. 6:69-76.
O'Toole, R. I. 1990. Intelligence and behaviour and motor vehicle accident
mortality. Accident Analysis and Prevention 22:211-221.
Owen, D. 1985. None of the Above: Behind the Myth of Schofastic Aptitude.
Boston: Houghton Mifflin.
Page, E. A. 1972. Miracle in Milwaukee: Raising the IQ. Educational Researcher
1:8-15.
Page, E. R., and Grandon, G. M. 1981. Massive intervention and child intel-
ligence: The Milwaukee Project in critical perspective. I. of Special Educa-
tion 15:239-256.
Parke, R., and Collmer, C. W. 1975. Child abuse: An interdiscipliwary analy-
sis. In Review of Child Development Research, vol. 5. E. M. Hetherington (ed.).
Chicago: University of Chicago Press, pp. 150-184.
Parker, S. J., Zahr, L. K., Cole, J. G., and Rrecht, M.-L. 1992. Outcome after
developmental intervention in the neonatal intensive care unit for moth-
ers of preterm infants with low socioeconomic status. J. of Pediatrics
120:780-785.
Passingham, R. E. 1982. Thc Human Primate. San Francisco: Freeman.
Patterson, P. 0. 1989. Employment testing and Ttle VI1 of the Civil Rights
Act ($ 1964. In Test Policy and the Politics of Opportunity Allocation: The
Workplace and the Law. B. R. Gifford (ed.). Boston: Kluwer Academic Pub-
lishers.
Pearson, J., Hunder, A., Ensminger, M., and Kellam, S. 1990. Black grand-
mothers in m~lti~enerational
households: Diversity in family structure and
parenting involvement in Woodlawn community. Child Development
61:434-442.
Pearson, R. (ed.). 1992. Shockley on Eugenics and Race. Washington, D.C.:
Scott-Townsend.
Pedersen, N. L., Plomin, R., Nesselroade, J. R., and McClearn, G. E. 1992. A
quantitative genetic analysis of cognitive abilities during the second half of
the life span. Psychological Science 3:346-353.
Peller, G. 1991. Espousing a positive vision of affirmative-action policies.
Chronicle of Higher Education, December 18, sec. 2.
Pelton, L. H. 1978. Child abuse and neglect: The myth of classlessness. Am. J.
of Orthopsychiatry 48:608-617.
Pelton, L. H. 1990-1991. Poverty and child protection. Protecting Children
(Winter): 3-5.
Peterson, S. A. 1990. Political Behavior: Patterns in Everyday Life. Newbury Park,
Cal.: Sage Publications.
Phillips, K., Fulker, D. W., Carey, G., and Nagoshi, C. T. 1988. Direct marital
assortment for cognitive and personality variables. Behavim Genetics
18:347-356.
Piaget, J. 1952. Autobiographical essay. In A History of Psychology in Autobiog-
Academic Bibliography on Intelligence
- The text provides a comprehensive list of academic citations focusing on the intersection of genetics, environment, and intelligence.
- Key research by Plomin and Bergeman explores the 'nature of nurture' and why siblings within the same family often develop distinct differences.
- Several entries examine the socioeconomic and demographic factors of fertility, marriage patterns, and family decline in America.
- The bibliography highlights studies on educational performance and admissions testing across different racial and ethnic groups.
- Multiple citations address the impact of maternal warmth and early childhood intervention on cognitive functioning and developmental retardation.
- The collection includes historical and sociological perspectives on the education of American leaders and corporate executives.
Plomin, R., and Bergeman, C. S. 1991. The nature of nurture: Genetic influence on "environmental" measures.
Bibliography
817
raphy, vol. 4. E. G. Boring, H. S. Langfeld, H. Werner, and R. M. Yerkes
(eds.). Worcester, Mass.: Clark University Press, pp. 237-256.
Pick, J. B., Butler, E. W., and Pavgi, S. 1988. Socioeconomic determinants of
fertility: Selected Mexican regions, 1976-1977. Social Biology 35: 137-1 57.
Pierson, G. W. 1969. The Education of American Leaders: Comparative Contri-
butions of U.S. Colleges and Universities. New York: Praeger.
Plomin, R., and Bergeman, C. S. 1987. Why are children in the same family
so different from one another? Behavioral and Brain Sciences 10:l-60.
Plomin, R., and Bergeman, C. S. 1991. The nature of nurture: Genetic influ-
ence on "environmental" measures. Behavioral awl Brain Sciences
14:373-427.
Plomin, R., and DeFries, J. C. 1980. Genetics and intelligence: Recent data.
Intelligence 4: 15-24.
Plomin, R., and DeFries, J. C. 1985. Ongins of Individual Diffmences in Infancy:
The Colorado Adoption Project. Orlando, Fla.: Academic Press.
Plomin, R., and Loehlin, J. C. 1989. Direct and indirect IQ heritability esti-
mates: A puzzle. Behavior Genetics 19:33 1-342.
Polansky, N. 1981. Damaged Parents: An Anatomy of Child Neglect. Chicago:
University of Chicago Press.
Pond, M. 1933. Occupations, intelligence, age, and schooling: Their relation-
ship and distribution in a factory population. Personnel journal 1 1:373-382.
Popenoe, D. 1993. American family decline, 1960-1990: A review and ap-
praisal. j . of Marriage and the Family 55527-555.
Porter, R. P. 1990. Forked Tongue: The Politics of Bilingual Education. New York:
Basic Books.
Potter, E. E. 1986. Employee Selection: Legal and Practical Altemtiues to Com-
pliance and Litigation. Washington, D.C.: National Foundation for the Study
of Equal Employment Policy.
Powell, A., Farrar, E., and Cohen, D. 1985. The Shopping Mall High School.
Boston: Houghton Mifflin.
Powers, D. E. 1977. Comparing predictions of law school performance for hlack,
Chicano, and white law students. in Reports of LSAC Sponsored Research.
Princeton, N.J.: Law School Admissions Council.
Powers, D. E. 1987. Who benefits most from preparing for a "coachahle" ad-
missions test?lournal of Educational Measurement 24:247-262.
Preston, S. H., and Camphell, C. 1993. Differential fertility and the distrihu-
tion of traits: The case of IQ. Am. J. ofSociol0~ 98:997-1019.
Price, R. A., and Vandenberg, S. G. 1980. Spouse similarity in American and
Swedish couples. Behavioral Genetics 1059-7 1.
Priest, T. B. 1982. Education and career among corporate chief executive offi-
cers: A historical note. Social Science Quarterly 63:342-349.
Qian, Z., and Preston, S. H. 1993. Changes in American marriage, 1972-1987:
Availability and forces of attraction by age and education. Am. Sociological
Reu. 58:482-495.
Quay, H. C. 1987. Intelligence. In HandbookofJuvenile Delinquency. H. C. Quay
(ed.). New York: Wiley, pp. 106-1 17.
Quay, L. C. 1971. Language, dialect, reinforcement, and the intelligence test
performance of Negro children. Child Development 42:5-15.
Quay, L. C. 1972. Negro dialect and Binet performance in severely disadvan-
taged black four-year-olds. Child Development 43:245-250.
Quay, L. C. 1974. Language dialect, age, and intelligence-test performance in
disadvantaged black children. Child Development 45:463-468.
Radin, N. 1971. Maternal warmth, achievement motivation, and cognitive
functioning in lower-class preschool children. Child Development
42:1560-1565.
Ramey, C. T. 1992. High-risk children and IQ: Altering intergenerational pat-
terns. intelligence 16:239-256.
Ramey, C. T., MacPhee, D., and Yeates, K. 0. 1982. Preventing develnprnen-
tal retardation: A general systems model. In How and How Much Can Intel-
ligence Be Increased. D. K. Detterman and R. J. Sternberg (eds.). Norwood,
N.J.: Ablex Publishing Corp., pp. 67-1 19.
Rank, M., and Hirschl, T. A. 1988. A rural-urban comparison of welfare exits:
The importance of population density. Rural Sociology 53:190-206.
Raschke, H. J. 1987. Divorce. In Handbook of Marriage and the Family. M. B.
Sussman and S. K. Steinmetz (eds.). New York: Plenum Press, pp. 597-624.
Ravitch, D. 1983. The Troubled Crusade: American Education, 1945- 1980. New
York: Basic Rooks.
Ravitch, D. 1985. The Schools We Deserve: Reflections on the Educational Crises
of Our Time. New York: Basic Books.
Ravitch, D., and Finn, C. E., Jr. 1987. What Do Our 17-Year-Olds Know! New
York: Harper & Row.
Rawls, 1. 197 1. A Theory ofjwtice. Cambridge, Mass.: Harvard University Press.
Ree, M. J., and Earles, J. A. 1990a. Differential Validity of a Diffewntial Aptitude
Test. AFHRL-TR-89-59. Brooks Air Force Base, Tex.: Manpower and Per-
sonnel Division,
Ree, M. J., and Earles, J. A. 1990b. Estimating the General Cognitive Component
of the Armed Services Vocational Aptitude Battery (ASVAB): Three Faces of g.
AFHRL-TR-90-38. Brooks Air Force Base, Tex.: Air Force Systems Com-
mand.
Ree, M. J., and Earles, J. A. 1991a. Aptitude of future manpower: Consequences
of demographic change. Brooks Air Force Base, Tex.: Manpower and Person-
nel Division, Air Force Systems Command.
Ree, M.]., and Earles, 1. A. 1991b. General cognitive ability predicts job per-
formance. Interim technical paper AL-TP-1991-0057. Brooks Air Force
Academic Bibliography on Intelligence
- The text consists of a formal bibliography listing academic sources focused on sociology, education, and psychology.
- A significant portion of the citations explores the relationship between general cognitive ability (g) and job performance, particularly within military contexts.
- Several entries address the intersection of intelligence with demographic factors, including family size, fertility, and birth order.
- The list includes research on potential biases in mental testing across different racial and ethnic groups, such as Native American and Mexican-American children.
- Broader social issues are represented through works on divorce, criminal behavior, and the evolution of 21st-century capitalism.
Estimating the General Cognitive Component of the Armed Services Vocational Aptitude Battery (ASVAB): Three Faces of g.
Bibliography
817
raphy, vol. 4. E. G. Boring, H. S. Langfeld, H. Werner, and R. M. Yerkes
(eds.). Worcester, Mass.: Clark University Press, pp. 237-256.
Pick, J. B., Butler, E. W., and Pavgi, S. 1988. Socioeconomic determinants of
fertility: Selected Mexican regions, 1976-1977. Social Biology 35: 137-1 57.
Pierson, G. W. 1969. The Education of American Leaders: Comparative Contri-
butions of U.S. Colleges and Universities. New York: Praeger.
Plomin, R., and Bergeman, C. S. 1987. Why are children in the same family
so different from one another? Behavioral and Brain Sciences 10:l-60.
Plomin, R., and Bergeman, C. S. 1991. The nature of nurture: Genetic influ-
ence on "environmental" measures. Behavioral awl Brain Sciences
14:373-427.
Plomin, R., and DeFries, J. C. 1980. Genetics and intelligence: Recent data.
Intelligence 4: 15-24.
Plomin, R., and DeFries, J. C. 1985. Ongins of Individual Diffmences in Infancy:
The Colorado Adoption Project. Orlando, Fla.: Academic Press.
Plomin, R., and Loehlin, J. C. 1989. Direct and indirect IQ heritability esti-
mates: A puzzle. Behavior Genetics 19:33 1-342.
Polansky, N. 1981. Damaged Parents: An Anatomy of Child Neglect. Chicago:
University of Chicago Press.
Pond, M. 1933. Occupations, intelligence, age, and schooling: Their relation-
ship and distribution in a factory population. Personnel journal 1 1:373-382.
Popenoe, D. 1993. American family decline, 1960-1990: A review and ap-
praisal. j . of Marriage and the Family 55527-555.
Porter, R. P. 1990. Forked Tongue: The Politics of Bilingual Education. New York:
Basic Books.
Potter, E. E. 1986. Employee Selection: Legal and Practical Altemtiues to Com-
pliance and Litigation. Washington, D.C.: National Foundation for the Study
of Equal Employment Policy.
Powell, A., Farrar, E., and Cohen, D. 1985. The Shopping Mall High School.
Boston: Houghton Mifflin.
Powers, D. E. 1977. Comparing predictions of law school performance for hlack,
Chicano, and white law students. in Reports of LSAC Sponsored Research.
Princeton, N.J.: Law School Admissions Council.
Powers, D. E. 1987. Who benefits most from preparing for a "coachahle" ad-
missions test?lournal of Educational Measurement 24:247-262.
Preston, S. H., and Camphell, C. 1993. Differential fertility and the distrihu-
tion of traits: The case of IQ. Am. J. ofSociol0~ 98:997-1019.
Price, R. A., and Vandenberg, S. G. 1980. Spouse similarity in American and
Swedish couples. Behavioral Genetics 1059-7 1.
Priest, T. B. 1982. Education and career among corporate chief executive offi-
cers: A historical note. Social Science Quarterly 63:342-349.
Qian, Z., and Preston, S. H. 1993. Changes in American marriage, 1972-1987:
Availability and forces of attraction by age and education. Am. Sociological
Reu. 58:482-495.
Quay, H. C. 1987. Intelligence. In HandbookofJuvenile Delinquency. H. C. Quay
(ed.). New York: Wiley, pp. 106-1 17.
Quay, L. C. 1971. Language, dialect, reinforcement, and the intelligence test
performance of Negro children. Child Development 42:5-15.
Quay, L. C. 1972. Negro dialect and Binet performance in severely disadvan-
taged black four-year-olds. Child Development 43:245-250.
Quay, L. C. 1974. Language dialect, age, and intelligence-test performance in
disadvantaged black children. Child Development 45:463-468.
Radin, N. 1971. Maternal warmth, achievement motivation, and cognitive
functioning in lower-class preschool children. Child Development
42:1560-1565.
Ramey, C. T. 1992. High-risk children and IQ: Altering intergenerational pat-
terns. intelligence 16:239-256.
Ramey, C. T., MacPhee, D., and Yeates, K. 0. 1982. Preventing develnprnen-
tal retardation: A general systems model. In How and How Much Can Intel-
ligence Be Increased. D. K. Detterman and R. J. Sternberg (eds.). Norwood,
N.J.: Ablex Publishing Corp., pp. 67-1 19.
Rank, M., and Hirschl, T. A. 1988. A rural-urban comparison of welfare exits:
The importance of population density. Rural Sociology 53:190-206.
Raschke, H. J. 1987. Divorce. In Handbook of Marriage and the Family. M. B.
Sussman and S. K. Steinmetz (eds.). New York: Plenum Press, pp. 597-624.
Ravitch, D. 1983. The Troubled Crusade: American Education, 1945- 1980. New
York: Basic Rooks.
Ravitch, D. 1985. The Schools We Deserve: Reflections on the Educational Crises
of Our Time. New York: Basic Books.
Ravitch, D., and Finn, C. E., Jr. 1987. What Do Our 17-Year-Olds Know! New
York: Harper & Row.
Rawls, 1. 197 1. A Theory ofjwtice. Cambridge, Mass.: Harvard University Press.
Ree, M. J., and Earles, J. A. 1990a. Differential Validity of a Diffewntial Aptitude
Test. AFHRL-TR-89-59. Brooks Air Force Base, Tex.: Manpower and Per-
sonnel Division,
Ree, M. J., and Earles, J. A. 1990b. Estimating the General Cognitive Component
of the Armed Services Vocational Aptitude Battery (ASVAB): Three Faces of g.
AFHRL-TR-90-38. Brooks Air Force Base, Tex.: Air Force Systems Com-
mand.
Ree, M. J., and Earles, J. A. 1991a. Aptitude of future manpower: Consequences
of demographic change. Brooks Air Force Base, Tex.: Manpower and Person-
nel Division, Air Force Systems Command.
Ree, M.]., and Earles, 1. A. 1991b. General cognitive ability predicts job per-
formance. Interim technical paper AL-TP-1991-0057. Brooks Air Force
8 18
Bibliography
Bibliography
8 19
Base, Tex.: Manpower and Personnel Research Division, Air Force Systems
Command.
Ree, M. J., and Earles, J. A. 1991c. The stability of g across different methods
of estimation. Intelligence 15:271-278.
Reich, R. B. 1991. The Work of Nations: Preparing Olrrselves for Zlst-Century
Capitalism. New York: Alfred A. Knopf.
Reichel, H., and Magnusson, D. 1988. The relationship of intelligence to reg-
istered criminality. Reports from the Department of Psychology 676. Stock-
holm, Sweden: University of Stockholm.
Reid, J. B., and Tahlin, P. S. 1976. A social interactional approach to the treat-
ment of abusive families. Paper presented to the American Psychological
Association, Washington, D.C.
Reid, S. T. 1979. Crime and Criminology. 2d ed. New York: Holt, Rinehart and
Winston.
Reid, S. T. 1982. Crime and Criminology. 3d ed., New York: Holt, Rinehart and
Winston.
Reschly, D.J., and Ross-Reynolds, J. 1982. An investigation of WISC-R item
bias with black, Chicano, Native American, Papago, and white children:
Implications for nondiscriminatory assessment. Iowa City, la.: University of
Iowa. Photocopy.
Retherford, R. D. 1986. Demographic transition and the evolution of intelli-
gence: Theory and evidence. Working Paper 40. Honolulu: East-West Pop-
ulation Institute.
Retherford, R. D., and Sewell, W. H. 1988. Intelligence and family size recon-
sidered. Social Biology 35: 1-40.
Retherford, R. D., and Sewell, W. H. 1989. How intelligence affects fertility.
Intelligence 13: 169-1 85.
Retherford, R. D., and Sewell, W. H. 1991. Birth order and intelligence:
Further tests of the confluence model. Am. Sociological Re\!. 56:141-
158.
Reuning, H. 1988. Testing Bushmen in the central Kalahari. In Human Ahili-
ties in Cultural Context. S. H. Irvine and J. W. Beny (eds.). Cambridge: Cam-
bridge University Press, p ~ .
453486.
Reynolds, A. J., et al. 1988. An analysis of a PSAT coaching program for ur-
ban gifted students. J. of Educational Research 81: 155-164.
Reynolds, C. R., and Brown, R. T. (eds.). 1984. Perspectives on "Rim in Menml
Testing." New York: Plenum Press.
Reynolds, C. R., Chastain, R. L., Kaufman, A. S., and McLean, J. E. 1987. Lle-
mographic characteristics and IQ among adults: Analysis of the WAIS-R
standardization sample as a function of the stratification variables. J, of
School Psych. 25:323-342.
Reynolds, C. R., and Gutkin, T. R. 1980. Predictive validity of the WISC-R
for white and Mexican-American children. Paper presented at the annual
meeting of the American Educational Research Association, Boston.
Reynolds, C. R., and Jensen, A. R. 1983. WISC-R subscale patterns of abili-
ties of blacks and whites matched on full scale IQ. J , of Educational Psych.
75:207-2 14.
Rindfuss, R. R., Rumpass, L., and John, C. S. 1980. Education and fertility:
Implications for the roles women occupy. Am. Sociological Rev. 45:431-
447.
R~ndfuss, R. R., Morgan, S. P., and Spicegood, C. G. 1988. First Births in Amer-
ica: Changes in the Timing of Parenthood. Aerkeley: University of California
Press.
Roberts, J. 197 1. Intellectual Development of Children by Demographic and SO-
cioeconomic Factors. DHEW No. 72-1 01 2. Washington, D.C.: Government
Printing Office.
Roherts, J. V., and Gabor, T. 1990. Lombrosian wine in a new bottle: Research
on crime and race. Canadian]. of Criminoloffy 32:291-3 13.
Rock, D. A., Hilton, T. L., Pollack, J., Ekstrom, R. R., and Goertz, M. E. 1985.
Psychomemc Analysts of the N U and the High School and Beyond Test Batter-
ies. Princeton, N.J.: Educational Testing Service.
Rokeach, M. 1973. The Nature of Human Values. New York: Free Press.
Roper Organization. 1993. Roper Reports 93-8.
Roskam, E. E., and Ellis, J. 1992. Commentary on Guttman: The irrelevance
of factor analysis for the study of group differences. Multivariate Behavioral
Research 27:205-218.
Ross, C., Danziger, S., and Smolensky, E. 1987. The level and trend of poverty
in the United States, 1939-1979. Demography 24:587-600.
Ross-Reynolds, I., and Reschly, D. J. 1983. An investigation of item bias on
the WISC-R with four sociocultural groups. 1. of Consulting and Clinical
Psych. 51:144-146.
Rossi, P. 1987. The iron law of evaluation and other metallic rules. In Research
in Social Probkms and Public Policy, vol. 4. 1. Miller and M. Lewis (eds.).
Greenwich, Conn.: JAI Press, pp. 3-20.
Rothenberg, S., and Licht, E. 1982. Ethnic Voters and National Issues. Wash-
ington, D.C.: Free Congress Research and Education Foundation.
Rounds, J., and Andersen, D. 1985. Assessment for entrance to community col-
lege: Research studies of three major standardized tests. J. of Research and
Development in Education 1854-58.
Rowe, D. C., and Plomin, R. 1981. The importance of nonshared (E,) envi-
ronmental influences on behavioral development. Developmental Psych.
17:517-531.
Rowe, D. C., and Rodgers, J. L. 1992. A social contagion model of adolescent
sexual behavior. Tucson: University of Arizona. Photocopy.
Academic Bibliography on Social Science
- The text provides a comprehensive list of academic citations focusing on the intersection of race, intelligence, and socioeconomics.
- Several entries examine the validity of standardized testing, specifically the WISC-R, across different sociocultural and racial groups.
- A significant portion of the bibliography covers demographic shifts in America, including fertility rates and the timing of first births.
- The list includes controversial sociobiological research regarding 'r/K theory' and its application to human racial differences.
- Economic and social policy research is represented through studies on poverty trends and the 'iron law of evaluation' in public policy.
Rossi, P. 1987. The iron law of evaluation and other metallic rules.
8 18
Bibliography
Bibliography
8 19
Base, Tex.: Manpower and Personnel Research Division, Air Force Systems
Command.
Ree, M. J., and Earles, J. A. 1991c. The stability of g across different methods
of estimation. Intelligence 15:271-278.
Reich, R. B. 1991. The Work of Nations: Preparing Olrrselves for Zlst-Century
Capitalism. New York: Alfred A. Knopf.
Reichel, H., and Magnusson, D. 1988. The relationship of intelligence to reg-
istered criminality. Reports from the Department of Psychology 676. Stock-
holm, Sweden: University of Stockholm.
Reid, J. B., and Tahlin, P. S. 1976. A social interactional approach to the treat-
ment of abusive families. Paper presented to the American Psychological
Association, Washington, D.C.
Reid, S. T. 1979. Crime and Criminology. 2d ed. New York: Holt, Rinehart and
Winston.
Reid, S. T. 1982. Crime and Criminology. 3d ed., New York: Holt, Rinehart and
Winston.
Reschly, D.J., and Ross-Reynolds, J. 1982. An investigation of WISC-R item
bias with black, Chicano, Native American, Papago, and white children:
Implications for nondiscriminatory assessment. Iowa City, la.: University of
Iowa. Photocopy.
Retherford, R. D. 1986. Demographic transition and the evolution of intelli-
gence: Theory and evidence. Working Paper 40. Honolulu: East-West Pop-
ulation Institute.
Retherford, R. D., and Sewell, W. H. 1988. Intelligence and family size recon-
sidered. Social Biology 35: 1-40.
Retherford, R. D., and Sewell, W. H. 1989. How intelligence affects fertility.
Intelligence 13: 169-1 85.
Retherford, R. D., and Sewell, W. H. 1991. Birth order and intelligence:
Further tests of the confluence model. Am. Sociological Re\!. 56:141-
158.
Reuning, H. 1988. Testing Bushmen in the central Kalahari. In Human Ahili-
ties in Cultural Context. S. H. Irvine and J. W. Beny (eds.). Cambridge: Cam-
bridge University Press, p ~ .
453486.
Reynolds, A. J., et al. 1988. An analysis of a PSAT coaching program for ur-
ban gifted students. J. of Educational Research 81: 155-164.
Reynolds, C. R., and Brown, R. T. (eds.). 1984. Perspectives on "Rim in Menml
Testing." New York: Plenum Press.
Reynolds, C. R., Chastain, R. L., Kaufman, A. S., and McLean, J. E. 1987. Lle-
mographic characteristics and IQ among adults: Analysis of the WAIS-R
standardization sample as a function of the stratification variables. J, of
School Psych. 25:323-342.
Reynolds, C. R., and Gutkin, T. R. 1980. Predictive validity of the WISC-R
for white and Mexican-American children. Paper presented at the annual
meeting of the American Educational Research Association, Boston.
Reynolds, C. R., and Jensen, A. R. 1983. WISC-R subscale patterns of abili-
ties of blacks and whites matched on full scale IQ. J , of Educational Psych.
75:207-2 14.
Rindfuss, R. R., Rumpass, L., and John, C. S. 1980. Education and fertility:
Implications for the roles women occupy. Am. Sociological Rev. 45:431-
447.
R~ndfuss, R. R., Morgan, S. P., and Spicegood, C. G. 1988. First Births in Amer-
ica: Changes in the Timing of Parenthood. Aerkeley: University of California
Press.
Roberts, J. 197 1. Intellectual Development of Children by Demographic and SO-
cioeconomic Factors. DHEW No. 72-1 01 2. Washington, D.C.: Government
Printing Office.
Roherts, J. V., and Gabor, T. 1990. Lombrosian wine in a new bottle: Research
on crime and race. Canadian]. of Criminoloffy 32:291-3 13.
Rock, D. A., Hilton, T. L., Pollack, J., Ekstrom, R. R., and Goertz, M. E. 1985.
Psychomemc Analysts of the N U and the High School and Beyond Test Batter-
ies. Princeton, N.J.: Educational Testing Service.
Rokeach, M. 1973. The Nature of Human Values. New York: Free Press.
Roper Organization. 1993. Roper Reports 93-8.
Roskam, E. E., and Ellis, J. 1992. Commentary on Guttman: The irrelevance
of factor analysis for the study of group differences. Multivariate Behavioral
Research 27:205-218.
Ross, C., Danziger, S., and Smolensky, E. 1987. The level and trend of poverty
in the United States, 1939-1979. Demography 24:587-600.
Ross-Reynolds, I., and Reschly, D. J. 1983. An investigation of item bias on
the WISC-R with four sociocultural groups. 1. of Consulting and Clinical
Psych. 51:144-146.
Rossi, P. 1987. The iron law of evaluation and other metallic rules. In Research
in Social Probkms and Public Policy, vol. 4. 1. Miller and M. Lewis (eds.).
Greenwich, Conn.: JAI Press, pp. 3-20.
Rothenberg, S., and Licht, E. 1982. Ethnic Voters and National Issues. Wash-
ington, D.C.: Free Congress Research and Education Foundation.
Rounds, J., and Andersen, D. 1985. Assessment for entrance to community col-
lege: Research studies of three major standardized tests. J. of Research and
Development in Education 1854-58.
Rowe, D. C., and Plomin, R. 1981. The importance of nonshared (E,) envi-
ronmental influences on behavioral development. Developmental Psych.
17:517-531.
Rowe, D. C., and Rodgers, J. L. 1992. A social contagion model of adolescent
sexual behavior. Tucson: University of Arizona. Photocopy.
820
Bibliography
Bibliography
82 1
Rowe, D. C., Rodgers, J. L., and Meseck-Bushey, S. 1988. An "epidemic" model
of sexual intercourse re valences for black and white adolescents. Social Bi-
ology 36:127-145.
Roy, A. D. 195 1. Some thoughts on the distribution of earnings. Oxford Econ.
Papers 3:135-146.
Rudner, L. M. 1988. Teacher testing-an
update. Educational Measurement: Is-
sues and Practice 7:16-19.
Rushron, J. P. 1985. Differential K theory: The sociobiology of individual and
group differences. Personality and Individual Differences 644 1-452.
Rushton, J. P. 1988. Race differences in behaviour: A review and evolutionary
analysis. Personality and Indiclidual Differences 9: 1009-1024.
Rushton, J. P. 1990a. Race and crime: A reply to Roberts and Gahor. Canadian
J . of Criminology 32:3 15-334.
Rushton, J. P. 1990h. Race differences and r/K theory: A reply to Silverman.
Ethnology and Sociobiolo~y 1 1: 13 1-140.
Rushton, J.
1990c. Race, hrain size and intelligence: A rejoinder to Cain and
Vanderwolf. Personality and Individual Differences 1 1 :785-794.
Rushton, J. P. 1990d. Race, brain size and intelligence: A rejoinder to Cain and
Vanderwolf. Personality and Individual Differences 1 1 :785-794.
Rushton, J. P. 1991a. Do r-K strategies underlie human race differences? A re-
ply to Weitzman et al. Canadian Psych. 32:2942.
Rushton, J.
1991b. Mongoloid-Caucasoid differences in hrain size from mil-
itary samples. Intelligence 15:35 1-359.
Rushton, J. P. In press. Cranial capacity related to sex, rank, and race in a strat-
ified random sample of 6325 U.S. military personnel. Intelligence
Rushton, J. P., and Bogaert, A. E 1987. Race differences in sexual hehav-
ior: Testing an evolutionary hypothesis. J. of Research in Personalirv,
2 1 :529-55 1.
Rushton, J. P., and Bogaert, A. E 1988. Race versus social class differences in
sexual behavior: A follow-up test of the r/K dimension. I.
Res. Per.
22:259-272.
Rutter, M. 1985. Family and school influences on comitive development.], of
Child Psych., and Psychiarry and Allied Disciplines 26:683-704.
Ryan, W.
1971. Blaming the Victim. 1976 ed. New York: Vintage.
Saigal, S., Szatmari, P., Rosenbaum, P., Camphell, D., and King, S. 1991. Cog-
nitive abilities and school performance of extremely low birth weight chil-
dren and matched term control children at age 8 years: A regional study.].
of Pediatrics 1 18:75 1-760.
Sandoval, J., et al. 1983. Cultural differences on WISC-R verhal items. ]. of
School Psych. 21:49-55.
Sarich, V. 1990. The institutionalization of racism at the University of Cali-
fornia at Berkeley. Academic Questions 4:72-81.
Sattler, J. 1988. Assessment of Children's Intelligence and Other Special Abilities.
2d ed. Boston: Allyn and Bacon.
Sattler, J. M and Gwynne, J. 1982. White examiners generally do not impede
the intelligence test performance of black children: To debunk a myth.]our-
nal of Consulting and Clinical Psych. 50: 196200.
Scarr, S., and Weinberg, R. A. 1976. IQ test performance of black children
adopted by white families. Am. Psychologist 31:726-739.
Scam, S., and Weinberg, R. A. 1978. The influence of "family background" on
intellectual attainment. Am, Sociological Rev. 43:674-692.
Scarr, S., and Weinberg, R. A. 1983. The Minnesota adoptionstudies: Genetic
differences and malleability. Child Development 54:260-267.
Scam, S., Pakstis, A., Katz, S. H., and Barker, W. 1977. The absence of a rela-
tionship between degree of white ancestry and intellectual skills within the
black population. Human Genetics 39:69-86.
Scheuneman, J. D. 1987. An experimental, exploratory study of causes of bias
in test items. J. of Educational Measurement 24:97-118.
Schiff, M., Duyme, M., Dumaret, A., and Tomkiewicz, S. 1982. How much
could we boost scholastic achievement and IQ scores? A direct answer from
a French adoption study. Cognition 12: 165-196.
Schiff, M., and Lewontin, R. 1986. Education and Class: The Iwekvance of IQ
Genetic Studies. Oxford: Clarendon.
Schmidt, E L. 1988. The problem of group differences in ability test scores in
employment selection. 1, of Vocational Behavior 33:272-292.
Schmidt, E L., and Hunter, J. E. 1981. Employment testing: Old theories and
new research findings. Am. Psychologist 36:1128-1137.
Schmidt, E L., and Hunter, J. E. 1983. Individual differences in productivity:
An empirical test of estimates derived from studies of selection procedure
utilities. J, of Applied Psych. 68:407-414.
Schmidt, F. L., and Hunter, J. E. 1991. C a d Modeling of Processes Detennin-
inglob Performance. Iowa City: University of Iowa. Photocopy.
Schmidt, F. L., Hunter, J. E., McKenzie, R. C., and Muldrow, T. W. 1979. The
impact of a valid selection procedure on work-force productivity. J. of A p
plied Psych. 64:609-626.
Schmidt, F. L., Hunter,]. E., Outerbridge, A. C., and Goff, S. 1988. Joint rela-
tion of experience and ability with job performance: A test of three hy-
potheses. J. of Applied Psych. 734657.
Schmidt, F. L., Mack, M. J., and Hunter,]. E. 1984. Selection utility in the oc-
cupation of U.S. ark ranger for three modes of test use. J. of Applied Psych.
69:490-497.
Schmidt, F. L., and Ones, D. S. 1992. Personnel selection. Annual Rev. of Psych.
43:627-670.
Schoen, R., and Kleugel, 1. R. 1988. The widening gap in black and white mar-
Academic Bibliography on Intelligence
- The text consists of a dense bibliographic list of academic sources focusing on intelligence, race, and socio-economic factors.
- Several entries by J. P. Rushton explore controversial evolutionary hypotheses regarding cranial capacity and sexual behavior across different races.
- Studies by Scarr and Weinberg examine the impact of adoption and family background on the IQ scores of black children in white households.
- Research by Schmidt and Hunter investigates the relationship between cognitive ability, employment testing, and workforce productivity.
- The citations include diverse perspectives, ranging from 'Blaming the Victim' to technical assessments of the WISC-R verbal items and cultural bias.
- The collection reflects a late 20th-century academic focus on the intersection of genetics, environment, and standardized testing.
White examiners generally do not impede the intelligence test performance of black children: To debunk a myth.
820
Bibliography
Bibliography
82 1
Rowe, D. C., Rodgers, J. L., and Meseck-Bushey, S. 1988. An "epidemic" model
of sexual intercourse re valences for black and white adolescents. Social Bi-
ology 36:127-145.
Roy, A. D. 195 1. Some thoughts on the distribution of earnings. Oxford Econ.
Papers 3:135-146.
Rudner, L. M. 1988. Teacher testing-an
update. Educational Measurement: Is-
sues and Practice 7:16-19.
Rushron, J. P. 1985. Differential K theory: The sociobiology of individual and
group differences. Personality and Individual Differences 644 1-452.
Rushton, J. P. 1988. Race differences in behaviour: A review and evolutionary
analysis. Personality and Indiclidual Differences 9: 1009-1024.
Rushton, J. P. 1990a. Race and crime: A reply to Roberts and Gahor. Canadian
J . of Criminology 32:3 15-334.
Rushton, J. P. 1990h. Race differences and r/K theory: A reply to Silverman.
Ethnology and Sociobiolo~y 1 1: 13 1-140.
Rushton, J.
1990c. Race, hrain size and intelligence: A rejoinder to Cain and
Vanderwolf. Personality and Individual Differences 1 1 :785-794.
Rushton, J. P. 1990d. Race, brain size and intelligence: A rejoinder to Cain and
Vanderwolf. Personality and Individual Differences 1 1 :785-794.
Rushton, J. P. 1991a. Do r-K strategies underlie human race differences? A re-
ply to Weitzman et al. Canadian Psych. 32:2942.
Rushton, J.
1991b. Mongoloid-Caucasoid differences in hrain size from mil-
itary samples. Intelligence 15:35 1-359.
Rushton, J. P. In press. Cranial capacity related to sex, rank, and race in a strat-
ified random sample of 6325 U.S. military personnel. Intelligence
Rushton, J. P., and Bogaert, A. E 1987. Race differences in sexual hehav-
ior: Testing an evolutionary hypothesis. J. of Research in Personalirv,
2 1 :529-55 1.
Rushton, J. P., and Bogaert, A. E 1988. Race versus social class differences in
sexual behavior: A follow-up test of the r/K dimension. I.
Res. Per.
22:259-272.
Rutter, M. 1985. Family and school influences on comitive development.], of
Child Psych., and Psychiarry and Allied Disciplines 26:683-704.
Ryan, W.
1971. Blaming the Victim. 1976 ed. New York: Vintage.
Saigal, S., Szatmari, P., Rosenbaum, P., Camphell, D., and King, S. 1991. Cog-
nitive abilities and school performance of extremely low birth weight chil-
dren and matched term control children at age 8 years: A regional study.].
of Pediatrics 1 18:75 1-760.
Sandoval, J., et al. 1983. Cultural differences on WISC-R verhal items. ]. of
School Psych. 21:49-55.
Sarich, V. 1990. The institutionalization of racism at the University of Cali-
fornia at Berkeley. Academic Questions 4:72-81.
Sattler, J. 1988. Assessment of Children's Intelligence and Other Special Abilities.
2d ed. Boston: Allyn and Bacon.
Sattler, J. M and Gwynne, J. 1982. White examiners generally do not impede
the intelligence test performance of black children: To debunk a myth.]our-
nal of Consulting and Clinical Psych. 50: 196200.
Scarr, S., and Weinberg, R. A. 1976. IQ test performance of black children
adopted by white families. Am. Psychologist 31:726-739.
Scam, S., and Weinberg, R. A. 1978. The influence of "family background" on
intellectual attainment. Am, Sociological Rev. 43:674-692.
Scarr, S., and Weinberg, R. A. 1983. The Minnesota adoptionstudies: Genetic
differences and malleability. Child Development 54:260-267.
Scam, S., Pakstis, A., Katz, S. H., and Barker, W. 1977. The absence of a rela-
tionship between degree of white ancestry and intellectual skills within the
black population. Human Genetics 39:69-86.
Scheuneman, J. D. 1987. An experimental, exploratory study of causes of bias
in test items. J. of Educational Measurement 24:97-118.
Schiff, M., Duyme, M., Dumaret, A., and Tomkiewicz, S. 1982. How much
could we boost scholastic achievement and IQ scores? A direct answer from
a French adoption study. Cognition 12: 165-196.
Schiff, M., and Lewontin, R. 1986. Education and Class: The Iwekvance of IQ
Genetic Studies. Oxford: Clarendon.
Schmidt, E L. 1988. The problem of group differences in ability test scores in
employment selection. 1, of Vocational Behavior 33:272-292.
Schmidt, E L., and Hunter, J. E. 1981. Employment testing: Old theories and
new research findings. Am. Psychologist 36:1128-1137.
Schmidt, E L., and Hunter, J. E. 1983. Individual differences in productivity:
An empirical test of estimates derived from studies of selection procedure
utilities. J, of Applied Psych. 68:407-414.
Schmidt, F. L., and Hunter, J. E. 1991. C a d Modeling of Processes Detennin-
inglob Performance. Iowa City: University of Iowa. Photocopy.
Schmidt, F. L., Hunter, J. E., McKenzie, R. C., and Muldrow, T. W. 1979. The
impact of a valid selection procedure on work-force productivity. J. of A p
plied Psych. 64:609-626.
Schmidt, F. L., Hunter,]. E., Outerbridge, A. C., and Goff, S. 1988. Joint rela-
tion of experience and ability with job performance: A test of three hy-
potheses. J. of Applied Psych. 734657.
Schmidt, F. L., Mack, M. J., and Hunter,]. E. 1984. Selection utility in the oc-
cupation of U.S. ark ranger for three modes of test use. J. of Applied Psych.
69:490-497.
Schmidt, F. L., and Ones, D. S. 1992. Personnel selection. Annual Rev. of Psych.
43:627-670.
Schoen, R., and Kleugel, 1. R. 1988. The widening gap in black and white mar-
Academic Bibliography on Intelligence
- The text consists of a bibliographic reference list focusing on sociological and psychological research from the mid-20th century.
- Key themes include the relationship between nutrition, specifically vitamin and mineral supplementation, and cognitive performance.
- Several citations address racial and socioeconomic disparities in infant mortality, medical school entry, and standardized testing outcomes.
- The list includes foundational works on behavioral science, such as B.F. Skinner's 'The Behavior of Organisms'.
- Economic and political perspectives are represented through studies on immigration, labor market participation, and voter behavior.
The impact of a low full additive and sucrose diet on academic performance in 803 New York City public schools.
822
Bibliography
Bibliography
823
riage rates: The impact of population composition and differential marriage
propensities. Am. Sociological Rev. 53:895-907.
Schoendorf, K. C., Hogue, C. J. R., Kleinman, J. C., and Rowley, D. 1992. Mor-
tality among infants of black as compared with white college-educated par-
ents. New England J. of Medicine 326:1522-1526.
Schoenthaler, S. J. 1991. Abstracts of early papers on the effects of vitamin and
mineral supplementation on 1Q and behaviour. Personality and Individual
Differences 12:335-341.
Schoenthaler, S. J., Amos, S. P., Eysenck, H. J., Peritz, E., and Yudkin, J. 1991.
Controlled trial of vitamin-mineral supplementation: Effects on intelli-
gence and performance. Personality and Individual Differences 1 2:3 5 1-362.
Schoenthaler, S. J., Doraz, W. E., and Wakefield, J. A., Jr. 1986. The impact of
a low full additive and sucrose diet on academic performance in 803 New
York City public schools. International J. of Biosocial Research 8: 185-195.
Schonemann, P. H. 1985. On artificial intelligence. Behavioral and Brain Sci-
ences 8:241-242.
Schwarz, P. A., and Kmg, R. E. 1972. Ability Testing in Developing Counties: A
Handbook of Principles and Techniques. New York: Praeger.
Schweinhart, L. J., and Weikart, D. P. 1991. Response to "Beyond IQ in
preschool programs!" Intelligence 15:3 13-3 15.
Scottish Council for Research in Education. 1949. The Trend of Scottish lntelli-
gence. London: University of London Press.
Sechrest, D. K., and Bums, P. 1992. Police corruption: The Miami case. Crim-
inal justice Behavior 19:294-3 13.
Seibel, D. W. 1962. Follow-Up Study ofa National Sample of High School Seniors.
SR-62-56. Princeton, N.J.: Educational Testing Serv~ce.
Seligman, D. 1992. A Question of Intelligence: The IQ Debate in America. New
York: Birch Lane Press.
Sewell, W. H., and Hauser, R. M. 1975. Education, Occupation, and Earnings:
Achievement in the Early Career. New York: Academic Press.
Seymour, R. T. 1988. Why plaintiffs' counsel challenge tests, and how they can
successfully challenge the theory of "validity generalization." J. of Vocational
Behavior 33:33 1-364.
Shea, S., and Fullilove, M. T. 1985. Entry of black and other minority students
into U.S. medical schools. New England J. of Me&ine 313:933-939.
Shockley, W. 1987. Jensen's data on Spearman's hypothesis: No artifact. Be-
havioral and Brain Sciences 10:5 12.
Shortridge, R. M. 1981. Estimating voter participation. In Analydng Elec-
toral History: A Guide to the Study of American Voter Behavior. J. M. Cluhb,
W. H. Flanigan, and N. H. Zingale (eds.). Beverly Hills, Cal.: Sage, pp.
137-152.
Shuey, A. M. 1966. The Testing of Negro Intelligence. 2d ed. New York: Social
Science Press.
Silberberg, E. 1985. Race, recent entry, and labor market participation. Am.
Econ. Rev. 751 168-77.
Silberman, C. 1970. Crisis in the Classroom. New York: Random House.
Silverman, 1. 1990. The r/K theory of human individual differences: Scientific
and social issues. Ethnology and Sociobiology 11 : 1-9.
Simon, J. L. 1989. The Economic Consequences of Immigration. Oxford: Basil
Blackwell.
Simon, J. L., Borjas, G. J., Wattenberg, B. J., Stein, D., Bartley, R. L., and
Brimelow, P. 1993. An immigration debate: M h y control the borders? Na-
tional Rev., February 1, pp. 27-34.
Simon, R. J., and Danner, M. J. E. 1990. Gender, race, and the predictive value
of the LSAT. 1. of Legal Education 40525-529.
Simons, R. L., Beaman, J., Conger, R. D., and Chao, W. 1993. Stress, support,
and antisocial behavior trait as determinants of emotional well-being and
parenting practices among single mothers. J. of Mawiage and the Family
55:385-398.
Singal, D. J. 1991. The other crisis in American education. Atlantic Monthly
(Nov.): 59ff.
Sjaastad, L. A. 1962. The costs and returns of human migration.]. of Political
Econ. 70:80-93.
Skinner, B. F. 1938. The Behavior of Organisms: A n Experimental Analysis. New
York: Appleton-Century-Crofts.
Skinner, B. E 1953. Science and Human Behavior. New York: Macmillan.
Skinner, B. E 197 1. Beyond Freedom and Dignity. New York: Alfred A. Knopf.
Slack, W. V., and Porter, D. 1980. The Scholastic Aptitude Test: A critical ap-
praisal. Harvard Educational Rev. 50: 1 54-1 75.
Smith, D. A., and Davidson, L. A. 1986. Interfacing indicators and constructs
in criminological research: A note on the comparability of self-report vio-
lence data for race and sex groups. Criminology 24:473-487.
Smith, D. I., and Kirkham, R. W. 1982. Relationship between intelligence and
driving record. Accident Analysis and Prevention 14:439-442.
Smith,]. P. 1984. Race and human capital. Am. Econ. Rev. 74:685-698.
Smith, 1. P. 1989. Children among the poor. Demography 26:235-248.
Smith, 1. P., and Welch, F. 1987. Race and poverty: A forty-year record. AEA
Papers and Proceedings 7 7 : 1 5 2- 1 58.
Smith, J. P., and Welch, E R. 1989. Black economic progress after Myrdal. J.
of Econ. Literature 275 19-564.
Smith, S. M. 1975. The Battered Child Syndrome. London: Butteworth.
Smith, S. M., and Hanson, R. 1975. Interpersonal relationships and child-
Multidisciplinary Bibliography on Human Behavior
- The bibliography lists foundational psychological works by B.F. Skinner regarding behavioral science and the societal concepts of freedom and dignity.
- A significant portion of the citations focuses on the intersection of race, poverty, and economic progress, particularly in the post-Myrdal era.
- The text includes extensive references to the study of intelligence, including its measurement, attempts to raise it through intervention, and its historical role in public policy.
- Sociological research on family dynamics is well-represented, covering topics such as child abuse, divorce rates, and racial differences in marriage markets.
- The list features technical reports on vocational and military aptitude testing, such as the Armed Services Vocational Aptitude Battery (ASVAB).
- Historical perspectives on eugenics, birth control, and the Immigration Act of 1924 are included to provide context for the IQ controversy.
Snyderman, M., and Rothman, S. 1988. The IQ Controversy: The Media and Public Policy.
822
Bibliography
Bibliography
823
riage rates: The impact of population composition and differential marriage
propensities. Am. Sociological Rev. 53:895-907.
Schoendorf, K. C., Hogue, C. J. R., Kleinman, J. C., and Rowley, D. 1992. Mor-
tality among infants of black as compared with white college-educated par-
ents. New England J. of Medicine 326:1522-1526.
Schoenthaler, S. J. 1991. Abstracts of early papers on the effects of vitamin and
mineral supplementation on 1Q and behaviour. Personality and Individual
Differences 12:335-341.
Schoenthaler, S. J., Amos, S. P., Eysenck, H. J., Peritz, E., and Yudkin, J. 1991.
Controlled trial of vitamin-mineral supplementation: Effects on intelli-
gence and performance. Personality and Individual Differences 1 2:3 5 1-362.
Schoenthaler, S. J., Doraz, W. E., and Wakefield, J. A., Jr. 1986. The impact of
a low full additive and sucrose diet on academic performance in 803 New
York City public schools. International J. of Biosocial Research 8: 185-195.
Schonemann, P. H. 1985. On artificial intelligence. Behavioral and Brain Sci-
ences 8:241-242.
Schwarz, P. A., and Kmg, R. E. 1972. Ability Testing in Developing Counties: A
Handbook of Principles and Techniques. New York: Praeger.
Schweinhart, L. J., and Weikart, D. P. 1991. Response to "Beyond IQ in
preschool programs!" Intelligence 15:3 13-3 15.
Scottish Council for Research in Education. 1949. The Trend of Scottish lntelli-
gence. London: University of London Press.
Sechrest, D. K., and Bums, P. 1992. Police corruption: The Miami case. Crim-
inal justice Behavior 19:294-3 13.
Seibel, D. W. 1962. Follow-Up Study ofa National Sample of High School Seniors.
SR-62-56. Princeton, N.J.: Educational Testing Serv~ce.
Seligman, D. 1992. A Question of Intelligence: The IQ Debate in America. New
York: Birch Lane Press.
Sewell, W. H., and Hauser, R. M. 1975. Education, Occupation, and Earnings:
Achievement in the Early Career. New York: Academic Press.
Seymour, R. T. 1988. Why plaintiffs' counsel challenge tests, and how they can
successfully challenge the theory of "validity generalization." J. of Vocational
Behavior 33:33 1-364.
Shea, S., and Fullilove, M. T. 1985. Entry of black and other minority students
into U.S. medical schools. New England J. of Me&ine 313:933-939.
Shockley, W. 1987. Jensen's data on Spearman's hypothesis: No artifact. Be-
havioral and Brain Sciences 10:5 12.
Shortridge, R. M. 1981. Estimating voter participation. In Analydng Elec-
toral History: A Guide to the Study of American Voter Behavior. J. M. Cluhb,
W. H. Flanigan, and N. H. Zingale (eds.). Beverly Hills, Cal.: Sage, pp.
137-152.
Shuey, A. M. 1966. The Testing of Negro Intelligence. 2d ed. New York: Social
Science Press.
Silberberg, E. 1985. Race, recent entry, and labor market participation. Am.
Econ. Rev. 751 168-77.
Silberman, C. 1970. Crisis in the Classroom. New York: Random House.
Silverman, 1. 1990. The r/K theory of human individual differences: Scientific
and social issues. Ethnology and Sociobiology 11 : 1-9.
Simon, J. L. 1989. The Economic Consequences of Immigration. Oxford: Basil
Blackwell.
Simon, J. L., Borjas, G. J., Wattenberg, B. J., Stein, D., Bartley, R. L., and
Brimelow, P. 1993. An immigration debate: M h y control the borders? Na-
tional Rev., February 1, pp. 27-34.
Simon, R. J., and Danner, M. J. E. 1990. Gender, race, and the predictive value
of the LSAT. 1. of Legal Education 40525-529.
Simons, R. L., Beaman, J., Conger, R. D., and Chao, W. 1993. Stress, support,
and antisocial behavior trait as determinants of emotional well-being and
parenting practices among single mothers. J. of Mawiage and the Family
55:385-398.
Singal, D. J. 1991. The other crisis in American education. Atlantic Monthly
(Nov.): 59ff.
Sjaastad, L. A. 1962. The costs and returns of human migration.]. of Political
Econ. 70:80-93.
Skinner, B. F. 1938. The Behavior of Organisms: A n Experimental Analysis. New
York: Appleton-Century-Crofts.
Skinner, B. E 1953. Science and Human Behavior. New York: Macmillan.
Skinner, B. E 197 1. Beyond Freedom and Dignity. New York: Alfred A. Knopf.
Slack, W. V., and Porter, D. 1980. The Scholastic Aptitude Test: A critical ap-
praisal. Harvard Educational Rev. 50: 1 54-1 75.
Smith, D. A., and Davidson, L. A. 1986. Interfacing indicators and constructs
in criminological research: A note on the comparability of self-report vio-
lence data for race and sex groups. Criminology 24:473-487.
Smith, D. I., and Kirkham, R. W. 1982. Relationship between intelligence and
driving record. Accident Analysis and Prevention 14:439-442.
Smith,]. P. 1984. Race and human capital. Am. Econ. Rev. 74:685-698.
Smith, 1. P. 1989. Children among the poor. Demography 26:235-248.
Smith, 1. P., and Welch, F. 1987. Race and poverty: A forty-year record. AEA
Papers and Proceedings 7 7 : 1 5 2- 1 58.
Smith, J. P., and Welch, E R. 1989. Black economic progress after Myrdal. J.
of Econ. Literature 275 19-564.
Smith, S. M. 1975. The Battered Child Syndrome. London: Butteworth.
Smith, S. M., and Hanson, R. 1975. Interpersonal relationships and child-
824
Bibliography
Bibliography
82 5
rearing practices in 214 parents of battered children. British 1. of l'sychiutry
125:513-525.
Smith, S. M., Hanson, R., and Noble, S. 1974. Social aspects of the battered
baby syndrome. British J. of Psychiatry 125:568-582.
Snow, R. E. 1982. The training of intellectual aptitude. In How und HOW Much
Can Intelligence Be Increased. D.
K. Detterman and R. J. Ster.nherg (eds.).
Norwood, N.J.: Ablex Publishing Corp., pp. 1-37.
Sn~derman, M., and Herrnstein, R. J. 1983. Intelligence tcsrs and the lmmi,
gration Act of 1924. Am. Psychologist 38:986-995.
Snyderman, M., and Rothman, S. 1988. The IQ Controversy: Th Mediu and
Public Policy. New Brunswick, N.J.: Transaction Books.
Solon, G. 1992. Inrergenerationtll income mobility in the United States. Ain.
Econ. Rew. 82:393-408.
Soloway, R. A. 1982. Birth Control aid th Populncion Question in England,
1877-1930. Chapel Hill, N.C.: University of North Carolina Press.
Sommer, R., and Sommer, B. A. 1983. Mystery in Milwaukec: Early interven-
tion, IQ, and psychology textbooks. Am. Psychok~gist 38:982-985.
South, S. 1. 1985. Econc>mic conditions and the divorce rate: A time-
series analysis of the postwar United States. I. of M~lnia~e
and the Familv
47:31-41.
South, S. J. 1993. Racial and ethnic differences in the desire to marry. J. of
Marriage and the Family 55: 357-370.
South, S.]., and Lloyd, K. M. 1992. Marriage markets and nunmnrit;~l fertility
in the United States. Demography 29247-264.
Sowcll, T. 1981. Ethnic America: A Histmy. New York: Hilsic Rooks.
Sowell, T. 1989. The new racism on campus. Fortune, February 13, pp. 1 15- 1 16.
Sowell, T. 1992. In~ide American Education: The Decline, the Deception, thc /log-
mas. New York: Free Press.
Spanier, G. R., and Glick, P. C. 1980. Mate selection difterentials I~ctwecn
whites and blacks in the United States. Social Forccs 58:707-725.
Spearman, C. S. 1904. "General intelligence," objectively determined and
measured. Am. I. of Psych. 15:201-209.
Spearman, C. 1927. The Abilities of Man. New York: M;lc~nillan.
Sperl, T. C., Ree, M. J., and Steuck, K.W. 1990. Air Force Officer Qualif?)ing Test
(AFOQT) and Armed Services Vocational Aptitude Battery (ASVAR): Andy-
sis of Common Measurement Atrributes. Brooks Air Force Base, Tex.: Ail.
Force Systems Command.
Spitz, H. H. 1986. The Raising of Intelligence: A Selected Hisctvry of Attcmpu:
to Raise Retarded Intelligence. Hillsdale, N.J.: Lawrence Erlbaum Associ-
ates.
Spitz, H. H. 1992. Does the Carolina Ahecedarian early intervention project
prevent sociocultur;ll mental retardation? Intelligence 16:225-2 37.
Spuhler, J. N. 1968. Assortiitive maring with respect to physical charncteris-
tics. Social Biology 15:128-140.
Stanley, I). T., Mann, D. E., and Doig, 1. W. 1967. Men Who Goveun: A Bio-
g~aj~hical
ProfiL of Federal Political Executizles. Washington, 11.C.: Brookings
Iristitution.
Stanley, J. C., Feng, C. D., and Zhu, X. 1989. Chinese youths who reason ex-
tremely \vcll rna[hematicillly: Threilt or bonanzii? In Network News and
Views, vol. 8. Washington, D.C.: Educational Excellence Network, pp.
33-39.
Staples, R. 1985. Changes in black fi,3mily structure: The conflict between fam-
ily ideology and structural conditions. j. of M~lm'ugc and the Family
47:1005-1013.
Steelc, R. 1987. Psychodynamic factors in child ahuse. In The Buttered Child.
4th ed. R. E. Hclfer ancl R. S. Kcmpe (eds.). C:l>ici~go: University ot(:hicagu
Press, pp. 81-1 14.
Steelc, S. 1991. The Content of Our Character. New York: Ui~sic Rooks.
Stein, Z., Snsser, M., Saengcr, C;.,
and Mi~soll;~,
E 1972. Nutrition and rnental
performance. Science 178:708-713.
Stephen, E. H., Kindfuss, R. R., and Bean, F. L). 1988. Racial cliffcrcnces in con-
tr;lceptive choice: Complexity and implications. L)cmvgclphy 25:53-70.
Sternberg, R. 1. 1985. General intellect~~al
ability. In Human Abilities: An ln-
fonnation~l'mccssing Apl,ro~ich. R. J. Sternhcrg (ed.). Ncw York: W.H. Free-
man and Company, pp. 5-30.
Stemberg, R. J. 1988. Thr Trinrchic Mind: A Nc.w Theory of Human Intelligence.
Ncw York: Penguin.
Stevenson, H. W., and Azuma, H. 1983. IQ in Japan and the United States:
Methodologic;tl problems in Lynn's rinalysis. Nature 306:291-292.
Stevenson, H., Lee, S.-Y., Chen, C., Lummis, M., Stigler, I., Fan, I,., ;lnd Gc,
F. 1990. Mathematics achievement of children in China ilnd the United
States. Child 1)evelopment 61:1053-1066.
Stcvcnson, H., Stigler, J. W., Lee, S., Lucker, ( 3 . W., Kitamura, S., and Hsu, C:.
1985. Cognitive performance ofJapanese, Chinese, i~ncl American cl~ildren.
Child Devehpment 56:718-734.
Stewart, N. 1947. A.G.C.T. scores of army personnel grouped hy occupation.
ilccupation 26:54 1.
Stigler, S. S. 1986. The History of Statistics: The Measurenrent of Uncertcu'nty be
fme 1900. Cambridge, Mass.: Harvard University Press.
Storfer, M. L). 1990. Intelligei~e and Giftedness: The (:ontributions of Heredit
and Early Environment. San Francisco: Jossey-Bass.
Straus, M. A., and (;elks, R. J. 1986. Societal change and change in family vi
olence from 1975 to 1985 as revealed in two national surveys.). of Marriag
a d the Family 48:465-479.
Scholarly Bibliography on Human Development
- The text provides a comprehensive list of academic citations focusing on the intersection of intelligence, race, and socioeconomic outcomes.
- Several entries examine the comparative cognitive and mathematical performance of children in Japan, China, and the United States.
- The bibliography includes significant sociological research on family structures, domestic violence, and the evolution of the American family.
- A portion of the references addresses the genetic and environmental factors influencing occupational status and educational attainment.
- The list highlights specific studies on Asian-American educational achievements and the controversies surrounding university admissions.
Chinese youths who reason extremely well mathematically: Threat or bonanza?
824
Bibliography
Bibliography
82 5
rearing practices in 214 parents of battered children. British 1. of l'sychiutry
125:513-525.
Smith, S. M., Hanson, R., and Noble, S. 1974. Social aspects of the battered
baby syndrome. British J. of Psychiatry 125:568-582.
Snow, R. E. 1982. The training of intellectual aptitude. In How und HOW Much
Can Intelligence Be Increased. D.
K. Detterman and R. J. Ster.nherg (eds.).
Norwood, N.J.: Ablex Publishing Corp., pp. 1-37.
Sn~derman, M., and Herrnstein, R. J. 1983. Intelligence tcsrs and the lmmi,
gration Act of 1924. Am. Psychologist 38:986-995.
Snyderman, M., and Rothman, S. 1988. The IQ Controversy: Th Mediu and
Public Policy. New Brunswick, N.J.: Transaction Books.
Solon, G. 1992. Inrergenerationtll income mobility in the United States. Ain.
Econ. Rew. 82:393-408.
Soloway, R. A. 1982. Birth Control aid th Populncion Question in England,
1877-1930. Chapel Hill, N.C.: University of North Carolina Press.
Sommer, R., and Sommer, B. A. 1983. Mystery in Milwaukec: Early interven-
tion, IQ, and psychology textbooks. Am. Psychok~gist 38:982-985.
South, S. 1. 1985. Econc>mic conditions and the divorce rate: A time-
series analysis of the postwar United States. I. of M~lnia~e
and the Familv
47:31-41.
South, S. J. 1993. Racial and ethnic differences in the desire to marry. J. of
Marriage and the Family 55: 357-370.
South, S.]., and Lloyd, K. M. 1992. Marriage markets and nunmnrit;~l fertility
in the United States. Demography 29247-264.
Sowcll, T. 1981. Ethnic America: A Histmy. New York: Hilsic Rooks.
Sowell, T. 1989. The new racism on campus. Fortune, February 13, pp. 1 15- 1 16.
Sowell, T. 1992. In~ide American Education: The Decline, the Deception, thc /log-
mas. New York: Free Press.
Spanier, G. R., and Glick, P. C. 1980. Mate selection difterentials I~ctwecn
whites and blacks in the United States. Social Forccs 58:707-725.
Spearman, C. S. 1904. "General intelligence," objectively determined and
measured. Am. I. of Psych. 15:201-209.
Spearman, C. 1927. The Abilities of Man. New York: M;lc~nillan.
Sperl, T. C., Ree, M. J., and Steuck, K.W. 1990. Air Force Officer Qualif?)ing Test
(AFOQT) and Armed Services Vocational Aptitude Battery (ASVAR): Andy-
sis of Common Measurement Atrributes. Brooks Air Force Base, Tex.: Ail.
Force Systems Command.
Spitz, H. H. 1986. The Raising of Intelligence: A Selected Hisctvry of Attcmpu:
to Raise Retarded Intelligence. Hillsdale, N.J.: Lawrence Erlbaum Associ-
ates.
Spitz, H. H. 1992. Does the Carolina Ahecedarian early intervention project
prevent sociocultur;ll mental retardation? Intelligence 16:225-2 37.
Spuhler, J. N. 1968. Assortiitive maring with respect to physical charncteris-
tics. Social Biology 15:128-140.
Stanley, I). T., Mann, D. E., and Doig, 1. W. 1967. Men Who Goveun: A Bio-
g~aj~hical
ProfiL of Federal Political Executizles. Washington, 11.C.: Brookings
Iristitution.
Stanley, J. C., Feng, C. D., and Zhu, X. 1989. Chinese youths who reason ex-
tremely \vcll rna[hematicillly: Threilt or bonanzii? In Network News and
Views, vol. 8. Washington, D.C.: Educational Excellence Network, pp.
33-39.
Staples, R. 1985. Changes in black fi,3mily structure: The conflict between fam-
ily ideology and structural conditions. j. of M~lm'ugc and the Family
47:1005-1013.
Steelc, R. 1987. Psychodynamic factors in child ahuse. In The Buttered Child.
4th ed. R. E. Hclfer ancl R. S. Kcmpe (eds.). C:l>ici~go: University ot(:hicagu
Press, pp. 81-1 14.
Steelc, S. 1991. The Content of Our Character. New York: Ui~sic Rooks.
Stein, Z., Snsser, M., Saengcr, C;.,
and Mi~soll;~,
E 1972. Nutrition and rnental
performance. Science 178:708-713.
Stephen, E. H., Kindfuss, R. R., and Bean, F. L). 1988. Racial cliffcrcnces in con-
tr;lceptive choice: Complexity and implications. L)cmvgclphy 25:53-70.
Sternberg, R. 1. 1985. General intellect~~al
ability. In Human Abilities: An ln-
fonnation~l'mccssing Apl,ro~ich. R. J. Sternhcrg (ed.). Ncw York: W.H. Free-
man and Company, pp. 5-30.
Stemberg, R. J. 1988. Thr Trinrchic Mind: A Nc.w Theory of Human Intelligence.
Ncw York: Penguin.
Stevenson, H. W., and Azuma, H. 1983. IQ in Japan and the United States:
Methodologic;tl problems in Lynn's rinalysis. Nature 306:291-292.
Stevenson, H., Lee, S.-Y., Chen, C., Lummis, M., Stigler, I., Fan, I,., ;lnd Gc,
F. 1990. Mathematics achievement of children in China ilnd the United
States. Child 1)evelopment 61:1053-1066.
Stcvcnson, H., Stigler, J. W., Lee, S., Lucker, ( 3 . W., Kitamura, S., and Hsu, C:.
1985. Cognitive performance ofJapanese, Chinese, i~ncl American cl~ildren.
Child Devehpment 56:718-734.
Stewart, N. 1947. A.G.C.T. scores of army personnel grouped hy occupation.
ilccupation 26:54 1.
Stigler, S. S. 1986. The History of Statistics: The Measurenrent of Uncertcu'nty be
fme 1900. Cambridge, Mass.: Harvard University Press.
Storfer, M. L). 1990. Intelligei~e and Giftedness: The (:ontributions of Heredit
and Early Environment. San Francisco: Jossey-Bass.
Straus, M. A., and (;elks, R. J. 1986. Societal change and change in family vi
olence from 1975 to 1985 as revealed in two national surveys.). of Marriag
a d the Family 48:465-479.
826
Bibliography
Bibliography
827
Straus, M. A., Gelles, R. J., and Steinmetz, S. K. 1980. Behind Closed Doors:
Violence in the American Family. New York: Anchor Books.
Straus, R. P., and Sawyer, E. A. 1986. Some new evidence on teacher and stu-
dent competencies. Economics of Education Rev. 5:4148.
Stromsdorfer, E. W. 1987. Economic evaluation of the Comprehensive Em-
ployment and Training Act. Evaluation Rev. 1 1:387-393.
Sturdivant, F. D., and Adler, R. D. 1976. Executive origins: Still a gray flannel
world? Harwrd Business Rev. 54: 125-132.
Sue, S., and Okazaki, S. 1990. Asian-American educational achievements: A
phenomenon in search of an explanation. Am. Psychologist 45:913-920.
Sussman, M. B., and Steinmetz, S. K. (eds.). 1987. Handbook of Martiage and
the Family. New York: Plenum Press.
Sutherland, E. H. 1931. Mental deficiency and crime. In Social Attitudes. K.
Young (ed.). New York: Holt, pp. 357-375.
Sweet, J. A., and Bumpass, L. L. 1987. American Families and Househokis. New
York: Russell Sage Foundation.
Sweet,]. A., and Rindfuss, R. R. 1983. Those ubiquitous fertility trends: United
States, 1945-1979. Social Biology 30: 127-139.
Takagi, D. Y. 1990. From discrimination to affirmative action: Facts in the
Asian American admissions controversy. Social Problems 37:578-592.
Takuma, T. 1966. On the early physical conditions influencing the develop-
ment of intelligence. Japanese ]. of Psych. 37:257-268.
Tambs, K., Sundet, J. M., Magnus, P., and Berg, K. 1989. Genetic and environ-
mental contributions to the covariance between occupational status, educa-
tional attainment, and IQ: A study of twins. Behavior Genetics 19:209-222.
Taubman, P., and Wales, T. 1972. Mental Ability and Higher Educational Attain-
ment in the 20th Century. New York: McGraw-Hill.
Taylor, J. 1992. Paved with Good Intentions: The Failure of Race Relations in Con-
temporary America. New York: Carroll & Graf.
Taylor, J. G., and Smith, P. C. 1956. An investigation of the shape of learning
curves for industrial motor tasks. I. of Applied Psych. 40: 142-149.
Taylor, L., and Skanes, G. 1977. A cross-cultural examination of some of
Jensen's hypotheses. Canadian J. of Behavioural Sciences 9:3 1 5-322.
Teachman, J. D. 1985. Historical and subgroup variations in the association
between marriage and first childbirth: A life-course perspective. J. of Fam-
ily Histwy 10:379-401.
Teachman, J. D., Polonko, K. A., and Scanzoni, J. 1987. Demography of the
family. In Handbook of Marriage and the Family. M. B. Sussman and S. K.
Steinmetz (eds.). New York: Plenum Press, pp. 3-36.
Teasdale, T. W., and Owen, D. R. 1989. Continuing secular increases in intel-
ligence and a stahle prevalence of high intelligence levels. lnteUigence
13:255-262.
Teasdale, T. W., S@renson, T. I. A,, and Owen, D. R. 1984. Social class in
adopted and nonadopted siblings. Behavior Genetics 14:587-593.
Terman, L. M. 1942. The vocational successes of intellectually gifted individ-
uals. Occupations 20:493-498.
Terman, L. M., and Oden, M. H. 1947. The Gifted Child Grows Up: Twenty-
Five Years' Follow-up of a Superior Group. Genetic Studies of Genius, vol. 4.
Stanford, Cal.: Stanford University Press.
Terrell, E, and Terrell, S. L. 1983. The relationship between race of examiner,
cultural mistrust, and the intelligence test performance of black children.
Psych. in the Schools 20:367-369.
Thornberry, T. P., Moore, M., and Christianson, R. L. 1985. The effect ofdrop-
ping out of high school on subsequent criminal behavior. Criminology
23:3-18.
Thorndike, R. L. 197 1. Concepts of culture fairness. J. of Educational Measure-
ment 8:63-70.
Thomdike, R. L. 1986. The role of general ability in prediction. J. ofvocational
Behavior 29:332-339.
Thurstone, L. L. 1938. Primay Mental Abilities. Psychometric Monographs 1.
Chicago: University of Chicago Press.
Xldsley,]. L. 1936. The Mounting Waste of the American Secondary School. Cam-
bridge, Mass.: Harvard University Press.
Tolson, T., and Wilson, M. 1990. The impact of two- and three-generational
black family structure on perceived family climate. Child Development
61:416428.
Topel, R. 1993. What have we learned from empirical studies of unemploy-
ment and turnover? Am. Econ. Rev. 83:llO-115.
Tribe, L. H. 1988. American Comtitutional Law. New York: Foundation Press.
Trickett, P. K., Aber, J. L., Carlson, V., and Cicchetti, D. 1991. Relationship of
socioeconomic status to the etiology and developmental sequelae of physi-
cal child abuse. Develomental Psych. 27: 148-1 58.
Tucker, M. B., and Taylor, R. J. 1989. Demographic correlates of relationship
status among black Americans. J. of Maniage and the Family 51:655-665.
Tuddenham, R. D. 1948. Soldier intelligence in World Wars I and 11. Am. Ps.
chologist 334-56.
Turkheimer, E. 1991. Individual and group differences in adoption studier
IQ. Psychological Bull. 1 10:392-405.
Turner, R., Hall, V., and Grimmett, S. 1973. Effects of familiarization 1
back on the performance of lower-class and middle-class kindergart'
on the Raven Colored Progressive Matrices. J. of Educational I
65:356-363.
U.S. Bureau of the Census. 1975. Historical Statistics of the United State:
nial Times to 1970, vol. 1. Washington, D.C.: Government Printing
Academic Bibliography of Social Sciences
- The text consists of a dense bibliographic list of academic sources focusing on intelligence, education, and socioeconomic factors.
- Several entries examine the relationship between IQ, genetics, and educational attainment through twin and adoption studies.
- The references include significant research on racial dynamics, cultural mistrust, and their impact on standardized test performance.
- A portion of the citations addresses family structures, marriage patterns, and their demographic correlates in American society.
- The list highlights longitudinal studies on gifted individuals and the societal consequences of high school dropout rates.
- Sources also cover historical shifts in intelligence levels and the economic implications of unemployment and turnover.
Terman, L. M., and Oden, M. H. 1947. The Gifted Child Grows Up: Twenty-Five Years' Follow-up of a Superior Group.
826
Bibliography
Bibliography
827
Straus, M. A., Gelles, R. J., and Steinmetz, S. K. 1980. Behind Closed Doors:
Violence in the American Family. New York: Anchor Books.
Straus, R. P., and Sawyer, E. A. 1986. Some new evidence on teacher and stu-
dent competencies. Economics of Education Rev. 5:4148.
Stromsdorfer, E. W. 1987. Economic evaluation of the Comprehensive Em-
ployment and Training Act. Evaluation Rev. 1 1:387-393.
Sturdivant, F. D., and Adler, R. D. 1976. Executive origins: Still a gray flannel
world? Harwrd Business Rev. 54: 125-132.
Sue, S., and Okazaki, S. 1990. Asian-American educational achievements: A
phenomenon in search of an explanation. Am. Psychologist 45:913-920.
Sussman, M. B., and Steinmetz, S. K. (eds.). 1987. Handbook of Martiage and
the Family. New York: Plenum Press.
Sutherland, E. H. 1931. Mental deficiency and crime. In Social Attitudes. K.
Young (ed.). New York: Holt, pp. 357-375.
Sweet, J. A., and Bumpass, L. L. 1987. American Families and Househokis. New
York: Russell Sage Foundation.
Sweet,]. A., and Rindfuss, R. R. 1983. Those ubiquitous fertility trends: United
States, 1945-1979. Social Biology 30: 127-139.
Takagi, D. Y. 1990. From discrimination to affirmative action: Facts in the
Asian American admissions controversy. Social Problems 37:578-592.
Takuma, T. 1966. On the early physical conditions influencing the develop-
ment of intelligence. Japanese ]. of Psych. 37:257-268.
Tambs, K., Sundet, J. M., Magnus, P., and Berg, K. 1989. Genetic and environ-
mental contributions to the covariance between occupational status, educa-
tional attainment, and IQ: A study of twins. Behavior Genetics 19:209-222.
Taubman, P., and Wales, T. 1972. Mental Ability and Higher Educational Attain-
ment in the 20th Century. New York: McGraw-Hill.
Taylor, J. 1992. Paved with Good Intentions: The Failure of Race Relations in Con-
temporary America. New York: Carroll & Graf.
Taylor, J. G., and Smith, P. C. 1956. An investigation of the shape of learning
curves for industrial motor tasks. I. of Applied Psych. 40: 142-149.
Taylor, L., and Skanes, G. 1977. A cross-cultural examination of some of
Jensen's hypotheses. Canadian J. of Behavioural Sciences 9:3 1 5-322.
Teachman, J. D. 1985. Historical and subgroup variations in the association
between marriage and first childbirth: A life-course perspective. J. of Fam-
ily Histwy 10:379-401.
Teachman, J. D., Polonko, K. A., and Scanzoni, J. 1987. Demography of the
family. In Handbook of Marriage and the Family. M. B. Sussman and S. K.
Steinmetz (eds.). New York: Plenum Press, pp. 3-36.
Teasdale, T. W., and Owen, D. R. 1989. Continuing secular increases in intel-
ligence and a stahle prevalence of high intelligence levels. lnteUigence
13:255-262.
Teasdale, T. W., S@renson, T. I. A,, and Owen, D. R. 1984. Social class in
adopted and nonadopted siblings. Behavior Genetics 14:587-593.
Terman, L. M. 1942. The vocational successes of intellectually gifted individ-
uals. Occupations 20:493-498.
Terman, L. M., and Oden, M. H. 1947. The Gifted Child Grows Up: Twenty-
Five Years' Follow-up of a Superior Group. Genetic Studies of Genius, vol. 4.
Stanford, Cal.: Stanford University Press.
Terrell, E, and Terrell, S. L. 1983. The relationship between race of examiner,
cultural mistrust, and the intelligence test performance of black children.
Psych. in the Schools 20:367-369.
Thornberry, T. P., Moore, M., and Christianson, R. L. 1985. The effect ofdrop-
ping out of high school on subsequent criminal behavior. Criminology
23:3-18.
Thorndike, R. L. 197 1. Concepts of culture fairness. J. of Educational Measure-
ment 8:63-70.
Thomdike, R. L. 1986. The role of general ability in prediction. J. ofvocational
Behavior 29:332-339.
Thurstone, L. L. 1938. Primay Mental Abilities. Psychometric Monographs 1.
Chicago: University of Chicago Press.
Xldsley,]. L. 1936. The Mounting Waste of the American Secondary School. Cam-
bridge, Mass.: Harvard University Press.
Tolson, T., and Wilson, M. 1990. The impact of two- and three-generational
black family structure on perceived family climate. Child Development
61:416428.
Topel, R. 1993. What have we learned from empirical studies of unemploy-
ment and turnover? Am. Econ. Rev. 83:llO-115.
Tribe, L. H. 1988. American Comtitutional Law. New York: Foundation Press.
Trickett, P. K., Aber, J. L., Carlson, V., and Cicchetti, D. 1991. Relationship of
socioeconomic status to the etiology and developmental sequelae of physi-
cal child abuse. Develomental Psych. 27: 148-1 58.
Tucker, M. B., and Taylor, R. J. 1989. Demographic correlates of relationship
status among black Americans. J. of Maniage and the Family 51:655-665.
Tuddenham, R. D. 1948. Soldier intelligence in World Wars I and 11. Am. Ps.
chologist 334-56.
Turkheimer, E. 1991. Individual and group differences in adoption studier
IQ. Psychological Bull. 1 10:392-405.
Turner, R., Hall, V., and Grimmett, S. 1973. Effects of familiarization 1
back on the performance of lower-class and middle-class kindergart'
on the Raven Colored Progressive Matrices. J. of Educational I
65:356-363.
U.S. Bureau of the Census. 1975. Historical Statistics of the United State:
nial Times to 1970, vol. 1. Washington, D.C.: Government Printing
828
Bibliography
U.S. Bureau of the Census. Money Income of Households, Families, and Persons
in the United States. Series P-60. Annual. Washington, D.C.: Government
Printing mice.
U.S. Bureau of the Census. Poverty in the United States. Series P-60. Annual.
Washington, D.C.: Government Printing Office.
U.S. Bureau of the Census. Statistical Abstract of the United States, Annual.
Washington, D.C.: Government Printing Office.
U.S. Department of Health and Human Services. 1988. Study of National Inci-
dence and Prevalence of Child Abuse and Neglect. Washington, D.C.: Office
of Human Development Services.
U.S. Department of Labor. 1970. Manual for the USTES General Aptitude Test
Battery. 4th ed. Washington, D.C.: Government Printing Office.
U.S. Department of Labor. 1993. Employment and Earnings. 40: 1.
Valdez, R. S., and Valdez, C. 1983. Detecting predictive bias: The WlSC-R vs.
achievement scores of Mexican-American and non-minority students.
Learning Disability Quarterly 6:44W47.
Valen, L. V, 1974. Brain size and intelligence in man. Am. J. of Physical An-
thropology 40:4 17423.
Valencia, R. R., and Rankin, R. J. 1988. Evidence of bias in predictive valid-
ity on the Kaufman Assessment Battery for children in samples of Anglo
and Mexican American children. Psych. in the Schools 25:257-266.
Valencia, R. R., and Rankin, R. J. 1985. Evidence of context bias on the
McCarthy Scales with Mexican American children: Implications for
test translation and nonbiased assessment.
.of Educational Psych.
77:197-207.
Vance, S. C. 1966. Higher education for the executive elite. California Man-
agement Rev. 8:2 1-30.
Vancourt, M., and Bean, E D. 1985. Intelligence and fertility in the United
States: 191 2-1982. Intelligence 9:23-32.
Verba, S., and Nie, N. H. 1972. Participationin America: Political Demwacy and
Social Equality. Chicago: University of Chicago Press.
Vemon, P. A. 1982. The Abilities and Achievements of Onentafs in North Amer-
ica. New York: Academic Press.
Vernon, P. A. 1983. Speed of information processing and geneml intelligence.
Intelligence 753-70.
Vemon, P. A., et al. 1985. Reaction times and speed of processing: Their rela-
tionship to timed and untimed measures of intelligence. Intelligence 9:357.
Vernon, P. E. 1950. The Structure of Human Abilities. New York: Wiley.
Vincent, K. R. 199 1. Blacklwhite IQ differences: Does age make the difference!
I. of Clinical Psych. 47:266270.
Vining, D. R., Jr. 1982a. Fertility differentials and the status of nations: A spec-
ulative essay on Japan and the West. Mankind Quarterly 22:3 1 1-3 53.
Vining, D. R., Jr. 1982b. On the possibility of the reemergence of a dysgenic
trend with respect to intelligence in American fertility differentials. Intelli-
gence 6:241-264.
Vining, D. R., Jr. 1986. Social versus reproductive success: The central theo-
ret~cal problem of human sociobiology. Behavioral and Brain Sciences
9: 167-2 16.
Wah, D. M., and Robinson, D. S. 1990. Examinee and score trends for the CUE
gnmd test: 1977-78,198243,1986-87, and 1987-88. Princeton, N.J.: Ed-
ucational Testing Service.
Wainer, H. 1988. How accurately can we assess changes in minority perfor-
mance on the SAT? Am. Psychologist 43:774-778.
Waldman, 1. D., Weinberg, R. A,, and Scarr, S. In press. Racial group differ-
ences in IQ in the Minnesota transracial adoption study: A reply to Levin
and Lynn. Intelligence.
Walker, D. A. 1976. The IEA Six Subject Survey: An Empirical Study of Educa-
tion in Twenty-one Counnies. New York: Wiley.
Waller, J. H. 1971. Differential reproduction: Its relation to IQ test score, ed-
ucation, and occupation. Social Biology 18:122-136.
Walsh, 1. 1979. Does high school grade inflation mask a more alarming trend!
Science 203:982.
Warner, W. L., and Ahegglen, J. C. Big Business Leaders in America. New York:
Harper & Rros.
Wasserman, G., Rauh, V., Brunell~, S., Garcia-Castro, M., and Necos, B. 1990.
Psychosocial attributes and life experiences of disadvantaged minority
mothers: Age and ethnic variations. Child Development 61:566-580.
Watkins, M. P., and Meredith, W. 1981. Spouse similarity in newly-weds with
respect to specific cognitive abilities, wio-economic status and education.
Behavioral Genetics 11:l-11.
Wattenberg, B. J. 1987. The Birth Dearth. New York: Pharos Rooks.
Wattenberg, B. I., and Zinsmeister, K. 1990. The case for more immigration.
Commentary (April): 19-25.
Weekley, J. A., et al. 1985. A comparison of three methods of estimating the
standard deviation ofperformance indollars. J. of AppliedPsych. 70: 122-1 26.
Weikart, D. P., Epstein, A. S., Schweinhart, L., and Bond, 1. T. 1978. The
Ypsilanti Preschool Cuniculum Demonstration Project: Preschool Years and
Longitudinal Results. Ypsilanti, Mich.: HighIScope Educational Research
Foundation.
Weinberg, R. A., Scarr, S., and Waldman, I. D. 1992. The Minnesota transra-
cia\ adoption study: A follow-up of 1Q test performance at adolescence. In-
telligence 16:117-135.
Weiss, 1. G. 1987. It$ time to examine the examiners. Negro E d u c a t i d Rev.
38:107-124.
Scholarly References and Bibliography
- The text consists of a dense bibliographic list of academic sources focusing on intelligence, demographics, and social trends.
- Several entries examine the relationship between intelligence (IQ) and fertility rates across different decades and nations.
- A significant portion of the citations addresses racial and ethnic variations in standardized testing and predictive bias.
- The list includes government publications from the U.S. Census Bureau and Department of Labor regarding poverty and employment.
- Research on cognitive processing speed and brain size is cited as a physiological component of intelligence studies.
- The references highlight long-term trends in educational performance, including SAT scores and grade inflation.
Vining, D. R., Jr. 1986. Social versus reproductive success: The central theoretical problem of human sociobiology.
828
Bibliography
U.S. Bureau of the Census. Money Income of Households, Families, and Persons
in the United States. Series P-60. Annual. Washington, D.C.: Government
Printing mice.
U.S. Bureau of the Census. Poverty in the United States. Series P-60. Annual.
Washington, D.C.: Government Printing Office.
U.S. Bureau of the Census. Statistical Abstract of the United States, Annual.
Washington, D.C.: Government Printing Office.
U.S. Department of Health and Human Services. 1988. Study of National Inci-
dence and Prevalence of Child Abuse and Neglect. Washington, D.C.: Office
of Human Development Services.
U.S. Department of Labor. 1970. Manual for the USTES General Aptitude Test
Battery. 4th ed. Washington, D.C.: Government Printing Office.
U.S. Department of Labor. 1993. Employment and Earnings. 40: 1.
Valdez, R. S., and Valdez, C. 1983. Detecting predictive bias: The WlSC-R vs.
achievement scores of Mexican-American and non-minority students.
Learning Disability Quarterly 6:44W47.
Valen, L. V, 1974. Brain size and intelligence in man. Am. J. of Physical An-
thropology 40:4 17423.
Valencia, R. R., and Rankin, R. J. 1988. Evidence of bias in predictive valid-
ity on the Kaufman Assessment Battery for children in samples of Anglo
and Mexican American children. Psych. in the Schools 25:257-266.
Valencia, R. R., and Rankin, R. J. 1985. Evidence of context bias on the
McCarthy Scales with Mexican American children: Implications for
test translation and nonbiased assessment.
.of Educational Psych.
77:197-207.
Vance, S. C. 1966. Higher education for the executive elite. California Man-
agement Rev. 8:2 1-30.
Vancourt, M., and Bean, E D. 1985. Intelligence and fertility in the United
States: 191 2-1982. Intelligence 9:23-32.
Verba, S., and Nie, N. H. 1972. Participationin America: Political Demwacy and
Social Equality. Chicago: University of Chicago Press.
Vemon, P. A. 1982. The Abilities and Achievements of Onentafs in North Amer-
ica. New York: Academic Press.
Vernon, P. A. 1983. Speed of information processing and geneml intelligence.
Intelligence 753-70.
Vemon, P. A., et al. 1985. Reaction times and speed of processing: Their rela-
tionship to timed and untimed measures of intelligence. Intelligence 9:357.
Vernon, P. E. 1950. The Structure of Human Abilities. New York: Wiley.
Vincent, K. R. 199 1. Blacklwhite IQ differences: Does age make the difference!
I. of Clinical Psych. 47:266270.
Vining, D. R., Jr. 1982a. Fertility differentials and the status of nations: A spec-
ulative essay on Japan and the West. Mankind Quarterly 22:3 1 1-3 53.
Vining, D. R., Jr. 1982b. On the possibility of the reemergence of a dysgenic
trend with respect to intelligence in American fertility differentials. Intelli-
gence 6:241-264.
Vining, D. R., Jr. 1986. Social versus reproductive success: The central theo-
ret~cal problem of human sociobiology. Behavioral and Brain Sciences
9: 167-2 16.
Wah, D. M., and Robinson, D. S. 1990. Examinee and score trends for the CUE
gnmd test: 1977-78,198243,1986-87, and 1987-88. Princeton, N.J.: Ed-
ucational Testing Service.
Wainer, H. 1988. How accurately can we assess changes in minority perfor-
mance on the SAT? Am. Psychologist 43:774-778.
Waldman, 1. D., Weinberg, R. A,, and Scarr, S. In press. Racial group differ-
ences in IQ in the Minnesota transracial adoption study: A reply to Levin
and Lynn. Intelligence.
Walker, D. A. 1976. The IEA Six Subject Survey: An Empirical Study of Educa-
tion in Twenty-one Counnies. New York: Wiley.
Waller, J. H. 1971. Differential reproduction: Its relation to IQ test score, ed-
ucation, and occupation. Social Biology 18:122-136.
Walsh, 1. 1979. Does high school grade inflation mask a more alarming trend!
Science 203:982.
Warner, W. L., and Ahegglen, J. C. Big Business Leaders in America. New York:
Harper & Rros.
Wasserman, G., Rauh, V., Brunell~, S., Garcia-Castro, M., and Necos, B. 1990.
Psychosocial attributes and life experiences of disadvantaged minority
mothers: Age and ethnic variations. Child Development 61:566-580.
Watkins, M. P., and Meredith, W. 1981. Spouse similarity in newly-weds with
respect to specific cognitive abilities, wio-economic status and education.
Behavioral Genetics 11:l-11.
Wattenberg, B. J. 1987. The Birth Dearth. New York: Pharos Rooks.
Wattenberg, B. I., and Zinsmeister, K. 1990. The case for more immigration.
Commentary (April): 19-25.
Weekley, J. A., et al. 1985. A comparison of three methods of estimating the
standard deviation ofperformance indollars. J. of AppliedPsych. 70: 122-1 26.
Weikart, D. P., Epstein, A. S., Schweinhart, L., and Bond, 1. T. 1978. The
Ypsilanti Preschool Cuniculum Demonstration Project: Preschool Years and
Longitudinal Results. Ypsilanti, Mich.: HighIScope Educational Research
Foundation.
Weinberg, R. A., Scarr, S., and Waldman, I. D. 1992. The Minnesota transra-
cia\ adoption study: A follow-up of 1Q test performance at adolescence. In-
telligence 16:117-135.
Weiss, 1. G. 1987. It$ time to examine the examiners. Negro E d u c a t i d Rev.
38:107-124.
Academic Bibliography and References
- This section contains a dense alphabetical bibliography of academic sources focusing on behavioral genetics, intelligence, and socio-economic outcomes.
- The citations cover a wide range of topics including the predictive power of the SAT, the impact of preschool curriculum, and longitudinal studies of resilient children.
- Several entries address the intersection of race and cognitive testing, including transracial adoption studies and affirmative action enforcement.
- The list includes significant works on criminology and psychiatry, exploring the relationship between intelligence and juvenile delinquency.
- The bibliography features diverse publication types, ranging from peer-reviewed journals like the American Economic Review to popular books like The Once and Future King.
Werner, E. E., and Smith, R. S. 1982. Vulnerable But Invincible: A Longitudinal Study of Resilient Children and Youth.
828
Bibliography
U.S. Bureau of the Census. Money Income of Households, Families, and Persons
in the United States. Series P-60. Annual. Washington, D.C.: Government
Printing mice.
U.S. Bureau of the Census. Poverty in the United States. Series P-60. Annual.
Washington, D.C.: Government Printing Office.
U.S. Bureau of the Census. Statistical Abstract of the United States, Annual.
Washington, D.C.: Government Printing Office.
U.S. Department of Health and Human Services. 1988. Study of National Inci-
dence and Prevalence of Child Abuse and Neglect. Washington, D.C.: Office
of Human Development Services.
U.S. Department of Labor. 1970. Manual for the USTES General Aptitude Test
Battery. 4th ed. Washington, D.C.: Government Printing Office.
U.S. Department of Labor. 1993. Employment and Earnings. 40: 1.
Valdez, R. S., and Valdez, C. 1983. Detecting predictive bias: The WlSC-R vs.
achievement scores of Mexican-American and non-minority students.
Learning Disability Quarterly 6:44W47.
Valen, L. V, 1974. Brain size and intelligence in man. Am. J. of Physical An-
thropology 40:4 17423.
Valencia, R. R., and Rankin, R. J. 1988. Evidence of bias in predictive valid-
ity on the Kaufman Assessment Battery for children in samples of Anglo
and Mexican American children. Psych. in the Schools 25:257-266.
Valencia, R. R., and Rankin, R. J. 1985. Evidence of context bias on the
McCarthy Scales with Mexican American children: Implications for
test translation and nonbiased assessment.
.of Educational Psych.
77:197-207.
Vance, S. C. 1966. Higher education for the executive elite. California Man-
agement Rev. 8:2 1-30.
Vancourt, M., and Bean, E D. 1985. Intelligence and fertility in the United
States: 191 2-1982. Intelligence 9:23-32.
Verba, S., and Nie, N. H. 1972. Participationin America: Political Demwacy and
Social Equality. Chicago: University of Chicago Press.
Vemon, P. A. 1982. The Abilities and Achievements of Onentafs in North Amer-
ica. New York: Academic Press.
Vernon, P. A. 1983. Speed of information processing and geneml intelligence.
Intelligence 753-70.
Vemon, P. A., et al. 1985. Reaction times and speed of processing: Their rela-
tionship to timed and untimed measures of intelligence. Intelligence 9:357.
Vernon, P. E. 1950. The Structure of Human Abilities. New York: Wiley.
Vincent, K. R. 199 1. Blacklwhite IQ differences: Does age make the difference!
I. of Clinical Psych. 47:266270.
Vining, D. R., Jr. 1982a. Fertility differentials and the status of nations: A spec-
ulative essay on Japan and the West. Mankind Quarterly 22:3 1 1-3 53.
Vining, D. R., Jr. 1982b. On the possibility of the reemergence of a dysgenic
trend with respect to intelligence in American fertility differentials. Intelli-
gence 6:241-264.
Vining, D. R., Jr. 1986. Social versus reproductive success: The central theo-
ret~cal problem of human sociobiology. Behavioral and Brain Sciences
9: 167-2 16.
Wah, D. M., and Robinson, D. S. 1990. Examinee and score trends for the CUE
gnmd test: 1977-78,198243,1986-87, and 1987-88. Princeton, N.J.: Ed-
ucational Testing Service.
Wainer, H. 1988. How accurately can we assess changes in minority perfor-
mance on the SAT? Am. Psychologist 43:774-778.
Waldman, 1. D., Weinberg, R. A,, and Scarr, S. In press. Racial group differ-
ences in IQ in the Minnesota transracial adoption study: A reply to Levin
and Lynn. Intelligence.
Walker, D. A. 1976. The IEA Six Subject Survey: An Empirical Study of Educa-
tion in Twenty-one Counnies. New York: Wiley.
Waller, J. H. 1971. Differential reproduction: Its relation to IQ test score, ed-
ucation, and occupation. Social Biology 18:122-136.
Walsh, 1. 1979. Does high school grade inflation mask a more alarming trend!
Science 203:982.
Warner, W. L., and Ahegglen, J. C. Big Business Leaders in America. New York:
Harper & Rros.
Wasserman, G., Rauh, V., Brunell~, S., Garcia-Castro, M., and Necos, B. 1990.
Psychosocial attributes and life experiences of disadvantaged minority
mothers: Age and ethnic variations. Child Development 61:566-580.
Watkins, M. P., and Meredith, W. 1981. Spouse similarity in newly-weds with
respect to specific cognitive abilities, wio-economic status and education.
Behavioral Genetics 11:l-11.
Wattenberg, B. J. 1987. The Birth Dearth. New York: Pharos Rooks.
Wattenberg, B. I., and Zinsmeister, K. 1990. The case for more immigration.
Commentary (April): 19-25.
Weekley, J. A., et al. 1985. A comparison of three methods of estimating the
standard deviation ofperformance indollars. J. of AppliedPsych. 70: 122-1 26.
Weikart, D. P., Epstein, A. S., Schweinhart, L., and Bond, 1. T. 1978. The
Ypsilanti Preschool Cuniculum Demonstration Project: Preschool Years and
Longitudinal Results. Ypsilanti, Mich.: HighIScope Educational Research
Foundation.
Weinberg, R. A., Scarr, S., and Waldman, I. D. 1992. The Minnesota transra-
cia\ adoption study: A follow-up of 1Q test performance at adolescence. In-
telligence 16:117-135.
Weiss, 1. G. 1987. It$ time to examine the examiners. Negro E d u c a t i d Rev.
38:107-124.
Bibliography
83 1
Weitzman, R. A. 1982. The re diction of college achievement by the Scholas-
tic Aptitude Test and the high school record.]. of Educational Measurement
19:179-191.
Weitzmann, F., Wiener, N. I., Wiesenthal, D. L., and Ziegler, M. 1990. Differ-
ential K theory and racial hierarchies. Canadian Psych. 3 1: 1-1 3.
Welch, F-, 1973. Black-white differences in returns to schooling. Am. Econ. Rev.
63:893-907.
Welch, F. 1981. Affirmative action and its enforcement. Am. Econ. Rev.
71:127-133.
Welsh, J. R., Jr., Watson, T. W., and Ree, M. J. 1990. Armed Services Vocational
Aptitude Battery (ASVAB): Predicting Military Criteria from General and Spe-
cific Abilities. AFHRL-TR-90-63. Brooks Air Force Base, Tex.: Air Force
Systems Command.
Werner, E. E. 1989. High risk children in young adulthood: A longitudinal
study from birth to 32 years. Am. J. of Orthopsychia~ 59:72-81.
Werner, E. E., and Smith, R. S. 1982. Vulnerable But Invincible: A Longitudinal
Study of Resilient Children and Youth. New York: McGraw-Hill.
Wessely, S., and Taylor, P. J. 1991. Madness and crime: Criminology versus psy-
chiatry. Criminal Behaviour and Mental Health 1: 193-228.
Whimbey, A. 1985. Focusing on trainable g. Behavioral and Brain Sciences
8:245-246.
White, E. 1969. Intelligence, individual differences, and learning: An approach
to political sophistication. British j. of Sociology 20:50-68.
White, J. L., Moffitt, T. E., and Silva, P. A. 1989. A prospective replication of
the protective effects of IQ in subjects at high risk for juvenile delinquency.
J. of Consulting and Clinical Psych. 57:7 19-724.
White, S., et al. 1988. Beyond intelligence testing. National Forum: Phi Kappa
Phi I. 68:2-29.
White, T. H. 1958. The Once and Future King. New York: Putnam.
White, W. E, Nylin, W. C., and Esser, P. R. 1985. Academic course grades as
better predictors of graduation from a commuter-type college than SAT
scores. Psycholo&d Reports 56:375-3 78.
Whitworth, R. H., and Chrisman, S. M. 1987. Validation of the Kaufman as-
sessment battery for children comparing Anglo and Mexican-American
preschoolers. Educational and Psychological Measurement. 47:695-698.
Whitworth, R. H., and Gibbons, R. T. 1986. Cross-racial comparison of the
WAIS and WAIS-R. Educational and Psychological Measurement 46: 104 1-49.
Williams, A. P., Cooper, W. D., and Lee, C. L. 1979. Factors Affecting Medical
School Admission Decisions for Minority and Majority Applicants: A Cornpara-
rive Study of Ten Schools. R-2030-HEW. Santa Monica, Cal.: Rand Corpo-
ration.
Williams, M. J. 1987. How the wealthy get that way. Fortune, April 13, pp.
32-38.
Wills, G. 1978. Inventing America: Jefferson's Declaration of Independence. New
York: Vintage.
Wilson, J. Q. 1993. The Moral Sense. New York: Free Press.
Wilson,]. Q., and Hermstein, R. J. 1985. Crime and Human Nature. New York:
Simon and Schuster.
Wilson,]. R. 1985. Jensen's support for Spearman's hypothesis is support for a
circular argument. Behavioral and Brain Sciences 8:246.
Wilson, K. M. 1983. A Review of Research on the Prediction of Academic Perfor-
mance after the Freshman Year. RR-83-11. Princeton, N.J.: Educational Test-
ing Service.
Wilson, W. J. 1987. The Truly Disadvantaged: The Inner City, the Underclass, and
Public Policy. Chicago: University of Chicago Press.
Wise, L. L., McLaughlin, D. H., and Gilmartin, K. J. 1977. The American Cit-
izen: I 1 Years After High School. Vol. 2. Palo Alto: American Institutes for
Research.
Wiseman, M. 1984. Turnover and family fragmentation in Aid to Families with
Dependent Children. Working Paper 84-10 (Revised). Berkeley, Cal.: In-
stitute of Business and Economic Research, University of California.
Wojtkiewicz, R. A., McLanahan, S. S., and Garfinkel, I. 1990. The growth of
families headed by women: 1950-1980. Demography 27:19-30.
Wolfe, D. A. 1985. Child-abusive parents: An empirical review and analysis.
Psychological Bull. 97:462-482.
Wolfe, J. R. 1982. The impact of family resources on childhood IQ. J. of Hu-
man Resources 17:2 13-235.
Wolfgang, M. E., Figlio, R. M., and Sellin, T. 1972. Delinquency in a Birth Co-
hort. Chicago: University of Chicago Press.
Wolfinger, R. E., and Rosenstone, S.J. 1980. Who Votes? New Haven, Conn.:
Yale University Press.
Wolpin, K. I. 1992. The determinants of black-white differences in early ern-
ployment careers: Search, layoffs, quits, and endogenous wage growth. J. of
Political Econ. 100535-560.
Wrong, D. 1980. Class Fertility Trends in Western Nations. New York: Arno.
Yee, A. H., Fairchild, H. H., Weizmann, E, and Wyatt, G. E. 1993. Address-
ing psychology's problems with race. Am. Psychologist 48: 1 132-1 140.
Young, G., and Gately, T. 1988. Neighborhood impoverishment and child mal-
treatment. J. of Family Issues 93240-254.
Young, L. 1964. Wednesday's Children: A Study of Child Negkct and Abuse. New
York: McGraw-Hill.
Youssef, N. H. 1978. The status and fertility patterns of Muslim women. In
Academic Bibliography and Index
- The text provides a comprehensive list of academic references covering sociology, psychology, and public policy, with a focus on family dynamics and intelligence.
- Key themes in the bibliography include the impact of family resources on childhood IQ, the growth of female-headed households, and the ecology of child abuse.
- The index section highlights the 'Abecedarian Project' and various studies on adoption and educational interventions like Head Start.
- A significant portion of the index is dedicated to the complexities of affirmative action in both higher education and the workplace.
- The data explores the intersection of race, employment careers, and the socioeconomic factors influencing academic performance and delinquency.
Wednesday's Children: A Study of Child Neglect and Abuse.
Bibliography
83 1
Weitzman, R. A. 1982. The re diction of college achievement by the Scholas-
tic Aptitude Test and the high school record.]. of Educational Measurement
19:179-191.
Weitzmann, F., Wiener, N. I., Wiesenthal, D. L., and Ziegler, M. 1990. Differ-
ential K theory and racial hierarchies. Canadian Psych. 3 1: 1-1 3.
Welch, F-, 1973. Black-white differences in returns to schooling. Am. Econ. Rev.
63:893-907.
Welch, F. 1981. Affirmative action and its enforcement. Am. Econ. Rev.
71:127-133.
Welsh, J. R., Jr., Watson, T. W., and Ree, M. J. 1990. Armed Services Vocational
Aptitude Battery (ASVAB): Predicting Military Criteria from General and Spe-
cific Abilities. AFHRL-TR-90-63. Brooks Air Force Base, Tex.: Air Force
Systems Command.
Werner, E. E. 1989. High risk children in young adulthood: A longitudinal
study from birth to 32 years. Am. J. of Orthopsychia~ 59:72-81.
Werner, E. E., and Smith, R. S. 1982. Vulnerable But Invincible: A Longitudinal
Study of Resilient Children and Youth. New York: McGraw-Hill.
Wessely, S., and Taylor, P. J. 1991. Madness and crime: Criminology versus psy-
chiatry. Criminal Behaviour and Mental Health 1: 193-228.
Whimbey, A. 1985. Focusing on trainable g. Behavioral and Brain Sciences
8:245-246.
White, E. 1969. Intelligence, individual differences, and learning: An approach
to political sophistication. British j. of Sociology 20:50-68.
White, J. L., Moffitt, T. E., and Silva, P. A. 1989. A prospective replication of
the protective effects of IQ in subjects at high risk for juvenile delinquency.
J. of Consulting and Clinical Psych. 57:7 19-724.
White, S., et al. 1988. Beyond intelligence testing. National Forum: Phi Kappa
Phi I. 68:2-29.
White, T. H. 1958. The Once and Future King. New York: Putnam.
White, W. E, Nylin, W. C., and Esser, P. R. 1985. Academic course grades as
better predictors of graduation from a commuter-type college than SAT
scores. Psycholo&d Reports 56:375-3 78.
Whitworth, R. H., and Chrisman, S. M. 1987. Validation of the Kaufman as-
sessment battery for children comparing Anglo and Mexican-American
preschoolers. Educational and Psychological Measurement. 47:695-698.
Whitworth, R. H., and Gibbons, R. T. 1986. Cross-racial comparison of the
WAIS and WAIS-R. Educational and Psychological Measurement 46: 104 1-49.
Williams, A. P., Cooper, W. D., and Lee, C. L. 1979. Factors Affecting Medical
School Admission Decisions for Minority and Majority Applicants: A Cornpara-
rive Study of Ten Schools. R-2030-HEW. Santa Monica, Cal.: Rand Corpo-
ration.
Williams, M. J. 1987. How the wealthy get that way. Fortune, April 13, pp.
32-38.
Wills, G. 1978. Inventing America: Jefferson's Declaration of Independence. New
York: Vintage.
Wilson, J. Q. 1993. The Moral Sense. New York: Free Press.
Wilson,]. Q., and Hermstein, R. J. 1985. Crime and Human Nature. New York:
Simon and Schuster.
Wilson,]. R. 1985. Jensen's support for Spearman's hypothesis is support for a
circular argument. Behavioral and Brain Sciences 8:246.
Wilson, K. M. 1983. A Review of Research on the Prediction of Academic Perfor-
mance after the Freshman Year. RR-83-11. Princeton, N.J.: Educational Test-
ing Service.
Wilson, W. J. 1987. The Truly Disadvantaged: The Inner City, the Underclass, and
Public Policy. Chicago: University of Chicago Press.
Wise, L. L., McLaughlin, D. H., and Gilmartin, K. J. 1977. The American Cit-
izen: I 1 Years After High School. Vol. 2. Palo Alto: American Institutes for
Research.
Wiseman, M. 1984. Turnover and family fragmentation in Aid to Families with
Dependent Children. Working Paper 84-10 (Revised). Berkeley, Cal.: In-
stitute of Business and Economic Research, University of California.
Wojtkiewicz, R. A., McLanahan, S. S., and Garfinkel, I. 1990. The growth of
families headed by women: 1950-1980. Demography 27:19-30.
Wolfe, D. A. 1985. Child-abusive parents: An empirical review and analysis.
Psychological Bull. 97:462-482.
Wolfe, J. R. 1982. The impact of family resources on childhood IQ. J. of Hu-
man Resources 17:2 13-235.
Wolfgang, M. E., Figlio, R. M., and Sellin, T. 1972. Delinquency in a Birth Co-
hort. Chicago: University of Chicago Press.
Wolfinger, R. E., and Rosenstone, S.J. 1980. Who Votes? New Haven, Conn.:
Yale University Press.
Wolpin, K. I. 1992. The determinants of black-white differences in early ern-
ployment careers: Search, layoffs, quits, and endogenous wage growth. J. of
Political Econ. 100535-560.
Wrong, D. 1980. Class Fertility Trends in Western Nations. New York: Arno.
Yee, A. H., Fairchild, H. H., Weizmann, E, and Wyatt, G. E. 1993. Address-
ing psychology's problems with race. Am. Psychologist 48: 1 132-1 140.
Young, G., and Gately, T. 1988. Neighborhood impoverishment and child mal-
treatment. J. of Family Issues 93240-254.
Young, L. 1964. Wednesday's Children: A Study of Child Negkct and Abuse. New
York: McGraw-Hill.
Youssef, N. H. 1978. The status and fertility patterns of Muslim women. In
Women in the Muslim World. L. Beck andN. Keddie (eds.). Cambridge, Mass.:
Harvard University Press, pp. 69-99.
Yudkin, J. 1991. Intelligence of children and vitamin-mineral supplements:
The DRF study. Discussion, conclusion and consequences. Personality and
individual Differences 12:363-365.
Zabin, L. S., Wong, R., Weinick, R. M., and Emerson, M. R. 1992. Dependency
in urban black families following the birth of an adolescent's child. J . of Mar-
riage and the Family 54:49&507.
Zajonc, R. B.
1976. Family configuration and intelligence. Science
192:227-236.
Zigler, E., and Muenchow, S. 1992. Head Start: The Inside Story of America's
Most Successful Educational Experiment. New York: Basic Books.
Zimmerman, D. 1. 1992. Regression toward mediocrity in economic stature.
Am. Econ. Rev. 82:409429.
Zoref, L. S., and Williams, P. B. 1980. A look at content bias in IQ tests. I, of
Educational Measurement 17:3 13-322.
Zuckerman, M., and Brody, N. 1988. Oysters, rabbits and people: A critique of
"race differences in behaviour" by J. P. Rushton. Personality and Individual
Differences 9: 1025-1033.
Zuravin, S. J. 1989. The ecology of child abuse and neglect: Review of the lit-
erature and presentation of data. Vioknce and Victims 4:101-120.
Index
Abecedarian Project, 407-409
Ahuse: see Child abuse and neglect
Achievement tests, black and white dif-
ferences in 1Q and, 290-293,
638-640
Adams, John, 531
Adoption, 309-31 1,410-413
Affirmative action
in higher education, 36,447-477
admissions policy and, 45W68
hlack dropout rates and, 473-474
costs of, 4704175
ethnic premium for, 449-458
graduate schools in arts and sci-
ences, 457458
impact of, 469-470
law schools, 455-456
medical schools, 456457
policy options for, 475477
racial animosity and, 473
rationale for, 45W68
undergraduate schools, 451-455
in the workplace, 479-507
employment tests and, 481-484,
502,655663
federal regulation of, 481-483,
485491,655463
impact of, 485-492
job productivity and, 492498
policy options for, 498-508
race norming and, 503-504
Affluent class
coalition with cognitive elite,
514-518
economic growth and, 516-517
elite college attendance by, 41-42
senior business executives and, 58
African Americans: see Black and white
differences; Blacks
Age
heritability of IQ and, 108
at marriage, 169-171
of mother
dysgenesis and, 351-352,354-355
low-birth-weight infants and,
216-217
as predictor of joh productivity, 81
Aid to Families with Dependent Chil-
dren (AFDC), 191-193; See also
Welfare dependency
Albemarle Paper Co. v. Moody ( 1975),
660,663
American College Testing (ACT) exam-
ination, 29 1, 294, 640-64 1
Annual family income: see Income
Aristotle, 255, 531
Armed Forces Qualification Test
(AFQT), 73-74, 120,277-278,
579-592
Armed Services Vocational Aptitude
Battery ( ASVAB), 75-76,
680-683
Asian-American(s)
immigrants, 359-360
reverse discrimination and, 453
and white differences
in IQ, 272-276,299-301
in test scores, affirmative action
and, 451453,455,456,458
Assortative mating, 110-1 13
Bean, Frank, 347
Bell curve, 556-558
Bender, William J . , 29, 41
Benton, David, 392
Besharov, Douglas, 208
Bias: see Test bias
Binet, Alfred, 2
Bishop, John, 421422,437-438
Black(s)
differences with whites: see Black and
white differences
dropout rates of, 473-474
immigrants, 359, 360, 363
The Bell Curve Index
- The index details the relationship between the affluent class and the cognitive elite, specifically regarding economic growth and elite college attendance.
- Extensive entries cover racial differences in IQ, test scores, and socioeconomic outcomes, including income, poverty, and welfare dependency.
- A significant portion of the text focuses on child development, linking parental IQ and socioeconomic status to outcomes like child abuse, neglect, and behavioral problems.
- The document references legal and policy frameworks such as the Civil Rights Act of 1964 and various Supreme Court cases like Albemarle Paper Co. v. Moody.
- It tracks the historical and scientific discourse on intelligence, citing figures like Alfred Binet, Aristotle, and Cyril Burt alongside modern standardized tests like the AFQT and SAT.
Aristotle, 255, 531; Armed Forces Qualification Test (AFQT), 73-74, 120, 277-278, 579-592.
Women in the Muslim World. L. Beck andN. Keddie (eds.). Cambridge, Mass.:
Harvard University Press, pp. 69-99.
Yudkin, J. 1991. Intelligence of children and vitamin-mineral supplements:
The DRF study. Discussion, conclusion and consequences. Personality and
individual Differences 12:363-365.
Zabin, L. S., Wong, R., Weinick, R. M., and Emerson, M. R. 1992. Dependency
in urban black families following the birth of an adolescent's child. J . of Mar-
riage and the Family 54:49&507.
Zajonc, R. B.
1976. Family configuration and intelligence. Science
192:227-236.
Zigler, E., and Muenchow, S. 1992. Head Start: The Inside Story of America's
Most Successful Educational Experiment. New York: Basic Books.
Zimmerman, D. 1. 1992. Regression toward mediocrity in economic stature.
Am. Econ. Rev. 82:409429.
Zoref, L. S., and Williams, P. B. 1980. A look at content bias in IQ tests. I, of
Educational Measurement 17:3 13-322.
Zuckerman, M., and Brody, N. 1988. Oysters, rabbits and people: A critique of
"race differences in behaviour" by J. P. Rushton. Personality and Individual
Differences 9: 1025-1033.
Zuravin, S. J. 1989. The ecology of child abuse and neglect: Review of the lit-
erature and presentation of data. Vioknce and Victims 4:101-120.
Index
Abecedarian Project, 407-409
Ahuse: see Child abuse and neglect
Achievement tests, black and white dif-
ferences in 1Q and, 290-293,
638-640
Adams, John, 531
Adoption, 309-31 1,410-413
Affirmative action
in higher education, 36,447-477
admissions policy and, 45W68
hlack dropout rates and, 473-474
costs of, 4704175
ethnic premium for, 449-458
graduate schools in arts and sci-
ences, 457458
impact of, 469-470
law schools, 455-456
medical schools, 456457
policy options for, 475477
racial animosity and, 473
rationale for, 45W68
undergraduate schools, 451-455
in the workplace, 479-507
employment tests and, 481-484,
502,655663
federal regulation of, 481-483,
485491,655463
impact of, 485-492
job productivity and, 492498
policy options for, 498-508
race norming and, 503-504
Affluent class
coalition with cognitive elite,
514-518
economic growth and, 516-517
elite college attendance by, 41-42
senior business executives and, 58
African Americans: see Black and white
differences; Blacks
Age
heritability of IQ and, 108
at marriage, 169-171
of mother
dysgenesis and, 351-352,354-355
low-birth-weight infants and,
216-217
as predictor of joh productivity, 81
Aid to Families with Dependent Chil-
dren (AFDC), 191-193; See also
Welfare dependency
Albemarle Paper Co. v. Moody ( 1975),
660,663
American College Testing (ACT) exam-
ination, 29 1, 294, 640-64 1
Annual family income: see Income
Aristotle, 255, 531
Armed Forces Qualification Test
(AFQT), 73-74, 120,277-278,
579-592
Armed Services Vocational Aptitude
Battery ( ASVAB), 75-76,
680-683
Asian-American(s)
immigrants, 359-360
reverse discrimination and, 453
and white differences
in IQ, 272-276,299-301
in test scores, affirmative action
and, 451453,455,456,458
Assortative mating, 110-1 13
Bean, Frank, 347
Bell curve, 556-558
Bender, William J . , 29, 41
Benton, David, 392
Besharov, Douglas, 208
Bias: see Test bias
Binet, Alfred, 2
Bishop, John, 421422,437-438
Black(s)
differences with whites: see Black and
white differences
dropout rates of, 473-474
immigrants, 359, 360, 363
834
Index
Black and white differences
in aptitude test scores
affirmative action and, 451458
narrowing gap in SATs, 292,
294-295,638-639
in educational attainment, 319-320
in fertility, 352-357
in income, 322-327
on indicators of social problems
cognitive outcomes for children,
337-338
crime, 338-339
developmental outcomes for chil-
dren, 336-337
home environment for children,
334-336
illegitimacy, 330-33 1
labor force dropouts, 327-328
low-birth-weight infants, 332-334
marriage rates, 329,330
poverty, 326327,333-334
unemployment, 327-329
welfare dependency, 33 1-332
in IQ, 276-295
affirmative action and: see Affirma-
tive action
African-Americans compared with
African blacks, 289-290
computation of, 278
diminishing trend in, 290-295,
637-642
dropout rates and, 474
genetic explanation of: see Genetic
factors in IQ
magnitude of, 276,277-280
socioeconomic status and, 286288
standardized tests and, 276
test bias and: see Test bias
uncertainty within scientific com-
munity about, 295-296
in Middle-Class Values Index,
339-340
in occupational status, 320-322
Blackbum, McKinley, 97
"Black English," 636
Bok, Derek, 66, 80
Borjas, George, 36 1-364
Roykin, Wade, 306
Brigham, Carl C., 5, 6
Broken homes
crime and, 249-250
illegitimacy and, 184-186
Brown University, 43,453
Burger, Warren, 658
Burt, Cyril, 11, 12, 16
California Psychological Inventory, 7
Cameron, Steve, 147-148, 15 1
Carroll, John B., 16
Case, Clifford, 659
Cattell, Raymond, 15,345-346, 366
Centiles. See Percentiles.
Chan, J. W. C., 273
Child abuse and neglect
parental IQ and, 21 1-2 13
socioeconomic status and, 207-2 10
Child development
behavioral problems in older children,
226-227,383
ethnic differences in, 336-337
home environment for: see Home en-
vironment for child development
index of problems, 227-229
low-IQ prevalence among mothers
and, 382-384
motor and social development, 226,
383
poverty and, 229-230
temperament, 226, 383
welfare dependency and, 229
Children; See also Child development;
Infants; Parenting
adoption of, 309-3 11,410-413
development of civility in, 256258
impact of cognitive stratification on,
519-520
raising 1Q of: see 1Q: raising
of single mothers: see Single mothen
Cigarette smoking, 214
Citizenship: see Civility
Civility, 253-266
defined, 254
Middle-Class Values Index and,
263-266,339-340
political participation as outcropping
of: see Political participation
Civil Rights Act of 1964,394,482,
485487,490,491,655-657
Civil Rights Act of 1991,482, 504, 663
Coleman, James S., 394-396
Civil Service Commission, 660
Coleman report, 275,394-396
Coaching for test, 400402,633435
College admission requirements, 41,43 1,
Cognitive ability, use of term, 22; See
439
also Intelligence; 1Q
College Board Achievement Tests,
Cognitive classes and social problems,
638-640
1 17-266
College enrollment
definition of cognitive classes,
affirmative action and: see
120-122
Affirmative action: in higher educa-
National Longitudinal Survey of
tion
Youth (NLSY) and, 118-120,
in elite colleges, 37-39, 112
124
feminist movement and, 112
presentation of statistical results,
growth of, 30-32
122-126,593-623
probability of, 32-35
specific problems: see Civility; Crime;
College grades
Family matters, Laho~ force
cognitive test scores as predictors of,
dropouts; Physical disability;
471472
Poverty; School dropouts; Unem-
as ~redictor of job productivity, 81
ployment; Welfare dependency
College graduates
Cognitive elite, 25-1 15
divorce probability and, 175-176
assortative mating and, 110-1 13
educational stratification and, 3@-32,
characterization of, 509-51 1
35-36,4550
coalitions with affluent, 514-518
ethnic differences and, 3 19-320
custodial state scenario and, 523-526
fertility of, 349-350, 353-354
educational stratification: see Educa-
illegitimacy and, 184
tional stratification
income stratification and, 94,95
heritability of IQ and, 105-1 10
low-birth-weight infants and, 2 17
isolation within, 5 12-5 13
marriage probability and, 172
joh productivity: see ]oh productivity
occupational stratification and, 59,60,
meritocracy and, 51 1-512
64-65
occupational stratification: see Occu-
parenting and
pational stratification
cognitive outcomes, 232
physical separation of, 101-105
developmental problems, 229
nlles generated by, 541-546
home environment for child devel-
white underclass and, 521
opment, 225
Cognitive stratification, 25-27; See also
poverty throughout childhood, 220
Cognitive classes and social be-
poverty and, 135-136,220
havior; Cognitive elite
socioeconomic status and, 151-1 53
impact of, 509-526
unemployment and, 164-166
benefits, 51 1-512
voting behavior and, 259
on children, 5 19-520
welfare dependency and, 196,
coalitions of cognitive elite and the
198-199,201
affluent, 5 14-5 18
Colleges, elite, 37-43,47-50, 112,
emerging white underclass, 520-521
451457
isolation within cognitive elite,
Collins, Mama, 399
512-513
Compensatory education, 398-399
spatial concentration, low cognitive
Competitive fairness, 512-5 13
ability, and underclass behavior,
Consortium for Longitudinal Studies,
522
405406
Index of Cognitive Stratification
- The text provides a detailed index of topics related to cognitive stratification, focusing on the emergence of a 'cognitive elite' and its social implications.
- It explores the relationship between IQ and various social outcomes, including crime, poverty, unemployment, and welfare dependency.
- The index highlights the concept of 'assortative mating' and the physical and social isolation of high-IQ individuals from the rest of society.
- It references the 'custodial state' scenario, suggesting a future where the cognitive elite manages a growing underclass through increased oversight.
- Educational stratification is a major theme, tracking how college enrollment and elite institutions filter individuals into different cognitive classes.
custodial state scenario and, 523-526
834
Index
Black and white differences
in aptitude test scores
affirmative action and, 451458
narrowing gap in SATs, 292,
294-295,638-639
in educational attainment, 319-320
in fertility, 352-357
in income, 322-327
on indicators of social problems
cognitive outcomes for children,
337-338
crime, 338-339
developmental outcomes for chil-
dren, 336-337
home environment for children,
334-336
illegitimacy, 330-33 1
labor force dropouts, 327-328
low-birth-weight infants, 332-334
marriage rates, 329,330
poverty, 326327,333-334
unemployment, 327-329
welfare dependency, 33 1-332
in IQ, 276-295
affirmative action and: see Affirma-
tive action
African-Americans compared with
African blacks, 289-290
computation of, 278
diminishing trend in, 290-295,
637-642
dropout rates and, 474
genetic explanation of: see Genetic
factors in IQ
magnitude of, 276,277-280
socioeconomic status and, 286288
standardized tests and, 276
test bias and: see Test bias
uncertainty within scientific com-
munity about, 295-296
in Middle-Class Values Index,
339-340
in occupational status, 320-322
Blackbum, McKinley, 97
"Black English," 636
Bok, Derek, 66, 80
Borjas, George, 36 1-364
Roykin, Wade, 306
Brigham, Carl C., 5, 6
Broken homes
crime and, 249-250
illegitimacy and, 184-186
Brown University, 43,453
Burger, Warren, 658
Burt, Cyril, 11, 12, 16
California Psychological Inventory, 7
Cameron, Steve, 147-148, 15 1
Carroll, John B., 16
Case, Clifford, 659
Cattell, Raymond, 15,345-346, 366
Centiles. See Percentiles.
Chan, J. W. C., 273
Child abuse and neglect
parental IQ and, 21 1-2 13
socioeconomic status and, 207-2 10
Child development
behavioral problems in older children,
226-227,383
ethnic differences in, 336-337
home environment for: see Home en-
vironment for child development
index of problems, 227-229
low-IQ prevalence among mothers
and, 382-384
motor and social development, 226,
383
poverty and, 229-230
temperament, 226, 383
welfare dependency and, 229
Children; See also Child development;
Infants; Parenting
adoption of, 309-3 11,410-413
development of civility in, 256258
impact of cognitive stratification on,
519-520
raising 1Q of: see 1Q: raising
of single mothers: see Single mothen
Cigarette smoking, 214
Citizenship: see Civility
Civility, 253-266
defined, 254
Middle-Class Values Index and,
263-266,339-340
political participation as outcropping
of: see Political participation
Civil Rights Act of 1964,394,482,
485487,490,491,655-657
Civil Rights Act of 1991,482, 504, 663
Coleman, James S., 394-396
Civil Service Commission, 660
Coleman report, 275,394-396
Coaching for test, 400402,633435
College admission requirements, 41,43 1,
Cognitive ability, use of term, 22; See
439
also Intelligence; 1Q
College Board Achievement Tests,
Cognitive classes and social problems,
638-640
1 17-266
College enrollment
definition of cognitive classes,
affirmative action and: see
120-122
Affirmative action: in higher educa-
National Longitudinal Survey of
tion
Youth (NLSY) and, 118-120,
in elite colleges, 37-39, 112
124
feminist movement and, 112
presentation of statistical results,
growth of, 30-32
122-126,593-623
probability of, 32-35
specific problems: see Civility; Crime;
College grades
Family matters, Laho~ force
cognitive test scores as predictors of,
dropouts; Physical disability;
471472
Poverty; School dropouts; Unem-
as ~redictor of job productivity, 81
ployment; Welfare dependency
College graduates
Cognitive elite, 25-1 15
divorce probability and, 175-176
assortative mating and, 110-1 13
educational stratification and, 3@-32,
characterization of, 509-51 1
35-36,4550
coalitions with affluent, 514-518
ethnic differences and, 3 19-320
custodial state scenario and, 523-526
fertility of, 349-350, 353-354
educational stratification: see Educa-
illegitimacy and, 184
tional stratification
income stratification and, 94,95
heritability of IQ and, 105-1 10
low-birth-weight infants and, 2 17
isolation within, 5 12-5 13
marriage probability and, 172
joh productivity: see ]oh productivity
occupational stratification and, 59,60,
meritocracy and, 51 1-512
64-65
occupational stratification: see Occu-
parenting and
pational stratification
cognitive outcomes, 232
physical separation of, 101-105
developmental problems, 229
nlles generated by, 541-546
home environment for child devel-
white underclass and, 521
opment, 225
Cognitive stratification, 25-27; See also
poverty throughout childhood, 220
Cognitive classes and social be-
poverty and, 135-136,220
havior; Cognitive elite
socioeconomic status and, 151-1 53
impact of, 509-526
unemployment and, 164-166
benefits, 51 1-512
voting behavior and, 259
on children, 5 19-520
welfare dependency and, 196,
coalitions of cognitive elite and the
198-199,201
affluent, 5 14-5 18
Colleges, elite, 37-43,47-50, 112,
emerging white underclass, 520-521
451457
isolation within cognitive elite,
Collins, Mama, 399
512-513
Compensatory education, 398-399
spatial concentration, low cognitive
Competitive fairness, 512-5 13
ability, and underclass behavior,
Consortium for Longitudinal Studies,
522
405406
Consortium on Financing Higher Educa-
tion (COFHE), 451
Cook, Philip, 42-43
Correlation coefficient, 2-3,6769,
561-564
Credentialing, 64-65,69,325-327,445,
474,503,542
Crime, 235-25 1
broken homes vs. IQ and, 249-250
educational attainment and, 250-251
history of study of link between IQ
and, 241-242
importance of link between IQ and,
241-242
incarceration, 247-250,365,367
increase in, 236237
low-IQ prevalence and, 375-376
psychological theories of, 237-241,
245
self-report data, 245-250
socioeconomic status, vs. IQ and,
248-250
sociological theories of, 23 7-24 1
types of criminal involvement by IQ,
246248
Crystallized intelligence, 15
Cultural bias: see Test bias
Cultural content of test items, 281-282
Cultural explanations of ethnic differ-
ences in IQ, 304-307
Custodial state, 523-526
Darwin, Charles, 1,343
Demographic transition, 343-345
Demography of intelligence: see Dysgene-
sis
Dependent variable, 122
Development, child: see Child develop-
ment
Digit span test, 283,306
Disability, 161-163,365,367
Disciplining of children, 205-206
"Disparate impact" in antidiscrimination
law, 482,657462
Divorce
by cognitive class, 173-1 74
educational attainment and, 175-1 76
intergenerational transmission of,
176-1 77
low-cognitive-ability prevalence and,
379-380
single mothers and poverty among
children, 137-141
socioeconomic status vs. IQ and,
174-175
Dropouts: see Labor force dropouts;
School dropouts
Dysgenesis, 341-368
in America in the early 1990s,
348-357
defined, 342
demographic transition and, 343-345
fertility and: see Fertility, differential
immigration and: see Immigration
importance of, 364-368
regression to the mean and, 357
state of knowledge ahout, 343-348
Earles, James, 76
"Educated person" 442-445
Education, 41 7445
affirmative action in: see Affirmative
action: in higher education
policy agenda for, 435445
raising 1Q with, 393-402, 414
trends in
average high school students,
419-425
college-bound students, 425-427
dumbing down, 429434
gifted students, 427428,434435
Educational attainment
affirmative action and, 502-503
assertive mating by, 110-1 12
child maltreatment and, 2 11
crime and, 250-25 1
divorce probability and, 175-176
employment problems and
labor force dropouts, 157, 160-161
unemployment, 164-165
ethnic differences in, 319-320,
324-325,353-354
fertility and, 349-350,353-354
illegitimacy and, 184
income stratfication and, 94-98
marriage rates and, 171-1 72
occupational stratification and, 52,
57-60,64
parenting and
developmental problems, 229
home environment for child devel-
opment, 225
low-birth-weight infants, 217
poverty throughout childhood, 220
poverty and, 135-137,220
as predictor of job productivity, 81,89
school dropouts: see School dropouts
socioeconomic status and, 151-153
voting behavior and, 259-261
welfare dependency and, 193,
196-197,198-199
Educational standards, 429433,437,
439-440
Educational stratification
college degree and, 30-32,35-36,
45-50
effects of, 49-50
elite colleges and, 3 7 4 9
extent of, 45-50
growth of college population and,
30-32
high school diploma and, 32-35
Egalitarianism, 9, 107, 500,527,
532-534
Elementary and Secondary Education
Act (ESEA) of 1965,398,434
Elliott, Delbert, 250
Employment, 155-166
affirmative action and: see Affirmative
action: in the workplace
labor force dropouts: see Labor force
dropouts
low-IQ prevalence and, 372-375
physical disabiliv, 161-163,365,367
unemployment: see Unemployment
Employment tests, 481484,502,
655-663
Environmental factors in intelligence,
8-9,106,108,298-299,
303-304,309-3'15,342-343,
410; See also IQ: raising
Equal Employment Oppomnities Com-
mission (EEOC),
655658,660,
661
Ethnic differences
in aptitude test scores, affirmative ac-
tion and, 451-458
in educational attainment, 3 19-320
324325,353-354
in fertility, 352-357
immigration and, 359-360
in income, 322-327
on indicators of social problems,
327-340
cognitive outcomes for children,
337-338
crime, 338-339
developmental outcomes for chil-
dren, 336-337
home environment for children,
334,336
illegitimacy, 330-33 1
labor force dropouts, 327-328
low-birth-weight infants, 332-333,
334
marriage rates, 329,330
poverty, 326321,333-334
unemployment, 327-329
welfare dependency, 331-332
in IQ, 269-3 15
affirmative action and: see Affirma-
tive action
Asian American and white,
272-276,299-301
black and white: see Black and
white differences: in IQ
cultural explanations of, 304-
307
genetics and, 295-31 1
Jews and gentiles, 275
Latinos and non-Latino whites,
275
in Middle-Class Values Index,
339-340
in occupational status, 320-322
in reproductive strategies, 642-643
Eugenic Hypothesis, 346
Factor analysis, 3-4, 18-19
Family Structure, 167-190; See also Di-
vorce; Illegitimacy; Marriage
crime and, 249-250
single mothers: see Single mothers
traditional, deterioration of, 190
trends in, 173
Feminism, 1 12-1 13
Index of Cognitive Stratification
- The text provides a detailed index of topics relating to cognitive ability, socioeconomic status, and social outcomes in late 20th-century America.
- Key themes include the concept of 'dysgenesis' and how fertility patterns among different IQ groups may influence national demographic trends.
- Educational attainment is linked to a wide array of social indicators, including marriage rates, crime, labor force participation, and welfare dependency.
- The index highlights the role of affirmative action and ethnic differences in IQ, income, and occupational status as central points of analysis.
- It documents the 'dumbing down' of educational standards alongside the stratification of elite colleges and the growth of the college-bound population.
Dysgenesis, 341-368; in America in the early 1990s, 348-357; defined, 342; demographic transition and, 343-345.
Consortium on Financing Higher Educa-
tion (COFHE), 451
Cook, Philip, 42-43
Correlation coefficient, 2-3,6769,
561-564
Credentialing, 64-65,69,325-327,445,
474,503,542
Crime, 235-25 1
broken homes vs. IQ and, 249-250
educational attainment and, 250-251
history of study of link between IQ
and, 241-242
importance of link between IQ and,
241-242
incarceration, 247-250,365,367
increase in, 236237
low-IQ prevalence and, 375-376
psychological theories of, 237-241,
245
self-report data, 245-250
socioeconomic status, vs. IQ and,
248-250
sociological theories of, 23 7-24 1
types of criminal involvement by IQ,
246248
Crystallized intelligence, 15
Cultural bias: see Test bias
Cultural content of test items, 281-282
Cultural explanations of ethnic differ-
ences in IQ, 304-307
Custodial state, 523-526
Darwin, Charles, 1,343
Demographic transition, 343-345
Demography of intelligence: see Dysgene-
sis
Dependent variable, 122
Development, child: see Child develop-
ment
Digit span test, 283,306
Disability, 161-163,365,367
Disciplining of children, 205-206
"Disparate impact" in antidiscrimination
law, 482,657462
Divorce
by cognitive class, 173-1 74
educational attainment and, 175-1 76
intergenerational transmission of,
176-1 77
low-cognitive-ability prevalence and,
379-380
single mothers and poverty among
children, 137-141
socioeconomic status vs. IQ and,
174-175
Dropouts: see Labor force dropouts;
School dropouts
Dysgenesis, 341-368
in America in the early 1990s,
348-357
defined, 342
demographic transition and, 343-345
fertility and: see Fertility, differential
immigration and: see Immigration
importance of, 364-368
regression to the mean and, 357
state of knowledge ahout, 343-348
Earles, James, 76
"Educated person" 442-445
Education, 41 7445
affirmative action in: see Affirmative
action: in higher education
policy agenda for, 435445
raising 1Q with, 393-402, 414
trends in
average high school students,
419-425
college-bound students, 425-427
dumbing down, 429434
gifted students, 427428,434435
Educational attainment
affirmative action and, 502-503
assertive mating by, 110-1 12
child maltreatment and, 2 11
crime and, 250-25 1
divorce probability and, 175-176
employment problems and
labor force dropouts, 157, 160-161
unemployment, 164-165
ethnic differences in, 319-320,
324-325,353-354
fertility and, 349-350,353-354
illegitimacy and, 184
income stratfication and, 94-98
marriage rates and, 171-1 72
occupational stratification and, 52,
57-60,64
parenting and
developmental problems, 229
home environment for child devel-
opment, 225
low-birth-weight infants, 217
poverty throughout childhood, 220
poverty and, 135-137,220
as predictor of job productivity, 81,89
school dropouts: see School dropouts
socioeconomic status and, 151-153
voting behavior and, 259-261
welfare dependency and, 193,
196-197,198-199
Educational standards, 429433,437,
439-440
Educational stratification
college degree and, 30-32,35-36,
45-50
effects of, 49-50
elite colleges and, 3 7 4 9
extent of, 45-50
growth of college population and,
30-32
high school diploma and, 32-35
Egalitarianism, 9, 107, 500,527,
532-534
Elementary and Secondary Education
Act (ESEA) of 1965,398,434
Elliott, Delbert, 250
Employment, 155-166
affirmative action and: see Affirmative
action: in the workplace
labor force dropouts: see Labor force
dropouts
low-IQ prevalence and, 372-375
physical disabiliv, 161-163,365,367
unemployment: see Unemployment
Employment tests, 481484,502,
655-663
Environmental factors in intelligence,
8-9,106,108,298-299,
303-304,309-3'15,342-343,
410; See also IQ: raising
Equal Employment Oppomnities Com-
mission (EEOC),
655658,660,
661
Ethnic differences
in aptitude test scores, affirmative ac-
tion and, 451-458
in educational attainment, 3 19-320
324325,353-354
in fertility, 352-357
immigration and, 359-360
in income, 322-327
on indicators of social problems,
327-340
cognitive outcomes for children,
337-338
crime, 338-339
developmental outcomes for chil-
dren, 336-337
home environment for children,
334,336
illegitimacy, 330-33 1
labor force dropouts, 327-328
low-birth-weight infants, 332-333,
334
marriage rates, 329,330
poverty, 326321,333-334
unemployment, 327-329
welfare dependency, 331-332
in IQ, 269-3 15
affirmative action and: see Affirma-
tive action
Asian American and white,
272-276,299-301
black and white: see Black and
white differences: in IQ
cultural explanations of, 304-
307
genetics and, 295-31 1
Jews and gentiles, 275
Latinos and non-Latino whites,
275
in Middle-Class Values Index,
339-340
in occupational status, 320-322
in reproductive strategies, 642-643
Eugenic Hypothesis, 346
Factor analysis, 3-4, 18-19
Family Structure, 167-190; See also Di-
vorce; Illegitimacy; Marriage
crime and, 249-250
single mothers: see Single mothers
traditional, deterioration of, 190
trends in, 173
Feminism, 1 12-1 13
Index
839
Fertility, differential, 342-357
demographic transition and, 343-345
ethnicity and, 352-357
mother's age and IQ and, 351-352,
354-355
number of children born and,
349-351,353-354
Fertility policy, 548-549
Finch, Frank, 145
Fletcher, Ronald, 12
Fluid intelligence, 15
Flynn, James, 273,307,308,348
Flynn effect, 307-309,346347,391,
397,422
Founding Fathers, 530-532
Frank, Robert, 42-43
Frequency distributions, 553-555
Galton, Sir Francis, 1-2, 26, 284
Garber, Howard, 408
Gardner, Howard, 18-19, 21,22,637
Gates, Bill, 114
GED (General Educational Develop-
ment), 147-148,153-154,372
Gender differences in IQ, 275
General Aptitude Test Battery (GATB),
72-73,504
General factor (g) of intelligence, 3-4
challenges to, 14-15, 18
classicists and, 14, 15, 22-23
defined, 4
job productivity and, 71, 75-79
reaction time and, 283-284
Spearman's hypothesis, 301-303,63 1,
636
Genetic factors in IQ, 23, 105-1 10,
295-31 1
controversy over, 8-12
demography of intelligence and: see
Dysgenesis
estimation of, 105-108
Hermstein's syllogism and, 105,
108-110
role of genes in individuals and groups,
298-299
Spearman's hypothesis and, 301-305
Ghiselli, Edwin, 72
Gillie, Oliver, 11
Goddard, H. H.. 6, 241
Gordon, Robert, 338
Goring, Charles, 241
Gottfredson, Linda, 321
Gould, Stephen J., 12, 296
Graduate Record Examination (GRE),
457458,641442
Grim v. Duke Power (1971), 70,85,
482,485,486,490,491,657-
658,663
Guilford, Joy, 15
Gustafsson, Jan-Eric, 304
Hacker, Andrew, 497-498
Hamilton, Alexander, 53 1
Hartigan Committee, 74-75, 85, 484
Harvard University, 28-29, 38, 40, 41,
43,66,451-454
Head Start, 403404,414-415,434
Heath, Shirley Brice, 206-207
Heber, Richard, 408
Heckman, James, 147-148, 151,485
Heritability of IQ: see Genetic factors in
l a
Hemstein, Richard, 10
Hermstein's syllogism, 105, 108-1 10
Higham, John, 358
High School and Beyond survey,
183-184
High school dropouts: see School
dropouts
High school graduates
divorce probability and, 175-1 76
dropouts compared with, 148-1 50
ethnic differences and, 3 19
fertility of, 349, 350
GED graduates compared with,
150-151
illegitimacy and, 184
income of, 94,95
low-birth-weight infants and, 2 17
marriage probability and, 172
median overlap with college graduates,
48-49
parenting and
cognitive outcomes, 232
developmental problems, 229
home environment for child devel-
opment, 225
poverty throughout childhood, 220
poverty and, 136137,220
probability of college enrollment by,
32-35
unemployment among, 164-165
welfare dependency and, 196197,
198-199
Hindelang, Michael, 242
Hiring decisions: see Affirmative action;
Job productivity
Hirsch, Jerry, 9-10
Hirschi, Travis, 242
Hobbes, Thomas, 528-529
Holmes, Oliver Wendell, 5
Home environment for child develop-
ment, 220-225
adoption and, 410-413,415-416
cognitive outcomes and, 232
educational attainment and, 225
ethnic differences in, 334,336
low-cognitive-ability prevalence and,
381-381
poverty and, 223-224
socioeconomic status and, 222-223
welfare and, 223-224
Home Observation for Measurement of
the Environment (HOME) in-
dex, 220-225,232,381-382
Homogamy, 11 1-1 13
Humphrey, Hubert, 500,659
Hunt, Earl B., 16
Hunter, John, 71-73,85
Hunter, Ronda, 85
Idiot savants, 22
Illegitimacy, 177-190
broken homes and, 184-186
developmental problems and, 229-230
educational attainment and, 184
ethnic differences in, 33@-331
family structure and, 184-186
IQ and, 179,181,200-201
low IQ prevalence and, 386389
poverty and, 186190
as precursor of child maltreatment,
210
socioeconomic status and, 182-183,
186,188-189
trends in, 178-179
welfare and, 186-190
Illiteracy, 420,436
Immigration, 5,6,342,343,356-364
ethnicity and 1Q as they apply to,
359-360
policy and, 549
self.selection and, 361-364
trend in, 356-358
Immigration Restriction Act of 1924,6,
343
Income, 93-101
black, affirmative action and, 485-486
educational attainment and, 94-98
elite college attendance and, 41
ethnic differences in, 322-327
growth of affluent class and, 5 15-5 17
high school achievement and, 438
1Q and, 93-94,98-100
occupational stratfication and, 97,98,
i o e i o i
redistribution issues, 547-548
residual characteristics of workers and,
96-98
Independent variable, 122
Infants
illegitimate: see Illegitimacy
low-birth-weight: see Low-Birth-
weight infants
maternal IQ and well.being of,
213-218
mortality, 2 17-2 18
motor and social development in, 226,
383
temperament in, 226,383
Intelligence: See also IQ
concept of, 1
definitions of, 4
general factor (g) of: see General fac-
tor (g) of intelligence
as information processing, 15-1 7
structures of, 14-15
theory of multiple, 17-2 1
triarchic theory of, 17
Iowa Test of Educational Developmen
(ITED), 423,424
IQ; See also Intelligence
affirmative action and: see Affirm
action, 98-100
behaviorists and, 8-9
classical tradition, 23
Index of Intelligence and Society
- The index highlights the 'General factor (g)' of intelligence as a central theme, linking it to job productivity, reaction time, and Spearman's hypothesis.
- Significant attention is given to the genetic factors of IQ, including the controversy surrounding heritability and Herrnstein's syllogism.
- The text maps the relationship between educational attainment—specifically high school graduation versus GED—and life outcomes like poverty, divorce, and unemployment.
- Social issues such as illegitimacy, welfare dependency, and home environments are cross-referenced with cognitive ability and socioeconomic status.
- Legal and policy-related entries include affirmative action, the Flynn effect, and landmark court cases like Griggs v. Duke Power.
- The inclusion of figures like Bill Gates and institutions like Harvard suggests a focus on the cognitive stratification of the American elite.
General factor (g) of intelligence, 3-4; challenges to, 14-15, 18; classicists and, 14, 15, 22-23; defined, 4; job productivity and, 71, 75-79.
Index
839
Fertility, differential, 342-357
demographic transition and, 343-345
ethnicity and, 352-357
mother's age and IQ and, 351-352,
354-355
number of children born and,
349-351,353-354
Fertility policy, 548-549
Finch, Frank, 145
Fletcher, Ronald, 12
Fluid intelligence, 15
Flynn, James, 273,307,308,348
Flynn effect, 307-309,346347,391,
397,422
Founding Fathers, 530-532
Frank, Robert, 42-43
Frequency distributions, 553-555
Galton, Sir Francis, 1-2, 26, 284
Garber, Howard, 408
Gardner, Howard, 18-19, 21,22,637
Gates, Bill, 114
GED (General Educational Develop-
ment), 147-148,153-154,372
Gender differences in IQ, 275
General Aptitude Test Battery (GATB),
72-73,504
General factor (g) of intelligence, 3-4
challenges to, 14-15, 18
classicists and, 14, 15, 22-23
defined, 4
job productivity and, 71, 75-79
reaction time and, 283-284
Spearman's hypothesis, 301-303,63 1,
636
Genetic factors in IQ, 23, 105-1 10,
295-31 1
controversy over, 8-12
demography of intelligence and: see
Dysgenesis
estimation of, 105-108
Hermstein's syllogism and, 105,
108-110
role of genes in individuals and groups,
298-299
Spearman's hypothesis and, 301-305
Ghiselli, Edwin, 72
Gillie, Oliver, 11
Goddard, H. H.. 6, 241
Gordon, Robert, 338
Goring, Charles, 241
Gottfredson, Linda, 321
Gould, Stephen J., 12, 296
Graduate Record Examination (GRE),
457458,641442
Grim v. Duke Power (1971), 70,85,
482,485,486,490,491,657-
658,663
Guilford, Joy, 15
Gustafsson, Jan-Eric, 304
Hacker, Andrew, 497-498
Hamilton, Alexander, 53 1
Hartigan Committee, 74-75, 85, 484
Harvard University, 28-29, 38, 40, 41,
43,66,451-454
Head Start, 403404,414-415,434
Heath, Shirley Brice, 206-207
Heber, Richard, 408
Heckman, James, 147-148, 151,485
Heritability of IQ: see Genetic factors in
l a
Hemstein, Richard, 10
Hermstein's syllogism, 105, 108-1 10
Higham, John, 358
High School and Beyond survey,
183-184
High school dropouts: see School
dropouts
High school graduates
divorce probability and, 175-1 76
dropouts compared with, 148-1 50
ethnic differences and, 3 19
fertility of, 349, 350
GED graduates compared with,
150-151
illegitimacy and, 184
income of, 94,95
low-birth-weight infants and, 2 17
marriage probability and, 172
median overlap with college graduates,
48-49
parenting and
cognitive outcomes, 232
developmental problems, 229
home environment for child devel-
opment, 225
poverty throughout childhood, 220
poverty and, 136137,220
probability of college enrollment by,
32-35
unemployment among, 164-165
welfare dependency and, 196197,
198-199
Hindelang, Michael, 242
Hiring decisions: see Affirmative action;
Job productivity
Hirsch, Jerry, 9-10
Hirschi, Travis, 242
Hobbes, Thomas, 528-529
Holmes, Oliver Wendell, 5
Home environment for child develop-
ment, 220-225
adoption and, 410-413,415-416
cognitive outcomes and, 232
educational attainment and, 225
ethnic differences in, 334,336
low-cognitive-ability prevalence and,
381-381
poverty and, 223-224
socioeconomic status and, 222-223
welfare and, 223-224
Home Observation for Measurement of
the Environment (HOME) in-
dex, 220-225,232,381-382
Homogamy, 11 1-1 13
Humphrey, Hubert, 500,659
Hunt, Earl B., 16
Hunter, John, 71-73,85
Hunter, Ronda, 85
Idiot savants, 22
Illegitimacy, 177-190
broken homes and, 184-186
developmental problems and, 229-230
educational attainment and, 184
ethnic differences in, 33@-331
family structure and, 184-186
IQ and, 179,181,200-201
low IQ prevalence and, 386389
poverty and, 186190
as precursor of child maltreatment,
210
socioeconomic status and, 182-183,
186,188-189
trends in, 178-179
welfare and, 186-190
Illiteracy, 420,436
Immigration, 5,6,342,343,356-364
ethnicity and 1Q as they apply to,
359-360
policy and, 549
self.selection and, 361-364
trend in, 356-358
Immigration Restriction Act of 1924,6,
343
Income, 93-101
black, affirmative action and, 485-486
educational attainment and, 94-98
elite college attendance and, 41
ethnic differences in, 322-327
growth of affluent class and, 5 15-5 17
high school achievement and, 438
1Q and, 93-94,98-100
occupational stratfication and, 97,98,
i o e i o i
redistribution issues, 547-548
residual characteristics of workers and,
96-98
Independent variable, 122
Infants
illegitimate: see Illegitimacy
low-birth-weight: see Low-Birth-
weight infants
maternal IQ and well.being of,
213-218
mortality, 2 17-2 18
motor and social development in, 226,
383
temperament in, 226,383
Intelligence: See also IQ
concept of, 1
definitions of, 4
general factor (g) of: see General fac-
tor (g) of intelligence
as information processing, 15-1 7
structures of, 14-15
theory of multiple, 17-2 1
triarchic theory of, 17
Iowa Test of Educational Developmen
(ITED), 423,424
IQ; See also Intelligence
affirmative action and: see Affirm
action, 98-100
behaviorists and, 8-9
classical tradition, 23
Index of Cognitive and Social Factors
- The index outlines the relationship between IQ and various social outcomes, including job productivity, labor force participation, and marriage rates.
- It details the economic value of intelligence testing, suggesting that IQ is a significant predictor of job performance compared to experience or specific skills.
- A substantial portion of the text focuses on the impact of maternal IQ on infant well-being, including birth weight, mortality, and developmental outcomes.
- The document tracks the debate over raising IQ through environmental interventions such as adoption, nutrition, and early childhood education programs.
- The index categorizes data by ethnic differences, examining how cognitive scores correlate with poverty, welfare dependency, and occupational status across different demographics.
economic costs of not testing and, 85-87; economic value of IQ and, 65,8246, 88; experience vs. IQ and, 79-80
Index
839
Fertility, differential, 342-357
demographic transition and, 343-345
ethnicity and, 352-357
mother's age and IQ and, 351-352,
354-355
number of children born and,
349-351,353-354
Fertility policy, 548-549
Finch, Frank, 145
Fletcher, Ronald, 12
Fluid intelligence, 15
Flynn, James, 273,307,308,348
Flynn effect, 307-309,346347,391,
397,422
Founding Fathers, 530-532
Frank, Robert, 42-43
Frequency distributions, 553-555
Galton, Sir Francis, 1-2, 26, 284
Garber, Howard, 408
Gardner, Howard, 18-19, 21,22,637
Gates, Bill, 114
GED (General Educational Develop-
ment), 147-148,153-154,372
Gender differences in IQ, 275
General Aptitude Test Battery (GATB),
72-73,504
General factor (g) of intelligence, 3-4
challenges to, 14-15, 18
classicists and, 14, 15, 22-23
defined, 4
job productivity and, 71, 75-79
reaction time and, 283-284
Spearman's hypothesis, 301-303,63 1,
636
Genetic factors in IQ, 23, 105-1 10,
295-31 1
controversy over, 8-12
demography of intelligence and: see
Dysgenesis
estimation of, 105-108
Hermstein's syllogism and, 105,
108-110
role of genes in individuals and groups,
298-299
Spearman's hypothesis and, 301-305
Ghiselli, Edwin, 72
Gillie, Oliver, 11
Goddard, H. H.. 6, 241
Gordon, Robert, 338
Goring, Charles, 241
Gottfredson, Linda, 321
Gould, Stephen J., 12, 296
Graduate Record Examination (GRE),
457458,641442
Grim v. Duke Power (1971), 70,85,
482,485,486,490,491,657-
658,663
Guilford, Joy, 15
Gustafsson, Jan-Eric, 304
Hacker, Andrew, 497-498
Hamilton, Alexander, 53 1
Hartigan Committee, 74-75, 85, 484
Harvard University, 28-29, 38, 40, 41,
43,66,451-454
Head Start, 403404,414-415,434
Heath, Shirley Brice, 206-207
Heber, Richard, 408
Heckman, James, 147-148, 151,485
Heritability of IQ: see Genetic factors in
l a
Hemstein, Richard, 10
Hermstein's syllogism, 105, 108-1 10
Higham, John, 358
High School and Beyond survey,
183-184
High school dropouts: see School
dropouts
High school graduates
divorce probability and, 175-1 76
dropouts compared with, 148-1 50
ethnic differences and, 3 19
fertility of, 349, 350
GED graduates compared with,
150-151
illegitimacy and, 184
income of, 94,95
low-birth-weight infants and, 2 17
marriage probability and, 172
median overlap with college graduates,
48-49
parenting and
cognitive outcomes, 232
developmental problems, 229
home environment for child devel-
opment, 225
poverty throughout childhood, 220
poverty and, 136137,220
probability of college enrollment by,
32-35
unemployment among, 164-165
welfare dependency and, 196197,
198-199
Hindelang, Michael, 242
Hiring decisions: see Affirmative action;
Job productivity
Hirsch, Jerry, 9-10
Hirschi, Travis, 242
Hobbes, Thomas, 528-529
Holmes, Oliver Wendell, 5
Home environment for child develop-
ment, 220-225
adoption and, 410-413,415-416
cognitive outcomes and, 232
educational attainment and, 225
ethnic differences in, 334,336
low-cognitive-ability prevalence and,
381-381
poverty and, 223-224
socioeconomic status and, 222-223
welfare and, 223-224
Home Observation for Measurement of
the Environment (HOME) in-
dex, 220-225,232,381-382
Homogamy, 11 1-1 13
Humphrey, Hubert, 500,659
Hunt, Earl B., 16
Hunter, John, 71-73,85
Hunter, Ronda, 85
Idiot savants, 22
Illegitimacy, 177-190
broken homes and, 184-186
developmental problems and, 229-230
educational attainment and, 184
ethnic differences in, 33@-331
family structure and, 184-186
IQ and, 179,181,200-201
low IQ prevalence and, 386389
poverty and, 186190
as precursor of child maltreatment,
210
socioeconomic status and, 182-183,
186,188-189
trends in, 178-179
welfare and, 186-190
Illiteracy, 420,436
Immigration, 5,6,342,343,356-364
ethnicity and 1Q as they apply to,
359-360
policy and, 549
self.selection and, 361-364
trend in, 356-358
Immigration Restriction Act of 1924,6,
343
Income, 93-101
black, affirmative action and, 485-486
educational attainment and, 94-98
elite college attendance and, 41
ethnic differences in, 322-327
growth of affluent class and, 5 15-5 17
high school achievement and, 438
1Q and, 93-94,98-100
occupational stratfication and, 97,98,
i o e i o i
redistribution issues, 547-548
residual characteristics of workers and,
96-98
Independent variable, 122
Infants
illegitimate: see Illegitimacy
low-birth-weight: see Low-Birth-
weight infants
maternal IQ and well.being of,
213-218
mortality, 2 17-2 18
motor and social development in, 226,
383
temperament in, 226,383
Intelligence: See also IQ
concept of, 1
definitions of, 4
general factor (g) of: see General fac-
tor (g) of intelligence
as information processing, 15-1 7
structures of, 14-15
theory of multiple, 17-2 1
triarchic theory of, 17
Iowa Test of Educational Developmen
(ITED), 423,424
IQ; See also Intelligence
affirmative action and: see Affirm
action, 98-100
behaviorists and, 8-9
classical tradition, 23
840
lndex
Index
841
IQ, cont.
controversies over, 4-13
development of concept, 4
dysgenesis and: see Dysgenesis
environmental factors in, 8-9, 106,
108,29&299,303-307,309-315,
342,410
ethnic differences in: see Ethnic differ-
ences
heritability of: see Genetic factors in
l a
importance of, 21-22
low: see Low cognitive ability
raising, 388-416
adoption and, 410-413,415416
education and, 393402,414
nutrition and, 391-393,414
policy agenda for, 413416
pre-school programs, 403-410,
414-415
stability over life span of, 129
stratification by: see Cognitive classes
and social behavior; Cognitive
elite
Jefferson, Thomas, 530-531
Jencks, Christopher, 53
Jensen, Arthur, 9-10, 13, 15,283-284,
302-304,308
Jewish and gentile differences in lQ, 275
Job productivity, 63-89
affirmative action and, 492-498
contemporary evidence on test scores
as predictors of, 70-7 1
economic costs of not testing and, 85-87
economic value of IQ and, 65,8246,
88
experience vs. IQ and, 79-80
high school performance and, 439
measurement of, 72
meta-analysis and, 71-73
specific skills vs. general factor g and,
75-79
test scores compared with other pre-
dictors of, 81-82
test validity and, 72-75, 81, 84, 85,
658,660,661
Joynson, Robert, 12
Jungeblut, Ann, 401
Kael, Pauline, 5 13
Kamin, Leon, 11,304,3 11
Katz, Lawrence, 94
Kaufman Assessment Battery of Children
(K-ABC), 290
Kaus, Mickey, 512
Klitgaard, Robert, 459
Kohn, Melvin, 205-206
Labor force participation, 157-162
by cognitive class, 158
defined, 157
educational attainment and, 160, 161
ethnic differences in, 327-328
low-1Q prevalence and, 373-374
socioeconomic status and, 158,
158-160
Latino(s)
affirmative action and, 451458,472,
503
cognitive outcomes for children,
337-338
crime and, 338, 339
developmental outcomes for children,
336
differences in IQ with non-Latino
whites, 275
educational attainment of, 3 19-320
fertility in, 353-354
home environment for children, 334,
336
illegitimacy and, 330-33 1
immigrants, 358-360,362
income of, 322,323
low-birth-weight infants of, 326,
332-333,334
marriage rates of, 329,330
in Middle-Class Values Index,
339-340
occupational status of, 320-322
poverty of children, 333-334
unemployment of, 327,328
welfare dependency of, 331-332
Law school, affirmative action and,
455456
Law School Aptitude Test (LSAT), 450,
455456,633-634
Lazar, Irving, 405
Lewontin, Richard, 304
Lindzey, G., 310
Lippmann, Walter, 5, 17-18
Locke, John, 529-530
Locurto, Charles, 408, 41 1
Loehlin, 1. C., 3 10
Logistic regression analysis, 122-126,
567,5934123,645453
Low-birth-weight infants
child maltreatment and, 210
ethnic differences in, 332, 333
low-lQ prevalence and, 381-382
maternal IQ and, 214-21 7
Lynn, Richard, 272-274, 289,359
Madison, James, 531, 532
Maguire, Xmothy, 450,455
Malinowski, Bronislaw, 177
Malparenting, 207-2 10
parental 1Q and, 21 1-213
socioeconomic status and, 207-210
Mare, Robert, 11 1
Marriage, 168-172; See also Divorce
age at, 169-171
assortive mating, 1 10-113
rates of
educational attainment and,
171-172
ethnic differences in, 329,330
IQ and, 169-172
socioeconomic status and, 170-172
trends in, 168-169
Massachusetts Institute of Technology
(MITI, 43,454,473-475
Math skills, 422423,425429,431-
433
Mating, assortative, 110-1 13
McGurk, Frank, 63 1
Median overlap, 48-49
Medical College Admissions Test
(MCAT), 456,457,633634
Medical schools, affirmative action and,
456457
Mental retardation, intensive interven-
tions for children at risk of,
406-409
Mercer, Jane, 304-306
Meritocracy, 5 1 1-5 12
Messick, Samuel, 401
Meta-analysis, 7 1-73
Middle-Class Values (MCV) lndex,
263-266,339-340,385
Military jobs, 73-77, 80
Mills, C. Wright, 58
Milwaukee Project, 408409
Minnesota Multiphasic Personality In-
ventory (MMPI), 7
Multicollinearity, 124
Multiculturalism in curriculum, 433
Multiple intelligence, theory of, 17-21
Multiple regression analysis, 566-567
Murchison, Carl, 241
Murphy, Kevin, 94
National Academy of Sciences, 74
National Assessment of Educational
Progress (NAEP), 290-291, 292,
294,420,422
National Longitudinal Survey of Youth
(NLSY), description of, 36, 49,
56,98, 1 13,118-1 20, 124,347,
569-577
Neglect: see Child abuse and neglect
Neighborhoods, 537-540
Neuman, Russell, 261-262
Neumark, David, 97
Nie, Norman, 259,260
Normal distribution, 44, 568-570
Nutrition, 391-393,414
Occupational status
affirmative action and, 485-486,
488492
ethnic differences in, 320-322
voting behavior and, 259-260
Occupational stratification, 5 1-61
assortative mating and, 1 12-1 13
business executives and, 57-60
childhood intelligence and adult out-
comes and, 53
educational attainment and, 52,
57-60,64
educational credentials and, 6 4 4 5
family resemblance in status and,
53-54
growth of high-1Q professions and,
54-57
income stratification and, 97,98,
100-101
Index of Cognitive Stratification
- The index highlights the intersection of intelligence, socioeconomic status, and occupational stratification in modern society.
- Extensive data from the National Longitudinal Survey of Youth (NLSY) serves as a primary foundation for analyzing social outcomes.
- Parental IQ and maternal cognitive ability are linked to critical childhood outcomes, including poverty, neglect, and developmental health.
- The text explores the tension between meritocracy and affirmative action within higher education and the workplace.
- Public policy discussions focus on the limits of educational reform and the necessity of simplifying social rules for a diverse population.
The growth of high-IQ professions and the family resemblance in status suggest a deepening cognitive partitioning of the social classes.
840
lndex
Index
841
IQ, cont.
controversies over, 4-13
development of concept, 4
dysgenesis and: see Dysgenesis
environmental factors in, 8-9, 106,
108,29&299,303-307,309-315,
342,410
ethnic differences in: see Ethnic differ-
ences
heritability of: see Genetic factors in
l a
importance of, 21-22
low: see Low cognitive ability
raising, 388-416
adoption and, 410-413,415416
education and, 393402,414
nutrition and, 391-393,414
policy agenda for, 413416
pre-school programs, 403-410,
414-415
stability over life span of, 129
stratification by: see Cognitive classes
and social behavior; Cognitive
elite
Jefferson, Thomas, 530-531
Jencks, Christopher, 53
Jensen, Arthur, 9-10, 13, 15,283-284,
302-304,308
Jewish and gentile differences in lQ, 275
Job productivity, 63-89
affirmative action and, 492-498
contemporary evidence on test scores
as predictors of, 70-7 1
economic costs of not testing and, 85-87
economic value of IQ and, 65,8246,
88
experience vs. IQ and, 79-80
high school performance and, 439
measurement of, 72
meta-analysis and, 71-73
specific skills vs. general factor g and,
75-79
test scores compared with other pre-
dictors of, 81-82
test validity and, 72-75, 81, 84, 85,
658,660,661
Joynson, Robert, 12
Jungeblut, Ann, 401
Kael, Pauline, 5 13
Kamin, Leon, 11,304,3 11
Katz, Lawrence, 94
Kaufman Assessment Battery of Children
(K-ABC), 290
Kaus, Mickey, 512
Klitgaard, Robert, 459
Kohn, Melvin, 205-206
Labor force participation, 157-162
by cognitive class, 158
defined, 157
educational attainment and, 160, 161
ethnic differences in, 327-328
low-1Q prevalence and, 373-374
socioeconomic status and, 158,
158-160
Latino(s)
affirmative action and, 451458,472,
503
cognitive outcomes for children,
337-338
crime and, 338, 339
developmental outcomes for children,
336
differences in IQ with non-Latino
whites, 275
educational attainment of, 3 19-320
fertility in, 353-354
home environment for children, 334,
336
illegitimacy and, 330-33 1
immigrants, 358-360,362
income of, 322,323
low-birth-weight infants of, 326,
332-333,334
marriage rates of, 329,330
in Middle-Class Values Index,
339-340
occupational status of, 320-322
poverty of children, 333-334
unemployment of, 327,328
welfare dependency of, 331-332
Law school, affirmative action and,
455456
Law School Aptitude Test (LSAT), 450,
455456,633-634
Lazar, Irving, 405
Lewontin, Richard, 304
Lindzey, G., 310
Lippmann, Walter, 5, 17-18
Locke, John, 529-530
Locurto, Charles, 408, 41 1
Loehlin, 1. C., 3 10
Logistic regression analysis, 122-126,
567,5934123,645453
Low-birth-weight infants
child maltreatment and, 210
ethnic differences in, 332, 333
low-lQ prevalence and, 381-382
maternal IQ and, 214-21 7
Lynn, Richard, 272-274, 289,359
Madison, James, 531, 532
Maguire, Xmothy, 450,455
Malinowski, Bronislaw, 177
Malparenting, 207-2 10
parental 1Q and, 21 1-213
socioeconomic status and, 207-210
Mare, Robert, 11 1
Marriage, 168-172; See also Divorce
age at, 169-171
assortive mating, 1 10-113
rates of
educational attainment and,
171-172
ethnic differences in, 329,330
IQ and, 169-172
socioeconomic status and, 170-172
trends in, 168-169
Massachusetts Institute of Technology
(MITI, 43,454,473-475
Math skills, 422423,425429,431-
433
Mating, assortative, 110-1 13
McGurk, Frank, 63 1
Median overlap, 48-49
Medical College Admissions Test
(MCAT), 456,457,633634
Medical schools, affirmative action and,
456457
Mental retardation, intensive interven-
tions for children at risk of,
406-409
Mercer, Jane, 304-306
Meritocracy, 5 1 1-5 12
Messick, Samuel, 401
Meta-analysis, 7 1-73
Middle-Class Values (MCV) lndex,
263-266,339-340,385
Military jobs, 73-77, 80
Mills, C. Wright, 58
Milwaukee Project, 408409
Minnesota Multiphasic Personality In-
ventory (MMPI), 7
Multicollinearity, 124
Multiculturalism in curriculum, 433
Multiple intelligence, theory of, 17-21
Multiple regression analysis, 566-567
Murchison, Carl, 241
Murphy, Kevin, 94
National Academy of Sciences, 74
National Assessment of Educational
Progress (NAEP), 290-291, 292,
294,420,422
National Longitudinal Survey of Youth
(NLSY), description of, 36, 49,
56,98, 1 13,118-1 20, 124,347,
569-577
Neglect: see Child abuse and neglect
Neighborhoods, 537-540
Neuman, Russell, 261-262
Neumark, David, 97
Nie, Norman, 259,260
Normal distribution, 44, 568-570
Nutrition, 391-393,414
Occupational status
affirmative action and, 485-486,
488492
ethnic differences in, 320-322
voting behavior and, 259-260
Occupational stratification, 5 1-61
assortative mating and, 1 12-1 13
business executives and, 57-60
childhood intelligence and adult out-
comes and, 53
educational attainment and, 52,
57-60,64
educational credentials and, 6 4 4 5
family resemblance in status and,
53-54
growth of high-1Q professions and,
54-57
income stratification and, 97,98,
100-101
Index
843
Ogbu, John, 307
Osbom, Frederick, 346
Out-of-wedlock births: see Illegitimacy
Panel Study of Income Dynamics, 119
Parenting, 203-233
abuse and neglect
parental IQ and, 21 1-2 13
socioeconomic status and, 207-210
educational attainment and
cognitive outcomes, 232
developmental problems and, 229
home environment for child devel-
opment, 225
low-birth-weight infants, 2 17
poverty throughout childhood, 220
"good," 204-205
matemal IQ
child development and: see Child
development
cognitive outcomes and, 230-232,
337-338
ethnic differences in, 334-338
low-IQ prevalence, 377-384
well-being of infants and. 213-218;
See also Low-birth-weight infants,
332-333,334
poverty and, 137-141
single mothers: see Single mothers
socioeconomic status and
abuse and neglect, 207-210
cognitive outcomes, 230-232
developmental problems, 228
home environment for child devel*
opment, 222-223
parenting style, 205-207
poverty throughout childhood,
218-220
Partitioning, cognitive: see Cognitive
classes and social behavior; Cog.
nitive elite
Payner, Brook, 485
Peabody Picture Vocabulary Test
(PPVT), 230-231,337-338,355
Pearson, Karl, 2-3, 15
Peckham, Robert, 11
Pelton, Leroy, 2 10
Percentiles, 558-559
Perkins, Frances, 192
Perry Preschool Program, 404-405
Physical disability, 161-163, 365, 367
Piaget, Jean, 16
Polansky, Norman, 2 12
Policy agenda, 527-552
for affirmative action
in higher education, 475477
in the workplace, 498-508
demography issues, 548-549
for education, 435-445
realism about how federal reforms
will work, 439-442
realism about limits of general im.
provements, 436439
restoring concept of "educated per-
son," 442-445
equality as an ideal, 528-535
income distribution, 547-548
raising IQ, 413-416
rule simplification, 541-556
"valued places" in society, 535-540
Political participation, 255-263
development in children, 256-258
voting behavior, 25&263
educational attainment and,
259-261
IQ and, 261-262
socioeconomic status and, 258-2 59
Poverty, 127-142
child abuse and, 209
educational attainment and, 135-137,
220
ethnic differences in, 326327,333,
334
history of, 128-129
low-birthaweight infants and, 2 16-2 17
low-IQ prevalence and, 3 70-37 1
parenting and
cognitive outcomes, 232
developmental problems, 229
throughout early childhood,
218-220,333-334,365,367
home environment for child devel-
opment, 223-224
illegitimacy, 187-190
Iow-IQ prevalence, 382-383
matemal IQ, 138-139,218-220
maternal sociwconomic status,
139-1 4 1
welfare: see Welfare dependency
socioeconomic status and
vs. IQ, 130-137,141-142
of single mothers, 139-140
Predictive validity: see Validity, test
Preliminary Scholastic Aptitude Test
(PSAT), 422
Prenatal care, 214
Pre-school programs, 403-410, 414-
415
Project Intelligence, 410
Psychometrics, 1-24
controversies in, 8-14
history of, 1-14
schools of, 14-24
Quay, L. C., 636
Race norming, 453,503-504
Racism, 6,9-10,328,358,453, 525-
526
Ramey, Craig, 407
Ravens Standard Progressive Matrices
(SPM), 273,290,306
Reaction rime, 283-284, 303
Ree, Malcolm, 76
Regression analysis, 565-567,593-623
logistic, 567
cognitive classes and social behav-
ior, 122-1 26,593-623
ethnic inequalities in relation to
IQ, 645-653
multiple, 566-567
regression coefficients, 565-566
Regression to the mean, 357
Reich, Rohert, 5 17
Retherford, Robert, 169
Reynolds, Cyril, 302
Roherts, Gwilym, 392
Roper Organization, 5 15
Rose, Steven, 3 13
Rosenstone, Steven, 259
Rothman, Stanley, 295
Rushton, J. Philippe, 642-643
Scarr, Sandra, 309-3 10
Scatter, diagrams, 560-561
Schiff, Michel, 41 1
Schmidt, Frank, 71
Scholastic Aptitude Test (SAT), 11, 12
bias against blacks and, 280-282
black and white differences in scores
affirmative action and, 451458
narrowing gap in, 292,294-295,
638-639
coaching and, 400-402,633-634
conversion into IQ scores, 38-39
decline in scores
average high school students and,
422423
of college-bound students, 425-
42 7
verbal, of gifted students, 42W29
distribution for all high school seniors:
1961,40
East Asians and, 301
elite colleges and, 39-40,43,49
Haward Un~versity: 1952 and 1960,
29
as predictor of life success, 66,80
School dropouts, 143-15 1, 153-154
by cognitive class, 146-147
crime and. 250
IQ of, 145-146
low-1Q prevalence and, 371-372
socioeconomic status vs. IQ and,
147-151
welfare dependency and, 199
Separated mothers: see Single mothers
Shockley, William, 10
Silverberg, Eugene, 496,497
Single mothers
divorced: see Divorce
divorce probabilities of children and,
176
illegitimacy: see Illegitimacy
poverty and
among children, 137-141
illegitimacy, 187-190
welfare dependency: see Welfare de-
pendency
Skinner, B. F., 8
Snyderrnan, Mark, 295
Social problems: see Cognitive classes
and social problems; Ethnic dif-
ferences: on indicators of social
problems; Low cognitive ability:
social problems and prevalence of
Index of Cognitive and Social Factors
- The text provides a detailed index of factors influencing child development, including low birth weight, home environment, and maternal IQ.
- It outlines the relationship between socioeconomic status (SES) and various life outcomes such as crime, divorce, and educational attainment.
- The index highlights the role of psychometrics and standardized testing, specifically the SAT, in predicting life success and measuring ethnic inequalities.
- There is a focus on the intersection of cognitive ability and social problems, including welfare dependency, school dropouts, and illegitimacy.
- The document references specific statistical methods like regression analysis and standard deviations used to analyze these social trends.
The index lists 'cognitive classes and social behavior' alongside 'ethnic inequalities in relation to IQ' and 'regression to the mean.'
Index
843
Ogbu, John, 307
Osbom, Frederick, 346
Out-of-wedlock births: see Illegitimacy
Panel Study of Income Dynamics, 119
Parenting, 203-233
abuse and neglect
parental IQ and, 21 1-2 13
socioeconomic status and, 207-210
educational attainment and
cognitive outcomes, 232
developmental problems and, 229
home environment for child devel-
opment, 225
low-birth-weight infants, 2 17
poverty throughout childhood, 220
"good," 204-205
matemal IQ
child development and: see Child
development
cognitive outcomes and, 230-232,
337-338
ethnic differences in, 334-338
low-IQ prevalence, 377-384
well-being of infants and. 213-218;
See also Low-birth-weight infants,
332-333,334
poverty and, 137-141
single mothers: see Single mothers
socioeconomic status and
abuse and neglect, 207-210
cognitive outcomes, 230-232
developmental problems, 228
home environment for child devel*
opment, 222-223
parenting style, 205-207
poverty throughout childhood,
218-220
Partitioning, cognitive: see Cognitive
classes and social behavior; Cog.
nitive elite
Payner, Brook, 485
Peabody Picture Vocabulary Test
(PPVT), 230-231,337-338,355
Pearson, Karl, 2-3, 15
Peckham, Robert, 11
Pelton, Leroy, 2 10
Percentiles, 558-559
Perkins, Frances, 192
Perry Preschool Program, 404-405
Physical disability, 161-163, 365, 367
Piaget, Jean, 16
Polansky, Norman, 2 12
Policy agenda, 527-552
for affirmative action
in higher education, 475477
in the workplace, 498-508
demography issues, 548-549
for education, 435-445
realism about how federal reforms
will work, 439-442
realism about limits of general im.
provements, 436439
restoring concept of "educated per-
son," 442-445
equality as an ideal, 528-535
income distribution, 547-548
raising IQ, 413-416
rule simplification, 541-556
"valued places" in society, 535-540
Political participation, 255-263
development in children, 256-258
voting behavior, 25&263
educational attainment and,
259-261
IQ and, 261-262
socioeconomic status and, 258-2 59
Poverty, 127-142
child abuse and, 209
educational attainment and, 135-137,
220
ethnic differences in, 326327,333,
334
history of, 128-129
low-birthaweight infants and, 2 16-2 17
low-IQ prevalence and, 3 70-37 1
parenting and
cognitive outcomes, 232
developmental problems, 229
throughout early childhood,
218-220,333-334,365,367
home environment for child devel-
opment, 223-224
illegitimacy, 187-190
Iow-IQ prevalence, 382-383
matemal IQ, 138-139,218-220
maternal sociwconomic status,
139-1 4 1
welfare: see Welfare dependency
socioeconomic status and
vs. IQ, 130-137,141-142
of single mothers, 139-140
Predictive validity: see Validity, test
Preliminary Scholastic Aptitude Test
(PSAT), 422
Prenatal care, 214
Pre-school programs, 403-410, 414-
415
Project Intelligence, 410
Psychometrics, 1-24
controversies in, 8-14
history of, 1-14
schools of, 14-24
Quay, L. C., 636
Race norming, 453,503-504
Racism, 6,9-10,328,358,453, 525-
526
Ramey, Craig, 407
Ravens Standard Progressive Matrices
(SPM), 273,290,306
Reaction rime, 283-284, 303
Ree, Malcolm, 76
Regression analysis, 565-567,593-623
logistic, 567
cognitive classes and social behav-
ior, 122-1 26,593-623
ethnic inequalities in relation to
IQ, 645-653
multiple, 566-567
regression coefficients, 565-566
Regression to the mean, 357
Reich, Rohert, 5 17
Retherford, Robert, 169
Reynolds, Cyril, 302
Roherts, Gwilym, 392
Roper Organization, 5 15
Rose, Steven, 3 13
Rosenstone, Steven, 259
Rothman, Stanley, 295
Rushton, J. Philippe, 642-643
Scarr, Sandra, 309-3 10
Scatter, diagrams, 560-561
Schiff, Michel, 41 1
Schmidt, Frank, 71
Scholastic Aptitude Test (SAT), 11, 12
bias against blacks and, 280-282
black and white differences in scores
affirmative action and, 451458
narrowing gap in, 292,294-295,
638-639
coaching and, 400-402,633-634
conversion into IQ scores, 38-39
decline in scores
average high school students and,
422423
of college-bound students, 425-
42 7
verbal, of gifted students, 42W29
distribution for all high school seniors:
1961,40
East Asians and, 301
elite colleges and, 39-40,43,49
Haward Un~versity: 1952 and 1960,
29
as predictor of life success, 66,80
School dropouts, 143-15 1, 153-154
by cognitive class, 146-147
crime and. 250
IQ of, 145-146
low-1Q prevalence and, 371-372
socioeconomic status vs. IQ and,
147-151
welfare dependency and, 199
Separated mothers: see Single mothers
Shockley, William, 10
Silverberg, Eugene, 496,497
Single mothers
divorced: see Divorce
divorce probabilities of children and,
176
illegitimacy: see Illegitimacy
poverty and
among children, 137-141
illegitimacy, 187-190
welfare dependency: see Welfare de-
pendency
Skinner, B. F., 8
Snyderrnan, Mark, 295
Social problems: see Cognitive classes
and social problems; Ethnic dif-
ferences: on indicators of social
problems; Low cognitive ability:
social problems and prevalence of
Socioeconomic status (SES)
black and white differences and
in income, 329-325
in IQ, 286288
college graduates and, 151-153
crime and, 248-250
divorce probability and, 174-1 75
educational attainment: see Educa-
tional attainment
employment problems and, 158-166
ethnic differences in, 274-275
illegitimacy and, 182-183, 186,
188-189
low-birth-weight infants and, 215,216
marriage and, 112, 172-174
parenting and, 205-210,222-223,
229-232.230-232
political socialization of children and,
257
poverty and, 130-137,139-142,
218-220
school dropouts and, 147-151
voting behavior and, 258-259
welfare dependency and, 195-201
Socioeconomic stratification
educational stratification and, 30
heritability of IQ and, 105-1 10
Hemstein's syllogism and, 10, 105,
108-110
residential segregation and, 104-105
Sowell, Thomas, 363,430
Spearman, Charles, 2-4, 14, 15
Spearman's hypothesis, 301-304,631,
636
Spuhler, J. N., 310
Standard deviations
computation of, 555-556
defined, 44,557-558
normal distribution and, 44, 557-558
Standard scores, 556
Stanford-Binet IQ test, 5, 7, 290,308
Statistics, 553-567
correlation coefficient, 2-3,6749,
561-564
dependent variable, 122
factor analysis, 3-4, 18-19,680-683
frequency distributions, 553-555
independent variable, 122
median overlap, 4849
meta-analysis, 7 1-73
normal distribution, 44, 556-558
regression analysis: see Regression
analysis
regression to the mean, 357
restriction of range, 68-69
standard deviations: see Standard devi-
ations
validity, 72-75,81,8+-87
Sternberg, Robert, 16, 17
Stevenson, Harold, 274,300,437
Sutherland, Edwin, 241
System of Multicultural Pluralistic As-
sessment (SOMPA), 304-306
TALENT, 1 18-1 19, 146,423
Teacher competency examinations,
493-494
Terman, Lewis, 5, 7,57, 162
Test bias, 12,280-286,625-637
external evidence of, 280-281,
483484,625630
internal evidence of, 281-282
item bias, 630-633
situational
coaching, 633-635
examiner bias, 635
language difficulties, 282, 636,
637
motivation to try, 282-284
practice effects, 633-63 5
test anxiety, 635
"uniform background," 285-286
Test validity: see Validity, test
Thurstone, Louis, 15
Transracial adoption study, 309-3 10
Underclass
attitudes of cognitive elite toward,
521,523
custodial state scenario and, 523-526
spatial concentration and, 522, 524
white, emerging, 520-52 1
Unemployment, 163-1 65
educational attainment and, 164-165
ethnic differences in, 327-329
low-IQ prevalence and, 374375
socioeconomic status vs. 1Q and,
163-165
Uniform Guidelines on Employee Selec-
tion Procedures, 485, 486, 490,
660-662
University of California at Berkeley, 43,
453-455
Un~versity of Virginia, 453-454
Validity, test
job productivity and, 72-75,81,
8447,658,660,661
test hias and, 280-281,483484,
625-630
Valued places in society, 535-540
Van Court, Marian, 347
Variahles, 122
Verha, Sidney, 259, 260
Verhal skills, 300-301, 422423.
425429,43 1,433,443
Vernon, Philip, 15, 273, 300-301
Vincent, Ken, 290
Vining, Daniel, Jr., 347
Voss, Harwin, 250
Voting behavior, 255, 258-263
educational attainment and, 259-261
1Q and, 261-262
socioeconomic status and, 258-259
Wages: see Income
Wards Cove Packing Co . , Inc , v. Atonio
( 1989), 666467
Washington, George, 53 1
Wechsler, David, 6-7
Wechsler Adult Intelligence Scale
(WAIS), 7,151-152,290
Wechsler Intelligence Scale for Children
(WISC), 7,275,302,303
Weikart, David, 404
Weinberg, Richard, 309-3 10
Welfare dependency, 191-201
child abuse and, 209
chronic, 194, 196-199
by cognitive class, 193-195
developmental problems and, 229
educat~onal attainment and, 193,
196-197,198-199
ethnic differences in, 33 1-332
home environment for child develop-
ment and, 223-224
illegitimacy and, 186-187, 188-190
low-IQ prevalence and, 376-377
probabilities after birth of first child,
195-196
socioeconomic status and, 195-201
trends in, 192-193
Westinghouse Science Talent Search,
42-43
White, T. H., 532-533
Wilson, James Q., 543
Wilson, William Julius, 522
Wolfinger, Raymond, 258, 259
Wonderlic Personnel Test, 504
Young, Leontine, 213
Intelligence and Social Structure
- The text provides a comprehensive index of statistical concepts and social variables, ranging from factor analysis and regression to welfare dependency and voting behavior.
- It explores the intersection of cognitive ability with socioeconomic outcomes, including unemployment, ethnic differences, and educational attainment.
- A significant portion of the index focuses on test validity and potential biases, examining situational factors like coaching, language difficulties, and test anxiety.
- The authors introduce the concept of a 'custodial state' and the emerging 'white underclass' as potential future societal developments.
- The work emphasizes that understanding the role of intelligence is essential for addressing America's most sensitive and persistent social problems.
To try to come to grips with the nation's problems without understanding the role of intelligence is to see through a glass darkly indeed; to grope with symptoms instead of causes, to stumble into supposed remedies that have no chance of working.
Socioeconomic status (SES)
black and white differences and
in income, 329-325
in IQ, 286288
college graduates and, 151-153
crime and, 248-250
divorce probability and, 174-1 75
educational attainment: see Educa-
tional attainment
employment problems and, 158-166
ethnic differences in, 274-275
illegitimacy and, 182-183, 186,
188-189
low-birth-weight infants and, 215,216
marriage and, 112, 172-174
parenting and, 205-210,222-223,
229-232.230-232
political socialization of children and,
257
poverty and, 130-137,139-142,
218-220
school dropouts and, 147-151
voting behavior and, 258-259
welfare dependency and, 195-201
Socioeconomic stratification
educational stratification and, 30
heritability of IQ and, 105-1 10
Hemstein's syllogism and, 10, 105,
108-110
residential segregation and, 104-105
Sowell, Thomas, 363,430
Spearman, Charles, 2-4, 14, 15
Spearman's hypothesis, 301-304,631,
636
Spuhler, J. N., 310
Standard deviations
computation of, 555-556
defined, 44,557-558
normal distribution and, 44, 557-558
Standard scores, 556
Stanford-Binet IQ test, 5, 7, 290,308
Statistics, 553-567
correlation coefficient, 2-3,6749,
561-564
dependent variable, 122
factor analysis, 3-4, 18-19,680-683
frequency distributions, 553-555
independent variable, 122
median overlap, 4849
meta-analysis, 7 1-73
normal distribution, 44, 556-558
regression analysis: see Regression
analysis
regression to the mean, 357
restriction of range, 68-69
standard deviations: see Standard devi-
ations
validity, 72-75,81,8+-87
Sternberg, Robert, 16, 17
Stevenson, Harold, 274,300,437
Sutherland, Edwin, 241
System of Multicultural Pluralistic As-
sessment (SOMPA), 304-306
TALENT, 1 18-1 19, 146,423
Teacher competency examinations,
493-494
Terman, Lewis, 5, 7,57, 162
Test bias, 12,280-286,625-637
external evidence of, 280-281,
483484,625630
internal evidence of, 281-282
item bias, 630-633
situational
coaching, 633-635
examiner bias, 635
language difficulties, 282, 636,
637
motivation to try, 282-284
practice effects, 633-63 5
test anxiety, 635
"uniform background," 285-286
Test validity: see Validity, test
Thurstone, Louis, 15
Transracial adoption study, 309-3 10
Underclass
attitudes of cognitive elite toward,
521,523
custodial state scenario and, 523-526
spatial concentration and, 522, 524
white, emerging, 520-52 1
Unemployment, 163-1 65
educational attainment and, 164-165
ethnic differences in, 327-329
low-IQ prevalence and, 374375
socioeconomic status vs. 1Q and,
163-165
Uniform Guidelines on Employee Selec-
tion Procedures, 485, 486, 490,
660-662
University of California at Berkeley, 43,
453-455
Un~versity of Virginia, 453-454
Validity, test
job productivity and, 72-75,81,
8447,658,660,661
test hias and, 280-281,483484,
625-630
Valued places in society, 535-540
Van Court, Marian, 347
Variahles, 122
Verha, Sidney, 259, 260
Verhal skills, 300-301, 422423.
425429,43 1,433,443
Vernon, Philip, 15, 273, 300-301
Vincent, Ken, 290
Vining, Daniel, Jr., 347
Voss, Harwin, 250
Voting behavior, 255, 258-263
educational attainment and, 259-261
1Q and, 261-262
socioeconomic status and, 258-259
Wages: see Income
Wards Cove Packing Co . , Inc , v. Atonio
( 1989), 666467
Washington, George, 53 1
Wechsler, David, 6-7
Wechsler Adult Intelligence Scale
(WAIS), 7,151-152,290
Wechsler Intelligence Scale for Children
(WISC), 7,275,302,303
Weikart, David, 404
Weinberg, Richard, 309-3 10
Welfare dependency, 191-201
child abuse and, 209
chronic, 194, 196-199
by cognitive class, 193-195
developmental problems and, 229
educat~onal attainment and, 193,
196-197,198-199
ethnic differences in, 33 1-332
home environment for child develop-
ment and, 223-224
illegitimacy and, 186-187, 188-190
low-IQ prevalence and, 376-377
probabilities after birth of first child,
195-196
socioeconomic status and, 195-201
trends in, 192-193
Westinghouse Science Talent Search,
42-43
White, T. H., 532-533
Wilson, James Q., 543
Wilson, William Julius, 522
Wolfinger, Raymond, 258, 259
Wonderlic Personnel Test, 504
Young, Leontine, 213
"This book is about differences in intellectual capacity
among people and groups, and what those differences
mkan for ~merica's future. The relationships we will
be discussing are among the most sensitive in contem-
porary America-so
sensitive that hardly anyone writes
or talks about them in public. It is not for lack of infor-
mation, as you will see."
66 To try to come to grips with the nation's problems
without understanding the role of intelligence is to see
through a glass darkly indeed; to grope with symptoms
instead of causes, to stumble into supposed remedies that
have no chance of working."
"We are not indifferent to the ways in which this book;
wrongly construed, might do harm. We have worried
about them from the day we set to work. But there can
be no red progress in solving America's social problems
when they are as misperceived as they are today. What
good can come of understanding the relationship of
intelligence to social structure and public policy? Little
good can come without it."
CURRENT AFFAIRS
The Necessity of Good
- The text concludes with a philosophical assertion regarding the origin of good.
- It suggests that certain conditions or actions are prerequisite for positive outcomes.
- The brevity of the statement emphasizes a moral or ethical absolute.
- The inclusion of 'CURRENT AFFAIRS' suggests this philosophical stance is being applied to modern societal issues.
good can come without it.
good can come without it."
CURRENT AFFAIRS
Intelligence and Class Structure
- The authors argue that cognitive ability has become the primary determinant of success, status, and financial security in modern American life.
- A new class structure is emerging, led by a "cognitive elite" while those with lower intelligence are increasingly marginalized from the information economy.
But despite decades of fashionable denial, the overriding and insistent truth about intellectual ability is that it is endowed unequally, for reasons that government policies can do little to change.
The Bell Curve Front Matter
- An introductory quote by Edmund Burke argues against suppressing truth for fear of social consequences, setting a provocative tone for the work.
- The table of contents outlines a four-part structure focused on the emergence of a cognitive elite and the relationship between intelligence and social behavior.
They argue against a fair Discussion of popular Prejudices, because, say they, tho' they would be found without any reasonable Support, yet the Discovery might be productive of the most dangerous Consequences.
Intelligence and Public Policy
- The authors acknowledge that the topic is often avoided due to fears of promoting racism or recalling historical totalitarian eugenic schemes.
- A central premise is that despite the triumph of equal rights, a cognitive elite is emerging and flourishing while others stagnate.
The relationships we will be discussing are among the most sensitive in contemporary America—so sensitive that hardly anyone writes or talks about them in public.
The Discovery of g
- Spearman proposed the existence of "g," a general intelligence factor that serves as a unitary mental trait underlying all cognitive tasks.
- This statistical approach, known as factor analysis, shifted the focus from specific learning abilities to a broader measure of intellectual capacity.
It turned out to be nearly impossible to devise items that plausibly measured some cognitive skill and were not positively correlated with other items that plausibly measured some cognitive skill, however disparate the pair of skills might appear to be.
The Jensen Controversy
- Arthur Jensen's 1969 article argued that compensatory education programs failed because they targeted populations with lower average IQs, which he claimed had a genetic basis.
- The public and academic reaction to Jensen was explosive, leading to riots and comparisons of his work to national disasters like Vietnam and Watergate.
During the first few years after the Harvard Educational Review article was published, Jensen could appear in no public forum in the United States without triggering something perilously close to a riot.
Theories of Intellectual Structure
- Despite diverse theories, researchers consistently find a large general factor of ability, known as Spearman's g, in all standardized testing.
- Classicists argue that modern IQ tests effectively measure g and are not biased against specific socioeconomic or ethnic subgroups.
Piaget discovered quickly that he was less interested in how well the children did than in what errors they made.
Gardner and the Classical Tradition
- Gardner's theory is considered radical because it rejects the concept of a general intelligence factor (g) in favor of seven distinct intelligences.
- The authors of this book declare their alignment with the classical tradition, citing its rigorous quantitative evidence and relevance to public policy.
If critics were willing to label language and logical thinking as talents as well, and to remove these from the pedestal they currently occupy, then I would be happy to speak of multiple talents.
The Classical View of Intelligence
- These conclusions assert that a general factor of cognitive ability exists, is measurable by IQ tests, remains relatively stable, and is substantially heritable.
- A significant gap exists between scientific consensus and media perception, which often contradicts these six foundational points.
But at least we hope that it will help you think of intelligence as just a noun, not an accolade.
The Rise of Cognitive Stratification
- The 20th century transitioned from social classes defined by hereditary rank and wealth to a system increasingly dominated by cognitive ability.
- Modern societies have become highly efficient at identifying the brightest youths and funneling them into lucrative, influential career paths.
Social class remains the vehicle of social life, but intelligence now pulls the train.
The Rise of Cognitive Sorting
In 1900, only about 2 percent of 23-year-olds got college degrees. Even if all of the 2 percent who went to college had IQs of 115 and above (and they did not), seven out of eight of the brightest 23-year-olds in the America of 1900 would have been without college degrees.
The Rise of Cognitive Sorting
At mid-century America abruptly becomes more efficient in getting the top students to college.
The Rise of Cognitive Sorting
- The college system acts as a "weeding" mechanism, where students with lower test scores may enter college but rarely complete a bachelor's degree.
- This educational partitioning has effectively created a "cognitive elite" by ensuring the most able youths are concentrated within the ranks of college graduates.
The line for students completing the B.A. shows an even more efficient sorting process.
The Rise of Cognitive Sorting
The valedictorian in Kalamazoo and the Kansas farm girl with an IQ of 140 might not even be going to college at all.
The Rise of Cognitive Stratification
What led the nation's most able college age youth (and their parents) to begin deciding so abruptly that State U. was no longer good enough?
The Rise of Cognitive Screens
Instead of the old screen-woven of class, religion, region, and old school ties-the new screen was cognitive ability, and its mesh was already exceeding fine.
The Rise of Cognitive Partitioning
- A small group of fifty schools accounts for only five percent of freshmen but captures sixty percent of students with top-tier SAT scores.
- The top ten universities alone enroll nearly one-third of all students nationwide who score in the 700s on the SAT-Verbal.
The degree of partitioning off of the top students as of the early 1990s has reached startling proportions.
The Language of Standard Deviation
Suppose you are told that a horse is sixteen hands tall and a snake is quarter of a rod long. Not many people can tell you from that information how the height of the horse compares to the length of the snake.
The Rise of Cognitive Partitioning
Most readers of this book are in preposterously unlikely groups, and this reflects the degree of partitioning that has already occurred.
The Great Cognitive Partitioning
- Social circles that were once defined by class or education have shifted to being defined by narrow ranges of high IQ.
- For those at elite universities, the cognitive overlap with the general population approaches zero, creating a distorted view of the world.
This profound isolation from other parts of the IQ distribution probably dulls our awareness of how unrepresentative our circle actually is.
IQ and Occupational Status
- Childhood IQ scores are as predictive of adult job status as IQ tests taken later in life, suggesting a stable underlying trait.
- A Danish adoption study revealed that biological siblings raised apart show more similar job status than adoptive siblings raised together.
The biologically related siblings resembled each other in job status, even though they grew up in different homes.
The Rise of Cognitive Stratification
In 1900, the number of jobs in the high-IQ professions soaked up only about one out of twenty of these talented people. By 1990, they soaked up almost five times as many, or one out of four.
The Rise of Cognitive Segregation
But after 1940, the trickle swelled to a flood, shown by the nonlinear upward sweep of the proportion in the top IQ decile who have more recently gone to work in this limited number of jobs.
The Rise of Cognitive Meritocracy
Many had reached their eminent positions only because they did not have to compete against more able people who were excluded from the competition for lack of the right religion, skin color, national origin, or family connections.
Intelligence and Job Performance
- High IQ correlates with increased productivity across all job types, from skilled professions like law to manual labor.
- General intelligence (g) is a more accurate predictor of job proficiency than specific aptitude tests or traditional hiring metrics like interviews and transcripts.
Laws can make the economy less efficient by forbidding employers to rue intelligence tests, but laws cannot make intelligence unimportant.
Understanding the Correlation Coefficient
Witness the prosperity of casinos despite the statistically modest edge they hold over their customers.
The Restriction of Range
Should we then approach the head coaches of the NFL and recommend that they try out a superbly talented 150.pound athlete at offensive tackle?
Intelligence and Job Performance
- The correlation between cognitive ability and job productivity, known as validity, averages approximately .4 across various industries.
- Higher job complexity generally results in a stronger correlation between intelligence and performance, with managerial roles showing a validity of .53.
In restaurants, there are better and worse dishwashers, better and worse busboys.
Cognitive Ability and Job Performance
- The military maintains an unparalleled database linking intelligence test scores (AFQT) to training success across diverse job specialties.
- Even in physically demanding roles like combat, cognitive ability remains a substantial predictor of success with a validity of .45.
Even the lowest-validity school, combat, in which training success is heavily dependent on physical skills, the validity was still a substantial .45.
The Dominance of General Intelligence
The explanatory power of g was almost thirty times greater than of all other cognitive factors in ASVAB combined.
The Predictive Power of G
- General intelligence (g) consistently serves as the most effective single predictor of job performance across both military and civilian sectors.
- Surprisingly, general intelligence tests often predict future job performance more accurately than tests designed to mimic specific job tasks.
The point is one that should draw broad agreement from readers who have held menial jobs: Given the other necessary qualities of diligence and good spirits, intelligence helps.
Intelligence Versus Job Experience
The ploaded items, on the other hand, will reveal whether the applicant will ever become the kind of busboy who will clear table 12 before he clears table 20 because he relates the needed task to something that happened twenty minutes earlier regarding table 15.
Intelligence and Job Productivity
- Long-term studies show that the performance gap between high and low intelligence workers often persists for decades rather than converging over time.
- The job interview, despite being the most trusted method for many employers, has a very low validity rating of only .14.
The method that many people intuitively expect to be the most accurate, the job interview, has a poor record as a predictor of job performance, with a validity of only .14.
The Economic Value of Intelligence Testing
But the value to the employer of hiring brighter dentists is forty times greater than the value of hiring comparably brighter receptionists.
The Economic Pressure to Partition
- High-stakes industries like law and investment banking utilize extreme selection ratios, sometimes hiring only one in several hundred applicants.
- The economic value of output in top-tier firms is so high that marginal gains in cognitive ability translate into massive financial returns.
The dollar value of output is so high that the difference between a new hiree who is two standard deviations above the mean and one who is four standard deviations above the mean on any given predictor measure can mean a huge economic difference.
Steeper Ladders, Narrower Gates
The irony is that as America equalizes the circumstances of people's lives, the remaining differences in intelligence are increasingly determined by differences in genes.
The Rising Value of Intelligence
Cognitive stratification as a central social process is something genuinely new under the sun.
Education and Wage Inequality
- From 1963 to 1987, the highest-earning American male workers saw a 40 percent wage increase while low-end wages remained static.
- The 1980s marked a sharp reversal of 1970s trends, with real wages climbing for the college-educated and falling for those with high school diplomas or less.
The job market reevaluated schooling during the past two decades: Educated workers, having been devalued in the 1970s, became increasingly valuable in the 1980s, in comparison with less educated workers.
The Mysterious Wage Residual
- Statistical analysis of wage variation reveals a "residual" factor beyond education, gender, and experience that drives income disparity.
- The authors argue that cognitive ability is a primary component of this X factor, commanding an increasing wage premium.
The job market for people lacking the residual characteristics declined, while expanding for people having them.
The Value of Complexity
- As society becomes more complex, the economic value of intelligence grows, creating a "cognitive elite" that thrives on managing this complexity.
- High-IQ occupations, including engineering, medicine, and law, consistently occupy the highest tiers of the American wage distribution.
The more complex a society becomes, the more valuable are the people who are especially good at dealing with complexity.
Geography of Cognitive Sorting
The executives do not spend much time with the janitors or the data entry clerks. They spend almost all their time interacting with other executives or with technical specialists, which means with people drawn from the upper portion of the ability distribution.
The Heritability of IQ
- Heritability measures the relative contribution of genes to the variation of a trait within a specific population rather than an individual.
- Modern studies of identical twins reared apart suggest that the heritability of general intelligence may be as high as .75 to .80.
It is the central irony of egalitarianism: Uniformity in society makes the members of families more similar to each other and members of different families more different.
The Genetic Lottery and Assortative Mating
- Equalizing environmental opportunities paradoxically increases the relative importance of genetic inheritance in determining IQ variation.
- Assortative mating is particularly strong regarding cognitive ability, reinforcing the emergence of a distinct cognitive elite.
In this sense, luck continues to matter in life's outcomes, hut now it is more a matter of the IQ handed out in life's lottery than anything else about circumstances.
Intelligence and Social Behavior
- The authors argue that cognitive ability is significantly linked to America's most pressing social problems.
- While IQ is a poor predictor of individual behavior, accounting for less than 20 percent of variance, it reveals large behavioral differences between groups.
It is not that cognitive ability has been considered and found inconsequential but that it has barely been considered at all.
The NLSY Data Mother Lode
But the mother lode for scholars who wish to understand the relationship of cognitive ability to social and economic outcomes is the NLSY.
Defining the Cognitive Classes
- The authors divide the population into five distinct cognitive classes based on IQ percentiles, with Class I as the "cognitive elite" and Class V as the bottom 5 percent.
- The authors suggest that the typical reader's social circle is likely composed almost entirely of Class I individuals, creating a skewed perception of the general population's intelligence.
In all likelihood, almost all of your friends and professional associates belong in that top Class I slice.
Intelligence and the Poverty Trap
- Statistical analysis reveals that low intelligence is a significantly stronger predictor of poverty than low socioeconomic background.
- A youth of average intelligence born into extreme poverty has a 90 percent chance of escaping it by their early 30s, whereas a youth with low intelligence from a middle-class home faces a higher poverty risk.
If you have to choose, is it better to be born smart or rich? The answer is unequivocally "smart."
The Changing Nature of Poverty
To rephrase the dialogue between F. Scott Fitzgerald and Ernest Hemingway, the poor were different from you and me: They had less money.
IQ Stability and Poverty Origins
The AFQT test scores for the NLSY sample were obtained when the subjects were 15 to 23 years of age, and their IQ scores were already as deeply rooted a fact about them as their height.
IQ, SES, and Poverty Risk
Despite coming from that solid background, his odds of being in poverty are 26 percent, more than twice as great as the odds facing the person from a deprived home but with average intelligence.
IQ, Marriage, and Child Poverty
- Single motherhood is identified as a primary driver of child poverty, with poverty rates for single-mother households consistently exceeding 30 percent since 1959.
- Marriage acts as a powerful economic buffer, significantly reducing the risk of poverty even for women with below-average cognitive ability.
The equation is brutally simple: The higher the proportion of children who live in households headed hy single women, then, ceteris paribus, the higher the proportion of children who will live in poverty.
IQ vs Socioeconomic Background
The conclusion is that no matter how rich and well educated the parents of the mother might have been, a separated, divorced, or never-married white woman with children and an average IQ was still looking at nearly a 30 percent chance of being below the poverty line.
The Evolution of School Failure
The very concept of school failure is a modern invention.
The Widening IQ Gap
- As high school diplomas became the societal norm, dropouts became increasingly self-selected for lower cognitive ability.
- By 1960, the IQ gap between graduates and dropouts had widened to approximately sixteen points, or one standard deviation.
As the high school diploma became the norm, the dropouts were likely to become more self-selected for low IQ, and so indeed it transpired.
IQ, Class, and College Attainment
The differences between GED graduates and those with regular diplomas are too great to justify grouping them together.
Cognitive Ability and Social Outcomes
But while socioeconomic privilege can help if the youngster is reasonably bright, there are limits to what it can do if he is not.
Cognitive Ability and Labor Dropout
Given equal age and IQ, a young man from a family with high socioeconomic status was more likely to spend time out of the labor force than the young man from a family with low socioeconomic status.
Intelligence and Labor Force Participation
The evidence in the NLSY regarding the seriousness of the ailments, whether a doctor has been consulted, and their duration raises questions about whether the self-reported disability data have the same meaning.
IQ and Labor Force Stability
Condescension toward these men is not in order, nor are glib assumptions that those who are cognitively disadvantaged cannot be productive citizens.
Intelligence and Family Structure
- The decline of the traditional family is not uniform across society but is heavily concentrated among those with lower cognitive ability and less education.
- Illegitimacy is strongly linked to cognitive ability, with women in the bottom 5 percent of intelligence being six times more likely to have an illegitimate first child than those in the top 5 percent.
Rumors of the death of the traditional family have much truth in them for some parts of white American society—those with low cognitive ability and little education.
Cognitive Ability and Marital Stability
For them, the probability of divorce in the first five years plunged from 28 percent for someone with an IQ of 100 to 9 percent for someone with an IQ of 130.
The Illegitimacy Revolution
No matter what the culture might be, 'there runs the rule that the father is indispensable for the full sociological status of the child as well as of the mother, that the group consisting of a woman and her offspring is sociologically incomplete and illegitimate.'
Intelligence and Illegitimacy
- A causal model is proposed where higher intelligence leads to deliberate family planning, while lower intelligence may correlate with impulsiveness and a lack of foresight regarding procreation.
- Statistical data presented shows a stark disparity: only 2% of "Very bright" white women had an illegitimate child compared to 32% of "Very dull" women.
The less intelligent the woman is, the more likely that she does not think ahead from sex to procreation, does not remember to use birth control, does not carefully consider when and under what circumstances she should have a child.
Cognitive Ability and Welfare Dependency
- Statistical analysis of the NLSY suggests a strong correlation between low cognitive ability and the likelihood of receiving welfare after a first child.
- The original intent of AFDC was to support widows, but the program's scope unexpectedly expanded to include abandoned and never-married women.
It came as a distressing surprise to Frances Perkins, the first woman cabinet member and a primary sponsor of the legislation, to find that they were.
Intelligence and Parental Competence
- Research indicates that IQ often explains parenting differences previously attributed to socioeconomic status or education levels.
- Low maternal IQ in the NLSY sample correlates with negative outcomes including low birth weight and poor motor or social development in toddlers.
The disquieting finding is that the worst environments for raising children, of the kind that not even the most resilient children can easily overcome, are concentrated in the homes in which the mothers are at the low end of the intelligence distribution.
Social Class and Malparenting
- Neglect is significantly more common than abuse, occurring at ratios between three to one and ten to one.
- While extreme abuse can occur randomly across all demographics due to parental derangement, most malparenting is heavily concentrated in lower socioeconomic classes.
Abuse is typically episodic and of short duration; neglect is chronic and continual.
Maternal Intelligence and Infant Health
- Higher maternal intelligence and education levels were strongly correlated with a significant decrease in smoking during pregnancy, even when controlling for socioeconomic status.
- Statistical analysis suggests that a mother's IQ plays a more significant role in determining the probability of a low-birth-weight baby than her socioeconomic background.
The failure of scholars and policymakers alike to look at the role of low intelligence in malparenting may properly be called scandalous.
IQ and Infant Health Outcomes
It takes more than love to childproof a house effectively; it also takes knowledge and foresight.
Cognitive Ability and Childhood Poverty
A child born to a white mother who was living under the poverty line but was of average intelligence had almost a 49 percent chance of living his first three years in poverty.
IQ and Intergenerational Outcomes
- Children's cognitive ability, measured by the Peabody Picture Vocabulary Test (PPVT), tends to closely mirror the IQ of their mothers.
- A one standard deviation increase in maternal IQ results in a 6.3 point gain for the child, compared to only a 1.7 point gain for a similar increase in socioeconomic status.
The provocative finding was that among those 29, 5 were children of women in Class I (10 percent of the 50 such children tested).
Intelligence and Criminal Behavior
- The correlation between low cognitive ability and criminality remains significant even when controlling for socioeconomic status.
- High intelligence acts as a protective factor, reducing the likelihood of criminal behavior in individuals from high-risk backgrounds.
The first casualty is not just freedom hut the honds that make community life attractive.
Intelligence and Criminal Behavior
- Cognitive deficits like a lack of foresight can make the immediate gains of crime more attractive while rendering future punishments abstract and meaningless.
- Low intelligence may lead to crime as an alternative route to status and income when traditional job markets are inaccessible.
To a person of low intelligence, the threats of apprehension and prison may fade to meaninglessness. They are too abstract, too far in the future, too uncertain.
IQ and Criminal Justice Involvement
- Data from the NLSY shows a strong inverse correlation between cognitive class and the likelihood of being stopped, booked, or convicted.
- The odds of a white male being interviewed in a correctional facility are fourteen times higher for those in the bottom IQ quartile compared to the top quartile.
Close to a standard deviation separated those who had never been stopped by the police from those who went to prison.
IQ, Socioeconomics, and Criminality
The youngster who commits assaults on the street probahly gets in fights on the school grounds; the youngster who is undeterred by the prospect of jail time probably is not much motivated by the prospect of getting a high school degree.
Cognitive Ability and Civic Life
Lacking this quality--civility, in its core meaning--a society must replace freedom with coercion if it is to maintain order.
Intelligence and Civil Society
- Educational level, rather than socioeconomic status or income, is the primary predictor of political involvement and voting behavior.
- Civility is defined not as mere politeness, but as an allegiance to the social order that allows a free society to function without heavy state constraint.
Civility is not obedience but rather 'allegiance' and 'deference'—words with old and honorable meanings that are now largely lost.
IQ and Middle-Class Values
- The authors introduce the Middle Class Values (MCV) Index to measure social cohesion through behaviors like educational attainment and marital stability.
- The MCV Index defines "doing everything right" as staying in the labor force, avoiding crime, and confining childbearing to marriage.
Many academic intellectuals hold middle-class values in contempt.
Intelligence and Middle Class Values
It is this population that forms the spine of the typical American community, filling the seats at the PTA meetings and the pews at church, organizing the Rotary Club fund-raiser, coaching the Little League team, or circulating a petition to put a stop light at a dangerous intersection.
Ethnic Differences in Cognitive Ability
- Data suggests that East Asians typically score higher on intelligence tests than white Americans, particularly in nonverbal intelligence.
- A consistent gap of approximately one standard deviation in IQ scores has been observed between African-Americans and European-Americans for several decades.
Despite the forbidding air that envelops the topic, ethnic differences in cognitive ability are neither surprising nor in doubt.
Group Differences in Cognitive Ability
These tests results are matched by analyses of occupational and scientific attainment by Jews, which consistently show their disproportionate level of success, usually by orders of magnitude, in various inventories of scientific and artistic achievement.
Black-White Cognitive Test Differences
- A meta-analysis of 156 studies conducted between 1918 and 1990 shows a mean difference of approximately 1.08 standard deviations, or 16 IQ points.
- Applying stricter criteria—such as excluding Southern states or focusing on post-1960 data—does not significantly diminish the observed statistical gap.
Since hlack-white differences are the ones that strain discourse most severely, we will probe deeply into the evidence and its meaning.
Quantifying Ethnic IQ Differences
To the extent that the difference represents an authentic difference in cognitive functioning, the social consequences are potentially huge as well.
Predictive and Internal Bias
How would a black youngster from the inner city ever have heard of a regatta?
Cultural Content and Test Bias
- The hypothesis that racial score gaps are caused by culturally specific questions is contradicted by empirical data.
- Counterintuitively, the gap between black and white scores is often wider on culturally neutral items than on culturally loaded ones.
The B/W difference is wider on items that appear to be culturally neutral than on items that appear to be culturally loaded.
Socioeconomic Status and IQ Gaps
- Statistical analysis shows that controlling for socioeconomic status (SES) reduces the black/white IQ gap by approximately 37 percent.
- Empirical data contradicts the hypothesis that the IQ gap should diminish as black families move up the socioeconomic ladder.
The trouble is that socioeconomic status is also a result of cognitive ability, as people of high and low cognitive ability move to correspondingly high and low places in the socioeconomic continuum.
Narrowing the Cognitive Gap
- Data from the NAEP and SAT show a significant narrowing of the black-white test score gap between the 1960s and early 1990s.
- Environmental factors are cited as the primary cause for this shift, as genetic changes do not occur within a twenty-year timeframe.
In a period as short as twenty years, environmental changes are likely to provide the main reason for the narrowing racial gap in scores.
Spearman's Hypothesis and Ethnic Differences
- Spearman's hypothesis suggests that the magnitude of the black-white difference is positively correlated with a test's "g" loading, or its measure of general intelligence.
- The confirmation of Spearman's hypothesis challenges environmentalist critiques by suggesting that the more "accurate" a mental test is, the larger the observed ethnic gap becomes.
Spearman's hypothesis says in effect that as mental measurement focuses most specifically and reliably on g, the observed black-white mean difference in cognitive ability gets larger.
Cultural and Environmental IQ Factors
- Castelike minorities, such as black Americans or the Buraku in Japan, often face systemic social barriers that impact educational achievement regardless of race.
- The "Flynn effect" describes a worldwide phenomenon where IQ scores consistently rise over time, necessitating more difficult restandardization of tests.
Ogbu argues that the differences in test scores are an outcome of this historical distinction, pointing to a number of castes around the world—the untouchables in India, the Buraku in Japan, and Oriental Jews in Israel—that have exhibited comparable problems in educational achievement despite being of the same racial group as the majority.
Racial IQ and Adoption Studies
- The Minnesota transracial adoption study showed that IQ scores for adopted children followed a racial ordering, with children of two black parents scoring lower than those with mixed or white parentage.
- A ten-year follow-up during the children's adolescence revealed that the IQ gap between adopted black and white children remained at seventeen points, mirroring national averages.
The bottom line is that the gap between the adopted children with two black parents and the adopted children with two white parents was seventeen points, in line with the B/W difference customarily observed.
Ethnic Inequalities and IQ
- The text asserts that IQ tests are valid across different ethnic groups and that cognitive ability distributions vary among whites, blacks, and East Asians.
- For black Americans, controlling for IQ reverses some success indicators; higher numbers of blacks than whites graduate college and enter professions when cognitive ability is equalized.
On two vitul indicators of success--educational attainment and entry into prestigious occupations-the black-white discrepancy reverses.
Ethnic Differences and Cognitive Ability
In some cases, large ethnic differences disappear altogether, or even reverse, with whites having the disadvantageous outcome compared to blacks and Latinos.
IQ and Ethnic Educational Attainment
- When controlling for an average college graduate IQ of 114, the probability of having a degree rises to 68% for blacks, significantly higher than whites (50%) and Latinos (49%).
- In professions such as medicine, the actual ratio of black to white doctors is roughly six times higher than it would be if selection were based strictly on race-blind cognitive ability scores.
After taking IQ into account, blacks have a better record of earning college degrees than either whites or Latinos.
IQ and Ethnic Economic Disparities
After controlling for IQ, the average black made 98 percent of the white wage.
IQ and Wage Disparities
- When IQ is introduced as a control variable, the black-white wage gap shrinks dramatically, with black wages rising to 98 percent of white wages on average.
- In specific sectors like clerical and service work, controlling for IQ actually results in a wage premium for black workers over their white counterparts.
And yet controlling just for IQ, ignoring both education and socioeconomic background, raises the average black wage to 98 percent of the white wage and reduces the dollar gap in annual earnings from wages for year-round workers to less than $600.
IQ and Ethnic Economic Disparities
Controlling for age, IQ, and gender (ignoring education and parental SES), the average wage for year-round black workers in the NLSY sample was 101 percent of the average white wage.
IQ and Ethnic Labor Disparities
With the facts in hand, we cannot distinguish between the role of the usual historical factors that people discuss and the possibility of ethnic differences in whatever other personal attributes besides IQ determine a person's ability to do well in the job market.
Ethnic Disparities in Family Structure
- Controlling for cognitive ability (IQ) reduces the Latino-white gap in illegitimacy significantly but only narrows the black-white gap by 20 percent.
- The disparity in out-of-wedlock births persists regardless of variables like poverty, education, or coming from a broken home.
For reasons that are yet to be fully understood, black America has taken a markedly different stance toward marriage than white and Latino America.
IQ and Ethnic Welfare Disparities
- Adjusting for IQ reduces the black-white welfare gap by half and the Latino-white gap by 84 percent among the general female population.
- In the context of infant health, adjusting for maternal IQ reduces the black-white disparity in low-birth-weight babies by approximately 50 percent.
These data, like those on illegitimacy and marriage, lend support to the suggestion that blacks differ from whites or Latinos in their likelihood of being on welfare for reasons that transcend both poverty and IQ.
IQ and Ethnic Disparities
- Incarceration rates for black men are over five times higher than for white men in the sample, but this gap shrinks by nearly three-quarters when cognitive ability is controlled.
- The Middle Class Values (MCV) Index is introduced as a metric for "solid citizenship," tracking marriage stability, labor force participation, and legal status.
This large black-white difference was reduced by almost three-quarters when IQ was taken into account.
The Demography of Intelligence
- In modern Western societies, declines in fertility occur disproportionately among educated and high-status women.
- The negative correlation between fertility and educational status is a consistent demographic pattern observed across various modern cultures.
Were those huddled masses bringing to our shores a biological inheritance inconsistent with the American way of life?
The Rise and Fall of Dysgenic Optimism
- Recent findings by Van Court and Bean suggest a continuous dysgenic effect in the United States since the early 20th century, with childless individuals actually possessing slightly higher IQs.
- Modern data from the mid-1980s indicates a measurable decline in average intelligence, estimated at approximately 0.8 IQ points per generation.
The optimism proved to be ephemeral. As scholars examined new data and reexamined the original analyses, they found that the optimistic results turned on factors that were ill understood or Ignored at the time the studies were published.
Demography and Ethnic Fertility Gaps
- A significant demographic divergence exists because a much higher percentage of black and Latino women in the study fall into lower IQ cohorts compared to white women.
- The tendency of high-IQ, college-educated women to delay childbirth is most pronounced among whites, potentially widening the cognitive gap in future generations.
On the face of it, the discrepancies are so dramatically large that the probability of further divergence seems substantial.
Immigration and Cognitive Demographics
- Immigration accounted for nearly 30 percent of the U.S. population increase in the 1980s, representing a major lever for shaping national demographics.
- Using estimated mean IQ scores for different ethnic groups, the authors calculate that the average IQ of legal immigrants in the 1980s was approximately 95.
There are few, if any, other domains where public policy could so directly mold the cognitive shape of things to come.
The Impact of Shifting IQ
- Small shifts in the mean IQ of a population result in disproportionately large changes in the size of the distribution's tails.
- A three-point drop in mean IQ could reduce the number of high-IQ individuals by over 40 percent while increasing the low-IQ population by nearly 70 percent.
Three points in lQ seem to he nothing (and indeed, they are nothing in terms of understanding an individual's ability), hut a population with an IQ mean that has slipped three points is likely to be importantly worse off.
The Demography of Intelligence
- Small shifts in the mean IQ of a population, such as a move from 97 to 103, correlate with significant swings in the prevalence of social problems.
- A higher mean IQ in the sample results in a 43 percent reduction in high school dropouts and a 36 percent reduction in poverty rates.
Our purpose has been to point out that the stakes are large and that continuing to pretend that there's nothing worth thinking about is as reckless as it is foolish.
Cognitive Ability and Poverty
- Statistical analysis reveals a strong correlation between low IQ scores and poverty, with 48 percent of the poor originating from the bottom 20 percent of the intelligence distribution.
- High school dropouts show an even more extreme cognitive skew, with 94 percent of permanent dropouts possessing below-average IQ scores.
The figure tells us forcefully that poverty is concentrated among those with low cognitive ability.
Cognitive Ability and Family Structure
- The bottom 50 percent of the cognitive ability distribution accounts for 82 percent of all children living in single-parent homes as of 1990.
- Home environments characterized by low emotional support and cognitive stimulation are heavily concentrated among mothers in the bottom two IQ deciles.
The prevailing notion that separation and divorce are so endemic that they affect everyone more or less equally is wrong as regards cognitive ability, at least in this age group.
Raising Cognitive Ability
- The authors explore whether cognitive stratification can be mitigated by raising intelligence through environmental interventions.
- Despite the theoretical potential for environmental influence, the history of raising intelligence is characterized by flamboyant claims and disappointing results.
Taken together, the story of attempts to raise intelligence is one of high hopes, flamboyant claims, and disappointing results.
The Coleman Report Findings
- The 1966 Coleman report found that objective factors like school funding and teacher credentials had little impact on cognitive differences.
- By 1964, American schools had achieved enough equalization that further "bricks-and-mortar" improvements yielded diminishing returns.
The Coleman report did not prove that educational reform is always futile, but that, on the whole, America had already achieved enough objective equalization in its schools by 1964 so that it was hard to pick up any effects of unequal school quality.
The Limits of SAT Coaching
- Research by Messick and Jungeblut shows that 300 hours of intensive study yields only about 70 points on the combined SAT, demonstrating significant diminishing returns.
- Evidence suggests that raising intelligence among school-age children consistently and affordably remains an unattainable goal with current methods.
The tales may even be true, but they need to be averaged with the tales that don't get told about the scores that improve by only a few points—and the scores that drop.
Head Start and IQ Fade-out
- Project Head Start was launched in 1965 as a central component of the War on Poverty, aiming to break the poverty cycle through preschool education and family services.
- The "fade-out" effect describes the consistent finding that cognitive gains from Head Start typically vanish by the third or sixth grade.
These findings conformed with the intuitive notion that, in the poet's words, 'as the twig is bent the tree's inclined.'
The Preschool Fadeout Effect
- The Perry Preschool Program, frequently cited as a success, utilized a high teacher-to-child ratio and master's-level staff that far exceeded standard program resources.
- A consortium of eleven high-quality preschool studies confirmed that while early education provides an immediate cognitive boost, the effect on intelligence is not permanent.
Perry Preschool resembled the average Head Start program as a Ferrari resembles the family sedan.
Intensive Interventions and the Abecedarian Project
- The Carolina Abecedarian Project represents the "apotheosis" of the day care approach, providing intensive care from one month of age through age five.
- Results showed significant long-term benefits, including a 50% reduction in grade repetition and fewer children scoring below an IQ of 85.
The Abecedarian Project is the apotheosis of the day care approach.
Environment and Adopted Intelligence
- Adopted children generally score seven to ten IQ points lower than the biological children of their adoptive parents, though the cause remains debated between genetics and early-life trauma.
- Despite the gap with biological siblings, adoption into higher socioeconomic homes typically raises a child's IQ by an estimated average of six points compared to staying with biological parents.
They seem unable to become fully human despite heroic efforts to restore them to society.
Interventions for Disadvantaged Children
- Adoption at birth from a poor environment to a stable one is identified as a highly effective and inexpensive way to improve cognitive and noncognitive outcomes.
- The authors advocate for a return to social norms where adoption was a more common outcome for children born into high-risk situations.
But let it be said plainly: Anyone seeking an inexpensive way to do some good for an expandable number of the most disadvantaged infants should look at adoption.
Trends in American Educational Achievement
The improvement has been substantial—on the order of half a standard deviation since the mid-1970s, and about .2 standard deviation above the previous high in 1965.
The Great SAT Decline
- National SAT scores experienced a significant drop between 1963 and 1976, losing nearly half a standard deviation in Verbal and a third in Math.
- Analysis shows that during the period of sharpest decline, the pool of white test-takers was actually shrinking and likely becoming more socioeconomically exclusive.
We are left with compelling evidence of a genuine decline in the intellectual resources of our brightest youngsters.
The Leveling of American Education
- The decline in SAT scores during the 1960s and 1970s is attributed to "mediocritization" rather than the democratization of the test-taking pool.
- The number of students achieving elite scores on the SAT-Verbal dropped by 41 percent between 1972 and 1993, despite a larger overall testing population.
It may be within the capability of an educational system—probably with the complicity of broader social trends—to put a ceiling on, or actually dampen, the realized intelligence of those with high potential.
The Dumbing Down of Education
The simple and no longer controversial truth is that educational standards declined, along with other momentous changes in American society during that decade.
The Decline of Verbal Standards
- Political agendas and interest group pressures have led school boards to prioritize non-offensive content over intellectual rigor.
- The rise of television and the decline of letter writing created a societal environment hostile to the development of high-level verbal skills.
A school board runs no risk whatsoever of angry historians picketing their offices.
The Neglect of the Gifted
- By 1993, programs for the gifted received only 0.1% of the $8.6 billion ESEA budget, while 92.2% was allocated to the disadvantaged.
- Despite success in college placement and safety, schools for gifted urban students are frequently underfunded and threatened with closure.
Banneker was 'elitest,' said an influential school board member, a luxury for parents who 'had their children in private school and can no longer afford it and bring them back to essentially a private school at the public expense.'
Prioritizing Academic Excellence
- The authors propose a federal prize scholarship program that awards $20,000 to the top 25,000 students based on academic achievement rather than financial need.
- The justification for these changes is based on national welfare rather than social justice, asserting that the nation's future depends on its most intellectually gifted members.
These gifted youngsters are important not because they are more virtuous or deserving but because our society's future depends on them.
Affirmative Action in Higher Education
- The authors argue that affirmative action as currently practiced involves an extremely large advantage for black and Latino candidates rather than a simple tie-breaker.
- The current system often prioritizes affluent minority applicants over disadvantaged white applicants, complicating the moral defense of the practice.
On elite campuses, the average black freshman is in the region of the 10th to 15th percentile of the distribution of cognitive ability among white freshman.
The Magnitude of Affirmative Action
- Data from elite universities reveals a median gap of 180 SAT points between white and black students, equivalent to roughly 1.3 standard deviations.
- The authors argue that current premiums are "unreasonably large," creating academic talent gaps that serve neither the students nor the institutions.
The difference between black and white scores was less than 100 points at only one school, Harvard.
Affirmative Action and SAT Disparities
At selective schools, the median black edge was 180 SAT points, while Asians faced a median penalty of 30 points.
The Mathematics of Minority Recruiting
- Elite private universities like Harvard and Stanford aggressively compete for a very small pool of high-scoring Black and Latino students.
- The scarcity of high-achieving minority applicants has led to "athletic-style" recruitment tactics, including massive financial grants and travel budgets regardless of need.
As a result, a number of college officials privately accuse each other of 'stealing' black students.
Rationales for Affirmative Action
- The author identifies three coherent rationales for affirmative action: redressing built-in racism, institutional utility, and social usefulness.
- Data suggests that higher test scores predict better academic performance across the entire range, contradicting the idea that ability differences matter less after a certain point.
The second point, often expressed by university officials with the words 'everyone we admit can do the work,' is true in the limited sense that students with comparatively low levels of ability can get passing grades.
The Student's Eye View
The statistical difference that was trivial in the view from above the battle has become a large racial discrepancy at ground level.
The Costs of Academic Disparity
Today the same degree from the same university is perceived differently if you have a black face or a white one.
Reforming University Affirmative Action
- The authors propose restoring the value of academic credentials by using uniform procedures for selection, grading, and degree granting.
- The text suggests that prestigious labels, such as degrees, must have the same meaning across all ethnic groups to build a society where ethnicity no longer matters.
To anticipate our larger conclusion, affirmative action as it is being practiced is a grave error.
The Case for Color-Blindness
At many colleges during that era, applicants were forbidden to enclose a photograph and instructed to avoid any information in the essay that might help identify their race or religion.
The Mechanics of Hiring Compliance
- Employers must navigate the "80 percent rule" to avoid disparate impact lawsuits, ensuring minority hiring rates are at least 80% of the most successful group's rate.
- Under current guidelines, the actual test scores of applicants are often legally irrelevant compared to the final demographic "bottom line" of hiring outcomes.
It makes no difference if the rejected male applicants had scores that were twice those of the successful women applicants: All that matters is the bottom line: the 80 percent criterion.
Affirmative Action and Police Performance
- The Washington, D.C., Police Department implemented residency requirements and normed tests to favor minority applicants, leading to a significant drop in candidate quality.
- Intellectual degradation in the force led to tangible street-level failures, such as the dismissal of one-third of murder cases due to incoherent arrest reports.
I've seen people diagnosed as borderline retarded graduate from the police academy.
Affirmative Action and Job Performance
There is a great deal of smoke emanating from such accounts. We urge that people start checking out whether there is any fire.
The Mechanics of Race Norming
- Race norming emerged as a solution where raw test scores are converted into percentiles based on the distribution within the applicant's own racial group.
- Using tools like the Wonderlic "Ethnic Conversion Table," identical raw scores are assigned vastly different percentiles to ensure a diverse final hiring pool.
Suppose that five candidates—white, black, Latino, Asian, and American Indian—all got the Wonderlic's mean score of 22 prior to any adjustment for group distributions.
The Rise of Cognitive Stratification
- Modern higher education and professional channeling have concentrated the top of the IQ distribution into a distinct, isolated social class.
- This "cognitive elite" now dominates the leadership of almost every major American institution, from corporate boardrooms to media and government.
The stratifications may have been stark, even bitter, but people were not stratified by cognitive ability.
The Rise of the Custodial State
- The cognitive elite and affluent class are merging into a powerful political bloc representing 10 to 15 percent of the voting population.
- This new coalition increasingly uses its financial and political clout to insulate itself through private security, private schools, and gated communities.
We fear that a new kind of conservatism is becoming the dominant ideology of the affluent—not in the social tradition of an Edmund Burke or in the economic tradition of an Adam Smith but 'conservatism' along Latin American lines, where to be conservative has often meant doing whatever is necessary to preserve the mansions on the hills from the menace of the slums below.
The Coming Custodial State
- The cognitive elite is predicted to shift from remedial social programs to a policy of containment and management.
- This "custodial state" would provide extensive services like state-run childcare and nutrition instead of cash to an underclass deemed incapable of self-sufficiency.
The most likely consequence in our view is that the cognitive elite, with its commanding position, will implement an expanded welfare state for the underclass that also keeps it out from underfoot.
The Founders and Natural Inequality
- Jefferson advocated for a "natural aristocracy" of talent and virtue to lead society, viewing it as nature's most precious gift.
- Jefferson's educational philosophy sought to "rake from the rubbish" the best geniuses to prepare them for governance.
The 'best geniuses' should be 'raked from the rubbish annually' by competitive grading and examinations, sent on to the next educational stage, and finally called to public service.
Finding Valued Places
- The primary goal of social policy should be ensuring individuals across the intelligence spectrum can find a "valued place" in society.
- A "valued place" is pragmatically defined by the degree to which an individual would be missed by others if they were gone.
You occupy a valued place if other people would miss you if you were gone.
The Burden of Complexity
- The United States is increasingly governed by complex rules that favor high-IQ individuals while marginalizing the rest of society.
- Complexity acts as a competitive advantage for the cognitive elite, as deciphering intricate systems is a direct application of high cognitive ability.
American society has erected barriers to individual sweat equity, by saying, in effect, 'Only people who are good at navigating complex rules need apply.'
Simplifying Marriage and Law
- The authors propose returning marriage to a unique legal status where rights and responsibilities regarding children are exclusively tied to being married.
- A broader policy shift is advocated toward radical simplification of the American legal system to make it accessible to all citizens, not just the "rich and smart."
As matters stand, the legal edifice has become a labyrinth that only the rich and the smart can navigate.
Cognitive Ability and Public Policy
- The authors argue that current U.S. welfare policies inadvertently subsidize births among women with lower cognitive ability, creating a form of accidental social engineering.
- Regarding immigration, the authors suggest shifting priority from family reunification to competency-based rules to ensure immigrants contribute positively to the economy.
The technically precise description of America's fertility policy is that it subsidizes births among poor women, who are also disproportionately at the low end of the intelligence distribution.
Equality and Statistical Distributions
- Attempts to pretend inequality of intelligence doesn't exist or to force equal outcomes have historically led to disaster.
- Human success should be measured internally rather than by external metrics of competence or endowment.
It is time for America once again to try living with inequality, as life is lived: understanding that each human being has strengths and weaknesses, qualities we admire and qualities we do not admire.
The Power of Bell Curves
It is worth pausing a moment over this link between a relatively simple measure of spread in a distribution and the way things in everyday life vary, for it is one of nature's more remarkable uniformities.
Standard Scores Versus Percentiles
- While percentiles are intuitive for the general public, they are mathematically misleading because they compress data at the tails of a distribution.
- Standard scores (z-scores) provide a more accurate representation of real-world differences, such as height or intelligence, than centiles do.
In a true normal distribution, the distance from the 99th centile to the 100th (or, similarly, from the 1st to the 0th) is infinite.
Correlation and Regression Analysis
- Squaring the correlation coefficient reveals the "explained variance," indicating how much variation in one variable is reduced by knowing the other.
- While correlation measures the strength of a relationship, regression analysis is used to determine the specific nature and magnitude of that relationship.
Perhaps, if you have been compelled to be around social scientists, you have heard the phrase 'explains the variance,' as in, for example, 'Education explains 20 percent of the variance in income.'
Methodology and AFQT Scoring
- The study transitioned from the 1980 AFQT scoring method to the 1989 version because the latter was deemed psychometrically superior and more "g-loaded".
- The revised AFQT scoring removed the speeded "numerical operations" subtest to avoid errors caused by minor timing discrepancies during administration.
The reason for the change was to avoid the numerical operations subtest, which was both less highly g-loaded than the mathematics knowledge subtest and sensitive to small discrepancies in the time given to subjects.
AFQT as a Psychometric Measure
- The AFQT is identified as one of the most highly "g-loaded" mental tests currently in use, effectively tapping into general intelligence.
- The Armed Services Vocational Aptitude Battery (ASVAB) consists of ten subtests ranging from general intelligence to specific vocational knowledge.
To see them arising between tests of such different subject matter should alert us to some deeper level of mental functioning.
The Nature of g
- The "g" factor represents a broad mental capacity that permeates performance on any task requiring cognitive challenge or mental complexity.
- The AFQT correlates with classic IQ tests, such as the California Test of Mental Maturity, at levels equal to or higher than those tests correlate with each other.
This is the pattern that betrays what g means-a broad mental capacity that permeates performance on anything that challenges people cognitively.
AFQT Scores and Socioeconomic Status
- The correlation between the AFQT score and the composite Socioeconomic Status (SES) index is measured at .55, which aligns with previous research.
- The text explores the "unresolvable" controversy regarding whether IQ tests measure innate ability or are merely proxies for environmental factors.
The relationship of an IQ test score to education and socioeconomic background is a constant and to some extent unresolvable source of controversy.
Education's Impact on IQ Scores
- Statistical models demonstrate that an additional year of education is associated with a gain of approximately 2.3 centiles or one IQ point.
- Evidence suggests a "negatively accelerated" relationship where elementary education has a greater causal impact on IQ than graduate-level studies.
The causal importance of the elementary grades in developing a person's IQ is greater than the causal role of, say, graduate school.
Statistical Analysis of Family Matters
- One primary dependent variable analyzed is whether an individual married before the age of 30, categorized by high school and college samples.
- Another key analysis focuses on the likelihood of divorce within the first five years of marriage, incorporating the date of first marriage as a control variable.
DEPENDENT VARIABLE: Divorced within the first five years of marriage.
Statistical Analysis of Social Outcomes
- One primary dependent variable tracks whether male subjects were interviewed in a correctional facility between 1979 and 1990.
- In the Middle Class Values Index analysis, cognitive ability (zAFQT89) shows a highly significant positive correlation with higher scores.
The College Sample: Omitted. No one in the cross-sectional College Sample waj ever interviewed in jail.
Predictive Bias in Testing
- Statistical analysis of large, representative samples consistently fails to find evidence of predictive bias against black test-takers in education or employment.
- Prominent researchers like Arthur Jensen have noted a lack of any bona fide examples where tests underpredict the performance of black individuals.
When questions about data come up, cloudier and murkier is usually a safe bet.
Testing Item Bias Hypotheses
- Statistical analysis shows that the rank order of item difficulty is nearly identical across racial groups, often exceeding a .95 correlation.
- Evidence suggests that coaching and practice effects for IQ tests are generally insignificant and only occur under very specific, rare conditions.
Relative item difficulties are essentially the same for both races (by sex). That is, blacks and whites of the same sex come close to finding the same item the easiest, the same item next easiest, all the way down to the hardest item.
Debating Cultural Bias in Testing
- Studies translating the Stanford-Binet into black dialect showed no significant improvement in scores, suggesting language is not the primary barrier.
- Standardized tests are found to function similarly for both groups and tend to overpredict rather than underpredict black performance.
This readiness to theorize about what might be true about black-white differences in test scores while ignoring the pertinent data is common.
Rushton's Racial Evolutionary Theory
- J. Philippe Rushton proposes that racial differences in behavior and biology are rooted in evolutionary reproductive strategies.
- The theory applies the biological concept of "parental investment," where species balance between producing many offspring or investing heavily in a few.
However, Rushton's work is not that of a crackpot or a bigot, as many of his critics are given to charging.
Logistic Regression and Demographic Indicators
The analysis treats nominal variables differently from the convention in many other regression packages.
Income Disparities and Affirmative Action
- When controlling for IQ and education, the income gap between minority groups and whites significantly narrows or even reverses.
- Educational attainment, particularly graduate degrees, shows a high correlation with increased annual wages across all racial groups.
Much of the current debate about affirmative action in employment takes place in ignorance of the original objectives of affirmative action and the ways in which antidiscrimination law has evolved.
The Rise of Disparate Impact
- The Supreme Court case Griggs v. Duke Power Co. became a landmark ruling by striking down job requirements that lacked a manifest relationship to job performance.
- Chief Justice Warren Burger's unanimous decision shifted the burden of proof to employers to demonstrate the "business necessity" of their hiring criteria.
Said the Court, good (i.e., nondiscriminatory) intentions do not excuse tests "that operate as 'built-in headwinds' for minority groups and are unrelated to measuring job capability."
The Flaws of Disparate Impact
- The "80 percent rule" for determining disparate impact is psychometrically unsound because it fails to account for how selection ratios naturally shift as hiring standards rise.
- Statistical modeling shows that as IQ cutoffs increase for specialized roles, the ratio of selected candidates from lower-scoring groups inevitably shrinks.
The result of so extreme a requirement, warned the Court, would be 'a host of evils.'
Cognitive Stratification in Elite Education
- By the early 1990s, the mean SAT-Verbal score for graduates of the top twelve universities was estimated at 650, contrasted with a national norm of 376.
- The research highlights a growing concentration of high-cognitive-ability individuals within a small cluster of prestigious academic institutions.
The odds are already so tiny that they are for practical purposes unaffected by further restrictions.
Measuring Job Performance
- Research by John Hunter indicates that intelligence has a massive correlation with job knowledge, which in turn serves as the primary driver for high performance in work samples.
- Supervisor ratings are the most common metric in research due to their convenience, though critics question if they measure actual skill or merely social rapport.
But how is this knowledge to be captured in objective measures? Ratings by supervisors or peers? Samples of work in the various tasks that a job demands? Tests of job knowledge?
Cognitive Ability and Economic Productivity
- The validity of AFQT scores in predicting job performance is almost entirely derived from their measurement of general intelligence (g).
- Small correlations in validity, such as .4, can translate into massive economic consequences and productivity gains when applied to a large workforce.
No data have yet tested the possibility that productivity diverges (the advantage enjoyed by the smarter employee increases with experience) in very-high-complexity jobs.
Cognitive Stratification and Educational Homogamy
- Data from 1960 shows Harvard freshmen averaged 2.9 standard deviations above the national mean, placing their estimated mean IQ at approximately 130.
- There is documented evidence of increasing educational homogamy, where individuals with similar schooling levels are more likely to marry one another.
That each NLSY subject was paid $50 to take the test helped ensure a positive attitude toward the experience.
Stability of IQ and Poverty
- IQ is found to have a greater impact on the likelihood of living in poverty than a person's socioeconomic background.
- Logistic regression analysis is utilized to isolate the independent impact of IQ and socioeconomic background on poverty.
The correlations between a person's IQ obtained at age 7 and social behavior in adulthood would support the same qualitative conclusions as those based on an IQ obtained at age 20.
IQ and Educational Attainment
- Statistical analysis shows a strong correlation between cognitive ability and the likelihood of completing high school.
- Among specific demographics, such as black permanent dropouts in the NLSY, almost none were found in the top quartile of IQ.
Continued schooling makes a modest contribution to intellectual capital but not enough to make much difference in the basic relationships linking IQ to other outcomes.
IQ and Occupational Disability
- The text examines the relationship between IQ and job-related health disabilities, specifically within blue-collar occupations.
- Regression analysis suggests that IQ is a stronger predictor of disability in blue-collar jobs than years of education, even when controlling for age.
The coefficient relating IQ to likelihood of disability is about four times the coefficient for years of education.
Causality in Teenage Motherhood
- The text examines whether early motherhood causes lower IQ scores or if low IQ is a preexisting predictor of early pregnancy.
- Data suggests that the relationship between cognitive ability and age at first birth remains strong even when testing women who gave birth after taking the IQ test.
She is not very hright and gets pregnant inadvertently or because she has not thought through the consequences; or she is poor and has a baby because it offers better rewards than not having a baby, whether those rewards are tangible in the form of an income and apartment of her own through welfare, or in the form of having someone to love.
Methodology of the HOME Index
In a revealing sign of the unpopularity of intelligence as an explanatory variable, Cramer treats years of education as a proxy measure of socioeconomic status.
Statistical Nuances of Social Indicators
- The analysis of crime trends reveals a divergence between violent and property crime starting in the late 1970s, a phenomenon the authors find under-explored.
- A significant discrepancy is noted in the NLSY sample, where 23 percent of children scored at or below an IQ of 80, far exceeding national norms.
This divergence between violent and property crimes is in itself a potentially significant phenomenon that has yet to be adequately explored.
Intelligence and Political Socialization
- Research indicates that intelligence is a stronger predictor of political socialization and attitudes than socioeconomic status.
- Higher intelligence levels correlate with liberal views on social issues and conservative views on economic ones, while being inversely related to militaristic and chauvinistic attitudes.
Chauvinistic, militaristic, and anticommunistic attitude were inversely related to intelligence.
Socioeconomic Status and IQ Gaps
- Data from multiple studies suggest that the black-white IQ gap actually widens at higher levels of socioeconomic prestige and parental education.
- Historical reviews of thirteen studies found that in twelve cases, the racial IQ discrepancy was more pronounced in high-SES groups than in low-SES groups.
This logic is as fallacious as the logic behind controlling for SES that ignores the ways in which IQ helps determine socioeconomic status.
Divergent Trends in SAT Performance
- Asian American SAT score increases are primarily driven by gains among top-tier students, whereas Black score improvements are concentrated among the lowest-scoring students.
- Research in Shanghai suggests a high density of top-tier math performance among Chinese students even when they lack familiarity with American standardized testing formats.
The Asian increase in test scores has been driven by improvements among the best students, while the black increase has been driven by improvements among the worst students.
Cognitive Profiles and Spearman's Hypothesis
- The discussion references Spearman’s hypothesis, which suggests that the magnitude of racial differences in test performance is directly related to a test's "g" loading.
- Research indicates that tests with smaller performance gaps between demographic groups, such as the K-ABC, are often found to be less valid measures of general intelligence.
Spearman wrote that the mean difference 'was most marked in just those [tests] which are known to be most saturated with g'.
The Coleman Report and Schooling
- The Coleman Report found that a school's ethnic and socioeconomic mix influenced student outcomes more than standard investments like teacher salaries or physical plant quality.
- Historical data suggests that the correlation between childhood IQ and adult IQ is significantly stronger than the correlation between years of schooling and adult IQ.
Soon after, school busing itself became a battleground for social researchers, a tale we will not tell here except to say that having a beneficial effect on intelligence is no longer used as an argument in favor of busing.
Divergent Trends in Academic Achievement
- Standardized test data from the 1970s and 1980s reveals a significant performance gap between math and humanities.
- Math II scores saw a steep and continuous rise beginning in the 1980s and lasting through the early 1990s.
This is consistent with a broad theme that the sciences and math improved more in the 1980s than the humanities and social sciences did.